city of sonoma - storage.googleapis.com · city of sonoma city profile report 2017. report...
TRANSCRIPT
CITY OF SONOMA
CITY PROFILE REPORT 2017
Report developed by the Sonoma County Economic Development Board in partnership with the City of Sonoma and the Sonoma Valley Chamber of Commerce
PG. 2SONOMAEDB.ORG
ECONOMIC DEVELOPMENT BOARDB
OA
RD
OF
O
RS
DIR
EC
T
EDB FOUNDATION SPONSORS
PRESENTING LEVEL
EXECUTIVE LEVEL
FOUNDATION LEVEL PREMIER LEVEL
MEDIA LEVEL
AMERICAN AGCREDIT
AMERICAN RIVER BANK
COMCAST
GEORGE PETERSEN INSURANCE
KEEGAN & COPPIN CO.
MIDSTATE CONSTRUCTION
NORBAR
SONOMA COUNTY ALLIANCE
SUMMIT STATE BANK
VANTREO INSURANCE
ZAINER RINEHART CLARKE
WAYNE LEACH MICHAEL NICHOLLS MICHAEL TOMASINITERRI DENTE TERRY GARRETT KATHRYN HECHT LINDA KACHIUPAM CHANTER, CHAIR JORGE ALCAZAR SKIP BRAND
BEN STONE, Executive Director
PG. 3SONOMAEDB.ORG
CONTENTS
4. EXECUTIVE SUMMARY
6. POPULATION & DEMOGRAPHICS
7. POPULATION & INCOME PROJECTIONS
8. EMPLOYMENT
9. RESIDENTIAL REAL ESTATE
10. REAL ESTATE & CONSTRUCTION
11. CONSUMER ACTIVITY
12. EDUCATION
13. CITY DATA SNAPSHOT
14. SOURCES
15. ACKNOWLEDGMENTS

PG. 4SONOMAEDB.ORG
2017 CITY OF SONOMA PROFILE REPORT
EXECUTIVE SUMMARY April 2017
The Sonoma County Economic Development Board (EDB), in partnership with the Sonoma County Workforce Investment Board (WIB), the City of Sonoma, and the Sonoma Valley Chamber of Commerce is pleased to present the 2017 City of Sonoma Local Economic Profile. The City of Sonoma comprises 2.74 square miles and serves as the economic hub for the greater Sonoma Valley, which has a population of about 42,000.
Highlights from this Local Economic Profile include:
• The City of Sonoma’s seasonally unadjusted unemployment rate was 3.4% in September 2016, lower than Sonoma County (3.8%), California (5.3%) and the nation (4.8%) for the same month.
• The population of the City of Sonoma in 2016 was 11,342, and it is expected to rise 5.3% to 11,944 by 2021. This represents the greatest expected growth rate among the cities of Sonoma County and the county as a whole.
• Between 2000 and 2016, the median household income in the City of Sonoma grew by 30%, reaching $65,947. Looking into 2021, this growth is expected to continue with median income projected to rise to $76,417, an increase of around 16% from 2016.
• Median home prices in the City of Sonoma continue to increase, logging growth of 6.1% from 2014 to 2015. Prices reached $625,000 in 2015.
This report is meant to act as a spot-in-time profile to reflect conditions in the city in a given year. While every effort was made to ensure this report contained up-to-date information, certain data was unavailable at the time this report was released; thus, some figures may reflect years prior to 2016.
Thank you for your interest in the Economic Development Board’s research. For additional information, questions, comments, or suggestions please contact us at (707) 565-7170 or visit www.sonomaedb.org. For other county-specific questions, please visit www.sonomacounty.ca.gov.

PG. 5SONOMAEDB.ORG
PG. 6SONOMAEDB.ORG
2017 CITY OF SONOMA PROFILE REPORT
POPULATION & DEMOGRAPHICS
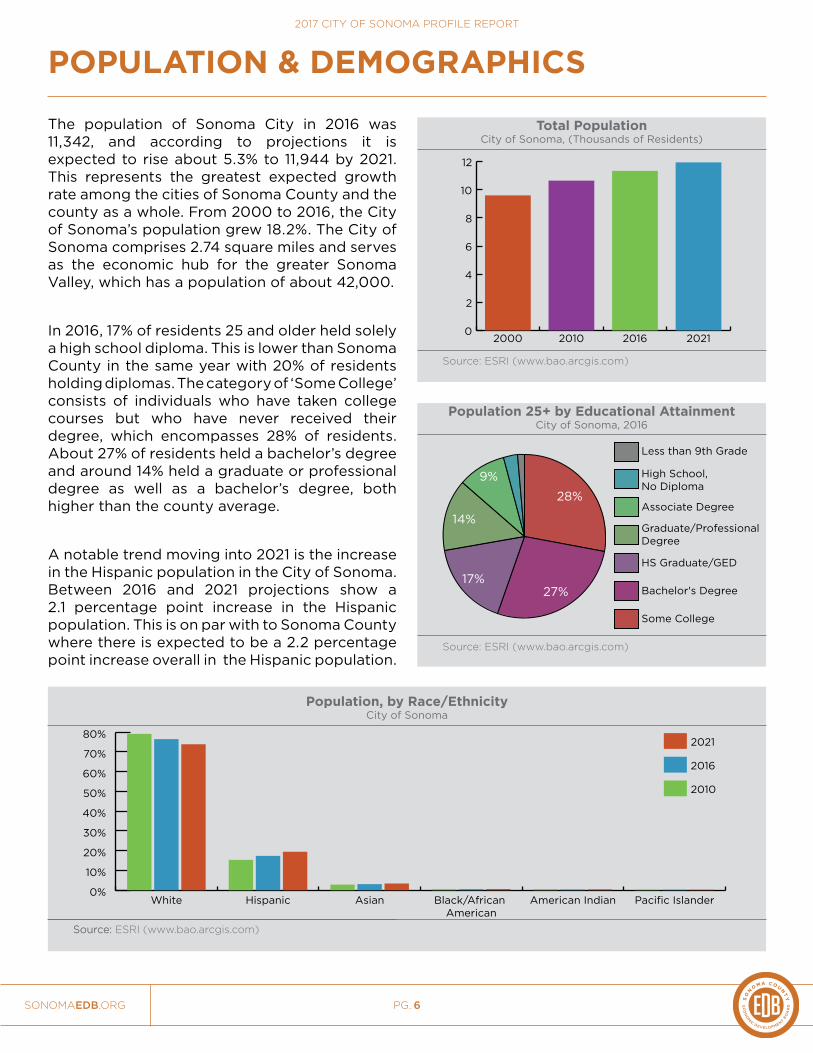
The population of Sonoma City in 2016 was 11,342, and according to projections it is expected to rise about 5.3% to 11,944 by 2021. This represents the greatest expected growth rate among the cities of Sonoma County and the county as a whole. From 2000 to 2016, the City of Sonoma’s population grew 18.2%. The City of Sonoma comprises 2.74 square miles and serves as the economic hub for the greater Sonoma Valley, which has a population of about 42,000.
In 2016, 17% of residents 25 and older held solely a high school diploma. This is lower than Sonoma County in the same year with 20% of residents holding diplomas. The category of ‘Some College’ consists of individuals who have taken college courses but who have never received their degree, which encompasses 28% of residents. About 27% of residents held a bachelor’s degree and around 14% held a graduate or professional degree as well as a bachelor’s degree, both higher than the county average.
A notable trend moving into 2021 is the increase in the Hispanic population in the City of Sonoma. Between 2016 and 2021 projections show a 2.1 percentage point increase in the Hispanic population. This is on par with to Sonoma County where there is expected to be a 2.2 percentage point increase overall in the Hispanic population.
ESRI (www.bao.arcgis.com) Source:
Total PopulationCity of Sonoma, (Thousands of Residents)
0
2
4
6
8
10
12
2021201620102000
ESRI (www.bao.arcgis.com) Source:
Population 25+ by Educational AttainmentCity of Sonoma, 2016
Less than 9th Grade
High School, No Diploma
Associate Degree
Graduate/Professional Degree
HS Graduate/GED
Bachelor's Degree
Some College
ESRI (www.bao.arcgis.com)Source:
Current and Projected Age DistributionCity of Sonoma, 2016 & 2021
0%
5%
10%
15%
20%
25%
30%
35%
2021
2016
65+45-6425-4410-244-90-4
ESRI (www.bao.arcgis.com) Source:
Median Household IncomeCity of Sonoma, (Thousands of Dollars)
$0
$10
$20
$30
$40
$50
$60
$70
$80
2021201620112000
California Economic Development Deparment (www.edd.ca.gov)
Source:
Unemployment RateCity of Sonoma, 2008-Sept. 2016
0%
2%
4%
6%
8%
10%
12%
'16'15'14'13'12'11'10'09'08
California Economic Development Deparment (www.edd.ca.gov)
Source:
Employment LevelsCity of Sonoma, (Thousands of Employees), 2008-Sept. 2016
0.0
1.1
2.2
3.3
4.4
5.5
'16'15'14'13'12'11'10'09'08
ESRI (www.bao.arcgis.com)Source:
Employed Population 16+ by IndustryCity of Sonoma, 2016
Information
Wholesale Trade
Agriculture and Mining
Transportation and Utilities
Public Administration
Finance, Insurance, and Real Estate
Construction
Manufacturing
Retail Trade
Services
56%
10%
10%
9%
ESRI (www.bao.arcgis.com)Source:
Total Business Establishments2016
0 1500 3000 4500 6000 7500 9000
Cloverdale
Cotati
Sebastopol
Windsor
Healdsburg
City of Sonoma
Rohnert Park
Petaluma
Santa Rosa
Bay Area Real Estate Information Services (www.bareis.com)
Source:
Median Price of an Existing HomeCity of Sonoma, (Thousands of Dollars), 1999-2015
$0
$100
$200
$300
$400
$500
$600
$700
$800
'15'14'13'12'11'10'09'08'07'06'05'04'03'02'01'00'99
Bay Area Real Estate Information Services (www.bareis.com)
Source:
Total Number of Houses SoldCity of Sonoma, 1999-2015
0
100
200
300
400
500
600
700
800
'15'13'11'09'07'05'03'01'99
California Board of Equalization (www.boe.ca.gov)
Source:
Total Taxable SalesCity of Sonoma, (Millions of Dollars), 1997-2014
$0
$50
$100
$150
$200
$250
$300
'14'12'10'08'06'04'02'00'98
California Department of Education (www.cde.ca.gov)
Source:
English Learners, by School District2015-2016
0% 10% 20% 30% 40%
Cloverdale Unified School District
Sonoma Valley UnifiedSchool District
Healdsburg UnifiedSchool District
Santa Rosa City Schools
Sonoma County
California
Windsor UnifiedSchool District
Cotati-RohnertPark
Petaluma City Schools
Sebastopol Union School District
Percent of Total Students
28%
27%17%
14%
9%
U.S. Census Bureau (www.census.gov) Source:
Residential Housing VacancyCity of Sonoma, Rental and Homeowner Inventory
0%
2%
4%
6%
8%
10%Rental
Homeowner
2015201420132012201120102009
ESRI (www.bao.arcgis.com) Source:
Total PopulationCity of Sonoma, (Thousands of Residents)
0
2
4
6
8
10
12
2021201620102000
ESRI (www.bao.arcgis.com) Source:
Population 25+ by Educational AttainmentCity of Sonoma, 2016
Less than 9th Grade
High School, No Diploma
Associate Degree
Graduate/Professional Degree
HS Graduate/GED
Bachelor's Degree
Some College
ESRI (www.bao.arcgis.com)Source:
Current and Projected Age DistributionCity of Sonoma, 2016 & 2021
0%
5%
10%
15%
20%
25%
30%
35%
2021
2016
65+45-6425-4410-244-90-4
ESRI (www.bao.arcgis.com) Source:
Median Household IncomeCity of Sonoma, (Thousands of Dollars)
$0
$10
$20
$30
$40
$50
$60
$70
$80
2021201620112000
California Economic Development Deparment (www.edd.ca.gov)
Source:
Unemployment RateCity of Sonoma, 2008-Sept. 2016
0%
2%
4%
6%
8%
10%
12%
'16'15'14'13'12'11'10'09'08
California Economic Development Deparment (www.edd.ca.gov)
Source:
Employment LevelsCity of Sonoma, (Thousands of Employees), 2008-Sept. 2016
0.0
1.1
2.2
3.3
4.4
5.5
'16'15'14'13'12'11'10'09'08
ESRI (www.bao.arcgis.com)Source:
Employed Population 16+ by IndustryCity of Sonoma, 2016
Information
Wholesale Trade
Agriculture and Mining
Transportation and Utilities
Public Administration
Finance, Insurance, and Real Estate
Construction
Manufacturing
Retail Trade
Services
56%
10%
10%
9%
ESRI (www.bao.arcgis.com)Source:
Total Business Establishments2016
0 1500 3000 4500 6000 7500 9000
Cloverdale
Cotati
Sebastopol
Windsor
Healdsburg
City of Sonoma
Rohnert Park
Petaluma
Santa Rosa
Bay Area Real Estate Information Services (www.bareis.com)
Source:
Median Price of an Existing HomeCity of Sonoma, (Thousands of Dollars), 1999-2015
$0
$100
$200
$300
$400
$500
$600
$700
$800
'15'14'13'12'11'10'09'08'07'06'05'04'03'02'01'00'99
Bay Area Real Estate Information Services (www.bareis.com)
Source:
Total Number of Houses SoldCity of Sonoma, 1999-2015
0
100
200
300
400
500
600
700
800
'15'13'11'09'07'05'03'01'99
California Board of Equalization (www.boe.ca.gov)
Source:
Total Taxable SalesCity of Sonoma, (Millions of Dollars), 1997-2014
$0
$50
$100
$150
$200
$250
$300
'14'12'10'08'06'04'02'00'98
California Department of Education (www.cde.ca.gov)
Source:
English Learners, by School District2015-2016
0% 10% 20% 30% 40%
Cloverdale Unified School District
Sonoma Valley UnifiedSchool District
Healdsburg UnifiedSchool District
Santa Rosa City Schools
Sonoma County
California
Windsor UnifiedSchool District
Cotati-RohnertPark
Petaluma City Schools
Sebastopol Union School District
Percent of Total Students
28%
27%17%
14%
9%
U.S. Census Bureau (www.census.gov) Source:
Residential Housing VacancyCity of Sonoma, Rental and Homeowner Inventory
0%
2%
4%
6%
8%
10%Rental
Homeowner
2015201420132012201120102009
ESRI (www.bao.arcgis.com) Source:Source:
Population, by Race/EthnicityCity of Sonoma
0%
10%
20%
30%
40%
50%
60%
70%
80%2021
2016
2010
Pacific IslanderAmerican IndianBlack/African American
AsianHispanicWhite
ESRI (www.bao.arcgis.com) Source:Source:
Households, by IncomeCity of Sonoma
0%
5%
10%
15%
20%2021
2016
2000
$200,000+$150,000-$199,999
$100,000-$149,999
$75,000-$99,999
$50,000-$74,999
$35,000-$49,999
25,000-$34,999
$15,000-$24,999
<$15,000
Bay Area Real Estate Information Services (www.bareis.com)
Source:Source:
Average Home Sales Price, by Sub-county Area(Thousands of Dollars), 2015
$0
$200
$400
$600
$800
$1000
$1200
WindsorSonomaSebastopolSanta RosaRohnert Park PetalumaHealdsburgCotatiCloverdale
County Avg.
California Homebuilding Foundation (www.mychf.org)
Source:Source:
Value of Residential and Non-residential Building PermitsCity of Sonoma, (Millions of Dollars), 2000-2016
$0
$5
$10
$15
$20
$25
$30
$35
$40Non-residential
Residential
'16'15'14'13'12'11'10'09'08'07'06'05'04'03'02'01'00
ESRI (www.bao.arcgis.com) *Other includes: Apparel and Services, Alcoholic Beverages, Household Operations, Housekeeping Supplies, Household Furnishings and Equipment, Life/Other Insurance, Miscellanous, Personal Care Products and Services, and Smoking Products
Source:
Consumer Spending, By CommodityCity of Sonoma, 2016
Education $9,949,036
Travel $13,022,248
Entertainment/Recreation $19,013,677
Cash Contributions/Gifts $28,380,787
Healthcare $34,948,303
Pensions and Social Security $44,431,325
Transportation $50,087,293
Food $51,275,016
Other* $54,521,580
Housing $136,028,571
California Department of Education (www.cde.ca.gov)Source:
Average SAT Score, by School DistrictCity of Sonoma, 2014-2015 & 2012-2015 Average
0
350
700
1050
1400
17503-Year Average: 2012-2015
2014-2015 School Year
Wes
t Sono
ma
County
Union
High
School
(Seb
asto
pol)
Petalu
ma
Join
t
Uni
on Hig
h
Santa
Rosa
City
Sch
ools
Sonom
a Coun
ty
Heald
sbur
g Uni
fied
School D
istric
t
Win
dsor U
nifie
d
School D
istric
t
Cotati-
Rohner
t Par
k
Uni
fied S
chool D
istric
t
Califo
rnia
Sonom
a Vall
ey U
nified
Sch
ool Dist
rict
Clove
rdale
Uni
fied
Sch
ool Dist
rict
PG. 7SONOMAEDB.ORG
2017 CITY OF SONOMA PROFILE REPORT
POPULATION & INCOME PROJECTIONS
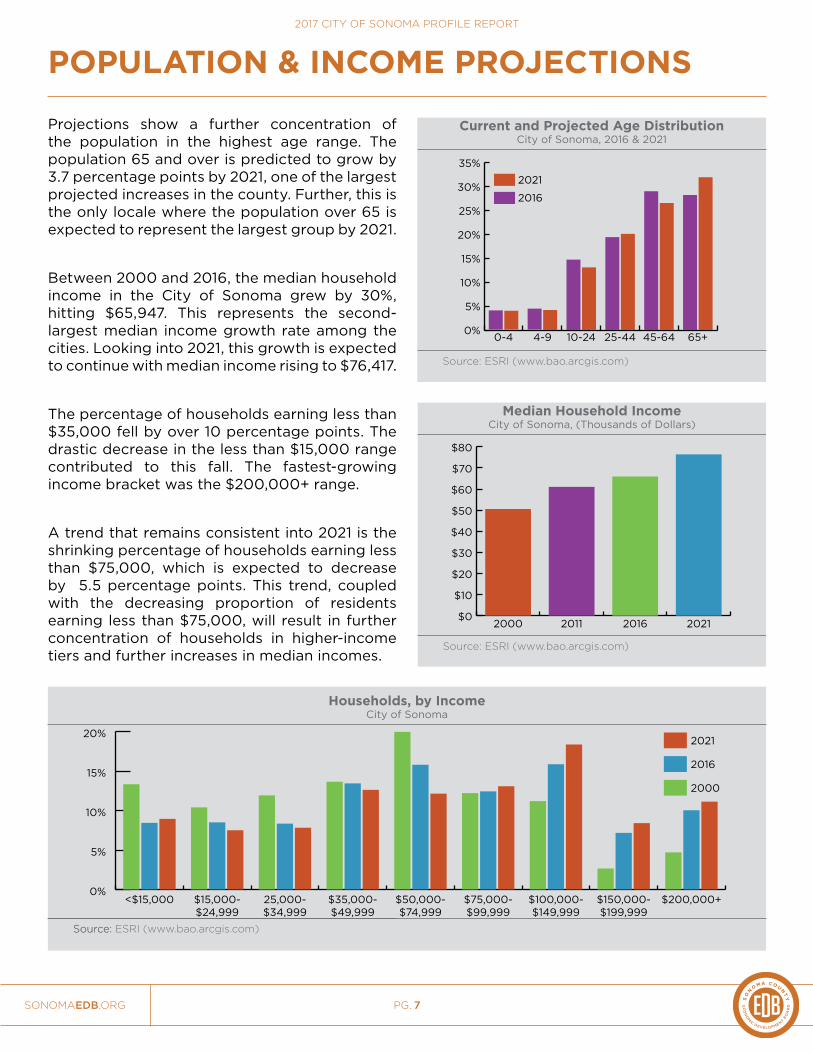
Projections show a further concentration of the population in the highest age range. The population 65 and over is predicted to grow by 3.7 percentage points by 2021, one of the largest projected increases in the county. Further, this is the only locale where the population over 65 is expected to represent the largest group by 2021.
Between 2000 and 2016, the median household income in the City of Sonoma grew by 30%, hitting $65,947. This represents the second-largest median income growth rate among the cities. Looking into 2021, this growth is expected to continue with median income rising to $76,417.
The percentage of households earning less than $35,000 fell by over 10 percentage points. The drastic decrease in the less than $15,000 range contributed to this fall. The fastest-growing income bracket was the $200,000+ range.
A trend that remains consistent into 2021 is the shrinking percentage of households earning less than $75,000, which is expected to decrease by 5.5 percentage points. This trend, coupled with the decreasing proportion of residents earning less than $75,000, will result in further concentration of households in higher-income tiers and further increases in median incomes.
ESRI (www.bao.arcgis.com) Source:
Total PopulationCity of Sonoma, (Thousands of Residents)
0
2
4
6
8
10
12
2021201620102000
ESRI (www.bao.arcgis.com) Source:
Population 25+ by Educational AttainmentCity of Sonoma, 2016
Less than 9th Grade
High School, No Diploma
Associate Degree
Graduate/Professional Degree
HS Graduate/GED
Bachelor's Degree
Some College
ESRI (www.bao.arcgis.com)Source:
Current and Projected Age DistributionCity of Sonoma, 2016 & 2021
0%
5%
10%
15%
20%
25%
30%
35%
2021
2016
65+45-6425-4410-244-90-4
ESRI (www.bao.arcgis.com) Source:
Median Household IncomeCity of Sonoma, (Thousands of Dollars)
$0
$10
$20
$30
$40
$50
$60
$70
$80
2021201620112000
California Economic Development Deparment (www.edd.ca.gov)
Source:
Unemployment RateCity of Sonoma, 2008-Sept. 2016
0%
2%
4%
6%
8%
10%
12%
'16'15'14'13'12'11'10'09'08
California Economic Development Deparment (www.edd.ca.gov)
Source:
Employment LevelsCity of Sonoma, (Thousands of Employees), 2008-Sept. 2016
0.0
1.1
2.2
3.3
4.4
5.5
'16'15'14'13'12'11'10'09'08
ESRI (www.bao.arcgis.com)Source:
Employed Population 16+ by IndustryCity of Sonoma, 2016
Information
Wholesale Trade
Agriculture and Mining
Transportation and Utilities
Public Administration
Finance, Insurance, and Real Estate
Construction
Manufacturing
Retail Trade
Services
56%
10%
10%
9%
ESRI (www.bao.arcgis.com)Source:
Total Business Establishments2016
0 1500 3000 4500 6000 7500 9000
Cloverdale
Cotati
Sebastopol
Windsor
Healdsburg
City of Sonoma
Rohnert Park
Petaluma
Santa Rosa
Bay Area Real Estate Information Services (www.bareis.com)
Source:
Median Price of an Existing HomeCity of Sonoma, (Thousands of Dollars), 1999-2015
$0
$100
$200
$300
$400
$500
$600
$700
$800
'15'14'13'12'11'10'09'08'07'06'05'04'03'02'01'00'99
Bay Area Real Estate Information Services (www.bareis.com)
Source:
Total Number of Houses SoldCity of Sonoma, 1999-2015
0
100
200
300
400
500
600
700
800
'15'13'11'09'07'05'03'01'99
California Board of Equalization (www.boe.ca.gov)
Source:
Total Taxable SalesCity of Sonoma, (Millions of Dollars), 1997-2014
$0
$50
$100
$150
$200
$250
$300
'14'12'10'08'06'04'02'00'98
California Department of Education (www.cde.ca.gov)
Source:
English Learners, by School District2015-2016
0% 10% 20% 30% 40%
Cloverdale Unified School District
Sonoma Valley UnifiedSchool District
Healdsburg UnifiedSchool District
Santa Rosa City Schools
Sonoma County
California
Windsor UnifiedSchool District
Cotati-RohnertPark
Petaluma City Schools
Sebastopol Union School District
Percent of Total Students
28%
27%17%
14%
9%
U.S. Census Bureau (www.census.gov) Source:
Residential Housing VacancyCity of Sonoma, Rental and Homeowner Inventory
0%
2%
4%
6%
8%
10%Rental
Homeowner
2015201420132012201120102009
ESRI (www.bao.arcgis.com) Source:
Total PopulationCity of Sonoma, (Thousands of Residents)
0
2
4
6
8
10
12
2021201620102000
ESRI (www.bao.arcgis.com) Source:
Population 25+ by Educational AttainmentCity of Sonoma, 2016
Less than 9th Grade
High School, No Diploma
Associate Degree
Graduate/Professional Degree
HS Graduate/GED
Bachelor's Degree
Some College
ESRI (www.bao.arcgis.com)Source:
Current and Projected Age DistributionCity of Sonoma, 2016 & 2021
0%
5%
10%
15%
20%
25%
30%
35%
2021
2016
65+45-6425-4410-244-90-4
ESRI (www.bao.arcgis.com) Source:
Median Household IncomeCity of Sonoma, (Thousands of Dollars)
$0
$10
$20
$30
$40
$50
$60
$70
$80
2021201620112000
California Economic Development Deparment (www.edd.ca.gov)
Source:
Unemployment RateCity of Sonoma, 2008-Sept. 2016
0%
2%
4%
6%
8%
10%
12%
'16'15'14'13'12'11'10'09'08
California Economic Development Deparment (www.edd.ca.gov)
Source:
Employment LevelsCity of Sonoma, (Thousands of Employees), 2008-Sept. 2016
0.0
1.1
2.2
3.3
4.4
5.5
'16'15'14'13'12'11'10'09'08
ESRI (www.bao.arcgis.com)Source:
Employed Population 16+ by IndustryCity of Sonoma, 2016
Information
Wholesale Trade
Agriculture and Mining
Transportation and Utilities
Public Administration
Finance, Insurance, and Real Estate
Construction
Manufacturing
Retail Trade
Services
56%
10%
10%
9%
ESRI (www.bao.arcgis.com)Source:
Total Business Establishments2016
0 1500 3000 4500 6000 7500 9000
Cloverdale
Cotati
Sebastopol
Windsor
Healdsburg
City of Sonoma
Rohnert Park
Petaluma
Santa Rosa
Bay Area Real Estate Information Services (www.bareis.com)
Source:
Median Price of an Existing HomeCity of Sonoma, (Thousands of Dollars), 1999-2015
$0
$100
$200
$300
$400
$500
$600
$700
$800
'15'14'13'12'11'10'09'08'07'06'05'04'03'02'01'00'99
Bay Area Real Estate Information Services (www.bareis.com)
Source:
Total Number of Houses SoldCity of Sonoma, 1999-2015
0
100
200
300
400
500
600
700
800
'15'13'11'09'07'05'03'01'99
California Board of Equalization (www.boe.ca.gov)
Source:
Total Taxable SalesCity of Sonoma, (Millions of Dollars), 1997-2014
$0
$50
$100
$150
$200
$250
$300
'14'12'10'08'06'04'02'00'98
California Department of Education (www.cde.ca.gov)
Source:
English Learners, by School District2015-2016
0% 10% 20% 30% 40%
Cloverdale Unified School District
Sonoma Valley UnifiedSchool District
Healdsburg UnifiedSchool District
Santa Rosa City Schools
Sonoma County
California
Windsor UnifiedSchool District
Cotati-RohnertPark
Petaluma City Schools
Sebastopol Union School District
Percent of Total Students
28%
27%17%
14%
9%
U.S. Census Bureau (www.census.gov) Source:
Residential Housing VacancyCity of Sonoma, Rental and Homeowner Inventory
0%
2%
4%
6%
8%
10%Rental
Homeowner
2015201420132012201120102009
ESRI (www.bao.arcgis.com) Source:Source:
Population, by Race/EthnicityCity of Sonoma
0%
10%
20%
30%
40%
50%
60%
70%
80%2021
2016
2010
Pacific IslanderAmerican IndianBlack/African American
AsianHispanicWhite
ESRI (www.bao.arcgis.com) Source:Source:
Households, by IncomeCity of Sonoma
0%
5%
10%
15%
20%2021
2016
2000
$200,000+$150,000-$199,999
$100,000-$149,999
$75,000-$99,999
$50,000-$74,999
$35,000-$49,999
25,000-$34,999
$15,000-$24,999
<$15,000
Bay Area Real Estate Information Services (www.bareis.com)
Source:Source:
Average Home Sales Price, by Sub-county Area(Thousands of Dollars), 2015
$0
$200
$400
$600
$800
$1000
$1200
WindsorSonomaSebastopolSanta RosaRohnert Park PetalumaHealdsburgCotatiCloverdale
County Avg.
California Homebuilding Foundation (www.mychf.org)
Source:Source:
Value of Residential and Non-residential Building PermitsCity of Sonoma, (Millions of Dollars), 2000-2016
$0
$5
$10
$15
$20
$25
$30
$35
$40Non-residential
Residential
'16'15'14'13'12'11'10'09'08'07'06'05'04'03'02'01'00
ESRI (www.bao.arcgis.com) *Other includes: Apparel and Services, Alcoholic Beverages, Household Operations, Housekeeping Supplies, Household Furnishings and Equipment, Life/Other Insurance, Miscellanous, Personal Care Products and Services, and Smoking Products
Source:
Consumer Spending, By CommodityCity of Sonoma, 2016
Education $9,949,036
Travel $13,022,248
Entertainment/Recreation $19,013,677
Cash Contributions/Gifts $28,380,787
Healthcare $34,948,303
Pensions and Social Security $44,431,325
Transportation $50,087,293
Food $51,275,016
Other* $54,521,580
Housing $136,028,571
California Department of Education (www.cde.ca.gov)Source:
Average SAT Score, by School DistrictCity of Sonoma, 2014-2015 & 2012-2015 Average
0
350
700
1050
1400
17503-Year Average: 2012-2015
2014-2015 School Year
Wes
t Sono
ma
County
Union
High
School
(Seb
asto
pol)
Petalu
ma
Join
t
Uni
on Hig
h
Santa
Rosa
City
Sch
ools
Sonom
a Coun
ty
Heald
sbur
g Uni
fied
School D
istric
t
Win
dsor U
nifie
d
School D
istric
t
Cotati-
Rohner
t Par
k
Uni
fied S
chool D
istric
t
Califo
rnia
Sonom
a Vall
ey U
nified
Sch
ool Dist
rict
Clove
rdale
Uni
fied
Sch
ool Dist
rict

PG. 8SONOMAEDB.ORG
2017 CITY OF SONOMA PROFILE REPORT
EMPLOYMENT
The City of Sonoma’s seasonally unadjusted unemployment rate fell to 3.4% in September 2016, lower than Sonoma County (3.8%). Unemployment remains significantly lower in Sonoma City compared to its peak of 9.1% in January of 2010. Sonoma City’s unemployment rate is below both the state (5.3%), and the nation (4.8%).
Total employment in the City of Sonoma reached 5,300 in September 2016, the highest level to date. Employment continues its upward trajectory which began in 2010.
A total number of 1,347 business establishments operated in the City of Sonoma in 2016, a net gain of 76 from the year prior. Sonoma County houses a total of 26,186 business establishments.
Over 56% of the City of Sonoma’s employed population works in the service sector, which includes education, health care, tourism, and legal services. The second-largest sector is Retail trade, followed by Manufacturing. The City of Sonoma supports a larger percentage of employees in the service sector compared to the county and most other cities. This shows reliance on consumer spending to support economic activity.
ESRI (www.bao.arcgis.com) Source:
Total PopulationCity of Sonoma, (Thousands of Residents)
0
2
4
6
8
10
12
2021201620102000
ESRI (www.bao.arcgis.com) Source:
Population 25+ by Educational AttainmentCity of Sonoma, 2016
Less than 9th Grade
High School, No Diploma
Associate Degree
Graduate/Professional Degree
HS Graduate/GED
Bachelor's Degree
Some College
ESRI (www.bao.arcgis.com)Source:
Current and Projected Age DistributionCity of Sonoma, 2016 & 2021
0%
5%
10%
15%
20%
25%
30%
35%
2021
2016
65+45-6425-4410-244-90-4
ESRI (www.bao.arcgis.com) Source:
Median Household IncomeCity of Sonoma, (Thousands of Dollars)
$0
$10
$20
$30
$40
$50
$60
$70
$80
2021201620112000
California Economic Development Deparment (www.edd.ca.gov)
Source:
Unemployment RateCity of Sonoma, 2008-Sept. 2016
0%
2%
4%
6%
8%
10%
12%
'16'15'14'13'12'11'10'09'08
California Economic Development Deparment (www.edd.ca.gov)
Source:
Employment LevelsCity of Sonoma, (Thousands of Employees), 2008-Sept. 2016
0.0
1.1
2.2
3.3
4.4
5.5
'16'15'14'13'12'11'10'09'08
ESRI (www.bao.arcgis.com)Source:
Employed Population 16+ by IndustryCity of Sonoma, 2016
Information
Wholesale Trade
Agriculture and Mining
Transportation and Utilities
Public Administration
Finance, Insurance, and Real Estate
Construction
Manufacturing
Retail Trade
Services
56%
10%
10%
9%
ESRI (www.bao.arcgis.com)Source:
Total Business Establishments2016
0 1500 3000 4500 6000 7500 9000
Cloverdale
Cotati
Sebastopol
Windsor
Healdsburg
City of Sonoma
Rohnert Park
Petaluma
Santa Rosa
Bay Area Real Estate Information Services (www.bareis.com)
Source:
Median Price of an Existing HomeCity of Sonoma, (Thousands of Dollars), 1999-2015
$0
$100
$200
$300
$400
$500
$600
$700
$800
'15'14'13'12'11'10'09'08'07'06'05'04'03'02'01'00'99
Bay Area Real Estate Information Services (www.bareis.com)
Source:
Total Number of Houses SoldCity of Sonoma, 1999-2015
0
100
200
300
400
500
600
700
800
'15'13'11'09'07'05'03'01'99
California Board of Equalization (www.boe.ca.gov)
Source:
Total Taxable SalesCity of Sonoma, (Millions of Dollars), 1997-2014
$0
$50
$100
$150
$200
$250
$300
'14'12'10'08'06'04'02'00'98
California Department of Education (www.cde.ca.gov)
Source:
English Learners, by School District2015-2016
0% 10% 20% 30% 40%
Cloverdale Unified School District
Sonoma Valley UnifiedSchool District
Healdsburg UnifiedSchool District
Santa Rosa City Schools
Sonoma County
California
Windsor UnifiedSchool District
Cotati-RohnertPark
Petaluma City Schools
Sebastopol Union School District
Percent of Total Students
28%
27%17%
14%
9%
U.S. Census Bureau (www.census.gov) Source:
Residential Housing VacancyCity of Sonoma, Rental and Homeowner Inventory
0%
2%
4%
6%
8%
10%Rental
Homeowner
2015201420132012201120102009
ESRI (www.bao.arcgis.com) Source:
Total PopulationCity of Sonoma, (Thousands of Residents)
0
2
4
6
8
10
12
2021201620102000
ESRI (www.bao.arcgis.com) Source:
Population 25+ by Educational AttainmentCity of Sonoma, 2016
Less than 9th Grade
High School, No Diploma
Associate Degree
Graduate/Professional Degree
HS Graduate/GED
Bachelor's Degree
Some College
ESRI (www.bao.arcgis.com)Source:
Current and Projected Age DistributionCity of Sonoma, 2016 & 2021
0%
5%
10%
15%
20%
25%
30%
35%
2021
2016
65+45-6425-4410-244-90-4
ESRI (www.bao.arcgis.com) Source:
Median Household IncomeCity of Sonoma, (Thousands of Dollars)
$0
$10
$20
$30
$40
$50
$60
$70
$80
2021201620112000
California Economic Development Deparment (www.edd.ca.gov)
Source:
Unemployment RateCity of Sonoma, 2008-Sept. 2016
0%
2%
4%
6%
8%
10%
12%
'16'15'14'13'12'11'10'09'08
California Economic Development Deparment (www.edd.ca.gov)
Source:
Employment LevelsCity of Sonoma, (Thousands of Employees), 2008-Sept. 2016
0.0
1.1
2.2
3.3
4.4
5.5
'16'15'14'13'12'11'10'09'08
ESRI (www.bao.arcgis.com)Source:
Employed Population 16+ by IndustryCity of Sonoma, 2016
Information
Wholesale Trade
Agriculture and Mining
Transportation and Utilities
Public Administration
Finance, Insurance, and Real Estate
Construction
Manufacturing
Retail Trade
Services
56%
10%
10%
9%
ESRI (www.bao.arcgis.com)Source:
Total Business Establishments2016
0 1500 3000 4500 6000 7500 9000
Cloverdale
Cotati
Sebastopol
Windsor
Healdsburg
City of Sonoma
Rohnert Park
Petaluma
Santa Rosa
Bay Area Real Estate Information Services (www.bareis.com)
Source:
Median Price of an Existing HomeCity of Sonoma, (Thousands of Dollars), 1999-2015
$0
$100
$200
$300
$400
$500
$600
$700
$800
'15'14'13'12'11'10'09'08'07'06'05'04'03'02'01'00'99
Bay Area Real Estate Information Services (www.bareis.com)
Source:
Total Number of Houses SoldCity of Sonoma, 1999-2015
0
100
200
300
400
500
600
700
800
'15'13'11'09'07'05'03'01'99
California Board of Equalization (www.boe.ca.gov)
Source:
Total Taxable SalesCity of Sonoma, (Millions of Dollars), 1997-2014
$0
$50
$100
$150
$200
$250
$300
'14'12'10'08'06'04'02'00'98
California Department of Education (www.cde.ca.gov)
Source:
English Learners, by School District2015-2016
0% 10% 20% 30% 40%
Cloverdale Unified School District
Sonoma Valley UnifiedSchool District
Healdsburg UnifiedSchool District
Santa Rosa City Schools
Sonoma County
California
Windsor UnifiedSchool District
Cotati-RohnertPark
Petaluma City Schools
Sebastopol Union School District
Percent of Total Students
28%
27%17%
14%
9%
U.S. Census Bureau (www.census.gov) Source:
Residential Housing VacancyCity of Sonoma, Rental and Homeowner Inventory
0%
2%
4%
6%
8%
10%Rental
Homeowner
2015201420132012201120102009

PG. 9SONOMAEDB.ORG
2017 CITY OF SONOMA PROFILE REPORT
RESIDENTIAL REAL ESTATE
Median home prices in the City of Sonoma continue to increase, logging growth of 6.1% from 2014 to 2015. Median home prices extended gains realized since 2011 and reached $625,000 in 2015.
The total number of houses sold in City of Sonoma increased by 2 in 2015, reaching 564. The number of houses sold rose steadily from 2009 to 2012. However, rising home prices contributed to a flattening in the number of houses sold per year.
The average sales price of a home in City of Sonoma for 2015 was $883,989, up from the year prior. This puts the City of Sonoma at the higher end of the spectrum for homes in the area, $301,396 higher than the county average.
ESRI (www.bao.arcgis.com) Source:
Total PopulationCity of Sonoma, (Thousands of Residents)
0
2
4
6
8
10
12
2021201620102000
ESRI (www.bao.arcgis.com) Source:
Population 25+ by Educational AttainmentCity of Sonoma, 2016
Less than 9th Grade
High School, No Diploma
Associate Degree
Graduate/Professional Degree
HS Graduate/GED
Bachelor's Degree
Some College
ESRI (www.bao.arcgis.com)Source:
Current and Projected Age DistributionCity of Sonoma, 2016 & 2021
0%
5%
10%
15%
20%
25%
30%
35%
2021
2016
65+45-6425-4410-244-90-4
ESRI (www.bao.arcgis.com) Source:
Median Household IncomeCity of Sonoma, (Thousands of Dollars)
$0
$10
$20
$30
$40
$50
$60
$70
$80
2021201620112000
California Economic Development Deparment (www.edd.ca.gov)
Source:
Unemployment RateCity of Sonoma, 2008-Sept. 2016
0%
2%
4%
6%
8%
10%
12%
'16'15'14'13'12'11'10'09'08
California Economic Development Deparment (www.edd.ca.gov)
Source:
Employment LevelsCity of Sonoma, (Thousands of Employees), 2008-Sept. 2016
0.0
1.1
2.2
3.3
4.4
5.5
'16'15'14'13'12'11'10'09'08
ESRI (www.bao.arcgis.com)Source:
Employed Population 16+ by IndustryCity of Sonoma, 2016
Information
Wholesale Trade
Agriculture and Mining
Transportation and Utilities
Public Administration
Finance, Insurance, and Real Estate
Construction
Manufacturing
Retail Trade
Services
56%
10%
10%
9%
ESRI (www.bao.arcgis.com)Source:
Total Business Establishments2016
0 1500 3000 4500 6000 7500 9000
Cloverdale
Cotati
Sebastopol
Windsor
Healdsburg
City of Sonoma
Rohnert Park
Petaluma
Santa Rosa
Bay Area Real Estate Information Services (www.bareis.com)
Source:
Median Price of an Existing HomeCity of Sonoma, (Thousands of Dollars), 1999-2015
$0
$100
$200
$300
$400
$500
$600
$700
$800
'15'14'13'12'11'10'09'08'07'06'05'04'03'02'01'00'99
Bay Area Real Estate Information Services (www.bareis.com)
Source:
Total Number of Houses SoldCity of Sonoma, 1999-2015
0
100
200
300
400
500
600
700
800
'15'13'11'09'07'05'03'01'99
California Board of Equalization (www.boe.ca.gov)
Source:
Total Taxable SalesCity of Sonoma, (Millions of Dollars), 1997-2014
$0
$50
$100
$150
$200
$250
$300
'14'12'10'08'06'04'02'00'98
California Department of Education (www.cde.ca.gov)
Source:
English Learners, by School District2015-2016
0% 10% 20% 30% 40%
Cloverdale Unified School District
Sonoma Valley UnifiedSchool District
Healdsburg UnifiedSchool District
Santa Rosa City Schools
Sonoma County
California
Windsor UnifiedSchool District
Cotati-RohnertPark
Petaluma City Schools
Sebastopol Union School District
Percent of Total Students
28%
27%17%
14%
9%
U.S. Census Bureau (www.census.gov) Source:
Residential Housing VacancyCity of Sonoma, Rental and Homeowner Inventory
0%
2%
4%
6%
8%
10%Rental
Homeowner
2015201420132012201120102009
ESRI (www.bao.arcgis.com) Source:
Total PopulationCity of Sonoma, (Thousands of Residents)
0
2
4
6
8
10
12
2021201620102000
ESRI (www.bao.arcgis.com) Source:
Population 25+ by Educational AttainmentCity of Sonoma, 2016
Less than 9th Grade
High School, No Diploma
Associate Degree
Graduate/Professional Degree
HS Graduate/GED
Bachelor's Degree
Some College
ESRI (www.bao.arcgis.com)Source:
Current and Projected Age DistributionCity of Sonoma, 2016 & 2021
0%
5%
10%
15%
20%
25%
30%
35%
2021
2016
65+45-6425-4410-244-90-4
ESRI (www.bao.arcgis.com) Source:
Median Household IncomeCity of Sonoma, (Thousands of Dollars)
$0
$10
$20
$30
$40
$50
$60
$70
$80
2021201620112000
California Economic Development Deparment (www.edd.ca.gov)
Source:
Unemployment RateCity of Sonoma, 2008-Sept. 2016
0%
2%
4%
6%
8%
10%
12%
'16'15'14'13'12'11'10'09'08
California Economic Development Deparment (www.edd.ca.gov)
Source:
Employment LevelsCity of Sonoma, (Thousands of Employees), 2008-Sept. 2016
0.0
1.1
2.2
3.3
4.4
5.5
'16'15'14'13'12'11'10'09'08
ESRI (www.bao.arcgis.com)Source:
Employed Population 16+ by IndustryCity of Sonoma, 2016
Information
Wholesale Trade
Agriculture and Mining
Transportation and Utilities
Public Administration
Finance, Insurance, and Real Estate
Construction
Manufacturing
Retail Trade
Services
56%
10%
10%
9%
ESRI (www.bao.arcgis.com)Source:
Total Business Establishments2016
0 1500 3000 4500 6000 7500 9000
Cloverdale
Cotati
Sebastopol
Windsor
Healdsburg
City of Sonoma
Rohnert Park
Petaluma
Santa Rosa
Bay Area Real Estate Information Services (www.bareis.com)
Source:
Median Price of an Existing HomeCity of Sonoma, (Thousands of Dollars), 1999-2015
$0
$100
$200
$300
$400
$500
$600
$700
$800
'15'14'13'12'11'10'09'08'07'06'05'04'03'02'01'00'99
Bay Area Real Estate Information Services (www.bareis.com)
Source:
Total Number of Houses SoldCity of Sonoma, 1999-2015
0
100
200
300
400
500
600
700
800
'15'13'11'09'07'05'03'01'99
California Board of Equalization (www.boe.ca.gov)
Source:
Total Taxable SalesCity of Sonoma, (Millions of Dollars), 1997-2014
$0
$50
$100
$150
$200
$250
$300
'14'12'10'08'06'04'02'00'98
California Department of Education (www.cde.ca.gov)
Source:
English Learners, by School District2015-2016
0% 10% 20% 30% 40%
Cloverdale Unified School District
Sonoma Valley UnifiedSchool District
Healdsburg UnifiedSchool District
Santa Rosa City Schools
Sonoma County
California
Windsor UnifiedSchool District
Cotati-RohnertPark
Petaluma City Schools
Sebastopol Union School District
Percent of Total Students
28%
27%17%
14%
9%
U.S. Census Bureau (www.census.gov) Source:
Residential Housing VacancyCity of Sonoma, Rental and Homeowner Inventory
0%
2%
4%
6%
8%
10%Rental
Homeowner
2015201420132012201120102009
ESRI (www.bao.arcgis.com) Source:Source:
Population, by Race/EthnicityCity of Sonoma
0%
10%
20%
30%
40%
50%
60%
70%
80%2021
2016
2010
Pacific IslanderAmerican IndianBlack/African American
AsianHispanicWhite
ESRI (www.bao.arcgis.com) Source:Source:
Households, by IncomeCity of Sonoma
0%
5%
10%
15%
20%2021
2016
2000
$200,000+$150,000-$199,999
$100,000-$149,999
$75,000-$99,999
$50,000-$74,999
$35,000-$49,999
25,000-$34,999
$15,000-$24,999
<$15,000
Bay Area Real Estate Information Services (www.bareis.com)
Source:Source:
Average Home Sales Price, by Sub-county Area(Thousands of Dollars), 2015
$0
$200
$400
$600
$800
$1000
$1200
WindsorSonomaSebastopolSanta RosaRohnert Park PetalumaHealdsburgCotatiCloverdale
County Avg.
California Homebuilding Foundation (www.mychf.org)
Source:Source:
Value of Residential and Non-residential Building PermitsCity of Sonoma, (Millions of Dollars), 2000-2016
$0
$5
$10
$15
$20
$25
$30
$35
$40Non-residential
Residential
'16'15'14'13'12'11'10'09'08'07'06'05'04'03'02'01'00
ESRI (www.bao.arcgis.com) *Other includes: Apparel and Services, Alcoholic Beverages, Household Operations, Housekeeping Supplies, Household Furnishings and Equipment, Life/Other Insurance, Miscellanous, Personal Care Products and Services, and Smoking Products
Source:
Consumer Spending, By CommodityCity of Sonoma, 2016
Education $9,949,036
Travel $13,022,248
Entertainment/Recreation $19,013,677
Cash Contributions/Gifts $28,380,787
Healthcare $34,948,303
Pensions and Social Security $44,431,325
Transportation $50,087,293
Food $51,275,016
Other* $54,521,580
Housing $136,028,571
California Department of Education (www.cde.ca.gov)Source:
Average SAT Score, by School DistrictCity of Sonoma, 2014-2015 & 2012-2015 Average
0
350
700
1050
1400
17503-Year Average: 2012-2015
2014-2015 School Year
Wes
t Sono
ma
County
Union
High
School
(Seb
asto
pol)
Petalu
ma
Join
t
Uni
on Hig
h
Santa
Rosa
City
Sch
ools
Sonom
a Coun
ty
Heald
sbur
g Uni
fied
School D
istric
t
Win
dsor U
nifie
d
School D
istric
t
Cotati-
Rohner
t Par
k
Uni
fied S
chool D
istric
t
Califo
rnia
Sonom
a Vall
ey U
nified
Sch
ool Dist
rict
Clove
rdale
Uni
fied
Sch
ool Dist
rict

PG. 10SONOMAEDB.ORG
2017 CITY OF SONOMA PROFILE REPORT
REAL ESTATE & CONSTRUCTION
The residential housing market for rental units in the City of Sonoma exhibited a tightening trend from 2009 to 2013. From 2009 to 2013 the rental vacancy rate declined sharply from around 8.9% to 0%. Although the vacancy rate may not actually be 0% due to a slight margin of error in U.S. Census estimates, this does show that the market for rental units in the City of Sonoma is tight. After 2013 rental vacancy rates improved somewhat, reaching 4.1% in 2015. The homeowner housing vacancy rate exhibited signs of a loosening housing market, with rates increasing from 0% in 2010 to 2.7% in 2015. Many real estate analysts consider a vacancy rate of 3% as full occupancy in a given housing market, indicating a tight housing market despite slight increases in vacancy rates.
The values of residential and non-residential building permits in the City of Sonoma fell to $17,363,562 and $4,813,054, respectively. Building permit values reflect trends in construction activity. As the first step in the construction process, the value of permits represent the intention to build. After steep gains in the last 3 years, especially in the value of residential permits, the City of Sonoma experienced a decline from between July 2015 and July 2016 compared to the previous 12 month period.
ESRI (www.bao.arcgis.com) Source:
Total PopulationCity of Sonoma, (Thousands of Residents)
0
2
4
6
8
10
12
2021201620102000
ESRI (www.bao.arcgis.com) Source:
Population 25+ by Educational AttainmentCity of Sonoma, 2016
Less than 9th Grade
High School, No Diploma
Associate Degree
Graduate/Professional Degree
HS Graduate/GED
Bachelor's Degree
Some College
ESRI (www.bao.arcgis.com)Source:
Current and Projected Age DistributionCity of Sonoma, 2016 & 2021
0%
5%
10%
15%
20%
25%
30%
35%
2021
2016
65+45-6425-4410-244-90-4
ESRI (www.bao.arcgis.com) Source:
Median Household IncomeCity of Sonoma, (Thousands of Dollars)
$0
$10
$20
$30
$40
$50
$60
$70
$80
2021201620112000
California Economic Development Deparment (www.edd.ca.gov)
Source:
Unemployment RateCity of Sonoma, 2008-Sept. 2016
0%
2%
4%
6%
8%
10%
12%
'16'15'14'13'12'11'10'09'08
California Economic Development Deparment (www.edd.ca.gov)
Source:
Employment LevelsCity of Sonoma, (Thousands of Employees), 2008-Sept. 2016
0.0
1.1
2.2
3.3
4.4
5.5
'16'15'14'13'12'11'10'09'08
ESRI (www.bao.arcgis.com)Source:
Employed Population 16+ by IndustryCity of Sonoma, 2016
Information
Wholesale Trade
Agriculture and Mining
Transportation and Utilities
Public Administration
Finance, Insurance, and Real Estate
Construction
Manufacturing
Retail Trade
Services
56%
10%
10%
9%
ESRI (www.bao.arcgis.com)Source:
Total Business Establishments2016
0 1500 3000 4500 6000 7500 9000
Cloverdale
Cotati
Sebastopol
Windsor
Healdsburg
City of Sonoma
Rohnert Park
Petaluma
Santa Rosa
Bay Area Real Estate Information Services (www.bareis.com)
Source:
Median Price of an Existing HomeCity of Sonoma, (Thousands of Dollars), 1999-2015
$0
$100
$200
$300
$400
$500
$600
$700
$800
'15'14'13'12'11'10'09'08'07'06'05'04'03'02'01'00'99
Bay Area Real Estate Information Services (www.bareis.com)
Source:
Total Number of Houses SoldCity of Sonoma, 1999-2015
0
100
200
300
400
500
600
700
800
'15'13'11'09'07'05'03'01'99
California Board of Equalization (www.boe.ca.gov)
Source:
Total Taxable SalesCity of Sonoma, (Millions of Dollars), 1997-2014
$0
$50
$100
$150
$200
$250
$300
'14'12'10'08'06'04'02'00'98
California Department of Education (www.cde.ca.gov)
Source:
English Learners, by School District2015-2016
0% 10% 20% 30% 40%
Cloverdale Unified School District
Sonoma Valley UnifiedSchool District
Healdsburg UnifiedSchool District
Santa Rosa City Schools
Sonoma County
California
Windsor UnifiedSchool District
Cotati-RohnertPark
Petaluma City Schools
Sebastopol Union School District
Percent of Total Students
28%
27%17%
14%
9%
U.S. Census Bureau (www.census.gov) Source:
Residential Housing VacancyCity of Sonoma, Rental and Homeowner Inventory
0%
2%
4%
6%
8%
10%Rental
Homeowner
2015201420132012201120102009
ESRI (www.bao.arcgis.com) Source:Source:
Population, by Race/EthnicityCity of Sonoma
0%
10%
20%
30%
40%
50%
60%
70%
80%2021
2016
2010
Pacific IslanderAmerican IndianBlack/African American
AsianHispanicWhite
ESRI (www.bao.arcgis.com) Source:Source:
Households, by IncomeCity of Sonoma
0%
5%
10%
15%
20%2021
2016
2000
$200,000+$150,000-$199,999
$100,000-$149,999
$75,000-$99,999
$50,000-$74,999
$35,000-$49,999
25,000-$34,999
$15,000-$24,999
<$15,000
Bay Area Real Estate Information Services (www.bareis.com)
Source:Source:
Average Home Sales Price, by Sub-county Area(Thousands of Dollars), 2015
$0
$200
$400
$600
$800
$1000
$1200
WindsorSonomaSebastopolSanta RosaRohnert Park PetalumaHealdsburgCotatiCloverdale
County Avg.
California Homebuilding Foundation (www.mychf.org)
Source:Source:
Value of Residential and Non-residential Building PermitsCity of Sonoma, (Millions of Dollars), 2000-2016
$0
$5
$10
$15
$20
$25
$30
$35
$40Non-residential
Residential
'16'15'14'13'12'11'10'09'08'07'06'05'04'03'02'01'00
ESRI (www.bao.arcgis.com) *Other includes: Apparel and Services, Alcoholic Beverages, Household Operations, Housekeeping Supplies, Household Furnishings and Equipment, Life/Other Insurance, Miscellanous, Personal Care Products and Services, and Smoking Products
Source:
Consumer Spending, By CommodityCity of Sonoma, 2016
Education $9,949,036
Travel $13,022,248
Entertainment/Recreation $19,013,677
Cash Contributions/Gifts $28,380,787
Healthcare $34,948,303
Pensions and Social Security $44,431,325
Transportation $50,087,293
Food $51,275,016
Other* $54,521,580
Housing $136,028,571
California Department of Education (www.cde.ca.gov)Source:
Average SAT Score, by School DistrictCity of Sonoma, 2014-2015 & 2012-2015 Average
0
350
700
1050
1400
17503-Year Average: 2012-2015
2014-2015 School Year
Wes
t Sono
ma
County
Union
High
School
(Seb
asto
pol)
Petalu
ma
Join
t
Uni
on Hig
h
Santa
Rosa
City
Sch
ools
Sonom
a Coun
ty
Heald
sbur
g Uni
fied
School D
istric
t
Win
dsor U
nifie
d
School D
istric
t
Cotati-
Rohner
t Par
k
Uni
fied S
chool D
istric
t
Califo
rnia
Sonom
a Vall
ey U
nified
Sch
ool Dist
rict
Clove
rdale
Uni
fied
Sch
ool Dist
rict
PG. 11SONOMAEDB.ORG
2017 CITY OF SONOMA PROFILE REPORT
CONSUMER ACTIVITY
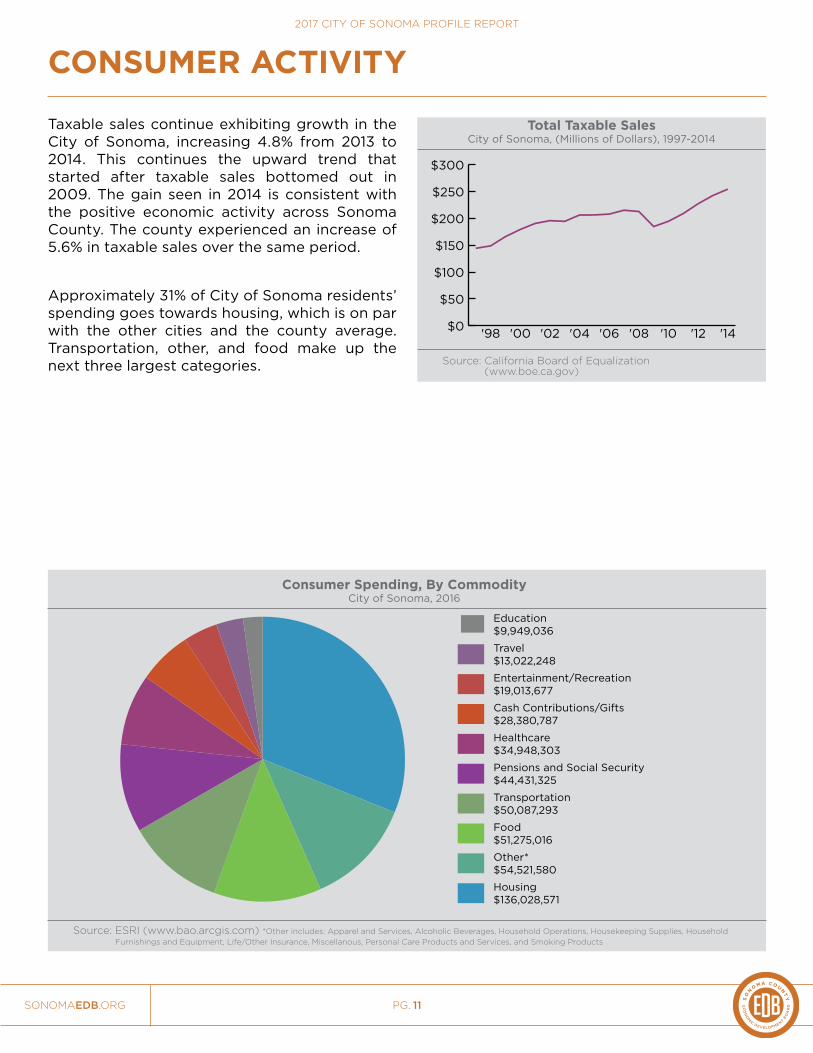
Taxable sales continue exhibiting growth in the City of Sonoma, increasing 4.8% from 2013 to 2014. This continues the upward trend that started after taxable sales bottomed out in 2009. The gain seen in 2014 is consistent with the positive economic activity across Sonoma County. The county experienced an increase of 5.6% in taxable sales over the same period.
Approximately 31% of City of Sonoma residents’ spending goes towards housing, which is on par with the other cities and the county average. Transportation, other, and food make up the next three largest categories.
ESRI (www.bao.arcgis.com) Source:
Total PopulationCity of Sonoma, (Thousands of Residents)
0
2
4
6
8
10
12
2021201620102000
ESRI (www.bao.arcgis.com) Source:
Population 25+ by Educational AttainmentCity of Sonoma, 2016
Less than 9th Grade
High School, No Diploma
Associate Degree
Graduate/Professional Degree
HS Graduate/GED
Bachelor's Degree
Some College
ESRI (www.bao.arcgis.com)Source:
Current and Projected Age DistributionCity of Sonoma, 2016 & 2021
0%
5%
10%
15%
20%
25%
30%
35%
2021
2016
65+45-6425-4410-244-90-4
ESRI (www.bao.arcgis.com) Source:
Median Household IncomeCity of Sonoma, (Thousands of Dollars)
$0
$10
$20
$30
$40
$50
$60
$70
$80
2021201620112000
California Economic Development Deparment (www.edd.ca.gov)
Source:
Unemployment RateCity of Sonoma, 2008-Sept. 2016
0%
2%
4%
6%
8%
10%
12%
'16'15'14'13'12'11'10'09'08
California Economic Development Deparment (www.edd.ca.gov)
Source:
Employment LevelsCity of Sonoma, (Thousands of Employees), 2008-Sept. 2016
0.0
1.1
2.2
3.3
4.4
5.5
'16'15'14'13'12'11'10'09'08
ESRI (www.bao.arcgis.com)Source:
Employed Population 16+ by IndustryCity of Sonoma, 2016
Information
Wholesale Trade
Agriculture and Mining
Transportation and Utilities
Public Administration
Finance, Insurance, and Real Estate
Construction
Manufacturing
Retail Trade
Services
56%
10%
10%
9%
ESRI (www.bao.arcgis.com)Source:
Total Business Establishments2016
0 1500 3000 4500 6000 7500 9000
Cloverdale
Cotati
Sebastopol
Windsor
Healdsburg
City of Sonoma
Rohnert Park
Petaluma
Santa Rosa
Bay Area Real Estate Information Services (www.bareis.com)
Source:
Median Price of an Existing HomeCity of Sonoma, (Thousands of Dollars), 1999-2015
$0
$100
$200
$300
$400
$500
$600
$700
$800
'15'14'13'12'11'10'09'08'07'06'05'04'03'02'01'00'99
Bay Area Real Estate Information Services (www.bareis.com)
Source:
Total Number of Houses SoldCity of Sonoma, 1999-2015
0
100
200
300
400
500
600
700
800
'15'13'11'09'07'05'03'01'99
California Board of Equalization (www.boe.ca.gov)
Source:
Total Taxable SalesCity of Sonoma, (Millions of Dollars), 1997-2014
$0
$50
$100
$150
$200
$250
$300
'14'12'10'08'06'04'02'00'98
California Department of Education (www.cde.ca.gov)
Source:
English Learners, by School District2015-2016
0% 10% 20% 30% 40%
Cloverdale Unified School District
Sonoma Valley UnifiedSchool District
Healdsburg UnifiedSchool District
Santa Rosa City Schools
Sonoma County
California
Windsor UnifiedSchool District
Cotati-RohnertPark
Petaluma City Schools
Sebastopol Union School District
Percent of Total Students
28%
27%17%
14%
9%
U.S. Census Bureau (www.census.gov) Source:
Residential Housing VacancyCity of Sonoma, Rental and Homeowner Inventory
0%
2%
4%
6%
8%
10%Rental
Homeowner
2015201420132012201120102009
ESRI (www.bao.arcgis.com) Source:Source:
Population, by Race/EthnicityCity of Sonoma
0%
10%
20%
30%
40%
50%
60%
70%
80%2021
2016
2010
Pacific IslanderAmerican IndianBlack/African American
AsianHispanicWhite
ESRI (www.bao.arcgis.com) Source:Source:
Households, by IncomeCity of Sonoma
0%
5%
10%
15%
20%2021
2016
2000
$200,000+$150,000-$199,999
$100,000-$149,999
$75,000-$99,999
$50,000-$74,999
$35,000-$49,999
25,000-$34,999
$15,000-$24,999
<$15,000
Bay Area Real Estate Information Services (www.bareis.com)
Source:Source:
Average Home Sales Price, by Sub-county Area(Thousands of Dollars), 2015
$0
$200
$400
$600
$800
$1000
$1200
WindsorSonomaSebastopolSanta RosaRohnert Park PetalumaHealdsburgCotatiCloverdale
County Avg.
California Homebuilding Foundation (www.mychf.org)
Source:Source:
Value of Residential and Non-residential Building PermitsCity of Sonoma, (Millions of Dollars), 2000-2016
$0
$5
$10
$15
$20
$25
$30
$35
$40Non-residential
Residential
'16'15'14'13'12'11'10'09'08'07'06'05'04'03'02'01'00
ESRI (www.bao.arcgis.com) *Other includes: Apparel and Services, Alcoholic Beverages, Household Operations, Housekeeping Supplies, Household Furnishings and Equipment, Life/Other Insurance, Miscellanous, Personal Care Products and Services, and Smoking Products
Source:
Consumer Spending, By CommodityCity of Sonoma, 2016
Education $9,949,036
Travel $13,022,248
Entertainment/Recreation $19,013,677
Cash Contributions/Gifts $28,380,787
Healthcare $34,948,303
Pensions and Social Security $44,431,325
Transportation $50,087,293
Food $51,275,016
Other* $54,521,580
Housing $136,028,571
California Department of Education (www.cde.ca.gov)Source:
Average SAT Score, by School DistrictCity of Sonoma, 2014-2015 & 2012-2015 Average
0
350
700
1050
1400
17503-Year Average: 2012-2015
2014-2015 School Year
Wes
t Sono
ma
County
Union
High
School
(Seb
asto
pol)
Petalu
ma
Join
t
Uni
on Hig
h
Santa
Rosa
City
Sch
ools
Sonom
a Coun
ty
Heald
sbur
g Uni
fied
School D
istric
t
Win
dsor U
nifie
d
School D
istric
t
Cotati-
Rohner
t Par
k
Uni
fied S
chool D
istric
t
Califo
rnia
Sonom
a Vall
ey U
nified
Sch
ool Dist
rict
Clove
rdale
Uni
fied
Sch
ool Dist
rict

PG. 12SONOMAEDB.ORG
2017 CITY OF SONOMA PROFILE REPORT
EDUCATION
The Sonoma Valley Unified School District serves the greater Sonoma Valley, including the City of Sonoma along with the unincorporated communities of El Verano, Boyes Hot Springs, Fetters Hot Springs, Agua Caliente, Glen Ellen, Vineburg and Schellville. The district enrolls about 4,600 students each year.
The percentage of English learners in the Sonoma Valley Unified School District is 31.8%. This includes elementary, middle, and high school students. The ratio of English learners in the Sonoma Valley Unified School District is well above the county average of 22.8%, as well as the state average of 22.1%.
The average SAT score for a student from the Sonoma Valley School District in the 2013-14 school year was 1455. This places the Sonoma Valley Unified School District below the county average of 1570, and below the state average of 1473.
ESRI (www.bao.arcgis.com) Source:
Total PopulationCity of Sonoma, (Thousands of Residents)
0
2
4
6
8
10
12
2021201620102000
ESRI (www.bao.arcgis.com) Source:
Population 25+ by Educational AttainmentCity of Sonoma, 2016
Less than 9th Grade
High School, No Diploma
Associate Degree
Graduate/Professional Degree
HS Graduate/GED
Bachelor's Degree
Some College
ESRI (www.bao.arcgis.com)Source:
Current and Projected Age DistributionCity of Sonoma, 2016 & 2021
0%
5%
10%
15%
20%
25%
30%
35%
2021
2016
65+45-6425-4410-244-90-4
ESRI (www.bao.arcgis.com) Source:
Median Household IncomeCity of Sonoma, (Thousands of Dollars)
$0
$10
$20
$30
$40
$50
$60
$70
$80
2021201620112000
California Economic Development Deparment (www.edd.ca.gov)
Source:
Unemployment RateCity of Sonoma, 2008-Sept. 2016
0%
2%
4%
6%
8%
10%
12%
'16'15'14'13'12'11'10'09'08
California Economic Development Deparment (www.edd.ca.gov)
Source:
Employment LevelsCity of Sonoma, (Thousands of Employees), 2008-Sept. 2016
0.0
1.1
2.2
3.3
4.4
5.5
'16'15'14'13'12'11'10'09'08
ESRI (www.bao.arcgis.com)Source:
Employed Population 16+ by IndustryCity of Sonoma, 2016
Information
Wholesale Trade
Agriculture and Mining
Transportation and Utilities
Public Administration
Finance, Insurance, and Real Estate
Construction
Manufacturing
Retail Trade
Services
56%
10%
10%
9%
ESRI (www.bao.arcgis.com)Source:
Total Business Establishments2016
0 1500 3000 4500 6000 7500 9000
Cloverdale
Cotati
Sebastopol
Windsor
Healdsburg
City of Sonoma
Rohnert Park
Petaluma
Santa Rosa
Bay Area Real Estate Information Services (www.bareis.com)
Source:
Median Price of an Existing HomeCity of Sonoma, (Thousands of Dollars), 1999-2015
$0
$100
$200
$300
$400
$500
$600
$700
$800
'15'14'13'12'11'10'09'08'07'06'05'04'03'02'01'00'99
Bay Area Real Estate Information Services (www.bareis.com)
Source:
Total Number of Houses SoldCity of Sonoma, 1999-2015
0
100
200
300
400
500
600
700
800
'15'13'11'09'07'05'03'01'99
California Board of Equalization (www.boe.ca.gov)
Source:
Total Taxable SalesCity of Sonoma, (Millions of Dollars), 1997-2014
$0
$50
$100
$150
$200
$250
$300
'14'12'10'08'06'04'02'00'98
California Department of Education (www.cde.ca.gov)
Source:
English Learners, by School District2015-2016
0% 10% 20% 30% 40%
Cloverdale Unified School District
Sonoma Valley UnifiedSchool District
Healdsburg UnifiedSchool District
Santa Rosa City Schools
Sonoma County
California
Windsor UnifiedSchool District
Cotati-RohnertPark
Petaluma City Schools
Sebastopol Union School District
Percent of Total Students
28%
27%17%
14%
9%
U.S. Census Bureau (www.census.gov) Source:
Residential Housing VacancyCity of Sonoma, Rental and Homeowner Inventory
0%
2%
4%
6%
8%
10%Rental
Homeowner
2015201420132012201120102009
ESRI (www.bao.arcgis.com) Source:Source:
Population, by Race/EthnicityCity of Sonoma
0%
10%
20%
30%
40%
50%
60%
70%
80%2021
2016
2010
Pacific IslanderAmerican IndianBlack/African American
AsianHispanicWhite
ESRI (www.bao.arcgis.com) Source:Source:
Households, by IncomeCity of Sonoma
0%
5%
10%
15%
20%2021
2016
2000
$200,000+$150,000-$199,999
$100,000-$149,999
$75,000-$99,999
$50,000-$74,999
$35,000-$49,999
25,000-$34,999
$15,000-$24,999
<$15,000
Bay Area Real Estate Information Services (www.bareis.com)
Source:Source:
Average Home Sales Price, by Sub-county Area(Thousands of Dollars), 2015
$0
$200
$400
$600
$800
$1000
$1200
WindsorSonomaSebastopolSanta RosaRohnert Park PetalumaHealdsburgCotatiCloverdale
County Avg.
California Homebuilding Foundation (www.mychf.org)
Source:Source:
Value of Residential and Non-residential Building PermitsCity of Sonoma, (Millions of Dollars), 2000-2016
$0
$5
$10
$15
$20
$25
$30
$35
$40Non-residential
Residential
'16'15'14'13'12'11'10'09'08'07'06'05'04'03'02'01'00
ESRI (www.bao.arcgis.com) *Other includes: Apparel and Services, Alcoholic Beverages, Household Operations, Housekeeping Supplies, Household Furnishings and Equipment, Life/Other Insurance, Miscellanous, Personal Care Products and Services, and Smoking Products
Source:
Consumer Spending, By CommodityCity of Sonoma, 2016
Education $9,949,036
Travel $13,022,248
Entertainment/Recreation $19,013,677
Cash Contributions/Gifts $28,380,787
Healthcare $34,948,303
Pensions and Social Security $44,431,325
Transportation $50,087,293
Food $51,275,016
Other* $54,521,580
Housing $136,028,571
California Department of Education (www.cde.ca.gov)Source:
Average SAT Score, by School DistrictCity of Sonoma, 2014-2015 & 2012-2015 Average
0
350
700
1050
1400
17503-Year Average: 2012-2015
2014-2015 School Year
Wes
t Sono
ma
County
Union
High
School
(Seb
asto
pol)
Petalu
ma
Join
t
Uni
on Hig
h
Santa
Rosa
City
Sch
ools
Sonom
a Coun
ty
Heald
sbur
g Uni
fied
School D
istric
t
Win
dsor U
nifie
d
School D
istric
t
Cotati-
Rohner
t Par
k
Uni
fied S
chool D
istric
t
Califo
rnia
Sonom
a Vall
ey U
nified
Sch
ool Dist
rict
Clove
rdale
Uni
fied
Sch
ool Dist
rict

PG. 13SONOMAEDB.ORG
2017 CITY OF SONOMA PROFILE REPORT
CITY DATA SNAPSHOT
Cloverdale
Cotati
Healdsburg
Petaluma
Rohnert Park
Santa Rosa
Sebastopol
City of Sonoma
Windsor
SonomaCounty*
TotalPopulation
2016
Unemployment Rate
Sept. 2016
MedianHousehold
Income2016
AverageSales Priceof a Home
2015
Percentageof EnglishLearners2015-16
AverageTotal
SAT Scores2014-15
8,993 3.2% $54,516 $457,158 35.5% 1406
7,503 5.0%
11,768
60,336
42,661
175,105
7,647
11,342
27,568
503,284
3.5%
2.9%
3.9%
4.2%
3.2%
3.4%
3.2%
3.8%
$61,258
$60,240
$77,149
$58,611
$58,729
$63,270
$65,947
$80,847
$63,910
$377,528
$1,036,968
$603,276
$377,528
$504,125
$801,302
$883,989
$555,777
$582,593
17.7%
30.7%
12.8%
17.7%
24.8%
11.9%
31.8%
20.5%
22.8%
1496
1552
1630
1496
1622
1631
1455
1530
1570

PG. 14SONOMAEDB.ORG
2017 CITY OF SONOMA PROFILE REPORT
SOURCES
NOTE ON DATA SOURCESThe 2017 City of Sonoma Local Economic Profile is a brief summary on various demographic, economic and social aspects of the City of Sonoma. This report is meant to act as a spot-in-time profile to reflect conditions in the city in a given year. Economic Development Board (EDB) research originates from information available from outside resources and previously published material. The 2017 City of Sonoma Local Economic Profile offers partial or composite representations of raw data and cites respective source data sets. For more information, please see the listed sources.
The Local Economic Profile does not provide complete in-depth analyses of all facets of the incorporated cities or the county. The EDB believes all data contained within this report to be accurate and the most current available, but does not guarantee its accuracy or completeness. Use of data from an outside source does not represent an endorsement of any product or service by the EDB, its members or affiliates.
The 2017 City of Sonoma Local Economic Profile was developed from national and local data sources. Interested readers are encouraged to contact data source agencies or organizations for further research. Readers are also invited to suggest topics for future reports by calling (707) 565-7170 or e-mailing [email protected].
DATA SOURCESBay Area Real Estate Information Services
California Board of Equalization
California Department of Education
California Employment Development Department
California Homebuilding Foundation
ESRI Business Analyst
United States Census Bureau

PG. 15SONOMAEDB.ORG
2017 CITY OF SONOMA PROFILE REPORT
ACKNOWLEDGMENTS
This report was prepared by Sean Werkema. Please direct any questions or comments to 707-565-7170 or by email at [email protected].
707 - 565 - 7170
SONOMAEDB.ORG
141 STONY CIRCLE, STE. 110, SANTA ROSA, CA 95401