city of groton, connecticut comprehensive annual financial
TRANSCRIPT

CITY OF GROTON, CONNECTICUT COMPREHENSIVE ANNUAL
FINANCIAL REPORT
FISCAL YEAR ENDED JUNE 30, 2019 DEPARTMENT OF FINANCE
CITY OF GROTON, CONNECTICUT


CITY OF GROTON, CONNECTICUT Comprehensive Annual Financial Report For the Year Ended June 30, 2019 PREPARED BY: RONALD YUHAS, JR. DIRECTOR OF FINANCE
KEITH HEDRICK, MAYOR


(a)
Contents Introductory Section – Unaudited Transmittal Letter i-iv Organizational Chart of the Government of the City of Groton v Principal Municipal Officials vi Financial Section Independent Auditor’s Report 1-3 Management’s Discussion and Analysis – Unaudited 5-12
Basic Financial Statements
Government-Wide Financial Statements: Statement of net position 13 Statement of activities 14
Fund Financial Statements: Balance sheet – governmental funds 15 Statement of revenues, expenditures and changes in fund balances –
governmental funds 16 Reconciliation of the statement of revenues, expenditures and changes in fund
balances of governmental funds to the statement of activities 17 Statement of net position – proprietary funds 18-19 Statement of revenues, expenses and changes in fund net position – proprietary
funds 20 Statement of cash flows – proprietary funds 21-22 Statement of fiduciary net position – fiduciary funds 23 Statement of changes in fiduciary net position – fiduciary funds 24 Notes to financial statements 25-62
Required Supplementary Information – Unaudited Schedule of employer contributions – pension trust fund 63 Schedule of investment returns – pension trust fund 64 Schedule of changes in the City’s net pension liability and related ratios 65 Schedule of employer contributions – OPEB trust fund 66 Schedule of changes in the City’s OPEB liability and related ratios 67 Schedule of investment returns – OPEB trust fund 68 Schedule of revenues and expenditures – budget and actual – budgetary basis –
General Fund 69 Note to required supplementary information 70-71

(b)
Contents
Combining and Individual Fund Financial Statements and Other Schedules
General Fund
Comparative balance sheets 73 Schedule of revenues and other financing sources – budgetary basis – budget and
actual 74-75 Schedule of expenditures and other financing uses – budgetary basis – budget and
actual 76-77 Schedule of property taxes levied, collected and outstanding 78
Nonmajor Governmental Funds Combining balance sheet 79 Combining statement of revenues, expenditures and changes in fund balances
(deficits) 80
Nonmajor Enterprise Fund Statement of net position – sewer department – nonmajor enterprise fund 81-82 Statement of revenues, expenditures and changes in net positions – nonmajor
enterprise fund 83 Statement of cash flows – nonmajor enterprise fund 84-85
Enterprise Funds
Electric Department Comparative statements of net position 87-88 Comparative statements of revenues, expenses and changes in fund net position 89 Comparative statements of cash flows 90-91 Comparative schedules of revenues 92 Comparative schedules of expenses 93 Water Department Comparative statements of net position 95-96 Comparative statements of revenues, expenses and changes in fund net position 97 Comparative statements of cash flows 98-99 Comparative schedules of revenues 100 Comparative schedules of expenses 101-102 Internal Service Funds: Combining statement of net position 104 Combining statement of revenues, expenses and changes in net position 105 Combining statement of cash flows 106

(c)
Contents Statistical Section – Unaudited
Table
1 Net position by component 108 2 Changes in net position 109-110 3 Changes in fund balances, governmental funds 111 4 Fund balances, governmental funds 112 5 Assessed and estimated actual value of taxable property 113 6 Property tax rates – direct and overlapping governments 114 7 Principal property taxpayers 115 8 Property tax levies and collections 116 9 Ratios of outstanding debt type 117
10 Ratio of net general bonded debt to assessed value and net general bonded debt per capita 118
11 Computation of direct and overlapping bonded debt 119 12 Schedule of statutory debt limitation 120 13 Schedule of statutory debt limitation 121 14 Demographic and economic statistics 122 15 Principal employers 123 16 Full-time equivalent government employees by function/program 124 17 Operating indicators by function/program 125 18 Capital asset statistics by function/program 126


Introductory Section


i
CITY OF GROTON 295 Meridian Street
Groton, Connecticut 06340-4040
Department of Finance Telephone (860) 446-4110
Fax (860) 446-4113
February 27, 2020 To: The Honorable Mayor, Members of the City Council, and Citizens of the City of Groton,
Connecticut. The Finance Department is pleased to present the Comprehensive Annual Financial Report (CAFR) of the City of Groton, Connecticut (City) for the year ended June 30, 2019. The report includes the independent auditors’ report as required by City Charter and the General Statutes of the State of Connecticut (Statutes). The report is prepared in conformity with accounting principles generally accepted in the United States of America (GAAP) and standards set forth by the Governmental Accounting Standards Board (GASB). Responsibility for both the accuracy of the data, and the completeness and fairness of the presentation, including all disclosures, rests with the management of the City. Management of the City is responsible for establishing and maintaining internal controls designed to ensure that the assets of the City are protected from loss, theft or misuse and to ensure that adequate accounting data are compiled to allow for the preparation of financial statements in conformity with GAAP. The internal controls are designed to provide reasonable, but not absolute, assurance that these objectives are met. The concept of reasonable assurance recognizes that: (1) the cost of a control should not exceed the benefits likely to be derived; and (2) the calculation of costs and benefits requires estimates and judgments by management. To the best of our knowledge and belief, the enclosed data are accurate in all material respects and are reported in a manner that presents fairly the financial position and results of operations as measured by the financial activity of its various funds. All disclosures necessary to enable the reader to gain an understanding of the City’s financial activities have been included. RSM US LLP, a public accounting firm fully licensed and qualified to perform audits of municipalities within the State of Connecticut, have audited the financial statements. The goal of the independent audit was to provide reasonable assurance that the financial statements of the City, for the fiscal year ended June 30, 2019, are free of material misstatement. The independent audit involved examining, on a test basis, evidence supporting the amounts and disclosures in the financial statements; assessing the accounting principles used and significant estimates made by management; and evaluating the overall financial statement presentation. The independent auditors concluded, based upon the audit, that there was a reasonable basis for rendering an unmodified opinion that the City of Groton’s financial statements for the year ended June 30, 2019, are fairly presented in conformity with GAAP. The independent auditors’ report is presented as the first component of the financial section of this report.

ii
The independent audit of the financial statements of the City was part of a broader Single Audit designed to meet the special needs of federal and state grantor agencies. The standards governing Single Audit engagements require the independent auditor to report not only on the fair presentation of the financial statements, but also on the audited government’s internal controls and compliance with legal requirements, with special emphasis on internal controls and legal requirements involving the administration of federal and state awards. These reports are available separately. GAAP requires that management provide a narrative introduction, overview, and analysis to accompany the basic financial statements in the form of Management’s Discussion and Analysis (MD&A). This letter of transmittal is designed to complement MD&A and should be read in conjunction with it. The City’s MD&A can be found immediately following the report of the independent auditors. Profile of the City of Groton The City is governed by an elected Mayor, a six-member council and a City Clerk. The City Council and Mayor, which act as a board, also serve as the Water Pollution Control Authority. Elections for Mayor, Council and other officials are held on the first Monday of May of each odd numbered year for a term of two years. The Mayor is elected separately from the Council and presides as its Chairperson. In addition to all the powers and privileges conferred in the Charter, the inhabitants have the powers and privileges conferred and granted to towns and cities under the Constitution and Statutes of Connecticut. The legislative power of the City is vested exclusively in the Council except as otherwise provided by the electors (those who are legally able to vote). The Council has the power to enact, amend or repeal ordinances consistent with the Statutes or the Charter. The electors have the power to approve or reject ordinances, by referendum, as provided in the Charter. The Mayor, as the Chief Executive Officer of the City, recommends the budget to the electors for their approval at the annual meeting held on the first Monday of June. The report includes all funds of the City. The City provides a full range of services. These services include police and fire protection; sanitation services; the construction and maintenance of highways, streets and infrastructure; and recreational activities. In addition to general governmental activities, the governing body is the final authority of the Electric, Water and Sewer Departments and the City of Groton Retirement System; therefore, these activities are included in the reporting entity. The reporting entity also includes the discretely presented component unit, Bozrah Light and Power Company. The annual budget serves as the foundation for the City’s financial planning and control. The City maintains budgetary controls with the objectives to ensure compliance with legal provisions embodied in the annual appropriated budget, approved by the Freemen or electors. The City maintains an encumbrance accounting system as one technique of accomplishing budgetary controls. As demonstrated by the budgetary schedules included in the financial section of this report, the City continues to meet its responsibility for sound financial management. The City is located in New London County in the southeast part of the State of Connecticut on the east bank of the Thames River and encompasses an area of 3.06 square miles. Groton is astride Interstate 95, a major highway between New York, Providence and Boston. Numerous state routes connect Groton with all points in Connecticut and with neighboring states. Passenger service is provided by Amtrak and by a number of interstate and intrastate bus companies. Air service is provided at Groton-New London Airport to major airports and cities. The Thames River provides a deep-water harbor with terminal and berth facilities for water transportation.
iii
Rocky soil limited the City’s early agricultural possibilities; therefore, the early inhabitants turned to the sea for fishing, trade, and shipbuilding. This seafaring heritage continues today in Groton, the self-proclaimed “Submarine Capital of the World.” Nuclear-powered submarines, built in the City by Electric Boat division of General Dynamics, are home ported at the U. S. Naval Submarine Base here. The Revolutionary War Battle of Groton Heights, which took place at Fort Griswold in 1781, is a hallmark of Groton’s history. British forces, led by General Benedict Arnold, staged a massive attack on the fort and the colonists under the leadership of Colonel William Ledyard, who bravely resisted. Severely outnumbered they finally surrendered to the British and prepared for capture. The British took no prisoners, though, and instead brutally massacred all those who surrendered, killing Colonel Ledyard with his own sword. Today, Fort Griswold is a state park featuring a monument and a museum. The Battle of Groton Heights is re-enacted here every year commemorating the soldiers who fought so bravely for freedom. Factors Affecting Financial Condition The City’s economic base is supported by a diverse selection of goods producing industries and services. Pharmaceutical and submarine building continue to be the leading manufacturing sectors in Groton. Property taxes, which account for approximately 32.4% of the General Fund revenue, have provided a reliable revenue source, with collections consistently at or above 99 percent. Current tax collections were approximately 99% of the adjusted tax levy. Groton Utilities Fiscal Year 2018-2019 marked another major milestone in the history of Groton Utilities as we continue the service of our customers and our community. Groton Utilities manages three types of services – electric, water and sewer. Electric Division Upgrading its Infrastructure During the past fiscal year, the Electric Division has been hard at work upgrading and improving the electric distribution system infrastructure. The various infrastructure improvement projects are designed to increase service reliability, increase capacity for future load growth and provide our customers with a level of service that is second to none. Costs associated with the Electric Division’s infrastructure improvement projects have been approved by the Utility Commission, City Council and the Freemen in the form of the Electric Bond Funds. The 2012 and 2016 Electric Bond Program calls for continued infrastructure improvements of two substations – Pleasant Valley and Buddington Road stations along with continued voltage improvements to our main transmission lines. In order to meet our customers’ demand for power and to provide the highest level of reliability, the distribution voltage throughout our service area will be increased from the present voltage of 8.32 kV to 13.8 kV. By increasing the voltage of the distribution system, primary conductors will be capable of distributing more power, more efficiency.

iv
Water The Water Division maintains its tradition of quality water and continues to look for ways to improve it. Protecting our water sources, purifying it, maintaining our water distribution system, and providing water testing to ensure the quality of the finished product is required to ensure regulatory compliance, while planning for the future. The 2016 Water Bond Fund calls for the replacement of the Walker Hill standpipe and meter replacements. The $54 million Water Treatment Plant Upgrade and local interconnect project were started during the fiscal year. Sewer The Sewer Division operates the Pollution Abatement Facility plant which treats an average flow of two million gallons per day. Along with the plant, they also maintain approximately 36 miles of pipe and 9 pump stations. Starting in fiscal year 2019, the Sewer division was moved from the City’s General Fund to its own Enterprise Fund, which will allow for necessary future capital improvements. Risk Management The City has a limited risk management program for its general liability auto insurance. As part of this comprehensive plan, resources are being accumulated in a separate insurance reserve fund to meet potential losses of $1,000 per injury/auto and $5,000 per property damage and general liability claims. All third-party coverage is currently maintained for claims greater than the aforementioned limits and other potential losses. However, future plans may include the assumption of additional risk by the City. The City’s insured benefit program uses an alternative funding arrangement, known as a self-funded (ASO-Administrative Services Only) program with individual stop-loss provisions. Full-time employees of the City not covered under any collective bargaining agreement are also eligible for the group insurance program. The cost of the medical program is contributory for some full-time employees and their dependents who must contribute between 9% and 15%; however, certain employees electing dental coverage must contribute between 15% and 20% of the cost for the dental plan. The individual stop-loss coverage protects the City from claims in excess of $100,000 for hospitalization and in excess of $100,000 for major medical, per eligible employee and each eligible dependent. Acknowledgements. The preparation of this report would not have been possible without the efficient and dedicated services of the entire staff of the Finance Department. Each member has my sincere appreciation for their contributions made in the preparation of this report. The cooperation and assistance of the accounting firm of RSM US LLP, also contributed significantly to its production. Respectfully submitted, Ronald Yuhas, Jr. Finance Director

v
vi
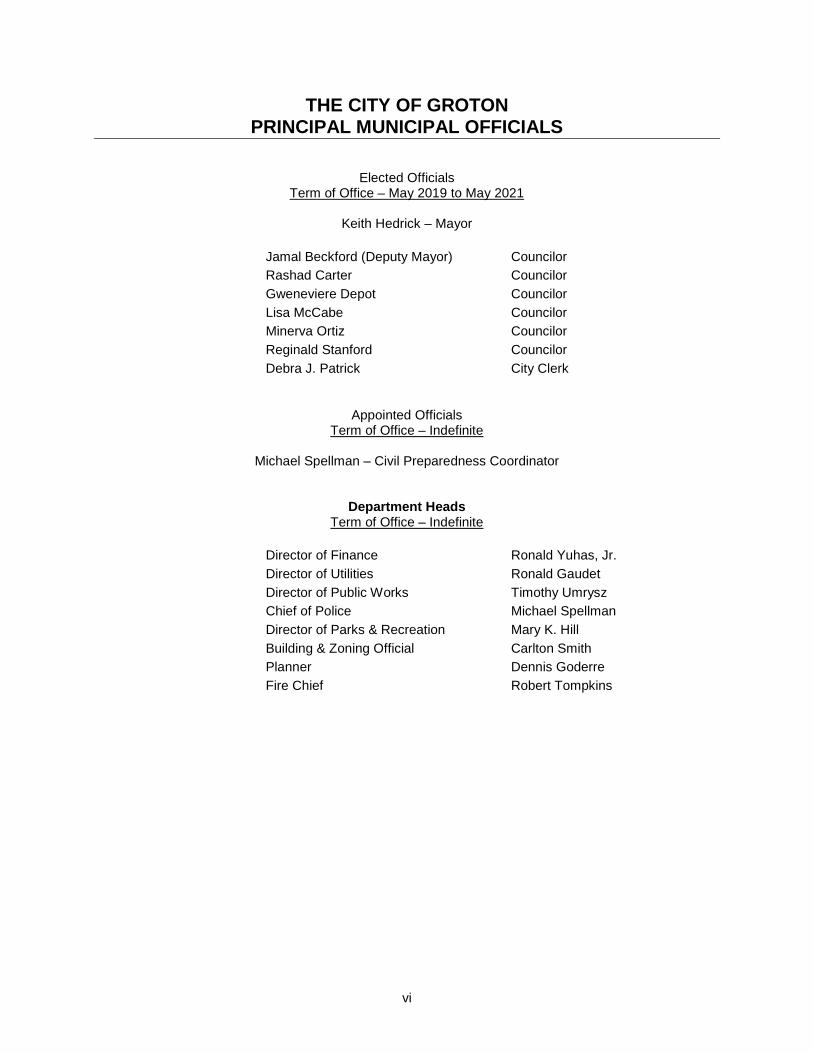
THE CITY OF GROTON PRINCIPAL MUNICIPAL OFFICIALS
Elected Officials Term of Office – May 2019 to May 2021
Keith Hedrick – Mayor
Jamal Beckford (Deputy Mayor) Councilor Rashad Carter Councilor Gweneviere Depot Councilor Lisa McCabe Councilor Minerva Ortiz
Reginald Stanford Councilor Councilor
Debra J. Patrick City Clerk
Appointed Officials Term of Office – Indefinite
Michael Spellman – Civil Preparedness Coordinator
Department Heads Term of Office – Indefinite
Director of Finance Ronald Yuhas, Jr. Director of Utilities Ronald Gaudet Director of Public Works Timothy Umrysz Chief of Police Michael Spellman Director of Parks & Recreation Mary K. Hill Building & Zoning Official Carlton Smith Planner Dennis Goderre Fire Chief Robert Tompkins

Financial Section


1
Independent Auditor’s Report Honorable Mayor and Members of City Council City of Groton, Connecticut Report on the Financial Statements We have audited the accompanying financial statements of the governmental activities, the business type activities, the discretely presented component unit, each major fund and the aggregate remaining fund information of the City of Groton, Connecticut (the City), as of and for the fiscal year ended June 30, 2019, and the related notes to the financial statements, which collectively comprise the City’s basic financial statements as listed in the table of contents. Management’s Responsibility for the Financial Statements Management is responsible for the preparation and fair presentation of these financial statements in accordance with accounting principles generally accepted in the United States of America (GAAP); this includes the design, implementation, and maintenance of internal control relevant to the preparation and fair presentation of financial statements that are free from material misstatement, whether due to fraud or error. Auditor’s Responsibility Our responsibility is to express opinions on these financial statements based on our audit. We conducted our audit in accordance with auditing standards generally accepted in the United States of America (GAAS) and the standards applicable to financial audits contained in Government Auditing Standards, issued by the Comptroller General of the United States. Those standards require that we plan and perform the audit to obtain reasonable assurance about whether the financial statements are free from material misstatement. An audit involves performing procedures to obtain audit evidence about the amounts and disclosures in the financial statements. The procedures selected depend on the auditor’s judgment, including the assessment of the risks of material misstatement of the financial statements, whether due to fraud or error. In making those risk assessments, the auditor considers internal control relevant to the entity’s preparation and fair presentation of the financial statements in order to design audit procedures that are appropriate in the circumstances, but not for the purpose of expressing an opinion on the effectiveness of the entity’s internal control. Accordingly, we express no such opinion. An audit also includes evaluating the appropriateness of accounting policies used and the reasonableness of significant accounting estimates made by management, as well as evaluating the overall presentation of the financial statements. We believe that the audit evidence we have obtained is sufficient and appropriate to provide a basis for our audit opinions.

2
Opinions In our opinion, the financial statements referred to above present fairly, in all material respects, the respective financial position of the governmental activities, the business-type activities, the discretely presented component unit, each major fund, and the aggregate remaining fund information of the City as of June 30, 2019, and the respective changes in financial position and, where applicable, cash flows thereof for the year then ended in accordance with GAAP. Other Matters Required Supplementary Information GAAP requires that the management’s discussion and analysis, the pension and OPEB related schedules and budgetary comparison information as listed in the table of contents be presented to supplement the basic financial statements. Such information, although not a part of the basic financial statements, is required by the Governmental Accounting Standards Board who considers it to be an essential part of financial reporting for placing the basic financial statements in an appropriate operational, economic, or historical context. We have applied certain limited procedures to the required supplementary information in accordance with GAAS, which consisted of inquiries of management about the methods of preparing the information and comparing the information for consistency with management’s responses to our inquiries, the basic financial statements, and other knowledge we obtained during our audit of the basic financial statements. We do not express an opinion or provide any assurance on the information because the limited procedures do not provide us with sufficient evidence to express an opinion or provide any assurance. Supplementary and Other Information Our audit was conducted for the purpose of forming opinions on the financial statements that collectively comprise the City’s basic financial statements. The combining and individual fund financial statements and other schedules and the introductory and statistical sections are presented for purposes of additional analysis and are not a required part of the basic financial statements. The combining and individual fund financial statements and other schedules are the responsibility of management and were derived from and relate directly to the underlying accounting and other records used to prepare the basic financial statements. Such information has been subjected to the auditing procedures applied in the audit of the basic financial statements and certain additional procedures, including comparing and reconciling such information directly to the underlying accounting and other records used to prepare the basic financial statements or to the basic financial statements themselves, and other additional procedures in accordance with GAAS. In our opinion, the combining and individual fund financial statements and other schedules are fairly stated, in all material respects, in relation to the basic financial statements as a whole. The introductory and statistical sections, as listed in the table of contents, have not been subjected to the auditing procedures applied in the audit of the basic financial statements, and accordingly, we do not express an opinion or provide any assurance on them.

3
Prior-Year Comparative information We also previously audited, in accordance with GAAS, the basic financial statements of the City as of and for the year ended June 30, 2018 (not presented herein), and have issued our report thereon dated February 27, 2019, which contained unmodified opinions on the respective financial statements of governmental activities, business-type activities, the discretely presented component unit, each major fund and the aggregate remaining fund information. The accompanying General Fund Balance Sheet and Statements of Net Position, Statements of Revenues, Expenses and Changes in Net Position and Statements of Cash Flows for the Electric and Water Departments and Internal Service Funds as of and for the year ended June 30, 2018 (the “2018 Statements”) are presented for purposes of additional analysis and are not a required part of the basic financial statements. Such information is the responsibility of management and was derived from and relates directly to the underlying accounting and other records used to prepare the 2018 financial statements. The 2018 Statements have been subjected to the auditing procedures applied in the audit of the 2018 basic financial statements and certain additional procedures, including comparing and reconciling such information directly to the underlying accounting and other records used to prepare those financial statements or to those financial statements themselves, and other additional procedures in accordance with GAAS. In our opinion, 2018 Statements are fairly stated in all material respects in relation to the basic financial statements as a whole for the year ended June 30, 2018. Other Reporting Required by Government Auditing Standards In accordance with Government Auditing Standards, we have also issued our report dated February 27, 2020 on our consideration of the City’s internal control over financial reporting and on our tests of its compliance with certain provisions of laws, regulations, contracts, and grant agreements and other matters. The purpose of that report is solely to describe the scope of our testing of internal control over financial reporting and compliance and the results of that testing, and not to provide an opinion on the effectiveness of the City’s internal control over financial reporting or on compliance. That report is an integral part of an audit performed in accordance with Government Auditing Standards in considering the City’s internal control over financial reporting and compliance.
New Haven, Connecticut February 27, 2020

4
This page intentionally left blank.

5
CITY OF GROTON 295 Meridian Street
Groton, Connecticut 06340-4040
Department of Finance Telephone (860) 446-4110
Fax (860) 446-4113
MANAGEMENT DISCUSSION AND ANALYSIS – Unaudited FOR THE YEAR ENDED JUNE 30, 2019
As management of the City of Groton, Connecticut (City), we offer readers of the City’s financial statements this narrative overview and analysis of the financial activities of the City for the year ended June 30, 2019. We encourage readers to consider the information presented here in conjunction with additional information that we have furnished in our letter of transmittal. Financial Highlights
• The assets and deferred outflows of resources of the City exceeded its liabilities and deferred inflows of resources at the close of the most recent fiscal year by $87,682,420 (net position). Of this amount, $13,622,036 (unrestricted net position) may be used to meet the City’s ongoing obligations to citizens and creditors.
• On the government-wide basis, the City’s total net position increased by $12,591,482 for the fiscal year, with a slight decrease in the government activities and an increase in the business-type activities.
• As of the close of the current fiscal year, the City’s governmental funds reported combined ending fund balances of $12,097,249 an increase of $1,206,989 in comparison with the prior year. $5,611,133 of the total amount of $12,097,249 is available for spending at the City’s discretion (unassigned fund balance).
• At the end of the current fiscal year, unassigned fund balance for the General Fund was $5,634,786 or 36.8% of total General Fund expenditures and other financing uses.
• The City’s total long-term obligations increased by $10,026,253 during the current fiscal year due to proceeds of the Drinking Water State Revolving Fund (DWSRF) loan from the State of Connecticut for the Water Treatment Plant Upgrade.

6
Overview of the Financial Statement This discussion and analysis are intended to serve as an introduction to the City’s basic financial statements. The City’s basic financial statements comprise three components: 1) government-wide financial statements, 2) fund financial statements, and 3) notes to the basic financial statements. This report also contains other supplementary information in addition to the basic financial statements themselves. Government-wide financial statements. The government-wide financial statements are designed to provide readers with a broad overview of the City’s finances, in a manner similar to a private-sector business. The statement of net position presents information on all of the City’s assets, deferred outflows of resources, liabilities and deferred inflows of resources with the difference between assets plus deferred outflows of resources and liabilities plus deferred inflows of resources reported as net position. Over time, increases or decreases in net position may serve as a useful indicator of whether the financial position of the City is improving or deteriorating. The statement of activities presents information showing how the City’s net position changed during the most recent fiscal year. All changes in net position are reported as soon as the underlying event giving rise to the change occurs, regardless of the timing of related cash flows. Thus, revenues and expenses are reported in this statement for some items that will only result in cash flows in future fiscal periods (e.g., uncollected taxes and earned but unused vacation leave). Both of the government-wide financial statements distinguish functions of the City that are principally supported by taxes and intergovernmental revenues (governmental activities) from other functions that are intended to recover all or a significant portion of their costs through user fees and charges (business-type activities). The governmental activities of the City include general government, public safety, highways and streets, sanitation, sewer operation and recreation. The business-type activities of the City include electric, water and sewer operations. The government-wide financial statements not only include the City itself, but also a legally separate component unit, Bozrah Light and Power Company. Financial information for this component unit is reported separately from the financial information presented for the primary government itself. Fund financial statements. A fund is a grouping of related accounts that is used to maintain control over resources that have been segregated for specific activities or objectives. The City uses fund accounting to ensure and demonstrate compliance with finance-related legal requirements. All of the funds of the City can be divided into three categories: governmental funds, proprietary funds, and fiduciary funds. Governmental funds. Governmental funds are used to account for essentially the same functions reported as governmental activities in the government-wide financial statements. However, unlike the government-wide financial statements, governmental fund financial statements focus on near-term inflows and outflows of spendable resources, as well as on balances of spendable resources available at the end of the fiscal year. Such information may be useful in evaluating a City’s near-term financing requirements. Because the focus of governmental funds is narrower than that of the government-wide financial statements, it is useful to compare the information presented for governmental funds with similar information presented for governmental activities in the government-wide financial statements. By doing so, readers may better understand the long-term impact of the City’s near-term financing decisions. Both the governmental fund balance sheet and the governmental fund statement of revenues, expenditures and changes in fund balances provide a reconciliation to facilitate this comparison between governmental funds and governmental activities.

7
The City maintains seven individual governmental funds. Information is presented separately in the governmental fund balance sheet and in the governmental fund statement of revenues, expenditures and changes in fund balances for the General Fund, which is considered to be a major fund. Data from the other six governmental funds are combined into a single, aggregated presentation. Individual fund data for each of these non-major governmental funds is provided in the form of combining statements elsewhere in this report. Major Governmental Funds Non-major Governmental Funds General Fund
State Aid Road Bridge Street Forfeiture Grant
Miscellaneous Grants Equipment Replacement Fund
Submarine Memorial Fund
The City adopts an annual budget for its General Fund. A budgetary comparison statement has been provided in the required supplementary information section for the General Fund to demonstrate compliance with this budget. The basic governmental fund financial statements can be found on Page 15 through Page 17 of this report. Proprietary funds. The City operates two different types of proprietary funds. Enterprise funds are used to report the same functions presented as business-type activities in the government-wide financial statements. The City uses enterprise funds to account for its Electric, Water and Sewer operations. Internal service funds are an accounting device used to accumulate and allocate costs internally among the City’s various functions. The City uses internal service funds to account for its self-insured medical benefits and property and general liability claims. These services benefit both governmental and business-type activities and therefore the operations have been recorded in proportion in the respective financial statements. Proprietary funds provide the same type of information as the government-wide financial statements, only in more detail. The proprietary fund financial statements provide separate information for the Electric Department and for the Water Department, both of which are considered to be major funds of the City. The Sewer Department is considered and included in other non-major enterprise funds. Conversely, both internal service funds are combined into a single, aggregated presentation in the proprietary fund financial statements. Individual fund data for the internal service funds is provided in the form of combining statements elsewhere in this report. The basic proprietary fund financial statements can be found on Page 18 through Page 22 of this report. Fiduciary funds. Fiduciary funds are used to account for resources held for the benefit of parties outside the government. Fiduciary funds are not reflected in the government-wide financial statement because the resources of those funds are not available to support the City’s own programs. The accounting used for fiduciary funds is much like that used for proprietary funds. The basic fiduciary fund financial statements can be found on Page 23 and Page 24 of this report. Notes to the basic financial statements. The notes provide additional information that is essential to a full understanding of the data provided in the government-wide and fund financial statements. The notes to the basic financial statements can be found on Page 25 to Page 64 of this report.
8
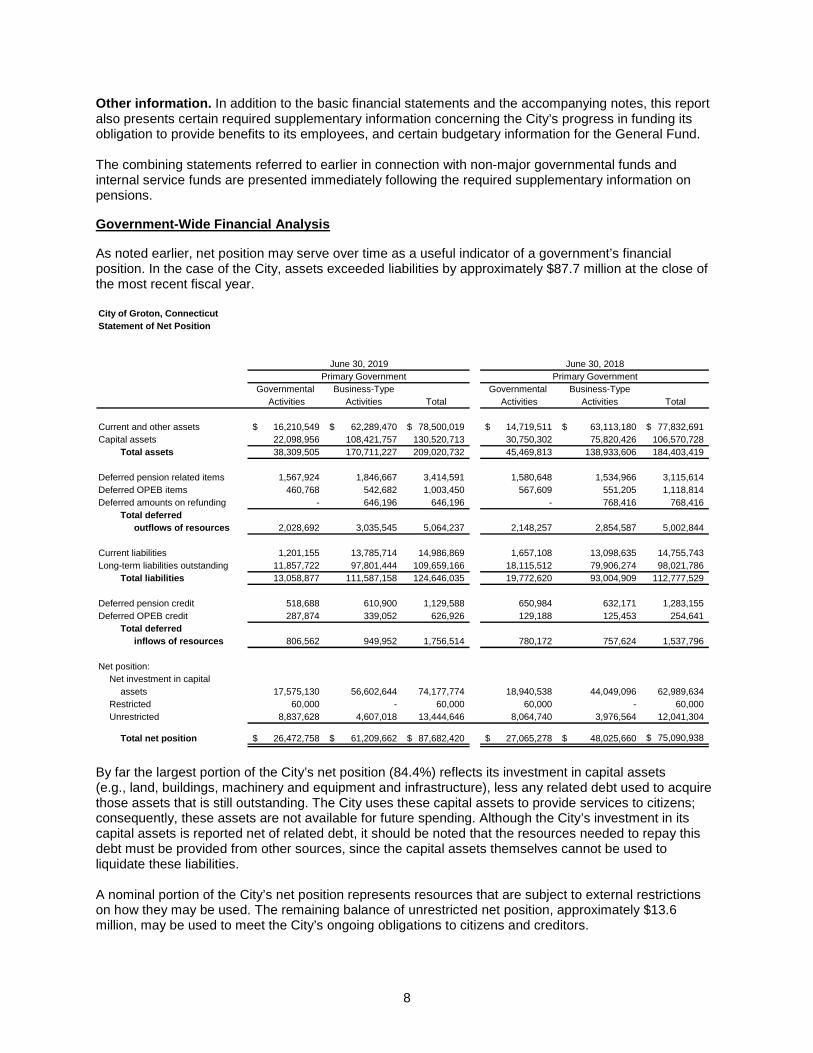
Other information. In addition to the basic financial statements and the accompanying notes, this report also presents certain required supplementary information concerning the City’s progress in funding its obligation to provide benefits to its employees, and certain budgetary information for the General Fund. The combining statements referred to earlier in connection with non-major governmental funds and internal service funds are presented immediately following the required supplementary information on pensions. Government-Wide Financial Analysis As noted earlier, net position may serve over time as a useful indicator of a government’s financial position. In the case of the City, assets exceeded liabilities by approximately $87.7 million at the close of the most recent fiscal year. City of Groton, ConnecticutStatement of Net Position
Primary GovernmentGovernmental Business-Type Governmental Business-Type
Activities Activities Total Activities Activities Total
Current and other assets 16,210,549$ 62,289,470$ 78,500,019$ 14,719,511$ 63,113,180$ 77,832,691$ Capital assets 22,098,956 108,421,757 130,520,713 30,750,302 75,820,426 106,570,728
Total assets 38,309,505 170,711,227 209,020,732 45,469,813 138,933,606 184,403,419
Deferred pension related items 1,567,924 1,846,667 3,414,591 1,580,648 1,534,966 3,115,614 Deferred OPEB items 460,768 542,682 1,003,450 567,609 551,205 1,118,814 Deferred amounts on refunding - 646,196 646,196 - 768,416 768,416
Total deferred outflows of resources 2,028,692 3,035,545 5,064,237 2,148,257 2,854,587 5,002,844
Current liabilities 1,201,155 13,785,714 14,986,869 1,657,108 13,098,635 14,755,743 Long-term liabilities outstanding 11,857,722 97,801,444 109,659,166 18,115,512 79,906,274 98,021,786
Total liabilities 13,058,877 111,587,158 124,646,035 19,772,620 93,004,909 112,777,529
Deferred pension credit 518,688 610,900 1,129,588 650,984 632,171 1,283,155 Deferred OPEB credit 287,874 339,052 626,926 129,188 125,453 254,641
Total deferred inflows of resources 806,562 949,952 1,756,514 780,172 757,624 1,537,796
Net position:Net investment in capital
assets 17,575,130 56,602,644 74,177,774 18,940,538 44,049,096 62,989,634 Restricted 60,000 - 60,000 60,000 - 60,000 Unrestricted 8,837,628 4,607,018 13,444,646 8,064,740 3,976,564 12,041,304
Total net position 26,472,758$ 61,209,662$ 87,682,420$ 27,065,278$ 48,025,660$ 75,090,938$
June 30, 2018Primary Government
June 30, 2019
By far the largest portion of the City’s net position (84.4%) reflects its investment in capital assets (e.g., land, buildings, machinery and equipment and infrastructure), less any related debt used to acquire those assets that is still outstanding. The City uses these capital assets to provide services to citizens; consequently, these assets are not available for future spending. Although the City’s investment in its capital assets is reported net of related debt, it should be noted that the resources needed to repay this debt must be provided from other sources, since the capital assets themselves cannot be used to liquidate these liabilities. A nominal portion of the City’s net position represents resources that are subject to external restrictions on how they may be used. The remaining balance of unrestricted net position, approximately $13.6 million, may be used to meet the City’s ongoing obligations to citizens and creditors.
9
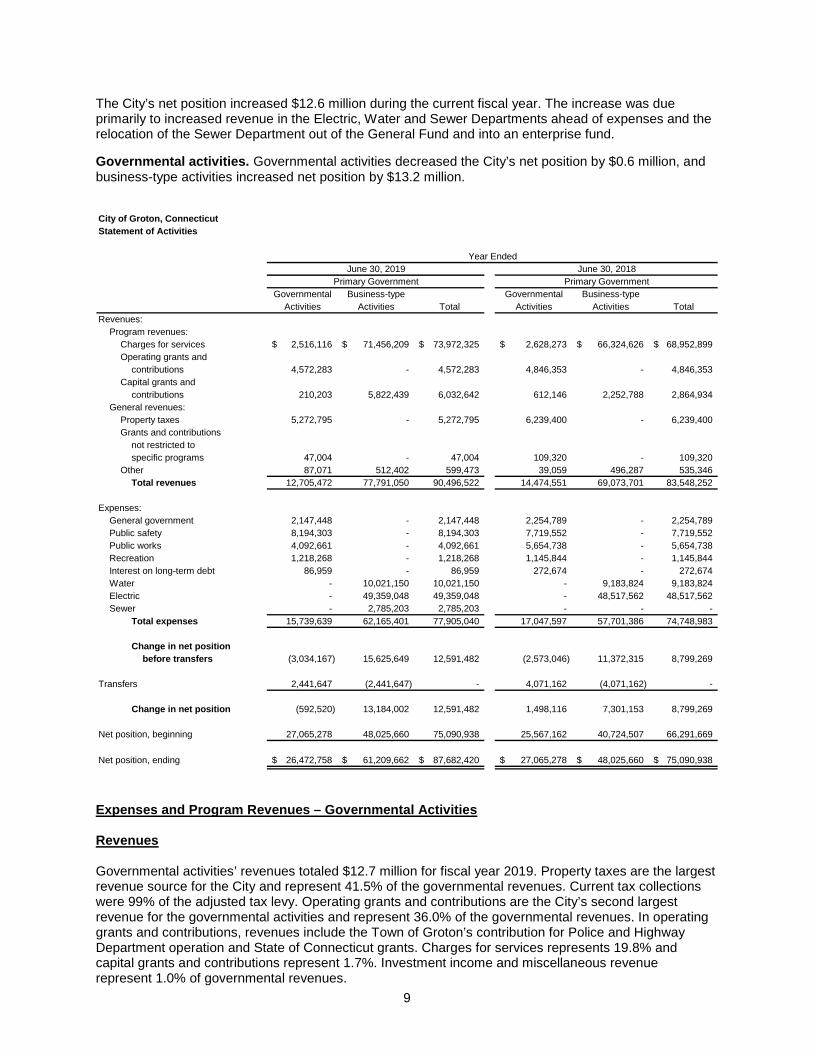
The City’s net position increased $12.6 million during the current fiscal year. The increase was due primarily to increased revenue in the Electric, Water and Sewer Departments ahead of expenses and the relocation of the Sewer Department out of the General Fund and into an enterprise fund. Governmental activities. Governmental activities decreased the City’s net position by $0.6 million, and business-type activities increased net position by $13.2 million. City of Groton, ConnecticutStatement of Activities
Governmental Business-type Governmental Business-typeActivities Activities Total Activities Activities Total
Revenues:Program revenues:
Charges for services 2,516,116$ 71,456,209$ 73,972,325$ 2,628,273$ 66,324,626$ 68,952,899$ Operating grants and
contributions 4,572,283 - 4,572,283 4,846,353 - 4,846,353 Capital grants and
contributions 210,203 5,822,439 6,032,642 612,146 2,252,788 2,864,934 General revenues:
Property taxes 5,272,795 - 5,272,795 6,239,400 - 6,239,400 Grants and contributions
not restricted tospecific programs 47,004 - 47,004 109,320 - 109,320
Other 87,071 512,402 599,473 39,059 496,287 535,346 Total revenues 12,705,472 77,791,050 90,496,522 14,474,551 69,073,701 83,548,252
Expenses:General government 2,147,448 - 2,147,448 2,254,789 - 2,254,789 Public safety 8,194,303 - 8,194,303 7,719,552 - 7,719,552 Public works 4,092,661 - 4,092,661 5,654,738 - 5,654,738 Recreation 1,218,268 - 1,218,268 1,145,844 - 1,145,844 Interest on long-term debt 86,959 - 86,959 272,674 - 272,674 Water - 10,021,150 10,021,150 - 9,183,824 9,183,824 Electric - 49,359,048 49,359,048 - 48,517,562 48,517,562 Sewer - 2,785,203 2,785,203 - - -
Total expenses 15,739,639 62,165,401 77,905,040 17,047,597 57,701,386 74,748,983
Change in net position before transfers (3,034,167) 15,625,649 12,591,482 (2,573,046) 11,372,315 8,799,269
Transfers 2,441,647 (2,441,647) - 4,071,162 (4,071,162) -
Change in net position (592,520) 13,184,002 12,591,482 1,498,116 7,301,153 8,799,269
Net position, beginning 27,065,278 48,025,660 75,090,938 25,567,162 40,724,507 66,291,669
Net position, ending 26,472,758$ 61,209,662$ 87,682,420$ 27,065,278$ 48,025,660$ 75,090,938$
Year EndedJune 30, 2019 June 30, 2018
Primary Government Primary Government
Expenses and Program Revenues – Governmental Activities Revenues Governmental activities’ revenues totaled $12.7 million for fiscal year 2019. Property taxes are the largest revenue source for the City and represent 41.5% of the governmental revenues. Current tax collections were 99% of the adjusted tax levy. Operating grants and contributions are the City’s second largest revenue for the governmental activities and represent 36.0% of the governmental revenues. In operating grants and contributions, revenues include the Town of Groton’s contribution for Police and Highway Department operation and State of Connecticut grants. Charges for services represents 19.8% and capital grants and contributions represent 1.7%. Investment income and miscellaneous revenue represent 1.0% of governmental revenues.

10
Capital grants and contributions decreased by $401,943 due to less capital improvement grants being expended in the current year. Charges for services decreased $112,157 due to a decrease in fines, fees and permits. Property taxes decreased by $966,605 due to relocation of the Sewer Department from the General Fund to an Enterprise Fund. Expenses Governmental expenses totaled $15,739,639 for the fiscal year. Of the expenditures, 52.1% or $8,194,303 is related to public safety. Public works expenses amounted to $4,092,661, or 26.0%. Recreation expenses amounted to $1,218,268 or 7.7%. Interest expense was $86,959 or 0.6%. General government expenses were $2,147,448 or 13.6%. Public safety and recreation have slightly increased while, general government, and public works expenses decreased from the previous year due to the relocation of the Sewer Department. Business-type activities. Business-type activities represent 69.8% of the City’s net position and account for a large portion of the expenditures in the City. Key elements of the activity are as follows: • Charges for services and other for business-type activities increased by $8,717,349 while expenses
increased by $4,464,015 over the prior year. Financial Analysis of the City’s Funds As noted earlier, the City uses fund accounting to ensure and demonstrate compliance with finance-related legal requirements. Governmental funds. The focus of the City’s governmental funds is to provide information on near-term inflows, outflows, and balances of expendable resources. Such information is useful in assessing the City’s financing requirements. In particular, unreserved fund balance may serve as a useful measure of a government’s net resources available for spending at the end of the fiscal year. As of the end of the current fiscal year, the City’s governmental funds reported combined ending fund balances of $12,097,249, an increase of $1,206,989 in comparison with the prior year. Approximately 46.4% of this total amount, $5,611,133 constitutes unassigned fund balance, which is available for spending at the City’s discretion. The General Fund is the operating fund of the City. At the end of the current fiscal year, unassigned fund balance of the General Fund was $5,634,786, while total fund balance was $6,674,075. As a measure of the General Fund’s liquidity, it may be useful to compare both unassigned fund balance and total fund balance to total fund expenditures. Unassigned fund balance represents 36.8% of total General Fund expenditures. Total fund balance represents 43.6% of total General Fund expenditures. The fund balance of the City’s General Fund increased by $1,000,293 during the current fiscal year due to revenues being slightly better than expenses. Proprietary funds. The City’s proprietary funds provide the same type of information found in the government-wide financial statements, but in more detail. The unrestricted net position of the Electric operation at the end of the year amounted to $(907,508), the unrestricted net position of the Water operation amounted to $3,295,229 and the unrestricted net position of the Sewer operation amounted to $1,902,036. The increase in net position for the Electric Fund was $2,826,598, the increase in net position for the Water Fund was $6,699,311 and the increase in net position for the Sewer Fund was $3,163,442 respectively. Other factors concerning the finances of these three funds have already been addressed in the discussion of the City’s business-type activities.

11
General Fund Budgetary Highlights During the year, total expenditures were less than budgetary estimates and total revenues were more than budgetary estimates. The City did not have use a portion of their fund balance as planned. Capital Asset and Debt Administration Capital assets. The City’s investment in capital assets for its governmental and business type activities as of June 30, 2019, amounts to approximately $130.5 million (net of accumulated depreciation). This investment in capital assets includes land, land improvements, buildings and improvements, distribution systems, machinery and equipment, park facilities, sewer lines and roads. The total increase in the City’s investment in capital assets for the current fiscal year was 22.5% (28.1% decrease for governmental activities and an increase of 43.0% for business-type activities). Major capital asset events during the current fiscal year included the following:
• The relocation of the Sewer Department capital assets from the Governmental Activities to the Business-type Activities
• Construction began on various governmental, electric and water projects; construction in progress as of the close of the fiscal year had reached $40,413,209.
City of Groton, ConnecticutCapital Assets (Net of Depreciation)
Governmental Business-type Governmental Business-typeActivities Activities Total Activities Activities Total
Land and land rights 3,156,803 $ 3,472,941 $ 6,629,744 $ 3,789,257 $ 2,840,487 $ 6,629,744 $ Construction in progress 772,061 40,413,290 41,185,351 1,354,288 16,742,028 18,096,316 Land improvements 910,880 - 910,880 1,075,226 - 1,075,226 Buildings and
improvements 4,529,421 10,224,441 14,753,862 10,850,981 3,532,411 14,383,392 Distribution systems - 51,753,305 51,753,305 - 50,424,181 50,424,181 Machinery and equipment 201,933 1,648,439 1,850,372 529,241 1,529,240 2,058,481 Vehicles 2,188,317 909,341 3,097,658 2,513,987 752,079 3,266,066 Infrastructure 10,339,541 - 10,339,541 10,637,322 - 10,637,322
Total 22,098,956 $ 108,421,757 $ 130,520,713 $ 30,750,302 $ 75,820,426 $ 106,570,728 $
June 30, 2019 June 30, 2018Primary Government Primary Government
Additional information on the City’s capital assets can be found in Note 6.

12
Long-term debt. At the end of the current fiscal year, the City had total net bonded debt and note payable outstanding of $76,055,813. Of this amount, $2,905,000 comprises debt backed by the full faith and credit of the City and $73,150,813 is Electric, Water and Sewer debt for which the City is liable in the event of default by the Electric, Water and Sewer Departments. City of Groton, ConnecticutChanges in Bonded Debt and Note Payable During Fiscal 2019
Bonds andNotes Payable
Outstanding at June 30, 2018 66,029,560 $ Debt issued 15,066,653 Bond principal payments (5,040,400)
Outstanding at June 30, 2019 76,055,813 $ The City’s total bonded debt increased by $10,026,253 (15.2%) during the current fiscal year. The City maintains an “Aa-3” from Moody’s for general obligation debt. State statutes limit the amount of general obligation debt a governmental entity may issue to 7 times total tax collections including interest and lien fees and the tax relief for elderly freeze grant from the prior year. The current debt limitation for the City is $43,894,760. Additional information on the City’s long-term debt can be found in Note 7. Economic Factors and Next Year’s Budgets and Rates
• The unemployment rate for the City is currently 3.6%. This compares favorably to the state’s average unemployment rate of 3.8% and the national average rate of 3.7%.
• Inflationary trends in the region compare favorably to national indices.
All of these factors were considered in preparing the City’s budget for the 2019 fiscal year. During the current fiscal year, fund balance in the General Fund increased by $1,000,293. The City has appropriated $800,000 of the 2019 fiscal year fund balance for spending in the 2020 fiscal year budget. It is intended that this use of available fund balance will avoid the need to additionally raise taxes or charges during the 2020 fiscal year. Requests for Information This financial report is designed to provide a general overview of the City’s finances for all those with an interest in the government’s finances. Questions concerning any of the information provided in this report or requests for additional financial information should be addressed to the Finance Director, Ronald Yuhas, Jr., City of Groton, 295 Meridian Street, Groton, CT 06340.

Basic Financial Statements


13
City of Groton, Connecticut
Statement of Net PositionJune 30, 2019
Component UnitBozrah
Governmental Business-Type Light andActivities Activities Total Power Company
Assets
Cash and cash equivalents 14,972,072 $ 30,700,046 $ 45,672,118 $ 1,725,617 $ Investments 543,175 - 543,175 - Receivables, net of allowances for
collection losses:Property taxes 40,360 - 40,360 - Use charges - 4,955,481 4,955,481 1,199,117 Accrued utility revenue - 1,166,954 1,166,954 - Intergovernmental and other 531,688 63,257 594,945 13,441
Inventory and prepayments 25,926 1,814,575 1,840,501 5,720 Internal balances 37,328 (37,328) - - Due from component units - 3,628,749 3,628,749 - Amount held at Connecticut Municipal Electric Energy Cooperative - 14,033,178 14,033,178 1,849,556 Restricted cash 60,000 - 60,000 181,842 Other noncurrent assets - - - - Equity investment in component unit - 5,957,317 5,957,317 - Net Other Post-Employment Benefit asset - 7,241 7,241 - Capital assets, not being depreciated 3,928,864 43,886,231 47,815,095 521,439 Capital assets, net of accumulated
depreciation 18,170,092 64,535,526 82,705,618 10,409,689 Total assets 38,309,505 170,711,227 209,020,732 15,906,421
Deferred outflows of resources:Deferred pension amounts 1,567,924 1,846,667 3,414,591 - Deferred OPEB amounts 460,768 542,682 1,003,450 83,112 Deferred charge on refunding - 646,196 646,196 -
Total deferred outflows ofresources 2,028,692 3,035,545 5,064,237 83,112
Liabilities
Accounts payable and accrued liabilities 765,219 12,887,482 13,652,701 757,011 Accrued interest payable 40,911 898,232 939,143 - Unearned revenue - performance 395,025 - 395,025 - Noncurrent liabilities:Due to primary government - - - 3,628,749
Rate stabilization - 12,874,668 12,874,668 1,938,024 Due within one year 516,146 4,705,400 5,221,546 264,400 Due in more than one year 11,341,576 80,221,376 91,562,952 3,441,060
Total liabilities 13,058,877 111,587,158 124,646,035 10,029,244
Deferred inflows of resources:Deferred pension amounts 518,688 610,900 1,129,588 - Deferred OPEB amounts 287,874 339,052 626,926 2,972
Total deferred inflows ofresources 806,562 949,952 1,756,514 2,972
Net position:Net investment in capital assets 17,575,130 56,602,644 74,177,774 7,347,561 Restricted for:
Endowments - expendable 60,000 - 60,000 - Unrestricted 8,837,628 4,607,018 13,444,646 (1,390,244)
Total net position 26,472,758 $ 61,209,662 $ 87,682,420 $ 5,957,317 $
See notes to financial statements.
Primary Government

14
City of Groton, Connecticut
Statement of ActivitiesFor the Year Ended June 30, 2019
Component UnitBozrah
Operating Capital Light andCharges for Grants and Grants and Governmental Business-type Power
Functions/Programs Expenses Services Contributions Contributions Activities Activities Total CompanyPrimary government:
Governmental activities:General government (2,147,448) $ 1,646,366 $ 37,707 $ -$ (463,375) $ -$ (463,375) $ -$ Public safety (8,194,303) 619,377 2,483,713 - (5,091,213) - (5,091,213) - Public works (4,092,661) 17,592 2,050,863 210,203 (1,814,003) - (1,814,003) - Parks and recreation (1,218,268) 232,781 - - (985,487) - (985,487) - Interest expense (86,959) - - - (86,959) - (86,959) -
Total governmental activities (15,739,639) 2,516,116 4,572,283 210,203 (8,441,037) - (8,441,037) -
Business-type activities:Electric department (49,359,048) 56,303,526 - - - 6,944,478 6,944,478 - Water department (10,021,150) 10,838,056 - 5,822,439 - 6,639,345 6,639,345 - Sewer department (2,785,203) 4,314,627 - - - 1,529,424 1,529,424
Total business-type activities (62,165,401) 71,456,209 - 5,822,439 - 15,113,247 15,113,247 -
Total primary government (77,905,040) $ 73,972,325 $ 4,572,283 $ 6,032,642 $ (8,441,037) 15,113,247 6,672,210 -
Component unit:Bozrah Light and Power
Company (20,546,212) $ 20,517,046 $ -$ -$ - - - (29,166) Total component
unit (20,546,212) $ 20,517,046 $ -$ -$ - - - (29,166)
General revenues:Property taxes 5,272,795 - 5,272,795 - Grants and contributions not restricted to specific programs 47,004 - 47,004 - Investment income 87,071 512,402 599,473 -
Transfers 2,441,647 (2,441,647) - - Total general revenues and transfers 7,848,517 (1,929,245) 5,919,272 -
Change in net position (592,520) 13,184,002 12,591,482 (29,166)
Net position - beginning 27,065,278 48,025,660 75,090,938 5,986,483
Net position - ending 26,472,758 $ 61,209,662 $ 87,682,420 $ 5,957,317 $
See notes to financial statements.
Program Revenues Primary GovernmentNet (Expense) Revenue and Changes in Net Position

15
City of Groton, Connecticut
Balance Sheet - Governmental FundsJune 30, 2019
Non-MajorMajor Fund Funds Total
General Governmental GovernmentalFund Funds Funds
Assets
Cash and cash equivalents 10,957,968 $ 1,339,121 $ 12,297,089 $ Receivables:
Property taxes, net 40,360 - 40,360 Intergovernmental and other 5,446 164,635 170,081
Investments - 543,175 543,175 Due from other funds 8,384 4,040,025 4,048,409 Inventory of supplies, at cost 25,926 - 25,926
Total assets 11,038,084 $ 6,086,956 $ 17,125,040 $
Liabilities
Accounts payable and accrued liabilities 317,651 $ 178,617 $ 496,268 $ Due to other funds 4,015,751 90,140 4,105,891 Unearned revenue - 395,025 395,025
Total liabilities 4,333,402 663,782 4,997,184
Deferred inflows of resources:Unavailable revenue 30,607 - 30,607
Fund balances:Nonspendable 25,926 - 25,926 Restricted - 1,005,502 1,005,502 Committed 213,363 4,441,325 4,654,688 Assigned 800,000 - 800,000 Unassigned 5,634,786 (23,653) 5,611,133
Total fund balances 6,674,075 5,423,174 12,097,249
Total liabilities, deferred inflowsof resources and fund balances 11,038,084 $ 6,086,956 $
Amounts reported for governmental activities in the statement ofnet position are different because:
Capital assets purchased by governmental funds are reported as expenditures, however, the Statement of Net Position includes thosecapital assets among the assets of the City as a whole. 22,098,956
Deferred outflows of resources-pension/opeb related items 2,028,692 Deferred inflows of resources-pension/opeb related items (806,562) Other long-term assets are not available to pay for current-period
expenditures and, therefore, are reported as unavailable in the funds. 30,607 Internal service funds are used by management to charge the costs of
health insurance. Certain assets and liabilities of the internalservice funds are included in governmental activities in thestatement of net position. 2,922,449
Long-term liabilities, including bonds payable, are not due and payablein the current period and therefore are not reported in the funds. (11,857,722)
Accrued interest payable not recorded in funds. (40,911)
Net position of governmental activities 26,472,758 $
See notes to financial statements.

16
City of Groton, Connecticut
Statement of Revenues, Expenditures and Changes in Fund Balances -Governmental FundsFor the Year Ended June 30, 2019
Major FundNon-Major Total
General Governmental GovernmentalFund Funds Funds
Revenues:Property taxes 5,290,265 $ -$ 5,290,265 $ Intergovernmental 4,650,138 179,352 4,829,490 Charges for services 2,005,992 - 2,005,992 Income from investments 39,084 47,987 87,071 Other 234,200 275,924 510,124
Total revenues 12,219,679 503,263 12,722,942
Expenditures:Current:
General government 1,499,487 23,939 1,523,426 Public safety 7,891,251 11,698 7,902,949 Public works 2,854,175 - 2,854,175 Parks and recreation 1,165,922 - 1,165,922 Non-departmental 84,357 - 84,357 Capital outlay 686,305 321,325 1,007,630
Debt service:Bond principal 265,000 - 265,000 Bond and note interest 118,706 - 118,706
Total expenditures 14,565,203 356,962 14,922,165
Excess (deficiency) of revenuesover expenditures (2,345,524) 146,301 (2,199,223)
Other financing sources:Transfers in 4,086,140 740,323 4,826,463 Transfers out (740,323) (679,928) (1,420,251)
Total other financing sources 3,345,817 60,395 3,406,212
Net change in fund balances 1,000,293 206,696 1,206,989
Fund balances, beginning 5,673,782 5,216,478 10,890,260
Fund balances, ending 6,674,075 $ 5,423,174 $ 12,097,249 $
See notes to financial statements.
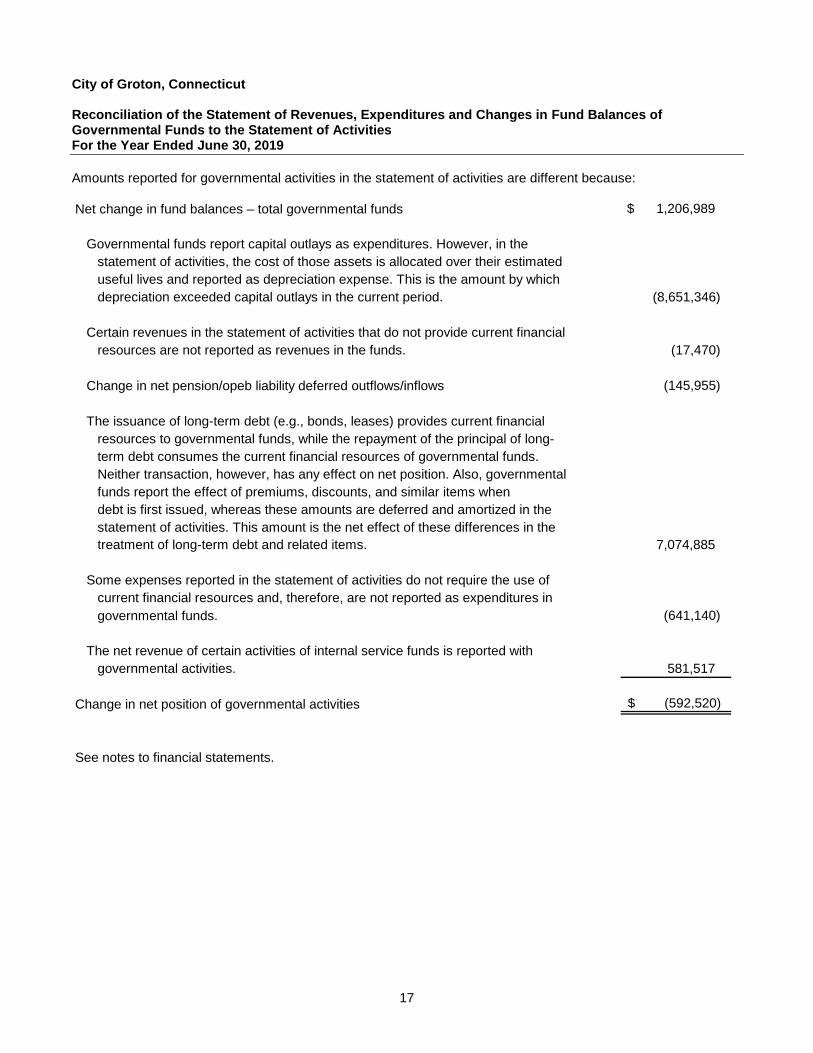
City of Groton, Connecticut Reconciliation of the Statement of Revenues, Expenditures and Changes in Fund Balances of Governmental Funds to the Statement of Activities For the Year Ended June 30, 2019
17
Amounts reported for governmental activities in the statement of activities are different because: Net change in fund balances – total governmental funds $ 1,206,989
Governmental funds report capital outlays as expenditures. However, in the statement of activities, the cost of those assets is allocated over their estimateduseful lives and reported as depreciation expense. This is the amount by whichdepreciation exceeded capital outlays in the current period. (8,651,346)
Certain revenues in the statement of activities that do not provide current financial resources are not reported as revenues in the funds. (17,470)
Change in net pension/opeb liability deferred outflows/inflows (145,955)
The issuance of long-term debt (e.g., bonds, leases) provides current financialresources to governmental funds, while the repayment of the principal of long-term debt consumes the current financial resources of governmental funds. Neither transaction, however, has any effect on net position. Also, governmentalfunds report the effect of premiums, discounts, and similar items when debt is first issued, whereas these amounts are deferred and amortized in the statement of activities. This amount is the net effect of these differences in the treatment of long-term debt and related items. 7,074,885
Some expenses reported in the statement of activities do not require the use ofcurrent financial resources and, therefore, are not reported as expenditures ingovernmental funds. (641,140)
The net revenue of certain activities of internal service funds is reported with governmental activities. 581,517
Change in net position of governmental activities (592,520) $
See notes to financial statements.

18
City of Groton, Connecticut
Statement of Net Position - Proprietary FundsJune 30, 2019
GovernmentalActivities
OtherElectric Water Nonmajor Internal
Department Department Enterprise Fund Total Service FundAssets
Current assets:Cash 19,016,098 $ 10,536,052 $ 669,453 $ 30,221,603 $ 3,213,426 $ Receivables:
Use charges (net of allowance for uncollectibles of $75,000 and $2,500, respectively) 3,873,938 771,360 310,183 4,955,481 424,864
Accrued utility revenue 1,166,954 - 1,166,954 - Due from other funds 920,045 3,568 1,052,694 1,976,307 94,810 Prepaid expenses 111,084 134,226 10,254 255,564 - Inventory 1,361,061 197,950 - 1,559,011 -
Total current assets 26,449,180 11,643,156 2,042,584 40,134,920 3,733,100
Noncurrent assets:Amount held at CMEEC 14,033,178 - - 14,033,178 - Equity in joint venture investments 5,957,317 - - 5,957,317 - Due from component units 3,628,749 - - 3,628,749 - Net OPEB asset - - 7,241 7,241 -
Total noncurrent assets 23,619,244 - 7,241 23,626,485 -
Capital assets (net of accumulated depreciation):Land and land rights 704,844 2,135,643 632,454 3,472,941 - Construction in progress 2,044,971 38,341,216 27,103 40,413,290 - Buildings and improvements 372,994 3,227,161 6,624,286 10,224,441 - Plant and pumping stations - 3,332,714 287,463 3,620,177 - Station equipment 8,158,723 - 8,158,723 - Electric distribution system 20,867,081 - 20,867,081 - Water distribution system - 19,107,324 19,107,324 - Machinery and equipment 1,068,743 560,442 19,254 1,648,439 - Vehicles 520,404 250,717 138,220 909,341 -
Total capital assets (net of accumulated depreciation) 33,737,760 66,955,217 7,728,780 108,421,757 -
Total noncurrent assets 57,357,004 66,955,217 7,736,021 132,048,242 -
Deferred outflows of resources:Deferred pension amounts 1,108,000 554,000 184,667 1,846,667 - Deferred OPEB amounts 325,609 162,805 54,268 542,682 - Deferred charges on refundings 562,501 83,695 - 646,196 -
Total deferred outflows of resources 1,996,110 800,500 238,935 3,035,545 -
Total assets and deferred outflowsof resources 85,802,294 79,398,873 10,017,540 175,218,707 3,733,100
See notes to financial statements.
Enterprise FundsBusiness-Type Activities

19
GovernmentalActivities
OtherElectric Water Nonmajor Internal
Department Department Enterprise Fund Total Service FundLiabilities
Current liabilities:Accounts payable 5,108,035 $ 3,479,746 $ 58,649 $ 8,646,430 $ 316,000 $ Accrued payroll and compensated absences 360,151 291,018 46,190 697,359 - Accrued taxes 374,929 33,847 - 408,776 - Accrued interest payable 428,644 408,801 60,787 898,232 - Unearned revenue - - - - Due to other funds 1,058,011 920,045 35,579 2,013,635 - General obligation bonds and BAN's - current portion 3,736,400 646,000 323,000 4,705,400 - Customer deposits payable 3,087,868 - 3,087,868 -
Total current liabilities 14,154,038 5,779,457 524,205 20,457,700 316,000
Noncurrent liabilities:Rate stabilization 12,874,668 - - 12,874,668 - General obligation bonds and notes payable - net of
premium and deferred amounts 33,964,400 28,796,013 5,685,000 68,445,413 - Unamortized premium 2,197,896 608,906 437,761 3,244,563 - Net pension liability 2,054,975 918,370 112,137 3,085,482 - Net OPEB liability 3,645,920 1,799,998 - 5,445,918 -
Total noncurrent liabilities 54,737,859 32,123,287 6,234,898 93,096,044 - Total liabilities 68,891,897 37,902,744 6,759,103 113,553,744 316,000
Deferred inflows of resources:Deferred pension amounts 366,540 183,270 61,090 610,900 - Deferred OPEB amounts 203,431 101,716 33,905 339,052 -
Total deferred inflows of resources 569,971 284,986 94,995 949,952 -
Net position:Net investment in capital assets 17,247,934 38,093,304 1,261,406 56,602,644 - Unrestricted (907,508) 3,117,839 1,902,036 4,112,367 3,417,100
Total net position 16,340,426 $ 41,211,143 $ 3,163,442 $ 60,715,011 3,417,100 $
Adjustment to reflect the consolidation of internal service fund activities related to enterprise funds 494,651
Net position of business-type activities 61,209,662 $
See notes to financial statements.
Business-Type ActivitiesEnterprise Funds

20
City of Groton, Connecticut
Statement of Revenues, Expenses and Changes in Fund Net Position - Proprietary FundsFor the Year Ended June 30, 2019
GovernmentalActivities
OtherElectric Water Nonmajor Internal
Department Department Enterprise Fund Total Service Fund
Operating revenues 56,303,526 $ 10,838,056 $ 4,314,627 $ 71,456,209 $ 5,328,968 $
Operating expenses:Direct expenses:
Purchased power 33,771,883 - - 33,771,883 - Other 3,266,471 3,936,417 2,122,356 9,325,244 -
Overhead expenses:Customer account 1,925,074 458,248 128,457 2,511,779 - Administrative and general 5,875,406 4,042,388 - 9,917,794 - Claims and administration - - - - 4,673,106 Taxes 1,787,472 352,823 60,064 2,200,359 - Depreciation 1,938,727 922,154 236,242 3,097,123 -
Total operating expenses 48,565,033 9,712,030 2,547,119 60,824,182 4,673,106
Operating income 7,738,493 1,126,026 1,767,508 10,632,027 655,862
Nonoperating revenues (expenses):Capital grant - 5,822,439 - 5,822,439 Investment income 447,911 59,966 4,525 512,402 8,869 Interest expense (1,259,500) (309,120) (238,084) (1,806,704) - Equity in earnings/losses in investments (29,166) - - (29,166) -
Total nonoperating revenues (expenses) (840,755) 5,573,285 (233,559) 4,498,971 8,869
Income before transfers 6,897,738 6,699,311 1,533,949 15,130,998 664,731
Transfers in - - 1,629,493 1,629,493 - Transfers out (4,071,140) - - (4,071,140) -
Changes in net position 2,826,598 6,699,311 3,163,442 12,689,351 664,731
Net position, beginning 13,513,828 34,511,832 - 48,025,660 2,752,369
Net position, ending 16,340,426 $ 41,211,143 $ 3,163,442 $ 60,715,011 3,417,100 $
Adjustment to reflect the consolidation of internal service fund activities:
Related to proprietary funds 494,651
Change in net position of business-type activities 13,184,002 $
See notes to financial statements.
Business-Type ActivitiesEnterprise Funds

21
City of Groton, Connecticut
Statement of Cash Flows - Proprietary FundsFor the Year Ended June 30, 2019
GovernmentalActivities
OtherElectric Water Nonmajor Internal
Department Department Enterprise Fund Total Service FundCash flows from operating activities:
Cash received from customers 57,100,555 $ 10,922,215 $ 4,004,444 $ 72,027,214 $ -$ Cash payments to suppliers for goods and services (39,387,876) (828,763) (3,091,076) (43,307,715) - Cash payments to employees for services (8,905,443) (3,654,119) (181,375) (12,740,937) - Cash received from premiums - - - - 5,328,968 Cash paid for claims - - - - (4,152,870) - - - (1,041,351)
Net cash provided by operating activities 8,807,236 6,439,333 731,993 15,978,562 134,747
Cash flows from investing activities:Interest and dividends on investments 447,911 59,966 4,525 507,877 8,869
Net cash provided by investing activities 447,911 59,966 4,525 507,877 8,869
Cash flows from noncapital and relatedfinancing activities:
Transfers to other funds (4,071,140) - 664,928 (3,406,212) - Amount held at CMEEC (453,222) - - (453,222) -
Net cash (used in) provided by noncapital and related financing activities (4,524,362) - 664,928 (3,859,434) -
Cash flows from capital and relatedfinancing activities:
Acquisition and construction of capital assets (2,328,589) (25,404,843) (46,364) (27,779,796) - Repayment of CMEEC loan (200,400) - (200,400) - Net Proceeds/Loans to/from Bozrah Light and Power 290,379 - 290,379 - Capital grants - 5,822,439 5,822,439 - Principal paid on general obligation bond maturities -
and equipment contracts (3,533,000) (717,000) (325,000) (4,575,000) - Debt proceeds - 15,066,653 - 15,066,653 - Interest paid on general obligation bonds, bond -
anticipation notes and equipment contracts (1,634,060) (194,362) (360,629) (2,189,051) - Net cash used in capital and related
financing activities (7,405,670) (5,427,113) (731,993) (12,832,783) -
Net (decrease) increase in cashand cash equivalents (2,674,885) 1,072,186 669,453 (933,246) 143,616
Cash and cash equivalents, beginning 21,690,983 9,463,866 - 31,154,849 3,069,810
Cash and cash equivalents, ending 19,016,098 $ 10,536,052 $ 669,453 $ 30,221,603 $ 3,213,426 $
(Continued)
Business-Type ActivitiesEnterprise Funds

22
City of Groton, Connecticut
Statement of Cash Flows - Proprietary Funds (Continued)For the Year Ended June 30, 2019
GovernmentalActivities
OtherElectric Water Nonmajor Internal
Department Department Enterprise Fund Total Service FundReconciliation of operating income to net
cash provided by (used in) operating activities:Operating income 7,738,493 $ 1,126,026 $ 1,767,508 $ 10,632,027 $ 655,862 $ Adjustments to reconcile operating income to
net cash provided by operating activities:Depreciation 1,938,727 922,154 236,242 3,097,123 - Change in assets and liabilities:
(Increase) decrease in:Accounts receivable 591,470 84,159 (310,183) 365,446 (459,096) Inventory 118,597 5,320 - 123,917 - Prepaid expenses 27,054 30,111 (10,254) 46,911 - Due from other funds (920,045) 2,258,346 (1,052,694) 285,607 - Customer deposits 424,742 - - 424,742 - Deferred outflows/inflows related to pension
and OPEB 71,265 (38,175) (143,940) (110,850) -
Increase (decrease) in:Accounts payable (370,705) 813,877 58,649 501,821 (62,019) Accrued payroll and compensated absences (28,186) 2,780 46,190 20,784 - Due to other funds (1,204,423) 920,045 35,579 (248,799) - Accrued taxes 10,049 - 10,049 - Rate stabilization 60,270 - 60,270 - Unearned revenue (279,453) - (279,453) - Net pension liability 672,824 336,412 112,137 1,121,373 - Net OPEB liability (43,443) (21,722) (7,241) (72,406) -
Net cash provided by operating activities 8,807,236 $ 6,439,333 $ 731,993 $ 15,978,562 $ 134,747 $
Schedule of non-cash capital and related financing activities:Contributions of capital assets -$ -$ 7,918,656 $ 7,918,656 $ -$ Transfer of long-term debt, related premium -$ -$ (6,954,093) $ (6,954,093) $ -$
and accrued interest
See notes to financial statements.
Business-Type ActivitiesEnterprise Funds

23
City of Groton, Connecticut
Statement of Fiduciary Net Position - Fiduciary FundsJune 30, 2019
Trust FundsAssets
Cash 3,748,370 $
InvestmentsU.S. government bonds 9,655,599 Mortgage backed securities 4,151,221 Collateralized mortgage obligations 3,502,760 Fixed Income - non-profit 94,609 Partnerships 2,683,171 Corporate bonds 4,317,126 Foreign bonds 1,215,476 Common stocks 660,681 Foreign stocks 176,295 Mutual funds:
Equities and related securities 56,532,145 Fixed income 5,698,661
Total investments 88,687,744
Accrued interest 118,654 Total assets 92,554,768
Liabilities
Pending purchases 71,957
Net position - restricted for pension andother post-retirement benefits 92,482,811 $
See notes to financial statements.

24
City of Groton, Connecticut
Statement of Changes in Fiduciary Net Position - Fiduciary FundsFor the Year Ended June 30, 2019
Trust FundsAdditions:
Contributions:Employer 2,592,725 $ Plan members 872,990
Total contributions 3,465,715
Investment income:Change in fair value of investments 2,791,824 Interest and dividends 2,768,959
Total investment income 5,560,783
Less investment expenses 71,993
Net investment income 5,488,790
Total additions 8,954,505
Deductions:Benefits 5,148,533 Administration 30,009
Total deductions 5,178,542
Change in net position 3,775,963
Net position restricted for pension andother post-retirement benefits:
Beginning of year 88,706,848
End of year 92,482,811 $
See notes to financial statements.

City of Groton, Connecticut Notes to Financial Statements
25
Note 1. Summary of Significant Accounting Policies Reporting entity: The City of Groton, Connecticut (the City) lies entirely within the Town of Groton (the Town) and covers an area of 3.06 square miles. The City operates under a Council-Mayor form of government as prescribed by its charter. The City provides the following services as authorized by its charter: utilities, public safety, public works, sanitation services and recreation. Accounting principles generally accepted in the United States of America (GAAP) require that the reporting entity include (1) the primary government, (2) organizations for which the primary government is financially accountable and (3) other organizations for which the nature and significance of their relationship with the primary government are such that exclusion would cause the reporting entity’s financial statements to be misleading or incomplete. As required by GAAP, these financial statements present the City and its component units, entities for which the City is considered to be financially accountable. The City’s component unit is a discretely presented component unit, which is reported in a separate column in the government-wide financial statements to emphasize that it is legally separate from the City. Bozrah Light and Power Company (the Company) has a June 30 year-end. Discretely presented component unit: The Company is wholly owned by the City. The Company operates as an electric utility, purchasing power and selling it to consumers. It owns and maintains electric distribution facilities for the purpose of delivering electricity to others. The Company is subject to requirements of Chapter 101 of the Connecticut General Statutes (the Statutes), which sets forth the regulatory structure applicable to municipal electric utilities. Under Chapter 101, the City is permitted to realize an average rate of return on its investment of five to eight percent. Any excess revenues may be used for capital expansion, economic development or to effect a rate reduction for electric consumers. The information presented for the Company is for the year ended June 30, 2019. Accounting standards adopted in the current year: Governmental Accounting Standards Board (“GASB”) Statement No. 83, Certain Asset Retirement Obligations, was effective for the City beginning with its year ending June 30, 2019. The objective of this Statement is to set guidance for determining the timing and pattern of recognition for liabilities and corresponding deferred outflow of resources related to asset retirement obligations. The adoption of this statement did not impact the City’s financial statements. GASB Statement No. 88, Certain Disclosures Related to Debt, including Direct Borrowings and Direct Placements, was effective for the City beginning with its year ending June 30, 2019. The primary objective of this Statement is to improve the information that is disclosed in notes to government financial statement related to debt, including direct borrowings and direct placements. It also clarifies which liabilities governments should include when disclosing information related to debt. The adoption of GASB Statement No. 88 did not impact the City’s financial position or results of operations.

City of Groton, Connecticut Notes to Financial Statements
26
Note 1. Significant Accounting Policies (Continued) Government-wide and fund financial statements: The government-wide financial statements (i.e., the statement of net position and the statement of activities) report information on all of the non-fiduciary activities of the City. For the most part, the effect of interfund activity has been removed from these statements. Governmental activities, which normally are supported by taxes and intergovernmental revenues, are reported separately from business-type activities, which rely to a significant extent on fees and charges for support. The statement of activities demonstrates the degree to which the direct expenses of a given function or segment are offset by program revenues. Direct expenses are those that are clearly identifiable with a specific function or segment. Program revenues include 1) charges to customers or applicants who purchase, use, or directly benefit from goods, services, or privileges provided by a given function or segment, and 2) grants and contributions that are restricted to meeting the operational or capital requirements of a particular function or segment. Taxes and other items not properly included among program revenues are reported instead as general revenues. Separate financial statements are provided for governmental funds, proprietary funds and fiduciary funds, even though the latter are excluded from the government-wide financial statements. Major individual governmental funds and major individual enterprise funds are reported as separate columns in the fund financial statements. Measurement focus, basis of accounting and financial statement presentation: The government-wide, proprietary funds and fiduciary fund financial statements are reported using the economic resources measurement focus and the accrual basis of accounting. Revenues are recorded when earned and expenses are recorded when a liability is incurred, regardless of the timing related cash flows. Property taxes are recognized as revenues in the year for which they are levied. Grants and similar items are recognized as revenues as soon as all eligibility requirements imposed by the provider have been met. Governmental fund financial statements are reported using the current financial resources measurement focus and the modified accrual basis of accounting. Revenues are recognized as soon as they are both measurable and available. Revenues are considered to be available when they are collectible within the current period or soon enough thereafter to pay liabilities of the current period. For this purpose, the government considers revenues to be available if they are collected within 60 days of the end of the current fiscal period. Expenditures generally are recorded when a liability is incurred, as under accrual accounting. However, debt service expenditures, as well as expenditures related to compensated absences and claims and judgments, are recorded only when payment is due. Property taxes, licenses, and interest associated with the current fiscal period are all considered to be susceptible to accrual (i.e., measurable and available) and so have been recognized as revenues of the current fiscal period. All other revenue items are considered to be measurable and available only when cash is received by the City. The City reports the following major governmental fund: The General Fund is the City’s primary operating fund. It accounts for and reports all financial resources of the general government not accounted for and reported in other funds.

City of Groton, Connecticut Notes to Financial Statements
27
Note 1. Summary of Significant Accounting Policies (Continued) The City reports the following major proprietary funds: The Electric Department accounts for the activities of the City’s Electric Department. The Water Department accounts for the activities of the City’s Water System. Additionally, the City reports the following other fund types: The Sewer Department accounts for the activities of the City’s Sewer System. The Internal Service Funds account for risk financing activities for medical insurance benefits. The Trust Funds account for the activities of the City of Groton Employees Retirement System and the OPEB, which accumulates resources for pension and OPEB benefit payments to qualified employees. As a general rule, the effect of interfund activity has been eliminated from the government-wide financial statements. Exceptions to this general rule are payments-in-lieu of taxes and other charges between the City’s Electric Department, Water Department, Sewer Department and various other functions of the City. Elimination of these charges would distort the direct costs and program revenues reported for the various functions concerned. Amounts reported as program revenues include 1) charges to customers or applicants for goods, services, or privileges provided, 2) operating grants and contributions, and 3) capital grants and contributions, including special assessments. Internally dedicated resources are reported as general revenues rather than as program revenues. Likewise, general revenues include all taxes. Proprietary funds distinguish operating revenues and expenses from non-operating items. Operating revenues and expenses generally result from providing services and producing and delivering goods in connection with a proprietary fund’s principal ongoing operations. The principal operating revenues of the Electric Department enterprise fund, of the Water Department enterprise fund, of the Sewer Department and of the government’s internal service funds are charges to customers for sales and services. Operating expenses for enterprise funds and internal service funds include the cost of sales and services, administrative expenses, and depreciation on capital assets. All revenues and expenses not meeting this definition are reported as non-operating revenues and expenses. Assets, liabilities, deferred outflows/inflows of resources and net position or equity: Deposits and investments: Cash and cash equivalents: The City’s cash and cash equivalents consist of cash on hand, demand deposits, money market accounts and short-term investments with original maturities of three months or less from the date of acquisition.

City of Groton, Connecticut Notes to Financial Statements
28
Note 1. Summary of Significant Accounting Policies (Continued) Investments: Investments are stated at fair value. In general, the Statutes allow the City to invest in obligations of the United States of America or United States government sponsored corporations, in shares or other interests in any custodial arrangement, pool, or no-load, open-end management type investment company or investment trust (as defined), in obligations of any State or political subdivision rated within the top two rating categories of any nationally recognized rating service, or in obligations of the State of Connecticut or political subdivision rated within the top three rating categories of any nationally recognized rating services. For the Equipment Replacement Account, not more than 31% can be invested in equity securities. Investment income is recorded in the fund in which it was earned. The City’s Trust Funds are guided by a written investment policy that describes the characteristics of the investment portfolios and expected returns on the pension fund assets. The funds’ assets are managed by investment managers. Fair value: Fair value is the price that would be received to sell an asset or paid to transfer a liability in an orderly transaction between market participants at the measurement date. Fair value is best determined based upon quoted market prices. However, in certain instances, there are no quoted market prices for certain assets or liabilities. In cases where quoted market prices are not available, fair values are based on estimates using present value or other valuation techniques. Those techniques are significantly affected by the assumptions used, including the discount rate and estimates of future cash flows. Accordingly, the fair value estimates may not be realized in an immediate settlement of the asset or liability. Fair value measurements focus on exit prices in an orderly transaction (that is, not a forced liquidation or distressed sale) between market participants at the measurement date under current market conditions. If there has been a significant decrease in the volume and level of activity for the asset or liability, a change in valuation technique or the use of multiple valuation techniques may be appropriate. In such instances, determining the price at which willing market participants would transact at the measurement date under current market conditions depends on the facts and circumstances and requires the use of significant judgment. The City’s fair value measurements are classified into a fair value hierarchy based on the markets in which the assets and liabilities are traded and the reliability of the assumptions used to determine fair value.

City of Groton, Connecticut Notes to Financial Statements
29
Note 1. Summary of Significant Accounting Policies (Continued) The three categories within the hierarchy are as follows: Level 1: Quoted prices in active markets for identical assets and liabilities. Level 2: Inputs other than quoted prices included within Level 1 that are observable for the asset or
liability, either directly or indirectly, including quoted prices for similar assets or liabilities in active markets, quoted prices for identical or similar assets or liabilities in markets that are not active, interest rates and yield curves observable at commonly quoted intervals, implied volatilities, credit spreads, and market-corroborated inputs.
Level 3: Unobservable inputs shall be used to measure fair value to the extent that relevant observable
inputs are not available, thereby allowing for situations in which there is little, if any, market activity for the asset or liability at the measurement date. Level 3 assets and liabilities include financial instruments whose value is determined using pricing models, discounted cash flows methodologies, or similar techniques, as well as instruments for which the determination of fair value requires significant management judgment.
See Note 3 for additional information regarding fair value. Investments measured at the net asset value (NAV): Investments valued using the net asset value per share (or its equivalent) as a practical expedient are considered “alternative investments” and, unlike traditional investments, generally do not have readily obtainable market values and take the form of limited partnerships. The City values these investments based on the partnerships’ audited financial statements. If June 30 statements are available, those values are used preferentially. However, some partnerships have fiscal years ending at other than June 30. If June 30 valuations are not available, the value is determined from the most recently available valuation taking into account subsequent calls and distributions. Receivables and payables: Interfunds: Activity between funds that are representative of lending borrowing arrangements outstanding at the end of the fiscal year are referred to as either “due to/from other funds” (i.e., the current portion of interfund loans) or “advances to/from other funds” (i.e., the non-current portion of interfund loans). Any residual balances outstanding between the governmental activities and business-type activities are reported in the government-wide financial statements as “internal balances.” Property taxes and other receivables: In the government-wide financial statements, property tax and electric and water use receivables are shown net of an allowance for uncollectibles of approximately $7,000, $75,000 and $2,500, respectively. In the fund financial statements, property tax receivables are recorded as of levy date and property tax revenue is recognized when it becomes available. Available means then due or past due and receivable within the current period and collected within the current period, or expected to be collected soon enough thereafter to be used to pay liabilities of the current period. Such time thereafter shall not exceed 60 days. Property taxes not collected during the 60-day period are recorded as deferred revenue. Property taxes are attached as an enforceable lien on property as of July 1. Assessments are set as of October 1 preceding and, as such, an inchoate lien is placed at that time. On July 1, when the mill rate is applied to levy a dollar tax, lien is recognized. Taxes are billed in one installment due July 1. A lien may be continued if filed within 1 year of the due date. The City performs tax assessment and collection duties for the City of Groton. The City sets its own mill rate at its Annual Budget Meeting on the first Monday in June.

City of Groton, Connecticut Notes to Financial Statements
30
Note 1. Summary of Significant Accounting Policies (Continued) Inventories and prepaid items: Inventory is valued at moving weighted average cost for the Proprietary Funds. All other inventories are valued at specific cost using the first-in/first-out (FIFO) method. Inventory in the General Fund consists of expendable supplies held for consumption. Inventory in the Proprietary Funds consists of supplies and materials. Certain payments to vendors reflect costs applicable to future accounting periods and are recorded as prepaid items in both government-wide and enterprise fund financial statements. Restricted assets: The restricted assets for the City are restricted for endowment purposes. The trust agreement restricts the expenditure of the investment income only for the designated purpose. The City also restricts cash for unspent bond proceeds. Capital assets: Capital assets, which include property, plant, equipment, and infrastructure assets (e.g., roads, bridges, sidewalks, and similar items), are reported in the applicable governmental (or business-type activities) columns in the government-wide financial statements and in the proprietary funds financial statements. Capital assets are defined by the government as assets with an initial, individual cost of more than $5,000 for equipment, $20,000 for improvements, and $100,000 for infrastructure, and an estimated useful life in excess of one year. Such assets are recorded at historical cost or estimated historical cost if purchased or constructed. Donated capital assets are recorded at acquisition value at the date of donation. The costs of normal maintenance and repairs that do not add to the value of the asset or materially extend assets’ lives are not capitalized. Major outlays for capital assets and improvements are capitalized as projects are constructed. Interest incurred during the construction phase of capital assets of business-type activities is included as part of the capitalized value of the assets constructed. Property, plant, and equipment of the City are depreciated using the straight-line method over the following estimated useful lives: Asset Type Years
Buildings 25-67Improvements 17-100Vehicles and equipment 5-33Roads 50Sewer plant 30-40Sewer distribution system 40-50Station equipment 20Electrical distribution system 17-25Plant and pumping stations 50Water distribution system 40-50

City of Groton, Connecticut Notes to Financial Statements
31
Note 1. Summary of Significant Accounting Policies (Continued) Deferred outflows/inflows of resources: In addition to assets, the statement of net position will sometimes report a separate section for deferred outflows of resources. This separate financial statement element, deferred outflows of resources, represents a consumption of net position or fund balance that applies to a future period or periods and so will not be recognized as an outflow of resources (expense/expenditure) until then. The City reports a deferred charge on refunding and deferred outflows related to pension and OPEB in the government-wide statement of net position. A deferred charge on refunding results from the difference in the carrying value of refunded debt and its reacquisition price. This amount is deferred and amortized over the shorter of the life of the refunded or refunding debt. A deferred outflow of resources related to pension and OPEB results from differences between expected and actual experience, changes in assumptions or other inputs. These amounts are deferred and included in pension and OPEB expense in a systematic and rational manner. In addition to liabilities, the statement of net position will sometimes report a separate section for deferred inflows of resources. This separate financial statement element, deferred inflows of resources, represents an acquisition of net position or fund balance that applies to a future period or periods and so will not be recognized as an inflow of resources (revenue) until that time. The City reports a deferred inflow of resources related to pensions and OPEB in the government-wide statement of net position. A deferred inflow of resources related to pension and OPEB results from differences between expected and actual experience, changes in assumptions or other inputs. These amounts are deferred and included in pension and OPEB expenses in a systematic and rational manner. The governmental funds report unavailable revenues from property taxes, interest on property taxes, and sewer use charges. These amounts are deferred and recognized as an inflow of resources (revenue) in the period during which the amounts become available. Compensated absences: City employees accumulate vacation and sick leave hours for subsequent use or for payment upon termination or retirement. Vacation and sick leave expenses to be paid in future periods are accrued when incurred in the government-wide and proprietary fund financial statements. A liability for these amounts is reported in governmental funds only for the amounts that have become due. Amounts for compensated absences are generally liquidated by the General Fund for governmental activities, and in proprietary funds for business-type activities. The liability for sick leave occurs only at the time of retirement and only for employees other than utility employees. As of June 30, 2019, an estimate of future retirements has been recorded based upon years of service. The Electric. Water and Sewer Departments have recorded the liability for accumulated vacation. The Electric, Water and Sewer Departments’ vacation time is expensed as earned, as is the vacation time of governmental employees in the government-wide statements. The City’s governmental employees’ vacation time is recorded as expenditures as used in the government funds financial statements. Sick time for the City and Electric, Water and Sewer Departments does not vest. Long-term obligations: In the government-wide financial statements and proprietary fund type financial statements, long-term debt and other long-term obligations are reported as liabilities in the applicable governmental activities, business-type activities, or proprietary fund type statement of net position. Bond premiums and discounts are deferred and amortized over the life of the bonds using the effective interest method. Bonds payable are reported net of the applicable bond premium or discount. Bond issuance costs are recognized during the current period.

City of Groton, Connecticut Notes to Financial Statements
32
Note 1. Summary of Significant Accounting Policies (Continued) In the governmental fund financial statements, bond premiums and discounts, as well as bond issuance costs, are recognized during the current period. The face amount of debt issued is reported as other financing sources. Premiums received on debt issuances are reported as other financing sources, while discounts on debt issuances are reported as other financing uses. Issuance costs, whether or not withheld from the actual debt proceeds received, are reported as debt service expenditures. Net pension liability (asset): The net pension liability (asset) is measured as the portion of the actuarial present value of projected benefits that is attributed to past periods of employee service (total pension liability), net of the pension plan’s fiduciary net position. The pension plan’s fiduciary net position is determined using the same valuation methods that are used by the pension plan for purposes of preparing its statement of fiduciary net position. The net pension liability (asset) is measured as of a date (measurement date) no earlier than the end of the employer’s prior fiscal year, consistently applied from period to period. Net OPEB liability: The total OPEB liability is measured as the portion of the actuarial present value of projected benefits that is attributed to past periods of employee service (total OPEB liability) The OPEB plan’s fiduciary net position is determined using the same valuation methods that are used by the OPEB plan for purposes of preparing its statement of fiduciary net position. The net OPEB liability is measured as of a date (measurement date) no earlier than the end of the employer’s prior fiscal year, consistently applied from period to period. The net OPEB liability is reported in the statement of net position. In the governmental funds, expenditures are recognized when they are paid or are expected to be paid with current available resources. Fund equity and net position: In the government-wide financial statements, net position is classified in the following categories:
Net investment in capital assets: This category groups all capital assets, including infrastructure, into one component of net position, net of accumulated depreciation and reduced by the outstanding balances of bonds, notes or other borrowings that are attributable to the acquisition, construction or improvement of those assets. Deferred outflows of resources and deferred inflows of resources that are attributable to the acquisition, construction, or improvement of those assets or related debt are included in this component of net position. Restricted net position: These amounts are restricted to specific purposes when constraints placed on the use of resources are either (a) externally imposed by creditors (such as debt covenants), grantors, contributors, or laws or regulations of other governments; or (b) imposed by law through constitutional provisions or enabling legislations. Unrestricted net position (deficits): This category represents the net position of the City, which are not restricted for any project or other purpose.

City of Groton, Connecticut Notes to Financial Statements
33
Note 1. Summary of Significant Accounting Policies (Continued) In the fund financial statements, the City reported the following governmental fund balances:
Nonspendable fund balance: These amounts cannot be spent because they are not in spendable form. Restricted fund balance: These amounts are restricted to specific purposes when constraints placed on the use of resources are either (a) externally imposed by creditors (such as debt covenants), grantors, contributors, or laws or regulations of other governments; or (b) imposed by law through constitutional provisions or enabling legislations. Committed fund balance: This represents amounts constrained for a specific purpose by a government using its highest level of decision-making authority. The Groton City Council is the highest level of decision making authority for the City and can commit fund balance through the adoption of a resolution prior to the end of the fiscal year. Once adopted, the limitation imposed by the resolution remains in place until similar action is taken to remove or revise the limitation. Assigned fund balance: These amounts are approved and committed to by the City Council subsequent to June 30. The balance also includes encumbrances assigned for goods and services. Unassigned fund balance: includes residual positive fund balance within the general fund which has not been classified within the other abovementioned categories. Unassigned fund balance may also include negative balances for any governmental fund if expenditures exceed amounts restricted, committed, or assigned for those specific purposes.
When both restricted and unrestricted amounts are available for use, it is the City’s practice to use restricted resources first. Additionally, the City would first use committed, then assigned, and lastly unassigned amounts of unrestricted fund balance. Accounting estimates: The preparation of the financial statements in conformity with GAAP requires management to make estimates and assumptions that affect the reported amounts at the date of the financial statements and the reported amounts of revenues and expenditures during the reporting period. Actual results could differ from those estimates.
Note 2. Reconciliation of Government-Wide and Fund Financial Statements Explanation of certain differences between the governmental fund balance sheet and the government-wide statement of net position: The governmental fund balance sheet includes a reconciliation between fund balance – total governmental funds, and net position – governmental activities as reported in the government-wide statement of net position. One element of that reconciliation explains that “long-term liabilities, including bonds payable, are not due and payable in the current period and therefore are not reported in the funds.” The details of the difference are as follows: Bonds payable 2,905,000 $ Premium 171,361 Compensated absences 1,177,391 Net pension liability 2,974,674 Net OPEB liability 4,613,628 Heart and hypertension 15,668
Net adjustment to reduce fund balance - total governmentalfunds to arrive at net position - governmental activities 11,857,722 $

City of Groton, Connecticut Notes to Financial Statements
34
Note 2. Reconciliation of Government-Wide and Fund Financial Statements (Continued) Explanation of certain differences between the governmental fund statement of revenues, expenditures, and changes in fund balances and the government-wide statement of activities: The governmental fund statement of revenues, expenditures, and changes in fund balances includes a reconciliation between net changes in fund balances – total governmental funds and changes in net position of governmental activities as reported in the government-wide statement of activities. One element of that reconciliation explains that “Governmental funds report capital outlays as expenditures. However, in the statement of activities the cost of those assets is allocated over their estimated useful lives and reported as depreciation expense.” The details of this difference are as follows: Capital outlay 217,712 $ Depreciation expense (882,061) Loss on disposal (68,341) Transfer to Sewer Department (7,918,656)
Net adjustment to decrease net changes in fund balances -total governmental funds to arrive at changes in net positionof governmental activities (8,651,346) $
Another element of that reconciliation states that “the issuance of long-term debt (e.g., bonds, leases) provides current financial resources to governmental funds, while the repayment of the principal of long-term debt consumes the current financial resources of governmental funds. Neither transaction, however, has any effect on net position. Also, governmental funds report the effect of premiums, discounts, and similar items when debt is first issued, whereas these amounts are deferred and amortized in the statement of activities.” The details of this difference are as follows: Debt issued or incurred:
Principal repayments:General obligation debt 265,000 $ Amortization of bond premiums 17,511 Transfer to Sewer Department 6,792,374
Net adjustment to increase net changes in fund balances -total governmental funds to arrive at changes in net position ofgovernmental activities 7,074,885 $

City of Groton, Connecticut Notes to Financial Statements
35
Note 2. Reconciliation of Government-Wide and Fund Financial Statements (Continued) Another element of that reconciliation states that “Some expenses reported in the statement of activities do not require the use of current financial resources and therefore are not reported as expenditures in governmental funds.” The details of this difference are as follows: Changes in accrued liabilities for
Compensated absences 57,182 $ Accrued interest 175,955 Net pension liability (952,110) Net OPEB liability 61,476 Heart and hypertension 16,357
Net adjustment to decrease net changes in fund balances - totalgovernmental funds to arrive at changes in net position ofgovernmental activities (641,140) $
Note 3. Cash, Cash Equivalents and Investments Deposits: The City and the pension trust funds do not have a policy for deposits. The City also does not have a custodial credit risk policy. However, as a practice, the City follows state statutes. The State of Connecticut (the State) requires that each depository maintain segregated collateral in an amount equal to a defined percentage of its public deposits based upon the bank’s risk based capital ratio. Investments: The City and the Pension Trust Funds do not have a credit risk or a custodial credit risk policy for investments. The City and the Pension Trust Funds have adopted investment policies that conform to the policies as set forth by the State. The Statutes (Section 7-400) permit municipalities to invest in: (1) obligations of the United States and its agencies (2) highly rated obligations of any state of the United States or of any political subdivision, authority or agency thereof; and (3) shares or other interests in custodial arrangements or pools maintaining constant net asset values and in highly rated no-load open end money market mutual funds (with constant or fluctuating net asset values) whose portfolios are limited to obligations of the United States and its agencies, and repurchase agreements fully collateralized by such obligations. The Statutes (Sections 3-24f and 3-27f) also provide for investment in shares of the Connecticut Short Term Investment Fund (STIF). Other provisions of the Statutes cover specific municipal pension funds with particular investment authority and do not specify permitted investments. Therefore, investment of such funds is generally controlled by the laws applicable to fiduciaries. The pension and OPEB trust fund’s investment in foreign bonds and stocks is in proportion with which the investment manager shall deem appropriate. Interest rate risk: The City, including its trust funds, do not have a policy that limits investment maturities as a means of managing its exposure to fair value losses arising from increasing interest rates. However, its practice is to structure the investment portfolio so that securities mature to meet cash requirements for ongoing operations or pension payments, thereby avoiding the need to sell securities on the open market prior to maturity, and investing operating funds primarily in shorter-term securities, money market mutual funds, or similar investment pools. Concentration of credit risk: The City, including its trust funds, does not have a formal policy that limits the amounts invested in any one issuer. However, its practice is to maintain a diversified portfolio to minimize the risk of loss resulting from over-concentration of assets in a specific issuer. Approximately 10% of the City’s investments are concentrated in mortgage-backed securities.

City of Groton, Connecticut Notes to Financial Statements
36
Note 3. Cash, Cash Equivalents and Investments (Continued) Custodial credit risk: Deposits: This is the risk that, in the event of failure of a depository financial institution, a government will not be able to recover its deposits or will not be able to recover collateral securities that are in the possession of an outside party. As of June 30, 2019, approximately $41,067,000 of the entity’s approximate bank balance of $46,910,000 was uninsured and uncollateralized. Investments: This is the risk that in the event of the failure of the counterparty (e.g., broker-dealer) to a transaction, a government will not be able to recover the value of its investment or collateral securities that are in the possession of another Cash, cash equivalents and investments of the City consist of the following at June 30: Cash and cash equivalents:
Deposits with financial institutions 49,480,488 $ Total cash and cash equivalents 49,480,488
Investments:Pension and OPEB trust funds:U.S. government bonds 9,655,599 Mortgage backed securities 4,151,221 Collateralized mortgage obligations 3,502,760 Fixed Income - non-profit 94,609 Partnerships 2,683,171 Corporate bonds 4,317,126 Foreign bonds 1,215,476 Common stocks 660,681 Foreign stocks 176,295 Mutual funds
Equities and related securities 56,532,145 Fixed income 5,698,661
88,687,744 Other governmental funds:
U.S. Government Bonds 129,016 Fixed Income Mutual Funds 44,214 Common Stock 313,371 Corporate Bonds 56,574
543,175
Total investments 89,230,919 Total cash, cash equivalents and investments 138,711,407 $
These investments are uninsured and unregistered, with securities held by the counterparty in the City's or Pension Trust's name.

City of Groton, Connecticut Notes to Financial Statements
37
Note 3. Cash, Cash Equivalents and Investments (Continued) Cash, cash equivalents and investments are classified in the accompanying financial statements as follows: Statement of net position:
Cash and cash equivalents 45,672,118 $ Restricted cash 60,000 Investments 543,175
Total statement of net position 46,275,293
Fiduciary funds:Cash and cash equivalents 3,748,370 Investments 88,687,744
92,436,114 Total cash, cash equivalents and investments 138,711,407 $
Interest rate risk: This is the risk that changes in market interest rates will adversely affect the fair value of an investment. Generally, the longer the maturity of an investment, the greater the sensitivity of its fair value to changes in market interest rates. Information about the exposure of the entity’s debt type investments to this risk using the segmented time distribution model is as follows:
Fair Less Than 1-5 5-10 OverType of Investment Value 1 Year Years Years 10 Years
U.S. Government bonds 9,784,615 $ 26,363 $ 4,823,553 $ 3,232,095 $ 1,702,604 $ Collateralized mortgage obligations 3,502,760 - 1,475,917 658,227 1,368,616 Mortgage-backed securities 4,151,221 - - - 4,151,221 Fixed Income - non-profit 94,609 - - - 94,609 Corporate bonds 4,373,700 69,248 1,312,122 1,852,861 1,139,469 Foreign bonds 1,215,476 60,028 630,383 137,551 387,514
Total 23,122,381 $ 155,639 $ 8,241,975 $ 5,880,734 $ 8,844,033 $
Investment Maturities (in Years)
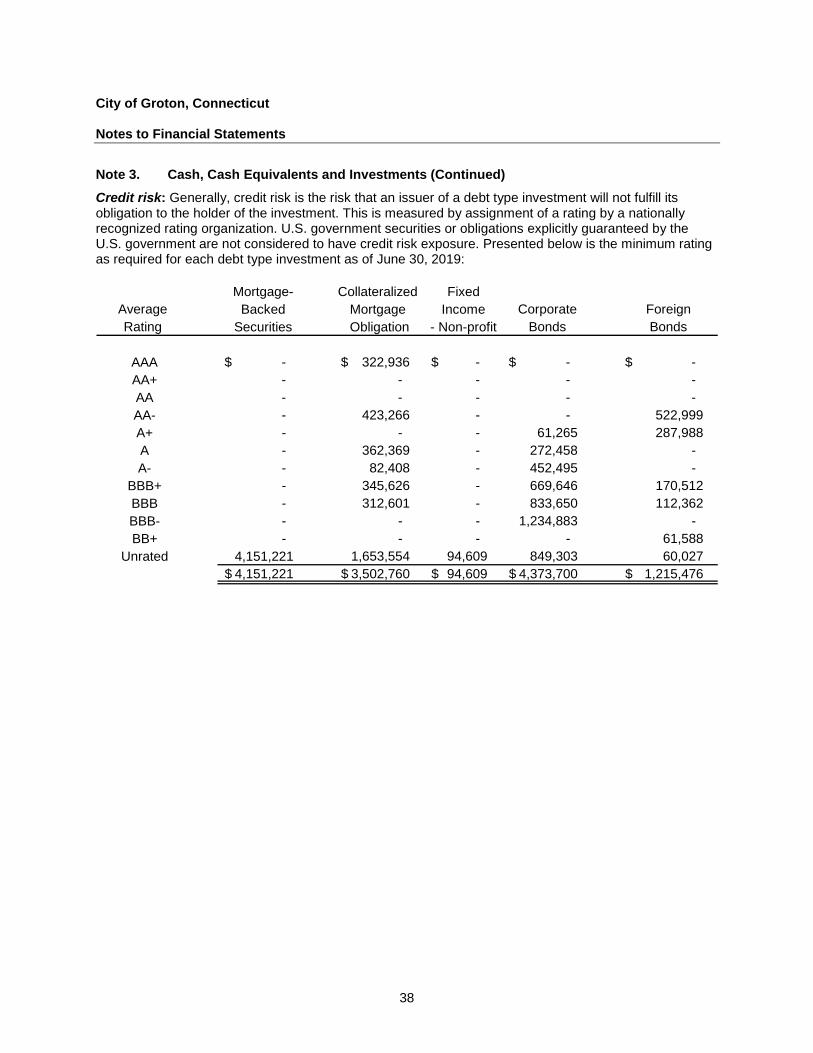
City of Groton, Connecticut Notes to Financial Statements
38
Note 3. Cash, Cash Equivalents and Investments (Continued) Credit risk: Generally, credit risk is the risk that an issuer of a debt type investment will not fulfill its obligation to the holder of the investment. This is measured by assignment of a rating by a nationally recognized rating organization. U.S. government securities or obligations explicitly guaranteed by the U.S. government are not considered to have credit risk exposure. Presented below is the minimum rating as required for each debt type investment as of June 30, 2019:
Mortgage- Collateralized FixedAverage Backed Mortgage Income Corporate ForeignRating Securities Obligation - Non-profit Bonds Bonds
AAA -$ 322,936 $ -$ -$ -$ AA+ - - - - - AA - - - - - AA- - 423,266 - - 522,999 A+ - - - 61,265 287,988 A - 362,369 - 272,458 - A- - 82,408 - 452,495 -
BBB+ - 345,626 - 669,646 170,512 BBB - 312,601 - 833,650 112,362 BBB- - - - 1,234,883 - BB+ - - - - 61,588
Unrated 4,151,221 1,653,554 94,609 849,303 60,027 4,151,221 $ 3,502,760 $ 94,609 $ 4,373,700 $ 1,215,476 $

City of Groton, Connecticut Notes to Financial Statements
39
Note 3. Cash, Cash Equivalents and Investments (Continued) Fair value: The Plan categorizes its fair value measurements within the fair value hierarchy established by generally accepted accounting principles. The Plan has the following recurring fair value measurements as of June 30, 2019:
Quoted Prices in Active Significant Significant
Markets for Other Other Identical Observable Observable Assets Inputs Inputs
June 30, 2019 (Level 1) (Level 2) (Level 3)Investments by fair value level:
Stocks 1,150,347 $ 1,150,347 $ -$ -$ Mutual funds 62,275,020 62,275,020 - -
Debt securities:U.S. Government Bonds 9,784,615 - 9,784,615 - Corporate bonds 4,373,700 - 4,373,700 - Asset and mortgage backed 4,151,221 - 4,151,221 - Collateralized mortgage obligations 3,502,760 - 3,502,760 - Other bonds 1,310,085 - 1,310,085 -
Total debt securities 23,122,381 62,275,020 23,122,381 -
Total investments by fair value level 86,547,748 62,275,020 23,122,381 -
Investments measured at the net asset level (NAV):Partnerships 2,683,171
Total investments measured at the NAV 2,683,171
Total investments measured at fair value 89,230,919 $
Fair Value Measurements Using
Partnerships: These limited partnerships provide for the portfolio exposure to private companies through equity and/or debt investments. Fund managers invest in private companies with the goal of enhancing value over the long-term.

City of Groton, Connecticut Notes to Financial Statements
40
Note 4. Unearned Revenue/Deferred Inflows of Resources Governmental funds report deferred inflows of resources in connection with receivables for revenues that are not considered to be available to liquidate liabilities of the current period. Governmental funds and governmental activities also report unearned revenue in connection with resources that have been received, but not yet earned. At the end of the current fiscal year, the various components of unearned revenue/deferred inflows of resources were as follows:
Deferred UnearnedInflows Revenue
General fund:Taxes and accrued interest on delinquent
property taxes 30,607 $ -$ Other nonmajor governmental funds: - 395,025
Intergovernmental revenue 30,607 $ 395,025 $
Note 5. Interfund Balances and Interfund Transfers Interfund balances: A summary of interfund balances as of June 30, 2019 is as follows:
Due From Due ToOther Funds Other Funds
General Fund 8,384 $ 4,015,751 $ Nonmajor governmental funds 4,040,025 90,140 Proprietary funds 2,071,117 2,013,635
Total 6,119,526 $ 6,119,526 $ All interfund balances resulted from the time lag between the dates payments occurred between funds for short-term internal financing. Interfund transfers: A summary of interfund transfers for the year ended June 30, 2019 is as follows:
Transfers From Transfers ToOther Funds Other Funds
General Fund 4,086,140 $ 740,323 $ Nonmajor governmental funds 740,323 679,928 Proprietary funds 1,629,493 4,071,140
Total 6,455,956 $ 5,491,391 $ Transfers are used to account for the financing by the General Fund of electric utilities and miscellaneous special revenue funds. Further, during the year ended June 30, 2019, the City transferred $7,918,656 of net capital assets, $664,928 of cash and $6,954,093 of long-term debt, related premiums and accrued interest to the Sewer Department enterprise fund. The net amount of $964,565 is not included in the above schedule.
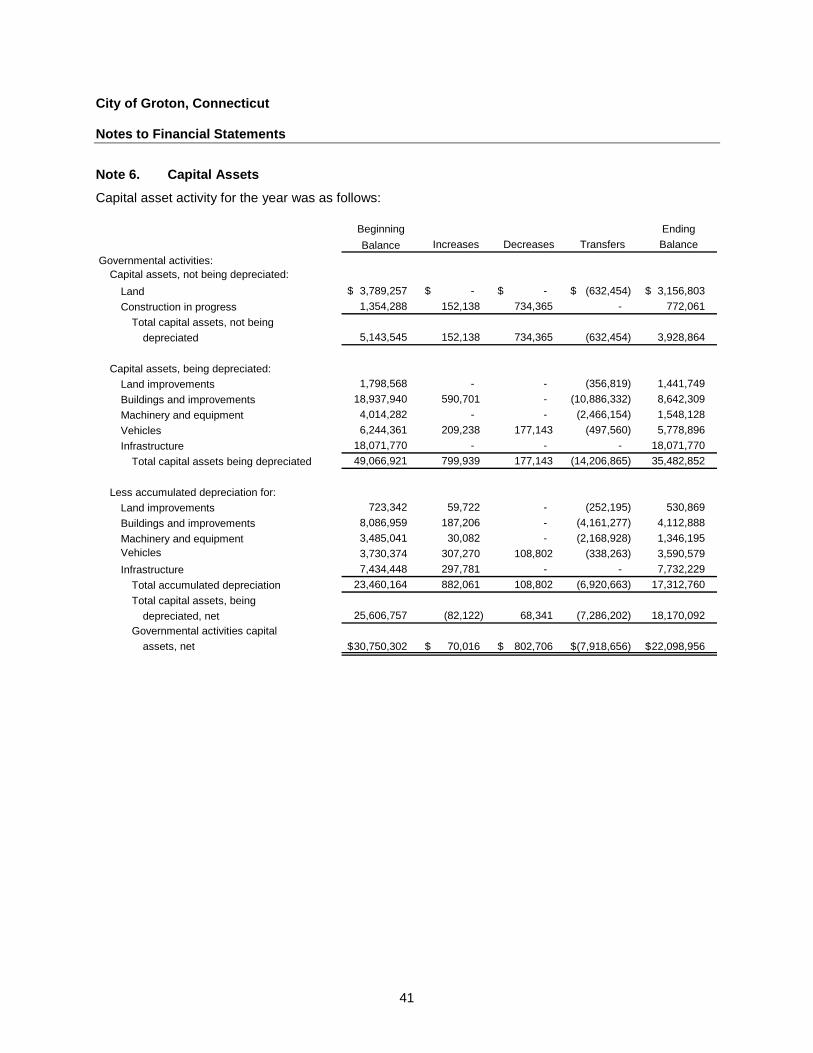
City of Groton, Connecticut Notes to Financial Statements
41
Note 6. Capital Assets Capital asset activity for the year was as follows:
Beginning EndingBalance Increases Decreases Transfers Balance
Governmental activities:Capital assets, not being depreciated:
Land 3,789,257 $ -$ -$ (632,454) $ 3,156,803 $ Construction in progress 1,354,288 152,138 734,365 - 772,061
Total capital assets, not beingdepreciated 5,143,545 152,138 734,365 (632,454) 3,928,864
Capital assets, being depreciated:Land improvements 1,798,568 - - (356,819) 1,441,749 Buildings and improvements 18,937,940 590,701 - (10,886,332) 8,642,309 Machinery and equipment 4,014,282 - - (2,466,154) 1,548,128 Vehicles 6,244,361 209,238 177,143 (497,560) 5,778,896 Infrastructure 18,071,770 - - - 18,071,770
Total capital assets being depreciated 49,066,921 799,939 177,143 (14,206,865) 35,482,852
Less accumulated depreciation for:Land improvements 723,342 59,722 - (252,195) 530,869 Buildings and improvements 8,086,959 187,206 - (4,161,277) 4,112,888 Machinery and equipment 3,485,041 30,082 - (2,168,928) 1,346,195 Vehicles 3,730,374 307,270 108,802 (338,263) 3,590,579 Infrastructure 7,434,448 297,781 - - 7,732,229
Total accumulated depreciation 23,460,164 882,061 108,802 (6,920,663) 17,312,760 Total capital assets, being
depreciated, net 25,606,757 (82,122) 68,341 (7,286,202) 18,170,092 Governmental activities capital
assets, net 30,750,302 $ 70,016 $ 802,706 $ (7,918,656) $ 22,098,956 $

City of Groton, Connecticut Notes to Financial Statements
42
Note 6. Capital Assets (Continued)
Beginning EndingBalance Increases Decreases Transfers Balance
Business-type activitiesCapital assets, not being depreciated:
Land 2,840,487 $ -$ -$ 632,454 $ 3,472,941 $ Construction in progress 16,742,028 23,671,262 - - 40,413,290
Total capital assets, not being depreciated 19,582,515 23,671,262 - 632,454 43,886,231
Capital assets, being depreciated:Buildings and improvements 8,159,120 238,029 - 11,243,152 19,640,301 Station equipment 22,484,402 163,642 9,371 - 22,638,673 Electric distribution system 43,010,126 1,404,185 1,161,843 - 43,252,468 Plant and pumping stations 10,772,625 - - 2,466,153 13,238,778 Water distribution system 27,955,760 1,570,008 - - 29,525,768 Machinery and equipment 8,162,737 454,894 - - 8,617,631 Vehicles 3,879,234 252,961 144,025 497,560 4,485,730
Total capital assets, being depreciated 124,424,004 4,083,719 1,315,239 14,206,865 141,399,349
Less accumulated depreciation for:Buildings and improvements 4,626,709 375,679 - 4,413,472 9,415,860 Station equipment 14,042,130 447,191 9,371 14,479,950 Electric distribution system 22,501,638 1,070,409 1,186,660 - 22,385,387 Plant and pumping stations 7,251,764 197,909 - 2,168,928 9,618,601 Water distribution system 10,003,200 415,244 - 10,418,444 Machinery and equipment 6,633,497 335,695 - 6,969,192 Vehicles 3,127,155 254,996 144,025 338,263 3,576,389
Total accumulated depreciation 68,186,093 3,097,123 1,340,056 6,920,663 76,863,823 Total capital assets, being
depreciated, net 56,237,911 986,596 (24,817) 7,286,202 64,535,526 Business-type activities capital
assets, net 75,820,426 $ 24,657,858 $ (24,817) $ 7,918,656 $ 108,421,757 $

City of Groton, Connecticut Notes to Financial Statements
43
Note 6. Capital Assets (Continued) Depreciation expense was charged to functions/programs of the City as follows: Governmental activities:
General government 90,701 $ Public safety 190,069 Public works 512,496 Recreation 88,795
Total depreciation expense – governmental activities 882,061 $
Business-type activities:Electric department 1,938,727 $ Water system 922,154 Sewer system 236,242
Total depreciation expense – business-type activities 3,097,123 $ Discretely presented component units: Activity for Bozrah Light and Power Company for the year ended June 30, was as follows:
Balance BalanceJuly 1, 2018 Increases Decreases June 30, 2019
Capital assets not being depreciatedLand and land rights 67,706 $ -$ -$ 67,706 $ Intangibles 4,711 - - 4,711 Construction in progress 470,256 645,340 666,574 449,022
Total capital assets not being depreciated 542,673 645,340 666,574 521,439
Capital assets being depreciatedBuildings and improvements 390,615 - - 390,615 Electric distribution system 17,056,457 487,485 118,328 17,425,614 Machinery and equipment 443,991 36,057 - 480,048 Vehicles 736,041 - 29,889 706,152
Total capital assets, being depreciated 18,627,104 523,542 148,217 19,002,429
Less accumulated depreciation forBuilding and improvements 296,370 6,131 - 302,501 Electric distribution system 7,086,990 524,729 95,871 7,515,848 Machinery and equipment 419,139 6,365 - 425,504 Vehicles 320,056 65,829 36,998 348,887
Total accumulated depreciation 8,122,555 603,054 132,869 8,592,740 Total capital assets, being
depreciated, net 10,504,549 (79,512) 15,348 10,409,689 Governmental activities capital
assets, net 11,047,222 $ 565,828 $ 681,922 $ 10,931,128 $
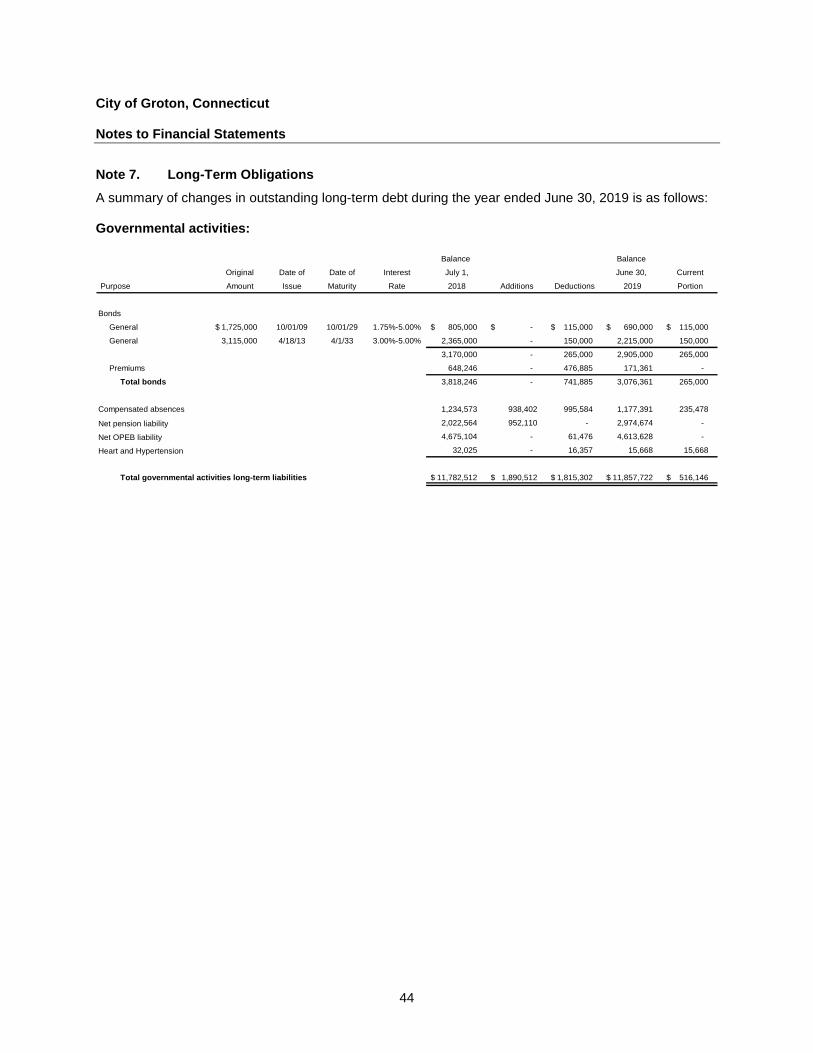
City of Groton, Connecticut Notes to Financial Statements
44
Note 7. Long-Term Obligations A summary of changes in outstanding long-term debt during the year ended June 30, 2019 is as follows: Governmental activities:
Balance Balance
Original Date of Date of Interest July 1, June 30, Current
Purpose Amount Issue Maturity Rate 2018 Additions Deductions 2019 Portion
Bonds
General 1,725,000 $ 10/01/09 10/01/29 1.75%-5.00% 805,000 $ -$ 115,000 $ 690,000 $ 115,000 $
General 3,115,000 4/18/13 4/1/33 3.00%-5.00% 2,365,000 - 150,000 2,215,000 150,000
3,170,000 - 265,000 2,905,000 265,000
Premiums 648,246 - 476,885 171,361 -
Total bonds 3,818,246 - 741,885 3,076,361 265,000
Compensated absences 1,234,573 938,402 995,584 1,177,391 235,478
Net pension liability 2,022,564 952,110 - 2,974,674 -
Net OPEB liability 4,675,104 - 61,476 4,613,628 -
Heart and Hypertension 32,025 - 16,357 15,668 15,668
Total governmental activities long-term liabilities 11,782,512 $ 1,890,512 $ 1,815,302 $ 11,857,722 $ 516,146 $

City of Groton, Connecticut Notes to Financial Statements
45
Note 7. Long-Term Obligations (Continued) Business-type activities:
Balance Balance
Original Date of Date of Interest July 1, June 30, Current
Purpose Amount Issue - Rate 2018 Additions Deductions 2019 Portion
Bonds
Electric bonds 5,640,000 $ 10/08/09 07/15/22 1.75%-5.00% 2,445,000 $ -$ 500,000 $ 1,945,000 $ 490,000 $
Electric bonds 5,800,000 10/01/09 10/01/29 1.75%-5.00% 3,480,000 - 290,000 3,190,000 290,000
Electric bonds 1,845,000 4/18/13 4/1/33 3.00%-5.00% 1,370,000 - 95,000 1,275,000 95,000
Electric bonds 4,300,000 7/9/14 10/1/27 1.00%-5.00% 3,530,000 - 405,000 3,125,000 400,000
Electric bonds 9,158,000 10/4/17 10/01/37 2.25%-5.00% 9,158,000 - 459,000 8,699,000 457,000
Electric bonds BLP 1,284,000 10/4/17 10/01/37 2.25%-5.00% 1,284,000 - 64,000 1,220,000 64,000
Telecommunication 13,875,000 4/18/13 4/1/33 3.00%-5.00% 10,385,000 - 800,000 9,585,000 850,000
Telecommunication 5,520,000 7/9/14 10/1/27 1.00%-5.00% 4,895,000 - 510,000 4,385,000 495,000
Telecommunication 3,595,000 7/9/14 10/127 1.00%-5.00% 2,290,000 - 410,000 1,880,000 395,000
38,837,000 - 3,533,000 35,304,000 3,536,000
Premiums 2,439,195 - 241,297 2,197,898 -
Total bonds 41,276,195 - 3,774,297 37,501,898 3,536,000
Note payable 2,597,200 - 200,400 2,396,800 200,400
Net pension liability 1,382,151 672,824 - 2,054,975 -
Net OPEB liability 3,689,363 - 43,443 3,645,920 -
Total electric long-term obligations 48,944,909 672,824 4,018,140 45,599,593 3,736,400
Water bonds 1,656,000 10/08/09 07/15/22 1.75%-5.00% 435,000 - 155,000 280,000 70,000
Water bonds 2,460,000 4/18/13 4/01/33 3.00%-5.00% 1,835,000 - 125,000 1,710,000 125,000
Water bonds 1,755,000 7/09/14 10/01/27 1.00%-5.00% 1,460,000 - 160,000 1,300,000 175,000
Water bonds 5,525,000 10/04/17 10/01/37 2.25%-5.00% 5,525,000 - 277,000 5,248,000 276,000
9,255,000 - 717,000 8,538,000 646,000
Premiums 650,931 - 42,025 608,906 -
Total bonds 9,905,931 - 759,025 9,146,906 646,000
Net pension liability 581,958 336,412 - 918,370 -
Net OPEB liability 1,821,720 - 21,722 1,799,998 -
DWSRF Interim Loan 39,000,000 10/4/17 5,837,360 15,066,653 - 20,904,013
Total water long-term obligations 18,146,969 15,403,065 780,747 32,769,287 646,000
Sewer 460,000 4/8/13 4/1/33 3.00%-5.00% - 335,000 25,000 310,000 25,000
Sewer Treatment 5,998,000 10/04/2017 10/01/2037 2.25%-5.00% - 5,998,000 300,000 5,698,000 298,000
- 6,333,000 325,000 6,008,000 323,000
Premiums - 459,374 21,613 437,761 -
Total bonds - 6,792,374 346,613 6,445,761 323,000
Net pension liability - 112,137 - 112,137 -
Total wastewater long-term obligations - 6,904,511 346,613 6,557,898 323,000
Total business-type long-term liabilities 67,091,878 $ 22,980,400 $ 5,145,500 $ 84,926,778 $ 4,705,400 $

City of Groton, Connecticut Notes to Financial Statements
46
Note 7. Long-Term Obligations (Continued) The bonds issued for telecommunications are taxable bonds issued by the Electric Department for Thames Valley Communications, Inc., which was wholly owned by the City of Groton. On February 1, 2013, Thames Valley Communications, Inc. was sold and the balance of the telecommunication bonds will be paid by the Electric Department. The annual requirements to amortize all bonded debt outstanding as of June 30, were as follows:
General GeneralYear Government Government Electric Electric Water Water Sewer Sewer
Ending Principal Interest Principal Interest Principal Interest Principal Interest TotalJune 30 Payments Payments Payments Payments Payments Payments Payments Payments Payments
2020 265,000 $ 109,400 $ 3,536,000 $ 1,329,445 $ 646,000 $ 325,300 $ 323,000 $ 227,650 $ 6,761,795 $ 2021 265,000 98,800 3,572,000 1,188,120 648,000 296,650 325,000 211,700 6,605,270 2022 270,000 85,838 3,598,000 1,029,555 647,000 266,200 325,000 195,450 6,417,043 2023 275,000 73,775 3,603,000 875,425 637,000 236,488 325,000 179,200 6,204,888 2024 275,000 62,325 3,134,000 727,814 556,000 208,125 325,000 162,950 5,451,214 2025-2029 915,000 190,500 12,525,000 1,947,748 2,440,000 682,695 1,605,000 582,550 20,888,493 Thereafter 640,000 50,800 5,336,000 668,822 2,964,000 375,338 2,780,000 372,912 13,187,872
2,905,000 $ 671,438 $ 35,304,000 $ 7,766,929 $ 8,538,000 $ 2,390,796 $ 6,008,000 $ 1,932,412 $ 65,516,575 $
General Fund Enterprise Funds
The General Government and Sewer Authority bonds are funded in the General Fund and paid from taxation. The Electric and Water Departments’ bonds are paid by the rate payers. Note payable: The City has a note payable to the Connecticut Municipal Electric Energy Cooperative’s (CMEEC) Rate Stabilization Fund Trust. The proceeds were loaned to the Company, a discretely presented component unit, which were used to fund upgrades to its Stockhouse Road Substation. The Company will pay back the loan directly to CMEEC with a 4.5% interest rate per annum. Payment of principal became required when construction was completed in October 2011. The loan’s principal balance is $2,396,800. The City’s Electric Utility has a corresponding note receivable at 4.5% interest, which is included in “Due From Component Units”. Statutory debt limitation: The City’s indebtedness does not exceed the legal debt limitations as required by the Statutes as reflected in the following schedule:
TotalCategory Debt Limit Indebtedness Balance
General purpose 14,109,030 $ 3,759,189 $ 10,349,841 $ Sewers 23,515,050 $ 6,018,600 $ 17,496,450 $ The total overall statutory debt limit for the City is equal to seven times annual receipts from taxation, $43,894,760.

City of Groton, Connecticut Notes to Financial Statements
47
Note 7. Long-Term Obligations (Continued) The total indebtedness reflected above includes bonds outstanding in addition to the amount of bonds authorized and unissued against which bond anticipation notes are issued and outstanding. Authorized/unissued bonds: The following is a summary of authorized/unissued bonds:
CumulativeBonded,
Bonds Rescinded BondsDescription Authorized Or Paid UnissuedImprovements:
Beach and parks 1,500,000 $ 1,085,000 $ 415,000 $ Land purchase 1,160,000 880,000 280,000 Fire department enhancement program 1,727,500 1,725,000 2,500 Public improvements 2,461,689 2,305,000 156,689 Systems:
Water 70,589,000 34,660,813 35,928,187 Electric 50,955,569 39,536,700 11,418,869 Sewer 6,309,000 6,203,000 106,000
134,702,758 $ 86,395,513 $ 48,307,245 $
Accrued liabilities, primarily compensated absences: The City accrues compensated absences as they are earned by employees if the leave is attributable to past service and it is probable that the employer will compensate the employee by cash payments at termination or retirement. The amount of this estimated obligation at June 30, 2019 is recorded in the government-wide statements since the benefits are to be funded from future financial resources and will be paid from the General Fund. Compensated absences were $1,177,391 at June 30, 2019. Heart and Hypertension: The amount recorded for heart and hypertension liability is for employees or spouses who have retired on a disability pension under state statutes relating to heart or hypertension health issues. Payments are made over a period of years based upon the settlement agreement.
Note 8. Risk Management The City is exposed to various risks of loss related to public official liability, police professional liability, theft or impairment of assets, errors and omissions, injury to or illness of employees, natural disasters, and owners and contractors protective liability. The City established as an internal service fund, the Health Insurance Fund, to account for and finance the retained risk of loss for City employee medical benefits coverage. A third party administers the plan for which the fund pays a fee, The Health Insurance Fund provides coverage for all eligible full time employees.

City of Groton, Connecticut Notes to Financial Statements
48
Note 8. Risk Management (Continued) The City has purchased a stop loss policy for individual claims exceeding $100,000. In addition, the City has established an internal service fund to reduce the cost of commercial insurance by raising the deductibles on the policies purchased. The City charges its departments premiums based on historical data. Health insurance premiums are based upon estimates by number of employees and type of coverage (single or family), trends in the insurance claims and estimates for administration. The claims liability reported in the fund, is based upon the requirements of GASB Statements No. 10, Accounting and Financial Reporting for Risk Financing and Related Insurance Issues and 30, Risk Financing Omnibus – an amendment of GASB Statement No. 10, which require that a liability for claims be reported if information prior to the issuance of the financial statements indicates that it is possible that a liability has been incurred at the date of the financial statements and the amount of the possible loss can be reasonably estimated. The amount of claim accrual is based on the ultimate costs of settling the claim, which include past experience data, inflation and other future economic and societal factors and incremental claim adjustment expenses, net of estimated subrogation recoveries. The claim accrual does not include other allocated or unallocated claims adjustment expenses.
Current YearClaims Claims and ClaimsPayable Changes in Claims PayableJuly 1 Estimates Paid June 30
2018 402,000 $ 3,773,717 $ 3,808,717 $ 367,000 $ 2019 367,000 $ 4,101,870 $ 4,152,870 $ 316,000 $ Such amounts are reported as a component of accounts payable and accrued liabilities in the statement of net position. The City currently is a member in Connecticut Interlocal Risk Management Agency (CIRMA), a public entity risk pool established for the purpose of administering an interlocal risk management program pursuant to the provisions of Section 7-479a et. seq. of the Statutes for workers’ compensation and employer liability coverage. CIRMA currently has 218 members in the workers’ compensation pool. The City pays an annual premium for its coverage. CIRMA is to be self-sustaining through members’ premiums but reinsures in excess of $750,000 for each insured occurrence. Members may be subject to supplemental assessment in the event of deficiencies; however, potential assessments are limited pursuant to the by-laws. The City purchases commercial insurance for all other risks of loss, including blanket and umbrella Polices. Settled claims have not exceeded commercial coverage in any of the past three years. There have not been any significant reductions in insurance coverage from the amounts held in prior years
Note 9. Related Party Transactions CMEEC: The Board of Directors of the Electric Department’s present wholesale electric supplier, CMEEC, consists of two representatives from each of the municipalities which created CMEEC. The representatives for the City of Groton are the Electric Department’s Director/Utility Commissioner and another member of the Utility Commission. The amount of power purchased from the wholesale supplier for the fiscal year ended June 30, 2019 is $33,771,883.

City of Groton, Connecticut Notes to Financial Statements
49
Note 9. Related Party Transactions (Continued) As part of the City’s contract with CMEEC, the members agreed to proportionally share in the benefits and detriments resulting from the changes in load from the base assumptions set forth in the contract as a single integrated participant in the New England Power Pool. Amounts are computed annually, based upon nonfuel revenues, less any direct and assigned nonfuel expenses. In March of 2003, the Board of Directors of CMEEC formed a Municipal Competitive Trust for the purpose to accumulate funds to be applied to fixed cost obligations (debt defeasance) and rate stabilization (rate support) to ensure competitive margins in rates and to mitigate any negative impacts to customers as a result of the restructuring of the electric industry in Connecticut and restructuring of power supply markets. Rate stabilization funds are held with CMEEC and are deferred revenue to be applied against future power costs unless changed by regulators. The rates and amortization of the deferred revenue are included in the rate setting policies approved by regulators. Each beneficiary (member) has an account and sub accounts within the trust, and no beneficiary shall have any interest in any account or sub account of any other beneficiary. Major taxpayers/customers: The City’s two major taxpayers account for approximately 49.97% of the October 1, 2017 Grand List. Three customers account for approximately 38.1% of the Electric Department revenues and approximately 26.8% of the Water Department revenues. Two customers account for 58.2% of the Sewer Department Revenue.
Note 10. Contingencies and Commitments Lawsuits: There are several personal injury and negligence lawsuits pending against the City. The City’s management, based upon consultation with legal counsel, estimates that potential claims against the City resulting from such litigation would not have a material adverse effect on the financial position of the City. Commitments: The City Council authorized and directed either the Chairman of the Utility Commission or Director of Utilities to execute and deliver a “Power Sales Contract for the Supply of Electric Power and Energy Cooperative”. Such a contract was entered into on December 1, 1979. The contract contains at least the following provisions:
1. Term of the contract - 50 years commencing with date executed.
2. “Participant” shall not, after the date of the contract, execute or adopt any instrument securing bonds, notes or other indebtedness payable from and secured by a lien on the net revenues derived from the ownership or operation of its electric system unless such instrument provides that any payments to be made under the contract shall be payable as operating expenses of such electric system.
The Company has a power purchase agreement with CMEEC for interruptible power to supply a major customer, Airgas Merchant Gases, Inc. The agreement, which runs through December 31, 2020, is based on customer usage. The Company has contracted with CMEEC to purchase its full requirements for electric capacity and energy from CMEEC.

City of Groton, Connecticut Notes to Financial Statements
50
Note 11. Employee Retirement Plans and Other Post-Employment Benefits Retirement Plan for the Employees of the City: Plan description: The City is the administrator of a single-employer, contributory, defined benefit plan established and administered by the City to provide pension benefits for its employees. The pension plan is considered to be part of the City’s financial reporting entity and is included in the City’s financial statements as a pension trust fund. The fund’s pooled investments may be used to pay benefits to members or beneficiaries of all employee groups. The plan does not issue a stand-alone financial report. Classes of employees covered: Based upon the actuarial valuation dated July 1, 2018, membership consisted of:
City Police Fire Utilities TotalInactive employees or beneficiaries currently
receiving benefits 39 28 15 60 142 Inactive employees entitled to, but not yet
receiving benefits 9 5 - 10 24 Active employees 49 26 15 107 197
97 59 30 177 363
Benefit provisions: The plan covers all City employees. Employees are fully vested after five (5) years of service, except police, firefighters and utilities union are vested after ten (10) years of service. If an employee leaves covered employment or dies before being vested, accumulated employee contributions and related investment earnings are refunded. Benefits and contributions are established by collective bargaining and may be amended only by the City Council. The retirement benefit is calculated based on average annual compensation multiplied by years of credited services (maximized at 32 years for police officers and at 30 years for all others). The following are the multiples for the different groups:
• 2.10% City and utility non-union excluding management and steelworkers • 2.10% for utility AFSCME – 007 and utility AFSCME – 818, AFSCME-135, CSEA 91 • 2.67% for police and firefighters with a maximum benefit of 80% • 2.30% for City and utility non-union management
Average annual compensation is the highest three consecutive years for police and firefighters, and five consecutive years for all other groups. Contributions: The City’s contributions are actuarially determined on an annual basis using the project unit credit method. Contributions from the general, electric and water funds are recognized when due. Administrative costs are generally financed through investment earnings.

City of Groton, Connecticut Notes to Financial Statements
51
Note 11. Employee Retirement Plans and Other Post-Employment Benefits (Continued) Employee contributions are required as follows:
• 5.2% of pay for City and utility non-union employees • 5.5% of pay for Other City and Utility Union employees • 5.8% of pay for Utility AFSCME007 employees • 6.0% of pay for steelworkers – CSEA 91, AFSCME-135, AFSCME-818 • 8.25% of pay for police and fire (fire for the first 30 years of service)
The City’s contributions for the current year were determined as part of the July 1, 2018 actuarial valuation. Actuarial assumptions are summarized later in this note. Assumed rate of return: The long-term expected rate of return on pension plan investments was determined using a building-block method in which best-estimate ranges of expected future real rates of return are developed. Best estimates of the real rates of return for each major asset class are included in the pension plan’s target asset allocation. Best estimates of arithmetic real rates of return for each major asset class included in the pension plan’s target asset allocation as of June 30, 2019, and the final investment return assumption, are summarized in the following table:
Pension FundsLong-Term
Target Expected RealAsset Class Allocation Rate of Return Weighting
U.S. large cap core equity 24% 4.55% 1.09%U.S. mid cap core equity 6% 5.05% 0.30%U.S. small cap core equity 6% 5.55% 0.33%Developed international equity 14% 5.55% 0.75%Emerging market international equity 7% 9.05% 0.63%Global Real Estate Investment Trusts 9% 5.95% 0.51%Intermediate taxable fixed income 29% 1.75% 0.51%High-yield taxable fixed income 4% 4.05% 0.16%Cash equivalents 2% 0.55% 0.01%
100% 4.29%Long- term inflation expectation 2.60%
Long-term expected nominal return 6.89%
Rate of return: For the year ended June 30, 2019, the annual money-weighted rate of return on pension plan investments, net of pension plan investment expense, was 6.18%. The money-weighted rate of return expresses investment performance, net of investment expense, adjusted for the changing amounts actually invested.
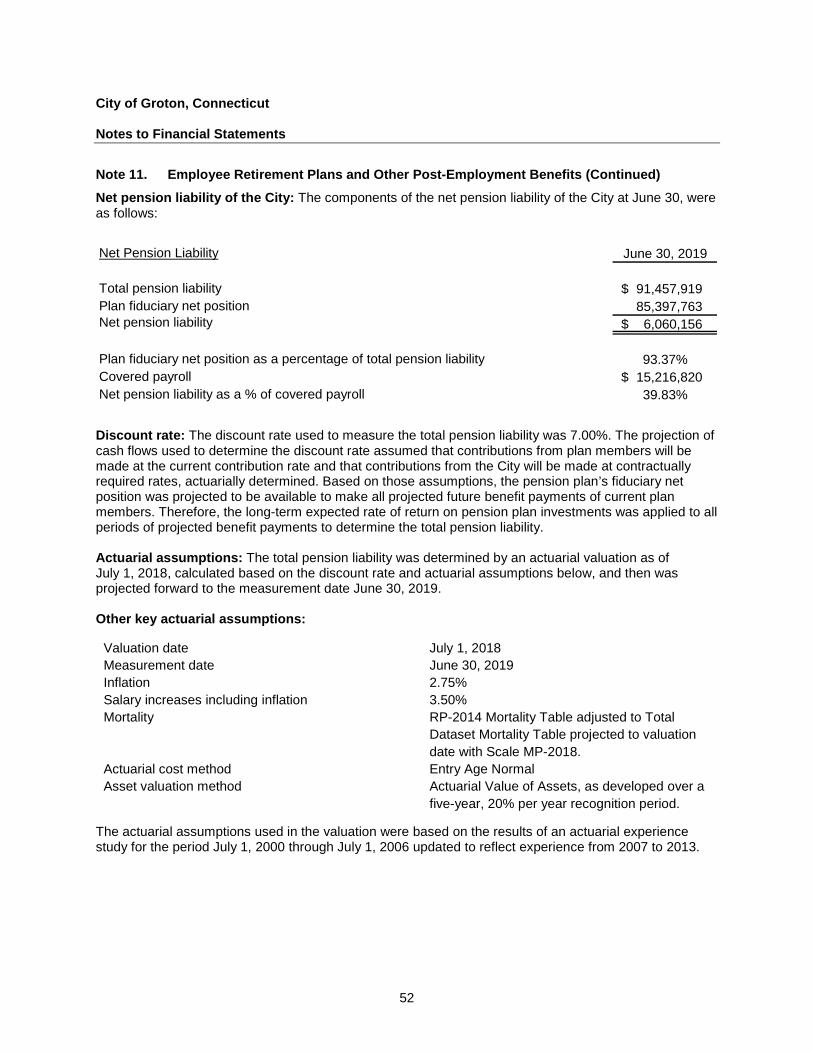
City of Groton, Connecticut Notes to Financial Statements
52
Note 11. Employee Retirement Plans and Other Post-Employment Benefits (Continued) Net pension liability of the City: The components of the net pension liability of the City at June 30, were as follows:
Net Pension Liability June 30, 2019
Total pension liability 91,457,919 $ Plan fiduciary net position 85,397,763 Net pension liability 6,060,156 $
Plan fiduciary net position as a percentage of total pension liability 93.37%Covered payroll 15,216,820 $ Net pension liability as a % of covered payroll 39.83% Discount rate: The discount rate used to measure the total pension liability was 7.00%. The projection of cash flows used to determine the discount rate assumed that contributions from plan members will be made at the current contribution rate and that contributions from the City will be made at contractually required rates, actuarially determined. Based on those assumptions, the pension plan’s fiduciary net position was projected to be available to make all projected future benefit payments of current plan members. Therefore, the long-term expected rate of return on pension plan investments was applied to all periods of projected benefit payments to determine the total pension liability. Actuarial assumptions: The total pension liability was determined by an actuarial valuation as of July 1, 2018, calculated based on the discount rate and actuarial assumptions below, and then was projected forward to the measurement date June 30, 2019. Other key actuarial assumptions:
Valuation date July 1, 2018 Measurement date June 30, 2019 Inflation 2.75% Salary increases including inflation 3.50% Mortality RP-2014 Mortality Table adjusted to Total
Dataset Mortality Table projected to valuation date with Scale MP-2018.
Actuarial cost method Entry Age Normal Asset valuation method Actuarial Value of Assets, as developed over a
five-year, 20% per year recognition period. The actuarial assumptions used in the valuation were based on the results of an actuarial experience study for the period July 1, 2000 through July 1, 2006 updated to reflect experience from 2007 to 2013.

City of Groton, Connecticut Notes to Financial Statements
53
Note 11. Employee Retirement Plans and Other Post-Employment Benefits (Continued) Sensitivity analysis: The following table presents the net pension liability (asset) of the City, calculated using the discount rate of 7.00%, as well as what the City’s net pension liability would be if it were calculated using a discount rate that is 1.% point lower (6.00%) or 1.0% higher (8.00%) than the current rate.
Current 1% Decrease Discount Rate 1% Increase
6.00% 7.00% 8.00%
Net pension liability (asset) as of June 30, 2019 16,838,230 $ 6,060,156 $ (3,003,896) $ Changes in the Net Pension Liability
Total Pension Plan Fiduciary Net PensionLiability Net Position Liability
(a) (b) (a) - (b)
Balances at June 30, 2018 86,575,627 $ 82,588,954 $ 3,986,673 $ Changes for the year:
Service cost 1,755,274 - 1,755,274 Interest 6,236,332 - 6,236,332 Differences between expected and actual
experiences (126,921) - (126,921) Change of assumptions 1,725,010 - 1,725,010 Contributions - employer - 1,625,175 (1,625,175) Contributions - members - 872,990 (872,990) Net investment income - 5,043,631 (5,043,631) Benefit payments, including refunds of
employee contributions (4,707,403) (4,707,403) - Administrative expense - (25,584) 25,584
Net changes 4,882,292 2,808,809 2,073,483 Balances at June 30, 2019 91,457,919 $ 85,397,763 $ 6,060,156 $
Increase (Decrease)
Deferred outflows and inflows: For fiscal year ended June 30, 2019, the recognized pension expense is $3,246,114. As of June 30, 2019, deferred outflows and deferred inflows of resources related to pensions are reported as follows:
Deferred Outflows Deferred Inflowsof Resources of Resources Net
Differences between expected and actual experience 412,023 $ (1,129,588) $ (717,565) $
Change of assumptions 2,348,365 - 2,348,365 Net difference between projected and actual
earnings on pension plan investments 654,203 - 654,203 3,414,591 $ (1,129,588) $ 2,285,003 $

City of Groton, Connecticut Notes to Financial Statements
54
Note 11. Employee Retirement Plans and Other Post-Employment Benefits (Continued) Amounts reported as deferred outflows of resources and deferred inflows of resources related to pensions will be recognized in pension expense as follows: Years ending June 30:
2020 1,072,482 $ 2021 109,900 2022 534,331 2023 302,073 2024 214,664 Thereafter 51,553
2,285,003 $ Other Post-Employment Benefits (OPEB): Plan description: The City administers one single-employer, defined benefit post-retirement healthcare plan, for the City’s OPEB. The plan provides medical benefits and life insurance to eligible retirees and their spouses. The Plan does not issue a separate financial report. The valuation date is July 1, 2017. The measurement date is June 30, 2019, which was based on a roll forward of the July 1, 2017 valuation. The net OPEB liability is report at the measurement date of June 30, 2019. Participant counts: Based upon the actuarial valuation dated July 1, 2017, participants consisted of:
City Police Fire Utilities Total
Retirees and beneficiaries 18 9 2 20 49 Active participants 50 24 14 89 177
68 33 16 109 226
Benefit provisions: The City plan provides for medical and life insurance benefits for all eligible City retirees. Employees are fully vested after five (5) years of service, except police and firefighters are vested after twenty-five (25) years of service. Benefits and contributions are established by contract and may be amended by union negotiations. Administration costs are financed from current operations.

City of Groton, Connecticut Notes to Financial Statements
55
Note 11. Employee Retirement Plans and Other Post-Employment Benefits (Continued) Actuarial assumptions are as follows:
Valuation date: July 1, 2017 Actuarial cost method: Entry Age Normal Cost Amortization method: 30 years, level dollar, open Asset valuation method: Fair value Actuarial assumptions:
Investment rate of return: Salary increases: Discount rate: Inflation rate:
7.0% 3.25% to 11.25% 7.0% 2.6%
Healthcare cost trend rates: 7.6% decreasing to 4.6% The actuarial assumptions used in the valuation were based on the results of an actuarial experience study for the period July 1, 2000 through July 1, 2006 updated to reflect experience from 2007 to 2013. Change in assumptions: The valuation reflects changes in the assumptions form the previous valuation.
Investment rate of return prior 7.5% to current 7.0% Inflation prior 2.75%, current 2.60% Healthcare cost trend rates – prior 7.75% to final 4.75%, current 7.6% decreasing to 4.6%
Investment policy: The OPEB plan’s policy in regard to the allocation of invested assets is established and may be amended by the Board. Plan assets are managed on a total return basis with a long-term objective of achieving and maintaining a fully funded status for the benefits provided through the OPEB plan. Rate of return: For the year ended June 30, 2019, the annual money-weighted rate of return on OPEB plan investments, net of OPEB plan investment expense, was as follows. The money-weighted rate of return expresses investment performance, net of investment expense, adjusted for the changing amounts actually invested.
OPEB Plan
Rate of return 7.0%

City of Groton, Connecticut Notes to Financial Statements
56
Note 11. Employee Retirement Plans and Other Post-Employment Benefits (Continued) Net OPEB liability: The components of the net OPEB liability at June 30, were as follows:
Net OPEB Liabilityas of June 30, 2019 OPEB Plan
Total OPEB liability 17,137,353$ Plan fiduciary net position 7,085,048 Net OPEB liability 10,052,305 Plan fiduciary net position as a percentage
of total OPEB liability 41.34%
Covered Payroll 16,733,495$ Net OPEB liability as a % of covered payroll 60.07% Changes in the Net OPEB Liability
Total OPEB Plan Fiduciary Net OPEBLiability Net Position Liability
(a) (b) (a) - (b)
Balances at June 30, 2018 16,304,081 $ 6,117,894 $ 10,186,187 $ Changes for the year:
Service cost 547,493 - 547,493 Interest 1,164,433 - 1,164,433 Differences between expected and actual
experiences (437,524) - (437,524) Contributions - employer - 967,550 (967,550) Net investment income - 440,734 (440,734) Benefit payments, including refunds of
employee contributions (441,130) (441,130) - Net changes 833,272 967,154 (133,882) Balances at June 30, 2019 17,137,353 $ 7,085,048 $ 10,052,305 $
Increase (Decrease)

City of Groton, Connecticut Notes to Financial Statements
57
Note 11. Employee Retirement Plans and Other Post-Employment Benefits (Continued) Assumed rate of return: The long-term expected rate of return on OPEB plan investments was determined by adding expected inflation to expected long-term real returns and reflecting expected volatility and correlation. Best estimates of the real rates of returns for each major asset class are included in the OPEB plan’s target asset allocation. Best estimates of arithmetic real rates of return for each major asset class included in the OPEB plan’s target asset allocation as of June 30, 2019, and the final investment return assumption, are summarized in the following table:
Long-Term Expected Real Rate
Asset Class Target Allocation of Return Weighting
U.S. Large Cap Core Equity 28.00% 4.00% 1.12%U.S. Mid Cap Core Equity 7.00% 4.60% 0.32%U.S. Small Cap Core Equity 7.00% 5.10% 0.36%Developed International Equity 13.00% 6.10% 0.79%Emerging Market International Equity 6.00% 8.30% 0.50%Global REITs 4.00% 5.20% 0.21%Intermediate Taxable Fixed Income 29.00% 1.20% 0.35%High-Yield Taxable Fixed Income 4.00% 3.50% 0.14%Cash Equivalents 2.00% -0.20% 0.00%
100.00% 3.79%Long-Term Inflation Expectation 2.60%
Long-term Expected Nominal Return 6.39%
Rate of return: For the year ended June 30, 2019, the annual money-weighted rate of return on pension plan investments, net of pension plan investment expense, was 7.01%. The money-weighted rate of return expresses investment performance, net of investment expense, adjusted for the changing amounts actually invested. Discount rate: The discount rate used to measure the total OPEB liability was 7.0%. The projection of cash flows used to determine the discount rate assumed that plan member contributions will be made at the current contribution rate and that City contributions will be made at rates equal to the difference between actuarially determined contribution rates and the member rate. Also, based on the net position of the plans and contribution policies, it was assumed the plan’s projected fiduciary net position would be sufficient to cover projected benefit payments and administrative expenses indefinitely. Therefore, the long-term expected rates of return on OPEB plan investments was applied to all periods of projected benefit payments to determine the total OPEB liability. Sensitivity of the net OPEB liability to changes in the healthcare cost trend rates: The following presents the net OPEB liability, as well as what the net OPEB liability would be if it were calculated using healthcare cost trend rates that are 1 percentage point lower or 1 percentage point higher than the current healthcare cost trend rates:
Healthcare Cost 1.0% Decrease Trend Rates 1.0% Increase
(6.6% decreasing (7.6% decreasing (8.6% decreasing to 3.6%) to 4.6%) to 5.6%)
Net OPEB liability as of June 30, 2019 8,186,830 $ 10,052,305 $ 12,296,531 $

City of Groton, Connecticut Notes to Financial Statements
58
Note 11. Employee Retirement Plans and Other Post-Employment Benefits (Continued) Sensitivity of estimates used in calculating the net OPEB liability: The following presents the net OPEB liability, calculated using the discount rate of 7.0%, as well as what the net OPEB liability would be if it were calculated using a discount rate that is 1% lower or 1% higher than the rate utilized.
Current 1% Decrease Discount Rate 1% Increase
Net OPEB Liability 6.0% 7.0% 8.0%
OPEB Plan 11,878,214$ 10,052,305$ 8,487,219$ OPEB expense and deferred outflows of resources and deferred inflows of resources related to OPEB: For the year ended June 30, 2019, the City recognized OPEB expense of $1,321,317. At June 30, 20189, the City reported deferred outflows of resources and deferred inflows of resources related to OPEB from the following sources:
Deferred Outflows Deferred Inflowsof Resources of Resources Net
Differences between expected and actual experience -$ (626,926) $ (626,926) $
Change of assumptions 959,002 - 959,002 Net difference between projected and actual
earnings on pension plan investments 44,448 - 44,448 1,003,450 $ (626,926) $ 376,524 $
Amounts reported in deferred inflows of resources related to OPEB will be recognized in OPEB expense as follows: Years ending June 30:
2020 55,758 $ 2021 55,758 2022 55,758 2023 42,442 2024 41,317 Thereafter 125,491
376,524 $

City of Groton, Connecticut Notes to Financial Statements
59
Note 11. Employee Retirement Plans and Other Post-Employment Benefits (Continued) Separate plan financial information:
TotalPension OPEB Trust Funds
Assets
Cash 3,590,171 $ 158,199 $ 3,748,370 $
Investments, at fair value:U.S. government bonds 9,655,599 - 9,655,599 Mortgage backed securities 4,151,221 - 4,151,221 Collateralized mortgage obligations 3,502,760 - 3,502,760 Fixed Income - non-profit 94,609 - 94,609 Partnerships 2,683,171 - 2,683,171 Corporate bonds 4,317,126 - 4,317,126 Foreign bonds 1,215,476 - 1,215,476 Common stocks 660,681 - 660,681 Foreign stocks 176,295 - 176,295 Mutual funds
Equities and related securities 51,911,821 4,620,324 56,532,145 Fixed income 3,378,157 2,320,504 5,698,661
Total investments 81,746,916 6,940,828 88,687,744
Accrued interest 118,654 - 118,654 Total assets 85,455,741 7,099,027 92,554,768
Liabilities
Pending purchases 57,978 13,979 71,957 Total liabilities 57,978 13,979 71,957
Net position – restricted for pensionbenefits and OPEB 85,397,763 $ 7,085,048 $ 92,482,811 $
As of June 30, 2019Schedule of Plan Net Position - Trust Funds
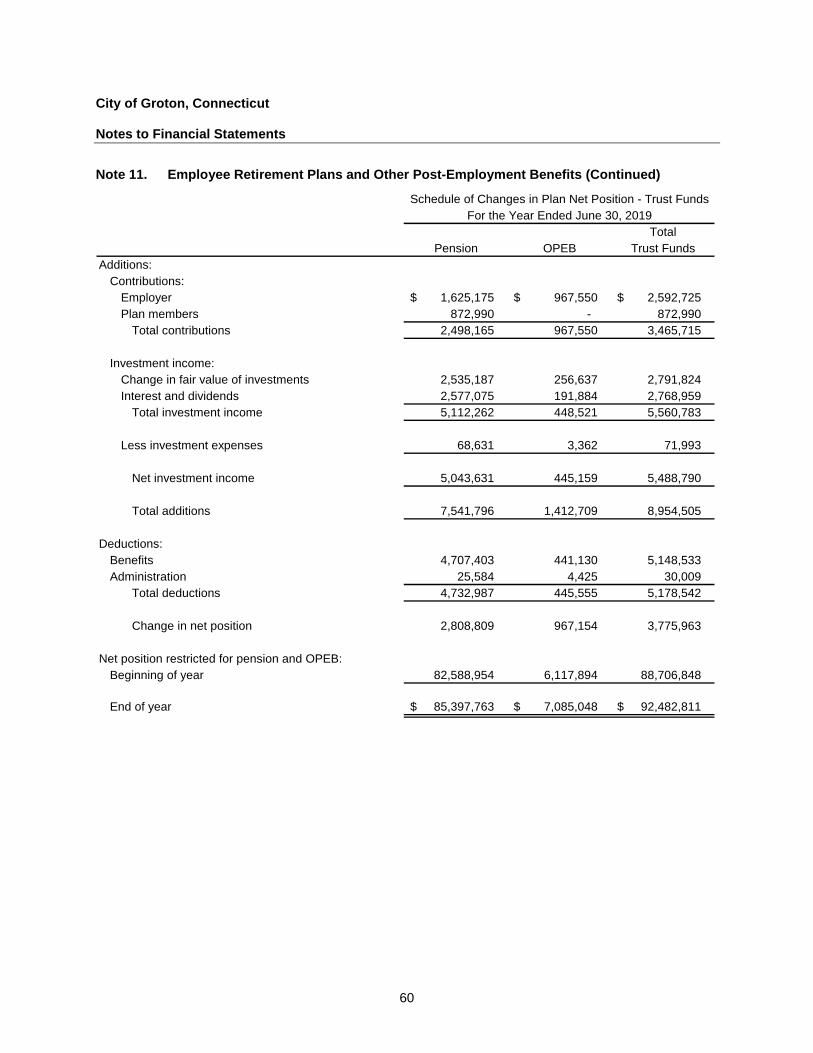
City of Groton, Connecticut Notes to Financial Statements
60
Note 11. Employee Retirement Plans and Other Post-Employment Benefits (Continued)
TotalPension OPEB Trust Funds
Additions:Contributions:
Employer 1,625,175 $ 967,550 $ 2,592,725 $ Plan members 872,990 - 872,990
Total contributions 2,498,165 967,550 3,465,715
Investment income:Change in fair value of investments 2,535,187 256,637 2,791,824 Interest and dividends 2,577,075 191,884 2,768,959
Total investment income 5,112,262 448,521 5,560,783
Less investment expenses 68,631 3,362 71,993
Net investment income 5,043,631 445,159 5,488,790
Total additions 7,541,796 1,412,709 8,954,505
Deductions:Benefits 4,707,403 441,130 5,148,533 Administration 25,584 4,425 30,009
Total deductions 4,732,987 445,555 5,178,542
Change in net position 2,808,809 967,154 3,775,963
Net position restricted for pension and OPEB:Beginning of year 82,588,954 6,117,894 88,706,848
End of year 85,397,763 $ 7,085,048 $ 92,482,811 $
Schedule of Changes in Plan Net Position - Trust FundsFor the Year Ended June 30, 2019

City of Groton, Connecticut Notes to Financial Statements
61
Note 12. Fund Balances (Deficits) The details for the City’s fund balances are the following:
Major Fund NonmajorGeneral Governmental
Fund Funds Total
Fund balances (deficits)Non-spendable:
Inventory 25,926 $ -$ 25,926 $ Total non-spendable 25,926 - 25,926
Restricted:Public safety - 69,866 69,866 Public works - 874,310 874,310 Capital outlay - 61,326 61,326
Total restricted - 1,005,502 1,005,502
Committed:General government 213,363 - 213,363 Capital outlay - 4,441,325 4,441,325
Total committed 213,363 4,441,325 4,654,688
Assigned:Subsequent years budget 800,000 - 800,000
Total assigned 800,000 - 800,000
Unassigned:General government 5,634,786 - 5,634,786 Public works - (23,653) (23,653)
Total unassigned (deficit) 5,634,786 (23,653) 5,611,133
Total fund balance 6,674,075 $ 5,423,174 $ 12,097,249 $

City of Groton, Connecticut Notes to Financial Statements
62
Note 13. Governmental Accounting Standards Board (GASB) Statements The GASB has issued several pronouncements that have effective dates that may impact future financial presentations. Management has not currently determined what, if any, impact implementation of the following statements may have on the financial statements. GASB Statement No. 84, Fiduciary Activities, is effective for reporting periods beginning after December 15, 2018. The objective of this statement is to improve guidance regarding the identification of fiduciary activities for accounting and financial reporting purposes and how those activities should be reported. GASB Statement No. 87, Leases, establishes a single model for lease accounting based on the principle that leases are financings of the right to use an underlying asset, which should result in the recognition and reporting of leased assets and the liability associated with subsequent lease payments, which have historically been classified as operating leases of the current reporting period only. The new statement requires a Lessee to recognize a lease liability and an intangible right-to-use lease asset, with the lessor required to recognize a lease receivable and a deferred inflow of resources. The requirements of this statement are effective for reporting periods beginning after December 15, 2019. GASB Statement No. 89, Accounting for Interest Cost Incurred before the End of a Construction Period. The objectives of this Statement are (1) to enhance the relevance and comparability of information about capital assets and the cost of borrowing for a reporting period and (2) to simplify accounting for interest cost incurred before the end of a construction period. The requirements of this Statement are effective for reporting periods beginning after December 15, 2019. Earlier application is encouraged. The requirements of this Statement should be applied prospectively. GASB Statement No. 90, Majority Equity Interests—an amendment of GASB Statements No. 14 and No. 61. The primary objectives of this Statement are to improve the consistency and comparability of reporting a government’s majority equity interest in a legally separate organization and to improve the relevance of financial statement information for certain component units. The requirements of this Statement are effective for reporting periods beginning after December 15, 2018. Earlier application is encouraged. GASB Statement No. 91, Conduit Debt Obligations. In May 2019, the GASB issued Statement No. 91, Conduit Debt Obligations. This Statement provides a single method of reporting conduit debt obligations by issuers and eliminates diversity in practice associated with (1) commitments extended by issuers, (2) arrangements associated with conduit debt obligations, and (3) related note disclosures. The requirements of this Statement are effective for reporting periods beginning after December 15, 2020. Earlier application is encouraged. The City is not an issuer of conduit debt, therefore this Statement will have no effect on its financial statements.

Required Supplementary Information – Unaudited


63
City of Groton, Connecticut
Required Supplementary Information - unauditedSchedule of Employer Contributions - Pension Trust FundLast Ten Fiscal Years
2019 2018 2017 2016 2015 2014 2013 2012 2011 2010
Actuarially determined contribution 1,347,400 $ 1,407,000 $ 1,117,900 $ 1,054,700 $ 1,166,100 $ 2,313,700 $ 2,026,400 $ 2,016,200 $ 1,818,700 $ 1,423,100 $
Contributions in relation to the actuariallydetermined contribution 1,625,175 1,346,461 1,147,616 1,213,572 1,479,095 1,362,750 1,726,093 1,790,134 1,779,312 1,787,483
Contribution deficiency (excess) (277,775) $ 60,539 $ (29,716) $ (158,872) $ (312,995) $ 950,950 $ 300,307 $ 226,066 $ 39,388 $ (364,383) $
Covered-employee payroll 15,216,820 $ 14,763,245 $ 14,714,020 $ 14,851,967 $ 15,356,366 $ 15,121,066 $ 15,121,066 $ 16,321,691 $ 15,891,574 $ 15,551,655 $
Contributions as a percentage of covered-employee payroll 10.68% 9.12% 7.80% 8.17% 9.63% 9.01% 11.42% 10.97% 11.20% 11.49%
Notes to ScheduleValuation date: July 1, 2018Measurement date: June 30, 2019
Actuarial cost method Entry Age NormalAmortization method Market ValueRemaining amortization period 10 yearsAsset valuation method Market ValueInflation 2.60%Salary increases 3.50Investment rate of return 7.0%Mortality RP-2014 Adjusted to 2006 Total Dataset Mortality Table, projected to the valuation date with Scale MP-2018.
Schedule of Contributions

64
City of Groton, Connecticut
Required Supplementary Information - unauditedSchedule of Investment Returns- Pension Trust FundLast Six Fiscal Years*
2019 2018 2017 2016 2015 2014
Annual money-weighted rate of return, net of investment income 6.18% 7.17% 11.08% 1.01% 1.26% 14.97%
*Note: This schedule is intended to show ten years of information. Additional information will be added as it becomes available.

65
City of Groton, Connecticut
Required Supplementary Information - unauditedSchedule of Changes in the City's Net Pension Liability and Related RatiosLast Six Fiscal Years*
Changes in Net Pension Liability (Asset) 2019 2018 2017 2016 2015 2014
Total pension liability :Interest on total pension liability 6,236,332 $ 6,099,703 $ 5,963,408 $ 5,650,092 $ 5,414,289 $ 5,201,190 $ Service cost 1,755,274 1,712,955 1,609,260 1,581,277 1,548,634 1,496,265 Differences between expected and actual experience (126,921) (1,360,984) 775,575 (260,729) (2,856) - Change of assumptions 1,725,010 25,042 614,842 1,450,755 - - Benefit payments, including refunds of
member contributions (4,707,403) (4,564,100) (4,372,215) (4,175,013) (3,978,282) (3,886,877) Changes of benefit terms - - 22,710 - 226,193 -
Net change in total pension liability 4,882,292 1,912,616 4,613,580 4,246,382 3,207,978 2,810,578
Total pension liability, beginning 86,575,627 84,663,011 80,049,431 75,803,049 72,595,071 69,784,493
Total pension liability ending (a) 91,457,919 86,575,627 84,663,011 80,049,431 75,803,049 72,595,071
Fiduciary net position:Employer contributions 1,625,175 $ 1,346,461 $ 1,147,616 $ 1,213,572 $ 1,479,095 $ 1,362,750 $ Member contributions 872,990 851,739 826,649 900,394 886,610 643,617 Net investment income 5,043,631 5,617,560 8,024,806 747,797 942,516 10,500,769 Benefit payments (4,707,403) (4,564,100) (4,372,215) (4,175,013) (3,978,282) (3,886,877) Administrative expenses (25,584) (61,445) (45,000) (48,210) (24,676) (39,131)
Net change in plan fiduciary net position 2,808,809 3,190,215 5,581,856 (1,361,460) (694,737) 8,581,128
Fiduciary net position, beginning 82,588,954 79,398,739 73,816,883 75,178,343 75,873,080 67,291,952
Fiduciary net position, ending (b) 85,397,763 82,588,954 79,398,739 73,816,883 75,178,343 75,873,080
Net pension liability (asset), ending = (a) - (b) 6,060,156 $ 3,986,673 $ 5,264,272 $ 6,232,548 $ 624,706 $ (3,278,009) $
Fiduciary net position as a % of total pension liability 93.37% 95.40% 93.78% 92.21% 99.18% 104.52%
Covered payroll 15,216,820$ 14,763,245$ 14,714,020$ 14,851,967$ 15,356,366$ 15,121,066$
Net pension liability (asset) as a % of covered payroll 39.83% 27.00% 35.78% 41.96% 4.07% -21.68%
*Note: This schedule is intended to show ten years of information. Additional information will be added as it becomes available.

66
City of Groton, Connecticut
Required Supplementary Information - unauditedSchedule of Employer Contributions - OPEB Trust FundLast Three Fiscal Years*
Schedule of Contributions - OPEB Plan 2019 2018 2017
Actuarially determined contribution 1,363,512 $ 1,362,210 $ 1,344,451 $
Contributions in relation to the actuarially determinedcontribution 967,550 1,265,889 1,221,385
Contribution deficiency (excess) 395,962 $ 96,321 $ 123,066 $
Covered-employee payroll 16,733,495 $ 16,246,112 $ 13,060,714 $
Contributions as a percentage of covered-employee payroll 5.78% 7.79% 9.35%
*Note: This schedule is intended to show ten years of information. Additional information will be added as it becomes available.
Notes to ScheduleValuation date: July 1, 2017Measurement date: June 30, 2019
Actuarial cost method Entry Age NormalAmortization method Market ValueRemaining amortization period 30 years Asset valuation method Market ValueInflation 2.60%Salary increases 3.25% to 11.25% Investment rate of return 7.0%Mortality RP-2014 Adjusted to 2006 Total Dataset Mortality Table,
projected to the valuation date with Scale MP-2018.

67
City of Groton, Connecticut
Required Supplementary Information - unauditedSchedule of Changes in the City's OPEB Liability and Related RatiosLast Three Fiscal Years*
Changes in Net OPEB Liability 2019 2018 2017
Total OPEB liability:Service cost 547,493 $ 501,305 $ 489,066 $ Change of benefit terms - (948,932) - Interest 1,164,433 1,165,580 1,099,164 Differences between expected and actual
experience (437,524) (280,105) (124,086) Changes in assumptions - 1,172,114 - Benefit payments, including refunds of member
contributions (441,130) (679,006) (625,491) Net change in total OPEB liability 833,272 930,956 838,653
Total OPEB liability, beginning 16,304,081 15,373,125 14,534,472
Total OPEB liability, ending (a) 17,137,353 16,304,081 15,373,125
Fiduciary net position:Employer contributions 967,550 1,265,889 1,221,385 Investment (loss) income net of investment
expenses 440,734 344,062 467,233 Benefit payments, including refunds of member
contributions (441,130) (679,006) (625,491) Other
Net change in plan fiduciary net position 967,154 930,945 1,063,127
Fiduciary net position, beginning 6,117,894 5,186,949 4,123,822
Fiduciary net position, ending (b) 7,085,048 6,117,894 5,186,949
Net OPEB liability, ending = (a) - (b) 10,052,305 $ 10,186,187 $ 10,186,176 $
Fiduciary net position as a % of total OPEB liability 41.34% 37.52% 33.74%
Covered payroll 16,733,495 $ 16,246,112 $ 13,060,714 $
Net OPEB liability as a % of covered payroll 60.07% 62.70% 77.99%
*Note: This schedule is intended to show ten years of information. Additional information will be added as it becomes available.
OPEB Plan

68
City of Groton, Connecticut
Required Supplementary Information - unauditedSchedule of Investment Returns - OPEB Trust FundLast Three Fiscal Years*
2019 2018 2017
Annual money-weighted rate of return, net of investment income 7.01% 6.63% 11.00%
*Note: This schedule is intended to show ten years of information. Additional information will be added as it becomes available.

69
City of Groton, Connecticut
Required Supplementary Information - UnauditedSchedule of Revenues and Expenditures - Budget and Actual -Budgetary Basis - General FundFor the Year Ended June 30, 2019(Unaudited)
ActualBudgetary Variance With
Original Final Basis Final BudgetRevenues:
Taxes 5,141,295 $ 5,141,295 $ 5,290,265 $ 148,970 $ Intergovernmental 4,634,202 4,634,202 4,650,138 15,936 Charges for services 1,642,468 1,642,468 2,005,992 363,524 Miscellaneous revenues 91,000 91,000 234,200 143,200 Investment income and other sources 5,000 5,000 39,084 34,084
Total revenues 11,513,965 11,513,965 12,219,679 705,714
Expenditures:Current:
General government 2,310,131 2,310,131 2,181,433 128,698 Public safety 8,110,415 8,110,415 7,932,962 177,453 Public works 3,090,891 3,090,891 2,894,032 196,859 Parks and recreation 1,204,462 1,204,462 1,165,922 38,540 Non-departmental 110,000 110,000 84,357 25,643 Contingency 790,000 790,000 675,000 115,000
Debt service:Bond principal 265,000 265,000 265,000 - Bond and note interest 119,206 119,206 118,706 500
Total expenditures 16,000,105 16,000,105 15,317,412 682,693
Excess (deficiency) of expenditures (4,486,140) (4,486,140) (3,097,733) 1,388,407
Other financing sources (uses):Transfers in 4,086,140 4,086,140 4,086,140 - Appropriation of fund balance 400,000 400,000 - (400,000)
Total other financing sources(uses) 4,486,140 4,486,140 4,086,140 (400,000)
Revenues and other financingsources over (under) expenditures and otherfinancing (uses) -$ -$ 988,407 988,407 $
Budgetary fund balance, beginning 5,060,583
Change in budget expenditures not recognizedfor GAAP purposes, inventories and prepaids (414,204)
Budgetary fund balance, ending 5,634,786 $
See note to required supplementary information.
General Fund
Budgeted Amounts

City of Groton, Connecticut Note to Required Supplementary Information (Unaudited)
70
Note 1. Stewardship, Compliance and Accountability Budgets and budgetary accounting: All agencies of the City submit requests for appropriations to the City’s mayor on or before the second Monday in March of each year so that a budget may be prepared. The budget is prepared for the general fund by function and activity within departments, and includes information on the past year, current year estimates, and requested appropriations for the next year.
• The proposed budget is presented to the City Council for review on the first Monday in April. The City Council may only consider the proposed budget and make recommendations. Subsequent to publication of the proposed budget on the third Monday in May, a public hearing is held to solicit comments from citizens of the City.
• Formal budgetary integration is employed as a management control device during the year. All unencumbered appropriations lapse at fiscal year-end.
• In accordance with the provisions of the charter, no funds may be transferred from one department to another without prior approval of the qualified electors at the annual City budget meeting or special City meeting. This approval is granted at the City budget meeting which authorizes Mayor and Council to make transfers which will not exceed the total budget approved.
• The City charter does not provide for additional appropriations.
• Encumbrances are recognized as a valid and proper charge against a budget appropriation in the year in which the purchase order, contract or other commitment is issued and, accordingly, encumbrances outstanding at year-end are reported in budgetary reports as expenditures in the current year. Generally, all unencumbered appropriations lapse at year-end, except those for the capital projects Funds. Appropriations for capital projects are continued until completion of applicable projects, even when projects extend more than one fiscal year.
Budget – GAAP reconciliation: A reconciliation of general fund operations presented on a budgetary basis to the amounts presented in the fund financial statements in accordance with GAAP is as follows:
Expenditures, Revenue Encumbrances, and Other and Other Financing Financing Sources Uses
Balance, budgetary basis, for year ended June 30, 2019 16,305,819 $ 15,317,412 $
Changes in reserves for encumbrances, continuedappropriations and liquidation of encumbrances - (11,886)
Balance, GAAP basis, for year ended June 30, 2019 16,305,819 $ 15,305,526 $

City of Groton, Connecticut Note to Required Supplementary Information (Continued) (Unaudited)
71
Note 1. Stewardship, Compliance and Accountability (Continued) Donor restricted endowments: The City has received an endowment for the maintenance of the U.S. Submarine Veterans of World War II memorial located at the Thames River. The amounts are reflected in net position as restricted for permanent funds. Investment income (interest only) is approved for expenditure by the City Council. Special Revenue Funds: The City does not have legally adopted annual budgets for its special revenue funds. Budgets for the various special revenue funds which are utilized to account for specific grant programs are established in accordance with the requirements of the grantor agencies. Such budgets are non-lapsing and may comprise more than one fiscal year. Capital Project Funds: Legal authorization for expenditures of the capital project funds is provided by the related bond ordinances. Capital appropriations do not lapse until completion of the applicable projects.

72
This page intentionally left blank.

Combining and Individual Fund Financial Statements and Other Schedules


General Fund The General Fund is the principal fund of the City and is used to account for all activities of the City, except those required to be accounted for in another fund. The General Fund accounts for the normal recurring activities of the City (i.e., general government, public safety, public works, health, social services, recreation, education, etc.). These activities are funded principally by property taxes, user fees and grants from other governmental funds.


73
City of Groton, Connecticut
Comparative Balance SheetsGeneral FundJune 30, 2019 and 2018
2019 2018Assets
Cash 10,957,968 $ 9,287,954 $ Receivables:
Property taxes 40,360 57,490 Intergovernmental and other 5,446 17,479
Due from other funds 8,384 62,406 Inventory of supplies, at cost 25,926 11,725
Total assets 11,038,084 $ 9,437,054 $
Liabilities
Accounts payable and accrued liabilities 317,651 $ 501,815 $ Due to other funds 4,015,751 3,213,380
Total liabilities 4,333,402 3,715,195
Deferred inflows of resources:Unavailable revenue 30,607 48,077
Fund balance:Nonspendable 25,926 11,725 Committed 213,363 201,474 Assigned 800,000 400,000 Unassigned 5,634,786 5,060,583
Total fund balance 6,674,075 5,673,782
Total liabilities, deferred inflows ofresources, and fund balance 11,038,084 $ 9,437,054 $

74
City of Groton, Connecticut
Schedule of Revenues and Other Financing Sources - Budgetary Basis - Budget and Actual -General FundFor the Year Ended June 30, 2019
ActualBudgetary Variance With
Original Final Basis Final BudgetTaxes
Current levy 5,109,795 $ 5,109,795 $ 5,262,553 $ 152,758 $ Interest on taxes 30,000 30,000 26,824 (3,176) Lien fees on taxes 1,500 1,500 888 (612)
Total taxes 5,141,295 5,141,295 5,290,265 148,970
IntergovernmentalTown of Groton:
Highway grant 2,050,863 2,050,863 2,050,863 - Police grant 2,443,079 2,443,079 2,443,079 - PILOT program 37,707 37,707 37,707 -
State of Connecticut:Civil preparedness 4,600 4,600 37,390 32,790 Town Aid Road 56,766 56,766 56,865 99 Total disabled 125 125 64 (61) Elderly property 3,214 3,214 - (3,214) Telephone access line 12,848 12,848 9,550 (3,298) Miscellaneous grants 25,000 25,000 14,620 (10,380)
Total intergovernmental revenue 4,634,202 4,634,202 4,650,138 15,936
Charges for Services and FacilitiesWater Department 40,514 40,514 40,514 - Sewer Department 13,505 13,505 13,505 -
Finance Department services:Electric Department 198,910 198,910 198,910 - Water Department 99,455 99,455 99,455 - Sewer Department 33,152 33,152 33,152 -
Human Resources Department Services:Electric Department 144,782 144,782 144,782 - Water Department 72,391 72,391 72,391 - Sewer Department 24,130 24,130 24,130 -
Building Maintenance:Electric Department 28,200 28,200 28,200 - Water Department 14,100 14,100 14,100 - Sewer Department 4,700 4,700 4,700 -
Highway Department sales 1,000 1,000 266 (734) Public beach receipts 120,000 120,000 144,463 24,463 Recreation receipts 62,000 62,000 68,738 6,738 Parks receipts 13,000 13,000 9,636 (3,364) Gravel Sales 27,000 27,000 17,326 (9,674) Recycling/Bulky Waste 11,500 11,500 9,944 (1,556) Lease of City Land - - - -
Budgeted Amounts
(Continued)
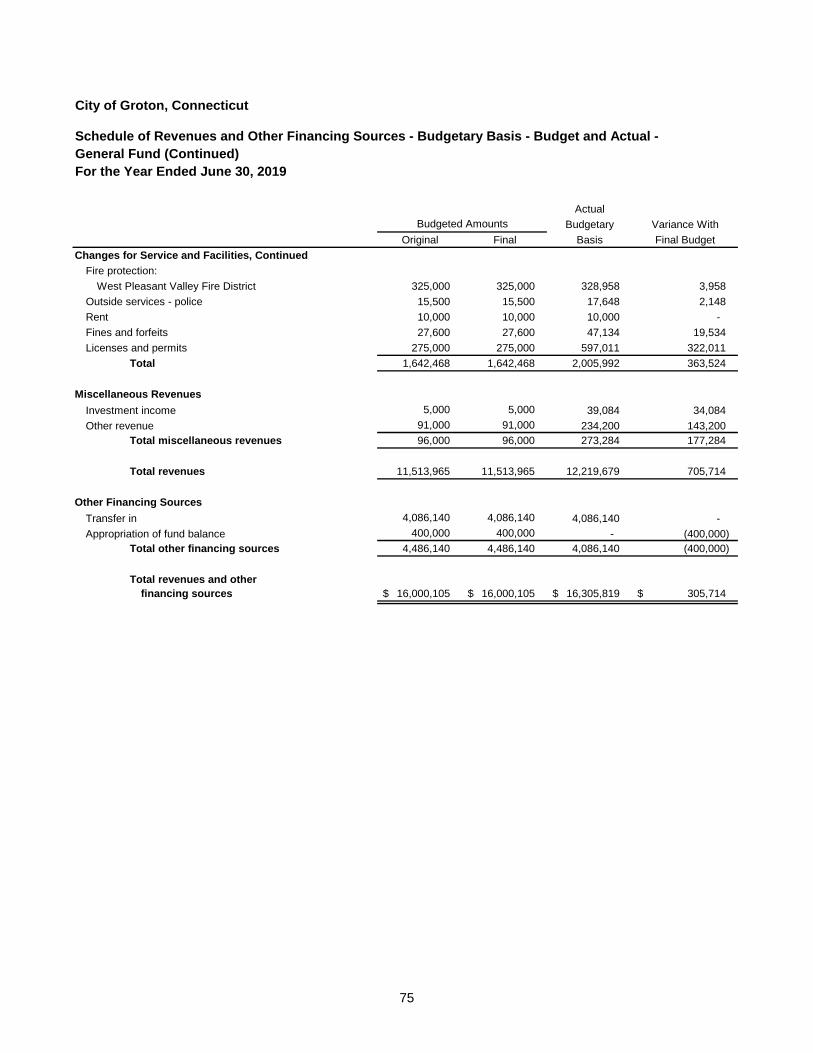
75
City of Groton, Connecticut
Schedule of Revenues and Other Financing Sources - Budgetary Basis - Budget and Actual -General Fund (Continued)For the Year Ended June 30, 2019
ActualBudgetary Variance With
Original Final Basis Final BudgetChanges for Service and Facilities, Continued
Fire protection:West Pleasant Valley Fire District 325,000 325,000 328,958 3,958
Outside services - police 15,500 15,500 17,648 2,148 Rent 10,000 10,000 10,000 - Fines and forfeits 27,600 27,600 47,134 19,534 Licenses and permits 275,000 275,000 597,011 322,011
Total 1,642,468 1,642,468 2,005,992 363,524
Miscellaneous RevenuesInvestment income 5,000 5,000 39,084 34,084 Other revenue 91,000 91,000 234,200 143,200
Total miscellaneous revenues 96,000 96,000 273,284 177,284
Total revenues 11,513,965 11,513,965 12,219,679 705,714
Other Financing SourcesTransfer in 4,086,140 4,086,140 4,086,140 - Appropriation of fund balance 400,000 400,000 - (400,000)
Total other financing sources 4,486,140 4,486,140 4,086,140 (400,000)
Total revenues and other financing sources 16,000,105 $ 16,000,105 $ 16,305,819 $ 305,714 $
Budgeted Amounts

76
City of Groton, Connecticut
Schedule of Expenditures and Other Financing Uses - Budgetary Basis -Budget and Actual - General FundFor the Year Ended June 30, 2019
ActualBudgetary Variance With
Original Final Basis Final BudgetGeneral Government
Mayor's office 416,474 $ 416,474 $ 388,205 $ 28,269 $ Human Resources 294,272 294,272 287,060 7,212 Finance Department 663,033 663,033 639,840 23,193 Building, Planning and Zoning, EDC 717,961 717,961 694,072 23,889 Municipal building operation 180,207 180,207 138,998 41,209 Civil preparedness 11,459 11,459 7,461 3,998 Unallocated 26,725 26,725 25,797 928
Total general government 2,310,131 2,310,131 2,181,433 128,698
Public SafetyPolice Department:
Supervision 225,533 225,533 231,041 (5,508) Criminal investigation 351,887 351,887 359,189 (7,302) Uniformed patrol 4,369,930 4,369,930 4,206,119 163,811 Harbor patrol 3,979 3,979 6,842 (2,863) Traffic control 18,374 18,374 25,977 (7,603) Police training 72,000 72,000 90,468 (18,468) DWI project 2,435 2,435 3,987 (1,552) Outside charges - - 14,701 (14,701)
Total police department 5,044,138 5,044,138 4,938,324 105,814
Fire Department 3,066,277 3,066,277 2,994,638 71,639
Total public safety 8,110,415 8,110,415 7,932,962 177,453
Public WorksHighway Department:
Highway maintenance 1,993,550 1,993,550 1,824,944 168,606 Sanitation 981,980 981,980 978,632 3,348 Snow removal 115,361 115,361 90,456 24,905
Total highway department 3,090,891 3,090,891 2,894,032 196,859
Total public works 3,090,891 3,090,891 2,894,032 196,859
Budgeted Amounts
(Continued)

77
City of Groton, Connecticut
Schedule of Expenditures and Other Financing Uses - Budgetary Basis -Budget and Actual - General Fund (Continued)For the Year Ended June 30, 2019
ActualBudgetary Variance With
Original Final Basis Final BudgetParks and Recreation
Supervision and general expenditures 180,179 $ 180,179 $ 191,586 $ (11,407) $ Summer recreation 172,860 172,860 182,476 (9,616) Beach activities 133,654 133,654 122,046 11,608 Winter recreation 58,500 58,500 56,355 2,145 Beach and park maintenance 659,269 659,269 613,459 45,810
Total parks and recreation 1,204,462 1,204,462 1,165,922 38,540
Non-DepartmentalGeneral insurance 90,000 90,000 84,357 5,643 Pay adjustment 20,000 20,000 - 20,000
Total non-departmental 110,000 110,000 84,357 25,643
Contingency 790,000 790,000 675,000 115,000
Debt ServiceBonded principal:
Public improvements 265,000 265,000 265,000 - Total bonded principal 265,000 265,000 265,000 -
Bond and Note Interest:Public improvements 119,206 119,206 118,706 500 Sewer Authority - - - -
Total bond and note interest 119,206 119,206 118,706 500
Total debt service 384,206 384,206 383,706 500
Total expenditures and otherfinancing uses 16,000,105 $ 16,000,105 $ 15,317,412 $ 682,693 $
Budgeted Amounts

78
City of Groton, Connecticut
Schedule of Property Taxes Levied, Collected andOutstanding - General FundFor the Year Ended June 30, 2019
Uncollected Suspense Adjusted UncollectedGrand Taxes Current Transfers and Uncollected Interest, Liens Suspense Taxes Taxes
List Year July 1, 2018 Levy Additions Deletions Adjustments Taxes Taxes and Other Fees Collected Total June 30, 2019
2017 -$ 5,254,068 $ 7,969 $ 16,453 $ 10,777 $ 5,234,807 5,204,339 $ 12,313 $ 265 $ 5,216,917 $ 30,468 $ 2016 35,129 - 1,290 2,010 2,374 32,035 25,825 8,293 5,223 39,341 6,210 2015 9,625 - 8,168 330 2,146 15,317 6,540 3,589 1,015 11,144 8,777 2014 18,560 - - 163 1,050 17,347 16,046 735 620 17,401 1,301 2013 779 - - 56 342 381 69 1,080 1,304 2,453 312 2012 397 - - - 66 331 39 165 125 329 292 2011 - - - - - - - 197 96 293 - 2010 - - - - - - - 164 121 285 - 2009 - - - - - - - 125 82 207 - 2008 - - - - - - - 305 177 482 - 2007 - - - - - - - 175 92 267 - 2006 - - - - - - - 113 51 164 - 2005 - - - - - - - 173 81 254 - 2004 - - - - - - - 199 83 282 - 2003 - - - - - - - 86 32 118 -
- Subtotal 64,490 $ 5,254,068 $ 17,427 $ 19,012 $ 16,755 $ 5,300,218 $ 5,252,858 $ 27,712 $ 9,367 $ 5,289,937 $ 47,360 $
Lawful CorrectionsCollections

Nonmajor Governmental Funds Special Revenue Funds Special revenue funds are used to account for specific revenues that are legally restricted to expenditure for particular purposes. State Aid Road This fund is used to account for State grants to maintain roads. Bridge Street This fund is used to account for Federal grants to maintain roads. Forfeiture Grant This fund is used to account for a State grant dealing with drug investigations. Miscellaneous Grants This fund is used to account for various grants and donations principally for drug awareness and drunk driving. Capital Project Funds Capital project funds are used to account for the acquisition and construction of major capital facilities other than those financed by proprietary funds and trust funds. Equipment Replacement Fund This fund is used to account for capital assets acquisition and construction from general government resources. Permanent Fund Permanent funds are used to report resources that are legally restricted to the extent that only earnings, not principal, may be used for purposes that support the reporting government’s programs. Submarine Memorial Fund This fund will be used to maintain the Wall of Honor for Submarine Veterans of World War II.


79
City of Groton, Connecticut
Combining Balance SheetNonmajor Governmental FundsJune 30, 2019
Capital PermanentProject Fund Fund
State Equipment SubmarineAid Bridge Forfeiture Miscellaneous Replacement Memorial
Road Street Grant Grants Fund Fund TotalsAssets
Cash 360,885 $ -$ 56,626 $ 579,890 $ 280,394 $ 61,326 $ 1,339,121 $ Intergovernmental receivables - - - - 164,635 - 164,635 Investments - - - - 543,175 - 543,175 Due from other funds 119,940 - 13,240 32,443 3,874,402 - 4,040,025
Total assets 480,825 $ -$ 69,866 $ 612,333 $ 4,862,606 $ 61,326 $ 6,086,956 $
Liabilities and FundBalances (Deficits)
Liabilities:Accounts payable -$ -$ -$ 115,048 $ 63,569 $ -$ 178,617 $ Due to other funds - 23,653 - 45,000 21,487 - 90,140 Unearned revenue -
performance 58,800 - - - 336,225 - 395,025 Total liabilities 58,800 23,653 - 160,048 421,281 - 663,782
Fund balances (deficits):Restricted 422,025 - 69,866 452,285 - 61,326 1,005,502 Committed - - - - 4,441,325 - 4,441,325 Unassigned (deficits) - (23,653) - - - - (23,653)
Total fund balances(deficits) 422,025 (23,653) 69,866 452,285 4,441,325 61,326 5,423,174
Total liabilities and fund balances(deficits) 480,825 $ -$ 69,866 $ 612,333 $ 4,862,606 $ 61,326 $ 6,086,956 $
Special Revenue Funds

80
City of Groton, Connecticut
Combining Statement of Revenues, Expenditures andChanges in Fund Balances (Deficits)Nonmajor Governmental FundsFor the Year Ended June 30, 2019
Capital PermanentProjects Fund Fund
State Equipment SubmarineAid Bridge Forfeiture Miscellaneous Replacement Memorial
Road Street Grant Grants Fund Fund TotalsRevenues:
Income from investments -$ -$ -$ 2,558 $ 45,065 $ 364 $ 47,987 $ Intergovernmental 56,865 - 40,634 - 81,853 - 179,352 Other - - - 60,287 213,462 2,175 275,924
Total revenues 56,865 - 40,634 62,845 340,380 2,539 503,263
Expenditures:Current:
General government - - - 21,764 - 2,175 23,939 Public safety - - 9,655 2,043 - - 11,698 Capital outlay - - - - 321,325 - 321,325
Total expenditures - - 9,655 23,807 321,325 2,175 356,962
Excess (deficiency) of expenditures 56,865 - 30,979 39,038 19,055 364 146,301
Other financing sources (uses):Operating transfer in - - - - 740,323 - 740,323 Operating transfer out - - - (15,000) (664,928) - (679,928)
- - - (15,000) 75,395 - 60,395
Net change in fund balances (deficits) 56,865 - 30,979 24,038 94,450 364 206,696
Fund balances (deficits), beginning 365,160 (23,653) 38,887 428,247 4,346,875 60,962 5,216,478
Fund balances (deficits), ending 422,025 $ (23,653) $ 69,866 $ 452,285 $ 4,441,325 $ 61,326 $ 5,423,174 $
Special Revenue Funds

Nonmajor Enterprise Fund
Enterprise funds are maintained to account for the City’s ongoing organizations and activities that are similar to those found in the private sector. The City’s nonmajor enterprise fund is: Sewer Department – Accounts for the operations of the City’s sewer system.

81
City of Groton, Connecticut
Statement of Net Position - Sewer Department - Nonmajor Enterprise FundJune 30, 2019
2019Assets
Current assets:Cash 669,453 $ Receivables (net of allowance for uncollectibles of $0
and $0 respectively) 310,183 Due from other funds 1,052,694 Prepaid expenses 10,254
Total current assets 2,042,584
Noncurrent assets:Net OPEB asset 7,241
Capital assets (net of accumulated depreciation):Land and land rights 632,454 Construction in progress 27,103 Buildings and improvements 6,624,286 Plant and pumping stations 287,463 Machinery and equipment 19,254 Vehicles 138,220
Total capital assets (net of accumulated depreciation) 7,728,780
Total noncurrent assets 7,728,780
Total assets 9,778,605 $
Deferred outflows of resources:Deferred pension amounts 184,667 $ Deferred OPEB amounts 54,268
Total deferred outflows of resources 238,935
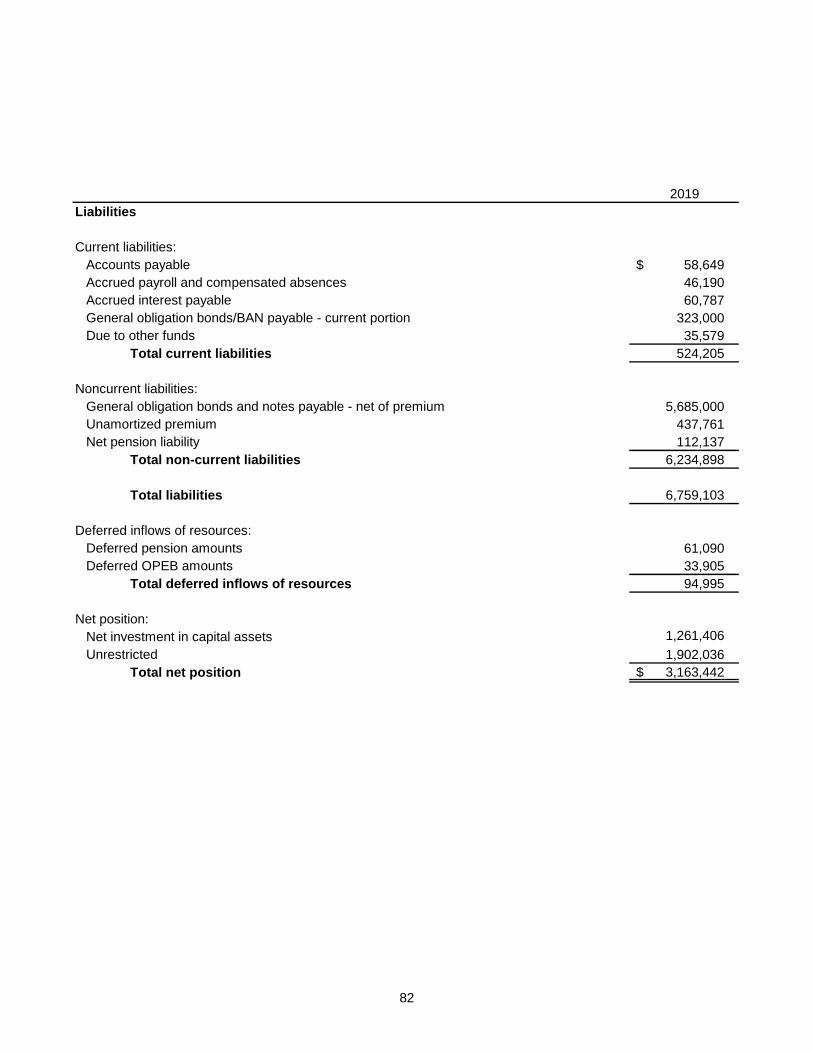
82
2019Liabilities
Current liabilities:Accounts payable 58,649 $ Accrued payroll and compensated absences 46,190 Accrued interest payable 60,787 General obligation bonds/BAN payable - current portion 323,000 Due to other funds 35,579
Total current liabilities 524,205
Noncurrent liabilities:General obligation bonds and notes payable - net of premium 5,685,000 Unamortized premium 437,761 Net pension liability 112,137
Total non-current liabilities 6,234,898
Total liabilities 6,759,103
Deferred inflows of resources:Deferred pension amounts 61,090 Deferred OPEB amounts 33,905
Total deferred inflows of resources 94,995
Net position:Net investment in capital assets 1,261,406 Unrestricted 1,902,036
Total net position 3,163,442 $
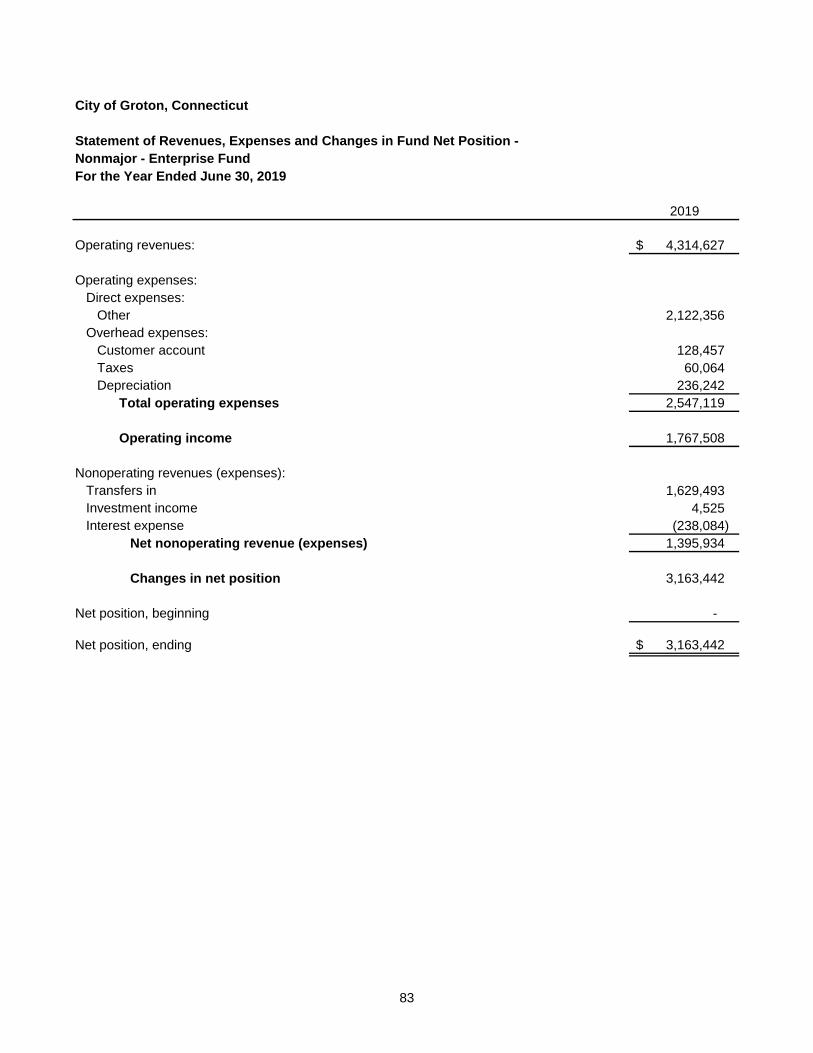
83
City of Groton, Connecticut
Statement of Revenues, Expenses and Changes in Fund Net Position -Nonmajor - Enterprise FundFor the Year Ended June 30, 2019
2019
Operating revenues: 4,314,627 $
Operating expenses:Direct expenses:
Other 2,122,356 Overhead expenses:
Customer account 128,457 Taxes 60,064 Depreciation 236,242
Total operating expenses 2,547,119
Operating income 1,767,508
Nonoperating revenues (expenses):Transfers in 1,629,493 Investment income 4,525 Interest expense (238,084)
Net nonoperating revenue (expenses) 1,395,934
Changes in net position 3,163,442
Net position, beginning -
Net position, ending 3,163,442 $
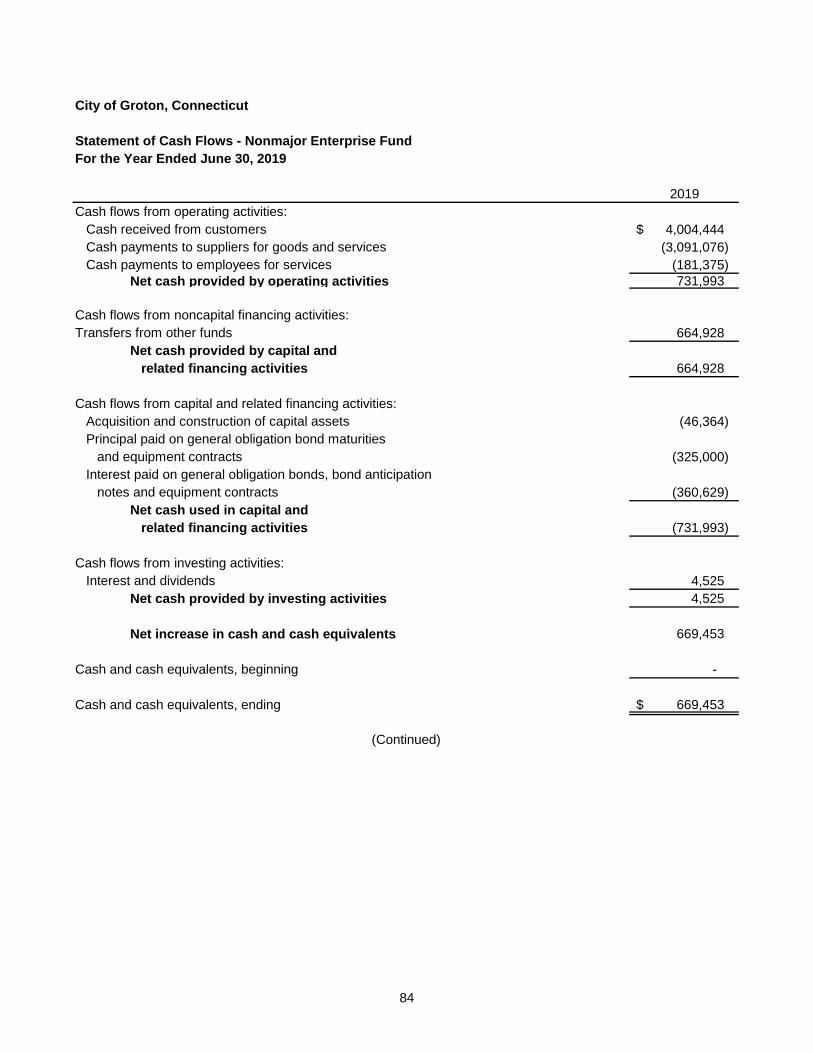
84
City of Groton, Connecticut
Statement of Cash Flows - Nonmajor Enterprise FundFor the Year Ended June 30, 2019
2019Cash flows from operating activities:
Cash received from customers 4,004,444 $ Cash payments to suppliers for goods and services (3,091,076) Cash payments to employees for services (181,375)
Net cash provided by operating activities 731,993
Cash flows from noncapital financing activities:Transfers from other funds 664,928
Net cash provided by capital and related financing activities 664,928
Cash flows from capital and related financing activities:Acquisition and construction of capital assets (46,364) Principal paid on general obligation bond maturities
and equipment contracts (325,000) Interest paid on general obligation bonds, bond anticipation
notes and equipment contracts (360,629) Net cash used in capital and
related financing activities (731,993)
Cash flows from investing activities:Interest and dividends 4,525
Net cash provided by investing activities 4,525
Net increase in cash and cash equivalents 669,453
Cash and cash equivalents, beginning -
Cash and cash equivalents, ending 669,453 $
(Continued)

85
City of Groton, Connecticut
Statement of Cash Flows - Nonmajor Enterprise FundFor the Year Ended June 30, 2019
2019Reconciliation of operating income to net cash provided by
operating activities:Operating income 1,767,508 $ Adjustments to reconcile operating income to net cash
provided by operating activities:Depreciation 236,242 Change in assets and liabilities:
(Increase) decrease in:Accounts receivable (310,183) Prepaid expenses (10,254) Due from other funds (1,052,694) Deferred outflows/inflows related to pension/OPEB (143,940)
Increase (decrease) in:Accounts payable 58,649 Accrued payroll and compensated absences 46,190 Due to other funds 35,579 Net pension liability 112,137 Net OPEB asset (7,241)
Net cash provided by operating activities 731,993 $
Schedule of non-cash capital and related financing activities:
Contributions of capital assets 7,918,656 $ Transfer of long-term debt, related premium and accrued interest (6,954,093) $

Enterprise Funds Enterprise Funds are used to account for operations that are financed and operated in a manner similar to private business enterprises – where the intent of the City’s Council is that the costs of providing goods or services to the general public on a continuing basis be financed or recovered primarily through user charges; or where the City’s council has decided that periodic determination of net income is appropriate for accountability purposes. Electric Department This fund is used to account for the activities of the City’s electric system. Water System This fund is used to account for the activities of the City’s water system.


86
This page intentionally left blank.

87
City of Groton, Connecticut
Comparative Statements of Net Position - Electric Department - Enterprise FundsJune 30, 2019 and 2018
2019 2018Assets
Current assets:Cash 19,016,098 $ 21,690,983 $ Receivables:
Use charges (net of allowance for uncollectibles of $75,000and $75,000, respectively) 3,873,938 4,465,408
Accrued utility revenue 1,166,954 1,166,954 Due from other funds 920,045 - Prepaid expenses 111,084 138,138 Inventory 1,361,061 1,479,658
Total current assets 26,449,180 28,941,141
Noncurrent assets:Amount held at CMEEC 14,033,178 13,579,956 Equity in joint venture investments 5,957,317 5,986,483 Due from component unit 3,628,749 3,919,128
Total noncurrent assets 23,619,244 23,485,567
Capital assets (net of accumulated depreciation):Land and land rights 704,844 704,844 Construction in progress 2,044,971 1,947,317 Buildings and improvements 372,994 208,309 Station equipment 8,158,723 8,442,272 Electric distribution system 20,867,081 20,508,488 Machinery and equipment 1,068,743 1,005,565 Vehicles 520,404 531,103
Total capital assets (net of accumulated depreciation) 33,737,760 33,347,898
Total noncurrent assets 57,357,004 56,833,465
Total assets 83,806,184 $ 85,774,606 $
Deferred outflows of resources:Deferred pension amounts 1,108,000 $ 1,080,161 $ Deferred OPEB amounts 325,609 387,885 Deferred amount on bond refunding 562,501 674,576
Total deferred outflows of resources 1,996,110 2,142,622

88
2019 2018Liabilities
Current liabilities:Accounts payable 5,108,035 $ 5,478,740 $ Accrued payroll and compensated absences 360,151 388,337 Accrued taxes 374,929 364,880 Accrued interest payable 428,644 673,982 General obligation bonds/BAN payable - current portion 3,736,400 3,733,400 Customer deposits payable 3,087,868 2,663,126 Due to other funds 1,058,011 2,262,434
Total current liabilities 14,154,038 15,564,899
Noncurrent liabilities:Rate stabilization 12,874,668 12,814,398 General obligation bonds and notes payable - net of
premium and deferred amount on refunding 33,964,400 37,700,800 Unamortized premium 2,197,896 2,439,193 Unearned revenue - 279,453 Net pension liability 2,054,975 1,382,151 Net OPEB liability 3,645,920 3,689,363
Total non-current liabilities 54,737,859 58,305,358
Total liabilities 68,891,897 73,870,257
Deferred inflows of resources:Deferred OPEB amounts 203,431 88,282 Deferred pension amounts 366,540 444,861
Total deferred inflows of resources 569,971 533,143
Net investment in capital assets 17,247,934 15,913,847 Unrestricted (deficit) (907,508) (2,400,019)
Total net position 16,340,426 $ 13,513,828 $

89
City of Groton, Connecticut
Comparative Statements of Revenues, Expenses and Changes in Fund Net Position -Electric Department - Enterprise FundFor the Years Ended June 30, 2019 and 2018
2019 2018
Operating revenues: 56,303,526 $ 56,323,195 $
Operating expenses:Direct expenses:
Purchased power 33,771,883 33,122,248 Other 3,266,471 3,325,621
Overhead expenses:Customer account 1,925,074 1,691,224 Administrative and general 5,875,406 5,403,799 Taxes 1,787,472 1,663,264 Depreciation 1,938,727 1,948,844
Total operating expenses 48,565,033 47,155,000
Operating income 7,738,493 9,168,195
Nonoperating revenues (expenses):Investment income 447,911 463,699 Interest expense (1,259,500) (1,258,320) Equity losses in investments (29,166) (104,242)
Total nonoperating revenues (expenses) (840,755) (898,863)
Income before transfers out 6,897,738 8,269,332
Transfers out (4,071,140) (4,071,162) Changes in net position 2,826,598 4,198,170
Net position, beginning 13,513,828 9,315,658
Net position, ending 16,340,426 $ 13,513,828 $

90
City of Groton, Connecticut
Comparative Statements of Cash Flows - Electric Department - Enterprise FundFor the Years Ended June 30, 2019 and 2018
2019 2018Cash flows from operating activities:
Cash received from customers 57,100,555 $ 59,116,361 $ Cash payments to suppliers for goods and services (39,387,876) (38,379,710) Cash payments to employees for services (8,905,443) (8,408,022)
Net cash provided by operating activities 8,807,236 12,328,629
Cash flows from noncapital and related financing activities:Transfers to other funds (4,071,140) (4,071,162) Amount held at CMEEC (453,222) (4,980,275)
Net cash used in noncapital and related (4,524,362) (9,051,437)
Cash flows from capital and related financing activities:Acquisition and construction of capital assets (2,328,589) (1,694,653) Payments Bozrah Light and Power 290,379 16,556 Repayment from CMEEC loan (200,400) (200,400) Principal paid on general obligation bond maturities
and equipment contracts (3,533,000) (8,525,864) Interest paid on general obligation bonds, bond anticipation notes
and equipment contracts (1,634,060) (1,074,094) Debt proceeds - 10,442,000
Net cash used in capital andrelated financing activities (7,405,670) (1,036,455)
Cash flows from investing activities:Interest and dividends on investments 447,911 463,699
Net cash provided by investing activities 447,911 463,699
Net (decrease) increase in cash and cash equivalents (2,674,885) 2,704,436
Cash and cash equivalents, beginning 21,690,983 18,986,547
Cash and cash equivalents, ending 19,016,098 $ 21,690,983 $
Schedule of noncash, noncapital and related financing activities:Equity earnings/loss in joint venture investments (29,166) $ (104,242) $
(Continued)
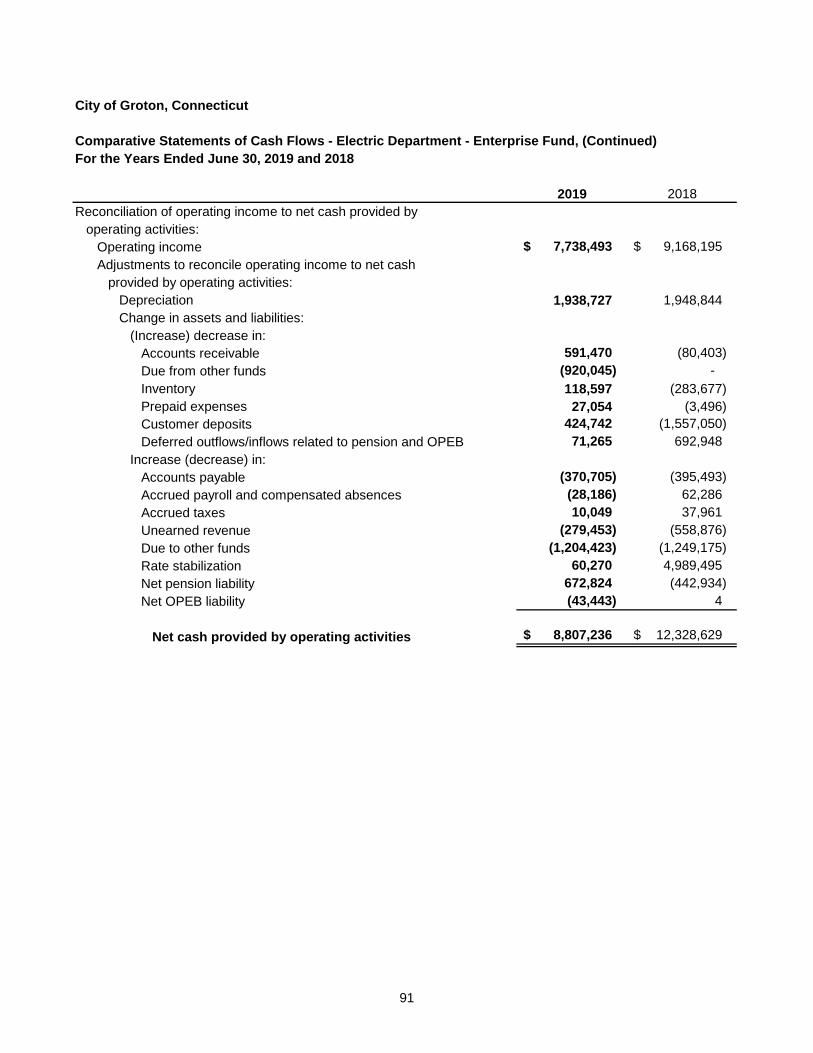
91
City of Groton, Connecticut
Comparative Statements of Cash Flows - Electric Department - Enterprise Fund, (Continued)For the Years Ended June 30, 2019 and 2018
2019 2018Reconciliation of operating income to net cash provided by
operating activities:Operating income 7,738,493 $ 9,168,195 $ Adjustments to reconcile operating income to net cash
provided by operating activities:Depreciation 1,938,727 1,948,844 Change in assets and liabilities:
(Increase) decrease in:Accounts receivable 591,470 (80,403) Due from other funds (920,045) - Inventory 118,597 (283,677) Prepaid expenses 27,054 (3,496) Customer deposits 424,742 (1,557,050) Deferred outflows/inflows related to pension and OPEB 71,265 692,948
Increase (decrease) in:Accounts payable (370,705) (395,493) Accrued payroll and compensated absences (28,186) 62,286 Accrued taxes 10,049 37,961 Unearned revenue (279,453) (558,876) Due to other funds (1,204,423) (1,249,175) Rate stabilization 60,270 4,989,495 Net pension liability 672,824 (442,934) Net OPEB liability (43,443) 4
Net cash provided by operating activities 8,807,236 $ 12,328,629 $

92
City of Groton, Connecticut
Comparative Schedules of RevenuesElectric DepartmentFor the Years Ended June 30, 2019 and 2018
2019 2018Electric service revenues:
Residential 16,273,498 $ 15,754,423 $ Commercial 14,329,718 14,182,560 Industrial 24,569,321 23,397,560 Private street lighting 225,524 222,784 Public street lighting 327,558 319,593
Total electric service revenues 55,725,619 53,876,920
Other electric revenue:Miscellaneous - rents, scrap, jobbing sales, etc. 577,907 2,446,275
Total operating revenues 56,303,526 $ 56,323,195 $

93
City of Groton, Connecticut
Comparative Schedules of Expenses -Electric DepartmentFor the Years Ended June 30, 2019 and 2018
2019 2018Direct expenses:
Purchased power 33,771,883 $ 33,122,248 $
Other expenses:Transmission expenses:
Station expenses 36,190 $ 42,144 $ Maintenance:
Station equipment 55,544 49,953 Overhead conductors and devices 11,957 6,050
Total transmission expenses 103,691 98,147
Distribution expenses:Supervision and engineering 589,000 586,868 Station expenses 71,864 45,624 Line expenses 82,953 95,945 Street lighting and signal system expenses 40,598 60,704 Meter expenses 114,284 93,059 Customer installation expenses 27,653 56,117 Miscellaneous - 67,458
Maintenance:Supervision and engineering 172,661 150,171 Station expenses 659,659 603,939 Overhead lines 1,038,363 1,166,782 Services 190,518 73,576 Underground lines 9,829 3,739 Line transformers 1,241 2,637 Signal lights and fire alarms 43,645 121,548 Meters 120,512 99,307
Total distribution expenses 3,162,780 3,227,474
Total other expenses 3,266,471 $ 3,325,621 $
Customer account expenses:Meter reading 218,722 $ 162,201 $ Customer records and collection 464,066 493,781 Uncollectible accounts - 113,104 Miscellaneous 1,242,286 922,138
Total customer account expenses 1,925,074 $ 1,691,224 $
Administrative and general expenses:Administrative and general salaries 1,154,406 $ 1,279,356 $ General office supplies and expenses 251,537 315,846 Outside services employed 694,254 729,264 Injuries and damages 538,847 500,160 Employee welfare and benefits 2,827,811 2,315,166 Miscellaneous general expenses 158,909 178,412 Rent 81,029 111,492 Maintenance:
General plant 779,035 724,514 Miscellaneous 330,686 258,310
6,816,514 6,412,520 Deduct: expenses transferred for transportation and administrative (941,108) (1,008,721)
Total administrative and general expenses 5,875,406 $ 5,403,799 $

94
This page intentionally left blank.

95
City of Groton, Connecticut
Comparative Statements of Net Position - Water Department - Enterprise FundsJune 30, 2019 and 2018
2019 2018Assets
Current assets:Cash 10,536,052 $ 9,463,866 $ Receivables (net of allowance for uncollectibles of $2,453
and $2,453, respectively) 771,360 855,519 Due from other funds 3,568 2,261,914 Prepaid expenses 134,226 164,337 Inventory 197,950 203,270
Total current assets 11,643,156 12,948,906
Capital assets (net of accumulated depreciation):Land and land rights 2,135,643 2,135,643 Construction in progress 38,341,216 14,794,711 Buildings and improvements 3,227,161 3,324,102 Plant and pumping stations 3,332,714 3,520,861 Water distribution system 19,107,324 17,952,560 Machinery and equipment 560,442 523,675 Vehicles 250,717 220,976
Total capital assets (net of accumulated depreciation) 66,955,217 42,472,528
Total noncurrent assets 66,955,217 42,472,528
Total assets 78,598,373 $ 55,421,434 $
Deferred outflows of resources:Deferred pension amounts 554,000 454,805 Deferred OPEB amounts 162,805 163,320 Deferred amounts on bond refunding 83,695 93,840
Total deferred outflows of resources 800,500 711,965

96
2019 2018Liabilities
Current liabilities:Accounts payable 3,479,746 $ 2,546,221 $ Accrued payroll and compensated absences 291,018 288,238 Accrued taxes 33,847 38,349 Accrued interest payable 408,801 262,163 General obligation bonds/BAN payable - current portion 646,000 717,000 Customer deposits payable - 115,146 Due to other funds 920,045 -
Total current liabilities 5,779,457 3,967,117
Noncurrent liabilities:General obligation bonds and notes payable - net of premium 28,796,013 14,375,360 Unamortized premium 608,906 650,931 Net pension liability 918,370 581,958 Net OPEB liability 1,799,998 1,821,720
Total non-current liabilities 32,123,287 17,429,969
Total liabilities 37,902,744 21,397,086
Deferred inflows of resources:Deferred pension amounts 183,270 187,310 Deferred OPEB amounts 101,716 37,171
Total deferred inflows of resources 284,986 224,481
Net position:Net investment in capital assets 38,093,304 28,135,249 Unrestricted 3,117,839 6,376,583
Total net position 41,211,143 $ 34,511,832 $
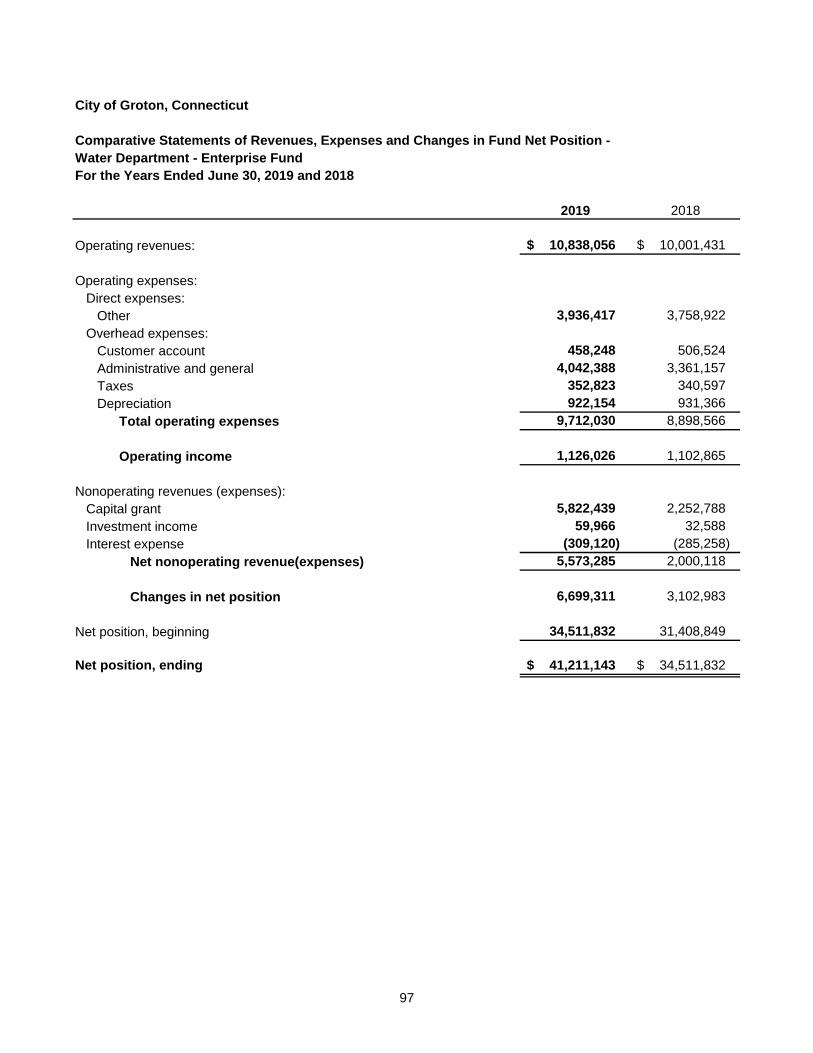
97
City of Groton, Connecticut
Comparative Statements of Revenues, Expenses and Changes in Fund Net Position -Water Department - Enterprise FundFor the Years Ended June 30, 2019 and 2018
2019 2018
Operating revenues: 10,838,056 $ 10,001,431 $
Operating expenses:Direct expenses:
Other 3,936,417 3,758,922 Overhead expenses:
Customer account 458,248 506,524 Administrative and general 4,042,388 3,361,157 Taxes 352,823 340,597 Depreciation 922,154 931,366
Total operating expenses 9,712,030 8,898,566
Operating income 1,126,026 1,102,865
Nonoperating revenues (expenses):Capital grant 5,822,439 2,252,788 Investment income 59,966 32,588 Interest expense (309,120) (285,258)
Net nonoperating revenue(expenses) 5,573,285 2,000,118
Changes in net position 6,699,311 3,102,983
Net position, beginning 34,511,832 31,408,849
Net position, ending 41,211,143 $ 34,511,832 $

98
City of Groton, Connecticut
Comparative Statements of Cash Flows - Water Department - Enterprise FundFor the Years Ended June 30, 2019 and 2018
2019 2018Cash flows from operating activities:
Cash received from customers 10,922,215 $ 10,020,969 $ Cash payments to suppliers for goods and services (828,763) (2,445,802) Cash payments to employees for services (3,654,119) (4,083,047)
Net cash provided by operating activities 6,439,333 3,492,120
Cash flows from capital and related financing activities:Acquisition and construction of capital assets (25,404,843) (8,682,871) Capital grants 5,822,439 2,252,788 Principal paid on general obligation bond maturities
and equipment contracts (717,000) (2,664,319) Interest paid on general obligation bonds, bond anticipation
notes and equipment contracts (194,362) (119,248) Debt proceeds 15,066,653 11,362,360
Net cash (used in) capital and related financing activities (5,427,113) 2,148,710
Cash flows from investing activities:Interest and dividends 59,966 32,588
Net cash provided by investing activities 59,966 32,588
Net increase in cash and cash equivalents 1,072,186 5,673,418
Cash and cash equivalents, beginning 9,463,866 3,790,448
Cash and cash equivalents, ending 10,536,052 $ 9,463,866 $
(Continued)

99
City of Groton, Connecticut
Comparative Statements of Cash Flows - Water Department - Enterprise Fund (Continued)For the Years Ended June 30, 2019 and 2018
2019 2018Reconciliation of operating income to net cash provided by
operating activities:Operating income 1,126,026 $ 1,102,865 $ Adjustments to reconcile operating income to net cash
provided by operating activities:Depreciation 922,154 931,366 Change in assets and liabilities:
(Increase) decrease in:Accounts receivable 84,159 19,538 Inventory 5,320 (28,054) Prepaid expenses 30,111 (39,369) Due from other funds 2,258,346 1,244,733 Deferred outflows/inflows related to pension/OPEB (38,175) 291,753
Increase (decrease) in:Accounts payable 813,877 135,810 Due to other funds 920,045 - Accrued payroll and compensated absences 2,780 19,975 Accrued taxesNet pension liability 336,412 (186,499) Net OPEB obligation (21,722) 2
Net cash provided by operating activities 6,439,333 $ 3,492,120 $

100
City of Groton, Connecticut
Comparative Schedules of RevenuesWater SystemFor the Years Ended June 30, 2019 and 2018
2019 2018Water service revenues:
Residential 3,094,718 $ 2,890,505 $ Commercial 1,661,646 1,650,760 Industrial 3,146,049 2,699,226 Private fire protection 105,721 107,040 Public fire protection 286,403 286,403 Other sales to public authorities 2,056,983 1,906,384
Total water service revenues 10,351,520 9,540,318
Other water revenue:Miscellaneous - rents, lien fees, scrap sales, etc. 486,536 461,113
Total operating revenues 10,838,056 $ 10,001,431 $
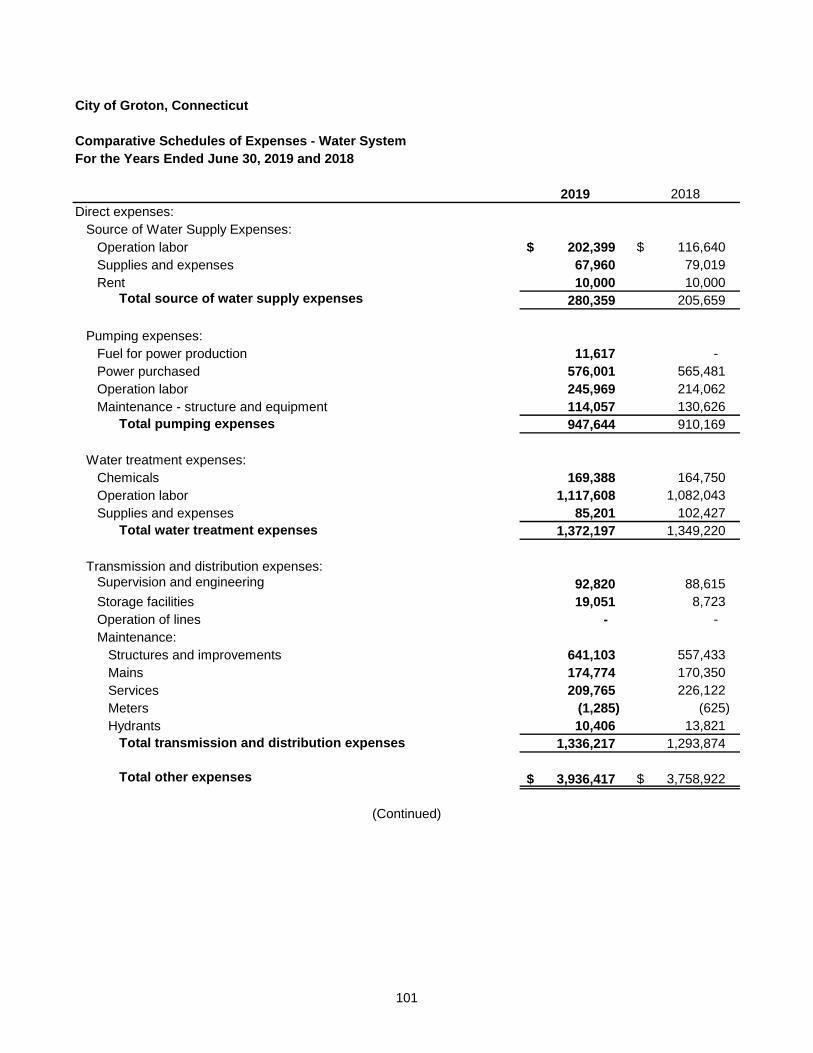
101
City of Groton, Connecticut
Comparative Schedules of Expenses - Water SystemFor the Years Ended June 30, 2019 and 2018
2019 2018Direct expenses:
Source of Water Supply Expenses:Operation labor 202,399 $ 116,640 $ Supplies and expenses 67,960 79,019 Rent 10,000 10,000
Total source of water supply expenses 280,359 205,659
Pumping expenses:Fuel for power production 11,617 - Power purchased 576,001 565,481 Operation labor 245,969 214,062 Maintenance - structure and equipment 114,057 130,626
Total pumping expenses 947,644 910,169
Water treatment expenses: Chemicals 169,388 164,750 Operation labor 1,117,608 1,082,043 Supplies and expenses 85,201 102,427
Total water treatment expenses 1,372,197 1,349,220
Transmission and distribution expenses:Supervision and engineering 92,820 88,615 Storage facilities 19,051 8,723 Operation of lines - - Maintenance:
Structures and improvements 641,103 557,433 Mains 174,774 170,350 Services 209,765 226,122 Meters (1,285) (625) Hydrants 10,406 13,821
Total transmission and distribution expenses 1,336,217 1,293,874
Total other expenses 3,936,417 $ 3,758,922 $
(Continued)

102
City of Groton, Connecticut
Comparative Schedules of Expenses - Water System (Continued)For the Years Ended June 30, 2019 and 2018
2019 2018Customer account expenses:
Meter reading 69,258 $ 78,713 $ Customer records and collection 155,279 178,092 Uncollectible accounts 160 2,894 Miscellaneous 233,551 246,825
Total customer account expenses 458,248 $ 506,524 $
Administrative and general expenses:Administrative and general salaries 933,756 $ 902,293 $ General office supplies and expenses 135,636 183,862 Outside services employed 140,843 79,197 Insurance 124,656 93,794 Injuries and damages 492,584 347,797 Employee welfare and benefits 1,576,173 1,372,301 Miscellaneous general expenses 330,436 70,786 Rent 40,514 23,556 Maintenance:
Office furniture and equipment 8,838 7,257 Communication equipment 992 537 Miscellaneous general property 257,960 279,777
Total administrative and general expenses 4,042,388 $ 3,361,157 $

103
This page intentionally left blank.

Internal Service Funds Internal Service Funds are used to account for the financing of goods and services provided by one department or agency of the City to other departments or agencies of the City and to other government units, on a cost reimbursement basis. Self-Insurance This fund is used to account for losses arising from property and general liability claims. Health Plan This fund is used to account for losses arising from medical claims of the City’s employees.

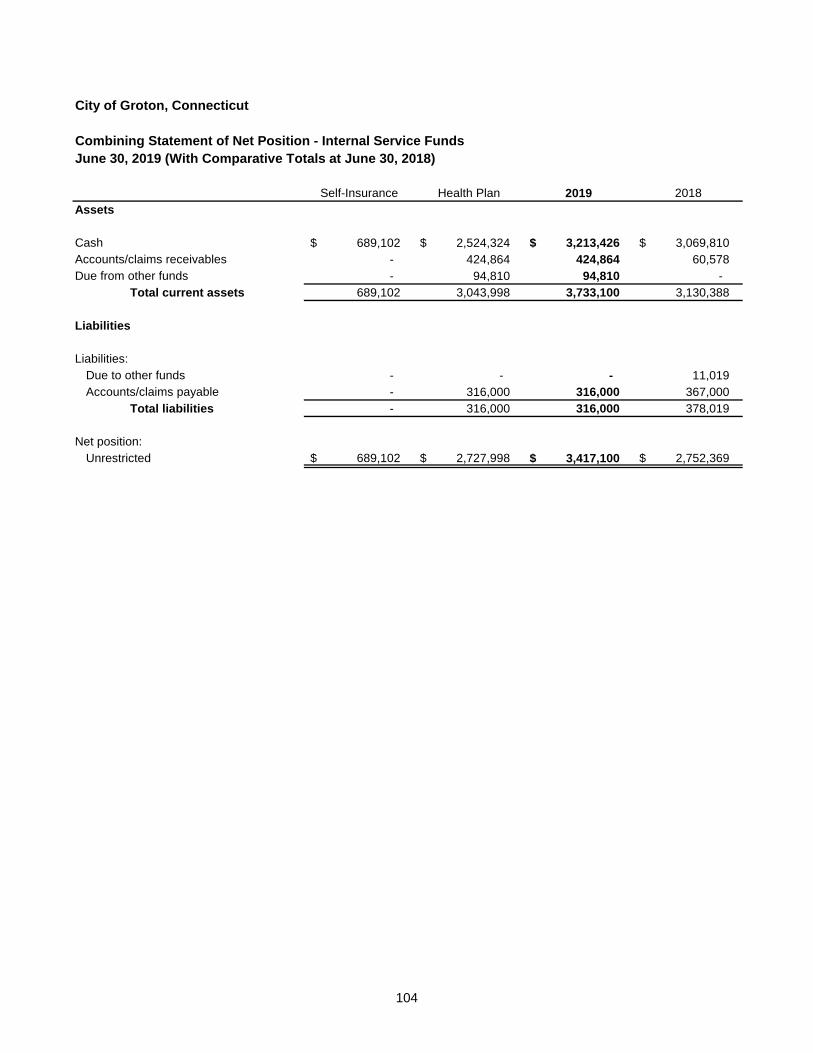
104
City of Groton, Connecticut
Combining Statement of Net Position - Internal Service FundsJune 30, 2019 (With Comparative Totals at June 30, 2018)
Self-Insurance Health Plan 2019 2018Assets
Cash 689,102 $ 2,524,324 $ 3,213,426 $ 3,069,810 $ Accounts/claims receivables - 424,864 424,864 60,578 Due from other funds - 94,810 94,810 -
Total current assets 689,102 3,043,998 3,733,100 3,130,388
Liabilities
Liabilities:Due to other funds - - - 11,019 Accounts/claims payable - 316,000 316,000 367,000
Total liabilities - 316,000 316,000 378,019
Net position:Unrestricted 689,102 $ 2,727,998 $ 3,417,100 $ 2,752,369 $

105
City of Groton, Connecticut
Combining Statement of Revenues, Expenses and Changes in Net Position - Internal Service FundsFor the Year Ended June 30, 2019 (With Comparative Totals for the Year Ended June 30, 2018)
Self-Insurance Health Plan 2019 2018Operating revenues:
Premiums 10,040 $ 5,318,928 $ 5,328,968 $ 5,000,763 $
Operating expenses:Claims paid:
Public safety 8,063 - 8,063 2,849 Public works 1,608 - 1,608 2,275 General government - - - 5,000 Health plan - 3,622,084 3,622,084 3,770,189
Administration:Health plan - 1,041,351 1,041,351 916,793
Total operating expenses 9,671 4,663,435 4,673,106 4,697,106
Operating income 369 655,493 655,862 303,657
Nonoperating revenue:Interest income - 8,869 8,869 6,160
Total nonoperating revenue - 8,869 8,869 6,160
Change in net position 369 664,362 664,731 309,817
Net position, beginning 688,733 2,063,636 2,752,369 2,442,552
Net position, ending 689,102 $ 2,727,998 $ 3,417,100 $ 2,752,369 $

106
City of Groton, Connecticut
Combining Statement of Cash Flows - Internal Service FundsFor the Year Ended June 30, 2019 (With Comparative Totals for the Year Ended June 30, 2018)
Self-Insurance Health Plan 2019 2018Cash flows from operating activities:
Cash received for premiums 10,040 $ 5,318,928 $ 5,328,968 $ 5,000,763 $ Cash paid to claimants (9,671) (4,143,199) (4,152,870) (3,907,822) Cash paid for administration - (1,041,351) (1,041,351) (916,793)
Net cash provided byoperating activities 369 134,378 134,747 176,148
Cash flows provided by investing activities:Interest income - 8,869 8,869 6,160
Net increase in cashand cash equivalents 369 143,247 143,616 182,308
Cash and cash equivalents, beginning 688,733 2,381,077 3,069,810 2,887,502
Cash and cash equivalents, ending 689,102 $ 2,524,324 $ 3,213,426 $ 3,069,810 $
Reconciliation of operating income to netcash provided by operating activities:
Operating income 369 $ 655,493 $ 655,862 $ 303,657 $ Adjustment to reconcile operating income
to net cash provided by operatingactivities:
Change in assets and liabilities:(Increase) in accounts receivable - (459,096) (459,096) (3,528) Decrease in accrued liabilities - (62,019) (62,019) (123,981)
Net cash provided by operating activities 369 $ 134,378 $ 134,747 $ 176,148 $

107
This page intentionally left blank.

Statistical Section – Unaudited This part of the City’s comprehensive annual financial report presents detailed information as a context for understanding what the information in the financial statements, note disclosures, and required supplementary information says about the City’s overall financial health.
CONTENTS Financial Trends (Tables 1-4) These schedules contain trend information to help the reader understand how the City’s financial performance and well-being have changed over time. Revenue Capacity (Tables 5-8) These schedules contain information to help the reader assess the City’s most significant local revenue source, the property tax. Debt Capacity (Tables 9-13) These schedules present information to help the reader assess the affordability of the City’s current levels of outstanding debt and the City’s ability to issue additional debt in the future. Demographic and Economic Information (Tables 14-15) These schedules offer demographic and economic indicators to help the reader understand the environment within which the City’s financial activities take place. Operating Information (Tables 16-18) These schedules contain service and infrastructure data to help the reader understand how the information in the City’s financial report relates to the services the City provides and the activities it performs. The accompanying tables are presented in the above order. Refer to the Table of Contents for applicable page number.


108
City of Groton, Connecticut Table1
Net Position by ComponentLast Ten Years(Unaudited)
2019 2018 2017 2016 2015 2014 2013 2012 2011 2010Governmental activities:
Net investment in capital assets 17,575,130 $ 18,940,538 $ 19,349,984 $ 21,611,939 $ 20,466,258 $ 18,001,407 $ 20,912,472 $ 20,566,312 $ 20,204,792 $ 18,698,216 $ Restricted for:
Endowment - expendable 60,000 60,000 60,000 60,000 60,000 60,000 60,000 60,000 60,000 60,000 Permanent funds - expendable - - - - - 427 246 246 12,398 12,196 Special revenue funds - - - 544,000 543,091 633,791 668,551 677,811 580,192 -
Unrestricted 8,837,628 8,064,740 10,366,270 7,956,547 9,179,006 9,456,594 6,514,415 6,256,564 7,194,347 9,406,900 Total governmental activities 26,472,758 27,065,278 29,776,254 30,172,486 30,248,355 28,152,219 28,155,684 27,560,933 28,051,729 28,177,312
Business-type activities:Net investment in capital assets 56,602,644 44,049,096 44,049,096 39,510,537 34,891,780 32,574,605 34,198,112 38,646,385 34,724,535 31,679,508
Restricted for:Debt service - - - - - - - - - - Economic development - - - - - - - - - - Energy and efficiency - - - - - - - - - -
Unrestricted 4,607,018 3,976,564 7,046,997 2,831,156 3,604,247 (2,830,813) (10,260,873) (26,243,049) 3,709,903 5,192,868 Total business-type activities 61,209,662 48,025,660 51,096,093 42,341,693 38,496,027 29,743,792 23,937,239 12,403,336 38,434,438 36,872,376
City net position:Net investment in capital assets 74,177,774 62,989,634 63,399,080 61,122,476 55,358,038 50,576,012 55,110,584 59,212,697 54,929,327 46,977,724
Restricted for:Capital projects - - - - - - - - - - Endowment-expendable 60,000 60,000 60,000 60,000 60,000 60,000 60,000 60,000 60,000 60,000 Permanent funds-expendable - - - - - 427 246 246 12,398 12,196 Public works - - - 544,000 543,091 633,791 668,551 677,811 580,192 -
Debt service - - - - - - - - - - Economic development - - - - - - - - - - Energy and efficiency - - - - - - - - - - Unrestricted 13,444,646 12,041,304 17,413,267 10,787,703 12,783,253 6,625,781 (3,746,458) (19,986,485) 10,904,250 17,999,768
Total City net position 87,682,420 $ 75,090,938 $ 80,872,347 $ 72,514,179 $ 68,744,382 $ 57,896,011 $ 52,092,923 $ 39,964,269 $ 66,486,167 $ 65,049,688 $
Fiscal Year Ended

109
City of Groton, Connecticut Table 2
Changes in Net PositionLast Ten Fiscal Years(Unaudited)
2019 2018 2017 2016 2015 2014 2013 2012 2011 2010Expenses:
Governmental activities:General government 2,147,448 $ 2,254,789 $ 2,602,416 $ 2,564,351 $ 2,353,876 $ 2,471,659 $ 2,070,702 $ 2,103,355 $ 1,905,884 $ 1,883,687 $ Public safety 8,194,303 7,719,552 8,410,924 7,873,997 8,107,091 7,926,207 7,462,297 7,921,386 8,236,685 8,135,137 Public works 4,092,661 5,654,738 4,945,304 5,319,979 5,744,427 5,363,235 5,730,214 5,084,289 5,869,143 4,948,692 Parks and Recreation 1,218,268 1,145,844 1,254,836 1,183,923 1,323,902 1,357,588 1,330,321 1,148,723 1,230,512 1,087,662 Interest expense 86,959 272,674 83,240 201,986 172,874 219,652 106,801 125,814 137,112 207,406
Total governmental expenses 15,739,639 17,047,597 17,296,720 17,144,236 17,702,170 17,338,341 16,700,335 16,383,567 17,379,336 16,262,584
Business-type activities:Electric department 49,359,048 48,517,562 49,793,760 50,892,927 54,018,154 56,354,668 59,384,748 86,423,334 61,548,644 66,672,893 Water department 10,021,150 9,183,824 9,394,789 8,622,052 8,226,487 8,694,227 8,235,438 7,984,553 8,140,017 8,178,970 Sewer department 2,785,203 - - - - - - - - -
Total business-type expenses 62,165,401 57,701,386 59,188,549 59,514,979 62,244,641 65,048,895 67,620,186 94,407,887 69,688,661 74,851,863
Total expenses 77,905,040 74,748,983 76,485,269 76,659,215 79,946,811 82,387,236 84,320,521 110,791,454 87,067,997 91,114,447
Program revenues:Governmental activities:
Charges for services:General government 1,646,366 1,332,466 1,415,868 1,346,842 1,029,699 1,196,809 313,397 1,179,037 1,009,264 924,262 Public safety 619,377 1,005,689 480,227 426,712 394,490 358,433 328,811 508,484 259,705 384,644 Public works 17,592 81,754 56,639 38,161 45,563 39,364 59,995 60,212 55,799 43,234 Recreation 232,781 208,364 213,081 215,108 171,091 172,502 146,755 130,635 113,709 131,648
Operating grants and contributions 4,572,283 4,846,353 4,182,825 3,447,538 4,278,561 4,639,990 5,131,028 4,273,734 4,388,296 4,860,134 Capital grants and contributions 210,203 612,146 386,950 657,177 2,127,673 1,316,601 759,986 519,122 1,712,368 1,094,709
Total governmental activities 7,298,602 8,086,772 6,735,590 6,131,538 8,047,077 7,723,699 6,739,972 6,671,224 7,539,141 7,438,631
Business-type activities:Electric department 56,303,526 56,323,195 55,883,773 56,482,331 61,853,220 63,494,427 64,892,454 60,553,199 63,134,404 66,675,238 Water department 16,660,495 12,254,219 10,696,461 10,256,269 9,743,591 9,858,947 9,603,898 9,708,205 9,893,954 8,233,088 Sewer department 4,314,627 - - - - - - - - -
Total business-type activities 77,278,648 68,577,414 66,580,234 66,738,600 71,596,811 73,353,374 74,496,352 70,261,404 73,028,358 74,908,326
Total program revenues 84,577,250 76,664,186 73,315,824 72,870,138 79,643,888 81,077,073 81,236,324 76,932,628 80,567,499 82,346,957
Net (expense)/revenue:Governmental activities (8,441,037) (8,960,825) (10,561,130) (11,012,698) (9,655,093) (9,614,642) (9,960,363) (9,712,343) (9,840,195) (8,823,953) Business-type activities 15,113,247 10,876,028 7,391,685 7,223,621 9,352,170 8,304,479 6,876,166 (24,146,483) 3,339,697 56,463
Total net expenses 6,672,210 1,915,203 (3,169,445) (3,789,077) (302,923) (1,310,163) (3,084,197) (33,858,826) (6,500,498) (8,767,490)
Fiscal Year
(Continued)

110
City of Groton, Connecticut Table 2, Cont'd
Changes in Net Position (Continued)Last Ten Fiscal Years(Unaudited)
2019 2018 2017 2016 2015 2014 2013 2012 2011 2010General revenues and other changes
in net position:Governmental activities:
Property taxes 5,272,795 $ 6,239,400 $ 6,428,808 $ 7,041,746 $ 6,261,303 $ 6,143,075 $ 6,419,394 $ 5,615,381 $ 6,144,038 $ 5,901,139 $ Grants and contributions not restricted
to specific purposes 47,004 109,320 134,700 96,432 249,464 130,053 132,174 19,088 77,264 408,771 Investment income 87,071 39,059 61,249 5,045 31,911 218,553 230,423 383,372 305,794 294,327 Miscellaneous - - - 206,194 170,215 - 53,627 102,082 85,892 322,512 Transfers 2,441,647 4,071,162 3,540,141 3,587,412 3,119,496 3,119,496 3,119,496 3,101,624 3,101,624 3,101,624
Total governmental activities 7,848,517 10,458,941 10,164,898 10,936,829 9,832,389 9,611,177 9,955,114 9,221,547 9,714,612 10,028,373
Business-type activities:Investment income 512,402 496,287 281,576 209,457 593,358 621,570 893,174 1,217,005 1,323,989 1,629,491 Transfers (2,441,647) (4,071,162) (3,540,141) (3,587,412) (3,119,496) (3,119,496) (3,119,496) (3,101,624) (3,101,624) (3,101,624)
Total business-type activities (1,929,245) (3,574,875) (3,258,565) (3,377,955) (2,526,138) (2,497,926) (2,226,322) (1,884,619) (1,777,635) (1,472,133)
Total general revenues 5,919,272 6,884,066 6,906,333 7,558,874 7,306,251 7,113,251 7,728,792 7,336,928 7,936,977 8,556,240
Change in net position:Governmental activities (592,520) 1,498,116 (396,232) (75,869) 177,296 (3,465) (5,249) (490,796) (125,583) 1,204,420 Business-type activities 13,184,002 7,301,153 4,133,120 3,845,666 6,826,032 5,806,553 4,649,844 (26,031,102) 1,562,062 (1,415,670)
Change in net position 12,591,482 $ 8,799,269 $ 3,736,888 $ 3,769,797 $ 7,003,328 $ 5,803,088 $ 4,644,595 $ (26,521,898) $ 1,436,479 $ (211,250) $
Fiscal Year

111
City of Groton, Connecticut Table 3
Changes in Fund Balances, Governmental FundsLast Ten Years (Modified Accrual Basis of Accounting)(Unaudited)
2019 2018 2017 2016 2015 2014 2013 2012 2011 2010Revenues:
Property taxes 5,290,265 $ 6,228,104 $ 6,457,027 $ 7,041,746 $ 6,240,201 $ 6,166,362 $ 6,417,756 $ 5,628,575 $ 6,137,303 $ 5,913,531 $ Intergovernmental 4,829,490 5,567,819 4,704,475 4,201,147 6,655,698 6,086,644 6,055,232 4,830,557 6,177,928 6,363,614 Charges for services 2,005,992 1,716,213 1,795,524 1,878,175 1,516,247 1,478,824 1,356,688 1,740,471 1,438,477 1,483,788 Income from investments 87,071 39,059 61,249 (24,006) 29,252 215,894 227,439 369,356 291,858 276,820 Contributions - - - - - - - - - - Other 510,124 912,060 370,291 392,977 294,811 288,284 125,030 230,674 85,892 322,512
Total revenues 12,722,942 14,463,255 13,388,566 13,490,039 14,736,209 14,236,008 14,182,145 12,799,633 14,131,458 14,360,265
Expenditures:Current:
General government 1,523,426 2,075,390 1,966,793 2,144,414 2,141,306 2,090,838 1,676,925 1,813,522 1,706,352 1,605,410 Public safety 7,902,949 7,818,178 7,705,695 7,476,859 7,331,992 7,208,553 7,166,333 7,224,753 7,229,895 7,306,685 Public works 2,854,175 4,722,013 4,234,108 4,839,142 4,924,827 4,666,194 5,264,004 4,450,747 5,163,704 4,256,569 Parks and recreation 1,165,922 1,120,551 1,166,765 1,123,025 1,222,490 1,290,576 1,323,722 1,085,185 1,123,010 1,029,072 Non-departmental and other 84,357 86,644 82,052 73,573 140,021 84,429 62,407 64,922 148,211 148,473 Capital outlay 1,007,630 1,729,379 1,994,492 4,155,972 3,119,487 1,012,139 872,963 606,560 1,432,761 3,092,237
Debt service:Bond principal 265,000 5,975,000 475,000 585,000 590,000 793,000 640,000 676,000 905,500 953,585 Bond and note interest 118,706 144,822 160,400 177,294 194,909 196,185 114,103 125,259 152,616 188,286
Total expenditures 14,922,165 23,671,977 17,785,305 20,575,279 19,665,032 17,341,914 17,120,457 16,046,948 17,862,049 18,580,317
Deficiency of revenues overexpenditures (2,199,223) (9,208,722) (4,396,739) (7,085,240) (4,928,823) (3,105,906) (2,938,312) (3,247,315) (3,730,591) (4,220,052)
Other financing sources (uses):Bond proceeds - 5,998,000 - - - - 3,575,000 - - 1,725,000 Refunding bond proceeds - - - - 190,000 - - - - 1,614,200 Payment to refunding bond escrow - - - - (210,251) - - - - (1,713,838) Bond anticipation note proceeds - - 5,500,000 - - - - - - - Premium on bond sale - 453,874 49,115 39,573 23,888 - 295,000 - - 124,602 Transfers in 4,826,463 4,086,162 3,655,141 3,587,412 3,119,496 3,584,029 3,119,496 3,277,456 3,101,624 3,101,624 Transfers out (1,420,251) (15,000) (15,000) - - (464,533) - (175,832) - -
Net other financing sources (uses) 3,406,212 10,523,036 9,189,256 3,626,985 3,123,133 3,119,496 6,989,496 3,101,624 3,101,624 4,851,588
Net changes in fund balances 1,206,989 $ 1,314,314 $ 4,792,517 $ (3,458,255) $ (1,805,690) $ 13,590 $ 4,051,184 $ (145,691) $ (628,967) $ 631,536 $
Debt service as a Percentage ofnoncapital expenditures 2.61% 3.92% 4.19% 4.87% 4.98% 6.45% 4.87% 5.47% 6.44% 7.00%
Fiscal Year

112
City of Groton, Connecticut Table 4
Fund Balances, Governmental FundsLast Ten Years (Modified Accrual Basis of Accounting)(Unaudited)
2019 2018 2017 2016 2015 2014 2013 2012 2011 2010General fund:
Nonspendable 25,926 $ 11,725 $ 9,035 $ 34,814 $ 33,017 $ 9,750 $ 49,908 $ 17,138 $ 16,768 $ -$ Restricted - - - - - - - - - - Committed 213,363 201,474 468,052 - - - - - - - Assigned 800,000 400,000 451,000 400,000 720,172 819,652 703,263 704,798 1,115,054 - Unassigned 5,634,786 5,060,583 3,951,759 3,463,375 2,718,163 3,324,488 3,899,210 3,484,919 3,070,485 - Reserved - - - - - - - - - 91,645
Unreserved:Designated - - - - - - - - - 973,606 Undesignated - - - - - - - - - 3,874,650
Total unreserved - - - - - - - - - 4,848,256
Total general fund 6,674,075 5,673,782 4,879,846 3,898,189 3,471,352 4,153,890 4,652,381 4,206,855 4,202,307 4,939,901
All other governmental funds:Nonspendable - - - - - - - - - - Restricted 1,005,502 893,256 4,719,753 867,024 1,083,303 633,791 6,084,045 737,811 640,192 - Committed 4,441,325 4,346,875 - 41,869 3,710,682 5,283,346 246 1,505,291 1,596,000 - Assigned - - - - - - - - - - Unassigned (23,653) (23,653) (23,653) (23,653) (23,653) (23,653) (702,888) (467,357) (310,208) - Endowment - - - - - - - - - 60,000 Unreserved, reported in:
Special revenue funds - - - - - - - - - 497,845 Capital funds - - - - - - - - - 1,247,316 Permanent funds - - - - - - - - - 12,196
Total all other governmental funds 5,423,174 5,216,478 4,696,100 885,240 4,770,332 5,893,484 5,381,403 1,775,745 1,925,984 1,817,357
Total all governmental funds 12,097,249 $ 10,890,260 $ 9,575,946 $ 4,783,429 $ 8,241,684 $ 10,047,374 $ 10,033,784 $ 5,982,600 $ 6,128,291 $ 6,757,258 $
Fiscal Year

113
City of Groton, Connecticut Table 5
Assessed and Estimated Actual Value of Taxable Property(1)
Last Ten Years(Unaudited)
Ratio of Total TotalYear Grand List Estimated Estimated Estimated Assessed Value Direct
Ended of Assessed Actual Assessed Actual Assessed Actual To Total Estimated CityJune 30, October 1, Value Value Value Value Value Value Actual Value Rate
2010 2008 1,049,470,816 1,499,244,023 282,742,288 403,917,554 1,332,213,104 1,903,161,577 70.00% 4.14 2011 2009 1,049,648,005 1,499,497,150 264,971,922 378,531,317 1,314,619,927 1,878,028,467 70.00% 4.14 2012 2010 1,016,705,163 1,452,435,947 316,240,195 451,771,707 1,332,945,358 1,904,207,654 70.00% 4.60 2013 2011 1,011,029,157 1,444,327,361 247,047,195 352,952,564 1,258,076,348 1,797,251,925 70.00% 4.60 2014 2012 1,043,066,050 1,490,094,357 254,071,365 362,959,093 1,297,137,415 1,853,053,450 70.00% 4.60 2015 2013 1,043,075,570 1,490,107,957 254,071,365 362,959,093 1,297,146,935 1,853,067,050 70.00% 4.82 2016 2014 968,407,882 1,383,439,831 229,294,291 327,563,273 1,197,702,173 1,711,003,104 70.00% 5.87 2017 2015 957,158,414 1,367,369,163 210,073,895 300,105,564 1,167,232,309 1,667,474,727 70.00% 5.43 2018 2016 956,015,813 1,365,736,876 223,958,541 319,940,773 1,179,974,354 1,685,677,649 70.00% 5.22 2019 2017 957,457,458 1,367,796,369 221,760,368 316,800,526 1,179,217,826 1,684,596,894 70.00% 4.58
(1) Total assessed value based on 70 percent of estimated actual value.
Real Property Personal Property Total

114
City of Groton, Connecticut Table 6
Property Tax Rates - Direct and Overlapping GovernmentsLast Ten Years(Unaudited)
Year Grand List Debt Total Debt Total Ended of Operating Service City Operating Service Town Total
June 30, October 1, Millage Millage Millage Millage Millage Millage Mill Rate
2010 2008 3.88 0.26 4.14 17.22 0.73 17.95 22.09 2011 2009 3.88 0.26 4.14 18.12 0.77 18.89 23.03 2012 2010 4.36 0.24 4.60 19.51 0.71 20.22 24.82 2013 2011 4.37 0.21 4.60 19.60 1.09 20.72 25.32 2014 2012 4.32 0.28 4.60 19.95 0.77 20.72 25.32 2015 2013 4.59 0.23 4.82 19.27 0.86 20.13 24.95 2016 2014 5.59 0.28 5.87 20.09 0.86 20.95 26.82 2017 2015 5.22 0.21 5.43 20.83 0.90 21.73 27.16 2018 2016 5.02 0.20 5.22 22.74 0.89 23.63 28.85 2019 2017 4.46 0.12 4.58 23.12 1.05 24.17 28.75
Note: Data supplied by Town and City of Groton Tax Collector.
City of Groton Town of Groton

115
City of Groton, Connecticut Table 7
Principal Property TaxpayersCurrent Year and Ten Years Ago
Percentage PercentageTaxable of Total City Taxable of Total City
Assessed Taxable Assessed TaxableName Nature of Business Value Rank Assessed Value Value Rank Assessed Value
Chas. Pfizer Company, Inc. Pharmaceuticals 332,831,141 $ 1 28.22% 578,707,218 $ 1 42.60%General Dynamics Corporation Submarine 277,411,540 2 23.53% 187,461,290 2 13.80%Fuelcell Energy Equipment Leasing 19,687,500 3 1.67% - N/A 0.00%Branford Manor, Inc. Apartments 13,320,110 4 1.13% 10,101,420 4 0.74%Groton Estates Colonial Manor, Inc. Apartments 12,496,070 5 1.06% 13,066,670 3 0.96%Mohawk Northeast Construction 10,487,990 6 0.89% - N/A 0.00%The North/South Harbor Ltd. Apartments 7,689,780 8 0.65% 7,990,640 6 0.59%Ansonia Acquisitions, LLC Apartments 7,086,540 9 0.60% 5,271,520 8 0.39%Buckeye Terminals LLC Oil Terminal 5,685,650 9 0.48% 6,295,970 7 0.46%Avery Heights LP Apartments 5,640,150 10 0.48% 3,751,510 10 0.28%
Total 692,336,471 $ 58.71% 812,646,238 $ 59.82%
Source: Town of Groton Assessor's Department
The total net assessment of the top ten taxpayers for the City of Groton constitutes 57.19% of the total October 1, 2017 net taxable Grand List for the City of Grotonafter the BAA deliberations.
Current Year Ten Years Ago

116
City of Groton, Connecticut Table 8
Property Tax Levies and CollectionLast Ten Years(Unaudited)
Percentage of Percentage ofNet Total Tax Delinquent
Year Grand List Total Percent of Delinquent Net Total Collections Outstanding TaxesEnded Tax Rate of Adjusted Net Current Levy Taxes Tax to Total Delinquent to Total
June 30, in Mills October 1 Tax Levy Collections Collected Collected Collections Tax Levy Taxes Tax Levy
2010 4.14 2008 5,634,676 $ 5,608,587 $ 99.54% 31,133 $ 5,608,587 $ 99.54% 46,819 0.83%2011 4.14 2009 5,719,007 5,658,026 98.93% 423,274 5,658,026 98.93% 76,656 1.34%2012 4.14 2010 5,597,114 5,443,915 98.76% 79,711 5,523,626 98.69% 73,488 1.33%2013 4.60 2011 6,453,438 6,296,266 99.10% 90,119 6,376,385 98.81% 77,052 1.23%2014 4.60 2012 6,185,972 5,905,522 95.47% 235,140 6,140,662 99.27% 45,310 0.73%2015 4.82 2013 6,223,649 6,160,646 98.99% 37,033 6,197,679 99.58% 71,460 1.15%2016 5.87 2014 7,015,745 6,958,217 99.18% 49,243 7,007,460 99.88% 73,880 1.05%2017 5.43 2015 6,364,155 6,330,454 99.47% 37,088 6,367,542 100.05% 95,802 1.51%2018 5.22 2016 6,295,071 6,153,259 97.75% 77,322 6,230,581 98.98% 64,490 1.02%2019 4.58 2017 5,300,218 5,204,339 98.19% 48,519 5,252,858 99.11% 47,360 0.89%
Source: Town of Groton Tax Collector's Department.

117
City of Groton, Connecticut Table 9
Ratios of Outstanding Debt TypeLast Ten Years(Unaudited)
PercentageYear Ended Grand of Personal
June 30, City Sewer Total Electric (2) Water(2) Sewer(3) Total Total Income (1) Per Capita (1)
2010 3,501,000 $ 1,573,500 $ 5,074,500 $ 33,563,885 $ 6,851,615 $ -$ 40,415,500 $ 45,490,000 $ 26.6% 5,926 2011 3,098,000 1,071,000 4,169,000 31,383,930 5,867,070 - 37,251,000 41,420,000 13.9% 4,138 2012 2,737,000 756,000 3,493,000 29,226,980 5,095,020 - 34,322,000 37,815,000 12.5% 3,733 2013 5,492,000 940,000 6,432,000 42,794,310 6,787,690 - 49,582,000 56,014,000 18.1% 5,391 2014 4,980,000 655,000 5,635,000 39,973,040 6,036,960 - 46,010,000 51,645,000 16.7% 4,971 2015 4,525,000 515,000 5,040,000 37,280,000 5,320,000 - 42,600,000 47,640,000 15.4% 4,586 2016 4,070,000 385,000 4,455,000 34,455,000 4,590,000 - 39,045,000 43,500,000 14.1% 4,187 2017 3,620,000 360,000 3,980,000 31,405,000 4,170,000 - 35,575,000 39,555,000 12.8% 3,807 2018 3,170,000 6,333,000 9,503,000 38,837,000 15,092,360 - 53,929,360 63,432,360 20.5% 6,106 2019 2,905,000 - 2,905,000 35,304,013 29,442,013 6,008,000 70,754,026 73,659,026 23.8% 7,090
Note: (1) Details regarding the City's outstanding debt can be found in the notes to the financial statements.(2) Electric and Water general obligation bonds are paid by the rate payers. Only a portion of the rate payers are property owners.(3) Starting in FY 2019, Sewer general obligation bonds are paid by the rate payers. Only a portion of the rate payers are property owners.
General Obligations Bonds General Obligation Bonds
Governmental Activities Business-Type Activities

118
City of Groton, Connecticut Table 10
Ratio of Net General Bonded Debt to Assessed Value andNet General Bonded Debt Per CapitaLast Ten Fiscal Years(Unaudited)
Percentage ofNet Long-Term Net
Debt to Long-Term Assessed Bonded Assessed Debt
Population Value Debt Value Per Capita
2010 *** 10,010 1,332,213,104 $ 5,074,500 $ 0.38% 507 2011 ** 10,389 1,314,619,927 4,169,000 0.32% 401 2012 ** 10,389 1,332,945,358 3,493,000 0.26% 366 2013 ** 10,389 1,258,076,348 6,432,000 0.51% 619 2014 ** 10,389 1,297,137,415 5,635,000 0.43% 542 2015 ** 10,389 1,297,146,935 5,040,000 0.39% 485 2016 ** 10,389 1,197,702,173 4,455,000 0.37% 429 2017 ** 10,389 1,167,232,309 3,980,000 0.34% 383 2018 ** 10,389 1,179,974,354 9,503,000 0.81% 915 2019 ** 10,389 1,179,217,826 2,905,000 0.25% 280
*** Based on 2000 Bureau of Census figure.** Based on 2010 Bureau of Census figure.
Year EndedJune 30,

119
City of Groton, Connecticut Table 11
Computation of Direct and Overlapping Bonded DebtJune 30, 2019(Unaudited)
Net Percentage AmountBonded Debt Application Applicable
Jurisdiction Outstanding to City to City
Direct:City of Groton 2,905,000 $ 100.00% 2,905,000 $
Overlapping:Town of Groton 62,603,783 31.66% 19,820,358
Total 65,508,783 $ 22,725,358 $
Note: The percentage of overlapping debt is provided by the Town of Groton.

120
City of Groton, Connecticut Table 12
Schedule of Statutory Debt LimitationFor the Year Ended June 30, 2019(Unaudited)
Total tax collections as of June 30, 2018 (including interest and lien fees) 6,270,680 $
Reimbursement for revenue loss on: Tax relief for elderly freeze -
Total base 6,270,680 $
GeneralPurpose Sewer
Debt limitation:2-1/4 times base 14,109,030 $ -$ 3-3/4 times base - 23,515,050
Total debt limitation 14,109,030 23,515,050
Indebtedness: Bonds payable 2,905,000 6,008,000 Authorized, but unissued debt 854,189 10,600
Total Indebtedness 3,759,189 6,018,600
Debt limitation in excess of outstanding and authorized debt 10,349,841 $ 17,496,450 $
Notes: (A) The above total indebtedness amounts to: 9,777,789 $
(B) In no case shall total indebtedness exceed seven times annualreceipts from taxation 43,894,760 $
(C) A "Schools" column is not provided in the above schedule since aneducational system is provided by the Town of Groton.
(D) There are authorized and existing bonds of both the Electric andWater Departments. Although this debt is also a general obligation of the City, repayment is expected to come from the respectiveutility's operational income. Therefore, the amounts are notreflected in the schedule.

121
City of Groton, Connecticut Table 13
Schedule of Statutory Debt Limitation
2019 2018 2017 2016 2015 2014 2013 2012 2011 2010
Total tax collections, including interest and lien fees 6,270,680 $ 6,270,680 $ 6,407,002 $ 7,048,262 $ 6,235,091 $ 6,187,324 $ 6,412,585 $ 5,624,204 $ 6,117,086 $ 5,879,707 $
Reimbursement for revenue loss on:Tax relief for elderly freeze - - - - - - - - - 2,902
Total base 6,270,680 $ 6,270,680 $ 6,407,002 $ 7,048,262 $ 6,235,091 $ 6,187,324 $ 6,412,585 $ 5,624,204 $ 6,117,086 $ 5,882,609 $
Debt limit:General purpose 2 1/4 times base 14,109,030 $ 14,109,030 $ 14,415,755 $ 15,858,590 $ 14,028,955 $ 13,921,479 $ 14,428,316 $ 12,654,459 $ 13,763,444 $ 13,235,870 $ Sewer 3 3/4 times base - 23,515,050 24,026,258 26,430,983 23,381,591 23,202,465 24,047,194 21,090,765 22,939,073 22,059,784
Total Debt Limit 14,109,030 37,624,080 38,442,013 42,289,573 37,410,546 37,123,944 38,475,510 33,745,224 36,702,517 35,295,654
Net debt applicable to limit:General purpose:
Bonds payable 2,905,000 3,170,000 3,620,000 4,070,000 4,525,000 4,980,000 5,492,000 2,737,000 3,098,000 3,501,000 Bond anticipation notes - - - - - - - - - -
Sewer:Bonds payable - 6,333,000 360,000 385,000 515,000 655,000 936,000 756,000 1,071,000 1,573,500 Bond anticipation notes - - 5,500,000 2,750,000 - - - - - - Total net debt applicable
to limit 2,905,000 9,503,000 9,480,000 7,205,000 5,040,000 5,635,000 6,428,000 3,493,000 4,169,000 5,074,500
Legal debt limit 11,204,030 $ 28,121,080 $ 28,962,013 $ 35,084,573 $ 32,370,546 $ 31,488,944 $ 32,047,510 $ 30,252,224 $ 32,533,517 $ 30,221,154 $
In no case shall total indebtedness exceed seven times annual receipts from taxation 43,894,760 $ 43,894,760 $ 44,849,014 $ 49,337,834 $ 43,645,637 $ 43,311,268 $ 44,888,095 $ 39,369,428 $ 42,819,602 $ 41,178,263 $
Total net debt applicable to the limit as a percentage of debt limit 20.59% 25.26% 24.66% 17.04% 13.47% 15.18% 16.71% 10.35% 11.36% 14.38%
Notes: (A) A "Schools" column is not provided in the above schedule since an educational system is provided by the Town of Groton.(B) There are authorized and existing bonds of both the Electric and Water Departments. Although this debt is also a general
obligation of the City, repayment is expected to come from the respective utility's operational income. Therefore, the amountsare not reflected in the schedule.
Last Ten Fiscal Years(Unaudited)
Fiscal Year

122
City of Groton, Connecticut Table 14
Demographic and Economic StatisticsLast Ten Calendar Years(unaudited)
EducationPersonal Income Level in
Calendar (Amounts Expressed Per Capita Median Years of UnemploymentYear in Thousands) Income 2 Age 3 Schooling 4 Rate 1
2010 *** 10,010 222,612 $ 22,239 $ *** 31.6 N/A 9.10%2011 ** 10,389 309,125 29,755 *** 28.7 N/A 8.40%2012 ** 10,389 309,125 29,755 *** 28.7 N/A 8.20%2013 ** 10,389 309,125 29,755 *** 28.7 N/A 7.70%2014 ** 10,389 309,125 29,755 *** 28.7 N/A 6.20%2015 ** 10,389 309,125 29,755 *** 28.7 N/A 5.20%2016 ** 10,389 309,125 29,755 *** 28.7 N/A 5.30%2017 ** 10,389 309,125 29,755 *** 28.7 N/A 4.00%2018 ** 10,389 309,125 29,755 *** 28.7 N/A 4.10%2019 ** - 10,389 29,755 *** 28.7 N/A 0.00%
*** Based on 2000 Bureau of Census figure.** Based on 2010 Bureau of Census figure.
(1) Based on the Connecticut Labor Department employment data.
(2) Based on 2000 U.S. Department of Commerce, Bureau of Census data.
(3) Based on 2000 Bureau of Census data.
(4) Information not available from State Department of Education.
Population1

123
City of Groton, Connecticut Table 15
Principal EmployersCurrent Year and Ten Years Ago(Unaudited)
Percentage PercentageEmployer Employees Rank of Total Employees Rank of Total
General Dynamics, Electric Boat Division 8,164 1 55% 7,800 1 61%Pfizer's 5,528 2 37% 4,000 2 31%University of Connecticut 230 3 2% 230 4 2%Superintendent of Ships 220 4 1% 200 5 2%City of Groton 207 5 1% 234 3 2%Groton Board of Education 135 6 1% 135 6 1%Coast Guard Research & Development 130 7 1% 130 7 1%Proto-Power 108 8 1% 80 8 1%Sacred Heart School 38 9 0% 33 10 0%Project Oceanology 36 10 0% 35 9 0%
Total 14,796 100.0% % 12,877 100%
Source: State Department of Labor
2019 2009

124
City of Groton, Connecticut Table 16
Full-Time Equivalent Government Employees by Function/ProgramLast Ten Fiscal Years(Unaudited)
Function/Program 2019 2018 2017 2016 2015 2014 2013 2012 2011 2010
General government:Mayor 1 1 1 1 1 1 1 1 1 1 Finance 5 5 5 5 5 5 5 5 5 5 Planning 1 1 1 1 1 1 1 1 1 1 Parks and recreation 5 5 5 5 5 5 5 5 5 5 City clerk 1 1 1 1 1 1 1 1 1 1 Building and zoning 3 3 3 3 3 3 3 3 3 3 Other 5 3 3 3 3 3 3 3 3 3
PoliceOfficers 27 27 27 28 29 29 31 32 32 32 Civilians 7 7 7 7 7 9 12 13 13 13
FireFirefighters and officers 17 17 17 17 17 17 17 17 17 17
Public worksEngineering 1 1 1 1 1 1 2 2 2 2 Highway 19 19 19 18 19 21 20 20 20 20
Water department 39 35 35 34 31 32 34 34 34 34
Sewer department 5 5 5 6 6 6 6 6 6 6
Electric department 71 66 66 71 70 70 95 95 95 95
Total 207 196 196 201 199 204 236 238 238 238
Source: Various City Departments.
Fiscal Year

125
City of Groton, Connecticut Table 17
Operating Indicators by Function/ProgramLast Ten Fiscal Years(Unaudited)
Function/Program 2019 2018 2017 2016 2015 2014 2013 2012 2011 2010
General government:Public safety:
Physical arrests 498 503 495 588 621 532 496 514 616 732 Parking violations 1,599 1,484 1,568 1,331 889 1,019 785 1,896 2,274 3,488 Traffic violations 1,920 1,558 1,630 1,606 1,341 1,865 1,815 2,234 2,584 3,290
Fire:Emergency responses 1,118 1,111 1,061 1,127 1,055 1,085 1,332 1,270 1,058 745 Fires extinguished 40 41 22 23 12 23 51 64 34 44
Public works:Highways and streets:
Street resurfacing (miles) - 1 2 6 7 9 2 - - 1 Sidewalk repaired (feet) 619 1,420 1,134 410 175 1,901 1,250 430 580 687
Sanitation:Refuse collected (tons/day) 12 11 11 12 12 12 12 12 12 12 Recyclables collected
(tons/day) 3 3 3 3 3 3 3 3 3 2 Water pollution authority:
Average daily sewagetreatment (millions ofgallons) 2 2 2 2 2 2 2 2 2 2
Parks and recreation:Beach passes issued 2,496 2,448 2,179 2,125 2,092 2,052 2,008 1,952 1,864 1,671 Recreation:
Summer program 566 587 381 613 426 392 326 282 270 275 Fall program 111 119 120 269 115 116 192 194 90 187 Winter program 481 402 354 215 170 145 126 159 73 205
Business-type activities:Water fund:
New connections 12 6 8 3 5 9 9 10 10 11 Water main breaks 13 14 16 14 16 5 5 5 11 11 Average daily consumption
(millions of gallons) 5.000MGD 5.000MGD 5.500MGD 5.700MGD 5.700MGD 5.900MGD 5.900MGD 5.600MGD 5.800MGD 5.600MGDPeak daily consumption
(millions of gallons) 7.648MGD 7.648MGD 9.704MGD 9.100MGD 8.511MGD 8.250MGD 8.250MGD 8.208MGD 9.597MGD 9.173MGD
Source: Various city departments
Fiscal Year

126
City of Groton, Connecticut Table 18
Capital Asset Statistics by Function/ProgramLast Ten Fiscal Years(Unaudited)
Function/Program 2019 2018 2017 2016 2015 2014 2013 2012 2011 2010
General government:Parks and recreation:
Acreage 40 40 40 40 40 40 40 40 40 40 Playgrounds 6 6 6 6 6 6 6 6 6 6 Baseball/softball
diamonds 5 5 5 5 5 5 5 5 5 5 Basketball courts 3 3 3 3 3 3 3 3 3 3 Tennis courts 6 6 6 6 6 6 6 6 6 6
Public safety:Fire department 2 2 2 2 2 2 2 2 2 2 Police department:
Stations 1 1 1 1 1 1 1 1 1 1 Patrol units 24 24 24 24 24 24 24 24 24 24
Public works:Highway department:
Streets (miles) 29 29 29 29 29 29 29 29 29 29 Sidewalks (miles 23 23 23 23 23 23 23 23 23 23
Water fund:Water mains (miles) 105 105 105 105 105 105 105 105 105 105 Fire hydrants 737 737 737 735 734 731 728 726 724 714 Storage capacity
(thousands ofgallons) 2,789,000 2,789,000 2,789,000 2,789,000 2,789,000 2,789,000 2,789,000 2,789,000 2,789,000 2,789,000
Sewer fund:Sewer mains (miles) 35 35 35 35 35 35 35 35 35 35 Storm drainage (miles) 16 16 16 16 16 16 16 16 16 16 Treatment capacity
(millions of gallons) 3.1 3.1 3.1 3.1 3.1 3.1 3.1 3.1 3.1 3.1
Source: Various city departments.
Fiscal Year

127
This page intentionally left blank.