city of gaithersburg, md adopted budget for the fiscal
TRANSCRIPT

F Y 2 0 2 2
City of Gaithersburg, MD Adopted Budget
For the Fiscal Year Ended July 1, 2021 to June 30, 2022

This Page Intentionally Left Blank

Table of Contents
FY22 Budget
All pages within this document, including the cover are assigned page numbers so that the document page numbers match the electronic page count.
TRANSMITTAL LETTER.............................................................................................................................. 7 ABOUT THE CITY ...................................................................................................................................... 11
Community Profile .......................................................................................................................... 11 List of Principal Officials ................................................................................................................. 15 Organizational Chart ...................................................................................................................... 16 Other Budget Resources and Links ............................................................................................... 17
Strategic Plan ................................................................................................................................. 18 Strategic Direction – City Administration ................................................................................. 24 Strategic Direction – Communication ...................................................................................... 36 Strategic Direction – Community Services .............................................................................. 54 Strategic Direction – Economic Development ......................................................................... 67 Strategic Direction – Environment ........................................................................................... 82 Strategic Direction – Housing .................................................................................................. 90 Strategic Direction – Infrastructure & Facilities ..................................................................... 104 Strategic Direction – Parks, Recreation & Culture ................................................................ 109 Strategic Direction – Planning & Development ..................................................................... 119 Strategic Direction – Police ................................................................................................... 129 Strategic Direction – Transportation ...................................................................................... 140
ABOUT THE BUDGET ............................................................................................................................. 151
Budget Highlights ......................................................................................................................... 151 Budget Timeline and Process ...................................................................................................... 153
Budget Award ............................................................................................................................... 157 Instrument of Adoption ................................................................................................................. 159 Accounting Structure .................................................................................................................... 162
FINANCIAL OVERVIEW .......................................................................................................................... 169 General Fund Summary ............................................................................................................... 169 General Fund Revenues .............................................................................................................. 172 General Fund Expenditures ......................................................................................................... 180 Five Year Financial Plan .............................................................................................................. 194
GENERAL FUND DEPARTMENTAL BUDGETS .................................................................................... 201
OFFICE OF THE CITY MANAGER .......................................................................................................... 201
1101 Mayor & Council .................................................................................................................. 205 1131 Office of the City Manager .................................................................................................. 207 1133 Economic & Business Development ................................................................................... 209 1142 Housing & Community Development .................................................................................. 211
OFFICE OF THE CITY ATTORNEY ......................................................................................................... 213 1111 Legal Services..................................................................................................................... 216 1122 Registration & Elections ...................................................................................................... 218
HUMAN RESOURCES ............................................................................................................................. 221 1135 Human Resources .............................................................................................................. 224
COMMUNITY AND PUBLIC RELATIONS ............................................................................................... 227 1212 Public Information ............................................................................................................... 231 1213 Gaithersburg Television ...................................................................................................... 233 1215 Community Services ........................................................................................................... 235 1216 Homeless Services ............................................................................................................. 237
3

Table of Contents
FY22 Budget
FINANCE AND ADMINISTRATION ......................................................................................................... 239
1141 Finance & Administration .................................................................................................... 242 1149 General Services ................................................................................................................ 244 1911 Non-Departmental ............................................................................................................... 245
INFORMATION TECHNOLOGY .............................................................................................................. 247 1145 Information Technology ...................................................................................................... 250 1146 Geographic Information Systems........................................................................................ 253
DEPARTMENTS OF PARKS, RECREATION AND CULTURE .............................................................. 255
Facilities & Admin Division 1411 Parks, Recreation & Culture Administration ....................................................................... 263 1426 Activity Center ..................................................................................................................... 265 1428 Miniature Golf Course ......................................................................................................... 267 1429 Picnic Pavilions .................................................................................................................. 269
Recreation Services Division 1416 Recreation Classes ............................................................................................................. 270 1421 Casey Community Center ................................................................................................... 272 1422 Water Park .......................................................................................................................... 274 1425 Benjamin Gaither Center .................................................................................................... 276 1427 Gaithersburg Aquatic Center .............................................................................................. 279
Cultural Events & Services Division 1423 Gaithersburg Arts Barn ....................................................................................................... 281 1430 Winter Lights ....................................................................................................................... 283 1436 Special Events .................................................................................................................... 285 1437 Museums ............................................................................................................................. 287 1438 Kentlands Mansion ............................................................................................................. 289
Sports & Youth Services Division 1415 Recreation Programs & Sports ........................................................................................... 291 1417 Youth Services .................................................................................................................... 293 1418 Summer Programs .............................................................................................................. 295 1419 Gaithersburg Youth Center at Robertson Park ................................................................... 297 1420 Skate Park ........................................................................................................................... 299 1424 Gaithersburg Youth Center at Olde Towne ........................................................................ 300
DEPARTMENT OF PLANNING AND CODE ADMINISTRATION........................................................... 303 1192 Planning & Code Administration ......................................................................................... 308 1194 Planning .............................................................................................................................. 310 1196 Permits & Inspections ......................................................................................................... 312 1197 Neighborhood Services ....................................................................................................... 314 1198 Animal Control..................................................................................................................... 316
GAITHERSBURG POLICE DEPARTMENT ............................................................................................ 319 1211 Police Department .............................................................................................................. 323
PUBLIC WORKS ...................................................................................................................................... 327 Engineering Division 1311 Public Works Administration ............................................................................................... 334
1345 Recycling ............................................................................................................................. 336 1351 Engineering Services .......................................................................................................... 337 1393 Street Lighting ..................................................................................................................... 339
PW Operations Division 1312 Streets & Special Projects .................................................................................................. 340 1315 Fleet Maintenance .............................................................................................................. 342 1341 Landscaping & Forestry ...................................................................................................... 344 1343 Municipal Parks Maintenance ............................................................................................. 346
4

Table of Contents
FY22 Budget
PUBLIC WORKS (Continued)
PW Operations Division (Continued) 1344 Mowing & Bulk Pick-Up ....................................................................................................... 348 1397 Traffic Control ...................................................................................................................... 350
Environmental Services Division 1134 City Sustainability Program ................................................................................................. 352 1342 Environmental Services Operations ................................................................................... 354
Facilities Management Division 1150 Facilities Management ........................................................................................................ 355 1151 Building & Grounds - City Hall ............................................................................................ 358 1152 Building & Grounds - Police Station .................................................................................... 359 1153 Building & Grounds - Public Service Facility ....................................................................... 360 1155 Building & Grounds - Train Station/Freight House .............................................................. 361 1158 Building & Grounds - Kentlands Mansion ........................................................................... 362 1159 Building & Grounds - Benjamin Gaither Center .................................................................. 363
1160 Building & Grounds - Casey Community Center ................................................................ 364 1161 Building & Grounds - Olde Towne Pavilion ......................................................................... 365 1162 Building & Grounds - 16 South Summit Avenue ................................................................. 366 1164 Building & Grounds - Gaithersburg Aquatic Center ............................................................ 368 1165 Building & Grounds - Activity Center .................................................................................. 369 1166 Building & Grounds - Gaithersburg Arts Barn ..................................................................... 370 1167 Building & Grounds - Water Park ....................................................................................... 371 1168 Building & Grounds - Miniature Golf ................................................................................... 372 1169 Building & Grounds - Skate Park ........................................................................................ 373 1170 Building & Grounds - Youth Center in Olde Towne ............................................................ 374 1172 Building & Grounds - Gaithersburg Youth Center ............................................................... 375 1173 Building & Grounds - Gaithersburg - CPSC Park Site ........................................................ 376 1175 Building & Grounds - Parking Facility ................................................................................. 377 1176 Building & Grounds - Homeless Services ........................................................................... 378
PERSONNEL AND SALARY SCHEDULES ............................................................................................ 379
CAPITAL IMPROVEMENTS PLAN ........................................................................................................ 385 Overview ...................................................................................................................................... 385 Project Closure List ...................................................................................................................... 388 New Projects Summary ............................................................................................................... 390 Revenues, Expenditures, and Projected Fund Balances ............................................................ 393
OTHER FUNDS ........................................................................................................................................ 411
Stormwater Management Fund ................................................................................................... 411 Forest Conservation Fund ........................................................................................................... 421 Asset Replacement Fund ............................................................................................................. 424 Housing Program Fund ................................................................................................................ 430
GLOSSARY .............................................................................................................................................. 433 APPENDIX A: CIP Projects ..................................................................................................................... 439
CIP Project Summary................................................................................................................... 439 CIP Project Detail ......................................................................................................................... 445
APPENDIX B: Stormwater Projects ....................................................................................................... 557
Stormwater Projects Summary .................................................................................................... 557 Stormwater Project Pages ........................................................................................................... 559
5

COVID-19 Day of Remembrance
at City Hall
6

City of Gaithersburg ● 31 South Summit Avenue, Gaithersburg, Maryland 20877-2038 301-258-6300 ● FAX 301-948-6149 ● [email protected] ● gaithersburgmd.gov
_________________________________________________________________________________________________ MAYOR COUNCIL MEMBERS CITY MANAGER Jud Ashman Neil Harris Tanisha R. Briley
Laurie-Anne Sayles Michael A. Sesma
Ryan Spiegel Robert T. Wu
July 1, 2021 Mayor and City Council and residents of Gaithersburg: We are pleased to provide the adopted budget for the City of Gaithersburg for Fiscal Year 2022 (FY22). This past year was full of unprecedented challenges brought on by the COVID‐19 pandemic. The global upheaval of the pandemic has disrupted every aspect of our lives and many have experienced deep loss. The economic downturn is one of many fallouts of COVID‐19. The need to shelter in place and limit activity to only the most essential of tasks to control the spread of the virus has dramatically reduced City revenues and created an environment of unpredictability around future fiscal impact. In anticipation of revenue declines, the FY21 budget was optimized to respond to the ongoing public health crisis and maintain high quality services, while being reduced in other areas to balance the budget. Although the impact to the City’s revenue was even greater than expected, we have pivoted City operations and programs to meet the needs of the community in the fiscally responsible manner for which we are known. The uncertain fiscal conditions continued as we worked to prepare the FY22 budget. Despite the challenging economic environment caused by the virus, we have produced a FY22 budget that supports the core programs and services that will be needed to ensure our community’s resilience and recovery for the next fiscal year and beyond. Thanks to our strong financial position, we are able to do so without proposing a tax increase. The rate of $0.262 per $100 of assessed value will remain in place for FY22. Having only raised the real property tax rate once in more than 40 years, the City continues to enjoy one of the lowest property tax rates in Maryland. The FY22 budget reflects the priorities of the Mayor and City Council as set forth in the City’s strategic plan, as well as insight from Gaithersburg residents acquired through the virtual budget forum. This budget allows us to continue and to strengthen our commitment to our guiding principles of customer focus, open communication, creativity, fiscal responsibility, cooperation, commitment to excellence, and continuous improvement. The adopted FY22 expenditure budget for FY22 is $70.2 million, representing just a 1.2 percent increase from FY21. This modest increase reflects the City’s understanding of the financial pressures on the community as a result of the pandemic and addresses important maintenance needs, funding for three new full‐time equivalent positions to address pressing operational needs, and planned increases for OPEB and Asset Replacement Fund contributions.
Revenues, excluding the use of funds on hand and a substantial one‐time transfer of funds, are expected to decline by 0.6 percent. The City’s real property and income tax bases remain fairly stable, demonstrating the strength and resiliency of the local economy.
7

The overall decline in revenues projected for FY22 is being offset by a one‐time transfer of $4.1 million from the Stormwater Fund to the General Fund. This transfer repays a subsidy from the General Fund to the Stormwater Fund that was used to aid in reducing the rate needed for stormwater management as the City sought to raise funds in 2014 to meet new anticipated state requirements. Following a recent intensive study to review ongoing funding needs, it was concluded that the Stormwater Fund was in a good position to continue to meet the known current and near term future environmental mandates; the subsidy could thus be returned to the General Fund. The Stormwater Fund was also able to return funds to the Capital Improvement Fund, which provided additional relief for the General Fund. If not for these transfers, the City would be facing a substantial deficit, requiring the significant use of reserves and/or substantive cuts to the capital budget to achieve balance. As a pay‐as‐you go community, we must remain vigilant in protecting the long‐term sustainability of our strong financial position and continue to be strategic in our use of reserves, avoiding unsustainable practices such as supplementing operations, and focusing instead on planned investments in capital expenditures. The Capital Improvement Plan (CIP) structure was modified in FY19 to reflect individual capital project identification and funding. This move from budgeting only by category of capital spending to individual capital projects allows for better identification of recurring versus one‐time capital needs. We also shifted towards a more data‐driven approach to capital planning in FY17, including using pavement management condition assessments and facility assessment to prioritize funding based on needs in the most cost effective manner. The FY22 budget continues this trend of asset and facility assessments, and includes funding for needs analyses to improve long range capital planning. Long range budgeting practices are integral to maintaining solid fiscal health. The FY22 budget continues to put changes into practice that should allow the City to maintain its low tax rate and debt‐free status. Strategic Plan Highlights
As the annual budget guides the provision of City services and reflects priorities identified by the Mayor and City Council, public input plays a prominent role in its development. As was done last year, staff used a virtual budget forum to facilitate participation in the budget process. The forum helped us gather detailed information on funding priorities important to our residents. Following the virtual budget forum, the Mayor and City Council held their annual retreat to address the long term community priorities. Comments and feedback from both the forum and the retreat are reflected in the priorities addressed in the adopted budget. Highlighted below are select items from the adopted FY22 Strategic Plan that you will see reflected in both the operating and capital components of the adopted FY22 budget: City Administration
Develop a Citywide plan to advance racial equity
Develop a plan to align long‐term capital needs with funding
Implement new hybrid election process and evaluate effectiveness
8

Community and Public Relations
Support a cross‐departmental initiative to highlight the City’s diversity
Develop and conduct an outreach plan to enhance Advisory Committee memberships, allowing them to more closely match community demographics, including the consideration of youth membership where appropriate
Refine the nonprofit grant program to include requirements for the direct implementation of equitable, collaborative neighborhood‐based outreach programming, focusing on student/parent, school and community engagement
Economic Development
Support repositioning and/or redevelopment of the Lakeforest Mall site by working with current property owners and identifying potential developers
Respond to the extraordinary economic conditions brought on by the COVID‐19 pandemic
Review the Toolbox program to determine if changes should be made to support local businesses
Perform a real estate market analysis and feasibility study to forecast post‐COVID demand and estimate fiscal impacts on City revenue
Housing
Develop program to offer financial incentives to developers of market‐rate projects to incorporate higher than the 15 percent minimum for affordable housing
Work with Neighborhood Services and Community Services to reduce the number of households receiving “writs of eviction” and the subsequent loss of their housing
Planning and Development
Transition from Energov’s (the City’s permitting software) Citizen Access Port (CAP) to the Customer Self‐Service (CSS) account
Adopt the Lakeforest Mall Master Plan
Police
Include de‐escalation training that contains decision‐making exercises into all use of force training venues for firearms, Taser and defensive tactics
Ensure open communication with community organizers and the public through quarterly meetings (at a minimum) for the purpose of preserving strong relationships of mutual trust between the department and the communities we serve
Implement Fair and Impartial Policing training to officers and develop a written policy that is consistent with the training received and community expectations
Recreation and Environment
Introduce and implement an after school youth sports initiative to engage disconnected students
Partner with G‐PARC on the trail mapping initiative “Explore Gaithersburg” at Bohrer and Morris Parks
Complete the first waste audit of community recycling and determine program needs
Define metrics needed to complete a climate action and resiliency plan
9

Develop a City webpage specifically dedicated to climate and restructure the environmental services web content navigation
Investigate the feasibility of providing a curbside composting service to residents Transportation and Infrastructure
Complete evaluations of three school sites within the City for school zone effectiveness and capacity to support the Safe Routes to School program
Work with MCPS to build the new Gaithersburg Elementary School Turf Field
Complete construction of the park at the former CPSC site (Pleasant View Park)
Begin the design of the buildout of the remaining section of 16 S. Summit Avenue Conclusion
The daunting challenge of preparing the FY22 budget in the backdrop of the unknown lingering effects of the pandemic could not have been accomplished without the incredible work of many contributors. We would like to express our appreciation to those who were involved in developing the budget and participating in the virtual budget forum. The Mayor and City Council, our resourceful and dedicated staff and, of course, our residents all have a role in continuing the City’s reputation for excellence. This adopted budget invests in our people and our processes to improve on our stellar record of service to the community, puts people in place to provide enhanced services, preserves and maintains our infrastructure, and lays the groundwork for future growth, all with the ultimate goal of ensuring that the residents of our growing City enjoy the highest possible quality of life.
Tanisha R. Briley Kim Francisco, CPA
City Manager Director of Finance
10

About the City
Community Profile
FY22 Budget
The City of Gaithersburg is a municipality sharing local government taxing authority with Montgomery County, Maryland. The City operates under the council-manager form of government. The governing body is the Mayor and City Council (M&CC), which formulates policies for the administration of the City. A Mayor and five City Council members are elected at-large for staggered four-year terms. The City Manager is appointed by the Mayor and City Council to serve as the City’s chief executive officer. The City Manager is responsible for the implementation of policies and directions established by the Mayor and City Council.
Gaithersburg is centrally located in the heart of Montgomery County. The southeastern border lies 12 miles from the northwestern border of Washington, D.C., and 18.5 miles northwest of the U.S. Capitol Building. Gaithersburg occupies approximately 10.33 square miles, with a population of 70,223 as of July 1, 2020. As mandated by state law, Montgomery County provides school, library, social services, and fire protection in Gaithersburg. In addition to the Montgomery County Police, Gaithersburg residents are served by the City’s own Police Department. The City continues to attract and maintain a dense concentration of high technology and biotechnology companies along the Interstate 270 Technology Corridor which benefit from their proximity to the regulatory agencies in the National Capital region. While the City is debt free, current economic conditions pose significant financial challenges. Through conservative fiscal policies and sound planning, core services continue to be delivered at a very high quality, and groundwork has been laid for sustainability despite decreasing revenue from other government entities.
11

About the City
Community Profile
FY22 Budget
American Community Survey Data Gaithersburg Maryland
Population, 2019 estimate 67,742 6,018,848 Population, 2010 (April 1) estimates base 59,903 5,773,794 Population, percent change – April 1, 2010 to July 1, 2018 13.1% 4.2% Population, 2010 59,933 5,773,552 Persons under 5 years, percent , 2015-2019 6.7% 6.1% Persons under 18 years, percent, 2015-2019 22.9% 22.3% Persons 65 years and over, percent, 2015-2019 11.5% 15.0% Female persons, percent, 2015-2019 51.3% 51.5% White alone, percent, 2015-2019 (a) 48.8% 55.5% Black or African American alone, percent, 2015-2019 (a) 17.8% 29.9% American Indian and Alaska Native alone, percent, 2015-2019 (a) 0.3% 0.4% Asian alone, percent, 2015-2019 (a) 18.9% 6.3% Native Hawaiian and Other Pacific Islander alone, percent, 2015-2019 (a) 0.0% 0.1% Two or more races, percent, 2015-2019 4.8% 3.4% Hispanic or Latino, percent, 2015-2019 (b) 25.0% 10.1% White alone, not Hispanic or Latino, percent, 2015-2019 34.4% 50.9% Veterans, 2015-2019 2,407 365,356 Foreign born persons, percent, 2015-2019 38.1% 15.2% Housing units, 2015-2019 26,222 2,448,422 Owner-occupied housing unit rate, 2015-2019 51.2% 66.9% Median value of owner-occupied housing units, 2015-2019 $ 392,200 $ 314,800 Median gross rent, 2015-2019 $ 1,740 $ 1,392 Households, 2015-2019 24,799 2,205,204 Persons per household, 2015-2019 2.72 2.67 Living in same house 1 year ago, percent of persons age 1 year+, 2015-2019
78.6% 86.4%
Language other than English spoken at home, percent of persons age 5 years+, 2015-2019
48.8% 19.0%
High school graduate or higher, percent of persons age 25 years+, 2015-2019
88.1% 90.2%
Bachelor’s degree or higher, percent of persons age 25 years+, 2015-2019
54.0% 40.2%
Mean travel time to work (minutes), workers age 16 years+, 2015-2019 32.9 33.2 Median household income (in 2019 dollars), 2015-2019 $ 89,763 $ 84,805 Per capita income in last 12 months (in 2019 dollars), 2015-2019 $ 44,737 $ 42,122 (a) Includes persons reporting only one race. (b) Hispanics may be of any race, so also are included in applicable race categories. Sources: U.S. Census Bureau, 2015-2019 American Community Survey 5-Year Estimates
12

About the City
Community Profile
FY22 Budget
The City takes pride in many things but is best known for being one of the most diverse cities in the United States and being a debt-free community. While the City has grown to be the fourth largest in Maryland, it maintains a small town feel through numerous special events. In particular, the City is known for the Gaithersburg Book Festival and Winter Lights. Since its inception in 2010, the Festival has quickly become one of the nation’s top literary events, attracting hundreds of award-winning and best-selling authors, poets and songwriters from across the country. It is estimated that the one-day, in-person event held in mid-May, attracts an estimated 25,000 attendees. The popularity of the Festival is such that when reimagined as a virtual festival due to the COVID-19 pandemic, the new Gaithersburg Book Festival YouTube channel saw strong subscribership. Overall, the FY20 virtual Gaithersburg Book Festival had 5,588 unique viewers watching 913.7 hours of content and gained 832 new subscribers.
Winter Lights takes visitors past hundreds of dazzling light displays and beautifully lit trees on a 3.5 mile drive through Seneca Creek State Park. In November 2020, this beloved event celebrated 25 years of creating joyful memories for the more than 1.2 million visitors Themed areas include Winter Woods, Victorian Village, the North Pole, and the new Enchanted Forest. The Winter Lights event is open nightly from Late November through December 31 (closed on December 25). In addition to the nightly displays, the City offers a series of special evening events including: Leashes n’ Lights, S’more Lights and Wine Under the Lights.
13

About the City
Community Profile
FY22 Budget
Following is information about the City’s major taxpayers and employers from the City’s FY20 Comprehensive Annual Financial Report.
Largest Taxpayers
Taxpayer Assessed Valuation % of Total AstraZeneca 365,574,600 3.34% Asbury Methodist Village 250,505,200 2.29% Alexandria Real Estate Equities 247,095,200 2.25% BF Saul 167,061,700 1.52% RPAI 134,336,900 1.23% Bozzuto 127,267,300 1.16% Federal Realty Investment Trust 116,301,000 1.06% Orlo Gaithersburg LLC 114,653,400 1.05% KIMCO 106,055,900 0.97% BP Realty Investment 105,167,500 0.96% Total $ 1,734,018,700 15.82% Total Assessed Valuation $ 10,961,047,190
Major Employers
Employer Number of
Employees* Percentage of Total County Employment
AstraZeneca 4,000 0.71% National Institute of Standards and Technology 2,798 0.50% Leidos (former Lockheed Martin) 1,515 0.27% Asbury Methodist Village 771 0.14% Hughes Network Systems, LLC 729 0.13% Sodexo USA 536 0.10% Adventist HealthCare 495 0.09% GeneDX, Inc. 350 0.06% Kaiser Permanente 350 0.06% Emergent BioSolutions 347 0.06% Total 11,891 2.12% Total Montgomery County Civilian Labor Force 561,120 *Data for total employees available for county only
14

About the City
Community Profile
FY22 Budget
List of Principal Officials
Title Name Mayor Jud Ashman City Council Neil Harris Laurie-Anne Sayles Michael A. Sesma Ryan Spiegel Robert T. Wu City Manager Tanisha Briley Deputy City Manager Dennis Enslinger Assistant City Manager Thomas Lonergan City Attorney N. Lynn Board Department Directors Community & Public Relations Britta Monaco Finance & Administration Kim Francisco Human Resources Kim Yocklin Information Technology Peter Cottrell Parks, Recreation & Culture Carolyn Muller Planning & Code Administration John Schlichting Police Mark Sroka Public Works Anthony Berger
Department of Finance & Administration Accounting Specialist Diana Aguinaga Accountant II Janice Gacuma Administrative Assistant II Brittany Saravia Chief Accountant Francis Dohnji Comptroller Janice Hartman Director Kim Francisco Payroll Coordinator Larry Salins Procurement Division Chief Melayne A. C. Richards Senior Accounting Technician Witarani Doyle Senior Budget Analyst Nathan Bassett
15

Advisory Boards &Commissions
City of Gaithersburg, MarylandGaithersburg Citizens
N. Lynn BoardCity Attorney
Registration & Elections
Tanisha BrileyCity Manager
Dennis EnslingerDeputy City Manager
Planning & Code Administration John Schlichting
Human ResourcesKim YocklinDirector
Information TechnologyPeter Cottrell
Public WorksTony BergerDirector
Tom LonerganAssistant City Manager
Economic Development
Housing & Community Development
Finance & Administration Kimberly Francisco
Parks, Recreation & Culture Carolyn Muller
PoliceMark Sroka
Jud AshmanMayor
Robert T. WuCouncil Member
Neil HarrisCouncil Member
Laurie-Anne SaylesCouncil Member
Michael A. SesmaCouncil Vice President
Ryan SpiegelCouncil Member
Legislative Affairs
Community & Public RelationsBritta Monaco
Mayor & Council Services
Racial Equity Program
16

About the City
Community Profile
FY22 Budget
Other Budget Resources and Links
Gaithersburg City Charter:
https://library.municode.com/md/gaithersburg/codes/code_of_ordinances?nodeId=PTITHCH
Gaithersburg Budget and Strategic Planning page:
https://www.gaithersburgmd.gov/government/budget-strategic-planning
Gaithersburg Projects in the City Overview page:
https://www.gaithersburgmd.gov/government/projects-in-the-city
Gaithersburg Police Services page:
https://www.gaithersburgmd.gov/services/police-services
Gaithersburg Recreation page:
https://www.gaithersburgmd.gov/recreation
Gaithersburg Service Request page:
https://www.gaithersburgmd.gov/services/request-for-service
Gaithersburg Contact page:
https://www.gaithersburgmd.gov/how-do-i/contact
Gaithersburg City Facebook page:
http://www.facebook.com/gburgmd
Gaithersburg City Twitter account:
http://twitter.com/gburgmd
Gaithersburg City YouTube Page:
http://www.youtube.com/c/gburgmd
Gaithersburg City Nextdoor Page:
https://nextdoor.com/agency-detail/md/gaithersburg/city-of-gaithersburg/
Gaithersburg City Instagram Account:
https://www.instagram.com/gburgmd/
17

About the City
Strategic Plan
FY22 Budget
The Strategic Plan is so integral to the budget process that it is included in the City’s budget document and highlights are included in the budget letter. The Strategic Plan documents how the City operationalizes the overall vision, mission and guiding principles for the following year, moving from the highest level vision and mission, first into Strategic Directions, then into Key Strategies. Next, the Plan identifies Objectives for each Key Strategy. The last section of each Strategic Direction provides annual goals, called Key Action Items that were developed to move Objectives forward. Critical Measures have been developed to help with understanding how well the City is moving forward with each Strategic Direction. As described in the Budget Timeline section, the Strategic Plan is updated and discussed annually and early in the budgeting process. Through this planning process, Department Directors develop their work plans and financial needs for the budget year. The City believes all parts of the Strategic Plan have a budget impact as Key Action Items are completed mainly by internal staff; however, some Key Action Items also result in the need for additional purchases or budget requests. Those items are listed below by Strategic Direction and include the account number where the additional funds have been budgeted, or the Capital Improvement Plan project number for those Key Action Items related to capital projects.
Action Item Budget Impact
City Administration
Migrate City users to Microsoft 365 platform for Office and e-mail applications
CIP 0000175 – Cloud Data Governance CIP 0000178 – Microsoft 365 Migration Citywide-531000 - $132,391
Develop and implement an employee engagement plan 1135-546300 – In-Service Training $25,000 Implement new hybrid elections process and evaluate effectiveness 1122-522000 – General Operating Supplies
$22,000 1122-556000 – Postage $56,750
Develop a Citywide plan to address racial equity 1131-546300 – In-Service Training $24,200 1131-Personnel Accounts – Racial Equity Program Manager position - $139,081
Communication
Conduct and report results of 2021 Biennial Citizen Survey 1212-536000 – Miscellaneous Professional Services $20,000
Develop and implement communication campaign for 2021 municipal elections
1122-541000 – Advertising $2,300 1122-553000 – Printing & Binding $24,375 1122-554000 – Signage $3,000
Environment
Complete Year 2 of LED Streetlight conversion project CIP 0000151 – LED Streetlight Conversion Expand the scope of the Rainscapes Rewards program to include tree planting
3361-548100 – Sponsorships $30,000
Housing
Partner with a multifamily rental property seeking to make appropriate upgrades to its units utilizing the City HIF loan funds
2142-560000 – Miscellaneous $2,100,000
Work with Neighborhood Services and Community Services to reduce the number of households receiving “writs of eviction” and the subsequent loss of their housing
1142-543000 – Contributions $76,392
Infrastructure and Facilities
Complete construction of the park at the former CPSC site CIP 0000011 – Pleasant View Park (CPSC)
Complete the replacement of the fuel tanks at Public Works CIP 0000049 – Public Works – Fuel Facility
Complete construction on Olde Towne fiber duct bank project CIP 0000135 – Olde Towne – Fiber Duct Bank Installation Project
18

About the City
Strategic Plan
FY22 Budget
Action Item Budget Impact
Infrastructure and Facilities (Cont.)
Begin the design of the buildout of the remaining section of 16 S. Summit Avenue
CIP 0000149 – Buildout of 16 South Summit Avenue
Complete the construction of the new Police Station and Mayor & City Council Chambers
CIP 0000007 – Gaithersburg Police Station CIP 0000114 – Mayor & City Council Chambers CIP 0000163 – 16 South Summit Avenue IT Buildout
Begin the design of the renovations of City Hall CIP 0000048 – Future City Hall Projects
Begin/Complete the design of the roof replacement at the Activity Center CIP 0000061 – Activity Center – Roof Replacement
Replace the Casey Community Center Electronic Sign CIP 0000120 – Casey Community Center Electronic Sign
Work with MCPS to build the New Gaithersburg Elementary School Turf Field
CIP 0000162 – New Gaithersburg Elementary School Turf Field
Complete the Crown Farm Park restoration of the Corn Crib CIP 0000008 – Crown Farm Historic Park Begin the design on the remaining elements of Crown Farm Park Parks, Recreation, and Culture
Construction of park at CPSC CIP 0000011 – Pleasant View Park (CPSC) Construct the synthetic turf field at Robertson park Field #3 CIP 0000082 - Robertson Park Field #3 -
Synthetic Turf Installation Design replacement of the Pump & Filter Room CIP 0000062 – Water Park Filtration, Motors &
Pumps Develop community art process with public art vendor for design and fabrication of Diamond Farms Skate Spot art work
CIP 0000108 – Diamond Farms Skate Spot Art Project
Launch Gateway to Gaithersburg public art project, community mural program, and partner with G-PARC for artist-made trail markers
CIP 0000107 – Olde Towne Art Project CIP 0000128 – Park Trail Markers Art Project CIP 0000180 – Community Mural Project
Planning & Development
Transition from Energov’s (City’s permitting software) Citizen’s Access Port (CAP) to Customer Self-Service (CSS) account
1192-531000 - IT (Non-Consultant) Services $10,000
Police Recruit and hire four police officers to enable the department to remain at authorized staffing levels
1211 – Personnel Accounts – First year cost of $85K to $96K per officer
Transportation
Complete evaluations of three school sites within the City for school zone effectiveness and capacity to support the Safe Routes to School program
1351-532000 – Engineering & Architecture $45,000
Complete annual cycle of structural condition inspections for City bridges culverts and special structures
1351-532000 – Engineering & Architecture $45,000
Replace pedestrian bridge behind Casey Community Center CIP 0000168 – Casey Community Center Pedestrian Bridge
Complete the construction phase of Tschiffely Square road culvert repairs CIP 0000142 – ZC22CPR – Tschiffely Square Road Culvert Maintenance Repair CIP 000143 - ZC53CPR - Tschiffely Square Culvert Maintenance Repair Project
Even though the City is managed through individual Departments, many Key Action Items and Critical Measures are achieved through coordination of multiple departments. Because of this tight coordination, the Strategic Plan is presented as a consolidated document, rather than attempting to departmentalize these cohesive efforts.
19

Strategic PlanAn Overall Approach to Achieving the Vision of the City of Gaithersburg
Fiscal Year 2022www.gaithersburgmd.gov
20

Strategic Plan Components
‐ i ‐
Mission & Vision Statement
Description of what the City of Gaithersburg exists to do (Mission) and the characteristics that define it as a community (Vision).
Guiding Principles
Key Strategies
Objectives
Critical Measures
Description of the manner in which the City government will conduct business, pursue the Vision and fulfill its Mission.
Approaches intended to implement a Strategic Direction.
Individual actions and/or initiatives utilized to implement a Key Strategy.
Specific data providing objective verification that Strategic Directions are being achieved.
The eleven primary elements of the City Strategic Plan, each relating to a specific area of focus.
Strategic Directions
21

Mission & Vision
‐ ii ‐
Mission: The Gaithersburg City government exists to provide quality, cost effective, priority community services for its citizens. We are a City that serves as a catalyst for the involvement of residents, businesses and organizations to ensure that Gaithersburg is a great place to live, work, learn, and play.
Lives by the Six Pillars of CHARACTER COUNTS!® (trustworthiness, respect, responsibility, fairness, caring, and citizenship)
Has retained the best qualities of a small town and respects its heritage, while embracing the opportunities that new technologies, programs and concepts in urban design provide
Has involved and supportive citizens and businesses reflecting the diversity of the community
Has a fiscally conservative, proactive government
Has safe, livable neighborhoods with a variety of housing types and styles served by diverse transportation options
Has excellent learning opportunities that meet the needs of the community
Has attractive and beautifully maintained parks and public places
Has citizens and institutions that value cultural diversity and inclusion and seeks ways to promote involvement from all cultural groups
Has many leisure time activities that meet the needs of the community
Has citizens with a strong sense of community and individual responsibility
Has a natural environment that is protected, respected and enhanced
Has strong partnerships to meet the needs of the community
Has a community that encourages individual health and wellness
Has a commitment to sustainable practices that promote social equity, environmental health and economic prosperity
Vision: Gaithersburg will be a City that:
22

Guiding Principles
‐ iii ‐
Customer FocusWe actively pursue the identification of citizen needs through citizen involvement to provide effective service to our community with efficiency, accountability and a caring attitude.
Open Communication
Creativity
Fiscal Responsibility
Cooperation
Commitment to Excellence
Continuous Improvement
We promote honest, open communication and easy access to information.
We strive to improve the quality and efficiency of City services through creative approaches and new, innovative and cost effective technologies.
We provide quality services, of the best value, to effectively meet the needs of our community while maintaining a pay‐as‐you‐go philosophy.
We promote a spirit of fairness, trustworthiness, respect, and teamwork among our elected officials, City employees, residential and business communities, neighboring jurisdictions, and other governmental agencies.
We strive to achieve excellence in all we do.
We advocate good citizenship and support the freedom to actively pursue suggestions, ideas and creative approaches, leading to continuous improvement in everything we do.
23

Key Strategies
Potential Strategy Conflicts‐
Gaithersburg Strategic Plan – FY 2022
City AdministrationProvide the highest levels of resident, visitor and business
services through the continual enhancement of administrative and support functions
• Maintain employee compensation program balancing internal equity and external competitiveness with financial sustainability
• Develop efficient, transparent processes/systems to provide financial information and foster sustainability
• Provide engaged, professional, diverse, and enthusiastic staff to serve City needs
• Ensure City policies and processes reflect City’s values, mission and vision
• Invest in/maintain technology to gain efficiencies, improve operational effectiveness, increase productivity, and assist in information dissemination
• Ensure maintenance of key City services while acknowledging changes in demographics, population growth and/or economic conditions
• Ensure effective and efficient communication among employees, citizens and stakeholders
• Maintain intergovernmental and lobbying activities to enhance City resources and residents’ quality of life
24

Objectives
• Offer wellness incentive programs that will encourage employees to lead a healthy and active lifestyle while helping the City reduce health care costs
• Facilitate the retirement transition process for employees
• Provide programs and processes aimed at maintaining a healthy, active workforce
• Maintain salary structures that are externally competitive, internally equitable and sustainable
• Provide training for departmental hiring managers on recruitment and selection best practices to build and maintain a talented and diverse workforce
• Provide an employee benefits strategy based on shared City and employee financial responsibilities, cost predictability, and appropriate plan design
• Maintain balanced personnel policies that reflect evolving expectations of the workforce
Maintain employee compensation program balancing internal equity and external competitiveness with financial sustainability
• Safeguard and maximize the use of resources through risk management, prudent investments, and best financial management practices
• Review and improve financial processes and procedures to remain current with changing needs and technology
• Provide timely, relevant financial information to decision makers and the public
• Ensure financial sustainability through long range financial planning and encouraging long term decision making
• Ensure budget document and financial statements continue to meet Government Finance Officers Associations (GFOA’s) Distinguished Budget Presentation Award and Excellence in Financial Reporting Award criteria
Develop efficient, transparent processes/systems to provide financial information and foster sustainability
25

Objectives
• Utilize a 360° leadership evaluation system to engage employees in the personnel review process
• Employ performance measurement systems that provide feedback for decision making
• Provide a competitive and sustainable benefits package to recruit/retain high caliber employees
• Continually address compensation equity policies
• Build an environment of employee professionalism, engagement, empowerment, and involvement that supports an effective operating environment
• Develop succession strategies for key positions/job classes to prepare for potential turnover and loss of organizational knowledge
• Provide opportunities to improve organizational capability and effectiveness
• Encourage and seek out employee feedback on issues in the workplace
• Engage employees in determining how work is performed to enhance ownership and accountability
• Provide training, organizational development and career management opportunities to meet the changing needs of the City
• Provide opportunities for cross-departmental cooperation and promotion
• Develop and implement safety programs and incentives to achieve safety goals
Provide engaged, professional, diverse, and enthusiastic staff to serve City needs
26

Objectives
• Administer a fair, accurate and responsive election process
• Emphasize ethical conduct through employee training and adherence to the City Ethics Code
• Ensure an open and transparent government
• Ensure CHARACTER COUNTS! concepts are reflected in the City’s programs, events and activities
• Prioritize processes for identifying and implementing innovation within the organization
• Maintain fair and ethical employment and procurement practices
• Utilize “Green Purchasing” policies
• Ensure City services are able to respond to the needs of a diverse community
• Provide managers and supervisors with knowledge, tools, resources, and a policy framework that facilitates accurate and consistent interpretation of policies
• Promote a “values driven” organizational culture that reinforces ethical behavior, exercises transparency, and maintains the public trust
Ensure City policies and processes reflect City’s values, mission and vision
27

Objectives
Invest in/maintaintechnology to gain efficiencies, improve operational effectiveness, increase productivity, and assist in information dissemination
• Enhance customer service and reduce costs through investments in automation and technology
• Focus on energy management and resource conservation in City operations and purchasing
• Maintain a resilient and robust network to host technologies that provide continuity of operations and new functionality
• Facilitate transparency in City processes by ensuring ease of citizen access to information
• Balance increasing data storage needs with operational effectiveness
• Maintain continuity of operations and disaster recoverability by increasing redundancy and resiliency of key systems
• Use new technologies to increase the transparency of local government, including GIS mapping techniques, statistical data tools and access to public records
• Enhance service to citizens, businesses and others through information technology by providing more services and information to citizens
• Minimize the variation of hardware platforms, operating systems, network infrastructure, and database and application development to allow for ease of maintenance, facilitate training and reduce the total cost of ownership
• Maintain accurate and up-to-date databases to support decision making and transparency
28

Objectives
• Ensure the organization is structured in a manner that facilitates quality service, cooperation, teamwork, and communication and is flexible and adaptable to changing conditions
• Sustain an organizational environment that acknowledges and celebrates diversity and employs inclusive practices throughout daily operations
• Utilize hiring and retention strategies that encourage and produce a qualified and diverse workforce
• Identify all strategies for key City service delivery in the Strategic Plan document
• Maintain strategies to address current and future organizational needs including optimal workforce size, structure and space needs
• Utilize Strategic Plan in identifying budget priorities
Ensure maintenance of key City services while acknowledging changes in demographics, population growth and/or economic conditions
• Utilize best practices in the communication processes used to keep employees informed of changing information (i.e. staffing and promotions, policies and procedures, benefit changes, etc.)
• Conduct regular open forums and focus groups with departments/employee groups
• Provide periodic written communication from the City Manager to employees and other appropriate stakeholders
• Host events/programs to sustain morale among employees
• Utilize biennial Citizen Survey data to allocate resources to areas of greatest need
• Solicit employee feedback on key decisions
• Improve employee accessibility to technology and the City of Gaithersburg website
Ensure effective and efficient communication among employees, citizens and stakeholders
29

Objectives
• Maintain close working relationships with representatives of all levels of government and continually seek funding and grant opportunities for City priorities
• Evaluate services and programs that are duplicated by other levels of government/private sector and work to eliminate/reduce redundancies
• Forge partnerships with peer local governments and associated advocacy groups to maintain a leadership role on broad policy issues
• Ensure accurate assessment of real property within the City to provide for timely, equitable collection of taxes
• Work with local municipalities and Montgomery County on issues associated with tax duplication
Maintain intergovernmental and lobbying activities to enhance City resources and residents’ quality of life
30

Action Items
FY 2021 Key Action Items
Develop a workforce plan that addresses appropriate staffing levels and space allocation needs
Establish a program to provide periodic introductory training for City employees in the City's computing environment
Perform tactical and strategic analysis of the City’s network
Complete implementation of asset management system
Work with MCPS to finalize agreement for proposed new elementary school for the Gaithersburg Cluster and present to M&CC for consideration
Coordinate the construction of 16 S. Summit and support the provisioning and commissioning of the Police and Council Chamber technical infrastructure
Determine areas where the work of the Racial Equity Learning Cohort may be applied within City programs, processes and services
FY 2022 Key Action Items
Develop a workforce plan that addresses appropriate staffing levels and space allocation needs
Establish a program to provide periodic introductory training for City employees in the City's computing environment
Migrate City users to Microsoft 365 platform for Office and e-mail applications
Develop a Citywide plan to advance racial equity
Conduct a full review of administrative and personnel policies
Develop a plan to align long-term capital needs with funding
Develop and implement an employee engagement plan
Implement new hybrid elections process and evaluate effectiveness
Refresh the Strategic Directions Plan and improve the reporting process
31

Critical Measures
The chart above compares the City’s actual unassigned fund balance to the current fund balance policy target of 25% on a three-year expenditure average. When actual results are compared to this target, it appears that the unassigned fund balance is higher than the target. The City’s current policy target is similar to that used by many other jurisdictions. However, most other government entities issue debt for large capital projects.
The City’s current policy does not take into account the use of unassigned fund balance in place of debt issuance. This means that in years when the City has large capital project expenditures, the unassigned fund balance would be depleted. Conversely, in other years it would be expected that additional funds would be added to the unassigned fund balance as the City saves for future year projects. The FY20 – FY26 projection shows an expected use of fund balance of $36.6 million (or 70% of the three-year expenditure average), which would put the City’s fund balance below the policy target threshold of 25%. The 5-year plan and estimated unassigned fund balance is reviewed annually to ensure long-term sustainability of the City’s budget and operations. Over the past five years, the unassigned fund balance has seen a steady annual decrease averaging 10.65% (reduction of 42.61% during this period), though the balance increased slightly in FY20 due to expenditure reductions during the COVID-19 pandemic.
Analysis
125.22%
111.30%
91.31%
82.03% 82.61%
25.00% 25.00% 25.00% 25.00% 25.00%
0.00%
20.00%
40.00%
60.00%
80.00%
100.00%
120.00%
140.00%
2016 2017 2018 2019 2020
Unassigned (UA) Fund Balance as a Percentage of the 3‐Year Expenditure Average
UA Fund Balance Policy Target
32

Critical Measures
Analysis
The City desires to budget accurately so as to maximize use of City resources and has established a target of budgeting within 10% of actual results. This was achieved in fiscal years 2014 – 2020 for revenues and in 2016 - 2020 for expenditures.
During the FY20 budget, the City continued using estimated projections in the current fiscal year to refine the budget forecast and update the revenue budget based on the change in estimates. Revenues remain difficult to budget due to timing differences for the receipt of large capital grants, unpredictability in permitting revenues, and unexpected tax revenue growth. The conservative nature of City revenue budgets reduced the variance for revenues in FY20, while increasing the expense variance, as we saw reductions in both revenues and expenses for FY20.
5.00%
2.30%
3.25%
1.55%
5.60%
9.47%
8.77%
4.69%
6.09%
0.02%
0%
1%
2%
3%
4%
5%
6%
7%
8%
9%
10%
2016 2017 2018 2019 2020
Budget Variances 2016 – 2020
Expenditure Variance Revenue Variance
33

Critical Measures
Analysis
Expenditures of In-Service Training increased each year from FY14 to FY16 relative to full-time salaries. Beginning with FY17, expenditures leveled off as a result of closed training gaps. However, in FY19 expenditures increased due to greater efforts for in-house training.This is in keeping with adopted key strategies and objectives. This comparison is for Conference and In-Service Training in relation to full-time salaries.
$138,479 $131,610
$137,593
$187,166
$135,448
0.68%0.61% 0.61%
0.82%
0.56%
0.00%
0.50%
1.00%
1.50%
2.00%
2.50%
3.00%
$‐
$20,000
$40,000
$60,000
$80,000
$100,000
$120,000
$140,000
$160,000
$180,000
$200,000
FY16 FY17 FY18 FY19 FY20
Citywide Training Expenditures and Comparison to Full‐time Salaries
Training Training % of Salaries
34

Critical Measures
Citizen Survey Responses – “Excellent” or “Good”
350 responses were received for the 2019 survey, compared to 363 in 2017. We were higher than the benchmark in several categories, including the quality of sidewalk and storm drain maintenance and the quality of our recreation programs and centers. We were much higher in the use of public transit, ranking #20 amongst 214 communities. Gaithersburg’s reputation for openness and acceptance also ranked higher than the national benchmark. We were #11 amongst 289 communities. The next survey is scheduled for the fall of 2021.
Analysis
79%
75%
64%
79%
76%
75%
73%
66%
79%
74%
75%
71%
67%
76%
73%
80%
72%
73%
81%
75%
80%
82%
75%
88%
88%
0% 20% 40% 60% 80% 100%
Overall Quality of Life
Overall Appearance
Image/Reputation ofCity
Overall City Services
Impression of CityEmployees
2019 2017 2015 2013 2011
35

Key Strategies
Potential Strategy Conflicts‐
Gaithersburg Strategic Plan – FY 2022
Communication
Ensure effective and consistent communication activities with residents, businesses and visitors using new technologies and
innovative approaches that ensure transparency and encourage dialog
• Engage citizenry in diverse and meaningful ways, providing opportunities for two-way communication and involvement
• Maximize use of electronic communication to provide comprehensive, timely and accurate information
• Inform citizens of news, services, programs, and events with unique and compelling video productions
• Ensure accurate and comprehensive coverage of City news, events and emergency communications by external sources
• Market/brand the City and increase exposure through effective multimedia campaigns and special events
• Environment –efforts to reduce printed materials
36

Objectives
Engage citizenry in diverse and meaningful ways, providing opportunities for two‐way communication and involvement
• Foster involvement and provide opportunity for dialog through advisory committees, surveys, community meetings, volunteer opportunities, and recognition events
• Implement communication plan for City news and events, projects and initiatives, considering all communication tools including digital and print
• Produce creative and engaging marketing materials and publications to inform citizens of City news, programs and events
• Use citizen feedback such as online polls and citizen surveys to aid in strategic planning
• Monitor community demography and tailor communications as appropriate
• Utilize highest reasonable level of personalization in direct citizen outreach
• Maintain an effective, efficient website that ensures transparency, is responsive to the needs of users, communicates City strategies, priorities, news, and events, and provides opportunity for dialog
• Leverage social networking opportunities to expand the reach of the City’s message
• Expand opt-in opportunities for citizen engagement
• Ensure that communications are maximized to take advantage of emerging technologies
• Conduct ongoing campaigns to educate citizenry about features and opportunities available on website and social networking platforms, using a variety of outlets to maximize reach
Maximize use of electronic communication to provide comprehensive, timely and accurate information
37

Objectives
Inform citizens of news, services, programs, and events with unique and compelling video productions
• Ensure transparency through the live broadcast of select public meetings
• Produce and promote programs in a variety of formats and across multiple platforms (with an emphasis on social media) that benefit the City both strategically and economically
• Monitor industry and leverage opportunities for broader programming exposure, including improving viewing opportunities for GTV by taking advantage of online scheduling features
• Maximize use of drone within established guidelines to provide images for marketing, planning, mapping, and other operational purposes
• Maintain collaborative relationships with other Public/Education/Government (PEG) entities and service providers
• Foster working relationships with local media and community-based groups
• Communicate the City’s message to a broad audience, leveraging existing physical and digital communities such as HOAs, Neighborhood Watch Groups, ListServs, and “Citizen Ambassadors”
• Maximize the use and effectiveness of emergency notification systems
• Maintain involvement and maximize opportunities for regionwide communication through participation in the Metropolitan Washington Council of Governments public information groups and other professional associations
Ensure accurate and comprehensive coverage of City news, events and emergency communications by external sources
38

Objectives
Market/brand the City and increase exposure through effective multimedia campaigns and special events
• Develop multimedia messaging strategy to position Gaithersburg as a desirable place in which to live and do business. Ensure messaging is consistent and non-contradictory across City departments
• Leverage involvement with professional and trade associations and explore opportunities for cooperative advertising and promotion
• Consider all special events as messaging opportunities, taking advantage of captive audiences to communicate the City’s strategies and priorities as appropriate
• Generate awareness and maximize attendance for events and programs with marketing initiatives that cross departmental boundaries and focus on collaborative promotions
39

Action Items
FY 2021 Key Action Items
Conduct campaign to increase resident engagement by highlighting City employees and volunteers through social media and newsletter features
Expand style guide to include branding guidelines and basic design templates. Develop process for and conduct periodic audits and hold trainings to ensure consistent and appropriate use of City logos and other marketing elements across multiple platforms
Establish guidelines and develop a standardized process for incorporating messaging on a growing inventory of internal and external digital signs
With input from Facebook about its algorithms and by reviewing best practices from other government agencies, refine video content for maximum engagement on social media
Explore the idea of a “Chairpersons’ Luncheon” with Advisory Committee chairs to share ideas and cross-collaborate on key City initiatives
Explore the idea of a “Chairpersons’ Luncheon” with Advisory Committee chairs to share ideas and cross-collaborate on key City initiatives
Support a cross-departmental initiative to highlight the City’s diversity. Support efforts to increase engagement in hard to reach communities and explore and implement efforts to increase accessibility to digital content.
Conduct and report results of 2021 Biennial Citizen Survey
Develop and implement communication campaign for 2021 municipal elections
Inform stakeholders of updates to significant City projects by developing a consistent process for status communication
Integrate communication strategy into new Cable Channel playback system, ensuring consistency with brand identity and leveraging resources for a growing inventory of digital signage
Implement comprehensive public outreach for Capital Improvement Projects
FY 2022 Key Action Items
40

Critical Measures
This chart shows total website page views for 2016 - 2020. Over the years, some website content has transitioned to microsites that include map galleries, meeting agendas, class/program registration and ticketing sites. This accounts for some of the fluctuations over time. Also, an enhanced search function has improved the user experience, but has likely led to fewer page clicks.
December 2020 saw the highest website traffic for any single month since we started keeping records in 2012. Winter Lights was the most viewed page for 2020 by a large margin and offset what otherwise would have been a significant decline in traffic due to the COVID-related cancellations of so many other programs.
Our most visited pages for 2020 also included COVID Updates, Water Park, the new Bulk Pick Up program, and Farmers Markets.
Analysis
1,841,934
1,504,479
1,076,559
1,568,157
1,393,661
0
200,000
400,000
600,000
800,000
1,000,000
1,200,000
1,400,000
1,600,000
1,800,000
2,000,000
Total Website Page Views
2016 2017 2018 2019 2020
41

Critical Measures
Analysis
This chart shows Facebook growth by measuring the number of likes across all City pages. As of January 1, 2021, there were a total of 27,934 likes across 11 Facebook pages. Steady growth continues to be a trend. Overall, we saw an 11% increase (2,771 new likes) from the beginning of 2020 to the beginning of 2021.
14,496
18,254
21,545
25,163
27,934
0
5,000
10,000
15,000
20,000
25,000
30,000
Facebook Likes as of January 1 of Each YearAll City Facebook Pages
2017 2018 2019 2020 2021
42

Critical Measures
Analysis
The above chart measures growth on the City of Gaithersburg Government page (@GburgMD). There was a 10% increase (594 new likes) from the start of 2020 to the start of 2021. Over the five-year period, we have seen a 62% increase in likes.
The following pages break down the number of likes for all of the other Facebook accounts. Recommendations based on the data are on page 24.
4,204
4,874
5,521
6,216
6,810
0
1,000
2,000
3,000
4,000
5,000
6,000
7,000
8,000
Facebook Likes as of January 1 of Each YearCity Government Facebook Page
2017 2018 2019 2020 2021
43

Critical Measures
From the start of 2020 to the start of 2021, the Special Events page saw a 5% increase (327 new likes), the Parks & Recreation page saw a 10% increase (266 new likes), the Arts on the Green page saw a 10% increase (197 new likes), and the Community Museum page saw an 12% increase (202 new likes).
Analysis
Facebook Likes as of January 1 of Each Year
3,811
5,0225,569
6,244 6,571
0
2,000
4,000
6,000
8,000
Special Events
2017 2018 2019 2020 2021
1,3501,768
2,3092,647
2,913
0
1,000
2,000
3,000
4,000
Parks & Recreation
2017 2018 2019 2020 2021
9781,283
1,585
1,9072,104
0
500
1,000
1,500
2,000
2,500
Arts on the Green
2017 2018 2019 2020 2021
636926
1,283
1,7251,927
0
500
1,000
1,500
2,000
2,500
Community Museum
2017 2018 2019 2020 2021
44

Critical Measures
From the start of 2020 to the start of 2021, the Kentlands Mansion page saw a 12% increase (190 new likes), the Farmers Market page saw a 20% increase (271 new likes), the Casey Community Center page saw a 40% increase (173 new likes), and the Benjamin Gaither Center page saw a 20% increase (62 new likes).
Analysis
Facebook Likes as of January 1 of Each Year
8821,093
1,335
1,6191,809
0
500
1,000
1,500
2,000
Kentlands Mansion
2017 2018 2019 2020 2021
674901
1,077
1,367
1,638
0
500
1,000
1,500
2,000
Farmers Markets
2017 2018 2019 2020 2021
51141
233
433
606
0
200
400
600
800
Casey Community Center
2017 2018 2019 2020 2021
168215
268308
370
0
100
200
300
400
Benjamin Gaither Center
2017 2018 2019 2020 2021
45

Critical Measures
From the start of 2020 to the start of 2021, the Gaithersburg Police Department page saw a 17% increase (449 new likes) and the Bank On Gaithersburg page saw a 36% increase (40 new likes).
Facebook awareness campaigns would help grow a larger audience and following. Our thought is that by growing our audience with organic and paid strategies, we will increase community engagement and program participation and help to meet revenue goals. Campaigns would include engaging content highlighting City staff and community members, paid advertising targeting a relevant audience, and sharing content with community ambassadors.
We will be working with Facebook to have all City pages verified, thus prioritizing our pages in search results (Facebook’s algorithm automatically places verified pages at the top of search results). The stronger search presence is key to helping gain new followers and receive a higher rate of engagement. Verifying our pages also ensures our followers the authenticity of our pages and information.
Due to the pandemic, training with our Facebook representative was postponed in 2020. It is scheduled to take place on March 5, 2021. Training will consist of best practices and algorithm changes in a continued effort to grow and engage on the platform.
Analysis
Facebook Likes as of January 1 of Each Year
1,6781,960
2,2832,585
3,034
0
1,000
2,000
3,000
4,000
Gaithersburg Police Dept.
2017 2018 2019 2020 2021
64 7182
112
152
0
50
100
150
200
Bank On Gaithersburg
2017 2018 2019 2020 2021
46

Critical Measures
These charts show Twitter growth by measuring the number of followers. Overall, we have a total of 10,932 follows on eight accounts (see remaining charts on page 27). We saw a 17% increase (1,584 new followers) from the beginning of 2020 to the beginning of 2021.
On the City Government Twitter account, we increased our number of followers by 17% from the beginning of 2020 to the beginning of 2021, with 816 new followers.
Analysis
Twitter Followers as of January 1 of Each Year
3,013
3,984
4,878
5,694
0
1,000
2,000
3,000
4,000
5,000
6,000
City Government
2018 2019 2020 2021
1,690
2,158
2,530
3,193
0
500
1,000
1,500
2,000
2,500
3,000
3,500
Gaithersburg Police
2018 2019 2020 2021
352
500
611680
0
200
400
600
800
Grow Gaithersburg
2018 2019 2020 2021
103 109
131141
0
50
100
150
Bank On Gaithersburg
2018 2019 2020 2021
47

Critical Measures
The Sports and Aquatics Twitter accounts are primarily used to post cancellations that are integrated onto the City website so participants can get real-time updates during weekends and off-hours.
To increase growth on Twitter, we encourage increasing the volume of tweets and engaging with replies, retweets and tags. We also recommend evaluating the Twitter presence of some programs that may be better suited to deliver information via other social media outlets.
Analysis
Twitter Followers as of January 1 of Each Year
298341
378 384
0
100
200
300
400
500
Kentlands Mansion
2018 2019 2020 2021
212
283309 304
0
50
100
150
200
250
300
350
Arts on the Green
2018 2019 2020 2021
200
266
339361
0
50
100
150
200
250
300
350
400
Sports
2018 2019 2020 2021
85
109
172 175
0
50
100
150
200
Aquatics
2018 2019 2020 2021
48

Critical Measures
(Actual Engagement Numbers)
The Engagement Rate is total engagement (likes/comments/shares) divided by reach (# of people who saw each post).
5.5%
2.7%
7.4%
4.9%
8.1%
3.0%
5.4%
4.7%
4.3%
8.0%
3.2%
4.7%
4.0%
6.3%
6.7%
5.7%
3.5%
6.1%
7.7%
4.0%
7.0%
3.4%
6.2%
3.7%
3.0%
13.7%
6.8%
5.0%
5.3%
6.0%
5.9%
8.3%
3.4%
10.9%
6.9%
17.9%
17.7%
8.1%
12.3%
6.5%
9.7%
5.5%
16.9%
4.5%
11.3%
8.6%
3.4%
22.5%
9.3%
9.2%
5.9%
5.2%
8.1%
15.8%
4.3%
City Government
Arts on the Green
Bank On Gaithersburg
Benjamin GaitherCenter
Casey CommunityCenter
Farmers Markets
Community Museum
Kentlands Mansion
Parks & Recreation
Police Department
Special Events
2020 2019 2018 2017 2016
Facebook Engagement Rate for Each City Account
(4,758)
(13,201)
(11,843)
(3,589)
(497)
(1,281)
(178)
(30,133)(28,630)
(29,067)
(9,983)(14,249)(11,632)
(24,655)(14,657)
(4,978)(3,090)
(1,540)(1,142)
(6,093)(2,822)
(3,117)(806)
(37)(48)
(11,468)(4,766)
(50,633)(44,037)
(4,084)
(1,774)
(19)
(6,053)
(35,099)
(64)
(28,631)
(42,220)
(17,979)
(6,807)(9,603)
(24,835)
(72,074)
(5,452)
(18,739)
(76,979)
(12,727)
(36,934)
(22,169)
(6,852)
(11,180)
(15,725)
(14,012)
(4,032)
(4,474)
(19,047)
49

Critical Measures
2.0%
0.2%
2.1%
1.5%
1.8%
1.6%
3.0%
2.4%
0.6%
2.4%
1.8%
2.3%
2.1%
2.6%
1.4%
2.35%
0.92%
1.59%
1.96%
2.69%
2.69%
2.14%
1.23%
0.80%
1.29%
1.00%
2.55%
0.53%
1.53%
1.20%
0.80%
2.01%
1.72%
2.12%
1.86%
0.99%
1.93%
4.30%
0.83%
City Government
Aquatics
Arts on the Green
Bank On Gaithersburg
Economic Development
Kentlands Mansion
Police Department
Sports
2020 2019 2018 2017 2016
Twitter Engagement Rate for Each City Account
(68)
(5,605)
(Actual Engagement Numbers)
(34,097)
(4,392)
(739)(921)
(3,658)
(1,270)
(671)
(174)
(2,629)
(109)
(1,730)
(75)
(36,399)(17,982)
The Engagement Rate is total engagement (likes/comments/shares) divided by reach (# of people who saw each post).
(32,356)
(491)
(4,605)
(302)
(4,296)
(1,357)
(4,286)
(763)
(1123)(145)
(659)(244)
(11615)
(7516)
(676)
(1139)
(4291)
(3428)
(2566)
(1053)
(32,693)
(451)
(591)
50

Critical Measures
Analysis
The charts on pages 28 and 29 show both engagements and engagement rates for Facebook and Twitter.
The City Government Facebook page had a total of 72,074 engagements. Campaigns related to COVID-19 led the way, while event cancellations also saw high engagement. The most engaging post was the Winter Lights Festival ticketing alert (4.7k engagements and clicks, 26.8k reach). Other notable engagements & clicks: Discovery Park Ribbon Cutting photos and Facebook Live (1.8k and 724 respectively); Frank Willard Environmental Award (759), West Riding & Solitaire Court thank you photos to mail carriers and recycling crews (685).
In addition to lower engagement on some accounts likely related to fewer in-person events, 2020 also saw community outreach challenges because of the Facebook algorithm reach during the 2020 presidential election cycle. In an attempt to prevent the spread of disinformation, Facebook took stricter measures in what content was deemed political in nature, greatly affecting any paid campaigns and making it difficult for government posts to reach follower newsfeeds.
The City Government Twitter account had a total of 34,097 engagements. The most engaging tweets included the Discovery Park ribbon cutting announcement (1,600), Watkins Mill Interchange (524), Stay at Home Mug Challenge (355), and Winter Lights event alert (319).
Our Twitter audience tends to favor breaking news information on City projects while our Facebook audience favors posts highlighting community members, event alerts and City updates.
Video metrics help guide us on what types of programming work best on Facebook in reach and engagement.
Despite pausing some of our regular video programming due to the in-person nature of filming, we had a total of 56,585 minutes of video viewed on Facebook, a 19% increase over the previous year (47,414 minutes). With many programs going virtual, we posted a total of 347 videos (some animated) on our pages.
The top three Facebook videos by total minutes viewed include The Virtual Magic Show (4,839 min.), Ghosts of Gaithersburg (2,480 min.), and the I Do Crew wedding planners (1,803 min.). One-minute views more accurately capture watched content (Facebook considers just three seconds to be a single “view”). Among our top one-minute videos were the Lakeforest Master Plan (196 one-minute views), Hey Jerry Pinbusters (189 one-minute views), and the Discovery Park Ribbon Cutting Facebook Live (148 one-minute views).
51

Critical Measures
Analysis
For video engagement (reactions, comments and shares only) the top three included The Virtual Magic Show (229), the Mayor’s Statement of Support (179), and a Water Park Announcement with Kegan Kim (181 engagements).
Our City Government Instagram account (not reflected in the charts) garnered 11,414 engagements on 186 posts. Most engaging: Scenic train photography (193), Watkins Mill Road Interchange (172), and City mascots at Winter Lights (164). Examples of other topics that ranked high are community chalk drawings, an Animal Control act of kindness, and a local restaurant donation to the GPD.
On our Instagram account, landmarks and community photos with people do better than images with graphics and call-to-action posts. Crowd-sourced images are engaging and allow our followers to help tell the Gaithersburg story. We use Instagram Stories for call-to-action and informational campaigns that can be told in multiple parts and link to our website. There will be charts in next year’s metrics to measure Instagram growth and engagement.
The City launched its official presence on Nextdoor in November, with 14,573 members. It’s a valuable tool for us to reach our City residents where they already are.
Our first few weeks resulted in 6,737 views on nine posts. There were a total of 2,311 e-mail opens, with total impressions of 9,484. In December, we received a total of 19,334 impressions. Topics with the most impressions were the Winter Lights sold out notice (2.2k), Casey Cooking Classes (1.1k) and City Lobbies Closed (1.1k). Of note, the Nextdoor impressions metric is updated daily for one week after a post is created. After one week, the number of impressions freezes.
All social media platforms are vital in communicating and engaging with our community, especially in the digital and pandemic world where print and in-person outreach is more limited than ever. It is important to strategize what types of content engages best and where best to share and engage with our audience. We consistently see our most engagement with photo and video posts.
Data review and analysis has helped us assist other staff in strategizing best approaches to advertise recreation programs, elicit community feedback on City projects, produce video and virtual events that connect with our residents, and ensure that community service initiatives and public and education and outreach are impactful. As users continue to access City information using multiple channels of communication that work in conjunction with each other, we will continue to engage users on multiple platforms (as well as research and discover new ones) to fully engage and reach residents and the greater community.
52

Critical Measures
This chart shows the number of unique subscribers for all City newsletters (21 in all). Note that subscribers may sign up for more than one newsletter, but are only represented once on this chart. Several newsletter subscriptions are dependent upon the number of program participants. In 2020, we saw an 18% increase in total number of unique subscribers (3,326 new contacts), 215,667 opens, and 20,232 link clicks. 63% of opens were on desktop versus 34% opens on mobile. Our overall open rate is 33%, compared to 26% for government newsletters (per Constant Contact as of December 2020).
The City’s weekly newsletter (2,655 subscribers as of January 1, 2021) generated 9,221 unique link clicks. Most engaged content included the Mayor’s Statement of Support (373 clicks), Visit Montgomery Dining Out (324 clicks), Mayor & Council Thank You video (290 clicks), and CDC Face Coverings (213 clicks).
Our e-mail newsletter proved to be an essential tool in delivering vital pandemic information to our subscribers. In March and April we issued eight COVID-19 special edition newsletters, which had a total of 51,761 opens and 3,191 link clicks. Other special editions included the Budget Survey newsletter with 464 total link clicks and the Census Day newsletter with 326 link clicks.
The City introduced a new environmental e-newsletter in spring of 2020, Green in Gaithersburg (286 subscribers).
Analysis
Newsletter Subscribers Across All City Accounts
15,426
17,62316,576
18,726
22,052
0
5,000
10,000
15,000
20,000
25,000
2016 2017 2018 2019 2020
53

Key Strategies
Potential Strategy Conflicts‐
Gaithersburg Strategic Plan – FY 2022
CommunityServices
Strengthen the community by addressing the human service, safety and educational needs of all City residents through
collaborative efforts with schools, businesses, organizations, and nonprofits
• Collaborate with partners to ensure comprehensive, integrated, quality service delivery and community education
• Promote economic self-sufficiency through financial, vocational education and workforce development initiatives
• Provide access to safety net services
• Provide homeless services through advocacy, education, outreach, shelter, and prevention
• Maximize access to physical and mental health services for the un- and underinsured
• Provide youth with educational enrichment support and opportunities for positive social development
• Promote and support the ethnic and cultural diversity reflected in the City’s population
• Support homeless City residents with substance use disorders, mental illness, and economic challenges by providing outreach services and operating and pursuing funding for Wells/ Robertson and DeSellum Houses
54

Objectives
Collaborate with partners to ensure comprehensive, integrated, quality service delivery and community education
• Coordinate a collaborative, community-supported program to serve residents during the holiday season
• Collaborate on the delivery of services and provide information on City programs and initiatives by participating in and/or facilitating local, regional and interdepartmental coalitions, meetings and dialogues
• Coordinate and promote events and initiatives that provide opportunities for nonprofits and schools to increase their capacities in the areas of partnerships and volunteerism
• Conduct regular assessments of community needs to identify emerging trends
• Engage in collaborative initiatives that promote economic self-sufficiency and financial empowerment
• Encourage the unbanked and underbanked to use mainstream financial institutions through Bank On Gaithersburg and the programs of the Gaithersburg Financial Wellness Coalition
• Administer and monitor a nonprofit contract program that uses a strategic, results-based approach to support vocational and financial empowerment education
• Encourage resident participation in ESOL, GED, tutoring, civics, and citizenship programs
• Enhance community education and awareness through the development of and participation in outreach events and programs
Promote economic self‐sufficiency through financial wellness, vocational education and workforce development initiatives
55

Objectives
Provide access to safety net services
• Provide case coordination and management services for City residents to ensure complete, appropriate and quality access to community resources, food, social services, and affordable housing programs
• Help to prevent eviction and address emergency needs by providing oversight of nonprofit Housing Counseling and Housing Preservation contracts and federally-funded emergency assistance funds
• Administer and monitor nonprofit contracts for housing stabilization and access assistance for prescription drugs, transportation and food and nutrition
• Assist in eviction prevention and the promotion of safe, healthy living through the City’s Hoarding Task Force with the Neighborhood Services Division
• Assist in the reduction of child hunger by participating in a school lunch subsidy program
• Provide community education, training and resources to combat substance abuse and the opioid epidemic
Provide homeless services through advocacy, education, outreach, shelter, and prevention
• Administer and monitor the Homeless Services nonprofit contracts and ensure outcomes are met
• Monitor the homeless population, address local and regional needs, and raise awareness by collaborating and partnering with other agencies and organizations and participating in local and regional initiatives, committees and events
• Provide supervised service coordination for City residents who participate in permanent supportive housing programs
• Utilize the Homeless Information System to link homeless individuals and families to supportive services and track outcomes
56

Objectives
Maximize access to physical and mental health services for the un‐ and underinsured
• Administer and monitor the Health and Mental Health Assistance nonprofit contracts for uninsured and underinsured residents
• Provide interim case coordination services and collaborate to provide community educational events for City residents facing complicated and multifaceted mental and physical health challenges to ensure access to complete and appropriate community services
• Provide access to prescription drug discounts through the promotion and administration of the National League of Cities Prescription Drug program
• Coordinate trainings in critical mental health subject areas for City staff and area nonprofit providers
Provide youth with educational enrichment support and opportunities for positive social development
• Administer and monitor the School Based Nonprofit Youth Grants and School Grants to ensure service integration and collaboration with nonprofits serving Gaithersburg schools
• Foster educational success and encourage increased parental involvement through collaboration-building and support of related school and nonprofit initiatives
• Conduct outreach, public awareness and collaborative initiatives that promote involvement, engage the entire community and recognize students for educational and personal achievement through the Junior Mayor and GREAT programs, the “If I Were Mayor” contest, the Mayor’s Book Club, and CHARACTER COUNTS! initiatives and programming
57

Objectives
Promote and support the ethnic and cultural diversity reflected in the City’s population
• Explore opportunities to further raise diversity awareness amongst City staff, committee members, volunteers and other stakeholders
• Incorporate diversity elements into civic events
• Strive to ensure that the City’s advisory committees reflect the diversity of the community
• Work with the Public Information Office to provide inclusive communication
Support homeless City residents with substance use disorders, mental illness and economic challenges by providing outreach services and operating and pursuing funding for Wells/Robertson and DeSellum Houses
• Empower residents to break the cycle of addiction and homelessness and attain permanent or permanent-supportive housing through the programs and services of the Wells/Robertson House (transitional program) and DeSellum House (extended supportive housing program for Wells graduates)
• Utilize the ROSC (Recovery Oriented Systems of Care) model to partner with community and service providers for addiction prevention, advocacy and collaboration for homeless people in recovery from substance use disorder
• Utilize a Wellness Recovery Action Plan model and use recovery coaches to engage residents of Wells/Robertson and DeSellum Houses in a total well-being program
• Improve graduation and success rates for Wells/Robertson House and DeSellum program participants
• Maximize existing grants and explore additional funding opportunities from the Friends of Wells Robertson House, Inc., the State of Maryland, Montgomery County, and other sources
58

Action Items
Complete a two-year work plan for Bank On Gaithersburg
Develop multi year outcome reports for City grant programs, including GIS mapping
Prepare a report summarizing historic resident success data for the Wells/Robertson program
Prepare a report summarizing the history and statistics of the Gaithersburg Hoarding Task Force
Develop and conduct an outreach plan to enhance Community Advisory and Educational Enrichment Committee membership, allowing them to more closely match community demographics
Explore the establishment of a Gaithersburg area Coalition of Addiction Prevention and Treatment organizations to address substance use
FY 2021 Key Action Items
FY 2022 Key Action Items Explore the establishment of a Gaithersburg area Coalition of Addiction
Prevention and Treatment organizations to address substance use
Enhance street outreach engagement and linkage to services among the homeless Latino population by incorporating capabilities for bilingual communication
Refine the nonprofit grant program to include requirements for the direct implementation of equitable, collaborative neighborhood-based outreach programming, focusing on student/parent, school and community engagement
59

Critical Measures
Financial Wellness – Financial Wellness is integrated into all service contracts and Community Service programming. Numbers reflect those served with financial coaching, classes, services and outreach events, including VITA and the new COVID-19 Financial Navigator program.
Homeless Programs/Outreach – Homeless Services, Community Services, Housing & Community Development, and Neighborhood Services continue to coordinate on housing assistance cases and housing and service outreach, all significantly increased due to the COVID-19 crisis.
Safety Net Services – Challenges with affordable and subsidized rent options for the working poor, seniors and the disabled continues, with the added challenges of significantly increased food insecurity, unemployment and lack of money for rent and mortgages.
Youth Enrichment – School Grants were suspended for FY21 due to the COVID-19 crisis. Six-month renewal grants were awarded via the Nonprofit-School Grant program and the Youth Mental Health Grant, both to assist nonprofits in continuing critical services for youth facing challenges in the areas of mental health, isolation, technology, and engagement.
Analysis
Individuals and Households Served
1,617 3,716
10,359
2,9911,218
4,000
7,667
4,500
1,586
9,237
11,800
4,722
2,000
3,329
7,445
5801,185
13,868
7,568
163
0
2,000
4,000
6,000
8,000
10,000
12,000
14,000
16,000
Financial WellnessInitiatives
Homeless Programs,Case Coordination and
Outreach
Contracted Safety NetServices
Youth EnrichmentPrograms
FY18 FY19 FY20 FY21 Proposed FY21 Actual to 12/30
60

Critical MeasuresPoverty and Income Demographics
American Community Survey (ACS) 2015 – 2019 Income
This chart demonstrates poverty and related metrics from the 2015-2019 ACS for Gaithersburg, Rockville and Montgomery County. Except for residents (Age 65 and over), Gaithersburg continues to have higher rates of poverty. Among female headed households with children, 20% live at or below the federal poverty level, which is similar to the 2014-2018 ACS rate of 20.3%. Overall, poverty in the City increased from 9.1% to 10.2%. City residents without health insurance decreased from 10.4% to 9.6%, perhaps as a result of increased outreach and assistance by the County and the City’s nonprofit partners.
Another indicator of poverty is the rate of Free and Reduced Meals (FARMS) in Montgomery County Public Schools. To qualify, the annual income for a family of four must not exceed $48,470. MCPS “Schools at a Glance 2020-2021” reports that six of the 13 elementary schools with 10% or more City residents have FARMS rates between 58.8% and 85% (Gaithersburg, Rosemont, Summit Hall, Washington Grove, Brown Station and Watkins Mill Elementary Schools). As a comparison, the FARMS rate at Diamond Elementary School (on the west side of the City) is 7.3%.
Analysis
Federal Poverty Threshold (2021)
HH Size Maximum Income HH Size Maximum Income1 $12,880 5 $31,0402 $17,420 6 $35,5863 $21,960 7 $40,1204 $26,500 8 $44,660
¹ Supplemental Nutrition Assistance Program² from Table B11003: Family with female householder, no spouse present
20.0%
10.2%
8.0%
6.5%
9.6%
18.8%
6.3%
7.0%
8.6%
6.6%
16.1%
6.8%
6.2%
6.8%
7.1%
0.0% 5.0% 10.0% 15.0% 20.0% 25.0%
Female Head of Household²
Poverty (% of all)
SNAP¹ Program
Poverty 65+
No Health InsuranceMontgomery County
Rockville
Gaithersburg
61

Critical Measures
According to the 2019 ACS, Gaithersburg’s median household income remains about 20% below Rockville and Montgomery County. While 26.4% of Gaithersburg households have incomes below $50,000, 14.8% have incomes greater than $200,000/year. By comparison, 20% and 22% of Rockville and County residents, respectively, have incomes above $200,000. Crown’s continued build out is one factor in the rise of high-income households.
Median income for all households increased 11.3%, from $80,655 in 2009 to $89,763 in 2019. Median rent increased by nearly 31%, from $1,328 in 2009 to $1,741 (ACS 2019), underscoring the continually increasing cost burden on our significant number of low income households.
The impact of the COVID-19 crisis on household incomes and rent burden is not included in the ACS 2019 statistics. City households accessing information and assistance through the Community Services Division has increased more than 400% between March of 2020 and January of 2021, with the majority of households citing inability to pay part or some of their rent or buy food, particularly households relying traditionally on lower paying jobs and/or facing immigration status challenges. City CDBG Housing Assistance Grants were up 95% during this same time period.
Analysis
American Community Survey (ACS) 2015 – 2019, Income(Table DP‐03)
12.0% 14.4%
14.3%
14.0%
19.7%
10.8%
14.8%
9.3% 11.7%
12.7%
12.9%
20.3%
12.7%
20.3%
9.0%
12.2%
12.6%
12.0%
18.7%
12.6%
22.8%
0.0%
5.0%
10.0%
15.0%
20.0%
25.0%
Gaithersburg Rockville Montgomery County
62

Critical Measures
These maps compare pockets of poverty to client access of contracted services supported by City funding for emergency assistance, financial empowerment, housing stabilization, food and nutrition, health and mental health, youth enrichment, and vocational coaching in FY20. Services continue to appear to be reaching high poverty areas and beyond. The hotspot analysis is based on data from July 2019 through June 2020, so does not fully reflect the impact of the pandemic to date.
Analysis
63

Critical Measures
The unemployment map is based only on the civilian labor force, consistent with Department of Labor and media reporting. The two block groups showing the highest rate of unemployment include 1) the area around Fields Road ES/Shady Grove Village, and 2) the northern part of the Kentlands immediately surrounding the shopping center. The map of working poor is based on household income at or below 150% of the poverty threshold. Since the Census doesn’t officially define working poor, City Planning staff and the Housing and Community Development Director determined the best approach for this analysis and used 150% of the poverty threshold, which translates to a maximum income of $39,300 for a family of four. These figures are based on the 2019 ACS and do not reflect effects of the COVID-19 economic crisis. This is a new measure to be used for ongoing evaluation going forward.
Analysis
64

Critical Measures
The top graph indicates client achievement in income and permanent housing. The goal of transitional housing is to move individuals to permanent housing with enhanced skills and support systems. Although WRH allows residents to stay up to two years, our collaborative engagement in the Housing First model has resulted in more residents taking advantage of permanent supportive housing opportunities, resulting in an average stay at Wells of only about six months.
Despite being stymied by the pandemic, we have moved four residents into permanent supportive housing so far this year. The pandemic has also stagnated our number served and income increases. Some residents come into the program with Social Security and Social Security Disability income and do not increase their income during their stay. They are still eligible for permanent supportive housing.
FY21 proposed outcome measures for our Montgomery County grant include 70% of residents maintaining or increasing their monthly income and 85% who remain in the program for at least 6 months exiting to permanent housing.
The comparison chart to the Dorthy Day program shows DD outperforming Wells in residents attaining housing. This may be because the DD program was used as a bridge for people waiting to be placed in housing.
Analysis
Transitional Housing Comparison FY20
Wells/Robertson House (WRH)
70%
39%41%
77%
0%
20%
40%
60%
80%
100%
Wells/Robertson House Dorothy Day
PercentIncreasingIncome
PercentAttainingHousing
36 33 3531
14
24 23 2521
813 13 14 15
4
0
10
20
30
40
2017 2018 2019 2020 2021YTD
Residents Served Income Increase Housing Attainment
65

66

Key Strategies
Potential Strategy Conflicts‐
Gaithersburg Strategic Plan – FY 2022
Economic DevelopmentActively pursue economic and business development
strategies to support a growing and sustainable economic base, ensuring the financial resources needed to improve the
quality of life, fund services and provide a diversity of job opportunities for City residents
• Market the City as a desirable business location, leveraging our unique assets, proximity to the federal marketplace, state and federal incentive areas, and our strength as an internationally-recognized center of biotechnology
• Position Gaithersburg favorably for local investment via business expansion and/or real estate development by maintaining an attractive business environment
• Support implementation of the Gaithersburg Master Plan and Frederick Avenue Corridor and Vicinity Capacity Study
• Stimulate revitalization of Olde Towne, the Route 355 Corridor and the Lakeforest Mall site
• Provide support and guidance for established small businesses as well as aspiring entrepreneurs across industry sectors
• Affordable Housing
• Historic Preservation
• Transportation
• Non-commercial Development
67

Objectives
Market the City as a desirable business location, leveraging our unique assets, proximity to the federal marketplace, state and federal incentive areas, and our strength as an internationally‐recognized center of biotechnology
• Use the Economic Development website and social media to highlight successes, identify City and other state/county/federal incentives and initiatives, provide an online resource for baseline information on the local economy, and provide an effective point of contact to business and development prospects
• Conduct business outreach and ombudsman initiatives to build stronger relationships with businesses
• Participate in Maryland Department of Commerce, Technology Council of Maryland, Montgomery County Economic Development Corporation, International Council of Shopping Centers, Chamber of Commerce events and initiatives, and other target industry initiatives
• Continue to establish a distinct Economic Development brand and message distinguishing the City’s pro-business programs and processes relative to neighboring communities
• Emphasize exposure in local and national business media and at trade shows/events of targeted industries
• Increase awareness of the City as a center of life sciences business activity within the Biotech Capital Region
• Maintain and strengthen ongoing relationships with local commercial real estate owners, professionals and developers via roundtables/focus groups, speaking engagements, individual meetings, and other targeted events
• Use e-newsletter and other digital media outlets to establish frequent communication with business community
• Cultivate opportunities for regional cooperation in business attraction and retention efforts among economic development counterparts in the greater Washington area
68

Objectives
Position Gaithersburg favorably for local investment via business expansion and/or real estate development by maintaining an attractive business environment
• Administer and promote the benefits of the City’s Enterprise Zone as it relates to incentivizing new development and business relocation
• Work with site and/or industry specific local business groups on cooperative efforts
• Use Economic Development program funding, in addition to county and/or state business support programs, to incentivize and leverage extraordinary opportunities that present major job relocation, retention and/or development prospects
• Utilize the Economic & Business Development and Olde Towne Advisory Committees to act as ombudsmen for their respective business communities
• Seek new funding sources for Economic Development efforts
• Direct Economic Development Toolbox funding to businesses that exhibit growth potential, provide stable, well-paying jobs and help to diversify the City’s economy
• Track office space vacancy rates, commercial real property assessments and other indicators of economic trends
• Support business assistance programs at the state and county levels as appropriate
• Focus on retaining existing businesses and attracting new businesses from desired industries and diversifying the local economy
• Work proactively with commercial property owners/ representatives who may be interested in converting obsolete office/flex space into lab and other marketable uses, or repurposing/redeveloping vacant and/or obsolete retail space
• Pursue discussions with appropriate regional partners to support technology transfer and entrepreneurial activity, spurred by the proximity of Federal facilities
69

Objectives
Support implementation of the Gaithersburg Master Plan and Frederick Avenue Corridor and Vicinity Capacity Study
• Support large-scale assemblages and infill development to accelerate implementation of the City Master Plan and the Frederick Avenue Corridor and Vicinity Capacity Study
• Facilitate anticipated sales and future redevelopment of Lakeforest Mall properties
• Facilitate strategic acquisition of sites within larger, potential redevelopment assemblages to leverage partnerships with the development community
• Explore the use of alternative funding methods to enhance infrastructure throughout the City
• Promote rezoning of parcels that exhibit strong development and redevelopment potential in accordance with the Master Plan
• Consider and explore implementation strategies for recommendations in the Frederick Avenue Corridor and Vicinity Capacity Study
• Facilitate appropriate private and public investment in existing and new affordable housing
70

Objectives
• Promote Olde Towne as a distinct commercial hub with a unique identity by adding/upgrading public areas and cultural amenities
• Support cost-effective allocation of limited public resources to promote change
• Retain existing and attract new employers
• Enhance market driven opportunities for new businesses and private investment in real estate
• Facilitate development of City-owned parcels to assist in bringing new residents and marketable commercial/office space
• Explore partnership opportunities to expand cultural events and public art in Olde Towne
• Market the Toolbox program and the program’s expanded support for Olde Towne and the Route 355 Corridor
• Identify opportunities and support reinvestment in existing multifamily properties within Olde Towne and the Route 355 Corridor
• Ensure that applicable zoning codes are written to support new investment and development
• Seek opportunities for increased public parking facilities in Olde Towne, whether through agreements with existing property owners or acquisition
• Monitor and protect existing legislative and regulatory advantages that support new investment in real property
Stimulate revitalization of Olde Towne, the Route 355 Corridor and the Lakeforest Mall site
71

Objectives
• Establish better connections and stronger lines of communication with the City’s existing small business community
• Raise awareness of City’s Toolbox program as well as grant, loan and other business support programs available through nonprofit and other governmental agencies
• Facilitate connections between the small business community and people/agencies positioned to assist with their needs
• Aid business owners and entrepreneurs with grant/loan applications and other technical support, either directly or through partner agencies and organizations
• Strengthen our partnerships with the Maryland Women’s Business Center, SBA, and other regional business support organizations
• Disseminate information about potential procurement opportunities through outreach, networking events and other mediums
Provide support and guidance for established small businesses as well as aspiring entrepreneurs across industry sectors
72

Action Items
Support repositioning and/or redevelopment of Lakeforest Mall property
Develop list of potential uses for South Frederick Avenue property assemblage area
Review areas within the City’s Maximum Expansion Limits (MEL) to determine which parcels may have near-term potential for growth in housing, population and jobs
Educate stakeholders/promote benefits of new Opportunity Zone program as it relates to new investment within City’s designated census tracts
Initiate a process for sale and redevelopment of the South Frederick Avenue property assemblage area (303 - 311 S. Frederick Avenue)
Review commercial properties with delinquent taxes and below-market assessed values and work towards payment and reassessment
Create new data visualization products, such as interactive maps, story maps, static images, and other presentation formats for use in community engagement
Participate in the Greater Washington Board of Trade’s Council of Economic Development Officials committee in examination of potential regional coordinated marketing
Analyze the hotel room inventory and forecast room supply, demand and projected hotel tax revenue
Transfer ownership of the Fishman site, pending completion of development approvals
FY 2021 Key Action Items
73

Action Items
FY 2022 Key Action Items
Support repositioning and/or redevelopment of Lakeforest Mall site by working with current property owners and identifying potential developers
Initiate a process for sale and redevelopment or determine other uses for the South Frederick Avenue property assemblage area (303 - 311 S. Frederick Avenue)
Work with Planning staff to undertake a comprehensive review of the CD and MXD Zones
Transfer ownership of the Fishman site, pending completion of development approvals
Respond to the extraordinary economic conditions brought on by the COVID pandemic
Generate a database of City small businesses to the best practical extent
Review Toolbox program to determine if changes should be made to support local businesses
Perform real estate market analysis and feasibility to forecast post-COVID demand and estimate fiscal impacts on City revenue
74

Critical Measures
Analysis
Property types included in the total for the “Commercial Real Property Base” are Commercial, Commercial Condo, and Industrial classifications. The total for these categories in Levy Year 2021 increased (14.5%) from the previous year.
Levy Year 2021 began a new triennial assessment cycle and, given the timeframe of the valuation process, does not reflect the full impact of the COVID-19 pandemic. Commercial property owners are likely to appeal values, resulting in declines in each of the two upcoming years.
$3,581,619,700
$3,495,986,500
$4,227,721,000
$4,067,632,400 $3,995,629,800
$4,575,175,900
$0
$500,000,000
$1,000,000,000
$1,500,000,000
$2,000,000,000
$2,500,000,000
$3,000,000,000
$3,500,000,000
$4,000,000,000
$4,500,000,000
$5,000,000,000
2016 2017 2018 2019 2020 2021
Levy Year
Commercial Real Property Base(Market Value)
75
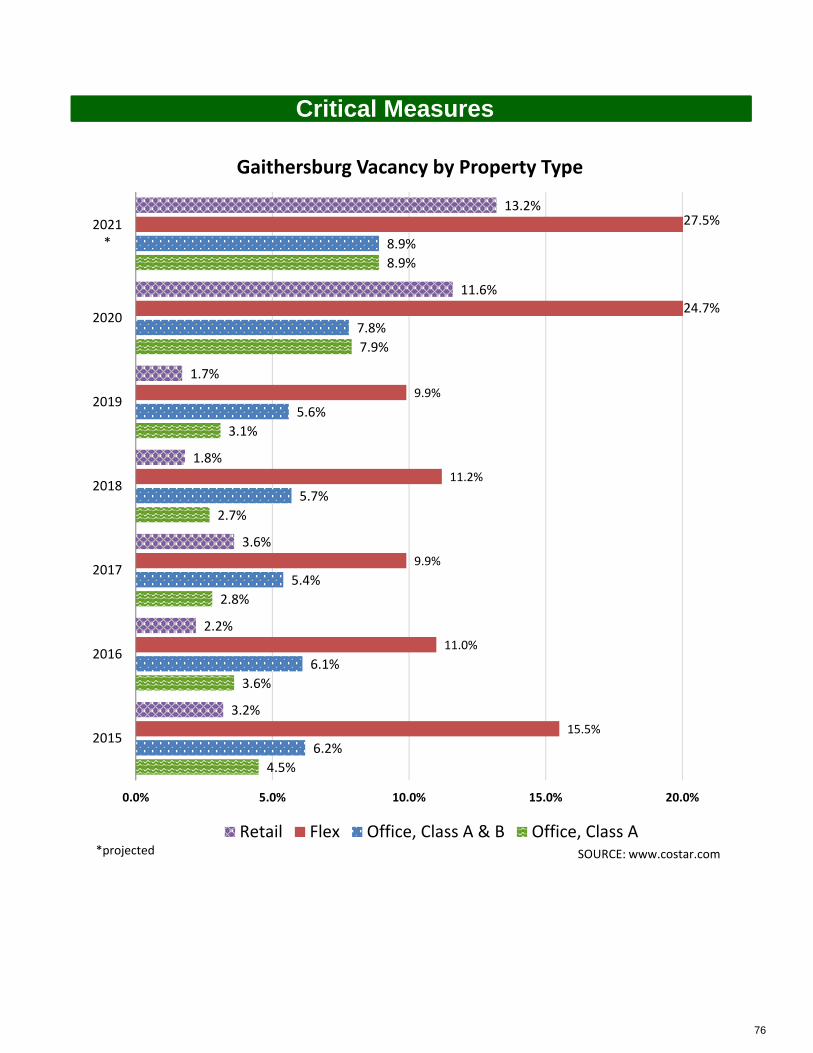
Critical Measures
4.5%
3.6%
2.8%
2.7%
3.1%
7.9%
8.9%
6.2%
6.1%
5.4%
5.7%
5.6%
7.8%
8.9%
15.5%
11.0%
9.9%
11.2%
9.9%
3.2%
2.2%
3.6%
1.8%
1.7%
11.6%
13.2%
0.0% 5.0% 10.0% 15.0% 20.0%
2015
2016
2017
2018
2019
2020
2021*
Gaithersburg Vacancy by Property Type
Retail Flex Office, Class A & B Office, Class ASOURCE: www.costar.com*projected
27.5%
24.7%
76

Critical Measures
Analysis
When compared with adjacent submarkets in 2020, the City’s strong Office and Flex categories once again outperformed Silver Spring, Rockville and Germantown.
Continued demand by the biotechnology sector in 2020 caused institutional investors of aging low-rise Class B office buildings to reinvest in building improvements to capture new and also expanding life sciences tenants.
Retail vacancy increased, driven by the impact of the global pandemic and exacerbated by the local market surplus of retail square footage (primarily attributed to Lakeforest Mall).
Gaithersburg
Rockville
Germantown
Silver Spring
Montgomery County
6.0%
8.0%
10.0%
12.0%
14.0%
16.0%
18.0%
2015 2016 2017 2018 2019 2020 2021*
Total Office & Flex Vacancy A Comparison between Submarkets
SOURCE: www.costar.com *projected
77

Critical Measures
Analysis
The Economic Development Opportunities Fund and the Economic Development Toolbox provide direct assistance to companies investing in upgrades to real property. Expenditures from these funds depend upon whether financial incentives are necessary to attract and retain employers. No transactions from the Opportunities Fund were completed in FY20.
Pandemic-related government restrictions on business activities had an impact upon expansions, particularly among restaurant and retail establishments – categories that typically benefit from the City’s incentive funding. In FY20, grants awarded from the Toolbox program totaled $20,136 less than the previous year. Job generation associated with incentive spending was lower, with 106 in FY19 versus 39 in FY20. Meanwhile, massive Federal government investment in COVID therapies and vaccines fueled expansion of local biotech companies, but did not trigger City incentive spending during the fiscal year.
Toolbox
Opportunities Fund
Jobs
0
50
100
150
200
250
300
350
$0
$50,000
$100,000
$150,000
$200,000
$250,000
$300,000
FY 2016 FY 2017 FY 2018 FY 2019 FY 2020
Economic Development Incentive Expenditureswith Job Creation
78

Critical Measures
Analysis
Gaithersburg Median Household Incomes increased slightly between 2019 and 2020. The City’s monthly unemployment rate ranged from 3% in January to a high of 10.4% in May during the COVID-19 pandemic spring lockdown of many business activities, which were imposed by State and County executive orders.
.
$83,899 $83,598$88,115 $85,988
$89,921
$101,018 $102,580 $105,535 $105,794$109,372
2016 2017 2018 2019 2020
Median Household Income
Gaithersburg Montgomery County
Source:Esri Business Analyst
79

Critical Measures
Analysis
The percentage of residents with Bachelor’s Degrees or higher increased slightly in the City and Montgomery County.
52.5%
59.0%
30.5%
53.5%
59.2%
31.0%
54.6%
59.7%
31.8%
52.8%
59.4%
32.5%
54.0%
61.1%
33.1%
Gaithersburg Montgomery County US
Educational AttainmentPercent with Bachelor's Degree or Higher (25 and older)
2016 2017 2018 2019 2020
SOURCE:Esri Business Analyst
80

Critical Measures
Analysis
Visitors to the City’s Economic Development website, www.growgaithersburg.com, increased when compared with the previous fiscal year. In response to pandemic-related business funding opportunities and regulatory changes, staff used social media (Twitter) and direct outreach to convey information to local employers and commercial landlords. From March 1 through May 30, @GrowGburg earned more than 198,800 impressions.
In late 2017, the City began a redesign and migration of the website to a new platform, a process completed in the fourth quarter of calendar year 2018. Therefore, “Page View” data from 2018 cannot be compared with that of 2019 and 2020.
2,746 2,473
10,856
2,9732,313
8,266
1,6981,138
6,089
1,5931,102
4,184
2,2031,780
4,281
0.00
2,000.00
4,000.00
6,000.00
8,000.00
10,000.00
12,000.00
Sessions New Users Page Views
Website Audience
FY 2016 FY 2017 FY 2018 FY 2019 FY 2020
81

Key Strategies
Potential Strategy Conflicts‐
Gaithersburg Strategic Plan – FY 2022
Environment
Meet the needs of the City in a manner that accurately reflects the community’s desire for environmental health and economic
prosperity without compromising the ability of future generations to meet these same needs
• Maintain a leadership role in supporting initiatives that promote local and regional livable and sustainable communities
• Ensure the City is implementing long-term strategies that embrace the interconnectivity of economics, equity, and the environment
• Preserve, enhance, and maintain an interconnected network of natural resources, open spaces, and environmental infrastructure
• Maintain a Stormwater Management programthat strives to balance the goals of the City’s Watershed Implementation Plan (WIP) with existing infrastructure maintenance and has a fair and equitable fee structure
• Support efforts to increase public participation in recycling, pollution prevention and other sustainability initiatives
• Transportation
82

Objectives
Maintain a leadership role in supporting initiatives that promote local and regional livable and sustainable communities
• Utilize City, state and federal grant programs to assist homeowners associations and residents in enhancing their communities via environmental initiatives
• Remain an active participant with Metropolitan Washington Council of Government’s (MWCOG’s) Region Forward initiative and implementation programs, and continue to partner with state, county and other local governments to address regional environmental concerns
• Continue to implement elements of the Green Team Action Plan
• Involve Environmental Affairs Committee in regional sustainability initiatives and promoting environmental education
• Implement strategies contained in the Environmental & Sustainability Master Plan that are focused on both the urban and natural environment
• Coordinate with Montgomery County Public Schools relative to environmental education requirements for local students
Ensure the City is implementing long‐term strategies that embrace the interconnectivity of economics, equity and the environment
• Maintain a healthy, diverse urban forest to provide optimal environmental, social and economic benefits
• Strive to improve local and regional air quality, resource efficiency, and transportation alternatives
• Encourage energy conservation and pursue the use of alternative and renewable energy sources
• Continue to consider equity in both the development of policies and programs and access to resources and amenities
• Maintain and enhance the City’s Geographic Information System to provide mapping and statistical data as tools for reporting and evaluating environmental and economic impacts
• Promote public and private energy efficiency audits and improvements
83

Objectives
Preserve, enhance and maintain an interconnected network of natural resources, open spaces and environmental infrastructure
• Promote environmental initiatives that exceed minimum standards in the areas of green building, recycling and energy resources and efficiency
• Protect and improve water resources by implementing watershed management plans that incorporate healthy stream protection, an improved and maintained stormwater management system, and implementation of stream restoration projects
• Engage citizens in the City’s volunteer planting, stream monitoring, and clean-up programs to increase community involvement in environmental protection
• Encourage resource stewardship through outreach and education programs at schools and in the community
• Explore opportunities to expand the Urban Forest
Maintain a Stormwater Management program that strives to balance the goals of the City’s Watershed Implementation Plan (WIP) with existing infrastructure maintenance and has a fair and equitable fee structure
• Work with Maryland Department of the Environment and Montgomery County in supporting the Chesapeake Bay Watershed Implementation Plan (WIP) and ensuring that it is reasonable and affordable
• Maintain a rate fee model that is based on impervious coverage and assessed to all property types
• Sustain focus on stormwater facility inspections and provide adequate funding for stormwater infrastructure maintenance and replacement
• Continue Green Street retrofits on existing streets
• Analyze and implement watershed management plans by prioritizing opportunities for stream restoration, stormwater management (SWM) facility retrofits, and new SWM facilities to reduce nitrogen and phosphorous in order to meet EPA Chesapeake Bay TMDL targets
• Implement new programs and measures identified in the watershed management plans
• Provide transparency and education on the use of the Stormwater Program Fee
84

Objectives
Support efforts to increase public participation in recycling, pollution prevention and other sustainability initiatives
• Encourage participation in the curbside recycling program
• Promote recycling program for multifamily dwellings and for businesses
• Promote the use of safe and environmentally-friendly practices in our Fleet Maintenance program
• Foster summer Parks, Recreation, & Culture programs that promote environmental awareness and sensitivity
• Encourage safe pesticide usage practices, reduction in synthetic pesticide usage, and grass recycling source reduction by City residents
• Encourage pollution prevention Citywide by implementing measures to address illicit discharges, illegal dumping, and the introduction of pollutants into the ecosystem
85

Action Items
Revise Chapter 8 of the City Code to reflect necessary changes to the Stormwater Management ordinance
Revise and amend the City Tree Manual Complete feasibility study and concept design for Brighton Weir
stormwater retrofit Implement a tracking system for comprehensive management of the
City’s stormwater facilities and storm drain assets Develop the City’s impervious baseline assessment to determine the
final restoration requirement under the new MS4 permit Develop and present new rate model for Stormwater Program Fee Track and develop a plan to reduce community recycling contamination
levels Develop Scope and Request for Proposal for Citywide LED street light
conversion project Create method to track recycling contamination rates in City facilities Expand compost drop off program Submit MS4 Year 2 annual report including refining credit goals and
submitting documentation on minimum control measures Refine asset management tracking system and reporting
FY 2021 Key Action Items
86

Action Items
FY 2022 Key Action Items
Adopted amended version Chapter 8 of the City Code to reflect necessary changes to the Stormwater Management ordinance
Revise the City Tree Manual
Submit MS4 Year 3 annual report including refining credit goals
Determine current canopy coverage levels
Select contractors for inlet inspection and cleaning contract and stormwater master contract
Refine data from new stormwater asset database
Complete Year 2 of LED Streetlight conversion project
Complete first waste audit of community recycling and determine program needs
Audit recycling at City Facilities to determine impact of container changes and determine other program enhancements
Define metrics needed to complete a climate action and resiliency plan
Develop webpage specifically dedicated to climate on the City’s website and restructure environmental services web content navigation
Expand the scope of the Rainscapes Rewards program to include tree planting
Evaluate the effectiveness of the City’s anti idling policy
Investigate feasibility of providing curbside composting service to residents
87

Critical Measures
Analysis
1,467 Acres1,633 Acres 1,636 Acres 1,562 Acres 1,567 Acres
365 Acres399 Acres 403 Acres
395 Acres 395 Acres
550 Acres
812 Acres 821 Acres861 Acres 864 Acres
17 Acres
18 Acres 28 Acres 83 Acres83 Acres
0 Acres
500 Acres
1,000 Acres
1,500 Acres
2,000 Acres
2,500 Acres
3,000 Acres
3,500 Acres
2006 2016 2018 2019 2020
Impervious Area by Water Quality Treatment Level
Untreated Partial Treatment
Full+ Treatment Alternative Treatment
*
* 2017 is not reported because there is no impervious layer data for that year
This chart illustrates the City’s progress towards its water quality goals set by the Maryland Department of the Environment. By 2023, the City must have projects underway to have 20% of the untreated, and partially treated, impervious surface area that existed in its baseline year to become fully treated. The City chose 2006 as its baseline year. Those water quality projects must be operational by 2025. Some of these projects are funded through the Stormwater Capital Improvement Plan. Other projects occur as redevelopment is required to meet modern water quality regulations. Alternative water quality control practices, such as street sweeping and stream restoration projects, can earn equivalent-acreage credits towards the goal.
88

Critical Measures
Analysis
6193
53515903
5229
1023
1023
1017
1230
1296
1184
1163
1107
0
1000
2000
3000
4000
5000
6000
7000
8000
9000
2016 2017 2018 2019
Metric Tons of CO2e
Municipal CO2e Emissions by Sector
Buildings and Facilities Street Lights Vehicle Fleet
Municipal emissions are shown in three major City emitting sectors: Buildings and Facilities; Vehicle Fleet; and Street Lights. During calendar year 2019, emissions from Buildings and Facilities decreased by 11.4% from 2018. Vehicle Fleet emissions increased by 20% compared to 2019. Emissions from Street Lights decreased 4% compared to 2017. Overall, calendar year 2019 resulted in a reduction of 576 metric tons of CO2e. Emissions are expected to reduce more dramatically in 2020 with limited occupancy in building, a cleaner energy grid and the initial impact of the street light conversion project.
*Data for this chart is provided on a calendar year basis. As such, 2020 data and analysis will not be available until June 2021.
89

Key Strategies
Potential Strategy Conflicts‐
Gaithersburg Strategic Plan – FY 2022
Housing
Maintain comprehensive housing policies and programs that provide fair, affordable options in homeownership and rental
opportunities
• Utilize Housing Initiative Fund (HIF) to make strategic investments in priority projects that support increased affordable housing
• Encourage and support homeownership in the City
• Identify and address barriers to fair housing and educate housing consumers and providers
• Support initiatives that improve the rental housing stock in the City
• Meet the current and future housing needs for a wide range of populations
• Economic Development
90

Objectives
Encourage and support homeownership in the City
• Increase the stock of affordable units throughout the City, particularly for households at or below 120% of Area Median Income (AMI)
• Identify ways to support households with incomes too low for Moderately Priced Dwelling Units (MPDUs)
• Assist common ownership communities seeking FHA approval
• Prioritize preservation of existing affordable rental units in redevelopment projects in relation to City funding and seek to retain or increase number of family-sized units
• Partner with peer institutions, other government agencies, nonprofit housing organizations, and/or for-profit developers to optimize City investment
• Seek opportunities for redevelopment, acquisition and priority upgrades that improve aging, underutilized and functionally obsolete properties
• Offer homeownership assistance loans to eligible first-time homebuyers, including displaced tenants and MPDU applicants.
• Consider modifying definition of “first priority” applicants to reflect any new Council priorities
• Identify potential barriers to homeownership presented by changing regulations and lending guidelines and adapt programs accordingly
• Structure the Gaithersburg Homeownership Assistance Loan Program (GHALP) to encourage eligible homebuyers to purchase in higher value communities of the City, outside of traditional low moderate income areas
• Leverage other financial resources to increase number of GHALP loans to meet demand
• Encourage a diversity of dwelling types and home prices in new developments
Utilize Housing Initiative Fund (HIF) to make strategic investments in priority projects that support increased affordable housing
91

Objectives
Identify and address barriers to fair housing and educate housing consumers and providers
• Utilize the most current data on area demographics, housing prices and inventory, and incidence of cost-burdened households to guide housing choice
• Monitor rental properties with MPDU and Work Force Housing Units (WFHUs) to ensure compliance with the affordable housing and applicable City and county requirements
• Work with Neighborhood Services and other City staff to provide Fair Housing training to residents, landlords, homeowner associations, nonprofits, and other interested groups
• Work with Montgomery County on the use of “paired testing” (the process of sending two individuals with similar characteristics, with one being from a protected class) to ensure property representatives are not acting in a discriminatory manner
• Ensure that the current and future housing stock allows residents to remain in the City as their financial, employment and familial situations change
• Support development community to ensure that affordable housing requirements are met and enforced over the control period
• Encourage appropriate mix of rental and homeownership units as the ratio changes over time
• Strengthen existing residential, commercial and rental housing property maintenance inspection program with appropriate attention to single-family dwellings
• Offer financial assistance in the form of loans or grants to owners of multifamily properties to provide improvements that reduce tenant utility costs along with other interior and exterior improvements in exchange for meeting City housing priorities
• Preserve the number of existing affordable rental units in redevelopment projects where possible
Support initiatives that improve the rental housing stock in the City
92

Objectives
Meet the current and future housing needs for a wide range of populations
• Ensure the City’s rental and ownership housing stock is appropriate for current residents and for those wishing to remain in the City as their housing needs change
• With referrals from Neighborhood Services and other groups, assist income-eligible homeowners with needed capital improvements (e.g., HVAC, accessibility enhancements)
• Explore opportunities to increase the housing supply near transit
• Through financial assistance and zoning flexibility, encourage developers of multifamily properties to offer more three + bedroom units to meet the needs of larger families
• Encourage retirement home communities to include independent living, assisted living and memory care MPDUs beyond what is required
• Encourage landlords and property managers to retain otherwise good tenants experiencing a housing crisis
• Evaluate County Bill 49-20 and other “ban the box” legislation that may prevent otherwise qualified applicants from being approved for rental housing based on criminal history
93

Action Items
FY 2021 Key Action Items
Coordinate with the Council of Governments, Montgomery County, the Housing Opportunities Commission and other regional partners on the new Assessment of Fair Housing, required by HUD for entitlement grantees
Partner with a multifamily rental property seeking to make appropriate upgrades to its units utilizing the City HIF loan funds
Conduct survey of owners of naturally occurring affordable housing developments to inquire about plans for the property (e.g., short or long term plans to hold or sell)
Develop program to offer financial incentives to developers of market-rate projects to incorporate higher than the 15 percent minimum
Determine potential infill sites for affordable housing in conjunction with Economic Development
Work with Neighborhood Services and Community Services to reduce the number of households receiving “writs of eviction” and the subsequent loss of their housing
94

Action Items
FY 2022 Key Action Items
Coordinate with the Council of Governments, Montgomery County, the Housing Opportunities Commission and other regional partners on the new Assessment of Fair Housing, required by HUD for entitlement grantees
Partner with a multifamily rental property seeking to make appropriate upgrades to its units utilizing the City HIF loan funds
Conduct survey of owners of naturally occurring affordable housing developments to inquire about plans for the property (e.g., short or long term plans to hold or sell)
Develop program to offer financial incentives to developers of market-rate projects to incorporate higher than the 15 percent minimum
Determine potential infill sites for affordable housing in conjunction with Economic Development
Work with Neighborhood Services and Community Services to reduce the number of households receiving “writs of eviction” and the subsequent loss of their housing
With Long-Range Planning staff, complete draft Housing Element, an amendment to the City’s Master Plan
Conduct second biennial housing survey of residential tenants and homebuyers to assess potential fair housing violations and to track short and long-term consequences of COVID in rental and ownership housing
If adopted by the County Council, in coordination with Neighborhood Services, bring similar legislation to the Mayor and Council that would prohibit landlords, lenders and other housing providers from requiring applicants to disclose certain criminal records and arrests without conviction by amending Chapter 13 of the City Code
95

Critical Measures
For more than a decade, the City has provided zero-percent deferred loans to assist low and moderate income families purchase a residential property in Gaithersburg. With so few MPDU and WFHUs available, this program enables eligible buyers with little savings to purchase their first home. Of 292 loans issued since 2009, the City has received $445,000 in repayments with just one foreclosure and one short sale during that period.
Compared to the median home value of $389,700 (ACS 2015-2019), in FY20 the median purchase price for all GHALP buyers was $306,000. Despite financial incentives to encourage purchases in high opportunity areas of the City, most buyers do purchase in neighborhoods with lower median home values.
Recent changes to GHALP included increasing maximum incomes from 100 to 120% of AMI for priority employment categories (City employees, first responders, Veterans and K-12 school employees). Non-city residents who do not work in Gaithersburg are no longer eligible unless they meet the priority definition.
In FY21 and 22, the City will see many more MPDUs and WFHUs in its inventory, with six townhome and condominium MPDUs under contract at Crown (with another 16 to come over the next 12- 18 months) and eight MPDUs and eight WFHUs under construction at The Chase. Aventon paid a fee-in-lieu for 49 rental MPDUs but will offer 42 MPDUs beginning in fall of 2021. At the completion of all residential development, Crown will have a total of 203 MPDUs, 79 fewer than permitted under the County’s MPDU ordinance.
Housing Programs/Services
*2021 data as of Dec. 31, 2020.
Fiscal YearClosing Cost
Loans Rental MPDUs Rental WFHUsEmergency
Assistance Grants
Added Total Added Total Units
2017 35 0 280 46 62 27
2018 35 0 280 0 108 25
2019 40 76 356 0 108 28
2020 37 0 356 0 108 46
2021* 17 0 346 0 108 45
Fiscal Year Homeownership MPDUs Homeownership WFHUs
Added Total Added Total
2017 5 25 5 5
2018 5 30 1 6
2019 2 32 0 6
2020 3 35 0 6
2021* 0 35 0 6
Analysis
96

Critical Measures
During the five-month period June – November 2019 there were 41 evictions in the City, an average of eight evictions per month. According to new data provided by the Sheriff’s Department, just 20 evictions took place during calendar year 2020 - ten between January and March 2 and ten after July 25 when the District Court reopened and began hearing eviction cases.
The Governor’s April 3, 2020 Executive Order prohibiting evictions of tenants suffering substantial loss of income due to COVID-19 remains in effect until the state of emergency is terminated or otherwise revised or amended. Tenants who “suffered substantial income loss due to the COVID-19 emergency” are expected to appear in court and to provide proof of that income loss.
Based on the number of rent assistance cases processed in the City since April 1, 2020, with just three notices of eviction, and the low number of writs of evictions being filed, landlords are clearly holding off on eviction filings. For example, as noted in the accompanying map, in the multi-family properties along North Summit Avenue –comprised over more than 1,000 units - there was one eviction in 2020.
Federal grants to the State, County and City have done much to relieve the financial burden on our renter households. Nearly all of the tenants receiving CDBG funds this year meet the federal definition of extremely low-income.
Housing Programs/Services
*Average per year (2014‐2017)**June – November 2019
Analysis
Fiscal Year Writs of Restitution Evictions
Gaithersburg Rockville Countywide Gaithersburg Rockville Countywide
2017* 939 553 10,451 119 50 836
2019** 41 29 336
2020 3022 20 325
97

Critical Measures
An analysis of advertised market rents (CoStar) continues to reflect the disparity in costs based on geography and age of construction. Two-bedroom units west of I-270 consistently have higher rents than those on the east side of the City, and in new properties, rents are significantly higher than the median two-bedroom rent of $1,741 (ACS 2015-2019).
The Crossings, with 199 units in Olde Towne, serves households at 60% of AMI through the federal Low-Income Housing Tax Credit (LIHTC) program. Maximum rents under the City’s MPDU program were $1,264 in 2019. Council action in 2020 to limit rent increases to 2.6% in 2020 during the State of Emergency, have likely forestalled significant increases at some properties. However, many properties were willing to keep increases below that cap and even waived late fees in the early months of the pandemic.
A recent examination of City multi-rental properties revealed that about 14% of the total number of rental units are affordable under some regulatory requirements, including MPDUs and WFHUs. Notable, however, is that so few are affordable to households at the lowest income bands who are most vulnerable to eviction and homelessness. Those households need ongoing deep subsidies, such as through HOC or other public housing agencies. Unless the new administration prioritizes direct Housing Choice Vouchers, that assistance is not forthcoming and the struggle to identify ways to help those tenants is ongoing.
Advertised Two Bedroom Market Rent
Analysis
1,387
1,435
1,281
2,204
1,966 2,1531,802
1,436
1,456 1,391
2,1791,795
2,1541,896 2,192
1,580
1,4611,455
2,5472,068
2,326
1,855
2,242
1,596
1,502
1,513
2,090 2,237 2,314
1,855
2,244
0
500
1,000
1,500
2,000
2,500
3,000
2017 2018 2019 2020
(ACS 2019) Median Gross Rent: $1,740
98
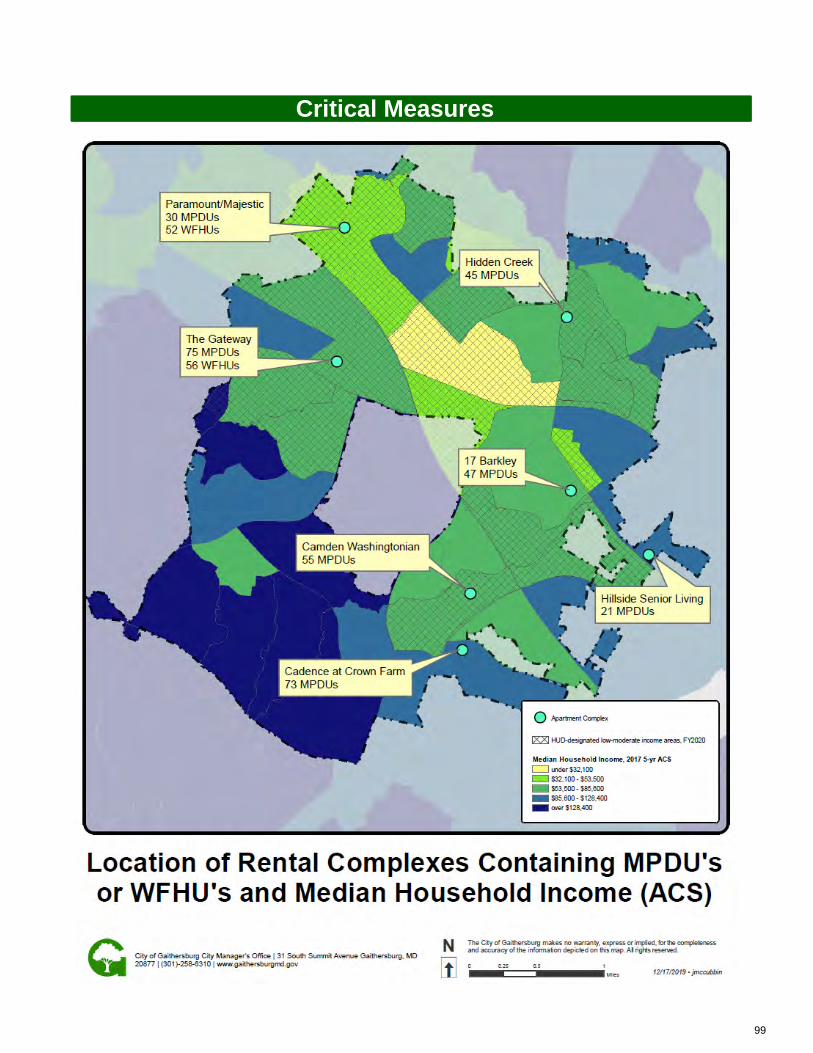
Critical Measures
99

Critical Measures
100

Critical Measures
101

Critical Measures
102

Critical Measures
Quick and focused action on the part of governments has prevented most evictions and residential mortgage foreclosures. The Governor’s Order on halting COVID-related evictions for non-payment; local and federal legislative action to address the immediate housing crisis, including forbearance on residential mortgages; and increased funding from all levels of government have kept thousands of City residents safely housed – at least until the immediate crisis has passed.
In Gaithersburg, housing affordability has long been a challenge to large segments of our population. Based on the most recent ACS data (2015-2019), cost-burdened households (i.e., paying more than 30% of income to housing) make up nearly half of our tenants; 26.7% pay more than 50% of their incomes to housing; and 9.5% of our residents live at or below the federal poverty level. This and more in a City where the median rent for a two-bedroom apartment is $1,740/month.
Moreover, Gaithersburg’s large percentage of minority households have suffered employment losses far exceeding White and Asian residents. During the nine months (April – December 2020) in which the City prioritized assistance to households with COVID-related income losses, CDBG funds assisted 60 families and single adults with incomes below 50% of AMI. More than 90% of the households receiving that assistance reported as Black or African American, White Hispanic, or multiple races.
Last year, our greatest housing concerns were two-fold: insufficient funds to assist every eligible resident and disproportionate numbers of City residents receiving writs of restitution (eviction notices). The CARES Act lifted the statutory cap on financial assistance and courts are not processing evictions related to COVID (a moratorium scheduled to end once the State of Emergency has been lifted).
Multi-family delinquencies, while high at many properties, have remained below 15% overall (as of November 2020). Many of the smaller properties appear to be weathering the crisis better than others. Financial assistance from the City and County coupled with other governmental assistance to landlords and property owners has been critical to the stability of both residents and property owners.
Another probable consequence of COVID is the low number of GHALP loans issued since April 2020. Whereas, prior years saw up to 60 loans in a 12-month period, since April, the City has issued just 23 loans, with most going to households with incomes above the HUD maximums. Due to record low interest rates, there has been a surge in mortgage refinancing (with the City’s willingness to resubordinate its GHALP loans).
Positive news for City revenues is the fairly significant increase in high-income households. In 2019, the percentage of households with incomes of $200,000 or higher rose to 14.8% of all households, up from 11.1% in 2014. According to Planning staff, that increase can largely be attributed to new residential growth at Crown and Parklands, as well as increasing numbers of higher-income households in Lakelands and Parklands.
Analysis
103

Key Strategies
Potential Strategy Conflicts‐
Gaithersburg Strategic Plan – FY 2022
Infrastructureand Facilities
Maintain and improve the City’s existing infrastructure, public facilities and capital assets in a sustainable, cost-effective
manner, and invest in new facilities and real property in support of the City’s strategic goals
• Plan and execute projects to preserve, maintain, improve, and grow City infrastructure to continue to provide necessary City programs and services
• Construct new City buildings in an environmentally sustainable manner and meet 2018 International Green Construction Code (IgCC) with City Amendments
104

Objectives
Plan and execute projects to preserve, maintain, improve, and grow City infrastructure to continue to provide necessary City programs and services
• Frequently assess and evaluate existing City building assets for functionality, code compliance, energy efficiency, deferred maintenance, space management, and compliance with the Americans with Disabilities Act (ADA)
• Provide adequate funding for maintenance, improvements and enhancements to the City’s infrastructure
• Increase emphasis on managing operating costs by evaluating cost-effective solutions and green technologies to increase building efficiency
• Fund and support capital projects that are in progress and continue to plan for future capital improvement projects
• Manage projects to provide space and services efficiently and effectively
• Support the preservation of City-owned historic resources and designated sites
• Maintain a Planned Life-Cycle Asset Replacement program for major equipment and building component replacement through the development of individual building maintenance plans
• Foster community interaction by offering unique, non-duplicative amenities and facilities in locations that draw residents throughout the City
• Ensure that all buildings, system improvements and capital projects meet or surpass environmental and regulatory requirements and incorporate sustainable practices as embodied in the International Green Construction Code (IgCC) with City Amendments or equivalent benchmarks where appropriate
• Optimize site potential to minimize non-renewable energy consumption
• Use environmentally preferable products• Protect and conserve water• Enhance indoor environmental quality• Optimize operational and maintenance practices
that result in reduction of our “carbon footprint”
Construct new City buildings in an environmentally sustainable manner and meet 2018 International Green Construction Code (IgCC) with City Amendments
105

Action Items
Complete park design at the former CPSC site
Begin construction of the park at the former CPSC site
Complete construction of Discovery Park
Replace the City Hall/Concert Pavilion marquee with an electronic sign
Complete the replacement of the fuel tank at Public Works
Begin/complete design on Olde Towne fiber duct bank project
Complete the Master Plan Study for the Public Works complex
Complete the construction of the new Police Station and Mayor and City Council Chambers
Complete the replacement of the Activity Center partition wall between Gym 1 & Gym 2
Begin the design on the modernization of the three elevators at the Olde Towne Parking Garage
Conduct the City Parking Lot Pavement Assessment
Complete the replacement of the Filtration System Motor and Pumps at the Water Park
FY 2021 Key Action Items
Complete construction of the park at the former CPSC site
Complete the replacement of the fuel tanks at Public Works
Complete construction on Olde Towne fiber duct bank project
Begin the modernization of the three elevators at the Olde Towne Parking Garage
Begin the design of the buildout of the remaining section of 16 S. Summit Avenue
Begin the design of the renovations of City Hall
Begin/Complete the design of the roof replacement at the Activity Center
Replace the Casey Community Center Electronic Sign
Work with MCPS to build the New Gaithersburg Elementary School Turf Field
Complete the Crown Farm Park restoration of the Corn Crib
Begin the design on the remaining elements of Crown Farm Park
FY 2022 Key Action Items
106

Critical Measures
Facility Operating Cost per Gross Square Foot
*Facilities Management
Facilities Management FY2015 FY2016 FY2017 FY2018 FY2019 FY2020FY2021
(Thru Dec. 2020)
Square Feet Maintained 452,830 452,830 494,849 494,849 533,705 533,705 518,835
Work Orders Performed 1,816 2,373 2,870 2,736 3,689 2,855 1,666
Facility Operating Cost per Square Foot (2017 IFMA Benchmark $7.49/GSF)
$5.10(+$0.72)
$5.49(+$0.39)
$5.67(+$0.18)
$5.96(+0.29)
$5.81(‐$0.15)
$5.99(+$0.18)
$6.95(Budget)(+$0.96)
Total Energy Per Facilities (Mbtu)
26,726(+22.50%)
21,735(‐18.77%)
16,825(‐22.59%)
16,321(‐2.99%)
16,701(+2.32%)
11,843(‐29.09%)
2,075(‐82.48%)
Electrical Usage Per kWHs 5,967,440 4,733,983 3,573,872 3,197,231 3,109,002 2,064,526 204,549
Natural Gas Usage perThms
62,098 54,416 45,042 53,141 59,095 48,867 13,779
Heating Oil usage per Gallons
1,444 1095 907 695 1,320 804 0
Water Usage per Gallons 6,804,885 4,814,874 5,794,590 5,799,662 9,188,212 6,255,996 1,640,108
$5.67 $5.96
$5.81 $5.99 $5.96
$3.83
$6.54
$7.49 $7.49 $7.49 $7.49
$7.49
$0.00
$1.00
$2.00
$3.00
$4.00
$5.00
$6.00
$7.00
$8.00
FY17 FY18 FY19 FY20 FY21 Budget FY21 Current
City of Gaithersburg ($/GSF)
International Facilities Management Association Baseline*
* Corrections to all the data was made for FY22. For example, the new Utility Software was able to dissectthe data to allow for reporting in the right reporting periods. However, FY20 & FY21 electrical data has notbeen completely entered and split prior to the publishing of this document.
**The FY22 square footage decreased to 518,835 due to the demolition of the CPSC warehouse and 307 &305 South Frederick Avenue.
*The International Facilities Management Association Baseline was updated in 2017. Their previouslypublished baseline was from 2013. The Facility Operating Baseline Cost increased from $6.54 to $7.49per gross square foot.
107

Critical Measures
AnalysisEven with COVID-19 and the lack of both staff and patrons visiting our facilities, the number of work orders expected to be completed is on par with those over the last three years. Facilities operating costs (actual) per gross square foot (GSF) (see chart on previous page) continue to increase each year due to factors such as the overall age of facilities and cost of utilities, services and repair/replacement of failing or failed equipment. To reverse this trend, a sizable investment will need to be dedicated to the renovation and modernization of the City’s buildings and infrastructure.
Multiple offices within the Public Works Department along with the help of the Information Technology Department completed the deployment of the City’s new Utilities Management System at the end of calendar year 2020. This new tool will enable the department to further analyze the City’s utility bills, utility consumption data, identify trends and assist with various regulatory reporting requirements such as Energy Star, Greenhouse Gas Emissions reports, etc. This tool can extract data that will allow the Public Works Department to compete for various sources of energy related funding previously unavailable due to the lack of data.
Energy Usage in Mbtu
15,572
5,253
10,190
130
16,827
4,503
12,196
126
16,918
5,911
10,910
97
16,701
5,910
10,608
183
11,843
4,687
7,044
112
2,075
1,378
697
‐
‐ 2,000 4,000 6,000 8,000 10,000 12,000 14,000 16,000 18,000
Total
Natural Gas
Electric
Heating Oil
2021* 2020 2019 2018 2017 5‐Yr. Avg.
* Partial year data
108

Key Strategies
Potential Strategy Conflicts‐
Gaithersburg Strategic Plan – FY 2022
Parks, Recreationand Culture
Provide quality parks, well-planned, sustainable facilities, and diverse cultural, artistic, and recreational opportunities for all ages and interests to promote the health and well-being of
residents and visitors
• Foster active lifestyles to support a healthy community; develop programs utilizing citizen input and recreational trends
• Ensure all communities have accessible, safe, functional, and engaging recreational facilities and amenities
• Support community oriented arts, history and science events, projects and initiatives, as well as local artists and scholars
• Preserve green space for passive and active recreation; seek opportunities to acquire open space; and foster conservation of natural resources
• Utilize revenue offsets to enhance department offerings
109

Objectives
Foster active lifestyles to support a healthy community; develop programs utilizing citizen input and recreational trends
• Provide in-person and virtual recreation and fitness classes, health and wellness programs, preventive screenings, sports, special events and arts programs, and other resources that promote a healthy lifestyle
• Provide quality out-of-school activities for City youth that promote enriching experiences
• Utilize various survey platforms as a means of measuring recreational trends and ensuring programs are relevant to the audience
• Utilize national standards to evaluate City recreation amenities relative to the Parks, Recreation and Open Space Plan
• Utilize Science, Technology, Engineering, Arts, and Math (STEAM) educational tools and outdoor educational offerings in youth activities at all age levels
• Provide resources to older adults who would benefit from programs and services that help them to stay healthy, engaged in their community, feel valued, and age in place
• Utilize standing committees, ad hoc committees, and focus groups for specific projects, programs and initiatives
• Provide excellent resources through personnel, equipment and supplies, fields, and facilities; promote good sportsmanship and teamwork while improving the physical and psychological well-being of participants
110

Objectives
• Continually evaluate recreational amenities, including virtual program options, relative to needs within existing communities
• Balance existing fields, parks, and amenities to meet current demand
• Meet and confer with City Planning and Code Administration staff to ensure optimal utilization of recreation space provided within new developments
• Work to ensure that shared-use trails, bike lanes and bike infrastructure are considered in the planning of road and infrastructure projects
• Work with federal, state and county government agencies as well as the private sector to fund new recreational facilities
• Ensure resident proximity to parks with a goal of less than .25 miles
• Coordinate with local agencies and organizations to publicize and encourage participation in free or reduced-fee programs
• Collaborate with Montgomery County Public Schools (MCPS) to continue the joint operation of the Gaithersburg Aquatic Center
• Identify under represented groups and promote participation, engagement and connectivity
• Reduce barriers for accessing information, recreational facilities and amenities
• Provide financial assistance for eligible City residents
Ensure all communities have accessible, safe, functional, and engaging recreational facilities and amenities
111

Objectives
Support community oriented arts, history and science events, projects and initiatives, as well as local artists and scholars
• Utilize the Art in Public Places program and a robust community engagement process to support a sense of place and pride for Gaithersburg
• Showcase community arts and heritage groups and artists in City arts programs and special events
• Implement the goals and objectives of the Cultural Arts Chapter of the Parks, Recreation and Culture (PRC) Element of the City’s Master Plan
• Partner with local, regional and national organizations to build strong science and history programs for schools and residents
• Utilize the City’s cultural assets and events to enhance Gaithersburg’s brand to residents, visitorsand new businesses
• Use multifaceted marketing strategies to increase awareness of the City’s cultural offerings
Preserve green space for passive and active recreation; seek opportunities to acquire open space; and foster conservation of natural resources
• Work with state and federal agencies to acquire surplus property
• Seek opportunities to acquire additional properties through purchases, partnerships and monetary contributions
• Cultivate an appreciation of the natural environment and the outdoors through recreational and camp offerings
• Provide technical assistance for community garden initiatives
• Engage patrons in good conservation and environmental stewardship practices
• Integrate nature-based activities and educational opportunities into City programs and events
• Integrate environmentally sustainable initiatives such as composting at large signature regional events
112

Objectives
Utilize revenue offsets to enhance department offerings
• Utilize the Gaithersburg Parks, Arts and Recreation Corporation (G-PARC) to support City parks, arts and recreation initiatives through fundraising, volunteer development, partnerships, and awareness campaign programs
• Develop new revenue streams and market-relevant fees for virtual programs while ensuring program quality is high
• Create a fee schedule that reflects local and national trends and appropriate market pricing for participation in programs and services
• Develop vested, working volunteers to support and promote large events, facilities and programs
• Develop active partners and in-kind support sponsors to share resources and to provide services and enhancements to City programs and events
• Leverage partnerships with foundations, agencies, and for-profit and nonprofit organizations to provide resources for the benefit of the community’s recreational needs
113

Action Items
Construction of park at CPSC
Construction of Discovery Park (formerly MedImmune)
Design and construct the synthetic turf field at Robertson park Field #3
Design replacement of the Pump & Filter Room
Complete concept design for Benjamin Gaither Center Courtyard access
FY 2020 Key Action Items
Construction of park at CPSC
Construct the synthetic turf field at Robertson park Field #3
Design replacement of the Pump & Filter Room
Complete design for Benjamin Gaither Center Courtyard access
Develop community art process with public art vendor for design and fabrication of Diamond Farms Skate Spot art work
Launch Gateway to Gaithersburg public art project, community mural program, and partner with G-PARC for artist-made trail markers
Introduce and implement an after school youth sports initiative to engage disconnected students
Begin the planning process for Crown Farm Park
Partner with G-PARC on the trail mapping initiative “Explore Gaithersburg” at Bohrer and Morris Parks
FY 2022 Key Action Items
114

Critical Measures
Analysis
The Water Park revenue offset decreased due to the minimum wage increase and weather conditions during summer operations of 2019. Due to COVID-19, the Water Park opened in July 2020, losing five weeks of FY20 operation (Memorial Day weekend through June 2020).
Revenue offset for Recreation Classes decreased due to COVID-19. All programs were cancelled in March and only a few were able to resume in July 2020.
Revenue offset reflects a small increase for Summer Programs. This increase is due to the cancellation of Summer 2020 Camp Programs which eliminated spending to rollout the summer season at the close of FY20. Revenue figures reported for Summer Programs in FY20 remain strong as the majority of the FY20 (Summer 2019) season was unaffected by COVID.
The Benjamin Gaither Center (Senior Programs) revenue offset for FY20 decreased due to the COVID-19 facility closure in March 2020. Revenue was on track with the projected budget through February with high participation in trip programs and an increase in Fitness Center memberships.
Recreation Programs Revenue Offset – Net of Facility Costs
30.50%
85%
96%
144.70%
30.2%
79.0%
122.0%
110.0%
26.0%
82.0%
99.0%
98.0%
28.0%
81.0%
122.0%
82.0%
15.0%
85.0%
42.0%
45.0%
0.00% 20.00% 40.00% 60.00% 80.00% 100.00% 120.00% 140.00% 160.00%
Senior Programs
Summer Programs
Recreation Classes
Water Park
FY 20 FY 19 FY 18 FY 17 FY16
115

Critical Measures
Cultural Programs Revenue Offset – Net of Facility Costs
Analysis
52%
50%
39%
7%
54%
140%
52%
42%
32%
6%
41%
157%
49%
41%
28%
15%
35%
145%
47%
24%
122%
0%
43%
217%
0% 50% 100% 150% 200% 250%
Arts Barn
Mansion
Book Festival
SummerFest
Oktoberfest
Winter Lights
FY 20 FY 19 FY 18 FY 17
$178,627/$382,991$274,128/$555,978$208,664/$536,690$278,958/$537,163
$422,937/$194,695$353,964/$243,925$340,258/$217,347$304,473/$217,236
$43,680/$102,425$33,810/$97,353$40,444/$97,974$45,908/$85,639
No Festival (FY20 ‐2020)$19,630/$134,707 (FY19 ‐2019)$8,991/$145,804 (FY18 ‐2018)$11,073/$157,743 (FY18 ‐2017)
$16,020/$13,105$37,220/$134,204$37,080/$114,486$43,700/$111,972
$88,304/$368,612$144,782/$350,169$155,002/$365,022$174,671/$348,447
Associated Revenue/Expense
During the first half of FY20, revenue goals were consistently met. The Maryland State Arts Council grant award was $113,193 (an 88% increase from FY19). Revenue offset for both Winter Lights and Oktoberfest increased for FY20. No SummerFest event was held.
Due to COVID-19, in-person events in mid-March were canceled and digital programs were developed to serve/retain customers. The Mansion hosted 108 events and earned 54% of projected revenue, but closed before the heavy wedding season began in April.
At the onset of FY20, the Arts Barn was closed for installation of a new HVAC system and roof. It reopened in October with a robust season before closing again in March. Despite the shortened season, the Arts Barn earned 71% of the projected revenue for the year.
The Gaithersburg Book Festival was successfully produced online and gained new audiences both locally and nationally. Winter Lights finished its 24th year with added light displays, sold-out special events and a 19% increase in revenue. Events staff produced 79 community in-person programs before closing due to COVID-19. Overall, in-person attendance for the Division was 306,930—71% of FY19 attendance.
116

Critical Measures
Benjamin Gaither Center Services
Analysis
This chart represents the average number of weekly meals served at the Center through the federally supported nutrition program and the average number of weekly fitness class participants. The number of meals served decreased as the center saw a shift in the average member, who tends to be more active and attends the center on a less frequent basis. The number of fitness class participants remained relatively steady.
This chart also reflects average monthly resident memberships as well as total memberships. There was a decrease in overall memberships and resident memberships from FY19 to March 2020, when the facility closed due to COVID-19. Typically both memberships types increase before the end of the fiscal year.
635
378
265
124
664
389
279
156
637
370
283
148
638
368
313
152
627
365
299
152
0 200 400 600 800
Total Membership ‐ Monthly Avg.
Resident Membership ‐ Monthly Avg.
Fitness Classes Participants ‐Weekly Avg.
Meals Served ‐ Weekly Avg.
FY20 FY19 FY18 FY17 FY16
117

Critical Measures
Camp Registration, Youth Center Attendance and GYC Memberships
Analysis
Summer Camps and Youth Programs were tremendously affected by the COVID-19 pandemic in FY20. Note that camp registration figures represented on this graph have historically been reported by season, not fiscal year. For the 2020 season, traditional camps were cancelled. Summer camp programs that operated did so at a considerably reduced capacity. While total registration numbers are low, the program impact was significant and allowed parents to return to work during Phase II of the COVID-19 Reopening.
Both Youth Centers served as locations for 2020 Summer Camps, but the after school drop-in programs closed in March 2020. Due to these closures, membership based attendance at the Youth Centers was down 32% and GYC membership totals were down 21%.
50
6,038
16,576
462
2,541
10,568
22,559
583
2,248
12,222
19,790
524
2,151
10,566
19,784
490
2,144
9,713
16,461
450
0 5,000 10,000 15,000 20,000 25,000
Camp Totals
RPYC
OTYC
GYC Memberships
FY20 FY19 FY18 FY17 FY16
118

Key Strategies
Potential Strategy Conflicts‐
Gaithersburg Strategic Plan – FY 2022
Planning and Development
Ensure all planning and development is built and maintained in a high quality manner that utilizes sustainable principles to maintain the high quality of life enjoyed by residents and
businesses, while balancing environmental, transportation, economic, social, and civic needs
• Foster a high level of community and stakeholder involvement in planning and development
• Encourage high quality, aesthetically appealing development that adheres to City objectives for sustainable growth
• Ensure all aspects of development are completed with best practices management, code enforcement, the highest level of public safety, and high quality standards for public and private infrastructure and well-maintained neighborhoods
• Carefully weigh impacts of development and annexations on public infrastructure and the environment with the City’s economic development, sustainable growth, and quality of life objectives
• Promote housing stability and inclusiveness and maintain neighborhood vitality through quality infrastructure, community involvement, public safety, and neighborhood services
• Economic Development
• Housing
• Environment
• Transportation
119

Objectives
Foster a high level of community and stakeholder involvement in planning and development
• Utilize software, technology and web applications to enhance public use and information
• Foster dialogue with outside agencies to facilitate information exchange
• Ensure timely response to community and stakeholder issues in Planning & Code Administration and Department of Public Works –Engineering and Landscaping & Forestry Divisions
• Maintain communication with HOAs during construction projects and relative to code compliance issues
• Ensure that City Master Plans and other planning documents accurately reflect land use and municipal planning best practices and applicable state and federal requirements
• Continue implementation of approved design guidelines for MXD zoned developments and Olde Towne
• Ensure that constructed development emulates the vision and plans for the development as approved by the Planning Commission
• Identify properties that present opportunities for adding value to the City and aggressively pursue annexations
• Attract quality development by ensuring maintenance of existing neighborhoods
• Provide amenities in new neighborhoods and strive to add additional neighborhood amenities within established neighborhoods
Encourage high quality, aesthetically appealing development that adheres to City objectives for sustainable growth
120

ObjectivesEnsure all aspects of development are completed with best practices management, code enforcement, the highest level of public safety, and high quality standards for public and private infrastructure and well‐maintained neighborhoods
• Evaluate innovations and current trends in planning and development to update City codes and regulations in order to ensure safety
• Promote best management practices through training and education of staff, appointed and elected officials
• Minimize disruption to existing neighborhoods by phasing construction as needed
• Conduct thorough and timely reviews of Development Plans, License Applications, Construction Permits, and Inspections
• Provide safety program involving fire inspections of targeted high-hazard occupancies
• Ensure that the City’s planning and economic priorities are reflected in a balanced review of school and traffic facilities
• Designate Gaithersburg Enterprise Zone, Frederick Avenue Corridor and Lakeforest Mall as priority areas for redevelopment
• Ensure compatible development patterns that are phased and constructed in a manner that creates the least amount of disruption as part of the entitlements process
• Maintain and enhance the City’s Geographic Information System and its layers in conjunction with the Information Technology Department to provide mapping and statistical data as tools for reporting and evaluating existing and proposed development
• Continually review and revise Planning & Development Ordinances and Codes to ensure best management practices
• Work with partner agencies and jurisdictions concerning adequate public facilities; analyze results and recommend potential changes
Carefully weigh impacts of development and annexations on public infrastructure and the environment with the City’s economic development, sustainable growth and quality of life objectives
121

Objectives
Promote housing stability and inclusiveness and maintain neighborhood vitality through quality infrastructure, community involvement, public safety, and neighborhood services
• Continually monitor and address deteriorating, blighted and/or overcrowded residential and non-residential structures through targeted code enforcement
• Utilize limited, strategic investments of City property acquisition funds to expedite improvements to areas of slum and blight
• Provide assistance to households at risk of foreclosure, eviction or utility shut-off
• Provide visible and active presence in neighborhoods and communities
• Preserve healthy, vibrant, diverse, and safe neighborhoods that enhance the quality of life through education and code compliance
• Utilize Code Enforcement Abatement Fund to resolve outstanding property maintenance violations
• Determine possible needs of underserved neighborhoods and reflect in the Comprehensive Plan
• Maintain a proactive license and inspection program for rental housing stock
• Actively track and ensure code compliance on foreclosed properties within the City
• Provide matching grants to neighborhood associations to address community improvements, beautification efforts and blight issues
• Maintain a proactive license program to encourage the registration of pets
• Complete, as required by HUD, visual lead testing at multi-family properties where CDBG funds are used to provide rental assistance for more than three months
122

Action Items
FY 2021 Key Action Items
Present 2015 IPMC Property Maintenance Code (Chapter 17AA of the City Code) for adoption
Update and present Tree Manual for adoption
Transition from Energov’s (City’s permitting software) Citizen’s Access Port (CAP) to Customer Self-Service (CSS) account
Finalize and present Parking Permit Program ordinance (Chapter 14) for adoption
Review current historic designation of City park at Crown and explore uses
Facilitate next steps in the Lakeforest Mall redevelopment
Present 2015 IPMC Property Maintenance Code (Chapter 17AA of the City Code) for adoption
Update and present Tree Manual for adoption
Transition from Energov’s (City’s permitting software) Citizen’s Access Port (CAP) to Customer Self-Service (CSS) account
Evaluate Chapter 13 - Landlord-Tenant Relations and present amendments for adoption
Present 2021 ICC codes and City Amendments (Chapters 5, 7 and 11) for adoption
Complete draft Housing Element: an amendment to the City’s Master Plan
Adopt Lakeforest Mall Master Plan
FY 2022 Key Action Items
123

Critical Measures
Development trends continue to remain steady, with the total number of applications in FY20 slightly higher than FY19. The number of applications at the mid-mark of FY21 are generally on track to match projections. Overall, the Covid-19 pandemic has not drastically affected the number of planning applications. Expectations for development applications in FY22 are consistent with previous years.
Analysis
Entitlements for Development
Case Type FY 2016 FY 2017 FY 2018 FY 2019 FY 2020 FY 2021*FY 2022
Projections
Site Plans 9 10 11 5 8 4 8
Schematic Development Plans & Amendments 3 4 4 10 2 4 4
Amendments to Site Plans 148 118 129 116 135 106 129
Record Plats 5 10 17 13 4 1 9
Zoning Map Amendment (Rezoning) 3 1 1 0 0 0 1
Zoning Verification 31 44 26 26 27 16 30
Board of Appeals Applications 2 8 5 3 4 1 4
Historic Reviews18 22 26 23 24 12 22
City Code/Text Amendments 3 3 4 1 3 1 2
TOTAL 222 220 223 197 207 145 209
* FY 2021 figures as of December 14, 2020
0
50
100
150
200
250
FY16 FY17 FY18 FY19 FY20
Zoning Verification
Historic Reviews
City Code/Text Amendments
Zoning Map Amendment
Record Plats
Board of Appeals Applications
Amendments to Site Plans
SDPs
Site Plans
Entitlement Trends
124

Critical Measures
Analysis
**Fire Protection System Operation Permits
FY FYFYFY20 Permits and Licenses
New CommercialBuildings0.5%
Interior Fit‐ups9% New Commercial
Occupancy Permits8%Residential
ImprovementPermits7%
New ResidentialPermits0.5%
Site Development
2.5%Sign14%
Fire Services15%
FPSOP** Licensed34%
Electrical Licenses10%
New Commercial Buildings
Interior Fit‐ups
New Commercial Occupancy Permits
Residential Improvement Permits
New Residential Permits
Site Development
Sign
Fire Services
FPSOP** Licensed
Electrical Licenses
6
149 167132
41 43
178229
730
331
0
100
200300
400
500600
700800
Permits & Licenses for Development
FY 2017 FY 2018 FY 2019 FY 2020
Notably, the existing building Fire Systems Licenses continued to increase in FY20 as expected with the program development in FY17. The Electrical Licenses are on a two year renewal and reflects as such in FY20. Commercial Interior Occupancies increased in FY20 near FY17 totals. Remaining permits were down in FY20. New residential occurring in FY21 has seen an increase thus far, and is projected to continue in FY22.
125

Critical Measures
Analysis
2,963
2,238
314 270
1560
971
2,520
1,937
281 215
1,258901
1,174
796
14091
459560
1,978
1,162
365
257
751 730
0
500
1,000
1,500
2,000
2,500
3,000
3,500
Building Electrical Mechanical Occupancy SiteDevelopment
Fire Code
FY 2017 FY 2018 FY 2019 FY 2020
Inspections for New & Infill Development
Building37%
Electrical25%
Mechanical4%
Occupancy3%
Site Development14%
Fire Code17%
FY20 Inspections for Development
Building
Electrical
Mechanical
Occupancy
Site Development
Fire Code
Inspection totals for FY20 were up from FY19 and FY21 totals are anticipated to remain equal to FY19 despite inspection challenges during the pandemic.
126

Critical Measures
Many of the metrics have been negatively impacted by COVID-19. The pandemic limited services including proactive rental housing inspections and licenses issued in the third and fourth quarter’s of FY20. Property Maintenance Inspections decreased by 30% as proactive inspections were suspended. There was a 99% compliance rate on Notices of Violations issued.
Amusement Vendors
Rental ‐Multi‐FamilyComplex (2Year Cycle)
Rental ‐Single‐Family
Home BasedBusiness
Total Numberof Licenses
FY 2016 16 29 25 1,232 43 1,345
FY 2017 19 42 30 1,380 41 1,512
FY 2018 14 20 26 1,341 11 1,412
FY 2019 14 16 34 1,422 36 1,522
FY 2020 3 10 27 1,242 32 1,314
0200400600800
1,0001,2001,4001,600
Neighborhood Services Licenses
16,13014,940
20,34318,945
14,774
12,127 10,994
15,550 14,068
9,940
3,885 3,805 4,722 4,772 4,753
118 141 71 105 81
0
5,000
10,000
15,000
20,000
25,000
FY 2016 FY 2017 FY 2018 FY 2019 FY 2020
Neighborhood Services Activity
Total Number
PropertyMaintenanceInspections
Notices ofViolation
MunicipalInfractionCitations
127

Critical Measures
These metrics track annual animal licenses, nonresident dog park memberships sold, and requests for service. COVID-19 impacted final numbers across the board in the third and fourth quarter of FY20.
Analysis
Pet License ‐ Cat Pet License ‐ DogDog Park
NonresidentMembership
Requests for Service
FY 2016 476 2,431 15 1,172
FY 2017 452 2,305 24 1,111
FY 2018 451 2,338 25 845
FY 2019 474 2,256 37 1,001
FY 2020 324 1,332 12 780
0
500
1,000
1,500
2,000
2,500
3,000Animal Control Services
$31,975$29,025 $28,970
$28,763 $21,245
$840 $1,440 $1,500$2,220 $780
$0
$5,000
$10,000
$15,000
$20,000
$25,000
$30,000
$35,000
FY 2016 FY 2017 FY 2018 FY 2019 FY 2020
Animal Control Revenues
License Revenues Dog Park Revenue
128

Key Strategies
Potential Strategy Conflicts‐
Gaithersburg Strategic Plan – FY 2022
Police Department
Safeguard the lives of those within the City, enforce the laws and ordinances of the State of Maryland and the City of
Gaithersburg, protect property, maintain the safe and orderly flow of traffic, and assist in securing, for all persons, equal
protection of the law
• Deliver comprehensive police services that prevent and reduce crime and sustain the quality of life in the City
• Enhance the establishment of highly skilled and diverse professionals capable of providing comprehensive and effective police services
• Work in partnership with communities, government agencies and allied organizations to augment the Department’s resources and improve delivery of comprehensive police services
• Employ new and advanced technologies to improve the delivery of quality police service
• Continually build community trust in the Police Department
129

Objectives
Deliver comprehensive police services that prevent and reduce crime and sustain the quality of life in the City
• Work with communities to reduce crime, maintain order, solve community problems, and respond to incidents that affect the quality of life
• Utilize the Data Driven Approach to Crime and Traffic Safety (DDACTS)
• Employ operational tactics resulting from careful analysis of the link between illegal drugs, including their distribution patterns and crime
• Acknowledge that the incidence of traffic accidents results in more deaths, injuries and property loss than criminal incidents. Dedicate appropriate Department resources toward the reduction of speeding and impaired driving. Encourage pedestrian safety and the proper usage of occupant protection
• Coordinate with Montgomery County Police 6th
District personnel to maximize services, visibility and effectiveness of our personnel
• Keep the public informed of the Department’s activities through outreach activities, social media and accessible statistics
130

Objectives
Enhance the establishment of highly skilled and diverse professionals capable of providing comprehensive and effective police services
• Focus on the development of professional staff and ensure that their accomplishments are recognized both internally and externally
• Enhance recruiting efforts by utilizing social media sites and job fairs to select suitable candidates for vacant positions. Our goal is to attract, select and retain the best qualified person(s) regardless of race, color, sex, national origin, or religion
• Continue professional development of internal leadership, enhancement of management and decision making skills, and improved communication in the face of the increasing complexity of the law enforcement profession
• Utilize performance evaluation and tracking systems that provide employees with timely feedback and career guidance
• Continually evaluate specialized units and personnel to adapt to changing demands
• Provide a mentoring program to all newly promoted supervisors
• Provide every officer with a variety of scenario-based training that covers a diverse range of incidents and training objectives, such as use of force, de-escalation techniques and mental health training
• Expand recruitment and retention initiatives to secure adequate pool of candidates and officers
131

Objectives
Work in partnership with communities, government agencies and allied organizations to augment the Department’s resources and improve delivery of comprehensive police services
• Ensure that the Continuity of Operation Plan (COOP) is up to date and its components are readily accessible
• Ensure the highest level of preparedness by providing opportunities for disaster response exercises and National Incident Management System/Incident Command System (NIMS/ICS) training
• Maintain strong partnerships with schools in the City
• Enhance relationships with non-English speaking communities and citizens
• Maintain support for Neighborhood Watch programs throughout the City
• Recognize community members for their contributions to the safety and well-being of the community
• Emphasize cooperative, proactive media relations as a means of advancing the goals of the Department
• Work with Montgomery County and the Alert Gaithersburg notification system vendor to ensure timely and accurate information is provided to internal and external customers
• Work with the Gaithersburg Police Foundation (GPF) in funding programs and activities that promote public safety and community partnership
• Work with other local governments and public utilities to coordinate responses to disasters and emergencies
132

Objectives
Employ new and advanced technologies to improve the delivery of quality police services
• Employ the Data Driven Approaches to Crime and Traffic Safety (DDACTS) model in the deployment of resources
• Utilize automated technology tools such as license plate readers, surveillance cameras, cell phone data extraction analysis, and speed cameras to supplement police personnel resources
• Utilize biometric field resources to aid investigators and patrol personnel in the rapid and accurate identification of offenders
• Use technology tools to measure and report crime statistics to accurately portray crime in individual neighborhoods
• Ensure control and accountability of property/evidence, Department equipment and fleet resources through the utilization of modern tracking and inventory systems
• Use body worn cameras to promote transparency and accountability
• Foster and adopt procedural justice as a guiding principle for internal and external policies and practices
• Maintain an organizational culture of transparency and accountability
• Provide a diverse workforce that covers a broad range of cultures and life experiences to improve understanding and effectiveness in dealing with all communities
Continually build community trust in the Police Department
133

Action Items
Identify highly motivated candidates between the ages of 18 and 20 years old who are interested in a future career as a Gaithersburg Police Officer for the position of Police Cadet
Implement Fair and Impartial Policing training to officers and develop a written policy that is consistent with the training received and community expectations
Demonstrate compliance with all applicable standards in order to obtain re-accreditation for the department by the Commission on Accreditation for Law Enforcement Agencies (CALEA)
Implement Focused Enforcement Area initiatives focused on specific geographical areas within the City to strengthen the working relationships between the department, citizens and businesses in those areas
Evaluate current operations and make any necessary adjustments to facilitate the move to the new police station at 16 South Summit Avenue
FY 2021 Key Action Items
Implement Fair and Impartial Policing training to officers and develop a written policy that is consistent with the training received and community expectations
Ensure department training objectives and policies are updated to coincide with police reform legislation and Maryland Police and Correctional Training Commission Standards
Include de-escalation training that contains decision-making exercises into all use of force training venues for firearms, Taser, and defensive tactics
Ensure open communications with community organizers and the public through quarterly meetings (at a minimum) for the purpose of preserving strong relationships of mutual trust between the department and the communities we serve
Recruit and hire four police officers to enable the department to remain at authorized staffing levels
FY 2022 Key Action Items
134

Critical Measures
20,687
24,75923,171
22,420
17,386
13,152 14,30411,973 12,211 12,243
0
5,000
10,000
15,000
20,000
25,000
30,000
2016 2017 2018 2019 2020
Percentage of Calls Handled by GPD
Total Calls in the City* Calls Handled by GPD Percentage Handled by GPD
63.6% 57.8% 51.7%
70.4%
*Total calls include dispatched calls plus self‐initiated calls.
16,805 16,834 16,58313,916
37,06338,596
35,39227,667
69,562 69,769 70,010 70,223
10,000
20,000
30,000
40,000
50,000
60,000
70,000
80,000
2017 2018 2019 2020
Dispatched Calls in 6D and Dispatched Calls in the City
DISPATCHED CALLS IN THE CITY
DISPATCHED CALLS IN MONTGOMERY CO. 6TH DISTRICT (including City)
POPULATION (City estimates, US Cenus estimates not available for 2018)
* Data provided by Montgomery Co. Emergency Communications Center
54.5%
135

Critical Measures
2,892
7,995
9,913
1,257
320
2,797
7,148
8,425
1,252
323
2,174
7,062
7,379
1,021
284
3,107
6,213
7,445
849
232
2,226
2,732
3,379
322
127
0 2,000 4,000 6,000 8,000 10,000
Reports Written
Traffic Citations
Traffic Warnings
Criminal Arrests
DUIs
GPD Activity Data
2020 2019 2018 2017 2016
136

Critical Measures
7283
4963
84
50
69
46
57
42
0
20
40
60
80
100
120
140
160
2016 2017 2018 2019 2020
Gaithersburg Investigative SectionCase Closure Rate
Closed Cases Open Cases Total Cases Handled Closure Percentage
51.6%
54.6%
52.5%152
95
120 126
66.7%59.0%
122
200
325287
215178
191
58
48
91
86
0
50
100
150
200
250
300
350
400
450
500
2016 2017 2018 2019 2020
MCPD 6D Investigative SectionCase Closure Rate
Closed Cases Open Cases Total Cases Closure Percentage
84.9% 85.7%
306
70.3% 67.4%335
264
51.2%
383
* Note: GPD and MCP have different reporting definitions for a “closed case”
391
137

Critical Measures
586592 561
600 586
2,162
2,078
1,812 1,892 1,885
724 744
709
607381300
500
700
900
1,100
1,300
1,500
1,700
1,900
2,100
2016 2017 2018 2019 2020
City of Gaithersburg Crimes Against Persons, Property and Society*
Crimes Against Persons Crimes Against Property Crimes Against Society
701 651 667 639 597
1,938 1,894
1,3851,482
1,705
513 412 491288
1770
300
600
900
1,200
1,500
1,800
2,100
2,400
2016 2017 2018 2019 2020
MCPD 6th District Crimes Against Persons, Property and Society* (Excluding City Limits)
Crimes Against Persons Crimes Against Property Crimes Against Society
* Data reported as of 01/21/2020 from the Montgomery County Records Management System.
138

Critical Measures
Analysis
The crime data for this report was pulled on January 21, 2021 from the Montgomery County Records Management System, which is now reporting using the National Incident-Based Reporting System (NIBRS). Due to the change from the Uniform Crime Reporting (UCR) Summary to NIBRS in July 2016, data is only available for 2016 going forward. Under NIBRS, there are 52 Group A offenses that are further categorized as crimes against persons, crimes against property and crimes against society.
Crimes against persons that includes offenses such as homicide, assaults and sex offenses decreased 3.0% from 604 incidents in 2019 to 586 incidents in 2020. Crimes against property that includes offenses such as burglary, robbery, thefts, and vandalisms decreased 0.4% from 1,892 incidents in 2019 to 1,885 incidents in 2020. Crimes against society that includes offenses such as drugs and weapons decreased 38.3% from 618 incidents in 2019 to 381 incidents in 2020. There was an overall decrease of 8.4% in Group A offenses from 3,114 incidents in 2019 to 2,852 incidents in 2020.
The Department does a daily analysis of where and when crimes are occurring and targets the areas having the highest incidents and/or patterns with additional resources. We will continue to utilize proactive crime suppression initiatives and creative use of specialized resources to address crime within the City.
139

Key Strategies
Potential Strategy Conflicts‐
Gaithersburg Strategic Plan – FY 2022
Transportation
Implement equitable transportation planning and management strategies that provide a safe and convenient multimodal
transportation system
• Preserve and maintain local transportation infrastructure to enhance safety and contain capital costs
• Reduce automobile dependence by facilitating multimodal transportation options
• Take a leading role in advancing transportation goals both in Gaithersburg and regionally
• Ensure safety on neighborhood roads through the use of appropriate engineering, enforcement, education, and evaluation practices
• Ensure attractiveness and viability of streetscape and associated amenities
• Economic Development
• Sustainability
140

Objectives
Preserve and maintain local transportation infrastructure to enhance safety and contain capital costs
• Conduct regular inspections of streets and sidewalks to develop a current transportation infrastructure condition assessment
• Prioritize routine and preventive maintenance as well as rehabilitation efforts to minimize major reconstruction projects
• Improve lighting in older neighborhoods through the use of infill lighting; ensure light outages are repaired in a timely manner
• Maintain all traffic control devices at a level consistent with industry standards
• Ensure roadway elements are in compliance with current ADA guidelines
• Ensure improvements distributed throughout the City
• Facilitate citizen involvement in reporting and monitoring City maintenance efforts
• Continually update snow and ice removal processes relating to efficiency and effectiveness
• Encourage increased transit ridership by the expansion of the shelter and bench installation program
• Work with Montgomery County to maintain or improve current Ride-On service levels in the City
• Work with Maryland Department of Transportation to support increased MARC rail service
• Support alternate modes of transportation through the provision of convenience equipment such as bicycle racks and electric vehicle charging stations
• Integrate bicycle and pedestrian design elements into road design and traffic calming measures
• Encourage state and county officials to fund transit, sidewalks, bikeways, and traffic improvements to decrease congestion
• Work with Montgomery County to optimize the timing at signalized intersections
• Determine viability of car and/or bicycle sharing programs as an additional transportation option
Reduce automobile dependence by facilitating multimodal transportation options
141

Objectives
Take a leading role in advancing transportation goals both in Gaithersburg and regionally
• Coordinate with other agencies on regional transportation issues within or affecting the City
• Advocate for transportation improvements at the local, state and federal level that accommodate all users and provide accessible and inclusive facilities
• Coordinate with other agencies regarding local traffic issues affecting the City
• Work with CSX and MARC to improve safety in and around railroad crossings in the City
• Work with Transportation Committee members to advise the Mayor & City Council on important transportation issues within or affecting the City
• Support Bus Rapid Transit initiatives that have the potential to reduce vehicular traffic on major arteries such as MD 355
• Remain an active participant on Metropolitan Washington Council of Government’s (MWCOG’s) Transportation Planning Board, Region Forward initiative, Cooperative Forecast, and implementation programs
• Use engineering, education and enforcement initiatives to ensure vehicular, bicycle and pedestrian safety in City neighborhoods
• Implement traffic calming measures in existing communities where appropriate and consider in new developments through the review process
• Utilize speed and traffic studies to assist in determining where speed enforcement would be effective
• Aggressively enforce parking ordinances and traffic laws to address hazardous situations and community concerns
• Work closely with the Police Department to emphasize traffic safety and enforcement in residential neighborhoods
• Effectively balance the public’s right to park on City streets with neighborhood impacts
Ensure safety on neighborhood roads through the use of appropriate engineering, enforcement, education, and evaluation practices
142
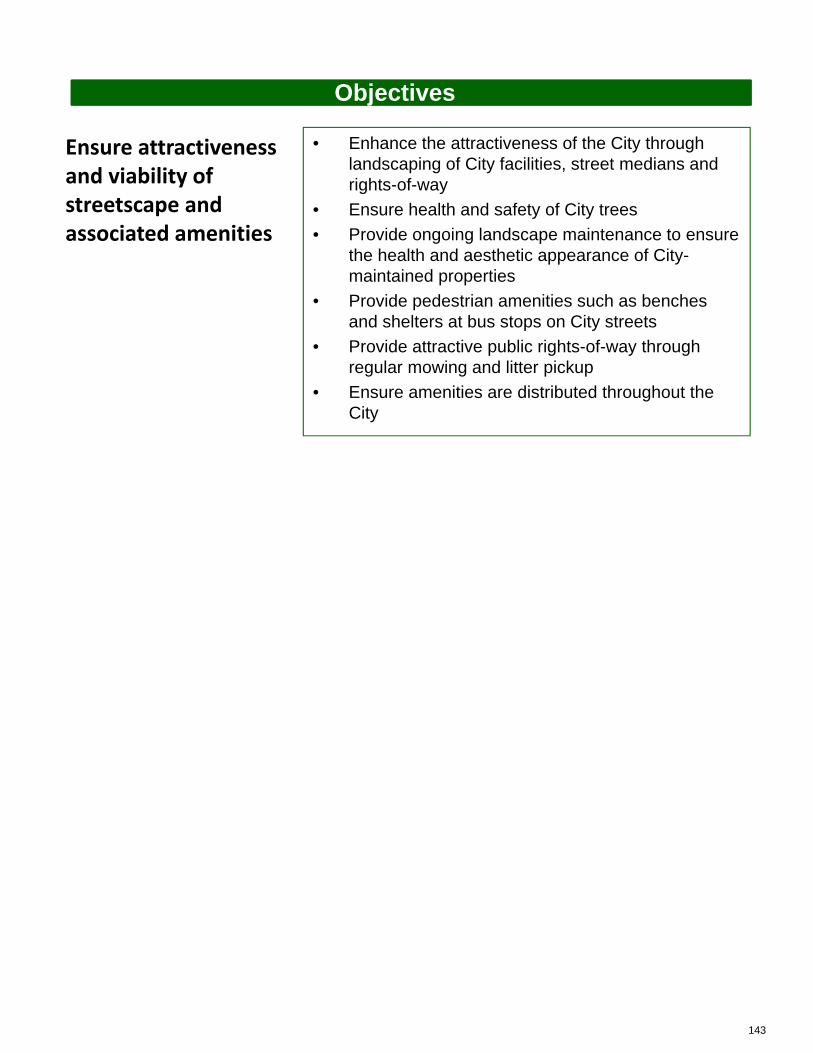
Objectives
Ensure attractiveness and viability of streetscape and associated amenities
• Enhance the attractiveness of the City through landscaping of City facilities, street medians and rights-of-way
• Ensure health and safety of City trees
• Provide ongoing landscape maintenance to ensure the health and aesthetic appearance of City-maintained properties
• Provide pedestrian amenities such as benches and shelters at bus stops on City streets
• Provide attractive public rights-of-way through regular mowing and litter pickup
• Ensure amenities are distributed throughout the City
143

Action Items
Complete the installation of 30 additional benches at City bus stops
Design service installation and construction of lights in Woodland Hills and Olde Carriage Hill
Reconstruct Quince Orchard Boulevard from MD 117 to MD 124
Complete design for pedestrian bridge over Great Seneca Highway
Complete reconstruction of North Summit Avenue and Brookes Avenue traffic signal
Complete reconstruction of Russell Avenue and Odendhal Avenue traffic signal
Execute a new City bus shelter agreement for the maintenance of existing shelters and the installation of new shelters
Design service installation and construction of lights in West Riding
Design service installation and construction of lights in Diamond Farm
Upgrade the pedestrian signals associated with the traffic signal at N. Summit and Diamond Avenues
Complete evaluations of three school sites within the City for school zone effectiveness and capacity to support the Safe Routes to School program
FY 2021 Key Action Items
FY 2022 Key Action Items
Complete evaluations of three school sites within the City for school zone effectiveness and capacity to support the Safe Routes to School program
Complete annual cycle of structural condition inspections for City bridges culverts and special structures
Replace pedestrian bridge behind Casey Community Center
Complete the construction phase of Tschiffely Square road culvert repairs
144
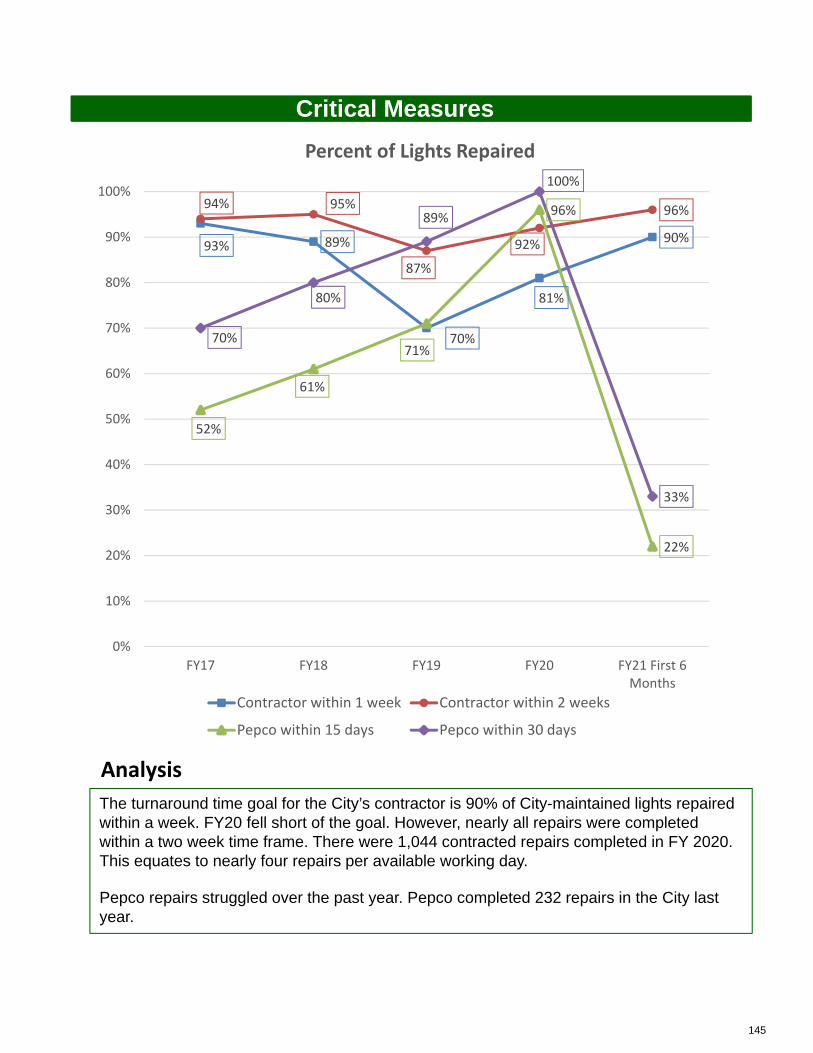
Critical Measures
The turnaround time goal for the City’s contractor is 90% of City-maintained lights repaired within a week. FY20 fell short of the goal. However, nearly all repairs were completed within a two week time frame. There were 1,044 contracted repairs completed in FY 2020. This equates to nearly four repairs per available working day.
Pepco repairs struggled over the past year. Pepco completed 232 repairs in the City last year.
93% 89%
70%
81%
90%
94% 95%
87%
92%
96%
52%
61%
71%
96%
22%
70%
80%
89%
100%
33%
0%
10%
20%
30%
40%
50%
60%
70%
80%
90%
100%
FY17 FY18 FY19 FY20 FY21 First 6Months
Percent of Lights Repaired
Contractor within 1 week Contractor within 2 weeks
Pepco within 15 days Pepco within 30 days
Analysis
145

Critical Measures
Analysis
Winter Events
Snow Totals 0” – 3” 4” – 8” 9” to 12”
Lane‐Miles of City Streets Plowed 228 228 228
Time to Clear Pavement 8 to 10 hours 10 to 12 hours 13 to 15 hours
Number of Contractors 6 6 6
Season Snow Fall
2017-2018 13.1” (Average)
2018-2019 28.1” (Above Average)
2019-2020 1.5” (Below Average)
Note: Snow lane miles differ from City inventory miles because the City performs snow removal on a few County owned roads under an agreement.
146

Critical Measures
Analysis
Citywide Lane Mile Breakdown byGaithersburg Pavement Condition Index Scale
Citywide Lane Miles Evaluated in 2019 = 221 LM
Failed
100 ‐
85 ‐
70 ‐
55 ‐
40 ‐
Gaithersburg PCI
Rating Scale
Good
Satisfactory
Fair
Poor
33.82
132.66
45.51
7.69 1.601%3%
21%
15%
60%
Surface improvements conducted in the calendar year amounted to 3.9 LM of microsurfacing and 4.8 LM of resurfacing. These improvements have resulted in maintaining the level of Satisfactory Pavement Condition Index (PCI) at 60%, increasing Good PCI to 15%, while decreasing Fair and Poor PCI ratings by 1% each.
The next PCI condition evaluation will take place in the Spring of 2021.
147

Critical Measures
Sidewalks include true sidewalks and multiuse paths adjacent to City roads. This number will likely increase in FY22 as roads are taken over by the City from developers.
Off Road Bicycle Facilities include multiuse paths and greenways not adjacent to roads. FY21 increase is due to the addition of the NIST path along MD 124.
On Road Bicycle Facilities indicate City streets with sharrows.
Analysis
16.4 16.4 16.4 16.417.4
0.0
5.0
10.0
15.0
20.0
2017 2018 2019 2020 2021
Miles
Off Road Bicycle Facilities
115.8 115.9
124.2 124.2 124.2
110.0
115.0
120.0
125.0
130.0
2017 2018 2019 2020 2021
Miles
Sidewalks
17.68 17.68 17.68 17.68 17.68
0.00
5.00
10.00
15.00
20.00
FY 2017 FY 2018 FY 2019 FY 2020 FY 2021
Miles
On Road Bicycle Facilities(Bike Lanes/Sharrows/Cycle Tracks)
Sharrows
148

Critical Measures
Analysis
The one year American Community Survey (ACS) data for 2019 shows that, while commuting time remained relatively constant from previous years, there were significant changes in some alternative modes to the single-occupancy vehicle (SOV) from 2018. SOV, carpooling and public transit remained in line with the previous year. However, large increases were seen in “walking” and “work from home,” with a slight increase in other means (taxis, Uber, motorcycles etc.). A sizable decrease was apparent in bicycling from the gains seen in the previous year, but it was still greater than in 2015 through 2017. These differences may reflect growing changes in how people work and the rise of the gig economy.
2015 2016 2017 2018 2019
Average Travel Time Minutes 31.5 31.8 34.2 34.4 33
Car, Truck,Van Alone 70.20% 61.40% 72.65% 68.20% 64.53%
Car, Truck,Van Pooled 9.10% 13.50% 9.85% 13.10% 12.25%
Public Transportation Including Bus and Rail 14.00% 14.70% 11.14% 9.50% 9.54%
Walked 0.60% 2.40% 1.11% 1.80% 3.25%
Bicycled 0.20% 0.00% 0.25% 1.28% 0.65%
Other Means 0.30% 1.40% 1.32% 1.63% 1.88%
Worked at Home 5.70% 6.70% 3.69% 4.50% 7.90%
Work commute Time
Mode
149

Gaithersburg CARES Hub at Seneca Creek Community Church
150

About the Budget
Budget Highlights
FY22 Budget
The budget highlights provide summary information on the adopted fiscal year 2022 budget in major categories and includes information about changes between the proposed and adopted budget. Consistent with the Citywide Funds Summary, the budget highlights will provide information about projected City revenues for fiscal year 2022 and the major categories of expenditures: personnel services, operating and capital.
FY22 Revenues
The General Fund is the primary operating fund for the City. FY22 anticipated General Fund revenues total $70.6 million. Real and personal property tax are the largest source of revenue for the City and at $31.8 million make up approximately 45% of projected General Fund revenues for FY22. The second largest revenue source is income taxes of $14 million which make up approximately 20% of General Fund revenues for FY22. There will be a significant one-time transfer of $4.1 million from the Stormwater Management Fund to the General Fund in FY22 which reflects the repayment of previous subsides made to the Fund.
The pandemic has impacted most of the City’s revenue sources, with the greatest negative effect on projected collections for hotel/motel taxes, admissions and amusement taxes, building permits fees, and revenue for recreation events and programs. As many restrictions lift at the state and local levels, we expect to see some of these revenues increase from FY20 and FY21 levels.
The General Fund will continue to provide significant resources to the CIP and Asset Replacement Fund in FY22 with transfers of $5 million and $3.1 million, respectively. The Stormwater Management Fund will also make a one-time transfer of $3.5 million to the CIP for the repayment of previous subsidies made to the Fund, which alleviates some strain on the General Fund.
FY22 Personnel Services Expenditures
The FY22 adopted budget provides $42.5 million for personnel services expenditures and affirms our commitment to supporting the City’s talented and dedicated workforce. The budget continues the implementation of a recent classification and compensation study that reviewed internal alignment and market competitiveness. The budget also provides for a general wage increase of 2.5%, as well as enhanced professional development opportunities and employee engagement efforts. The City will also further its commitment to advancing racial equity with the creation of a new Racial Equity Program Manager position and a new full time bilingual Caseworker position to better serve Spanish-speaking residents.
FY22 Operating Expenditures
The FY22 adopted budget provides $22.6 million for operating expenditures. Operational increases take into account funding for maintenance projects, including parking deck sealing at the parking garage in Olde Towne ($419,200), the first year of maintenance and operational costs at 16 South Summit Avenue ($154,567), and the implementation of a new hybrid biennial election process ($148,635). The City’s support of residents and businesses impacted by COVID-19 will also continue through the funding of several business assistance programs and direct assistance, including food and housing, to the most vulnerable among us.
FY22 Capital Expenditures
The FY22 budget includes a five-year capital improvement plan. While these capital expenditures are not formally adopted, the CIP provides projections for current and future capital needs. As a debt free municipality, the City must review planned capital expenditures regularly and set aside funding for future needs. Projected capital spending for FY22 totals $28 million of which $3.1 million is in the Stormwater Management Fund, $2.6 million is in the Asset Replacement Fund and $22.1 million is in the CIP. The City’s new police station and Mayor and Council chambers will be completed in FY22. In addition, the City’s newest park, Pleasant View Park will begin construction in FY22.
151

About the Budget
Budget Highlights
FY22 Budget
Changes from the Proposed Budget to the Adopted Budget
The adopted FY22 budget includes General Fund revenue projections $1.4 million higher than the proposed FY22 budget. This increase is primarily due to state grant revenues, some of which were previously anticipated to be received in FY21. Updated revenue projections also include an increase in tax duplication revenue from Montgomery County, and increases in some Parks, Recreation & Culture revenues based on revised facility opening dates. General Fund expenditure projections increased $29,562 which primarily reflects increases in contract mowing services, IT projects and Parks, Recreation & Culture personnel and program expenses offset by cost savings and reductions in other City programs. The impacts of these final changes means that the City no longer needs to reappropriate fund balance for FY22.
The projected CIP revenues for FY22 have increased $102,664 from the proposed budget which is comprised primarily of transfers for new projects for Blohm Park Trail Improvements and Benjamin Gaither Center Bathroom Renovations offset by reductions for City Hall basement waterproofing. Projected CIP expenditures for FY22 have increased $2.2 million which reflects planned expenditures for two new projects and expenditures previously planned for FY21 which will now be incurred in FY22 due to project delays, offset by decreases for construction originally planned for FY22 which is now projected for FY23. Of the total increase, approximately $2.2 million is for the new Police Station and Mayor and Council Chambers projects which have encountered some delays.
The American Rescue Plan Act (ARPA)
The City will receive its second tranche of ARPA funds, totaling $5.7 million in FY22. These federal awards apply to periods through December 31, 2024. The amount of grant revenue that will be recognized in FY22 will be dependent upon the finalization of Treasury guidance and the calculation of calendar year 2021 revenue losses. The City is also creating an internal work group to identify opportunities to strategically invest these funds in ways to maximize the City’s long-term resiliency and recovery efforts. While we expect that some portion of these one-time funds will provide FY22 revenues, the adopted budget does not include this federal grant.
152

About the Budget
Budget Timeline & Process
FY22 Budget
Budget Timeline and Process
Preparation of the budget occurs over an eight-month period after collaboration between Finance & Administration staff, Department Heads, Division Managers, City Council and the City Manager, and includes public engagement through a budget survey and the public comment process. The budget process is composed of nine steps. Following adoption, the budget is submitted to the Government Finance Officers Association (GFOA) for consideration under the Distinguished Budget Award program.
December January February March April May June July
Step #1: Departments Budget Preparation and Strategic Planning (December-February) Beginning in December, Finance & Administration staff prepare the budget package and distribute it to Department Directors for the upcoming budget process. This package is comprised of the timeline, forms for departmental services, personnel and capital requests, and current year revenue projections. The Capital Improvement Plan (CIP) and budget software become available for departmental data entry. Department directors are provided their current year Strategic Directions and Critical Measures and are requested to provide an update on their current year strategic goals, as well as provide any new goals for the next fiscal year and any updates to their Critical Measures. New goals are subject to approval by the City Manager’s Office. The initial work on departmental proposed requests and budget software entries should be completed by early February. The departments will return the Fee Schedule with any requests for updates or changes. Step #2: Budget Survey (January) Finance staff coordinate with the Community and Public Relations Department to update the Virtual Budget Forum survey and distribute to the public for comment and feedback. The survey opens to the public after New Year’s Day and is available for four weeks. The questions ask for public priorities by department, preferred method to pay for needed spending increases, and include several open-ended questions to allow constituents further opportunity to provide comment. Staff publicize the survey through the City’s website, email newsletters, and social media accounts throughout the month. Step #3: Mayor & City Council Retreat (February) The Mayor & City Council (M&CC) conduct an annual retreat in which they review the current financial status and future outlook. The future outlook is comprised of five-year projections of revenue and expenditures, Finance/Budget discussion and Strategic Direction review. During this review, the M&CC also provide modifications to the Strategic Directions and Critical Measures to ensure that they meet the objectives of the specified strategic plan area.
Budget Preparation and Strategic Planning
City Manager’s Proposed Budget
Budget Work Sessions
Adopt Budget
Budget Survey
Adopted Budget becomes effective
Budget Hearing
Council
153

About the Budget
Budget Timeline & Process
FY22 Budget
Step #4: City Manager’s Proposed Budget (February – March) The Senior Leadership Team begins to discuss the City Manager’s Proposed Budget. The team consists of the City Manager, Deputy City Manager, Director of Finance, Senior Budget Analyst, and Department Directors. The team reviews departmental proposed personnel and operating requests, the Fee Schedule, and proposed City Rules and Regulations. Departments submit new initiatives, prioritize action plans, and modify approaches if the proposed enhancements will add value to the existing services. By the beginning of April, the Budget Ordinance is prepared and the Proposed Budget is sent to the Mayor and City Council. The complete Proposed Budget is also available on the City’s website. Step #5: Mayor & City Council Budget Hearings (April) The Finance and Administration Department advertises the Budget Public Hearing Notice and Constant Yield Tax Rate Hearing Notice (if it is necessary). Both the Budget Public Hearing and Constant Yield Tax Rate are posted on the City’s website. The City then conducts a Budget Public Hearing and Constant Yield Tax Rate Public Hearing. Step #6: Mayor & City Council Budget Work Sessions and Revisions (April - May) The Mayor and the City Council conduct two Budget Work Sessions, with one for the operating budget and one for capital programs. Budget changes are returned to appropriate staff to make modifications for preparation of the final budget document. Staff works with the Director of Finance and Administration to make necessary updates to revenue, operating and CIP budgets. In mid-May, the public comment period concludes and the Budget Public Hearing record is officially closed. The Budget Ordinance is updated to include all changes coming from any subsequent events and/or directions from the Mayor and City Council. Step #7: Adoption (June) The final Proposed Budget is considered by the Mayor and City Council in early June. The instrument of adoption includes the tax rate. At the same time, the Mayor and City Council are asked to approve the Fee Schedule and Strategic Plan. Step #8: Adopted Budget Becomes Effective (July) On July 1, the Adopted Budget becomes effective. The final Adopted Budget document is made available to the public no later than July 1. Step #9: Amendment The Mayor and City Council have adopted R-57-13, a standing resolution authorizing the City Manager to transfer funds within the City budget after May 31 of each year, so long as no activity area budget is increased by more than 25%. The resolution allows only for transfers between Activities and Departments. There is no authorization to increase the entire appropriation without a Public Hearing, Work Session and the vote of the Mayor and City Council.
154

About the Budget
Budget Timeline & Process
FY22 Budget
DETAILED BUDGET TIMELINE
OCTOBER 21, 2020
Go Live - all parts of the budget software are open for departments to start preparing requests and submissions DECEMBER 3, 2020
CIP forms due from Department Heads JANUARY 4, 2021
Personnel forms due from Department Heads JANUARY 4 – JANUARY 31, 2021
Virtual Budget Forum survey available to the public JANUARY 22, 2021
Revenue budgets and fee schedule changes due from Department Heads JANUARY 25, 2021
Asset replacement purchase requests due from Department Heads IT allocations and Gasoline Expense forms due
FEBRUARY 3, 2021
Operating budgets and significant change forms due from Department Heads Special fund budgets due
FEBRUARY 22, 2021
Mayor & City Council Retreat
FEBRUARY 16 – FEBRUARY 24, 2021 City Manager, Deputy City Manager, and Director of Finance and Administration conduct review meetings with
Department Heads FEBRUARY 26, 2021
Budget Ordinance materials submitted to Mayor & City Council package for March 15th meeting MARCH 15, 2021
Introduce Budget Ordinance for Public Hearing at Mayor & City Council meeting Results of Virtual Budget Forum survey presented to the Mayor & City Council
APRIL 2, 2021
Advertise Budget Public Hearing (Public Hearing after seven days’ notice) APRIL 5, 2021
Send proposed budget to Mayor and City Council Proposed budget available to public
APRIL 20, 2021
Conduct Public Hearing on Budget
APRIL 27 & APRIL 28, 2021 Conduct Budget Work Sessions on Operating and Capital Budgets
155

About the Budget
Budget Timeline & Process
FY22 Budget
MAY 12, 2021
Close public comment record on Budget Public Hearing (Wednesday at 5 PM) Budget Ordinance changed and prepared for adoption
MAY 21, 2021
Submit materials for Mayor & City Council package for June 7 meeting JUNE 7, 2021
Present budget, fee schedule and rules and regulations for adoption at Mayor & City Council meeting JUNE 8, 2021
Budget ordinance posted on City website
JULY 1, 2021 Adopted Budget book posted to City website Adopted Budget becomes effective
156

About the Budget
Budget Timeline & Process
FY22 Budget
The City’s 2021 Budget received the Government Finance Officers Association’s (GFOA) Distinguished Budget Presentation Award. In order to receive this award the City had to satisfy nationally recognized guidelines for effective budget presentation. These guidelines are designed to assess how well an entity’s budget serves as a policy document, a financial plan, an operations guide, and a communication device. This award is valid for a period of one year and reflects the commitment of the City and our staff to meeting the highest principles of governmental budgeting. We believe our current budget continues to conform to the program requirements and we are submitting it to the GFOA to determine its continued eligibility. The instrument of adoption is included on the pages following the GFOA Budget Award.
157

158

ORDINANCE NO. O-4-21
ORDINANCE ADOPTING THE CITY BUDGET FOR THE FISCAL YEAR JULY 1, 2021, THROUGH JUNE 30, 2022, AND LEVYING AN AD
VALOREM TAX ON ALL ASSESSABLE PROPERTY WITHIN THE CITY OF GAITHERSBURG, MARYLAND
WHEREAS, the proposed budget for the 2021-22 Fiscal Year was submitted by the City Manager to the Mayor and City Council as required by the City Charter, as amended; and WHEREAS, the 2021-22 budget provides a complete financial plan, including anticipated revenues and proposed expenditures, for the fiscal year: NOW, THEREFORE, BE IT ORDAINED by the Mayor and City Council of the City of Gaithersburg, in public meeting assembled, that the budget for the City of Gaithersburg for the Fiscal Year July 1, 2021, through June 30, 2022, be and it hereby is proposed as follows:
ANTICIPATED REVENUES Local Taxes $31,769,200 Licenses & Permits $4,337,730 Intergovernmental Revenue $20,897,771 Charges for Services $4,714,914 Fines & Forfeitures $2,020,000 Miscellaneous Revenues $2,554,668
Anticipated Revenues $66,294,283 Reappropriation $0 Transfer In $4,281,591
Total Anticipated Revenues and Sources of Funds $70,575,874
DocuSign Envelope ID: 966C85E3-9985-4D36-878E-8EB5F0B9F7A1
159

PROPOSED EXPENDITURES
City Manager's Office $2,653,448 Office of the City Attorney $1,108,757 Community & Public Relations $3,726,131 Finance & Administration $5,355,203 Human Resources $1,270,651 Information Technology $2,360,916 Parks, Recreation & Culture $9,744,924 Planning & Code Administration $5,527,670 Police Department $9,950,720 Public Works $16,527,333
Operating Total $58,225,753
PROPOSED TRANSFERS
Transfer to Asset Replacement Funds $3,146,000 Transfer to Capital Improvement Funds $4,970,907 Transfer to Housing Program Fund $240,000 Transfer to Other Post Employment Benefit Trust $3,400,000 Transfer to Stormwater Fund $169,547
Total Transfers $11,926,454 Total Proposed Expenditures and Uses of Funds $70,152,207
OTHER REVENUES APPROPRIATED FOR Stormwater Fund $5,459,600 Housing Fund $353,129 Forest Conservation Fund $6,300
AND BE IT FURTHER ORDAINED that all of the sums set forth herein under the headings “PROPOSED EXPENDITURES”, “PROPOSED TRANSFERS” and “OTHER REVENUES APPROPRIATED FOR” be and hereby are appropriated. AND BE IT FURTHER ORDAINED that there is hereby levied on all of the assessable real property within the City an ad valorem tax at the rate of Twenty-six and Two/Tenths Cents ($.262) on each One Hundred Dollars ($100) of assessed value of said property, and there is hereby levied an ad valorem tax on the tangible personal property subject to taxation by the City, except for manufacturing equipment, manufacturing inventory and commercial inventory of corporate and unincorporated businesses, at the rate of Fifty-Three Cents ($.53) on each One Hundred Dollars ($100) of assessed value of such tangible personal property.
DocuSign Envelope ID: 966C85E3-9985-4D36-878E-8EB5F0B9F7A1
160

AND BE IT FURTHER ORDAINED that the City hereby adopts the imposition of a full year, one-half year, three-quarter year and one-quarter year tax levies authorized pursuant to Title 10, Sections 10-102, 10-103, 10-104 and 10-105, Tax Property Article, Annotated Code of Maryland, as amended, and authorizes and empowers Montgomery County, Maryland, to collect and remit the same to the City of Gaithersburg, consistent with the imposition and collection of such levies on real property by Montgomery County. ADOPTED by the City Council this 7th day of June, 2021.
____________________________________ JUD ASHMAN, MAYOR and President of the Council
DELIVERED to the Mayor of the City of Gaithersburg this 7th day of June, 2021. APPROVED by the Mayor of the City of Gaithersburg this 7th day of June, 2021.
____________________________________ JUD ASHMAN, MAYOR
THIS IS TO CERTIFY, that the foregoing Ordinance was adopted by the City Council of the City of Gaithersburg, in public meeting assembled on the 7th day of June, 2021; and that the same was APPROVED by the Mayor of the City of Gaithersburg on the 7th day of June, 2021. This Ordinance will become effective on the 1st day of July, 2021. ________________________________ Tanisha Briley, City Manager
DocuSign Envelope ID: 966C85E3-9985-4D36-878E-8EB5F0B9F7A1
161

About the Budget
Accounting Structure
FY22 Budget
Fund Structure
The accounts of the City are organized into funds, each of which is considered to be a separate accounting entity. The City operates the following funds for which information is included in the budget: General Fund – the primary operating fund of the City. It is used to account for all financial transactions and resources except those accounted for in another fund. Revenues are derived primarily from property and income taxes, State and Federal distributions, license and permit fees, charges for services and interest income. Stormwater Management Fund – a Special Revenue Fund, which accounts for payments received under the City’s expanded stormwater program fee. This revenue can only be used for capital or operating costs associated with cleaning and treating water runoff. This was a new fund beginning in FY16. Forest Conservation Fund – a Special Revenue Fund, which accounts for payments received under the City’s in-lieu fee for forestation. This revenue can only be used for afforestation or reforestation within the City and to further the City’s urban forestry goals. Housing Program Fund – a Special Revenue Fund, which accounts for funding that is dedicated or restricted for Housing Initiatives and the Gaithersburg Homebuyer Assistance Loan Program (GHALP). These programs are developed to aid in affordable housing efforts within the City. This was a new fund in FY18. Capital Improvements Plan (CIP) – is a group of capital projects funds, which account for resources that have been assigned for new capital purchases and large capital projects. These funds are comprised of: General capital projects; infrastructure; facilities; parks; technology; and art in public places. The City’s five-year CIP is used to account for financial resources to be used for the acquisition or construction of capital facilities. The CIP accounts for all current construction projects including improvements to roads and various other projects, while providing a blueprint for the next five fiscal years. Support for the CIP is made up of an operating transfer from the General Fund. The General Fund funds the entire CIP with an expectation that reimbursable State, County and Federal grant funds will be received in the fiscal year. Asset Replacement Fund – a Capital Projects Fund; this fund accounts for money set aside for the replacement of existing City equipment, vehicles and other assets. Revenues for this fund consist of a transfer from the General Fund. Expenditures include budgeted purchases for replacement assets. This was a new fund in FY17. The City also has a fund which is not included in the budget: Other Post-Employment Benefits (OPEB) Trust Fund – a fiduciary trust fund, which holds money that has been provided through an irrevocable pledge to pay for retiree costs other than pensions. The City offers health, dental and life insurance benefits for qualified retirees and disabled employees. In order to pay for these future benefits, the City has established an irrevocable trust. Although the fund is included on the City’s books, once money has been provided to the trust account they are no longer accessible to the City, instead being held on behalf of the retirees.
162

About the Budget
Accounting Structure
FY22 Budget
Basis of Budgeting
The General Fund, Stormwater Management Fund, Forest Conservation Fund, Housing Program Fund, Capital Improvements Plan, and Asset Replacement Fund are all considered to be governmental funds and follow the modified accrual basis of accounting. The modified accrual basis of accounting is unique to governments and can be thought of as a hybrid between cash basis and full accrual (corporate) accounting. This basis of accounting has a focus on current financial resources. Under the modified accrual basis of accounting, revenues are recognized to the extent that they are susceptible to accrual, meaning both measurable (you can determine the amount) and available (collectible within the budget year or within 60-90 days thereafter). Expenditures that are expected to be paid with resources on hand are recorded in the year under which the liability is incurred. Expenditures for long-term liabilities are only included under the modified accrual basis of accounting to the extent that they are expected to be paid in the near term. Proprietary funds follow the full accrual basis of accounting, where revenues and expenses are recognized as earned or incurred. The full accrual model is said to have a focus on economic resources, as opposed to just current financial resources as in governmental funds. This means that revenues and expenses are recognized when the underlying transaction occurs, regardless of when the cash is received or paid. The City of Gaithersburg does not have any proprietary funds. Fiduciary trust funds are used to account for resources that belong to parties outside the City, and for which the City is a steward of the resources. The City’s OPEB fund is a fiduciary trust fund which follows the accrual basis of accounting. Since these funds cannot be used for City operations, no budget is included for these funds. The City follows Generally Accepted Accounting Principles (GAAP) for budgeting with one exception. Open encumbrances at the end of the year are added to the subsequent years’ budgetary authority. Actual amounts are charged based on generally accepted accounting principles. The Mayor and City Council adopt an annual operating budget within the General Fund. Through the budget ordinance, money is appropriated to the Stormwater Management, Housing Program, Capital Improvements Plan, and Asset Replacement Funds. Revenues are appropriated to the Forest Conservation Fund through the City Code which established the Fund. Annual expenditure budgets are not adopted for these funds via the ordinance. The following page summarizes the revenues and expenditures for all funds for which the City prepares a budget, even though not all funds have expenditure budgets that are formally adopted.
163

About the BudgetCitywide Funds Summary
FY22 Budget
General StormwaterHousingProgram
ForestConservation CIP
AssetReplacement Total
Revenues and Sources of FundsLocal Taxes 31,769,200 - - - - - 31,769,200Licenses & Permits 4,337,730 - - - - - 4,337,730Grants 20,897,771 - 298,489 - 4,022,000 - 25,218,260Charges for Services 4,714,914 5,258,000 - - - - 9,972,914Fines & Forfeitures 2,020,000 - - - - - 2,020,000Miscellaneous Revenues 2,554,668 201,600 54,640 6,300 400,000 - 3,217,208
Total 66,294,283 5,459,600 353,129 6,300 4,422,000 76,535,312
Transfer-In 4,281,591 169,547 240,000 - 10,738,077 3,184,000 18,613,215Reappropriation - - - - - - -
Total Revenues and Sources of Funds 70,575,874 5,629,147 593,129 6,300 15,160,077 3,184,000 95,148,527
Expenditures and Uses of FundsPersonnel Services 41,551,163 987,185 - - - - 42,538,348Operating 16,066,090 1,639,151 2,888,489 47,505 1,957,000 - 22,598,235Contingency 500,000 - - - - - 500,000Capital 108,500 3,113,400 - - 22,138,763 2,590,906 27,951,569
Sub-Total 58,225,753 5,739,736 2,888,489 47,505 24,095,763 2,590,906 93,588,152Transfers
Transfer to Asset Replacement 3,146,000 38,000 - - - - 3,184,000Transfer to Capital Funds 4,970,907 3,547,170 - - - - 8,518,077Transfer to Housing 240,000 - - - - - 240,000Transfer to OPEB 3,400,000 - - - - - 3,400,000Transfer to Other Funds - 4,531,591 - - 6,942,000 - 11,223,591Transfer to Stormwater 169,547 - - - - - 169,547
Total Transfers 11,926,454 8,116,761 6,942,000 - 26,735,215
Total Expenditures and Uses of Funds 70,152,207 13,856,497 2,888,489 47,505 31,037,763 2,590,906 120,573,367
Net Change in Fund Balance 423,667 (8,227,350) (2,295,360) (41,205) (15,877,686) 593,094 (25,424,840)
Estimated Beginning Fund Balance 50,279,230 27,248,156 8,268,168 738,232 93,735,109 11,950,208 192,219,103
Projected Fund Balance 50,702,897 19,020,806 5,972,808 697,027 77,857,423 12,543,302 166,794,263
164

About the Budget
Accounting Structure
FY22 Budget
The All Funds Summary highlights the fact that many of the City’s funds are funded through transfers from the General Fund. However, the City’s Special Revenue Funds (Forest Conservation, Stormwater and Housing Funds) also receive funds directly. The following graphic represents the relationship between the City’s funds. The arrows represent how money flows into the City and whether money flows directly into the fund or comes from the General Fund. Most revenues are considered to be general revenues and are recorded in the General Fund. Distributions are made to the other funds in accordance with the budget. In FY22, two large one-time transfers from the Stormwater Fund will be made, to the General Fund and Capital Improvements Program. A smaller recurring transfer from the Stormwater Fund to the General Fund will continue to be made going forward.
165

About the Budget
Accounting Structure
FY22 Budget
Typically, the City uses funds in order to show compliance with restrictions on how certain revenues are spent or to separate activities, like capital and asset replacement from general operations for improved transparency. However, responsibility for administering different funds often crosses departmental lines. The chart below is designed to help show which funds are overseen by each department; the City Manager also oversees all departments and funds. The Stormwater Fund is the only fund besides the General Fund where salaries and benefits are charged.
Office of the City Manager
• Funds:
• General Fund• Housing Program Fund• CIP
Office of the City Attorney
• Funds:
• General Fund
Human Resources
• Funds:
• General Fund
Community and Public Relations
• Funds:
• General Fund• Asset Replacement
Finance and Administration
• Funds:
• General Fund• CIP
Information Technology
• Funds:
• General Fund• CIP
• Asset Replacement
Parks, Recreation and Culture
• Funds:
• General Fund• CIP
• Asset Replacement
Planning and Code Administration
• Funds:
• General Fund• CIP
• Forest Conservation
Gaithersburg Police Department
• Funds:
• General Fund• Asset Replacement
Public Works
• Funds:
• General Fund• Stormwater Management
• CIP
• Asset Replacement
• Forest Conservation
166

About the Budget
Accounting Structure
FY22 Budget
Accounting Policies
The policies enumerated below have been approved by the Mayor and City Council either within the City Code or through various resolutions. The FY22 Adopted Budget complies with all relevant long-term financial policies currently in place.
Balanced Budget Requirements
The City Manager, on such date as the Mayor and City Council shall determine, but at least sixty (60) days before the beginning of any fiscal year, shall submit a budget to the Council. The budget shall provide a complete financial plan for the budget year and shall contain estimates of anticipated revenues and proposed expenditures for the coming year. The total of the anticipated revenue shall equal or exceed the total of the proposed expenditures. The budget shall be a public record in the City office, open to public inspection by anyone during normal business hours. Re-appropriation of fund balance is considered to be a revenue for budgetary purposes.
Budget Transfers By resolution R-57-13, the Mayor and City Council authorized the City Manager to make budget transfers after May 31st of each year, so long as no one activity area is increased more than twenty-five (25) percent.
Budget Amendments Section 45 of the City Charter allows amendment of the City budget to include and permit use of excess funds. Amendment of the City budget requires passage of an ordinance through the City Council after a public hearing to allocate any additional funds that were unanticipated prior to the adoption of the City budget.
Investment Policy The State of Maryland allows municipalities to invest surplus funds in financial institutions within the State if the financial institution provides collateral with a market value that equals or exceeds the amount by which a deposit exceeds the deposit insurance. By resolution, the City Council has adopted an investment policy. The City’s investment strategy calls for an annual cash flow projection and investment in low risk securities such as US government bonds, US agencies securities and some short-term investments such as commercial paper and certificates of deposit. Due to the current economic conditions and low Treasury bill yields, the budget reflects a decrease in budgeted interest income.
Capital Asset Policy The City Council, by resolution, has adopted a Fixed Asset Policy. The policy requires all equipment, machinery, vehicles, land, buildings, infrastructure and improvements that cost $5,000 or more to be classified as a capital asset and reported in the government-wide financial statements.
167

About the Budget
Accounting Structure
FY22 Budget
Annual Audit
The City is required to have an annual audit performed by an independent Certified Public Accountant. It is performed in accordance with generally accepted auditing standards, which require that the audit be planned and performed to obtain reasonable assurance about whether the financial statements are free of material misstatements.
Accounting Practices The following are accounting practices that are typically used for budgetary decision making for both the operating budget and Capital Improvements Plan, but have not been formally adopted into a policy document. The policies are reviewed periodically as changes occur that require updating.
Capital Projects Fund Policy During deliberations and public hearings on the budget, the Capital Improvements Plan (CIP) process encourages citizen participation. As a guide, projects which meet the following criteria shall be included in the CIP: all construction and new infrastructure construction; major studies employing outside consultants relating to a potential CIP project; any equipment or furnishings or projects to furnish new buildings; and acquisition of land or buildings. Infrastructure is defined, for purposes of this policy, as street works including asphalt, concrete, sidewalks, curbs, gutters, stormwater management and streetlights. The CIP covers a five-year period and is revised annually in light of new and changing conditions. As revenue projections change in future years, the General Fund transfer to the CIP may be adjusted. The funding preference for City projects is pay-as-you-go. The City will leverage City funds with grants and private funds to the maximum extent possible.
Debt Policy
The City of Gaithersburg has no debt, and is a pay-as-you-go municipality; therefore, the City has not developed any formal debt policies, and has not applied to any credit rating agencies for a bond rating. Neither state law nor the City Charter mandates a limit on the amount of municipal debt that may be issued.
Fund Balance
While the City has not adopted an official fund balance policy, its stated goal is not to allow unassigned fund balance in the current fiscal year to drop below twenty five (25) percent of the three year average of General Fund expenditures. Fund balance represents the excess of assets minus liabilities. Fund balance is also often called the City’s reserves and can also be thought of as the cumulative balance of revenues exceeding expenditures. Unassigned fund balance is the remaining fund balance within the General Fund that does not have any claims or internal allocations on it.
168
Financial Overview
General Fund Summary
FY22 Budget
The budget summary on the following pages shows the General Fund revenues and expenditures by major category as well as the estimated total fund balance position for the City. Since the City has adopted a pay-as-you-go philosophy for capital projects, it is expected that the City will accumulate fund balance in some years in order to draw down those funds in years when there are substantial capital needs. The City has chosen to utilize some of the available unassigned fund balance to subsidize one-time projects in the capital budget. The FY22 Proposed Budget attempts to reduce the use of fund balance that will create a structural imbalance. An ongoing structural imbalance would mean that operating revenues are not sufficient to cover operating expenditures on an on-going basis, unless the reliance on fund balance is removed in future years. Over the next few budget cycles, the City plans to refine the projected long term capital needs and establish a fund balance policy which takes into account the City’s pay-as-you-go debt status. Both of these steps will help refine the City’s fund balance target in order to determine if the unassigned balances should be further reduced. Once that policy target has been established, the reliance on the use of re-appropriation for operating costs will be reevaluated.
169

Financial OverviewGeneral Fund Summary
FY22 Budget
FY20Actuals
FY21Projection
FY21AdoptedBudget
FY22AdoptedBudget Chg % Chg
Revenues and Sources of Funds
Local Taxes 32,478,832 31,714,550 32,198,200 31,769,200 (429,000) (1.3%)
Licenses & Permits 4,128,350 3,776,047 4,271,780 4,337,730 65,950 1.5%
Federal Grants 184,519 726,122 666,200 473,675 (192,525) (28.9%)
State Grants & Shared Taxes 2,763,221 4,813,918 4,547,053 4,919,053 372,000 8.2%
County Grants & Shared Taxes 14,518,693 15,698,034 14,713,900 15,505,043 791,143 5.4%
Charges for Services 4,542,944 3,221,924 4,821,926 4,714,914 (107,012) (2.2%)
Fines & Forfeitures 2,164,421 1,994,000 2,010,000 2,020,000 10,000 0.5%
Miscellaneous Revenues 5,429,496 4,443,311 3,484,372 2,554,668 (929,704) (26.7%)Total 66,210,475 66,387,906 66,713,431 66,294,283 (419,148) (0.6%)
Transfer-In - - - 4,281,591 4,281,591 0.0%
Reappropriation - - 2,637,106 - (2,637,106) (100.0%)
Total Revenues and Sources of Funds 66,210,475 66,387,906 69,350,537 70,575,874 1,225,337 1.8%Expenditures and Uses of Funds
Personnel Services 38,337,811 37,124,973 40,381,780 41,551,163 1,169,383 2.9%
Operating 12,455,978 13,532,423 15,359,910 16,066,090 706,180 4.6%
Capital 32,362 224,108 15,000 108,500 93,500 623.3%
Contingency - 500,000 500,000 500,000 - 0.0%Total 50,826,150 51,381,504 56,256,690 58,225,753 1,969,063 3.5%
Transfers
Transfer to Asset Replacement 2,488,000 2,319,300 2,319,300 3,146,000 826,700 35.6%
Transfer to Capital Funds 6,350,000 7,165,000 7,165,000 4,970,907 (2,194,093) (30.6%)
Transfer to Housing 240,000 240,000 240,000 240,000 - 0.0%
Transfer to OPEB 3,100,000 3,200,000 3,200,000 3,400,000 200,000 6.3%
Transfer to Stormwater 1,233,383 169,547 169,547 169,547 - 0.0%Total 13,411,383 13,093,847 13,093,847 11,926,454 (1,167,393) (8.9%)
Total Expenditures and Uses of Funds 64,237,533 64,475,351 69,350,537 70,152,207 801,670 1.2%
Revenues Over/(Under) Expenditures 1,972,942 1,912,555 - 423,667
Beginning Fund Balance 46,393,733 48,366,675 48,366,675 50,279,230
Reappropriation - - (2,637,106) -
Projected Fund Balance 48,366,675 50,279,230 45,729,569 50,702,897
170
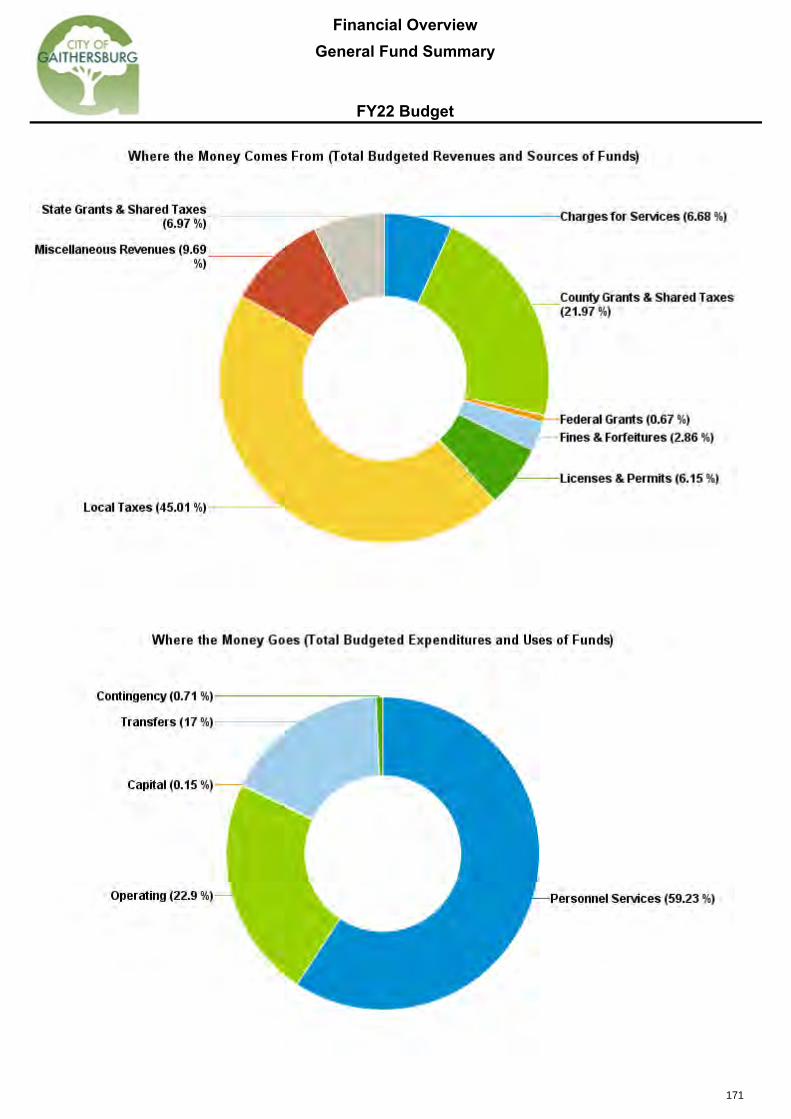
Financial OverviewGeneral Fund Summary
FY22 Budget
171

Financial Overview
General Fund Revenues
FY22 Budget
Revenue Descriptions
Real and Personal Property Taxes The State of Maryland completes property assessment of all property within the State on a three year basis. The City of Gaithersburg underwent a full assessment in FY21 and the next assessment cycle will be in FY24. The revised assessed values will be used for the FY22 property tax bills. Although the properties are assessed every three years, any increase in property value is spread over a three year period, e.g. property value with a full cash value going from $300,000 to $312,000 would be assessed at $304,000 in the first year, $308,000 the second year and $312,000 in the third year. Additionally, Montgomery County has approved a 10% cap on the total property value increase for any given year. As a result property assessments lag the full cash, or market value significantly. Property value decreases however, are reflected immediately when the assessment is changed. Real and Personal Property taxes are stated at 100% of the full assessed value. The City’s Real Property tax rate is $.262 per $100 of assessed value. The City’s Personal Property tax rate is $.53 per $100 of assessed value. In order to develop the FY22 budget for property taxes, the City obtained the updated assessed values for FY22 for all City properties. Using these revised assessed values, the City applied the property tax rates identified above to develop the FY22 revenue budget, and applied a slight discount to the amount estimated by the State. Real and Personal Property Taxes plus penalties and interest ($30,769,200) make up approximately 43.60% of the budgeted City revenue.
Income Tax Article 10-106 of the Annotated Code of Maryland provides that each County shall set, by ordinance or resolution, a county income tax equal to at least 1.0% but not more than 3.2%, to be applied in addition to the State income tax. The City of Gaithersburg, an incorporated municipality within Montgomery County, receives State income taxes based on the County’s 56% “piggyback” tax rate applied to the State income tax rate of 5.75%. The City’s receipts are determined according to State administered formulas based on the amount of income tax paid by City residents. During FY22, the City will receive income tax distributions that represent adjustments to: tax returns related to calendar year 2020, tax collections related to income earned in calendar year 2021, and estimated tax payments made in calendar year 2022. The City receives payments from the State during ten months of the year. In determining the FY22 budget for income tax, the City used the year-to-date collections for calendar years 2018 – 2020 to understand tax payment patterns and estimate the percentage of the total collections that are received during each payment. Based on these historical collection percentages, the City estimates remaining collections for the current year. The FY22 budget was developed after determining the FY21 Estimate based on current year collections and assuming that income tax collections would likely be flat year over year. Income taxes ($14,000,000) make up approximately 19.83% of the budgeted City revenue. Income tax is included within the Intergovernmental Revenues category.
172

Financial Overview
General Fund Revenues
FY22 Budget
Hotel / Motel Tax
Hotel / motel taxes have been established by the Mayor and City Council on the gross receipts of room rentals. Owners of the businesses are required to file a return and pay the tax on a monthly basis. The tax of 2% is based solely on overnight room rentals. The City has eleven (11) hotels/motels within the City limits that collect these taxes and remit the funds monthly. The budget for this revenue was developed based on the current year projected revenues. The projected revenues were calculated using individual hotel/motel receipts through December, and assumed that revenues would return to approximately 50% of the prior 3 year average, based on normal convention and tourism activity returning in calendar year 2022.
Hotel / motel taxes ($500,000) make up approximately 0.71% of the budgeted City revenue. Hotel / motel tax is included within the Local Taxes category.
Admissions and Amusements Tax
Admissions and amusement taxes are State administered local taxes on the gross receipts of various categories of amusement, recreation and sports activities. Businesses are required to file a return and pay the tax monthly, while the City receives quarterly distributions of the receipts from the State. Admissions and Amusement rates on the majority of categories are 10%. Those categories subject to State sales and use tax remain at 5%. The budget for this revenue was determined by reviewing collections after the closure of most facilities due to the COVID-19 pandemic, and assumes that activity at these facilities will gradually resume during FY22 with an estimate of approximately 44% of the FY19 revenue.
Admissions and amusements taxes ($500,000) make up approximately 0.71% of the budgeted City revenue. Admissions and amusement tax is included within the Local Taxes category.
Licenses & Permits
Licenses & permits include building, electrical, rental housing, fire protection, and cable television.
Cable TV franchise revenue is based on a negotiated percent (5%) of the cable provider’s annual subscription revenue generated by households within the City. The City’s share of this revenue is proposed to generate $950,000; permits issued for building construction is $1,500,000; rental housing licenses (fees paid by landlords for each rental housing unit) is $808,980; revenue from electrical permits is $160,000. The budget for these accounts was developed based on review of prior years’ collections. The building permit and related permit revenues were increased from the FY21 budget based on current license and permitting activity provided by the Planning and Code Administration Department.
Total of licenses & permits ($4,337,730) make up approximately 6.15% of the budgeted City revenue.
Intergovernmental Revenue
Intergovernmental revenue consists of receipts from the Federal, State or County governments. The majority of these receipts come from the State based on particular formulas set in law. The total estimate for intergovernmental revenue excluding $14.0 million of income tax is $6.9 million, with the largest sources being:
- State Highway User Tax ($1,682,053), which is derived from the State Motor Fuels Tax and disbursed to the City based on street miles and number of registered vehicles within the City;
- Recurring Montgomery County Revenue Sharing ($1,390,490), which is designed to share some of the savings the County has due to City maintenance of certain streets and public Right-of-Ways;
- State of Maryland Open Space Grant ($1,572,000), which is related to the construction of Pleasant View Park and Robertson Park Turf Field;
- State Police Aid ($900,000), which is based on the total number of sworn officers employed by the City; and- State bond bills ($700,000) for Pleasant View Park and pedestrian bridge projects.
Intergovernmental revenue ($6,897,771) makes up approximately 9.77% of the budgeted City revenue.
173

Financial Overview
General Fund Revenues
FY22 Budget
Service Charges
Service charges come primarily from fees imposed on the recipients of certain City services. The City’s largest fees include recycling ($1,802,775), recreation programs, classes, youth services and summer camps ($948,694), and winter lights revenues ($422,937). Revenues for service charges are based on the estimates provided by program managers in the Department of Parks & Recreation, primarily using historical averages with consideration for the current capacity constraints due to the COVID-19 pandemic, and assumes activities in FY22 will be operating with continually expanding capacities.
Service charges within the General Fund ($4,714,914) make up approximately 6.68% of the budgeted City revenue.
Fines and Forfeitures
Revenues from fines and forfeitures primarily result from speed radar fines, parking fines and City ordinance violations.
In FY08, the City implemented the state law allowing for speed radar set up within the municipal boundaries. FY22 revenue is budgeted for $1,810,000, which is an increase from the prior year budget. This revenue budget was developed based on historical declines in speed radar revenue but accounts for an increase relative to FY21 due to a higher FY22 estimate as economic activity and travel begin to resume during the COVID-19 pandemic.
All fines and forfeitures ($2,020,000) make up approximately 2.86% of the budgeted City revenue.
Other Miscellaneous
The City receives miscellaneous revenue from other non-recurring sources, the single largest of which is typically interest earnings. The budget for interest earnings is based on an estimated investment portfolio with both a managed component and utilizing the State investment pool. Budgeted returns range from 10 basis points (0.1%) for fully liquid cash funds to 0.8% for the longer term portfolio. Eighty two percent of the return is budgeted to be allocated to the General Fund as the rest goes to the Stormwater Fund, Housing Fund, or Forest Conservation Fund. Accounting regulations require that all investments be reported at market value during the year, which can create unrealized gains or losses. We expect minimal impact from unrealized gains or losses as the City is expecting the Federal Reserve to leave interest rates low.
Other miscellaneous ($2,554,668) makes up approximately 3.62% of the budgeted City revenue.
Fund Transfers
For FY22, the City’s General Fund will receive a one-time transfer from the Stormwater Fund to reimburse the City for prior years’ subsidies ($4,119,436), and will institute an annual transfer to cover the administrative cost of the Stormwater Fund ($162,155).
Fund Transfers ($4,281,591) makes up 6.07% of the budgeted City revenues.
The next few pages detail the revenues for the General Fund.
174

General Fund RevenuesRevenues by Object
FY22 Budget
AccountFY20
ActualsFY21
Projection
FY21AdoptedBudget
FY22AdoptedBudget Chg % Chg
Local Taxes
410000 - Real Estate Taxes - Current 28,762,849 29,600,000 29,000,000 29,400,000 400,000 1.4%
410100 - Real Estate Taxes - Prior Years (215,659) (50,000) (250,000) (250,000) - 0.0%
411000 - Corporate Personal PropertyTax - Current 1,021,023 1,000,000 850,000 1,000,000 150,000 17.6%
411100 - Corporate Personal PropertyTax - Prior Years 89,817 186,699 85,000 85,000 - 0.0%
412000 - Personal Property Tax - Current 17,545 19,400 20,000 19,000 (1,000) (5.0%)
412100 - Personal Property Tax - PriorYears 192 200 200 200 - 0.0%
413000 - Public Utilities PPT - Current 471,327 471,000 434,000 471,000 37,000 8.5%
413100 - Public Utilities PPT - PriorYears - 151 - - - 0.0%
414000 - Hotel & Motel Tax 808,160 300,000 770,000 500,000 (270,000) (35.1%)
418300 - Admissions & Amusements Tax 1,476,020 130,000 1,250,000 500,000 (750,000) (60.0%)
419000 - Local Tax - Penalties & Interest 35,156 28,600 28,000 32,000 4,000 14.3%
419100 - Penalties & Interest - PriorYears 12,402 28,500 11,000 12,000 1,000 9.1%
Total Local Taxes 32,478,832 31,714,550 32,198,200 31,769,200 (429,000) (1.3%)Licenses & Permits
420070 - Public Improvement StreetPermits 57,861 22,730 22,000 25,000 3,000 13.6%
420090 - Amusements Licenses 35,250 - 38,850 27,000 (11,850) (30.5%)
420100 - Traders Licenses 18,386 133,000 127,000 126,000 (1,000) (0.8%)
420130 - Hawkers/Peddlers Licenses 5,050 10,750 3,250 4,000 750 23.1%
420150 - Electricians Licenses 56,175 28,525 50,000 40,000 (10,000) (20.0%)
420170 - Rental Housing Licenses 653,328 712,120 847,530 808,980 (38,550) (4.5%)
420185 - Bus Shelter Franchise Fees 9,736 - 10,000 5,000 (5,000) (50.0%)
420190 - Cable TV Franchise Fees 975,243 980,000 980,000 950,000 (30,000) (3.1%)
420210 - Animal Licenses 21,360 26,000 30,000 30,000 - 0.0%
420220 - Pet Shop Commercial Kennel 250 750 750 750 - 0.0%
420230 - Building Permits 1,406,608 953,910 1,440,000 1,500,000 60,000 4.2%
420231 - Deck Permits 7,775 20,155 3,000 4,500 1,500 50.0%
420232 - Fence Permits 3,105 7,267 2,600 2,600 - 0.0%
420233 - Fuel Tank Permits 700 1,500 1,600 1,600 - 0.0%
420234 - Swimming Pool Permits 3,585 3,594 2,000 2,000 - 0.0%
175

General Fund RevenuesRevenues by Object
FY22 Budget
AccountFY20
ActualsFY21
Projection
FY21AdoptedBudget
FY22AdoptedBudget Chg % Chg
420235 - Tent Permits 3,150 282 3,000 3,000 - 0.0%
420236 - Trailers Permits 1,850 2,150 1,000 1,600 600 60.0%
420250 - Electrical Permits 182,783 164,770 144,000 160,000 16,000 11.1%
420270 - Utility Permits 6,342 5,934 3,000 5,500 2,500 83.3%
420290 - Occupancy Permits 87,350 48,900 41,000 71,000 30,000 73.2%
420300 - Home Occupation Licenses 150 160 200 200 - 0.0%
420310 - Sign Permits 22,181 18,338 17,000 18,000 1,000 5.9%
420320 - Fire Protection Permits 194,844 173,506 144,000 144,000 - 0.0%
420330 - Mechanical Permits 136,772 130,006 144,000 150,000 6,000 4.2%
420340 - Special Events Permits 8,205 - 11,000 5,000 (6,000) (54.5%)
420350 - Grading Permits 23,383 32,991 20,000 50,000 30,000 150.0%
420360 - Fire Protection SystemsPermits 42,240 36,555 40,000 35,000 (5,000) (12.5%)
420370 - On-Site Improvements 39,057 208,154 75,000 75,000 - 0.0%
420380 - Stormwater ManagementPermits 78,513 12,000 20,000 50,000 30,000 150.0%
464250 - CATV - Capital Equipment &PEG 47,117 42,000 50,000 42,000 (8,000) (16.0%)
Total Licenses & Permits 4,128,350 3,776,047 4,271,780 4,337,730 65,950 1.5%Federal Grants
431100 - Federal Grant - Miscellaneous 15,859 11,000 32,000 16,000 (16,000) (50.0%)
431500 - Federal Grant - FEMA - 96,872 - - - 0.0%
432100 - Federal Grant - PoliceEquipment 4,479 10,300 10,300 6,000 (4,300) (41.7%)
432400 - Federal Grant - DHS 7,500 7,950 6,000 7,950 1,950 32.5%
433100 - Federal Grant - CDBG 156,680 600,000 617,900 443,725 (174,175) (28.2%)
Total Federal Grants 184,519 726,122 666,200 473,675 (192,525) (28.9%)State Grants & Shared Taxes
434000 - State Grant - Open Space 535,000 335,000 800,000 1,572,000 772,000 96.5%
434100 - State Grant - Miscellaneous 1,764 2,000,000 900,000 - (900,000) (100.0%)
434200 - State Grant - Police 642,688 700,000 900,000 900,000 - 0.0%
434300 - State Grant - Arts 113,193 96,865 65,000 65,000 - 0.0%
434940 - State Grant - Bond Bill(s) - - 200,000 700,000 500,000 250.0%
435900 - State Revenue Sharing -Highway User 1,470,576 1,682,053 1,682,053 1,682,053 - 0.0%
Total State Grants & Shared Taxes 2,763,221 4,813,918 4,547,053 4,919,053 372,000 8.2%
176

General Fund RevenuesRevenues by Object
FY22 Budget
AccountFY20
ActualsFY21
Projection
FY21AdoptedBudget
FY22AdoptedBudget Chg % Chg
County Grants & Shared Taxes
437110 - County Grant - HomelessPrograms 40,450 37,423 36,333 36,333 - 0.0%
437130 - County Grant - NutritionProgram 38,206 - 55,000 33,575 (21,425) (39.0%)
437150 - County Grant - Miscellaneous 924 411,599 - - - 0.0%
437165 - County Grant - SupportiveHousing Asst. 37,423 39,800 36,000 42,000 6,000 16.7%
437970 - County Grant - FinancialCorporation 2,645 2,645 - 2,645 2,645 100.0%
438100 - County Rev. Sharing - IncomeTax 13,192,477 14,000,000 13,380,000 14,000,000 620,000 4.6%
438700 - County Rev. Sharing -Duplicate Services 1,206,567 1,206,567 1,206,567 1,390,490 183,923 15.2%
Total County Grants & Shared Taxes 14,518,693 15,698,034 14,713,900 15,505,043 791,143 5.4%Charges for Services
441100 - Automation Fees 216,271 162,905 110,000 200,000 90,000 81.8%
441300 - Zoning/Subdivision Fees 108,531 131,834 131,834 115,000 (16,834) (12.8%)
447150 - Recreation Programs - Sports 308,635 189,853 377,147 464,899 87,752 23.3%
447160 - Recreation Programs -Recreation Classes 127,404 40,813 200,450 150,000 (50,450) (25.2%)
447170 - Recreation Programs - YouthServices 31,584 69,315 35,280 39,374 4,094 11.6%
447180 - Recreation Programs - SummerCamps 375,614 68,828 244,973 294,421 49,448 20.2%
447200 - Casey Community CenterRentals 161,558 4,445 200,000 146,000 (54,000) (27.0%)
447220 - Water Park 393,822 29,665 350,000 200,000 (150,000) (42.9%)
447240 - Kentlands 89,060 7,315 125,530 90,000 (35,530) (28.3%)
447260 - Special Events 58,913 15,000 87,000 99,975 12,975 14.9%
447270 - Aquatic Facility - Indoor 146,420 18,311 164,085 120,000 (44,085) (26.9%)
447280 - Skate Park 13,265 15,080 7,070 14,068 6,998 99.0%
447290 - Group Picnics 39,625 14,000 40,242 50,000 9,758 24.2%
447300 - Winter Lights 422,937 598,211 367,000 422,937 55,937 15.2%
447320 - Miniature Golf Revenue 68,089 70,000 96,000 79,000 (17,000) (17.7%)
447330 - G'burg Youth Center in OldeTowne 13,612 1,940 17,000 9,110 (7,890) (46.4%)
447340 - Activity Center 172,840 13,100 194,803 140,000 (54,803) (28.1%)
177

General Fund RevenuesRevenues by Object
FY22 Budget
AccountFY20
ActualsFY21
Projection
FY21AdoptedBudget
FY22AdoptedBudget Chg % Chg
447380 - Arts Barn Programs 95,013 8,049 102,250 64,600 (37,650) (36.8%)
447390 - Arts Barn Admissions 82,858 10,680 107,250 78,400 (28,850) (26.9%)
447410 - Gaithersburg Youth Center atRobertson Park 6,261 - 2,940 2,635 (305) (10.4%)
447550 - Community Museum Revenue 8,533 2,711 12,800 8,000 (4,800) (37.5%)
447800 - Membership Fee - DogExercise 780 660 1,800 1,600 (200) (11.1%)
448250 - Benjamin Gaither Ctr Programs 125,041 26,287 122,000 112,000 (10,000) (8.2%)
449150 - Environmental Fees 3,985 6,000 4,000 5,000 1,000 25.0%
449200 - Stormwater MGMT PlanReview Fees 55,187 - - - - 0.0%
449240 - Recycling Collections 1,412,712 1,714,152 1,714,152 1,802,775 88,623 5.2%
449600 - Bike Locker Rental 35 35 35 35 - 0.0%
449700 - Fingerprinting Services 102 - - - - 0.0%
449800 - Parking Garage Fees - 35 35 35 - 0.0%
449810 - Charging Station Fees 1,699 1,350 1,700 1,700 - 0.0%
451320 - Returned Check Fees 490 350 350 350 - 0.0%
463200 - Processing Fees (PR&C) 2,069 1,000 4,200 3,000 (1,200) (28.6%)
Total Charges for Services 4,542,944 3,221,924 4,821,926 4,714,914 (107,012) (2.2%)Fines & Forfeitures
451300 - Ordinance Fines 14,775 12,000 20,000 20,000 - 0.0%
451310 - Police Tickets & Fines 184,348 122,000 230,000 180,000 (50,000) (21.7%)
451350 - Photo Radar 1,948,260 1,850,000 1,750,000 1,810,000 60,000 3.4%
451420 - Police Seizure 17,038 10,000 10,000 10,000 - 0.0%
Total Fines & Forfeitures 2,164,421 1,994,000 2,010,000 2,020,000 10,000 0.5%Miscellaneous Revenues
460110 - Sale of Recyclable Materials 2,998 4,400 4,000 4,400 400 10.0%
461100 - Interest Earnings 1,765,352 815,000 1,801,000 1,026,900 (774,100) (43.0%)
461101 - Change In Unrealized Gain/Loss 2,028,917 - - - - 0.0%
462010 - Property Rent - Residential 500 - - - - 0.0%
462030 - Property Rent -Telecommunications 83,567 86,071 86,000 88,578 2,578 3.0%
462040 - Property Rent - Commercial 16,443 1,530 18,312 9,150 (9,162) (50.0%)
462110 - Rent - Wells/Robertson 25,098 17,000 25,500 18,500 (7,000) (27.5%)
462120 - Rent - 50 DeSellum 17,150 18,120 18,960 19,140 180 0.9%
178

General Fund RevenuesRevenues by Object
FY22 Budget
AccountFY20
ActualsFY21
Projection
FY21AdoptedBudget
FY22AdoptedBudget Chg % Chg
463210 - Naming Rights - 15,000 15,000 15,000 - 0.0%
464100 - Contributions 23,645 - 5,500 3,000 (2,500) (45.5%)
464150 - Contributions - CS 47,800 122,065 80,000 18,000 (62,000) (77.5%)
464170 - Contributions - CC Scholarship 2,594 75 2,000 2,000 - 0.0%
464190 - Contributions - PR&C 16,665 8,550 27,600 8,000 (19,600) (71.0%)
464210 - Contributions - Arts - 15,524 35,000 41,000 6,000 17.1%
464230 - Contributions - Gertrude Ager 1,541 201 3,500 1,000 (2,500) (71.4%)
464240 - Holiday Giving 23,436 53,765 25,000 30,000 5,000 20.0%
465100 - Expenditure Reimbursement 16,244 123,750 10,000 10,000 - 0.0%
465200 - Prior Year ExpenditureReimbursement 5,139 5,000 5,000 5,000 - 0.0%
467200 - Miscellaneous 974,765 2,768,771 915,000 915,000 - 0.0%
467210 - Cash Over/Short 472 - - - - 0.0%
467230 - Miscellaneous - VendingMachines 22,275 6,000 17,000 10,000 (7,000) (41.2%)
467250 - Passports 39,095 20,755 60,000 25,000 (35,000) (58.3%)
467350 - Self Insurance Reimbursement 11,803 6,734 - - - 0.0%
467360 - ICMA Miscellaneous 193,413 180,000 180,000 180,000 - 0.0%
481100 - Sale of General Fixed Assets 110,585 175,000 150,000 125,000 (25,000) (16.7%)
Total Miscellaneous Revenues 5,429,496 4,443,311 3,484,372 2,554,668 (929,704) (26.7%)
Total Revenue 66,210,475 66,387,906 66,713,431 66,294,283 (419,148) (0.6%)
481200 - Reappropriation - - 2,637,106 - (2,637,106) (100.0%)
499200 - Transfer In - - - 4,281,591 4,281,591 0.0%
Total 66,210,475 66,387,906 69,350,537 70,575,874 1,225,337 1.8%
179

Financial Overview
General Fund Expenditures
FY22 Budget
The preceding pages focused on the General Fund’s revenue streams and categorized revenues by their source, or where they came from. The City’s expenditures are often viewed in many different categories to help understand the overall operations. Some of the ways this budget categorizes expenditures are:
By department – this groups expenditures under the operating department that is responsible for monitoring and developing the budget. This is similar to how the rest of the document is organized. Departments are further broken down by activity.
By function – this groups activities into broader categories, such as general government; public safety; public works; parks, recreation and culture; community services and development; miscellaneous; and transfers. These categories do not always correspond to the operating departments. These are the categories that are shown on the budget ordinance, which adopts the budget.
By object – this groups expenditures by the type of account or type of purchase. The pages that follow show General Fund expenditures in each of the categories identified above.
180

General Fund ExpendituresExpenditures by Department
FY22 Budget
DepartmentFY20
ActualsFY21
Projection
FY21AdoptedBudget
FY22AdoptedBudget Chg % Chg
City Manager's Offices 2,139,960 2,545,542 2,671,517 2,653,448 (18,069) -0.7%
Community & Public Relations 3,406,659 3,630,746 3,599,486 3,726,131 126,645 3.5%
Finance & Administration 17,867,190 18,155,457 18,604,746 17,281,657 (1,323,089) -7.1%
Human Resources 1,200,622 1,191,237 1,235,488 1,270,651 35,163 2.8%
Information Technology 2,135,968 2,279,738 2,279,694 2,360,916 81,222 3.6%
Office of the City Attorney 819,475 807,724 780,605 1,108,757 328,152 42.0%
Parks, Recreation & Culture 8,033,874 6,320,777 9,605,818 9,744,924 139,106 1.4%
Planning & Code Administration 5,220,060 5,311,905 5,567,378 5,527,670 (39,708) -0.7%
Police Department 9,715,040 9,652,203 9,710,447 9,950,720 240,273 2.5%
Public Works 13,698,687 14,580,022 15,295,358 16,527,333 1,231,975 8.1%
Total 64,237,533 64,475,351 69,350,537 70,152,207 801,670 1.2%
181

Financial OverviewGeneral Fund Expenditures - By Function and
ActivityFY22 Budget
Function/ActivityFY20
ActualsFY21
Projection
FY21AdoptedBudget
FY22AdoptedBudget Chg %Chg
General Government
Mayor & City Council 403,116 465,155 493,020 502,902 9,882 2.0%
Legal Services 765,529 807,724 775,605 956,122 180,517 23.3%
Registration & Elections 53,945 - 5,000 152,635 147,635 2,952.7%
Office of the City Manager 990,501 815,565 825,796 1,000,613 174,817 21.2%
Economic & Business Development 461,534 476,124 519,794 536,096 16,302 3.1%
City Sustainability Program 91,388 120,321 132,334 136,562 4,228 3.2%
Human Resources 1,200,622 1,191,237 1,235,488 1,270,651 35,163 2.8%
Finance & Administration 1,508,730 1,486,957 1,679,537 1,690,418 10,881 0.6%
Housing & Community Development 284,809 788,698 832,907 613,837 (219,070) (26.3%)
Information Technology 1,809,421 1,940,210 1,933,582 2,043,467 109,885 5.7%
Geographic Information Systems 326,546 339,528 346,112 317,449 (28,663) (8.3%)
General Services 43,700 47,556 61,356 55,381 (5,975) (9.7%)
Facilities Management 1,738,121 1,776,066 1,858,795 2,044,526 185,731 10.0%
Building & Grounds - City Hall 132,934 140,260 157,379 177,135 19,756 12.6%
Building & Grounds - 14 Faulks Corner 80,232 55,198 67,037 91,824 24,787 37.0%
Building & Grounds - Public Works 202,939 184,462 200,663 203,961 3,298 1.6%
Building & Grounds - Train Station/Freight House 26,008 28,666 35,041 36,877 1,836 5.2%
Building & Grounds - Kentlands Mansion 45,671 51,476 66,710 90,163 23,454 35.2%
Building & Grounds - Benjamin GaitherCenter 64,453 60,681 94,787 90,884 (3,903) (4.1%)
Building & Grounds - Casey CommunityCenter 130,784 120,711 164,422 184,526 20,104 12.2%
Building & Grounds - Olde TownePavilion 2,389 4,378 5,477 5,721 244 4.5%
Building & Grounds - 16 South SummitAvenue 46,573 22,400 54,146 208,713 154,567 285.5%
Building & Grounds - GaithersburgAquatic Center 11,677 33,593 19,491 24,865 5,374 27.6%
Building & Grounds - Activity Center 262,056 233,601 279,628 274,860 (4,768) (1.7%)
Building & Grounds - Gaithersburg ArtsBarn 49,980 69,425 82,250 79,389 (2,861) (3.5%)
Building & Grounds - Water Park 72,123 123,940 124,683 123,588 (1,095) (0.9%)
Building & Grounds - Miniature Golf 12,297 15,169 16,169 16,862 693 4.3%
Building & Grounds - Skate Park 1,669 5,828 8,479 9,321 842 9.9%
182

Financial OverviewGeneral Fund Expenditures - By Function and
ActivityFY22 Budget
Function/ActivityFY20
ActualsFY21
Projection
FY21AdoptedBudget
FY22AdoptedBudget Chg %Chg
General Government
Building & Grounds - Olde Towne YouthCenter 52,790 38,348 42,470 39,685 (2,785) (6.6%)
Building & Grounds - Robertson ParkYouth Center 53,674 48,149 55,951 52,505 (3,446) (6.2%)
Building & Grounds - GaithersburgCPSC Park Site 12,378 12,058 15,640 4,000 (11,640) (74.4%)
Building & Grounds - Parking Facility 70,883 82,613 112,349 528,947 416,598 370.8%
Building & Grounds - Homeless Services 35,670 37,379 45,249 42,960 (2,289) (5.1%)
Planning & Code Administration 907,064 936,692 900,823 945,109 44,286 4.9%
Planning 1,060,787 1,107,842 1,222,045 1,214,751 (7,294) (0.6%)
Neighborhood Services 1,183,506 1,183,255 1,235,670 1,201,559 (34,111) (2.8%)
Public Information 973,566 1,008,022 998,658 1,026,503 27,845 2.8%
Gaithersburg Television 302,628 305,676 303,944 323,587 19,643 6.5%
Total 15,472,695 16,164,963 17,008,486 18,318,954 1,310,468 7.7%
Public Safety
Permits & Inspections 1,700,161 1,739,670 1,790,821 1,723,765 (67,056) (3.7%)
Animal Control 368,542 344,446 418,019 442,486 24,467 5.9%
Police Department 9,715,040 9,652,203 9,710,447 9,950,720 240,273 2.5%
Traffic Control 273,833 314,341 327,661 402,605 74,944 22.9%
Total 12,057,575 12,050,660 12,246,948 12,519,576 272,628 2.2%
Public Works
Public Works Administration 822,814 657,568 815,111 933,679 118,568 14.5%
Streets & Special Projects 776,762 955,252 1,095,314 1,130,472 35,158 3.2%
Fleet Maintenance 657,651 643,202 675,137 663,178 (11,959) (1.8%)
Landscaping & Forestry 1,099,005 968,375 1,226,890 1,245,052 18,162 1.5%
Environmental Services Operations 546 1,500 6,450 6,450 - 0.0%
Municipal Parks Maintenance 1,986,473 2,095,867 2,068,107 2,107,483 39,376 1.9%
Mowing & Bulk Pick-Up 2,126,573 2,384,775 2,215,924 2,286,949 71,025 3.2%
Recycling 1,317,900 1,605,369 1,544,894 1,629,458 84,564 5.5%
Engineering Services 774,137 984,051 975,722 949,133 (26,589) (2.7%)
Street Lighting 666,303 705,000 705,000 705,000 - 0.0%
Total 10,228,164 11,000,959 11,328,549 11,656,854 328,305 2.9%
Parks, Recreation & Culture
183

Financial OverviewGeneral Fund Expenditures - By Function and
ActivityFY22 Budget
Function/ActivityFY20
ActualsFY21
Projection
FY21AdoptedBudget
FY22AdoptedBudget Chg %Chg
Parks, Recreation & Culture
Parks, Recreation & CultureAdministration 935,638 752,886 893,191 1,306,244 413,053 46.2%
Recreation Programs and Sports 826,006 560,921 922,097 861,903 (60,194) (6.5%)
Recreation Classes 249,580 118,330 289,579 255,352 (34,227) (11.8%)
Youth Services 326,781 335,294 401,231 552,377 151,146 37.7%
Summer Programs 441,221 228,689 678,381 542,663 (135,718) (20.0%)
Gaithersburg Youth Center at RobertsonPark 244,854 212,163 264,544 298,181 33,637 12.7%
Skate Park 21,813 41,479 44,117 45,222 1,105 2.5%
Casey Community Center 342,975 205,303 403,082 405,310 2,228 0.6%
Water Park 536,687 706,085 900,784 796,257 (104,527) (11.6%)
Gaithersburg Arts Barn 382,993 291,732 507,187 474,088 (33,099) (6.5%)
Gaithersburg Youth Center at OldeTowne 264,473 102,504 338,289 256,360 (81,929) (24.2%)
Activity Center 507,773 415,631 560,114 571,637 11,523 2.1%
Gaithersburg Aquatic Center 290,357 251,997 346,547 362,505 15,958 4.6%
Miniature Golf Course 98,927 93,378 105,900 108,018 2,118 2.0%
Picnic Pavilions 18,254 5,140 26,139 27,677 1,538 5.9%
Winter Lights 194,696 195,245 231,544 256,875 25,331 10.9%
Special Events 1,048,071 928,673 1,231,726 1,180,227 (51,499) (4.2%)
Museums 206,610 200,690 237,685 263,416 25,731 10.8%
Kentlands Mansion 368,617 270,115 398,877 427,814 28,937 7.3%
Total 7,306,326 5,916,255 8,781,014 8,992,126 211,112 2.4%
Other Governmental
Non-Departmental 2,903,377 3,527,097 3,770,006 3,609,404 (160,602) (4.3%)
Total 2,903,377 3,527,097 3,770,006 3,609,404 (160,602) (4.3%)
Community Services & Development
Community Services 1,593,014 1,823,525 1,767,348 1,785,815 18,467 1.0%
Homeless Services 537,452 493,523 529,535 590,226 60,691 11.5%
Benjamin Gaither Center (SeniorsProgram) 727,548 404,522 824,804 752,798 (72,006) (8.7%)
Total 2,858,013 2,721,570 3,121,687 3,128,839 7,152 0.2%
Total General Fund 50,826,150 51,381,504 56,256,690 58,225,753 1,969,063 3.5%
184
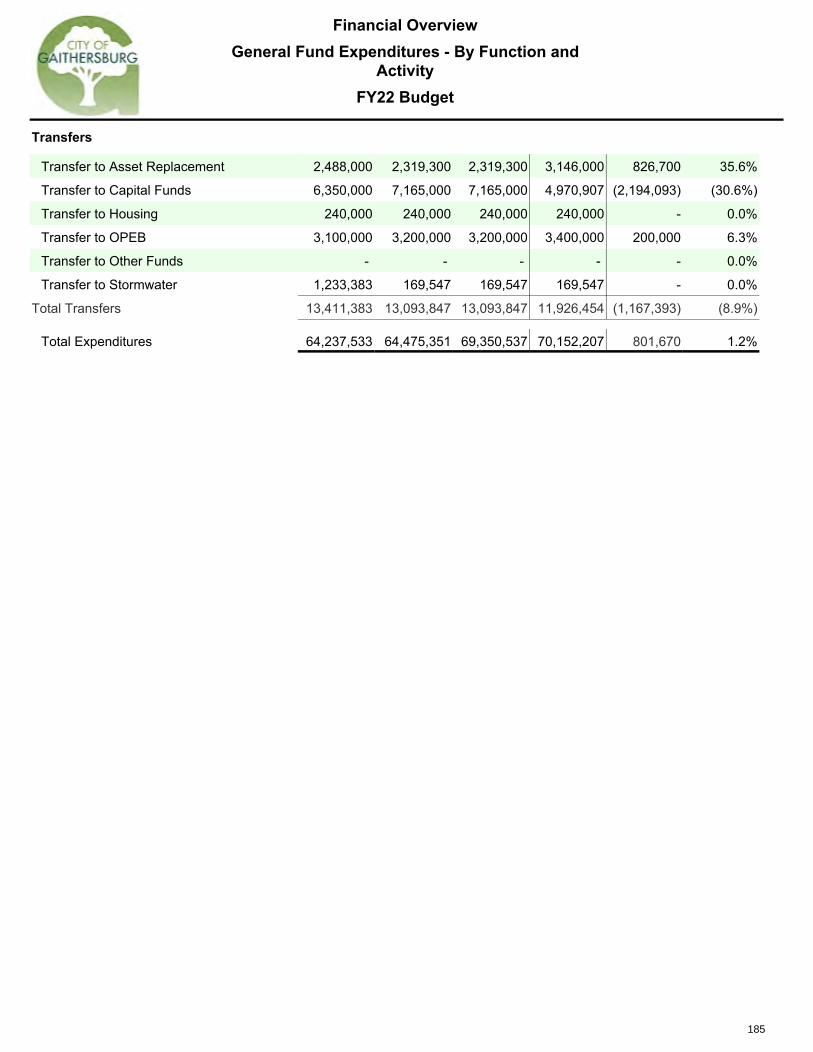
Financial OverviewGeneral Fund Expenditures - By Function and
ActivityFY22 Budget
Transfers
Transfer to Asset Replacement 2,488,000 2,319,300 2,319,300 3,146,000 826,700 35.6%
Transfer to Capital Funds 6,350,000 7,165,000 7,165,000 4,970,907 (2,194,093) (30.6%)
Transfer to Housing 240,000 240,000 240,000 240,000 - 0.0%
Transfer to OPEB 3,100,000 3,200,000 3,200,000 3,400,000 200,000 6.3%
Transfer to Other Funds - - - - - 0.0%
Transfer to Stormwater 1,233,383 169,547 169,547 169,547 - 0.0%
Total Transfers 13,411,383 13,093,847 13,093,847 11,926,454 (1,167,393) (8.9%)
Total Expenditures 64,237,533 64,475,351 69,350,537 70,152,207 801,670 1.2%
185

Financial OverviewGeneral Fund Expenditures - by Object
FY22 Budget
FY20Actuals
FY21Projection
FY21AdoptedBudget
FY22AdoptedBudget Chg % Chg
By Object Summary
Personnel Services 38,337,811 37,124,973 40,381,780 41,551,163 1,169,383 2.9%
Operating 12,455,978 13,532,423 15,359,910 16,066,090 706,180 4.6%
Capital 32,362 224,108 15,000 108,500 93,500 623.3%
Contingency - 500,000 500,000 500,000 - 0.0%
Transfers 13,411,383 13,093,847 13,093,847 11,926,454 (1,167,393) (8.9%)
Total 64,237,533 64,475,351 69,350,537 70,152,207 801,670 1.2%
186

Financial OverviewGeneral Fund Expenditures - by Object
FY22 Budget
Object - NameFY20
ActualsFY21
Projection
FY21AdoptedBudget
FY22AdoptedBudget Chg % Chg
Personnel Services
501000 - Full-Time Wages 23,620,041 23,094,146 23,996,496 24,545,381 548,885 2.3%
505000 - Other TaxableCompensation 9,735 10,200 10,800 10,800 - 0.0%
505100 - Other Taxable Comp.-Multilingual 61,533 58,240 58,240 58,240 - 0.0%
505200 - Other Taxable Comp.-GFIT 22,203 48,888 45,024 47,796 2,772 6.2%
505300 - Other Taxable Comp.-Housing Stipend 103,600 95,400 106,800 88,800 (18,000) (16.9%)
507000 - Vacation & Sick Payouts 356,310 372,436 354,000 375,000 21,000 5.9%
508000 - Overtime Wages 860,523 635,739 850,780 813,097 (37,683) (4.4%)
509000 - Part-Time Wages 2,725,415 1,771,742 3,545,242 3,494,458 (50,784) (1.4%)
510000 - FICA Taxes 2,034,233 1,968,400 2,228,709 2,279,279 50,570 2.3%
512000 - State UnemploymentTax 936 145,570 10,500 65,000 54,500 519.0%
513000 - Workers' Comp. 407,721 542,048 542,048 603,179 61,131 11.3%
513100 - Employee Advance/Worker's Comp. 1,072 - - - - 0.0%
514000 - Group Health/LifeInsurance 1,225 - - - - 0.0%
514100 - Group Insurance/Retirees 6,307 - - - - 0.0%
514200 - Vision Benefit 6,287 23,054 23,181 23,594 413 1.8%
514210 - Health Insurance 4,028,350 4,214,117 4,228,240 4,580,237 351,997 8.3%
514220 - Dental Benefit 159,334 260,518 264,864 262,571 (2,293) (0.9%)
514230 - Long-Term Care Benefit 32,617 42,694 45,667 49,660 3,993 8.7%
514240 - Life Ins and DisabilityBenefit 219,374 230,289 238,640 245,542 6,902 2.9%
514300 - Retiree Share/Insurance 13,628 - - - - 0.0%
514500 - M&CC Benefits 26,077 26,080 26,080 26,080 - 0.0%
514600 - Cobra Coverage 935 - - - - 0.0%
514700 - Out of Pocket DeductibleReimbursement 115,446 150,000 160,000 160,000 - 0.0%
515000 - Retirement (401A) 2,040,660 1,837,165 1,975,693 2,034,541 58,848 3.0%
515050 - SupplementalRetirement (401A) 424,764 451,296 468,267 480,128 11,861 2.5%
187

Financial OverviewGeneral Fund Expenditures - by Object
FY22 Budget
Object - NameFY20
ActualsFY21
Projection
FY21AdoptedBudget
FY22AdoptedBudget Chg % Chg
Personnel Services
515100 - Retirement HealthSavings (RHS) 269,978 284,357 270,168 282,216 12,048 4.5%
515200 - Medicare RetirementHealth Savings (RHS) 93,162 138,327 145,915 192,662 46,747 32.0%
516000 - Savings Plan (401K) 661,017 674,067 714,778 745,630 30,852 4.3%
516500 - Deferred Compensation(457) 19,297 18,700 20,898 21,272 374 1.8%
519000 - Tuition Reimbursement 16,030 31,500 50,750 66,000 15,250 30.0%
Total 38,337,811 37,124,973 40,381,780 41,551,163 1,169,383 2.9%Operating
521000 - Office Supplies 57,731 52,627 73,625 71,875 (1,750) (2.4%)
522000 - General OperatingSupplies 594,644 626,119 815,498 871,091 55,593 6.8%
522200 - Photo/Audio/VideoSupplies 3,619 1,250 3,050 3,050 - 0.0%
522500 - Program Activities 117,608 136,809 213,215 154,828 (58,387) (27.4%)
523300 - Police Outreach 10,813 7,300 10,300 7,300 (3,000) (29.1%)
523400 - Police Weapons 52,842 25,450 25,450 86,550 61,100 240.1%
524000 - Supplies/Resale 25,501 12,530 27,910 29,550 1,640 5.9%
525000 - Furniture/Fixture 24,203 16,700 24,350 46,425 22,075 90.7%
526000 - Machinery/Equipment 110,535 137,556 149,350 153,210 3,860 2.6%
529000 - Building & ConstructionSupplies 29,601 42,000 57,000 110,000 53,000 93.0%
530000 - Accounting & Audit 160,725 176,700 193,800 205,300 11,500 5.9%
531000 - IT (Non-Consultant)Services 532,697 626,052 680,073 875,196 195,123 28.7%
531500 - Software Licenses 21,730 29,060 31,600 17,600 (14,000) (44.3%)
531600 - Software MaintenanceAgreements 437,301 424,224 436,300 333,971 (102,329) (23.5%)
532000 - Engineering &Architecture 95,211 187,300 194,300 194,600 300 0.2%
533000 - Legal 11,685 44,780 45,680 46,900 1,220 2.7%
534500 - Wellness Programs 39,891 53,455 53,455 40,055 (13,400) (25.1%)
535000 - Medical/Hospital(Screenings) 28,815 15,000 26,500 26,500 - 0.0%
188

Financial OverviewGeneral Fund Expenditures - by Object
FY22 Budget
Object - NameFY20
ActualsFY21
Projection
FY21AdoptedBudget
FY22AdoptedBudget Chg % Chg
Operating
536000 - MiscellaneousProfessional Services 1,224,550 1,203,606 1,281,859 1,278,384 (3,475) (0.3%)
536100 - Temporary EmploymentAgency 6,800 - - 2,000 2,000 0.0%
536200 - Americans w/ DisabilitiesAct (ADA) 941 - 2,000 2,000 - 0.0%
536300 - Contract Cleaning 314,515 335,575 380,399 367,163 (13,236) (3.5%)
536400 - Contract MaintenanceServices 522,136 928,724 971,314 1,151,311 179,997 18.5%
536500 - Investigations 10,175 6,935 13,235 13,435 200 1.5%
536700 - Abatement Services - - 5,000 5,000 - 0.0%
536800 - Security Services 20,165 - 19,650 19,450 (200) (1.0%)
537000 - Instructor Services 60,952 18,140 89,299 77,712 (11,587) (13.0%)
538000 - Performances &Entertainment 153,949 46,080 145,454 159,170 13,716 9.4%
541000 - Advertising 93,631 103,123 134,144 132,370 (1,774) (1.3%)
542000 - Awards & Presentations 47,874 25,855 46,737 67,799 21,063 45.1%
543000 - Contributions 1,245,949 1,268,857 1,534,307 1,416,981 (117,326) (7.6%)
543200 - Contributions – HUDCOVID-19 - 536,000 265,900 114,450 (151,450) (57.0%)
544000 - Dues/Memberships/Certification 219,021 219,756 251,680 239,030 (12,650) (5.0%)
545000 - Publications/ ResourceMaterial 28,647 26,676 26,281 28,321 2,040 7.8%
546000 - Conf./Seminar/ClassRegistration 89,974 99,440 183,589 190,625 7,036 3.8%
546300 - In-Service Training 40,462 32,388 25,135 84,780 59,645 237.3%
547000 - Travel Expense 87,278 25,729 132,390 143,659 11,269 8.5%
547100 - Local Travel Mileage 244 - - 500 500 0.0%
548000 - Economic DevelopmentActivities 75,212 100,000 129,000 133,000 4,000 3.1%
548100 - Sponsorships 6,050 3,500 6,350 6,350 - 0.0%
549000 - ScholarshipManagement 37,521 42,738 43,645 33,714 (9,931) (22.8%)
550000 - Electric 986,861 982,231 1,118,223 1,135,200 16,977 1.5%
550100 - Gas (Natural) 60,473 44,700 69,000 77,800 8,800 12.8%
550200 - Water 104,084 103,848 133,850 133,950 100 0.1%
189

Financial OverviewGeneral Fund Expenditures - by Object
FY22 Budget
Object - NameFY20
ActualsFY21
Projection
FY21AdoptedBudget
FY22AdoptedBudget Chg % Chg
Operating
550700 - Solid Waste/Recycling 43,354 57,566 65,350 70,612 5,262 8.1%
550900 - Other Utilities 3,937 6,850 9,350 10,620 1,270 13.6%
551000 - Telephone (Landline) 66,562 79,176 72,625 81,475 8,850 12.2%
551100 - Cellular Phone 137,641 139,488 149,367 161,282 11,915 8.0%
552500 - Gasoline Expense 261,128 236,833 336,362 312,210 (24,152) (7.2%)
553000 - Printing & Binding 80,467 56,446 114,096 148,330 34,234 30.0%
554000 - Signage 12,523 27,356 36,870 44,020 7,150 19.4%
556000 - Postage 76,389 58,286 80,429 143,305 62,876 78.2%
556500 - Messenger Services 1,375 950 1,315 1,600 285 21.7%
557000 - Uniforms/ Laundry 131,359 173,854 164,885 177,185 12,300 7.5%
560000 - Miscellaneous 401,431 249,432 286,130 258,675 (27,455) (9.6%)
561000 - Local - In-Service Meals 5,336 3,370 5,200 5,900 700 13.5%
563000 - Insurance - Not Payroll 353,254 387,000 387,000 408,600 21,600 5.6%
564000 - Tax Abatement 297,765 338,115 360,725 63,315 (297,410) (82.4%)
567000 - Rental & Use 1,574,147 1,880,197 1,868,705 1,987,130 118,425 6.3%
567100 - Rental of Facilities 76,248 11,100 114,798 103,288 (11,510) (10.0%)
568300 - Police ForfeitureExpenditures 7,845 25,000 10,000 10,000 - 0.0%
568400 - Holiday GivingExpenditures 32,762 41,000 30,000 30,000 - 0.0%
572000 - R&M - Buildings &Facilities 650,127 493,050 592,883 1,133,686 540,803 91.2%
573000 - R&M - Machinery &Equipment 236,527 271,941 294,120 336,902 42,782 14.5%
574000 - R&M - Vehicles 212,933 218,700 302,100 282,000 (20,100) (6.7%)
575000 - R&M - Furniture &Equipment 252 7,900 7,704 7,800 96 1.2%
Total 12,455,978 13,532,423 15,359,910 16,066,090 706,180 4.6%Capital
595000 - Furniture & Equipment 750 230 - 50,000 50,000 0.0%
595060 - Machinery & Equipment 3,313 10,000 10,000 - (10,000) (100.0%)
595100 - Furniture & Equipment(Replacement) 10 3,211 5,000 5,000 - 0.0%
596000 - Vehicles/MotorEquipment 28,289 210,667 - 53,500 53,500 0.0%
190

Financial OverviewGeneral Fund Expenditures - by Object
FY22 Budget
Object - NameFY20
ActualsFY21
Projection
FY21AdoptedBudget
FY22AdoptedBudget Chg % Chg
Capital
Total 32,362 224,108 15,000 108,500 93,500 623.3%Contingency
580000 - Contingency - 500,000 500,000 500,000 - 0.0%
Total 0 500,000 500,000 500,000 - 0.0%
Total Operating 50,826,150 51,381,504 56,256,690 58,225,753 1,969,063 3.5%
Transfers
589201 - Transfer to Stormwater 1,233,383 169,547 169,547 169,547 - 0.0%
589202 - Transfer to Housing 240,000 240,000 240,000 240,000 - 0.0%
589300 - Transfer to CapitalFunds 6,350,000 7,165,000 7,165,000 4,970,907 (2,194,093) (30.6%)
589350 - Transfer to AssetReplacement 2,488,000 2,319,300 2,319,300 3,146,000 826,700 35.6%
589853 - Transfer to OPEB 3,100,000 3,200,000 3,200,000 3,400,000 200,000 6.3%
Total 13,411,383 13,093,847 13,093,847 11,926,454 (1,167,393) (8.9%)
Total Expenditures & Other Uses 64,237,533 64,475,351 69,350,537 70,152,207 801,670 1.2%
191

Financial Overview
General Fund Expenditures
FY22 Budget
No matter how the City’s expenditures are categorized, personnel costs make up a substantial portion of the total. The majority of personnel costs relate to the City’s workforce. The reasons for changes in full-time equivalent (FTE) employee counts, which are shown on the next page, are as follows:
Office of the City Manager – added a new Racial Equity Program Manager to coordinate the City’s efforts on racial
equity.
Office of the City Attorney – added a new Assistant City Attorney to enhance capacity in Office of the City Attorney to address increasing workload, centralize legal functions in the department, and reduce dependence on outside counsel.
Community and Public Relations – upgrade of a part-time administrative assistant to a full time Community Services Case Worker to provide additional help to residents requiring assistance from the Community Services division, with a focus on providing enhanced assistance to Spanish-speaking residents.
Planning and Code Administration – delay in filling new Rental Housing Code Inspector position until FY23.
Public Works – delay in filling upgraded Project Engineer position for duration of FY22. The next page summarizes the City’s full-time equivalent positions for the last ten years.
192

Financial OverviewFull-Time Equivalent Positions
FY22 Budget
Dept Name FY13 FY14 FY15 FY16 FY17 FY18 FY19 FY20 FY21 FY22
City Manager's Offices 11.45 11.70 11.20 12.52 12.83 14.20 15.20 11.20 10.29 11.32
Community & Public Relations 20.19 21.95 20.63 20.01 20.69 21.15 21.13 20.82 21.32 22.29
Finance & Administration 9.20 11.00 11.00 11.00 11.00 11.00 11.00 11.00 11.00 11.00
Human Resources 5.00 5.00 5.00 5.00 5.00 5.95 6.09 6.52 6.94 6.51
Information Technology 10.70 12.00 12.00 12.50 14.60 13.77 14.87 15.04 15.92 15.00
Office of the City Attorney 4.00 4.00 5.49
Parks, Recreation & Culture 119.53 121.42 120.84 120.99 120.77 123.80 124.94 126.10 132.60 122.40
Planning & Code Administration 42.38 45.38 47.53 48.64 49.78 48.49 49.75 48.83 50.08 48.83
Police Department 67.36 67.26 67.55 67.53 70.53 71.56 72.60 72.57 73.82 73.75
Public Works 89.50 89.44 92.07 92.57 99.42 100.77 102.42 103.07 99.50 103.24
Total 375.31 385.15 387.82 390.76 404.62 410.69 417.99 419.14 425.48 419.82% Change 2.62% 0.69% 0.76% 3.55% 1.50% 2.06% 0.27% 1.51% -1.33%
Culmulative % Change 11.86%
Population 63,842 65,690 67,099 68,635 69,562 69,769 70,010 70,223
% Chg in Population 2.89% 2.14% 2.29% 1.35% 0.30% 0.35% 0.30%
Culmulative % Change 9.99%
Household Income 72,746 74,597 77,745 78,553 82,209 85,948 91,312 94,591
% Chg in Household Income 2.54% 4.22% 1.04% 4.65% 4.55% 6.24% 3.59%
Culmulative % Change 30.03%
Note: Community & Housing Development was moved to Planning & Code Administration in FY17 and to the Office of the City Manager inFY18. In FY20, the Office of the City Attorney was established, moving Legal Services and Registrations and Elections under the City Attorney.For FY21, Environmental Services was moved from the Office of the City Manager to Public Works. Each years' full-time equivalent employees,shown above, are presented as they were shown in the adopted budget for that year.Sources: Previous years' City budgets and Comprehensive Annual Financial Reports
193

Financial Overview
Five Year Financial Plan
FY22 Budget
Although much of this document is focused on the annual General Fund budget, the City is very conscious of the long term perspective necessary for a pay-as-you-go financing strategy. The next page summarizes the long term financial forecast based on the current financial environment. Notes on significant assumptions are as follows: Revenue Assumptions
Local taxes are increased 2% based on estimated property value appreciation. Hotel and motel taxes are anticipated to increase by 60% in FY23 as the economy recovers from the COVID-19 pandemic,
and returns to 2% growth from FY24 onward. Admissions and amusement taxes are expected to increase by 80% in FY23 as the economy recovers from the COVID-
19 pandemic, and 15% in FY24 before returning to 2% growth in FY25 and FY26. Licenses & Permits, Federal and State Grants are held flat. County Grants & Shared Taxes were increased by 2% based on expected income tax increases. Charges for services are increased by 1%. Due to expected decreases in photo radar revenue, Fines & Forfeitures are shown decreasing 2% annually. Miscellaneous revenue is shown increasing by 1% annually, due to expected increases in interest rates and sale of capital
assets. Expenditure Assumptions
Personnel related expenditures are increased by 5%, excluding health insurance which is increased by 5.7% annually, based on the five year average increase. Of these increases 3% represents increases in wage levels and cost of benefits (5.7% for health insurance). The remaining 2% represents an estimate for expected growth in the number of positions needed to maintain and enhance service levels.
All Operating Expenditures and Capital Outlay are shown with a 2% annual increase. The Contingency line is held flat. The Transfer to the OPEB Trust is increased by $200,000 per year, which follows a long-term plan to bring funding up to
the expected minimum required level needed to fund this obligation. The Transfer for the Asset Replacement Fund increases by 2% annually. The Transfers to Capital Funds and Stormwater are consistent with the long-term plan within those sections of this budget
document. Beginning unassigned fund balance is calculated using FY20 actual ending less the projected change in fund balance for FY21.
194

Financial Overview5 Year Plan
FY22 Budget
FY22AdoptedBudget FY23 FY24 FY25 FY26
Revenues and Sources of Funds
Local Taxes 31,769,200 33,084,584 33,863,276 34,540,541 35,231,352
Licenses & Permits 4,337,730 4,337,730 4,337,730 4,337,730 4,337,730
Federal Grants 473,675 473,675 473,675 473,675 473,675
State Grants & Shared Taxes 4,919,053 4,919,053 4,919,053 4,919,053 4,919,053
County Grants & Shared Taxes 15,505,043 15,815,144 16,131,447 16,454,076 16,783,157
Charges for Services 4,714,914 4,762,053 4,809,663 4,857,749 4,906,317
Fines & Forfeitures 2,020,000 1,979,600 1,940,008 1,901,208 1,863,184
Miscellaneous Revenues 2,554,668 2,580,215 2,606,017 2,632,077 2,658,398Total 66,294,283 67,952,053 69,080,868 70,116,109 71,172,866
Reappropriation
Transfer-In 167,020 172,031 177,192 182,508
Total Revenues and Sources of Funds 70,575,874 78,549,803 80,353,432 85,048,467 82,941,775
Expenditures and Uses of Funds
Personnel Services 41,551,163 43,660,783 45,877,711 48,207,418 50,655,651
Operating 16,066,090 16,385,123 16,710,536 17,042,458 17,381,018
Capital 108,500 110,670 112,883 115,141 117,444
Contingency 500,000 500,000 500,000 500,000 500,000Total 58,225,753 60,656,576 63,201,131 65,865,017 68,654,113
Transfers
Transfer to Asset Replacement 3,146,000 3,208,920 3,273,098 3,338,560 3,405,332
Transfer to Capital Funds 4,970,907 10,669,960 9,659,960 11,420,653 6,253,000
Transfer to Housing 240,000 244,800 249,696 254,690 259,784
Transfer to OPEB 3,400,000 3,600,000 3,800,000 4,000,000 4,200,000
Transfer to Stormwater 169,547 169,547 169,547 169,547 169,547Total 11,926,454 17,893,227 17,152,301 19,183,450 14,287,662
Total Expenditures and Uses of Funds 70,152,207 78,549,803 80,353,432 85,048,467 82,941,775
Net Change in Fund Balance 423,667 - - - -
Beginning Fund Balance 50,279,230 50,702,897 40,272,168 29,171,635 14,416,469
Reappropriation - (10,430,729) (11,100,533) (14,755,166) (11,586,402)
Projected Fund Balance 50,702,897 40,272,168 29,171,635 14,416,469 2,830,067
- 10,430,729 11,586,40214,755,16611,100,533
4,281,591
195

Financial Overview
Five Year Financial Plan
FY22 Budget
Analysis
The chart below uses unassigned fund balance, rather than total fund balance. Unassigned fund balance represents funds on hand (or reserves) that do not have any restrictions or other commitments on it. Unassigned fund balance compared to the City’s target of 25% of the three year average of expenditures for the last five years and the future looking five year plan is depicted on the following chart.
The financial plan shows that the City intends to use fund balance annually, and that the fund balance target will not be met in future years unless changes are made to future spending plans. As discussed earlier within the Re-appropriation of Fund Balance section of this document, some of this use of fund balance is attributed to one time capital projects and funding of the CIP and some portion of operating expenditures. The reliance on reserves to fund operations has been reduced over the last few years and eliminated in the last two years. Under normal fiscal conditions, staff intends to continue to avoid the use of re-appropriation for operating expenses. The five year financial plan shows a depletion of the reserve in FY25 due to the forecasted projects in the CIP. As mentioned, an analysis will be undertaken in FY22 to align long term capital needs with projected funding.
196

Financial Overview
Five Year Financial Plan
FY22 Budget
The chart below summarizes the budgeted use of fund balance compared to the actual use of fund balance for the last ten years.
This chart shows that for many years the City budgeted to spend down reserves or break even; but actual results were significantly better.
Budgetary Changes In order to better manage these variances, several changes were instituted beginning in FY17. These changes include:
- Budgeting for position vacancies – Prior to the FY17 budget, all positions (including new positions) were budgeted to be filled for the entire year. In practice, the City experiences turnover in full-time and part-time positions. Beginning in FY17 the City began using a vacancy percentage to reflect turnover savings. The FY22 budget uses a 4% vacancy on full-time wages, excluding the Gaithersburg Police Department, and a 15% vacancy for part-time wages, excluding Parks, Recreation and Culture, and the Homeless Services Division in Community and Public Relations.
197

Financial Overview
Five Year Financial Plan
FY22 Budget
- Budgeting for asset replacement – The City previously budgeted amounts being saved for asset replacement as expenditures. These amounts were not intended to be spent in the current budget but were instead annual amounts that were being set aside for replacement of the asset in the future. Since they were not spent, the actual spending appeared less than budgeted spending. This system worked well for saving up funds, but when looking at the overall change to fund balance it appeared that the City was underspending in this area. Beginning in FY17, the City created an Asset Replacement Fund so that the annual savings amount is transferred out of the General Fund. As a result the amount saved for asset replacement is reflected both in the budget and in actual results. This change also allowed for more transparent budgeting of purchases from this fund and total amounts saved for future years.
- Final revenue adjustment – Beginning with the FY18 budget, the City adjusted the proposed revenue budget in May, based on re-projected current year revenues. The original revenue budget is developed the first week of February using 6 month results. Although many revenues are based on multi-year historical reviews, the projection is most informed by the most recent activity. Updating the revenue budget based on the most current projected revenues may improve the accuracy of the revenue budget.
- Other budgetary changes: o The City began using blended premium rates for vacant positions rather than budgeting for family coverage. This
change reduced the budget by between $50,000 and $180,000 depending on the number of vacant positions when the budget was developed. This is approximately $7,000 per open position.
o Continued focus and monitoring that budget requests are in-line with actual spending needs, rather than only considering year-over-year budgetary changes, if the prior year spending was not used.
The City anticipates that these changes to the budgeting process will result in closer budget-to-actual results. Indeed, we have seen that budget-to-actual variances in both revenues and expenditures were under 10% in FY16 through FY20.
Other Financial Changes
Over the last several years, the City experienced significant development which provided revenue growth from permits first, followed by property value appreciation and income tax revenue increases. Beginning in FY19 and likely to continue in FY22, the City’s growth expectations are tempered as there are few significant developments on the horizon. The City prides itself on remaining debt free. The presence of fund balance reserves allows the City to maintain this status. The City’s capital budgets are at historically high levels; however, there are still some capital needs which have not been programmed into the current CIP. The City has begun the process of conducting several needs assessments on various City facilities in order to more scientifically identify, quantify and prioritize maintenance and renovation needs. It is expected that these efforts will result in the need to add other projects to the CIP within the five year time horizon. The following chart illustrates the capital spending over the last ten years in comparison to capital savings.
198

Financial Overview
Five Year Financial Plan
FY22 Budget
*These are based on the FY22 budget and current CIP. FY21 is based on projected amounts.
Conclusion
The trend of conservative budgeting that historically resulted in unplanned fund balance growth has likely ended given the changes to the budgeting process previously discussed. When developing the five year plan, staff does not attempt to balance the plan for the five year term. It is anticipated that adjustments will be made to revenues and expenditures on an annual basis to avoid the reduction of fund balance levels beyond the target level. Staff will begin a full review of our projected resources and long term needs to bring our financial practices in line with our forecast.
199

Innovator Park in Crown Farm
200

OFFICE OF THE CITY MANAGER
City Manager
Economic & Community Development Administration
Mayor & CityCouncil Services Legislative Affairs
Housing &Community Development Racial Equity Program
201

General Fund Departmental BudgetDepartment Overview - City Manager's
OfficesFY22 Budget
The City Manager is the chief executive officer and, with the assistance of the Deputy City Manager and Assistant CityManager, directs and coordinates the general administration of the City government. The City Manager coordinates theenforcement and execution of all laws, ordinances and policies of the City. The Office of the City Manager provides management and administrative support for operating departments as well asprograms and initiatives established by the Mayor and Council. The City Manager’s Office also includes LegislativeAffairs, Economic Development, Housing and Community Development, and the newly formed Racial Equity Program.
Services Provided
City Manager's Offices Budget SummaryFY20
ActualsFY21
Projection
FY21AdoptedBudget
FY22AdoptedBudget Chg % Chg
By Activity1101 - Mayor & City Council 403,116 465,155 493,020 502,902 9,882 2.0%
1131 - Office of the City Manager 990,501 815,565 825,796 1,000,613 174,817 21.2%
1133 - Economic & Business Development 461,534 476,124 519,794 536,096 16,302 3.1%
1142 - Housing & Community Development 284,809 788,698 832,907 613,837 (219,070) (26.3%)
Total 2,139,960 2,545,542 2,671,517 2,653,448 (18,069) (0.7%)
202

General Fund Departmental BudgetDepartment Overview - City Manager's
OfficesFY22 Budget
City Manager's Offices BudgetSummary
FY20Actuals
FY21Projection
FY21AdoptedBudget
FY22AdoptedBudget Chg % Chg
By Object CategoryPersonnel Services 1,720,869 1,647,933 1,672,684 1,834,436 161,752 9.7%
Operating 419,091 897,609 998,833 769,012 (229,821) (23.0%)
Capital - - - 50,000 50,000 100.0%
Total 2,139,960 2,545,542 2,671,517 2,653,448 (18,069) (0.7%)
Departmental Personnel Schedule
FY20AdoptedBudget
FY21AdoptedBudget
FY22AdoptedBudget
1101 - Mayor & City Council
Administrative Assistant III 0 1 1
Municipal Clerk 1 1 1
Part-Time Personnel 0.2 0.2 0.2
Subtotal 1.2 2.2 2.2
1131 - Office of the City Manager
Administrative Assistant III 1 0 0
Legislative Affairs Manager 1 1 1
Assistant to the City Manager 1 1 1
Racial Equity Program Manager 0 0 1
Deputy City Manager 1 1 1
City Manager 1 1 1
Part-Time Personnel 0 0.1 0.12
Subtotal 5 4.1 5.12
1133 - Economic & Business Development
Business Services Coordinator 1 0 0
Economic Development Manager 0 1 1
Assistant City Manager 1 1 1
Subtotal 2 2 2
1142 - Housing & Community Development
Housing & Community Development Chief 1 1 1
Grants Administrator 1 1 1
Subtotal 2 2 2
203

General Fund Departmental BudgetDepartment Overview - City Manager's
OfficesFY22 Budget
Full-Time Personnel 10 10 11
Part-Time Personnel 0.2 0.29 0.32
Total 10.2 10.29 11.32
204

General Fund Departmental BudgetsCity Manager's Offices - Activity Analysis
FY22 Budget
Budget SummaryFY20
ActualsFY21
Projection
FY21AdoptedBudget
FY22AdoptedBudget Chg % Chg
By Object501000 - Full-Time Wages 94,988 146,943 140,553 145,283 4,730 3.4%
505200 - Other Taxable Comp.-GFIT - 420 336 336 - 0.0%
507000 - Vacation & Sick Payouts - 3,900 - - - 0.0%
509000 - Part-Time Wages 153,137 154,234 154,234 156,546 2,312 1.5%
510000 - FICA Taxes 20,705 23,072 23,025 23,579 554 2.4%
514200 - Vision Benefit (14) 140 184 129 (55) (29.9%)
514210 - Health Insurance 10,360 26,940 27,784 26,458 (1,326) (4.8%)
514220 - Dental Benefit (1,043) 1,432 1,782 1,321 (461) (25.9%)
514230 - Long-Term Care Benefit 854 288 290 310 20 6.9%
514240 - Life Ins and Disability Benefit 925 1,478 1,451 1,493 42 2.9%
514500 - M&CC Benefits 26,077 26,080 26,080 26,080 - 0.0%
515000 - Retirement (401A) 7,599 11,755 11,712 12,107 395 3.4%
516000 - Savings Plan (401K) 2,953 4,408 4,393 4,540 147 3.3%
519000 - Tuition Reimbursement 900 - - 1,800 1,800 100.0%
521000 - Office Supplies 437 150 200 1,600 1,400 700.0%
526000 - Machinery/Equipment 457 250 250 250 - 0.0%
531000 - IT (Non-Consultant) Services 27,842 27,650 27,886 30,450 2,564 9.2%
531600 - Software MaintenanceAgreements 3,420 3,828 4,590 - (4,590) (100.0%)
536000 - Miscellaneous ProfessionalServices 1,145 200 1,400 1,400 - 0.0%
541000 - Advertising 1,398 1,000 1,000 2,500 1,500 150.0%
542000 - Awards & Presentations 181 450 500 700 200 40.0%
543000 - Contributions 3,491 - - - - 0.0%
544000 - Dues/Memberships/Certification 888 930 825 825 - 0.0%
545000 - Publications/ Resource Material 10,681 5,000 5,000 5,000 - 0.0%
546000 - Conf./Seminar/ClassRegistration 4,663 6,000 10,695 10,695 - 0.0%
546300 - In-Service Training 2,500 - - - - 0.0%
547000 - Travel Expense 15,317 9,000 34,600 34,600 - 0.0%
547100 - Local Travel Mileage 157 - - 500 500 100.0%
551100 - Cellular Phone 5,369 6,400 6,400 6,400 - 0.0%
553000 - Printing & Binding 61 21 100 100 - 0.0%
1101 - Mayor & City Council
205

General Fund Departmental BudgetsCity Manager's Offices - Activity Analysis
FY22 Budget
Budget SummaryFY20
ActualsFY21
Projection
FY21AdoptedBudget
FY22AdoptedBudget Chg % Chg
By Object556000 - Postage 82 136 50 50 - 0.0%
557000 - Uniforms/ Laundry - 550 200 350 150 75.0%
560000 - Miscellaneous 7,587 2,500 7,500 7,500 - 0.0%
Total 403,116 465,155 493,020 502,902 9,882 2.0%
Budget SummaryFY20
ActualsFY21
Projection
FY21AdoptedBudget
FY22AdoptedBudget Chg % Chg
By Object SummaryPersonnel Services 317,441 401,090 391,824 399,982 8,158 2.1%
Operating 85,675 64,065 101,196 102,920 1,724 1.7%
Total 403,116 465,155 493,020 502,902 9,882 2.0%
206

General Fund Departmental BudgetsCity Manager's Offices - Activity Analysis
FY22 Budget
Budget SummaryFY20
ActualsFY21
Projection
FY21AdoptedBudget
FY22AdoptedBudget Chg % Chg
By Object501000 - Full-Time Wages 665,290 518,449 532,881 641,912 109,031 20.5%
505000 - Other Taxable Compensation 9,735 10,200 10,800 10,800 - 0.0%
505200 - Other Taxable Comp.-GFIT 135 1,092 1,344 1,344 - 0.0%
507000 - Vacation & Sick Payouts 19,917 14,942 - - - 0.0%
508000 - Overtime Wages 280 - - - - 0.0%
509000 - Part-Time Wages - - 3,000 3,000 - 0.0%
510000 - FICA Taxes 39,060 40,526 35,216 43,894 8,678 24.6%
514200 - Vision Benefit 179 284 362 363 1 0.3%
514210 - Health Insurance 47,309 32,642 45,510 49,528 4,018 8.8%
514220 - Dental Benefit 3,102 2,749 3,477 3,477 - 0.0%
514230 - Long-Term Care Benefit (627) 558 587 775 188 32.0%
514240 - Life Ins and Disability Benefit 4,033 4,653 3,883 4,890 1,007 25.9%
515000 - Retirement (401A) 85,613 41,476 44,407 53,493 9,086 20.5%
515100 - Retirement Health Savings(RHS) 6,075 9,724 4,273 9,524 5,251 122.9%
515200 - Medicare Retirement HealthSavings (RHS) 769 3,650 2,084 6,000 3,916 187.9%
516000 - Savings Plan (401K) 15,840 15,554 16,653 20,060 3,407 20.5%
516500 - Deferred Compensation (457) 9,150 8,564 10,545 10,875 330 3.1%
519000 - Tuition Reimbursement (2,301) - - 3,500 3,500 100.0%
521000 - Office Supplies 57 700 700 800 100 14.3%
522000 - General Operating Supplies 1,259 1,050 2,100 100 (2,000) (95.2%)
526000 - Machinery/Equipment - 81 250 1,450 1,200 480.0%
531000 - IT (Non-Consultant) Services 966 1,388 1,329 3,257 1,928 145.1%
531600 - Software MaintenanceAgreements 760 1,063 1,275 111 (1,164) (91.3%)
Significant Changes
FY21AdoptedBudget
FY22AdoptedBudget
Increase /(Decrease)
Object - Object Name / Reason for Change
546300 - In-Service Training 4,200 24,200 20,000
Increase related to new Racial Equity Training program in FY22.
1131 - Office of the City Manager
207

General Fund Departmental BudgetsCity Manager's Offices - Activity Analysis
FY22 Budget
Budget SummaryFY20
ActualsFY21
Projection
FY21AdoptedBudget
FY22AdoptedBudget Chg % Chg
By Object536000 - Miscellaneous ProfessionalServices 150 200 200 200 - 0.0%
541000 - Advertising - 500 500 500 - 0.0%
542000 - Awards & Presentations - 100 100 100 - 0.0%
543000 - Contributions 62,917 65,500 65,500 65,500 - 0.0%
544000 - Dues/Memberships/Certification 5,632 7,625 7,625 6,945 (680) (8.9%)
545000 - Publications/ Resource Material - 100 100 100 - 0.0%
546000 - Conf./Seminar/ClassRegistration 1,618 6,175 6,175 9,375 3,200 51.8%
546300 - In-Service Training - 4,200 4,200 24,200 20,000 476.2%
547000 - Travel Expense 5,627 6,200 6,200 9,200 3,000 48.4%
548100 - Sponsorships 1,000 1,500 1,500 1,500 - 0.0%
551100 - Cellular Phone 2,129 3,220 3,220 4,040 820 25.5%
552500 - Gasoline Expense 479 1,000 1,000 1,000 - 0.0%
553000 - Printing & Binding 471 100 100 100 - 0.0%
556000 - Postage 278 1,000 1,000 1,000 - 0.0%
557000 - Uniforms/ Laundry 150 200 200 200 - 0.0%
560000 - Miscellaneous 2,859 6,500 6,500 6,500 - 0.0%
561000 - Local - In-Service Meals 25 - - - - 0.0%
574000 - R&M - Vehicles 564 2,100 1,000 1,000 - 0.0%
Total 990,501 815,565 825,796 1,000,613 174,817 21.2%
Budget SummaryFY20
ActualsFY21
Projection
FY21AdoptedBudget
FY22AdoptedBudget Chg % Chg
By Object SummaryPersonnel Services 903,559 705,063 715,022 863,435 148,413 20.8%
Operating 86,941 110,502 110,774 137,178 26,404 23.8%
Total 990,501 815,565 825,796 1,000,613 174,817 21.2%
208

General Fund Departmental BudgetsCity Manager's Offices - Activity Analysis
FY22 Budget
Budget SummaryFY20
ActualsFY21
Projection
FY21AdoptedBudget
FY22AdoptedBudget Chg % Chg
By Object501000 - Full-Time Wages 239,437 244,274 235,129 241,826 6,697 2.8%
507000 - Vacation & Sick Payouts 9,190 6,735 - - - 0.0%
510000 - FICA Taxes 18,246 18,688 18,326 19,007 681 3.7%
514200 - Vision Benefit 44 200 184 184 - 0.0%
514210 - Health Insurance 38,201 41,368 38,186 40,629 2,443 6.4%
514220 - Dental Benefit 1,256 1,432 1,321 1,321 - 0.0%
514230 - Long-Term Care Benefit 364 288 290 310 20 6.9%
514240 - Life Ins and Disability Benefit 2,104 2,409 2,139 2,173 34 1.6%
515000 - Retirement (401A) 19,155 19,543 19,594 20,152 558 2.8%
516000 - Savings Plan (401K) 7,289 7,328 7,348 7,558 210 2.9%
521000 - Office Supplies - 100 100 100 - 0.0%
525000 - Furniture/Fixture - - 500 500 - 0.0%
526000 - Machinery/Equipment 26 100 500 500 - 0.0%
531000 - IT (Non-Consultant) Services 24,481 21,240 19,737 21,561 1,824 9.2%
531600 - Software MaintenanceAgreements 380 213 255 - (255) (100.0%)
536000 - Miscellaneous ProfessionalServices - - 500 500 - 0.0%
538000 - Performances & Entertainment 7,000 2,500 10,000 10,000 - 0.0%
541000 - Advertising - - 6,000 6,000 - 0.0%
543000 - Contributions 300 - 2,500 2,500 - 0.0%
544000 - Dues/Memberships/Certification 3,080 3,616 3,695 3,785 90 2.4%
545000 - Publications/ Resource Material 300 150 250 250 - 0.0%
546000 - Conf./Seminar/ClassRegistration 2,350 2,000 3,500 3,500 - 0.0%
547000 - Travel Expense 3,323 - 7,750 7,750 - 0.0%
548000 - Economic DevelopmentActivities 75,212 100,000 129,000 133,000 4,000 3.1%
548100 - Sponsorships 5,050 2,000 4,850 4,850 - 0.0%
551100 - Cellular Phone 1,243 1,440 1,440 1,440 - 0.0%
553000 - Printing & Binding 9 - 1,500 1,500 - 0.0%
556000 - Postage 30 - 150 150 - 0.0%
556500 - Messenger Services - - 50 50 - 0.0%
1133 - Economic & Business Development
209

General Fund Departmental BudgetsCity Manager's Offices - Activity Analysis
FY22 Budget
Budget SummaryFY20
ActualsFY21
Projection
FY21AdoptedBudget
FY22AdoptedBudget Chg % Chg
By Object560000 - Miscellaneous 3,463 500 5,000 5,000 - 0.0%
Total 461,534 476,124 519,794 536,096 16,302 3.1%
Budget SummaryFY20
ActualsFY21
Projection
FY21AdoptedBudget
FY22AdoptedBudget Chg % Chg
By Object SummaryPersonnel Services 335,286 342,265 322,517 333,160 10,643 3.3%
Operating 126,248 133,859 197,277 202,936 5,659 2.9%
Total 461,534 476,124 519,794 536,096 16,302 3.1%
210

General Fund Departmental BudgetsCity Manager's Offices - Activity Analysis
FY22 Budget
Budget SummaryFY20
ActualsFY21
Projection
FY21AdoptedBudget
FY22AdoptedBudget Chg % Chg
By Object501000 - Full-Time Wages 126,151 149,744 180,981 179,511 (1,470) (0.8%)
505200 - Other Taxable Comp.-GFIT - 168 336 336 - 0.0%
507000 - Vacation & Sick Payouts 4,814 4,886 - - - 0.0%
510000 - FICA Taxes 9,991 11,469 14,447 14,331 (116) (0.8%)
514200 - Vision Benefit (7) 40 124 37 (87) (70.2%)
514210 - Health Insurance 8,550 13,533 21,414 18,186 (3,228) (15.1%)
514220 - Dental Benefit (104) 682 1,234 860 (374) (30.3%)
514230 - Long-Term Care Benefit 169 204 290 310 20 6.9%
514240 - Life Ins and Disability Benefit 1,140 1,484 1,758 1,718 (40) (2.3%)
515000 - Retirement (401A) 10,092 11,979 15,082 14,960 (122) (0.8%)
515200 - Medicare Retirement HealthSavings (RHS) - 833 2,000 2,000 - 0.0%
516000 - Savings Plan (401K) 3,785 4,493 5,655 5,610 (45) (0.8%)
521000 - Office Supplies - - 350 350 - 0.0%
522000 - General Operating Supplies - - 150 150 - 0.0%
526000 - Machinery/Equipment - - 400 400 - 0.0%
531000 - IT (Non-Consultant) Services 224 158 226 864 638 282.3%
531600 - Software MaintenanceAgreements 380 425 510 - (510) (100.0%)
Significant Changes
FY21AdoptedBudget
FY22AdoptedBudget
Increase /(Decrease)
Object - Object Name / Reason for Change
543000 - Contributions 281,000 167,274 (113,726)
Decrease due to COVID funds originally being included with this account. This account is for non-COVID relatedcosts only.
543200 - Contributions – HUD COVID-19 265,900 114,450 (151,450)
Decrease because the FY21 budget of $265,900 was for CDBG COVID-related costs. We are currently drawingdown funds for COVID-related expenses.
595000 - Furniture & Equipment - 50,000 50,000
Addition of funding in support of City objectives to establish the Olde Towne Plaza as a destination for eveningand “off-season” programming, and drawing users other than those who patronize the plaza for the interactivewater feature, these funds will be used to purchase additional lighting, seating, and other public amenities withfunding from CDBG.
1142 - Housing & Community Development
211

General Fund Departmental BudgetsCity Manager's Offices - Activity Analysis
FY22 Budget
Budget SummaryFY20
ActualsFY21
Projection
FY21AdoptedBudget
FY22AdoptedBudget Chg % Chg
By Object536000 - Miscellaneous ProfessionalServices 25,000 28,000 33,000 33,000 - 0.0%
541000 - Advertising 1,923 1,500 1,500 1,500 - 0.0%
543000 - Contributions 92,456 20,000 281,000 167,274 (113,726) (40.5%)
543200 - Contributions – HUD COVID-19 - 536,000 265,900 114,450 (151,450) (57.0%)
544000 - Dues/Memberships/Certification - 1,000 1,000 1,000 - 0.0%
546000 - Conf./Seminar/ClassRegistration 99 1,000 2,000 2,000 - 0.0%
547000 - Travel Expense (144) 100 2,300 2,300 - 0.0%
551100 - Cellular Phone - 1,000 - 1,440 1,440 100.0%
553000 - Printing & Binding - - 250 250 - 0.0%
556000 - Postage 11 - 250 250 - 0.0%
556500 - Messenger Services 278 - 250 250 - 0.0%
560000 - Miscellaneous - - 500 500 - 0.0%
595000 - Furniture & Equipment - - - 50,000 50,000 100.0%
Total 284,809 788,698 832,907 613,837 (219,070) (26.3%)
Budget SummaryFY20
ActualsFY21
Projection
FY21AdoptedBudget
FY22AdoptedBudget Chg % Chg
By Object SummaryPersonnel Services 164,582 199,515 243,321 237,859 (5,462) (2.2%)
Operating 120,227 589,183 589,586 325,978 (263,608) (44.7%)
Capital - - - 50,000 50,000 0.0%
Total 284,809 788,698 832,907 613,837 (219,070) (26.3%)
212

City Attorney
LegalServices
Registrations & Elections
OFFICE OF THE CITY ATTORNEY
213

General Fund Departmental BudgetDepartment Overview - Office of the City
AttorneyFY22 Budget
The City Attorney is the legal adviser to the City and, with the assistance of the Deputy City Attorney, directs alllitigation and provides legal services to the City.
The Office of the City Attorney provides legal assistance to the Mayor and Council, City Boards, Commissions andCommittees, and all operating departments. The City Attorney’s Office also includes Registration & Elections.
Services Provided
Office of the City Attorney BudgetSummary
FY20Actuals
FY21Projection
FY21AdoptedBudget
FY22AdoptedBudget Chg % Chg
By Activity1111 - Legal Services 765,529 807,724 775,605 956,122 180,517 23.3%
1122 - Registration & Elections 53,945 - 5,000 152,635 147,635 2,952.7%
Total 819,475 807,724 780,605 1,108,757 328,152 42.0%
214

General Fund Departmental BudgetDepartment Overview - Office of the City
AttorneyFY22 Budget
Office of the City Attorney BudgetSummary
FY20Actuals
FY21Projection
FY21AdoptedBudget
FY22AdoptedBudget Chg % Chg
By Object CategoryPersonnel Services 735,094 737,195 701,283 887,734 186,451 26.6%
Operating 84,380 70,529 79,322 221,023 141,701 178.6%
Capital - - - - - 0.0%
Total 819,475 807,724 780,605 1,108,757 328,152 42.0%
Departmental Personnel Schedule
FY20AdoptedBudget
FY21AdoptedBudget
FY22AdoptedBudget
1111 - Legal Services
Paralegal 1 1 1
Legal Services Coordinator 1 1 1
City Attorney 1 1 1
Assistant City Attorney 1 0 1
Deputy City Attorney 0 1 1
Subtotal 4 4 5
Part-Time Personnel 0 0 0.49
Subtotal 0 0 0.49
Full-Time Personnel 4 4 5
Part-Time Personnel 0 0 0.49
Total 4 4 5.49
1122 - Registration & Elections
215

General Fund Departmental BudgetsOffice of the City Attorney - Activity Analysis
FY22 Budget
Budget SummaryFY20
ActualsFY21
Projection
FY21AdoptedBudget
FY22AdoptedBudget Chg % Chg
By Object501000 - Full-Time Wages 547,405 539,237 524,937 636,955 112,018 21.3%
505200 - Other Taxable Comp.-GFIT 445 840 672 1,008 336 50.0%
507000 - Vacation & Sick Payouts 14,370 16,852 - - - 0.0%
508000 - Overtime Wages 8,842 5,000 7,500 12,499 4,999 66.7%
510000 - FICA Taxes 36,632 41,699 36,513 46,084 9,571 26.2%
514200 - Vision Benefit (1) 232 221 308 87 39.4%
514210 - Health Insurance 52,670 56,084 52,651 70,818 18,167 34.5%
514220 - Dental Benefit 2,398 2,323 2,212 3,016 804 36.3%
514230 - Long-Term Care Benefit 536 577 580 775 195 33.6%
514240 - Life Ins and Disability Benefit 4,026 4,435 4,070 5,135 1,065 26.2%
515000 - Retirement (401A) 42,999 43,139 43,746 53,090 9,344 21.4%
515100 - Retirement Health Savings(RHS) 430 466 430 430 - 0.0%
515200 - Medicare Retirement HealthSavings (RHS) - - - 2,000 2,000 100.0%
516000 - Savings Plan (401K) 14,196 16,175 13,898 19,909 6,011 43.3%
516500 - Deferred Compensation (457) 10,146 10,136 10,353 10,397 44 0.4%
519000 - Tuition Reimbursement - - 3,500 3,500 - 0.0%
521000 - Office Supplies 374 400 500 700 200 40.0%
522000 - General Operating Supplies 173 300 300 500 200 66.7%
525000 - Furniture/Fixture 49 - - 3,000 3,000 100.0%
526000 - Machinery/Equipment 1,115 400 500 2,300 1,800 360.0%
531000 - IT (Non-Consultant) Services 9,895 9,765 9,102 11,098 1,996 21.9%
531500 - Software Licenses - - - 800 800 100.0%
531600 - Software MaintenanceAgreements 570 1,020 1,020 - (1,020) (100.0%)
533000 - Legal 6,160 40,000 40,000 40,000 - 0.0%
536000 - Miscellaneous ProfessionalServices 75 2,600 2,600 3,000 400 15.4%
541000 - Advertising - 1,294 1,000 1,000 - 0.0%
542000 - Awards & Presentations 100 - 100 100 - 0.0%
544000 - Dues/Memberships/Certification 1,951 2,750 2,750 4,335 1,585 57.6%
545000 - Publications/ Resource Material 5,823 6,500 6,500 8,500 2,000 30.8%
1111 - Legal Services
216

General Fund Departmental BudgetsOffice of the City Attorney - Activity Analysis
FY22 Budget
Budget SummaryFY20
ActualsFY21
Projection
FY21AdoptedBudget
FY22AdoptedBudget Chg % Chg
By Object546000 - Conf./Seminar/ClassRegistration 1,574 2,000 4,000 5,875 1,875 46.9%
547000 - Travel Expense 744 500 3,500 4,500 1,000 28.6%
547100 - Local Travel Mileage 37 - - - - 0.0%
551100 - Cellular Phone 712 1,100 - 1,540 1,540 100.0%
553000 - Printing & Binding 128 500 250 250 - 0.0%
556000 - Postage 150 200 500 500 - 0.0%
556500 - Messenger Services - 200 200 200 - 0.0%
560000 - Miscellaneous 609 1,000 1,000 1,500 500 50.0%
561000 - Local - In-Service Meals 196 - 500 500 - 0.0%
Total 765,529 807,724 775,605 956,122 180,517 23.3%
Budget SummaryFY20
ActualsFY21
Projection
FY21AdoptedBudget
FY22AdoptedBudget Chg % Chg
By Object SummaryPersonnel Services 735,094 737,195 701,283 865,924 164,641 23.5%
Operating 30,435 70,529 74,322 90,198 15,876 21.4%
Total 765,529 807,724 775,605 956,122 180,517 23.3%
217

General Fund Departmental BudgetsOffice of the City Attorney - Activity Analysis
FY22 Budget
Budget SummaryFY20
ActualsFY21
Projection
FY21AdoptedBudget
FY22AdoptedBudget Chg % Chg
By Object509000 - Part-Time Wages - - - 20,260 20,260 100.0%
510000 - FICA Taxes - - - 1,550 1,550 100.0%
522000 - General Operating Supplies 466 - - 19,000 19,000 100.0%
526000 - Machinery/Equipment 778 - - - - 0.0%
536100 - Temporary Employment Agency 6,800 - - 2,000 2,000 100.0%
541000 - Advertising 791 - - 3,300 3,300 100.0%
553000 - Printing & Binding 5,889 - - 24,375 24,375 100.0%
554000 - Signage 1,106 - - 3,000 3,000 100.0%
556000 - Postage 13,865 - - 56,750 56,750 100.0%
560000 - Miscellaneous - - 5,000 500 (4,500) (90.0%)
561000 - Local - In-Service Meals 1,254 - - 300 300 100.0%
567000 - Rental & Use 22,993 - - 21,600 21,600 100.0%
572000 - R&M - Buildings & Facilities 4 - - - - 0.0%
Total 53,945 - 5,000 152,635 147,635 2,952.7%
Significant Changes
FY21AdoptedBudget
FY22AdoptedBudget
Increase /(Decrease)
Object - Object Name / Reason for Change
522000 - General Operating Supplies - 19,000 19,000
Increase due to cost of purchasing ballot drop boxes for the 2021 City Election.
553000 - Printing & Binding - 24,375 24,375
Increase due to cost for printing and processing mail-ballots for the 2021 City Election.
556000 - Postage - 56,750 56,750
Increase resulting from postage costs related to mail-in ballots for 2021 City Election.
567000 - Rental & Use - 21,600 21,600
Increase due to election equipment rental cost for conducting the 2021 City Election.
1122 - Registration & Elections
218
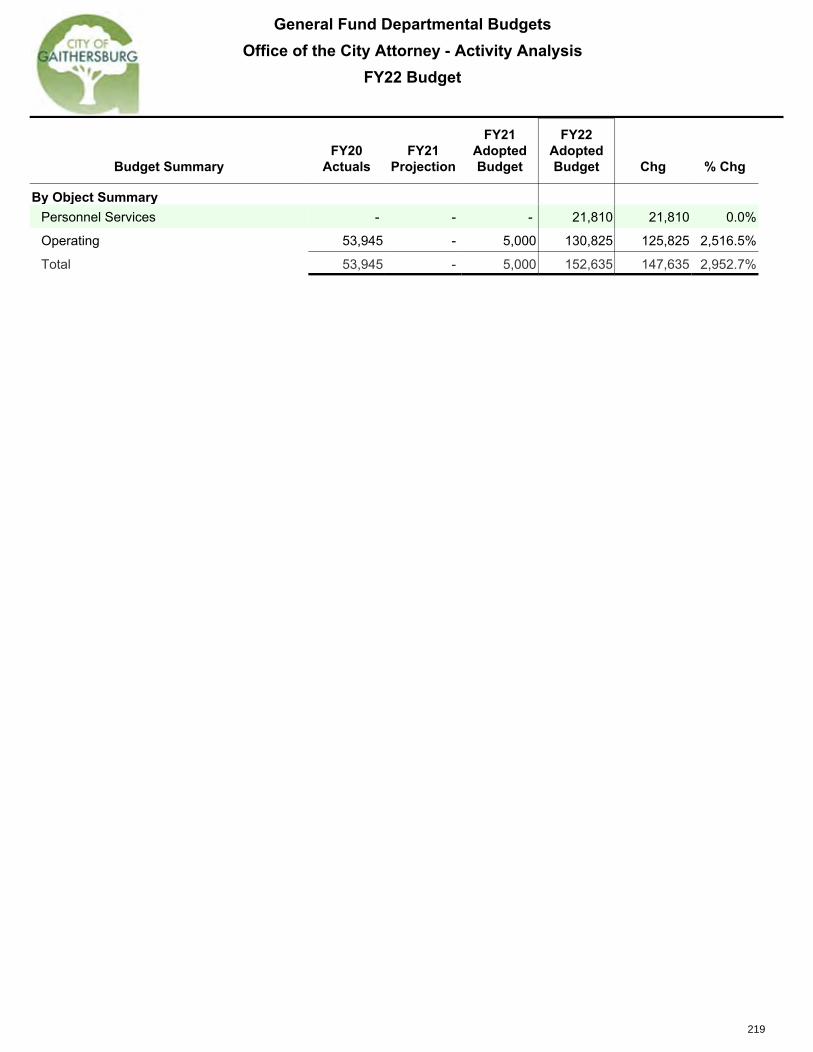
General Fund Departmental BudgetsOffice of the City Attorney - Activity Analysis
FY22 Budget
Budget SummaryFY20
ActualsFY21
Projection
FY21AdoptedBudget
FY22AdoptedBudget Chg % Chg
By Object SummaryPersonnel Services - - - 21,810 21,810 0.0%
Operating 53,945 - 5,000 130,825 125,825 2,516.5%
Total 53,945 - 5,000 152,635 147,635 2,952.7%
219
Farmers Market at Casey Community
Center
220

DEPARTMENT OF HUMAN RESOURCES
Director of Human Resources
Staffing Recruitment & Retention
Employee Training & Development
Benefits & Compensation
Performance Appraisals Safety & Health
Employee Relations
Policy Development
221

General Fund Departmental BudgetDepartment Overview - Human Resources
FY22 Budget
The Department of Human Resources is committed to providing quality services to all City Departments as well as ourcitizens. These services include: conducting recruitment of personnel, maintaining the classification of all positions,managing and administering all employee benefits, periodic analysis of compensation and benefit costs, administeringthe employee performance evaluation system, overseeing and managing worker's compensation and riskmanagement, and providing training to assure a safe and healthy work environment that stimulates the personal andprofessional development of all employees.
Services Provided
Human Resources Budget SummaryFY20
ActualsFY21
Projection
FY21AdoptedBudget
FY22AdoptedBudget Chg % Chg
By Activity1135 - Human Resources 1,200,622 1,191,237 1,235,488 1,270,651 35,163 2.8%
Total 1,200,622 1,191,237 1,235,488 1,270,651 35,163 2.8%
222

General Fund Departmental BudgetDepartment Overview - Human Resources
FY22 Budget
Human Resources Budget SummaryFY20
ActualsFY21
Projection
FY21AdoptedBudget
FY22AdoptedBudget Chg % Chg
By Object CategoryPersonnel Services 897,964 967,722 984,294 984,856 562 0.1%
Operating 302,657 223,515 251,194 285,795 34,601 13.8%
Capital - - - - - 0.0%
Total 1,200,622 1,191,237 1,235,488 1,270,651 35,163 2.8%
Departmental Personnel Schedule
FY20AdoptedBudget
FY21AdoptedBudget
FY22AdoptedBudget
1135 - Human Resources
Human Resources Generalist II 2 2 2
Human Resources Program Coordinator 2 2 2
Human Resources Technician 1 1 1
Director of Human Resources 1 1 1
Part-Time Personnel 0.52 0.94 0.51
Subtotal 6.52 6.94 6.51
Full-Time Personnel 6 6 6
Part-Time Personnel 0.52 0.94 0.51
Total 6.52 6.94 6.51
223

General Fund Departmental BudgetsHuman Resources - Activity Analysis
FY22 Budget
Budget SummaryFY20
ActualsFY21
Projection
FY21AdoptedBudget
FY22AdoptedBudget Chg % Chg
By Object501000 - Full-Time Wages 563,692 580,057 557,228 575,971 18,743 3.4%
505100 - Other Taxable Comp.-Multilingual 3,813 4,160 4,160 4,160 - 0.0%
505200 - Other Taxable Comp.-GFIT 560 1,680 1,344 1,344 - 0.0%
507000 - Vacation & Sick Payouts 15,302 7,882 - - - 0.0%
508000 - Overtime Wages 260 - - 510 510 100.0%
509000 - Part-Time Wages 5,231 - 60,203 15,795 (44,408) (73.8%)
510000 - FICA Taxes 42,415 44,823 48,137 46,322 (1,815) (3.8%)
512000 - State Unemployment Tax 428 - - - - 0.0%
514200 - Vision Benefit 110 540 405 497 92 22.7%
514210 - Health Insurance 71,004 98,408 63,053 96,649 33,596 53.3%
514220 - Dental Benefit 4,097 6,214 4,842 5,733 891 18.4%
514230 - Long-Term Care Benefit 554 864 870 930 60 6.9%
514240 - Life Ins and Disability Benefit 5,064 5,796 5,334 5,448 114 2.1%
514700 - Out of Pocket DeductibleReimbursement 115,446 150,000 160,000 160,000 - 0.0%
515000 - Retirement (401A) 44,997 46,404 46,438 47,997 1,559 3.4%
515100 - Retirement Health Savings(RHS) 5,220 - 9,368 - (9,368) (100.0%)
Significant Changes
FY21AdoptedBudget
FY22AdoptedBudget
Increase /(Decrease)
Object - Object Name / Reason for Change
522000 - General Operating Supplies 10,300 3,300 (7,000)
Decrease due to expense for City ID card replacement supplies purchased in FY21.
534500 - Wellness Programs 53,455 40,055 (13,400)
Decrease due to expenses for replacement money for all City AEDs, batteries, pads in FY21.
541000 - Advertising 12,000 20,000 8,000
Increase resulting from return to pre-pandemic funding.
542000 - Awards & Presentations 11,900 32,500 20,600
Increase due to return to pre-pandemic funding.
546300 - In-Service Training 12,500 45,700 33,200
Increase due to return to pre-pandemic funding and an increase of $20,000 for employee engagement efforts.
1135 - Human Resources
224

General Fund Departmental BudgetsHuman Resources - Activity Analysis
FY22 Budget
Budget SummaryFY20
ActualsFY21
Projection
FY21AdoptedBudget
FY22AdoptedBudget Chg % Chg
By Object515200 - Medicare Retirement HealthSavings (RHS) 1,616 1,992 2,000 2,000 - 0.0%
516000 - Savings Plan (401K) 16,937 17,402 17,412 18,000 588 3.4%
519000 - Tuition Reimbursement 1,218 1,500 3,500 3,500 - 0.0%
521000 - Office Supplies 2,302 800 1,000 600 (400) (40.0%)
522000 - General Operating Supplies 2,438 10,300 10,300 3,300 (7,000) (68.0%)
525000 - Furniture/Fixture 795 - 1,000 - (1,000) (100.0%)
526000 - Machinery/Equipment 969 32 1,700 500 (1,200) (70.6%)
531000 - IT (Non-Consultant) Services 82,335 71,200 75,710 74,136 (1,574) (2.1%)
531500 - Software Licenses 595 - 800 - (800) (100.0%)
531600 - Software MaintenanceAgreements 2,369 3,628 3,340 1,825 (1,515) (45.4%)
534500 - Wellness Programs 39,891 53,455 53,455 40,055 (13,400) (25.1%)
535000 - Medical/Hospital (Screenings) 28,815 15,000 26,500 26,500 - 0.0%
536000 - Miscellaneous ProfessionalServices 59,196 29,300 29,300 29,600 300 1.0%
536500 - Investigations 6,337 2,000 4,000 4,000 - 0.0%
541000 - Advertising 16,841 8,000 12,000 20,000 8,000 66.7%
542000 - Awards & Presentations 23,153 11,900 11,900 32,500 20,600 173.1%
544000 - Dues/Memberships/Certification 1,308 1,500 3,715 2,705 (1,010) (27.2%)
545000 - Publications/ Resource Material - 400 400 200 (200) (50.0%)
546000 - Conf./Seminar/ClassRegistration 2,417 1,000 - 600 600 100.0%
546300 - In-Service Training 30,453 12,500 12,500 45,700 33,200 265.6%
547000 - Travel Expense 53 - 950 950 - 0.0%
553000 - Printing & Binding 30 - - - - 0.0%
556000 - Postage 368 300 400 400 - 0.0%
560000 - Miscellaneous 1,759 2,000 2,000 2,000 - 0.0%
573000 - R&M - Machinery & Equipment 203 200 224 224 - 0.0%
574000 - R&M - Vehicles 29 - - - - 0.0%
Total 1,200,622 1,191,237 1,235,488 1,270,651 35,163 2.8%
225

General Fund Departmental BudgetsHuman Resources - Activity Analysis
FY22 Budget
Budget SummaryFY20
ActualsFY21
Projection
FY21AdoptedBudget
FY22AdoptedBudget Chg % Chg
By Object SummaryPersonnel Services 897,964 967,722 984,294 984,856 562 0.1%
Operating 302,657 223,515 251,194 285,795 34,601 13.8%
Total 1,200,622 1,191,237 1,235,488 1,270,651 35,163 2.8%
226

DEPARTMENT OF COMMUNITY & PUBLIC RELATIONS
Director of Community &
Public Relations
Public Information & Website
Municipal Cable TV Channel
Community Services
HomelessServices
227

General Fund Departmental BudgetDepartment Overview - Community & Public
RelationsFY22 Budget
The Department of Community & Public Relations is engaged in outreach and communications, disseminatinginformation, providing resources, and connecting residents to services. Activities within the Department include PublicInformation, Cable Television, Community Services, and Homeless Services.
The City of Gaithersburg informs and engages its residents using a variety of outlets, including a robust website, livemeeting broadcasts and video programming, social media, printed materials, advertising and marketing campaigns,emergency notification systems, community events, surveys, and volunteer recognition programs.
Through support services, outreach, education and grants, the City works to fortify a diverse community. Leveragingthe collaborative efforts of an extensive network of agencies, schools, volunteers, businesses and organizations,residents are provided with interim case coordination and are connected to education, nutrition, health and mentalhealth, crisis prevention, housing, vocational training and financial wellness programs, opportunities, and resources.
At the City’s transitional housing program for homeless men and women in recovery from substance use disorder,residents receive a variety of direct services and supports to aid in recovery and position them for successful transitionto permanent housing. A homeless advocacy and street outreach element connects people living on the streets withreferrals to addiction treatment, mental health and social service programs.
Services Provided
Community & Public Relations BudgetSummary
FY20Actuals
FY21Projection
FY21AdoptedBudget
FY22AdoptedBudget Chg % Chg
By Activity1212 - Public Information 973,566 1,008,022 998,658 1,026,503 27,845 2.8%
1213 - Gaithersburg Television 302,628 305,676 303,944 323,587 19,643 6.5%
1215 - Community Services 1,593,014 1,823,525 1,767,348 1,785,815 18,467 1.0%
1216 - Homeless Services 537,452 493,523 529,535 590,226 60,691 11.5%
Total 3,406,659 3,630,746 3,599,486 3,726,131 126,645 3.5%
228
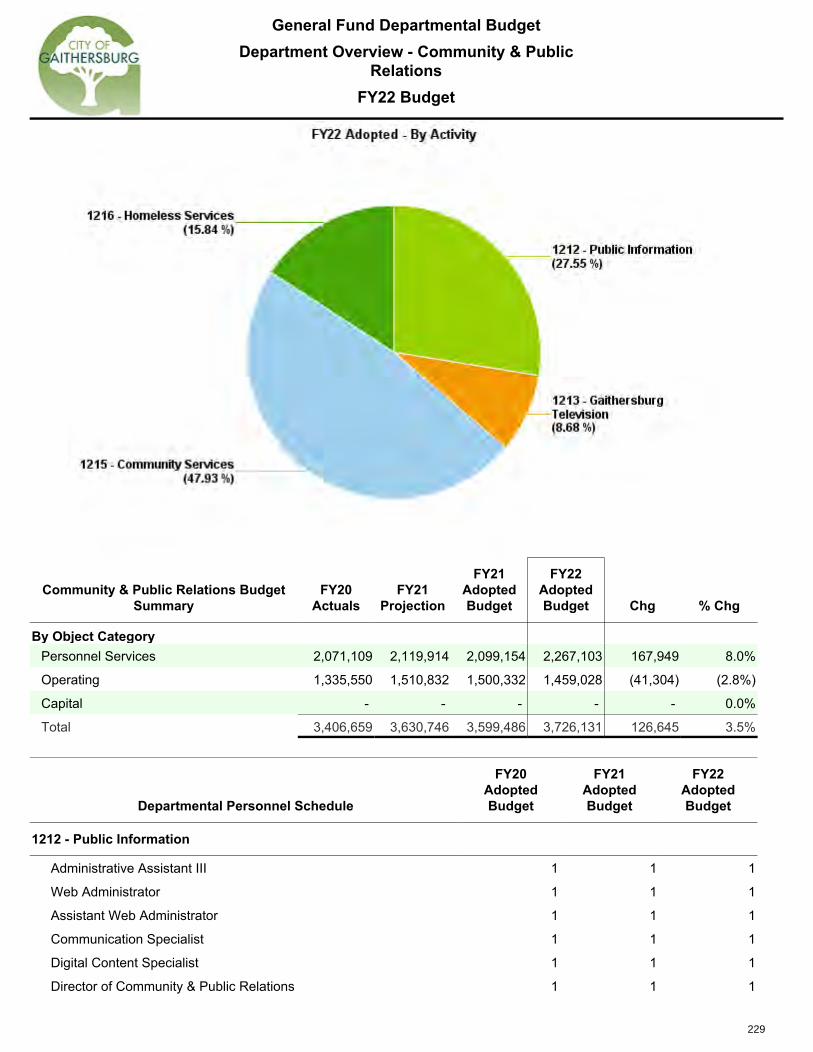
General Fund Departmental BudgetDepartment Overview - Community & Public
RelationsFY22 Budget
Community & Public Relations BudgetSummary
FY20Actuals
FY21Projection
FY21AdoptedBudget
FY22AdoptedBudget Chg % Chg
By Object CategoryPersonnel Services 2,071,109 2,119,914 2,099,154 2,267,103 167,949 8.0%
Operating 1,335,550 1,510,832 1,500,332 1,459,028 (41,304) (2.8%)
Capital - - - - - 0.0%
Total 3,406,659 3,630,746 3,599,486 3,726,131 126,645 3.5%
Departmental Personnel Schedule
FY20AdoptedBudget
FY21AdoptedBudget
FY22AdoptedBudget
1212 - Public Information
Administrative Assistant III 1 1 1
Web Administrator 1 1 1
Assistant Web Administrator 1 1 1
Communication Specialist 1 1 1
Digital Content Specialist 1 1 1
Director of Community & Public Relations 1 1 1
229

General Fund Departmental BudgetDepartment Overview - Community & Public
RelationsFY22 Budget
Departmental Personnel Schedule
FY20AdoptedBudget
FY21AdoptedBudget
FY22AdoptedBudget
Graphics Specialist 1 1 1
Part-Time Personnel 0.82 0.91 0.41
Subtotal 7.82 7.91 7.41
1213 - Gaithersburg Television
Television Production Specialist 1 1 1
Television Productions Manager 1 1 1
Part-Time Personnel 0.44 0.44 0.38
Subtotal 2.44 2.44 2.38
1215 - Community Services
Community Services Division Manager 1 1 1
Community Services Program Coordinator 2 2 1
Community Services Senior Program Coordinator 0 0 1
Community Services Case Coordinator 1 1 0
Community Services Case Worker 0 0 1
Community Services Project Manager 0 0 1
Part-Time Personnel 0.12 0.51 0.63
Subtotal 4.12 4.51 5.63
1216 - Homeless Services
House Manager 1 1 1
Primary Counselor 1 1 1
Homeless Services Division Manager 1 1 1
Clinical Supervisor/Discharge Coordinator 1 1 1
Part-Time Personnel 2.43 2.46 2.86
Subtotal 6.43 6.46 6.86
Full-Time Personnel 17 17 18
Part-Time Personnel 3.82 4.32 4.29
Total 20.82 21.32 22.29
230

General Fund Departmental BudgetsCommunity & Public Relations - Activity Analysis
FY22 Budget
Budget SummaryFY20
ActualsFY21
Projection
FY21AdoptedBudget
FY22AdoptedBudget Chg % Chg
By Object501000 - Full-Time Wages 595,716 628,902 603,244 624,436 21,192 3.5%
505100 - Other Taxable Comp.-Multilingual 2,080 2,080 2,080 2,080 - 0.0%
505200 - Other Taxable Comp.-GFIT 469 2,100 1,680 1,680 - 0.0%
505300 - Other Taxable Comp.-HousingStipend 9,300 6,500 9,600 6,000 (3,600) (37.5%)
507000 - Vacation & Sick Payouts 6,199 6,200 - - - 0.0%
508000 - Overtime Wages 417 100 898 505 (393) (43.8%)
509000 - Part-Time Wages 27,603 30,000 48,516 24,958 (23,558) (48.6%)
510000 - FICA Taxes 45,752 51,232 51,148 50,644 (504) (1.0%)
514200 - Vision Benefit 258 480 474 442 (32) (6.8%)
514210 - Health Insurance 87,425 95,248 93,013 93,545 532 0.6%
514220 - Dental Benefit 3,610 5,255 5,191 4,848 (343) (6.6%)
514230 - Long-Term Care Benefit 614 1,008 1,016 1,085 69 6.8%
514240 - Life Ins and Disability Benefit 5,441 6,290 5,866 5,978 112 1.9%
515000 - Retirement (401A) 47,590 50,313 50,271 52,037 1,766 3.5%
515100 - Retirement Health Savings(RHS) 1,447 5,095 - 4,977 4,977 100.0%
515200 - Medicare Retirement HealthSavings (RHS) 2,616 3,984 4,000 4,000 - 0.0%
516000 - Savings Plan (401K) 18,023 18,865 18,851 19,513 662 3.5%
521000 - Office Supplies 235 200 600 350 (250) (41.7%)
522000 - General Operating Supplies 142 - - - - 0.0%
522200 - Photo/Audio/Video Supplies - 250 250 250 - 0.0%
Significant Changes
FY21AdoptedBudget
FY22AdoptedBudget
Increase /(Decrease)
Object - Object Name / Reason for Change
531000 - IT (Non-Consultant) Services 42,510 49,297 6,787
Increase due to several software tools added to enhance social media opportunities, plus an increase in websitecontent management system annual expense, and movement of Microsoft licenses from 531600.
536000 - Miscellaneous Professional Services 4,000 23,000 19,000
Increased for biennial Citizen Survey.
1212 - Public Information
231

General Fund Departmental BudgetsCommunity & Public Relations - Activity Analysis
FY22 Budget
Budget SummaryFY20
ActualsFY21
Projection
FY21AdoptedBudget
FY22AdoptedBudget Chg % Chg
By Object522500 - Program Activities 434 1,200 2,200 2,200 - 0.0%
524000 - Supplies/Resale 646 1,000 2,100 1,000 (1,100) (52.4%)
525000 - Furniture/Fixture 1,774 - - - - 0.0%
526000 - Machinery/Equipment 454 - 1,000 1,000 - 0.0%
531000 - IT (Non-Consultant) Services 43,090 42,510 42,510 49,297 6,787 16.0%
531600 - Software MaintenanceAgreements 1,710 2,550 2,550 - (2,550) (100.0%)
536000 - Miscellaneous ProfessionalServices 23,156 2,000 4,000 23,000 19,000 475.0%
541000 - Advertising 2,196 2,400 2,400 3,400 1,000 41.7%
542000 - Awards & Presentations 150 50 50 50 - 0.0%
544000 - Dues/Memberships/Certification 1,070 2,090 2,090 1,998 (92) (4.4%)
545000 - Publications/ Resource Material 875 1,700 1,700 1,700 - 0.0%
546000 - Conf./Seminar/ClassRegistration 1,829 720 720 1,390 670 93.1%
547000 - Travel Expense 2,808 200 660 2,160 1,500 227.3%
551100 - Cellular Phone 3,584 3,500 4,480 4,480 - 0.0%
553000 - Printing & Binding 16,278 17,000 17,000 18,500 1,500 8.8%
554000 - Signage - 1,000 1,000 1,000 - 0.0%
556000 - Postage 17,568 15,000 15,000 17,000 2,000 13.3%
560000 - Miscellaneous 941 1,000 2,500 1,000 (1,500) (60.0%)
561000 - Local - In-Service Meals 67 - - - - 0.0%
Total 973,566 1,008,022 998,658 1,026,503 27,845 2.8%
Budget SummaryFY20
ActualsFY21
Projection
FY21AdoptedBudget
FY22AdoptedBudget Chg % Chg
By Object SummaryPersonnel Services 854,560 913,652 895,848 896,728 880 0.1%
Operating 119,006 94,370 102,810 129,775 26,965 26.2%
Total 973,566 1,008,022 998,658 1,026,503 27,845 2.8%
232

General Fund Departmental BudgetsCommunity & Public Relations - Activity Analysis
FY22 Budget
Budget SummaryFY20
ActualsFY21
Projection
FY21AdoptedBudget
FY22AdoptedBudget Chg % Chg
By Object501000 - Full-Time Wages 192,750 193,201 188,196 200,385 12,189 6.5%
507000 - Vacation & Sick Payouts 4,364 4,400 - - - 0.0%
509000 - Part-Time Wages 8,187 5,000 13,646 13,704 58 0.4%
510000 - FICA Taxes 14,768 15,164 16,041 16,377 336 2.1%
514200 - Vision Benefit 82 200 184 184 - 0.0%
514210 - Health Insurance 43,752 47,374 43,730 46,528 2,798 6.4%
514220 - Dental Benefit 3,758 2,850 2,630 2,630 - 0.0%
514230 - Long-Term Care Benefit 241 288 290 310 20 6.9%
514240 - Life Ins and Disability Benefit 1,864 1,933 1,908 1,933 25 1.3%
515000 - Retirement (401A) 15,420 15,456 15,683 16,031 348 2.2%
516000 - Savings Plan (401K) 5,782 5,796 5,881 6,012 131 2.2%
521000 - Office Supplies 50 50 50 50 - 0.0%
522200 - Photo/Audio/Video Supplies 207 1,000 2,800 2,800 - 0.0%
525000 - Furniture/Fixture 524 400 500 - (500) (100.0%)
526000 - Machinery/Equipment 2,667 1,000 1,000 2,000 1,000 100.0%
531000 - IT (Non-Consultant) Services 1,483 2,400 1,486 2,944 1,458 98.1%
531600 - Software MaintenanceAgreements 1,750 1,436 2,135 1,370 (765) (35.8%)
536000 - Miscellaneous ProfessionalServices 3,017 2,350 2,350 2,850 500 21.3%
544000 - Dues/Memberships/Certification - - - 2,190 2,190 100.0%
545000 - Publications/ Resource Material - - - 200 200 100.0%
546000 - Conf./Seminar/ClassRegistration - 469 500 100 (400) (80.0%)
547000 - Travel Expense - 25 25 50 25 100.0%
551100 - Cellular Phone 55 - - - - 0.0%
556000 - Postage - - 25 25 - 0.0%
560000 - Miscellaneous 69 250 250 250 - 0.0%
573000 - R&M - Machinery & Equipment 1,838 4,634 4,634 4,664 30 0.6%
Total 302,628 305,676 303,944 323,587 19,643 6.5%
1213 - Gaithersburg Television
233

General Fund Departmental BudgetsCommunity & Public Relations - Activity Analysis
FY22 Budget
Budget SummaryFY20
ActualsFY21
Projection
FY21AdoptedBudget
FY22AdoptedBudget Chg % Chg
By Object SummaryPersonnel Services 290,969 291,662 288,189 304,094 15,905 5.5%
Operating 11,659 14,014 15,755 19,493 3,738 23.7%
Total 302,628 305,676 303,944 323,587 19,643 6.5%
234

General Fund Departmental BudgetsCommunity & Public Relations - Activity Analysis
FY22 Budget
Budget SummaryFY20
ActualsFY21
Projection
FY21AdoptedBudget
FY22AdoptedBudget Chg % Chg
By Object501000 - Full-Time Wages 303,001 314,129 296,186 372,417 76,231 25.7%
505100 - Other Taxable Comp.-Multilingual 2,080 2,080 2,080 2,080 - 0.0%
505200 - Other Taxable Comp.-GFIT 45 840 336 1,008 672 200.0%
507000 - Vacation & Sick Payouts 4,061 4,100 - - - 0.0%
509000 - Part-Time Wages 5,129 16,111 16,111 3,406 (12,705) (78.9%)
510000 - FICA Taxes 23,501 25,485 25,020 31,911 6,891 27.5%
514200 - Vision Benefit 573 356 276 400 124 44.9%
514210 - Health Insurance 31,957 35,909 31,945 48,787 16,842 52.7%
514220 - Dental Benefit 3,022 3,002 2,206 3,440 1,234 55.9%
514230 - Long-Term Care Benefit 413 594 580 775 195 33.6%
514240 - Life Ins and Disability Benefit 2,979 3,177 3,075 3,874 799 26.0%
515000 - Retirement (401A) 24,240 25,131 24,682 31,035 6,353 25.7%
515100 - Retirement Health Savings(RHS) 9,392 10,474 9,406 9,524 118 1.3%
515200 - Medicare Retirement HealthSavings (RHS) - - - 2,000 2,000 100.0%
516000 - Savings Plan (401K) 6,940 7,108 7,038 9,215 2,177 30.9%
519000 - Tuition Reimbursement - 3,500 3,500 - (3,500) (100.0%)
521000 - Office Supplies 667 1,000 1,000 1,000 - 0.0%
522000 - General Operating Supplies 627 - - - - 0.0%
522500 - Program Activities 36,694 109,500 91,750 27,000 (64,750) (70.6%)
526000 - Machinery/Equipment 228 160 250 250 - 0.0%
531000 - IT (Non-Consultant) Services 12,100 12,159 11,890 13,166 1,276 10.7%
Significant Changes
FY21AdoptedBudget
FY22AdoptedBudget
Increase /(Decrease)
Object - Object Name / Reason for Change
522500 - Program Activities 91,750 27,000 (64,750)
Decreased due to contract with nonprofit for Financial Navigator Program ending May 30, 2021.
541000 - Advertising 14,000 1,500 (12,500)
Decreased due to reduction of monies for FY21 CFE Grant for the Financial Navigator Program. Grant ends May30, 2021.
1215 - Community Services
235

General Fund Departmental BudgetsCommunity & Public Relations - Activity Analysis
FY22 Budget
Budget SummaryFY20
ActualsFY21
Projection
FY21AdoptedBudget
FY22AdoptedBudget Chg % Chg
By Object531600 - Software MaintenanceAgreements 1,140 1,276 1,530 - (1,530) (100.0%)
536000 - Miscellaneous ProfessionalServices 6,146 10,150 10,150 10,150 - 0.0%
536300 - Contract Cleaning - 397 - - - 0.0%
536500 - Investigations 156 - - - - 0.0%
541000 - Advertising 29 14,000 14,000 1,500 (12,500) (89.3%)
542000 - Awards & Presentations 2,050 3,700 3,700 3,700 - 0.0%
543000 - Contributions 1,073,186 1,168,357 1,169,857 1,166,257 (3,600) (0.3%)
544000 - Dues/Memberships/Certification - - 100 100 - 0.0%
546000 - Conf./Seminar/ClassRegistration - 1,600 1,600 2,000 400 25.0%
546300 - In-Service Training 600 860 860 860 - 0.0%
547000 - Travel Expense 1,755 750 1,000 1,200 200 20.0%
551100 - Cellular Phone 1,074 720 720 2,260 1,540 213.9%
553000 - Printing & Binding 2,927 4,000 4,000 4,000 - 0.0%
556000 - Postage 1,359 750 1,000 1,000 - 0.0%
560000 - Miscellaneous 1,810 1,000 1,000 1,000 - 0.0%
568400 - Holiday Giving Expenditures 32,762 41,000 30,000 30,000 - 0.0%
573000 - R&M - Machinery & Equipment 373 150 500 500 - 0.0%
Total 1,593,014 1,823,525 1,767,348 1,785,815 18,467 1.0%
Budget SummaryFY20
ActualsFY21
Projection
FY21AdoptedBudget
FY22AdoptedBudget Chg % Chg
By Object SummaryPersonnel Services 417,332 451,996 422,441 519,872 97,431 23.1%
Operating 1,175,681 1,371,529 1,344,907 1,265,943 (78,964) (5.9%)
Total 1,593,014 1,823,525 1,767,348 1,785,815 18,467 1.0%
236

General Fund Departmental BudgetsCommunity & Public Relations - Activity Analysis
FY22 Budget
Budget SummaryFY20
ActualsFY21
Projection
FY21AdoptedBudget
FY22AdoptedBudget Chg % Chg
By Object501000 - Full-Time Wages 285,941 253,870 278,264 306,687 28,423 10.2%
505300 - Other Taxable Comp.-HousingStipend 2,200 - 2,400 - (2,400) (100.0%)
507000 - Vacation & Sick Payouts 3,826 3,884 - - - 0.0%
508000 - Overtime Wages 22,774 3,000 3,019 2,983 (36) (1.2%)
509000 - Part-Time Wages 83,978 103,000 97,533 109,589 12,056 12.4%
510000 - FICA Taxes 30,015 27,532 30,050 33,051 3,001 10.0%
514200 - Vision Benefit (39) 315 221 363 142 64.3%
514210 - Health Insurance 32,801 30,100 33,328 44,361 11,033 33.1%
514220 - Dental Benefit 3,359 3,536 3,951 3,901 (50) (1.3%)
514230 - Long-Term Care Benefit 683 486 580 620 40 6.9%
514240 - Life Ins and Disability Benefit 2,807 2,545 2,899 3,163 264 9.1%
515000 - Retirement (401A) 22,812 20,310 23,189 25,559 2,370 10.2%
515100 - Retirement Health Savings(RHS) 8,532 6,410 8,546 4,547 (3,999) (46.8%)
515200 - Medicare Retirement HealthSavings (RHS) - - - 2,000 2,000 100.0%
516000 - Savings Plan (401K) 8,559 7,616 8,695 9,585 890 10.2%
521000 - Office Supplies 844 600 900 900 - 0.0%
522000 - General Operating Supplies 4,418 4,000 5,600 5,600 - 0.0%
522500 - Program Activities 3,853 2,950 2,000 6,500 4,500 225.0%
525000 - Furniture/Fixture 516 - - 750 750 100.0%
526000 - Machinery/Equipment - 1,250 1,250 250 (1,000) (80.0%)
531000 - IT (Non-Consultant) Services - - - 3,852 3,852 100.0%
531500 - Software Licenses - 300 300 - (300) (100.0%)
531600 - Software MaintenanceAgreements 1,520 1,914 2,295 - (2,295) (100.0%)
536000 - Miscellaneous ProfessionalServices 1,850 4,100 4,100 5,150 1,050 25.6%
536500 - Investigations 156 - - - - 0.0%
542000 - Awards & Presentations 50 - - - - 0.0%
546300 - In-Service Training 90 - - - - 0.0%
551000 - Telephone (Landline) 579 600 1,160 1,160 - 0.0%
551100 - Cellular Phone 520 480 480 480 - 0.0%
1216 - Homeless Services
237

General Fund Departmental BudgetsCommunity & Public Relations - Activity Analysis
FY22 Budget
Budget SummaryFY20
ActualsFY21
Projection
FY21AdoptedBudget
FY22AdoptedBudget Chg % Chg
By Object552500 - Gasoline Expense 950 800 1,125 1,125 - 0.0%
553000 - Printing & Binding - - 200 200 - 0.0%
556000 - Postage 14 25 50 50 - 0.0%
560000 - Miscellaneous 13,560 13,000 16,500 16,500 - 0.0%
573000 - R&M - Machinery & Equipment - 300 300 300 - 0.0%
574000 - R&M - Vehicles 284 600 600 1,000 400 66.7%
Total 537,452 493,523 529,535 590,226 60,691 11.5%
Budget SummaryFY20
ActualsFY21
Projection
FY21AdoptedBudget
FY22AdoptedBudget Chg % Chg
By Object SummaryPersonnel Services 508,248 462,604 492,675 546,409 53,734 10.9%
Operating 29,203 30,919 36,860 43,817 6,957 18.9%
Total 537,452 493,523 529,535 590,226 60,691 11.5%
238

DEPARTMENT OF FINANCE & ADMINISTRATION
Director of Financeand Administration
Procurement & Purchasing
General Services
Non-Departmental
Budget
Accounting
Payroll
239

General Fund Departmental BudgetDepartment Overview - Finance &
AdministrationFY22 Budget
The Finance & Administration Division provides oversight of all City financial transactions and is specificallyresponsible for financial reporting, creation of the budget document and budget monitoring, payroll and accountspayable processing, procurement, and investments. Two other activities, 1149 General Services and 1911 Non-Departmental are shown within this section of the budget.The General Services activity is used for shared centralized costs such as office supplies and paper. The Non-Departmental activity is used for Citywide expenses that are not related to any department.
Services Provided
Finance & Administration Budget SummaryFY20
ActualsFY21
Projection
FY21AdoptedBudget
FY22AdoptedBudget Chg % Chg
By Activity1141 - Finance & Administration 1,508,730 1,486,957 1,679,537 1,690,418 10,881 0.6%
1149 - General Services 43,700 47,556 61,356 55,381 (5,975) (9.7%)
1911 - Non-Departmental 16,314,760 16,620,944 16,863,853 15,535,858 (1,327,995) (7.9%)
Total 17,867,190 18,155,457 18,604,746 17,281,657 (1,323,089) (7.1%)
240

General Fund Departmental BudgetDepartment Overview - Finance &
AdministrationFY22 Budget
Finance & Administration BudgetSummary
FY20Actuals
FY21Projection
FY21AdoptedBudget
FY22AdoptedBudget Chg % Chg
By Object CategoryPersonnel Services 2,076,749 2,212,581 2,631,676 2,838,270 206,594 7.9%
Operating 2,379,058 2,349,029 2,379,223 2,016,933 (362,290) (15.2%)
Capital - - - - - 0.0%
Transfers 13,411,383 13,093,847 13,093,847 11,926,454 (1,167,393) (8.9%)
Contingency - 500,000 500,000 500,000 - 0.0%
Total 17,867,190 18,155,457 18,604,746 17,281,657 (1,323,089) (7.1%)
Departmental Personnel Schedule
FY20AdoptedBudget
FY21AdoptedBudget
FY22AdoptedBudget
1141 - Finance & Administration
Administrative Assistant II 1 1 1
Accounting Specialist 1 1 1
Staff Accountant 1 0 0
Senior Budget Analyst 1 1 1
Procurement Manager 1 0 0
Procurement Specialist 0 0 1
Procurement Division Chief 1 1 1
Payroll Coordinator 1 1 1
Finance Systems Support Manager 0 1 0
Assistant Comptroller 1 0 0
Accountant II 0 1 1
Chief Accountant 0 1 1
Senior Accounting Technician 1 1 1
Director of Finance & Administration 1 1 1
Comptroller 1 1 1
Subtotal 11 11 11
Full-Time Personnel 11 11 11
Total 11 11 11
241

General Fund Departmental BudgetsFinance & Administration - Activity Analysis
FY22 Budget
Budget SummaryFY20
ActualsFY21
Projection
FY21AdoptedBudget
FY22AdoptedBudget Chg % Chg
By Object501000 - Full-Time Wages 858,727 789,864 951,156 963,678 12,522 1.3%
505200 - Other Taxable Comp.-GFIT 922 1,680 2,268 1,680 (588) (25.9%)
505300 - Other Taxable Comp.-HousingStipend 9,400 11,700 9,600 10,800 1,200 12.5%
507000 - Vacation & Sick Payouts 9,352 14,624 - - - 0.0%
508000 - Overtime Wages 2,075 2,000 200 600 400 200.0%
510000 - FICA Taxes 63,610 61,602 75,074 77,794 2,720 3.6%
514200 - Vision Benefit 164 861 905 953 48 5.3%
514210 - Health Insurance 136,769 141,797 157,600 168,838 11,238 7.1%
514220 - Dental Benefit 7,600 8,703 9,503 9,614 111 1.2%
514230 - Long-Term Care Benefit 1,104 1,302 1,583 1,705 122 7.7%
514240 - Life Ins and Disability Benefit 7,454 8,050 9,356 9,671 315 3.4%
515000 - Retirement (401A) 83,767 63,192 79,263 80,306 1,043 1.3%
515100 - Retirement Health Savings (RHS) 6,168 5,488 4,703 4,977 274 5.8%
515200 - Medicare Retirement HealthSavings (RHS) 7,462 8,043 11,833 12,000 167 1.4%
516000 - Savings Plan (401K) 23,255 23,697 29,724 30,115 391 1.3%
519000 - Tuition Reimbursement 3,216 3,500 3,500 3,500 - 0.0%
521000 - Office Supplies 5,940 4,250 4,500 4,400 (100) (2.2%)
525000 - Furniture/Fixture 150 500 1,000 2,300 1,300 130.0%
526000 - Machinery/Equipment 482 1,000 1,500 1,400 (100) (6.7%)
530000 - Accounting & Audit 47,000 66,500 47,000 60,500 13,500 28.7%
531000 - IT (Non-Consultant) Services 24,578 70,678 70,678 40,141 (30,537) (43.2%)
Significant Changes
FY21AdoptedBudget
FY22AdoptedBudget
Increase /(Decrease)
Object - Object Name / Reason for Change
530000 - Accounting & Audit 47,000 60,500 13,500
Increase includes $10K for expected Single Audit services.
531000 - IT (Non-Consultant) Services 70,678 40,141 (30,537)
Decrease due to FY21 including $35K for Kronos upgrade.
1141 - Finance & Administration
242

General Fund Departmental BudgetsFinance & Administration - Activity Analysis
FY22 Budget
Budget SummaryFY20
ActualsFY21
Projection
FY21AdoptedBudget
FY22AdoptedBudget Chg % Chg
By Object531600 - Software MaintenanceAgreements 104,309 98,791 98,791 95,986 (2,805) (2.8%)
536000 - Miscellaneous ProfessionalServices 75,537 73,400 73,400 73,580 180 0.2%
541000 - Advertising 3,035 3,500 3,500 3,500 - 0.0%
542000 - Awards & Presentations 1,185 1,185 1,185 1,185 - 0.0%
544000 - Dues/Memberships/Certification 4,618 3,200 3,465 3,595 130 3.8%
545000 - Publications/ Resource Material 578 300 500 350 (150) (30.0%)
546000 - Conf./Seminar/Class Registration 4,848 5,500 6,500 6,700 200 3.1%
547000 - Travel Expense 8,459 500 8,850 8,000 (850) (9.6%)
551100 - Cellular Phone 2,329 700 1,200 1,200 - 0.0%
553000 - Printing & Binding 30 - - - - 0.0%
556000 - Postage 3,131 3,500 4,000 4,000 - 0.0%
556500 - Messenger Services 234 150 - 150 150 100.0%
560000 - Miscellaneous 665 750 750 750 - 0.0%
573000 - R&M - Machinery & Equipment 577 6,450 6,450 6,450 - 0.0%
Total 1,508,730 1,486,957 1,679,537 1,690,418 10,881 0.6%
Budget SummaryFY20
ActualsFY21
Projection
FY21AdoptedBudget
FY22AdoptedBudget Chg % Chg
By Object SummaryPersonnel Services 1,221,046 1,146,103 1,346,268 1,376,231 29,963 2.2%
Operating 287,684 340,854 333,269 314,187 (19,082) (5.7%)
Total 1,508,730 1,486,957 1,679,537 1,690,418 10,881 0.6%
243

General Fund Departmental BudgetsFinance & Administration - Activity Analysis
FY22 Budget
Budget SummaryFY20
ActualsFY21
Projection
FY21AdoptedBudget
FY22AdoptedBudget Chg % Chg
By Object521000 - Office Supplies 11,149 8,000 12,500 10,500 (2,000) (16.0%)
531000 - IT (Non-Consultant) Services 3,865 3,740 3,740 3,865 125 3.3%
531600 - Software MaintenanceAgreements 16,852 16,850 16,850 16,850 - 0.0%
552500 - Gasoline Expense - 200 200 200 - 0.0%
553000 - Printing & Binding - 2,500 5,500 5,500 - 0.0%
556000 - Postage (447) 4,000 6,000 5,000 (1,000) (16.7%)
560000 - Miscellaneous 1,053 - - 1,000 1,000 100.0%
567000 - Rental & Use 1,547 1,600 5,900 1,800 (4,100) (69.5%)
573000 - R&M - Machinery & Equipment 9,681 10,666 10,666 10,666 - 0.0%
Total 43,700 47,556 61,356 55,381 (5,975) (9.7%)
Budget SummaryFY20
ActualsFY21
Projection
FY21AdoptedBudget
FY22AdoptedBudget Chg % Chg
By Object SummaryOperating 43,700 47,556 61,356 55,381 (5,975) (9.7%)
Total 43,700 47,556 61,356 55,381 (5,975) (9.7%)
1149 - General Services
244

General Fund Departmental BudgetsFinance & Administration - Activity Analysis
FY22 Budget
Budget SummaryFY20
ActualsFY21
Projection
FY21AdoptedBudget
FY22AdoptedBudget Chg % Chg
By Object507000 - Vacation & Sick Payouts - - 354,000 375,000 21,000 5.9%
512000 - State Unemployment Tax 508 145,570 10,500 65,000 54,500 519.0%
513000 - Workers' Comp. 407,721 542,048 542,048 603,179 61,131 11.3%
513100 - Employee Advance/ Worker'sComp. 1,072 - - - - 0.0%
514000 - Group Health/Life Insurance 1,225 - - - - 0.0%
514100 - Group Insurance/Retirees 6,160 - - - - 0.0%
514200 - Vision Benefit 2,329 2,300 2,300 2,300 - 0.0%
514210 - Health Insurance 403,630 360,000 360,000 400,000 40,000 11.1%
514220 - Dental Benefit 18,494 16,560 16,560 16,560 - 0.0%
514300 - Retiree Share/Insurance 13,628 - - - - 0.0%
Significant Changes
FY21AdoptedBudget
FY22AdoptedBudget
Increase /(Decrease)
Object - Object Name / Reason for Change
544000 - Dues/Memberships/Certification 154,733 109,765 (44,968)
Decrease due to Metropolitan Washington Council of Governments (MWCOG) dues for public safety initiativeswere moved to activity 1211, Police.
560000 - Miscellaneous 203,780 182,325 (21,455)
Decrease in Hotel & Motel tax due to reduced revenue.
563000 - Insurance - Not Payroll 387,000 408,600 21,600
Additional funding required for 8% increase in Premiums and estimated claims and deductibles.
564000 - Tax Abatement 360,725 63,315 (297,410)
Decrease resulting from the Asbury Tax Abatement expiring after FY21.
589300 - Transfer to Capital Funds 7,165,000 4,970,907 (2,194,093)
Transfers to CIP from the General Fund was reduced as part of the funding needed for FY22 was covered bythe transfer to CIP from Stormwater.
589350 - Transfer to Asset Replacement 2,319,300 3,146,000 826,700
Increase in the transfer of funds is due to numerous assets added which accounted for sizeable increases inFY20 and FY21; In addition, the transfer is catching up for the prior year in which some funding was decreaseddue to the pandemic reductions.
589853 - Transfer to OPEB 3,200,000 3,400,000 200,000
Scheduled increase in transfer per valuation report.
1911 - Non-Departmental
245

General Fund Departmental BudgetsFinance & Administration - Activity Analysis
FY22 Budget
Budget SummaryFY20
ActualsFY21
Projection
FY21AdoptedBudget
FY22AdoptedBudget Chg % Chg
By Object514600 - Cobra Coverage 935 - - - - 0.0%
522000 - General Operating Supplies 47 - - - - 0.0%
530000 - Accounting & Audit 30,408 34,000 32,000 35,000 3,000 9.4%
536000 - Miscellaneous ProfessionalServices 856,680 840,560 840,560 842,560 2,000 0.2%
543000 - Contributions 5,000 5,000 5,000 5,000 - 0.0%
544000 - Dues/Memberships/Certification 151,364 151,364 154,733 109,765 (44,968) (29.1%)
551100 - Cellular Phone (98) - - - - 0.0%
553000 - Printing & Binding 427 800 800 800 - 0.0%
560000 - Miscellaneous 352,827 203,780 203,780 182,325 (21,455) (10.5%)
563000 - Insurance - Not Payroll 353,254 387,000 387,000 408,600 21,600 5.6%
564000 - Tax Abatement 297,765 338,115 360,725 63,315 (297,410) (82.4%)
580000 - Contingency - 500,000 500,000 500,000 - 0.0%
589201 - Transfer to Stormwater 1,233,383 169,547 169,547 169,547 - 0.0%
589202 - Transfer to Housing 240,000 240,000 240,000 240,000 - 0.0%
589300 - Transfer to Capital Funds 6,350,000 7,165,000 7,165,000 4,970,907 (2,194,093) (30.6%)
589350 - Transfer to Asset Replacement 2,488,000 2,319,300 2,319,300 3,146,000 826,700 35.6%
589853 - Transfer to OPEB 3,100,000 3,200,000 3,200,000 3,400,000 200,000 6.3%
Total 16,314,760 16,620,944 16,863,853 15,535,858 (1,327,995) (7.9%)
Budget SummaryFY20
ActualsFY21
Projection
FY21AdoptedBudget
FY22AdoptedBudget Chg % Chg
By Object SummaryPersonnel Services 855,703 1,066,478 1,285,408 1,462,039 176,631 13.7%
Operating 2,047,674 1,960,619 1,984,598 1,647,365 (337,233) (17.0%)
Transfers 13,411,383 13,093,847 13,093,847 11,926,454 (1,167,393) (8.9%)
Contingency - 500,000 500,000 500,000 - 0.0%
Total 16,314,760 16,620,944 16,863,853 15,535,858 (1,327,995) (7.9%)
246

DEPARTMENT OF INFORMATION TECHNOLOGY
Director of Information Technology
Project Management Server/Network Operations
Systems Integration & Development
Technical Administration
Technical Research & Planning Telecommunications
Helpdesk Geographic Information Systems
Technical and Information Security
247

General Fund Departmental BudgetDepartment Overview - Information
TechnologyFY22 Budget
The Information Technology Department consists of the Information Technology activity and the GeographicInformation Systems activity.
The Information Technology activity provides for personnel and operating costs associated with the City's computerequipment, technical systems, telephone systems, and related information systems which generally benefit alldepartments. This activity also provides project management services for technically-related projects.
The Geographic Information Systems (GIS) activity supports users in utilizing GIS data and software. GIS is usedCitywide by departments to collect, organize, search, analyze, and visualize various geospatial-based information setsto aid better decision making. With this activity, we provide GIS software licenses and services, GIS data purchasesand subscriptions, GIS user support and training, and GIS map services and applications.
Services Provided
Information Technology Budget SummaryFY20
ActualsFY21
Projection
FY21AdoptedBudget
FY22AdoptedBudget Chg % Chg
By Activity1145 - Information Technology 1,809,421 1,940,210 1,933,582 2,043,467 109,885 5.7%
1146 - Geographic Information Systems 326,546 339,528 346,112 317,449 (28,663) (8.3%)
Total 2,135,968 2,279,738 2,279,694 2,360,916 81,222 3.6%
248

General Fund Departmental BudgetDepartment Overview - Information
TechnologyFY22 Budget
Information Technology BudgetSummary
FY20Actuals
FY21Projection
FY21AdoptedBudget
FY22AdoptedBudget Chg % Chg
By Object CategoryPersonnel Services 1,762,980 1,880,025 1,840,884 1,837,058 (3,826) (0.2%)
Operating 372,988 399,713 438,810 523,858 85,048 19.4%
Capital - - - - - 0.0%
Total 2,135,968 2,279,738 2,279,694 2,360,916 81,222 3.6%
Departmental Personnel Schedule
FY20AdoptedBudget
FY21AdoptedBudget
FY22AdoptedBudget
1145 - Information Technology
Network Operations Specialist I 2 2 2
Network Operations Specialist II 1 0 0
Network Operations Specialist III 0 1 1
IT Project Manager I 1 1 1
IT Project Manager III 2 2 2
Network Operations Division Manager 1 1 1
Business Systems Division Manager 1 1 1
Helpdesk Technician I 2 3 3
Helpdesk Manager 1 1 1
Director of Information Technology 1 1 1
Part-Time Personnel 0.92 0.92 0
Subtotal 12.92 13.92 13
1146 - Geographic Information Systems
GIS Division Manager 1 1 1
GIS Specialist I 1 0 0
GIS Specialist II 0 1 1
Part-Time Personnel 0.12 0 0
Subtotal 2.12 2 2
Full-Time Personnel 14 15 15
Part-Time Personnel 1.04 0.92 0
Total 15.04 15.92 15
249

General Fund Departmental BudgetsInformation Technology - Activity Analysis
FY22 Budget
Budget SummaryFY20
ActualsFY21
Projection
FY21AdoptedBudget
FY22AdoptedBudget Chg % Chg
By Object501000 - Full-Time Wages 1,078,666 1,159,755 1,113,137 1,153,600 40,463 3.6%
505200 - Other Taxable Comp.-GFIT 765 1,260 1,680 1,008 (672) (40.0%)
505300 - Other Taxable Comp.-HousingStipend 1,200 - - - - 0.0%
507000 - Vacation & Sick Payouts 17,714 11,278 - - - 0.0%
508000 - Overtime Wages 5,228 8,000 14,000 12,000 (2,000) (14.3%)
509000 - Part-Time Wages 24,607 - 27,580 - (27,580) (100.0%)
510000 - FICA Taxes 81,774 89,430 90,023 91,015 992 1.1%
514200 - Vision Benefit 249 1,000 982 921 (61) (6.2%)
514210 - Health Insurance 149,699 179,658 164,107 176,445 12,338 7.5%
514220 - Dental Benefit 5,556 12,353 11,911 11,398 (513) (4.3%)
514230 - Long-Term Care Benefit 1,771 1,872 1,886 2,015 129 6.8%
514240 - Life Ins and Disability Benefit 9,602 11,451 10,635 10,889 254 2.4%
Significant Changes
FY21AdoptedBudget
FY22AdoptedBudget
Increase /(Decrease)
Object - Object Name / Reason for Change
531000 - IT (Non-Consultant) Services 84,305 165,414 81,109
IT Services increased by more than $39,000 for a combination of many reasons. First, several softwarepackages (Microsoft, Netmotion) moved to a subscription model and as a result costs for users moved to531000 from 531600 ($9,200). In addition, the change to Work-From-Home due to the pandemic led to theaddition of costs for several services, including VNC Connect, GoToMeeting, and Zoom ($14,350). Finally, toimprove the reliability of its network connectivity, the City is adding a second Internet connection ($10,000)
531600 - Software Maintenance Agreements 93,255 75,949 (17,306)
Software Maintenance Agreements decreased because several software packages (Microsoft, Netmotion)moved to a subscription model and as a result costs for users moved to 531000 from 531600 ($9,200). Inaddition, maintenance costs for backup software were cut by $11,400 as the City moves to another product.
551000 - Telephone (Landline) 32,500 38,480 5,980
Telephone (Landline) costs increased due to the move to a more expensive SIP service after the one used bythe City for the past 5 years was shut down by the vendor, and due to the increased use of conference calls.
573000 - R&M - Machinery & Equipment 61,917 86,278 24,361
Repairs and Maintenance increased by $24,361 due to additional costs for an expanding network, inclusion ofcosts for the City's telephone system after the first five years had been covered by the initial implementation ofthe system, and the addition of anticipated costs for two new antenna systems in the new building at 16 S.Summit Avenue.
1145 - Information Technology
250

General Fund Departmental BudgetsInformation Technology - Activity Analysis
FY22 Budget
Budget SummaryFY20
ActualsFY21
Projection
FY21AdoptedBudget
FY22AdoptedBudget Chg % Chg
By Object515000 - Retirement (401A) 86,256 92,782 92,761 96,134 3,373 3.6%
515100 - Retirement Health Savings(RHS) 7,877 4,629 13,250 4,547 (8,703) (65.7%)
515200 - Medicare Retirement HealthSavings (RHS) 3,308 5,976 6,000 6,000 - 0.0%
516000 - Savings Plan (401K) 27,377 31,833 31,783 32,979 1,196 3.8%
519000 - Tuition Reimbursement 3,500 3,500 3,500 3,500 - 0.0%
521000 - Office Supplies 43 50 1,700 500 (1,200) (70.6%)
522000 - General Operating Supplies 26 - - - - 0.0%
525000 - Furniture/Fixture 2,044 - 500 500 - 0.0%
526000 - Machinery/Equipment 25,975 23,000 28,000 28,000 - 0.0%
531000 - IT (Non-Consultant) Services 61,968 84,000 84,305 165,414 81,109 96.2%
531500 - Software Licenses 15,343 15,000 15,000 15,000 - 0.0%
531600 - Software MaintenanceAgreements 91,813 93,000 93,255 75,949 (17,306) (18.6%)
536000 - Miscellaneous ProfessionalServices - 3,000 3,000 3,000 - 0.0%
536500 - Investigations 250 - - - - 0.0%
542000 - Awards & Presentations 50 150 - - - 0.0%
545000 - Publications/ Resource Material - - 100 100 - 0.0%
546000 - Conf./Seminar/ClassRegistration 11,125 2,000 14,500 12,000 (2,500) (17.2%)
547000 - Travel Expense 5,443 - 5,600 5,600 - 0.0%
551000 - Telephone (Landline) 25,611 31,500 32,500 38,480 5,980 18.4%
551100 - Cellular Phone 10,021 9,320 9,320 9,320 - 0.0%
552500 - Gasoline Expense 136 113 - 175 175 100.0%
556000 - Postage 130 200 50 100 50 100.0%
556500 - Messenger Services 27 100 100 100 - 0.0%
560000 - Miscellaneous 329 500 500 500 - 0.0%
573000 - R&M - Machinery & Equipment 53,926 63,000 61,917 86,278 24,361 39.3%
574000 - R&M - Vehicles 11 500 - - - 0.0%
Total 1,809,421 1,940,210 1,933,582 2,043,467 109,885 5.7%
251

General Fund Departmental BudgetsInformation Technology - Activity Analysis
FY22 Budget
Budget SummaryFY20
ActualsFY21
Projection
FY21AdoptedBudget
FY22AdoptedBudget Chg % Chg
By Object SummaryPersonnel Services 1,505,150 1,614,777 1,583,235 1,602,451 19,216 1.2%
Operating 304,271 325,433 350,347 441,016 90,669 25.9%
Total 1,809,421 1,940,210 1,933,582 2,043,467 109,885 5.7%
252

General Fund Departmental BudgetsInformation Technology - Activity Analysis
FY22 Budget
Budget SummaryFY20
ActualsFY21
Projection
FY21AdoptedBudget
FY22AdoptedBudget Chg % Chg
By Object501000 - Full-Time Wages 191,530 197,233 191,531 165,946 (25,585) (13.4%)
505200 - Other Taxable Comp.-GFIT 405 420 336 336 - 0.0%
509000 - Part-Time Wages 3,075 - - - - 0.0%
510000 - FICA Taxes 14,318 15,121 15,288 15,658 370 2.4%
514200 - Vision Benefit (23) 140 129 129 - 0.0%
514210 - Health Insurance 24,876 26,940 24,867 26,458 1,591 6.4%
514220 - Dental Benefit 171 1,432 1,321 1,321 - 0.0%
514230 - Long-Term Care Benefit 205 288 290 310 20 6.9%
514240 - Life Ins and Disability Benefit 1,856 1,978 1,941 1,971 30 1.5%
515000 - Retirement (401A) 15,322 15,778 15,961 16,348 387 2.4%
516000 - Savings Plan (401K) 6,095 5,918 5,985 6,130 145 2.4%
521000 - Office Supplies 9 - 50 50 - 0.0%
525000 - Furniture/Fixture - - 250 250 - 0.0%
526000 - Machinery/Equipment 31 500 500 500 - 0.0%
531000 - IT (Non-Consultant) Services 6,933 13,000 19,133 16,407 (2,726) (14.2%)
531500 - Software Licenses 197 - 2,000 1,000 (1,000) (50.0%)
531600 - Software MaintenanceAgreements 54,258 56,300 56,285 56,075 (210) (0.4%)
542000 - Awards & Presentations - 50 50 50 - 0.0%
544000 - Dues/Memberships/Certification 50 50 300 100 (200) (66.7%)
545000 - Publications/ Resource Material 75 - 200 150 (50) (25.0%)
546000 - Conf./Seminar/ClassRegistration 2,390 3,300 3,970 3,850 (120) (3.0%)
546300 - In-Service Training 90 - - - - 0.0%
547000 - Travel Expense 3,963 - 3,850 1,750 (2,100) (54.5%)
551100 - Cellular Phone 569 480 1,200 960 (240) (20.0%)
556000 - Postage 10 25 - 25 25 100.0%
556500 - Messenger Services - - 50 50 - 0.0%
560000 - Miscellaneous 143 50 100 100 - 0.0%
573000 - R&M - Machinery & Equipment - 525 525 1,525 1,000 190.5%
Total 326,546 339,528 346,112 317,449 (28,663) (8.3%)
1146 - Geographic Information Systems
253

General Fund Departmental BudgetsInformation Technology - Activity Analysis
FY22 Budget
Budget SummaryFY20
ActualsFY21
Projection
FY21AdoptedBudget
FY22AdoptedBudget Chg % Chg
By Object SummaryPersonnel Services 257,830 265,248 257,649 234,607 (23,042) (8.9%)
Operating 68,717 74,280 88,463 82,842 (5,621) (6.4%)
Total 326,546 339,528 346,112 317,449 (28,663) (8.3%)
254

DEPARTMENT OF PARKS, RECREATION & CULTURE
Director of Parks, Recreation &
Culture
RecreationServices
Sports & Youth Services
Facilities & Administrative
Services
Cultural Events & Services
255

General Fund Departmental BudgetDepartment Overview - Parks, Recreation & Culture
FY22 Budget
The Facilities and Administrative Services Division is supported by the following four activities. Parks, Recreation andCulture Administration - 1411 provides the necessary budget, equipment, training, personnel, and support to theDepartment to maintain excellent services for the community. The most important functions are associated with thestrategic directions supported by the department, as well as implementation of projects outlined in the Parks andRecreation Master Plan. Activity Center - 1426 provides a multipurpose recreation facility that hosts City events,programs and activities; provides opportunities for individuals and organizations to use a well-maintained facility forrental functions; and offers a well-equipped fitness center. Miniature Golf - 1428 provides staff, supplies, programs, andassociated expenses for course operations. The Miniature Golf Course (open May-October) is known for its beautifullandscaping and waterfall, and it is a popular destination for birthday parties and group rentals. Picnic Pavilions - 1429provides multi-use picnic pavilions for City functions and for rental use by individuals, groups or organizations for avariety of activities and events. Pavilions are available for use April-October and include three pavilions at Bohrer Parkand one at Griffith Park.
The Sports and Youth Services Division is supported by the following six activities. Recreation Programs and SportsServices - 1415 provides and encourages all to seek and participate in lifetime programs that benefit participantsphysically, mentally and socially. Youth Services - 1417 provides fun, safe and enriching after-school and weekendactivities that promote positive youth development through recreation, mentoring, leadership, and support. Through theCity’s Summer Camp Program - 1418 children ages 6 - 14 experience a variety of activities including sports, games,swimming, and arts and crafts activities in an environment that is fun, safe and stimulating. The Youth Centers atRobertson Park - 1419 and Olde Towne - 1424 provide after-school, weekend and summer activities for middle andhigh school aged youth. The Skate Park - 1420 facility provides a unique recreational opportunity for inline skaters,BMX bikes and skateboarders.
The Cultural Events and Services Division is supported by the following five activities. Arts Barn - 1423 providesperformances and enriching experiences in the performing and visual arts, and arts educational opportunities in avariety of mediums. Winter Lights - 1430 provides the community with the annual holiday tradition of a 3.5 mile drivethrough lights experience and a variety of special event nights. Special Events - 1436 provides for a diverse variety ofregional and community events and programs including Oktoberfest, Gaithersburg Book Festival, SummerFest andFireworks, Gaithersburg Chorus, parades, markets, commemorative ceremonies, outdoor concerts, and more.Museums - 1437 supports exhibits, events and programs at the Community Museum, Latitude Observatory and OldeTowne Plaza. Kentlands Mansion - 1438 supports an elegant facility for private rental events and City programs suchas concerts, dances, dinner theater, and family-themed events.
The Recreation Services Division is supported by the following five activities. The City’s Recreation Class Program-1416 provides the community opportunities to engage in diverse interests including dance, health and wellness, finearts, and special interests. Casey Community Center - 1421 serves as a location for civic, social and recreationalactivities for the community. The Water Park - 1422 operates annually Memorial Day to Labor Day providing aquaticexperiences for water exercise, summer camps, members, and daily admission patrons. The Gaithersburg AquaticCenter - 1427 (jointly operated with the Montgomery County Public Schools) provides the community with waterexercise, lessons and recreational/lap swimming for all ages and skill levels. The Benjamin Gaither Center - 1425provides programs and services for adults 55 years of age and older. The Center facilitates opportunities for seniors tobuild friendships and participate in a wide variety of educational, recreational, wellness, and social service programs.
Services Provided
256

General Fund Departmental BudgetDepartmental Summary - Parks, Recreation & Culture
FY22 Budget
Parks, Recreation & Culture BudgetSummary
FY20Actuals
FY21Projection
FY21AdoptedBudget
FY22AdoptedBudget Chg % Chg
411 - Facilities & Admin Division
1411 - Parks, Recreation & CultureAdministration 935,638 752,886 893,191 1,306,244 413,053 46.2%
1426 - Activity Center 507,773 415,631 560,114 571,637 11,523 2.1%
1428 - Miniature Golf Course 98,927 93,378 105,900 108,018 2,118 2.0%
1429 - Picnic Pavilions 18,254 5,140 26,139 27,677 1,538 5.9%
411 - Facilities & Admin Division 1,560,592 1,267,035 1,585,345 2,013,576 428,231 27.0%
412 - Recreation Services Division
1416 - Recreation Classes 249,580 118,330 289,579 255,352 (34,227) (11.8%)
1421 - Casey Community Center 342,975 205,303 403,082 405,310 2,228 0.6%
1422 - Water Park 536,687 706,085 900,784 796,257 (104,527) (11.6%)
1425 - Benjamin Gaither Center (SeniorsProgram) 727,548 404,522 824,804 752,798 (72,006) (8.7%)
1427 - Gaithersburg Aquatic Center 290,357 251,997 346,547 362,505 15,958 4.6%
412 - Recreation Services Division 2,147,147 1,686,237 2,764,796 2,572,222 (192,574) (7.0%)
413 - Cultural Events & Services Division
1423 - Gaithersburg Arts Barn 382,993 291,732 507,187 474,088 (33,099) (6.5%)
1430 - Winter Lights 194,696 195,245 231,544 256,875 25,331 10.9%
1436 - Special Events 1,048,071 928,673 1,231,726 1,180,227 (51,499) (4.2%)
1437 - Museums 206,610 200,690 237,685 263,416 25,731 10.8%
1438 - Kentlands Mansion 368,617 270,115 398,877 427,814 28,937 7.3%
413 - Cultural Events & Services Division 2,200,986 1,886,455 2,607,018 2,602,420 (4,598) (0.2%)
414 - Sports & Youth Services Division
1415 - Recreation Programs and Sports 826,006 560,921 922,097 861,903 (60,194) (6.5%)
1417 - Youth Services 326,781 335,294 401,231 552,377 151,146 37.7%
1418 - Summer Programs 441,221 228,689 678,381 542,663 (135,718) (20.0%)
1419 - Gaithersburg Youth Center atRobertson Park 244,854 212,163 264,544 298,181 33,637 12.7%
1420 - Skate Park 21,813 41,479 44,117 45,222 1,105 2.5%
1424 - Gaithersburg Youth Center at OldeTowne 264,473 102,504 338,289 256,360 (81,929) (24.2%)
414 - Sports & Youth Services Division 2,125,149 1,481,050 2,648,659 2,556,706 (91,953) (3.5%)
Total Parks, Recreation & Culture 8,033,874 6,320,777 9,605,818 9,744,924 139,106 1.4%
257

General Fund Departmental BudgetDepartmental Summary - Parks, Recreation & Culture
FY22 Budget
Parks, Recreation & Culture BudgetSummary
FY20Actuals
FY21Projection
FY21AdoptedBudget
FY22AdoptedBudget Chg % Chg
By Object CategoryPersonnel Services 6,613,575 5,294,898 7,637,154 7,729,873 92,719 1.2%
Operating 1,419,548 1,025,649 1,968,665 2,015,051 46,386 2.4%
Capital 750 230 - - - 0.0%
Total 8,033,874 6,320,777 9,605,818 9,744,924 139,106 1.4%
258

General Fund Departmental BudgetDepartmental Summary - Parks, Recreation & Culture
FY22 Budget
Departmental Personnel Schedule
FY20AdoptedBudget
FY21AdoptedBudget
FY22AdoptedBudget
1411 - Parks, Recreation & Culture Administration
Administrative Support Specialist 1 1 1
Accounting Specialist 1 1 1
Recreation Systems Support Manager 1 1 1
Sports & Youth Services Division Chief 0 0 1
Recreation Services Division Chief 0 0 1
Facilities & Administrative Services Division Chief 1 1 1
Cultural Events & Services Division Chief 0 0 1
Director of Parks, Recreation & Culture 1 1 1
Subtotal 5 5 8
1415 - Recreation Programs and Sports
Senior Program Supervisor 1 1 1
Program Supervisor 3 3 3
Sports & Youth Services Division Chief 1 1 0
Part-Time Personnel 6.18 5.37 5.99
Subtotal 11.18 10.37 9.99
1416 - Recreation Classes
Program Supervisor 1 1 1
Part-Time Personnel 1.93 2.12 1.65
Subtotal 2.93 3.12 2.65
1417 - Youth Services
Senior Program Supervisor 1 1 1
Program Supervisor 1 1 2
Part-Time Personnel 4.5 4.73 5.18
Subtotal 6.5 6.73 8.18
1418 - Summer Programs
Part-Time Personnel 14.82 15.92 10.86
Subtotal 14.82 15.92 10.86
259

General Fund Departmental BudgetDepartmental Summary - Parks, Recreation & Culture
FY22 Budget
Departmental Personnel Schedule
FY20AdoptedBudget
FY21AdoptedBudget
FY22AdoptedBudget
1419 - Gaithersburg Youth Center at Robertson Park
Facility Supervisor 1 1 0
Facility Coordinator 0 0 1
Community Facility Manager 1 1 1
Part-Time Personnel 2.35 2.26 2.3
Subtotal 4.35 4.26 4.3
1420 - Skate Park
Part-Time Personnel 1.24 1.24 1.19
Subtotal 1.24 1.24 1.19
1421 - Casey Community Center
Facility Coordinator 1 1 1
Community Facility Manager 1 1 1
Part-Time Personnel 4.62 7.15 5.43
Subtotal 6.62 9.15 7.43
1422 - Water Park
Facility Coordinator 0.5 0.5 0.5
Recreation Services Division Chief 1 1 0
Aquatics Superintendent 1 1 1
Aquatics Facility Coordinator 1 1 1
Part-Time Personnel 11.59 12.16 11.09
Subtotal 15.09 15.66 13.59
1423 - Gaithersburg Arts Barn
Program Coordinator 1 1 0
Facility Coordinator 0 0 1
Arts Administrator 1 1 1
Part-Time Personnel 3.73 4.4 3.23
Subtotal 5.73 6.4 5.23
260
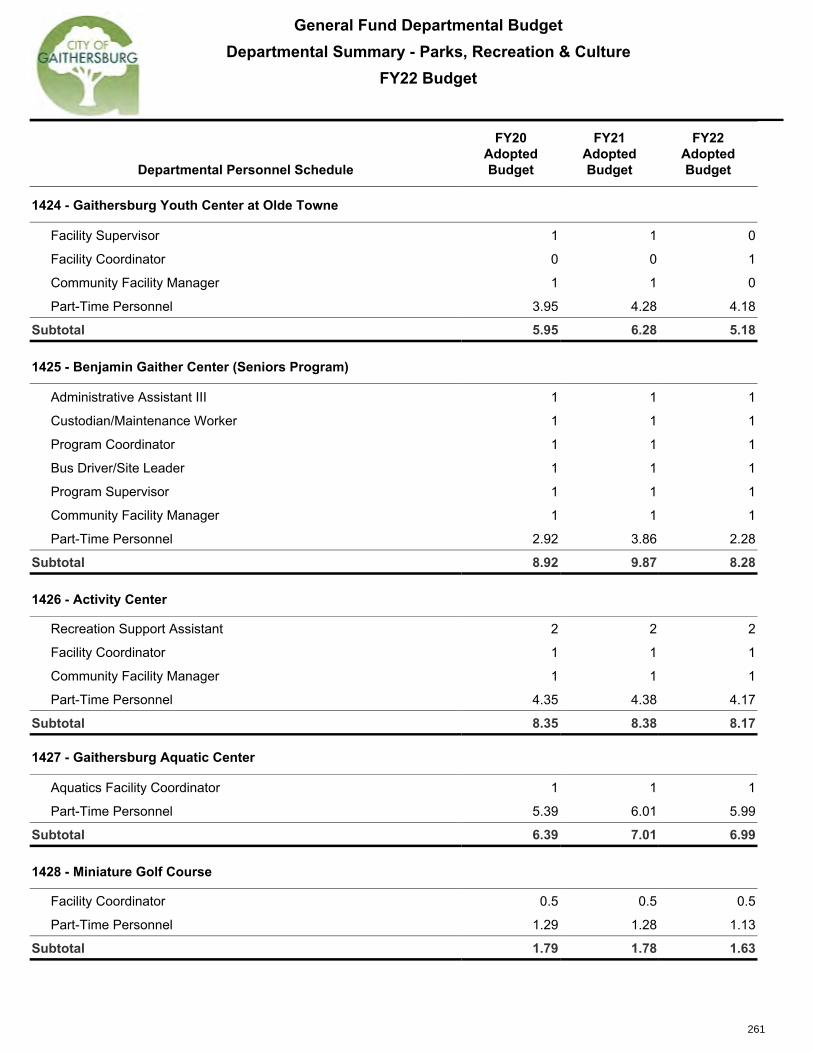
General Fund Departmental BudgetDepartmental Summary - Parks, Recreation & Culture
FY22 Budget
Departmental Personnel Schedule
FY20AdoptedBudget
FY21AdoptedBudget
FY22AdoptedBudget
1424 - Gaithersburg Youth Center at Olde Towne
Facility Supervisor 1 1 0
Facility Coordinator 0 0 1
Community Facility Manager 1 1 0
Part-Time Personnel 3.95 4.28 4.18
Subtotal 5.95 6.28 5.18
1425 - Benjamin Gaither Center (Seniors Program)
Administrative Assistant III 1 1 1
Custodian/Maintenance Worker 1 1 1
Program Coordinator 1 1 1
Bus Driver/Site Leader 1 1 1
Program Supervisor 1 1 1
Community Facility Manager 1 1 1
Part-Time Personnel 2.92 3.86 2.28
Subtotal 8.92 9.87 8.28
1426 - Activity Center
Recreation Support Assistant 2 2 2
Facility Coordinator 1 1 1
Community Facility Manager 1 1 1
Part-Time Personnel 4.35 4.38 4.17
Subtotal 8.35 8.38 8.17
1427 - Gaithersburg Aquatic Center
Aquatics Facility Coordinator 1 1 1
Part-Time Personnel 5.39 6.01 5.99
Subtotal 6.39 7.01 6.99
1428 - Miniature Golf Course
Facility Coordinator 0.5 0.5 0.5
Part-Time Personnel 1.29 1.28 1.13
Subtotal 1.79 1.78 1.63
261

General Fund Departmental BudgetDepartmental Summary - Parks, Recreation & Culture
FY22 Budget
Departmental Personnel Schedule
FY20AdoptedBudget
FY21AdoptedBudget
FY22AdoptedBudget
1429 - Picnic Pavilions
Part-Time Personnel 0.5 0.49 0.49
Subtotal 0.5 0.49 0.49
1430 - Winter Lights
Part-Time Personnel 1.14 1.14 1.14
Subtotal 1.14 1.14 1.14
1436 - Special Events
Senior Program Supervisor 2 3 2
Program Coordinator 1 1 1
Program Supervisor 3 2 3
Cultural Events & Services Division Chief 1 1 0
Sponsorship Program Administrator 1 1 1
Part-Time Personnel 3.33 3.4 3.61
Subtotal 11.33 11.4 10.61
1437 - Museums
Community Facility Manager 1 1 1
Part-Time Personnel 1.79 1.95 2.03
Subtotal 2.79 2.95 3.03
1438 - Kentlands Mansion
Custodian/Maintenance Worker 1 1 1
Facility Coordinator 1 1 1
Community Facility Manager 1 1 1
Part-Time Personnel 2.49 2.44 2.45
Subtotal 5.49 5.44 5.45
Full-Time Personnel 48 48 48
Part-Time Personnel 78.1 84.59 74.4
Total 126.1 132.6 122.4
262

General Fund Departmental BudgetsParks, Recreation & Culture - Activity Analysis
FY22 Budget
Budget SummaryFY20
ActualsFY21
Projection
FY21AdoptedBudget
FY22AdoptedBudget Chg % Chg
By Object501000 - Full-Time Wages 529,296 466,650 445,020 771,043 326,023 73.3%
505100 - Other Taxable Comp.-Multilingual 2,080 2,080 2,080 2,080 - 0.0%
505200 - Other Taxable Comp.-GFIT 967 1,680 1,344 2,016 672 50.0%
507000 - Vacation & Sick Payouts 6,014 6,400 - - - 0.0%
510000 - FICA Taxes 38,418 35,987 35,724 61,409 25,685 71.9%
514200 - Vision Benefit 28 340 221 497 276 124.9%
514210 - Health Insurance 29,555 21,678 31,472 67,818 36,346 115.5%
514220 - Dental Benefit 6,080 3,823 4,418 6,157 1,739 39.4%
514230 - Long-Term Care Benefit 356 720 725 1,240 515 71.0%
514240 - Life Ins and Disability Benefit 4,696 4,691 4,483 7,562 3,079 68.7%
515000 - Retirement (401A) 70,957 37,333 37,086 64,183 27,097 73.1%
515100 - Retirement Health Savings(RHS) 10,703 14,353 8,546 19,048 10,502 122.9%
515200 - Medicare Retirement HealthSavings (RHS) 1,462 1,992 2,000 2,000 - 0.0%
516000 - Savings Plan (401K) 15,345 13,999 13,907 24,068 10,161 73.1%
521000 - Office Supplies 2,631 2,300 6,200 5,600 (600) (9.7%)
522000 - General Operating Supplies 999 600 1,800 1,500 (300) (16.7%)
525000 - Furniture/Fixture 97 - - - - 0.0%
526000 - Machinery/Equipment 126 800 1,600 1,600 - 0.0%
530000 - Accounting & Audit 62,574 40,000 93,000 72,000 (21,000) (22.6%)
531000 - IT (Non-Consultant) Services 73,208 46,000 87,660 84,924 (2,736) (3.1%)
531600 - Software MaintenanceAgreements 1,520 2,295 2,295 - (2,295) (100.0%)
533000 - Legal 3,891 4,100 4,100 4,300 200 4.9%
1411 - Parks, Recreation & Culture Administration
Significant Changes
FY21AdoptedBudget
FY22AdoptedBudget
Increase /(Decrease)
Object - Object Name / Reason for Change
530000 - Accounting & Audit 93,000 72,000 (21,000)
Processing fees associated with credit card payment. Reduction due to a projected decrease in departmentrevenue.
263

General Fund Departmental BudgetsParks, Recreation & Culture - Activity Analysis
FY22 Budget
Budget SummaryFY20
ActualsFY21
Projection
FY21AdoptedBudget
FY22AdoptedBudget Chg % Chg
By Object536000 - Miscellaneous ProfessionalServices 225 500 650 650 - 0.0%
536200 - Americans w/ Disabilities Act(ADA) 941 - 2,000 2,000 - 0.0%
541000 - Advertising - 2,000 2,000 2,000 - 0.0%
542000 - Awards & Presentations 250 - - - - 0.0%
544000 - Dues/Memberships/Certification 1,220 2,985 2,785 3,335 550 19.7%
546000 - Conf./Seminar/ClassRegistration 595 1,100 3,190 3,250 60 1.9%
546300 - In-Service Training - 180 285 300 15 5.3%
547000 - Travel Expense 3,637 - 3,130 3,250 120 3.8%
551100 - Cellular Phone 1,847 1,500 1,920 2,040 120 6.3%
552500 - Gasoline Expense 9,838 2,000 16,250 13,000 (3,250) (20.0%)
553000 - Printing & Binding 16,662 10,600 22,995 22,995 - 0.0%
556000 - Postage 21,205 10,800 23,640 23,640 - 0.0%
557000 - Uniforms/ Laundry - 200 200 200 - 0.0%
560000 - Miscellaneous 13 - - - - 0.0%
561000 - Local - In-Service Meals 1,591 1,000 1,900 1,900 - 0.0%
567000 - Rental & Use 1,545 2,000 2,000 2,000 - 0.0%
573000 - R&M - Machinery & Equipment 7,728 2,800 11,765 11,839 74 0.6%
574000 - R&M - Vehicles 7,338 7,400 14,800 14,800 - 0.0%
Total 935,638 752,886 893,191 1,306,244 413,053 46.2%
Budget SummaryFY20
ActualsFY21
Projection
FY21AdoptedBudget
FY22AdoptedBudget Chg % Chg
By Object SummaryPersonnel Services 715,958 611,726 587,026 1,029,121 442,095 75.3%
Operating 219,680 141,160 306,165 277,123 (29,042) (9.5%)
Total 935,638 752,886 893,191 1,306,244 413,053 46.2%
264

General Fund Departmental BudgetsParks, Recreation & Culture - Activity Analysis
FY22 Budget
Budget SummaryFY20
ActualsFY21
Projection
FY21AdoptedBudget
FY22AdoptedBudget Chg % Chg
By Object501000 - Full-Time Wages 271,504 272,655 265,092 270,816 5,724 2.2%
505200 - Other Taxable Comp.-GFIT 854 1,260 1,008 1,008 - 0.0%
507000 - Vacation & Sick Payouts 1,278 1,300 - - - 0.0%
508000 - Overtime Wages 544 272 900 880 (20) (2.2%)
509000 - Part-Time Wages 96,687 5,500 143,939 146,185 2,246 1.6%
510000 - FICA Taxes 27,659 21,397 32,282 32,908 626 1.9%
514200 - Vision Benefit 183 340 276 313 37 13.4%
514210 - Health Insurance 43,096 47,374 43,730 46,528 2,798 6.4%
514220 - Dental Benefit 2,114 4,275 3,945 3,945 - 0.0%
514230 - Long-Term Care Benefit 720 576 580 620 40 6.9%
514240 - Life Ins and Disability Benefit 2,613 2,745 2,750 2,806 56 2.0%
515000 - Retirement (401A) 21,720 21,813 22,091 22,568 477 2.2%
515100 - Retirement Health Savings(RHS) 8,962 9,724 8,976 9,524 548 6.1%
515200 - Medicare Retirement HealthSavings (RHS) 1,923 1,992 2,000 2,000 - 0.0%
516000 - Savings Plan (401K) 8,146 8,181 8,283 8,463 180 2.2%
521000 - Office Supplies 164 200 250 250 - 0.0%
522000 - General Operating Supplies 6,386 3,000 6,000 6,000 - 0.0%
525000 - Furniture/Fixture 4,456 4,300 4,300 4,300 - 0.0%
526000 - Machinery/Equipment 166 1,600 1,600 1,600 - 0.0%
531000 - IT (Non-Consultant) Services 1,194 1,194 1,195 1,837 642 53.7%
531600 - Software MaintenanceAgreements 760 1,063 1,275 - (1,275) (100.0%)
536000 - Miscellaneous ProfessionalServices 382 400 500 420 (80) (16.0%)
536300 - Contract Cleaning 182 200 700 700 - 0.0%
536500 - Investigations - 60 120 120 - 0.0%
541000 - Advertising 172 - - - - 0.0%
546000 - Conf./Seminar/ClassRegistration - - 200 200 - 0.0%
546300 - In-Service Training 880 190 475 475 - 0.0%
553000 - Printing & Binding 60 - - - - 0.0%
1426 - Activity Center
265

General Fund Departmental BudgetsParks, Recreation & Culture - Activity Analysis
FY22 Budget
Budget SummaryFY20
ActualsFY21
Projection
FY21AdoptedBudget
FY22AdoptedBudget Chg % Chg
By Object554000 - Signage 298 300 300 300 - 0.0%
556000 - Postage - 300 500 300 (200) (40.0%)
557000 - Uniforms/ Laundry 500 200 700 700 - 0.0%
560000 - Miscellaneous - 100 300 300 - 0.0%
561000 - Local - In-Service Meals 226 120 250 250 - 0.0%
573000 - R&M - Machinery & Equipment 3,943 3,000 5,597 5,321 (276) (4.9%)
Total 507,773 415,631 560,114 571,637 11,523 2.1%
Budget SummaryFY20
ActualsFY21
Projection
FY21AdoptedBudget
FY22AdoptedBudget Chg % Chg
By Object SummaryPersonnel Services 488,004 399,404 535,852 548,564 12,712 2.4%
Operating 19,769 16,227 24,262 23,073 (1,189) (4.9%)
Total 507,773 415,631 560,114 571,637 11,523 2.1%
266

General Fund Departmental BudgetsParks, Recreation & Culture - Activity Analysis
FY22 Budget
Budget SummaryFY20
ActualsFY21
Projection
FY21AdoptedBudget
FY22AdoptedBudget Chg % Chg
By Object501000 - Full-Time Wages 28,237 29,526 28,235 29,189 954 3.4%
509000 - Part-Time Wages 24,044 26,500 38,682 36,595 (2,087) (5.4%)
510000 - FICA Taxes 3,764 4,286 5,210 5,126 (84) (1.6%)
514200 - Vision Benefit 112 49 46 46 - 0.0%
514210 - Health Insurance 23,954 11,843 10,932 11,632 700 6.4%
514220 - Dental Benefit 1,246 712 657 657 - 0.0%
514230 - Long-Term Care Benefit 510 72 73 78 5 6.8%
514240 - Life Ins and Disability Benefit 565 296 295 305 10 3.4%
515000 - Retirement (401A) 2,259 2,363 2,353 2,432 79 3.4%
515200 - Medicare Retirement HealthSavings (RHS) 923 995 1,000 1,000 - 0.0%
516000 - Savings Plan (401K) 847 886 882 912 30 3.4%
521000 - Office Supplies (26) 200 200 200 - 0.0%
522000 - General Operating Supplies 6,412 7,000 7,000 7,000 - 0.0%
524000 - Supplies/Resale 2,555 2,600 3,300 3,000 (300) (9.1%)
525000 - Furniture/Fixture 640 1,500 1,500 2,700 1,200 80.0%
526000 - Machinery/Equipment - - 250 1,450 1,200 480.0%
531000 - IT (Non-Consultant) Services - - - 321 321 100.0%
531500 - Software Licenses - - - 300 300 100.0%
531600 - Software MaintenanceAgreements 190 - 510 - (510) (100.0%)
536500 - Investigations 31 300 300 300 - 0.0%
541000 - Advertising 657 1,300 1,700 2,000 300 17.6%
546300 - In-Service Training 270 700 475 475 - 0.0%
553000 - Printing & Binding 160 350 400 400 - 0.0%
554000 - Signage 716 700 700 700 - 0.0%
557000 - Uniforms/ Laundry 824 1,000 1,000 1,000 - 0.0%
561000 - Local - In-Service Meals 35 200 200 200 - 0.0%
Total 98,927 93,378 105,900 108,018 2,118 2.0%
1428 - Miniature Golf Course
267

General Fund Departmental BudgetsParks, Recreation & Culture - Activity Analysis
FY22 Budget
Budget SummaryFY20
ActualsFY21
Projection
FY21AdoptedBudget
FY22AdoptedBudget Chg % Chg
By Object SummaryPersonnel Services 86,461 77,528 88,365 87,972 (393) (0.4%)
Operating 12,466 15,850 17,535 20,046 2,511 14.3%
Total 98,927 93,378 105,900 108,018 2,118 2.0%
268

General Fund Departmental BudgetsParks, Recreation & Culture - Activity Analysis
FY22 Budget
Budget SummaryFY20
ActualsFY21
Projection
FY21AdoptedBudget
FY22AdoptedBudget Chg % Chg
By Object509000 - Part-Time Wages 14,613 1,500 19,767 20,051 284 1.4%
510000 - FICA Taxes 1,118 115 1,512 1,534 22 1.5%
522000 - General Operating Supplies 519 1,400 1,400 1,400 - 0.0%
525000 - Furniture/Fixture - - - 1,400 1,400 100.0%
526000 - Machinery/Equipment - - 250 250 - 0.0%
531000 - IT (Non-Consultant) Services - - - 642 642 100.0%
531600 - Software MaintenanceAgreements 380 425 510 - (510) (100.0%)
550000 - Electric 1,624 1,500 2,300 2,000 (300) (13.0%)
554000 - Signage - 200 400 400 - 0.0%
Total 18,254 5,140 26,139 27,677 1,538 5.9%
Budget SummaryFY20
ActualsFY21
Projection
FY21AdoptedBudget
FY22AdoptedBudget Chg % Chg
By Object SummaryPersonnel Services 15,731 1,615 21,279 21,585 306 1.4%
Operating 2,523 3,525 4,860 6,092 1,232 25.3%
Total 18,254 5,140 26,139 27,677 1,538 5.9%
1429 - Picnic Pavilions
269
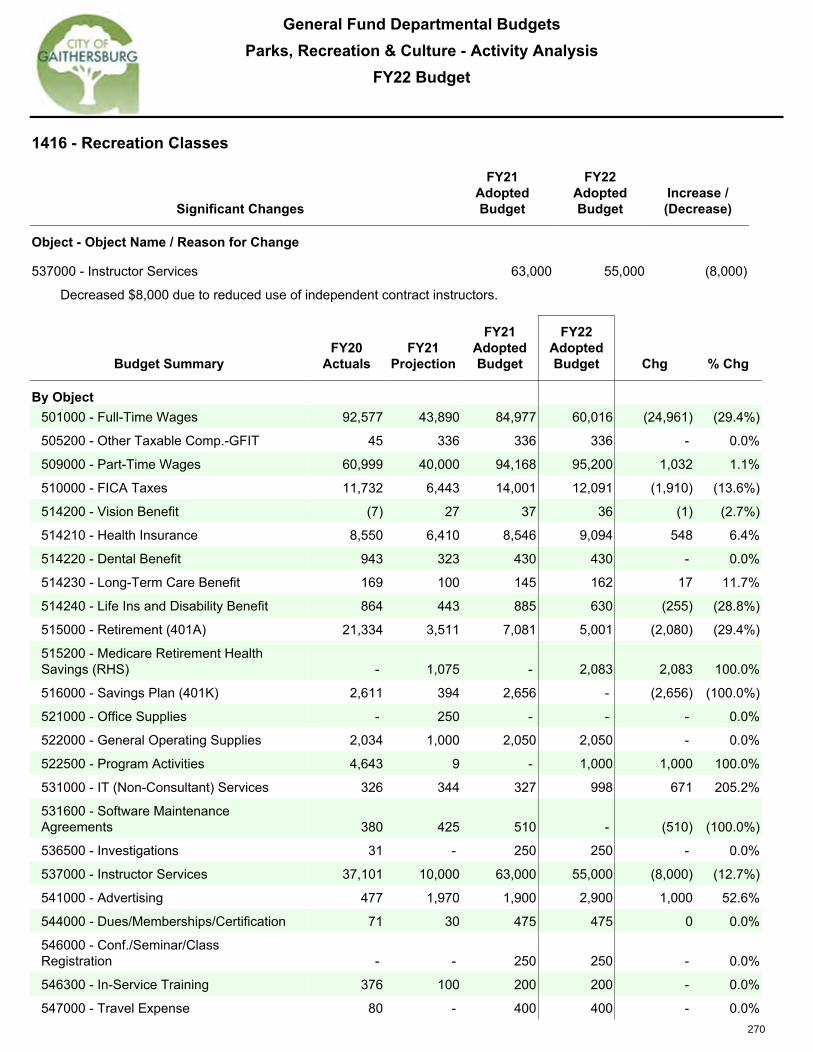
General Fund Departmental BudgetsParks, Recreation & Culture - Activity Analysis
FY22 Budget
Budget SummaryFY20
ActualsFY21
Projection
FY21AdoptedBudget
FY22AdoptedBudget Chg % Chg
By Object501000 - Full-Time Wages 92,577 43,890 84,977 60,016 (24,961) (29.4%)
505200 - Other Taxable Comp.-GFIT 45 336 336 336 - 0.0%
509000 - Part-Time Wages 60,999 40,000 94,168 95,200 1,032 1.1%
510000 - FICA Taxes 11,732 6,443 14,001 12,091 (1,910) (13.6%)
514200 - Vision Benefit (7) 27 37 36 (1) (2.7%)
514210 - Health Insurance 8,550 6,410 8,546 9,094 548 6.4%
514220 - Dental Benefit 943 323 430 430 - 0.0%
514230 - Long-Term Care Benefit 169 100 145 162 17 11.7%
514240 - Life Ins and Disability Benefit 864 443 885 630 (255) (28.8%)
515000 - Retirement (401A) 21,334 3,511 7,081 5,001 (2,080) (29.4%)
515200 - Medicare Retirement HealthSavings (RHS) - 1,075 - 2,083 2,083 100.0%
516000 - Savings Plan (401K) 2,611 394 2,656 - (2,656) (100.0%)
521000 - Office Supplies - 250 - - - 0.0%
522000 - General Operating Supplies 2,034 1,000 2,050 2,050 - 0.0%
522500 - Program Activities 4,643 9 - 1,000 1,000 100.0%
531000 - IT (Non-Consultant) Services 326 344 327 998 671 205.2%
531600 - Software MaintenanceAgreements 380 425 510 - (510) (100.0%)
536500 - Investigations 31 - 250 250 - 0.0%
537000 - Instructor Services 37,101 10,000 63,000 55,000 (8,000) (12.7%)
541000 - Advertising 477 1,970 1,900 2,900 1,000 52.6%
544000 - Dues/Memberships/Certification 71 30 475 475 0 0.0%
546000 - Conf./Seminar/ClassRegistration - - 250 250 - 0.0%
546300 - In-Service Training 376 100 200 200 - 0.0%
547000 - Travel Expense 80 - 400 400 - 0.0%
1416 - Recreation Classes
Significant Changes
FY21AdoptedBudget
FY22AdoptedBudget
Increase /(Decrease)
Object - Object Name / Reason for Change
537000 - Instructor Services 63,000 55,000 (8,000)
Decreased $8,000 due to reduced use of independent contract instructors.
270

General Fund Departmental BudgetsParks, Recreation & Culture - Activity Analysis
FY22 Budget
Budget SummaryFY20
ActualsFY21
Projection
FY21AdoptedBudget
FY22AdoptedBudget Chg % Chg
By Object549000 - Scholarship Management 1,877 600 1,005 750 (255) (25.4%)
553000 - Printing & Binding 457 500 800 1,500 700 87.5%
554000 - Signage - - - 200 200 100.0%
556000 - Postage - 150 150 150 - 0.0%
557000 - Uniforms/ Laundry - - - 150 150 100.0%
567100 - Rental of Facilities 1,909 - 5,000 4,000 (1,000) (20.0%)
Total 249,580 118,330 289,579 255,352 (34,227) (11.8%)
Budget SummaryFY20
ActualsFY21
Projection
FY21AdoptedBudget
FY22AdoptedBudget Chg % Chg
By Object SummaryPersonnel Services 199,819 102,952 213,262 185,079 (28,183) (13.2%)
Operating 49,761 15,378 76,317 70,273 (6,044) (7.9%)
Total 249,580 118,330 289,579 255,352 (34,227) (11.8%)
271
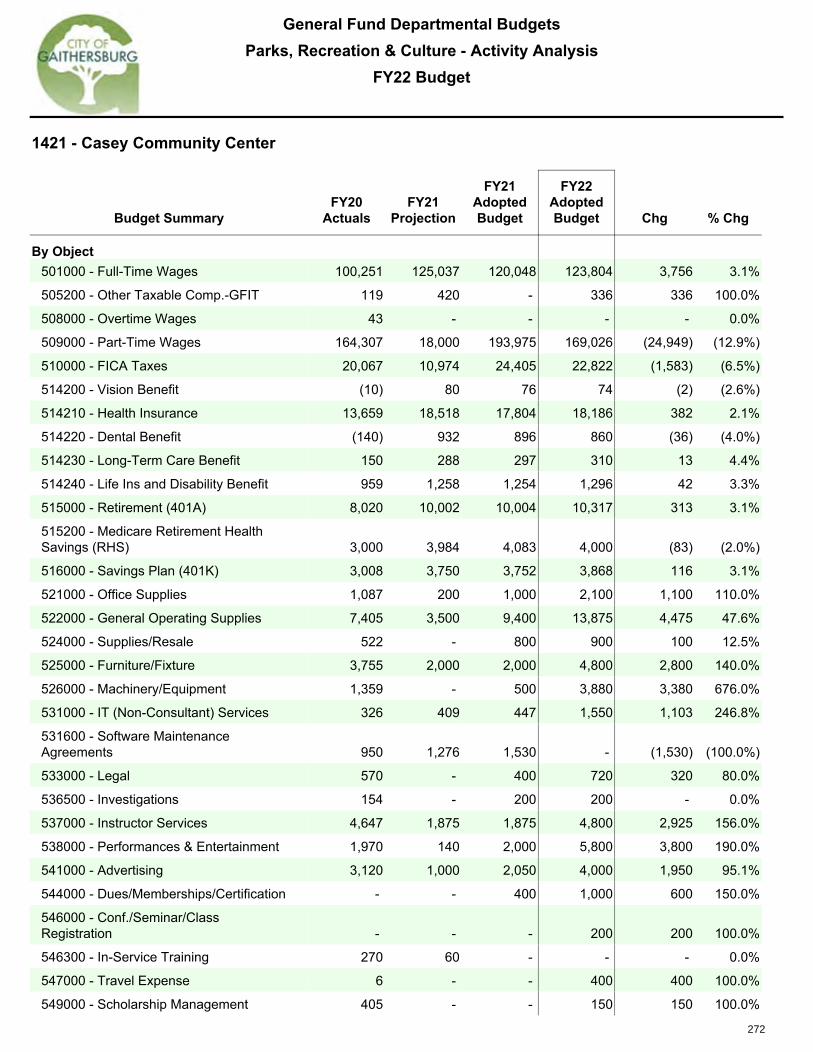
General Fund Departmental BudgetsParks, Recreation & Culture - Activity Analysis
FY22 Budget
Budget SummaryFY20
ActualsFY21
Projection
FY21AdoptedBudget
FY22AdoptedBudget Chg % Chg
By Object501000 - Full-Time Wages 100,251 125,037 120,048 123,804 3,756 3.1%
505200 - Other Taxable Comp.-GFIT 119 420 - 336 336 100.0%
508000 - Overtime Wages 43 - - - - 0.0%
509000 - Part-Time Wages 164,307 18,000 193,975 169,026 (24,949) (12.9%)
510000 - FICA Taxes 20,067 10,974 24,405 22,822 (1,583) (6.5%)
514200 - Vision Benefit (10) 80 76 74 (2) (2.6%)
514210 - Health Insurance 13,659 18,518 17,804 18,186 382 2.1%
514220 - Dental Benefit (140) 932 896 860 (36) (4.0%)
514230 - Long-Term Care Benefit 150 288 297 310 13 4.4%
514240 - Life Ins and Disability Benefit 959 1,258 1,254 1,296 42 3.3%
515000 - Retirement (401A) 8,020 10,002 10,004 10,317 313 3.1%
515200 - Medicare Retirement HealthSavings (RHS) 3,000 3,984 4,083 4,000 (83) (2.0%)
516000 - Savings Plan (401K) 3,008 3,750 3,752 3,868 116 3.1%
521000 - Office Supplies 1,087 200 1,000 2,100 1,100 110.0%
522000 - General Operating Supplies 7,405 3,500 9,400 13,875 4,475 47.6%
524000 - Supplies/Resale 522 - 800 900 100 12.5%
525000 - Furniture/Fixture 3,755 2,000 2,000 4,800 2,800 140.0%
526000 - Machinery/Equipment 1,359 - 500 3,880 3,380 676.0%
531000 - IT (Non-Consultant) Services 326 409 447 1,550 1,103 246.8%
531600 - Software MaintenanceAgreements 950 1,276 1,530 - (1,530) (100.0%)
533000 - Legal 570 - 400 720 320 80.0%
536500 - Investigations 154 - 200 200 - 0.0%
537000 - Instructor Services 4,647 1,875 1,875 4,800 2,925 156.0%
538000 - Performances & Entertainment 1,970 140 2,000 5,800 3,800 190.0%
541000 - Advertising 3,120 1,000 2,050 4,000 1,950 95.1%
544000 - Dues/Memberships/Certification - - 400 1,000 600 150.0%
546000 - Conf./Seminar/ClassRegistration - - - 200 200 100.0%
546300 - In-Service Training 270 60 - - - 0.0%
547000 - Travel Expense 6 - - 400 400 100.0%
549000 - Scholarship Management 405 - - 150 150 100.0%
1421 - Casey Community Center
272

General Fund Departmental BudgetsParks, Recreation & Culture - Activity Analysis
FY22 Budget
Budget SummaryFY20
ActualsFY21
Projection
FY21AdoptedBudget
FY22AdoptedBudget Chg % Chg
By Object553000 - Printing & Binding 2,499 1,000 2,700 4,000 1,300 48.1%
556000 - Postage 24 50 50 100 50 100.0%
557000 - Uniforms/ Laundry - - - 500 500 100.0%
560000 - Miscellaneous 52 - - - - 0.0%
561000 - Local - In-Service Meals 158 - 300 600 300 100.0%
572000 - R&M - Buildings & Facilities - 500 500 500 - 0.0%
573000 - R&M - Machinery & Equipment 261 50 336 336 - 0.0%
Total 342,975 205,303 403,082 405,310 2,228 0.6%
Budget SummaryFY20
ActualsFY21
Projection
FY21AdoptedBudget
FY22AdoptedBudget Chg % Chg
By Object SummaryPersonnel Services 313,434 193,243 376,594 354,899 (21,695) (5.8%)
Operating 29,541 12,060 26,488 50,411 23,923 90.3%
Total 342,975 205,303 403,082 405,310 2,228 0.6%
273

General Fund Departmental BudgetsParks, Recreation & Culture - Activity Analysis
FY22 Budget
Budget SummaryFY20
ActualsFY21
Projection
FY21AdoptedBudget
FY22AdoptedBudget Chg % Chg
By Object501000 - Full-Time Wages 146,798 271,809 238,891 162,236 (76,655) (32.1%)
505100 - Other Taxable Comp.-Multilingual 693 2,080 - 2,080 2,080 100.0%
505200 - Other Taxable Comp.-GFIT 210 840 252 336 84 33.3%
507000 - Vacation & Sick Payouts - 5,617 - - - 0.0%
509000 - Part-Time Wages 256,060 172,000 381,259 371,306 (9,953) (2.6%)
510000 - FICA Taxes 30,617 34,175 48,222 41,518 (6,704) (13.9%)
514200 - Vision Benefit (15) 229 247 120 (127) (51.4%)
514210 - Health Insurance 1,951 44,789 22,728 20,725 (2,003) (8.8%)
514220 - Dental Benefit (5) 2,603 3,029 1,087 (1,942) (64.1%)
514230 - Long-Term Care Benefit (159) 504 496 388 (108) (21.8%)
514240 - Life Ins and Disability Benefit 1,176 2,754 2,284 1,718 (566) (24.8%)
515000 - Retirement (401A) 11,744 21,746 19,908 13,519 (6,389) (32.1%)
515100 - Retirement Health Savings(RHS) 6,176 5,095 8,976 4,977 (3,999) (44.6%)
515200 - Medicare Retirement HealthSavings (RHS) 2,231 2,987 4,833 3,000 (1,833) (37.9%)
516000 - Savings Plan (401K) 4,404 8,156 7,465 5,070 (2,395) (32.1%)
521000 - Office Supplies 893 1,000 1,000 2,000 1,000 100.0%
522000 - General Operating Supplies 25,558 30,000 45,350 45,350 - 0.0%
524000 - Supplies/Resale 4,713 2,000 2,450 3,950 1,500 61.2%
525000 - Furniture/Fixture 649 800 800 800 0 0.0%
526000 - Machinery/Equipment 3,009 6,000 6,800 7,300 500 7.4%
531000 - IT (Non-Consultant) Services 438 455 440 1,109 669 152.0%
531500 - Software Licenses 452 - - - - 0.0%
531600 - Software MaintenanceAgreements 1,330 1,701 2,040 - (2,040) (100.0%)
536000 - Miscellaneous ProfessionalServices - 2,000 2,500 2,500 - 0.0%
536300 - Contract Cleaning 182 100 650 500 (150) (23.1%)
536400 - Contract Maintenance Services 19,714 40,000 42,700 42,700 - 0.0%
536500 - Investigations 63 800 1,000 1,000 - 0.0%
537000 - Instructor Services 1,760 1,765 2,000 2,500 500 25.0%
1422 - Water Park
274

General Fund Departmental BudgetsParks, Recreation & Culture - Activity Analysis
FY22 Budget
Budget SummaryFY20
ActualsFY21
Projection
FY21AdoptedBudget
FY22AdoptedBudget Chg % Chg
By Object538000 - Performances & Entertainment 650 1,000 2,400 3,000 600 25.0%
541000 - Advertising 32 250 250 2,000 1,750 700.0%
542000 - Awards & Presentations 463 200 200 200 - 0.0%
544000 - Dues/Memberships/Certification 300 1,500 2,500 2,500 - 0.0%
546000 - Conf./Seminar/ClassRegistration 484 - 3,300 3,300 - 0.0%
546300 - In-Service Training 1,002 1,250 1,250 1,700 450 36.0%
547000 - Travel Expense 607 - 2,000 2,000 - 0.0%
551100 - Cellular Phone 277 250 960 960 - 0.0%
553000 - Printing & Binding 863 1,200 1,200 1,500 300 25.0%
554000 - Signage 1,816 2,000 2,500 2,500 - 0.0%
556000 - Postage - 1,100 1,100 1,100 - 0.0%
557000 - Uniforms/ Laundry 3,045 4,500 4,500 5,000 500 11.1%
560000 - Miscellaneous 2,661 - - - - 0.0%
561000 - Local - In-Service Meals 327 600 600 700 100 16.7%
567000 - Rental & Use 198 1,000 1,400 1,400 - 0.0%
572000 - R&M - Buildings & Facilities - 23,000 23,500 23,500 - 0.0%
573000 - R&M - Machinery & Equipment 2,573 6,000 6,804 7,108 304 4.5%
595000 - Furniture & Equipment 750 230 - - - 0.0%
Total 536,687 706,085 900,784 796,257 (104,527) (11.6%)
Budget SummaryFY20
ActualsFY21
Projection
FY21AdoptedBudget
FY22AdoptedBudget Chg % Chg
By Object SummaryPersonnel Services 461,881 575,384 738,590 628,080 (110,510) (15.0%)
Operating 74,056 130,471 162,194 168,177 5,983 3.7%
Capital 750 230 - - - 0.0%
Total 536,687 706,085 900,784 796,257 (104,527) (11.6%)
275

General Fund Departmental BudgetsParks, Recreation & Culture - Activity Analysis
FY22 Budget
Budget SummaryFY20
ActualsFY21
Projection
FY21AdoptedBudget
FY22AdoptedBudget Chg % Chg
By Object501000 - Full-Time Wages 354,948 235,054 364,636 349,315 (15,321) (4.2%)
505100 - Other Taxable Comp.-Multilingual 3,640 2,080 2,080 2,080 - 0.0%
505200 - Other Taxable Comp.-GFIT 38 - 924 588 (336) (36.4%)
505300 - Other Taxable Comp.-HousingStipend 3,600 3,900 3,600 3,600 - 0.0%
507000 - Vacation & Sick Payouts 3,773 3,800 - - - 0.0%
508000 - Overtime Wages 1,582 - - - - 0.0%
509000 - Part-Time Wages 91,527 22,000 113,608 85,396 (28,212) (24.8%)
510000 - FICA Taxes 33,891 20,123 38,253 34,836 (3,417) (8.9%)
514200 - Vision Benefit 123 400 539 534 (5) (0.9%)
514210 - Health Insurance 93,534 71,468 99,631 98,554 (1,077) (1.1%)
514220 - Dental Benefit 1,723 4,323 6,040 5,529 (511) (8.5%)
514230 - Long-Term Care Benefit 746 576 858 917 59 6.9%
514240 - Life Ins and Disability Benefit 3,460 2,417 3,846 3,708 (138) (3.6%)
515000 - Retirement (401A) 28,290 18,804 30,386 29,097 (1,289) (4.2%)
515050 - Supplemental Retirement (401A) 2,176 2,171 2,120 2,304 184 8.7%
515100 - Retirement Health Savings(RHS) 281 - - - - 0.0%
515200 - Medicare Retirement HealthSavings (RHS) - - 1,833 3,833 2,000 109.1%
516000 - Savings Plan (401K) 8,753 7,051 11,395 10,911 (484) (4.2%)
521000 - Office Supplies 877 600 1,100 1,100 - 0.0%
1425 - Benjamin Gaither Center (Seniors Program)
Significant Changes
FY21AdoptedBudget
FY22AdoptedBudget
Increase /(Decrease)
Object - Object Name / Reason for Change
522500 - Program Activities 28,600 23,350 (5,250)
Decreased $10,250 due to anticipated opening in October 2021 and fewer trips offered in FY22.
525000 - Furniture/Fixture - 15,500 15,500
Increase due to purchase of new furniture. $14,000 to be reimbursed through donated funds in G-PARC.
536000 - Miscellaneous Professional Services 54,250 26,105 (28,145)
Decreased $28,145 due to anticipated opening in October 2021 and fewer lunches offered in FY22.
276

General Fund Departmental BudgetsParks, Recreation & Culture - Activity Analysis
FY22 Budget
Budget SummaryFY20
ActualsFY21
Projection
FY21AdoptedBudget
FY22AdoptedBudget Chg % Chg
By Object522000 - General Operating Supplies 8,291 250 12,790 12,460 (330) (2.6%)
522500 - Program Activities 19,952 - 28,600 23,350 (5,250) (18.4%)
525000 - Furniture/Fixture 1,689 - - 15,500 15,500 100.0%
526000 - Machinery/Equipment 4,212 2,000 3,200 4,880 1,680 52.5%
531000 - IT (Non-Consultant) Services - - 120 1,404 1,284 1,070.0%
531500 - Software Licenses 622 - 800 - (800) (100.0%)
531600 - Software MaintenanceAgreements 3,420 3,190 3,825 - (3,825) (100.0%)
536000 - Miscellaneous ProfessionalServices 30,866 - 54,250 26,105 (28,145) (51.9%)
536300 - Contract Cleaning 400 - 3,500 3,500 - 0.0%
536500 - Investigations 63 - 75 200 125 166.7%
537000 - Instructor Services 2,815 - 3,750 4,000 250 6.7%
538000 - Performances & Entertainment 900 - 4,850 4,470 (380) (7.8%)
541000 - Advertising 5,269 1,000 5,200 5,200 - 0.0%
542000 - Awards & Presentations 650 - - - - 0.0%
544000 - Dues/Memberships/Certification 200 - 475 375 (100) (21.1%)
546000 - Conf./Seminar/ClassRegistration 80 - 400 450 50 12.5%
546300 - In-Service Training 800 - - - - 0.0%
547000 - Travel Expense 412 - 1,650 1,300 (350) (21.2%)
547100 - Local Travel Mileage 27 - - - - 0.0%
549000 - Scholarship Management 94 75 140 140 - 0.0%
551100 - Cellular Phone 1,424 1,440 1,440 1,560 120 8.3%
553000 - Printing & Binding 8,662 300 11,888 9,000 (2,888) (24.3%)
554000 - Signage - - 1,400 1,000 (400) (28.6%)
556000 - Postage - 1,200 3,200 3,200 - 0.0%
557000 - Uniforms/ Laundry 533 - 550 550 - 0.0%
560000 - Miscellaneous 2,090 - - - - 0.0%
573000 - R&M - Machinery & Equipment 1,117 300 1,852 1,852 - 0.0%
Total 727,548 404,522 824,804 752,798 (72,006) (8.7%)
277

General Fund Departmental BudgetsParks, Recreation & Culture - Activity Analysis
FY22 Budget
Budget SummaryFY20
ActualsFY21
Projection
FY21AdoptedBudget
FY22AdoptedBudget Chg % Chg
By Object SummaryPersonnel Services 632,083 394,167 679,749 631,202 (48,547) (7.1%)
Operating 95,465 10,355 145,055 121,596 (23,459) (16.2%)
Total 727,548 404,522 824,804 752,798 (72,006) (8.7%)
278

General Fund Departmental BudgetsParks, Recreation & Culture - Activity Analysis
FY22 Budget
Budget SummaryFY20
ActualsFY21
Projection
FY21AdoptedBudget
FY22AdoptedBudget Chg % Chg
By Object501000 - Full-Time Wages 62,385 62,807 60,903 62,486 1,583 2.6%
505200 - Other Taxable Comp.-GFIT 270 420 336 336 - 0.0%
509000 - Part-Time Wages 162,711 117,145 192,145 204,270 12,125 6.3%
510000 - FICA Taxes 17,120 13,799 19,578 20,632 1,054 5.4%
514200 - Vision Benefit (7) 40 37 37 - 0.0%
514210 - Health Insurance 8,550 9,259 8,546 9,093 547 6.4%
514220 - Dental Benefit 2,085 466 430 430 - 0.0%
514230 - Long-Term Care Benefit 84 144 145 155 10 6.9%
514240 - Life Ins and Disability Benefit 620 634 639 656 17 2.7%
515000 - Retirement (401A) 4,991 5,024 5,075 5,207 132 2.6%
516000 - Savings Plan (401K) 1,872 1,884 1,903 1,953 50 2.6%
521000 - Office Supplies 332 750 750 750 - 0.0%
522000 - General Operating Supplies 9,655 13,000 15,000 15,000 - 0.0%
524000 - Supplies/Resale 35 1,000 1,500 1,000 (500) (33.3%)
526000 - Machinery/Equipment 436 2,100 2,150 2,150 - 0.0%
531600 - Software MaintenanceAgreements 380 425 510 - (510) (100.0%)
536000 - Miscellaneous ProfessionalServices 649 - - - - 0.0%
536400 - Contract Maintenance Services - 5,000 12,100 12,100 - 0.0%
537000 - Instructor Services 5,755 4,500 6,500 6,500 - 0.0%
538000 - Performances & Entertainment 53 - 600 750 150 25.0%
541000 - Advertising 74 250 500 1,000 500 100.0%
542000 - Awards & Presentations 150 150 150 150 - 0.0%
544000 - Dues/Memberships/Certification 1,064 500 2,500 2,500 - 0.0%
546000 - Conf./Seminar/ClassRegistration 250 500 500 800 300 60.0%
546300 - In-Service Training 282 1,200 1,200 1,200 - 0.0%
547000 - Travel Expense 380 - 400 400 - 0.0%
549000 - Scholarship Management 3,081 250 500 1,000 500 100.0%
550700 - Solid Waste/Recycling - 150 150 150 - 0.0%
551100 - Cellular Phone 277 250 250 250 - 0.0%
553000 - Printing & Binding 75 250 250 250 - 0.0%
1427 - Gaithersburg Aquatic Center
279

General Fund Departmental BudgetsParks, Recreation & Culture - Activity Analysis
FY22 Budget
Budget SummaryFY20
ActualsFY21
Projection
FY21AdoptedBudget
FY22AdoptedBudget Chg % Chg
By Object554000 - Signage - 1,000 1,000 1,000 - 0.0%
556000 - Postage - 100 100 100 - 0.0%
557000 - Uniforms/ Laundry (10) 700 700 700 - 0.0%
560000 - Miscellaneous 532 - - - - 0.0%
561000 - Local - In-Service Meals 38 500 500 500 - 0.0%
567000 - Rental & Use - 500 700 700 - 0.0%
572000 - R&M - Buildings & Facilities 4,000 4,000 5,000 5,000 - 0.0%
573000 - R&M - Machinery & Equipment 2,189 2,500 2,500 2,500 - 0.0%
575000 - R&M - Furniture & Equipment - 800 800 800 - 0.0%
Total 290,357 251,997 346,547 362,505 15,958 4.6%
Budget SummaryFY20
ActualsFY21
Projection
FY21AdoptedBudget
FY22AdoptedBudget Chg % Chg
By Object SummaryPersonnel Services 260,681 211,622 289,737 305,255 15,518 5.4%
Operating 29,676 40,375 56,810 57,250 440 0.8%
Total 290,357 251,997 346,547 362,505 15,958 4.6%
280

General Fund Departmental BudgetsParks, Recreation & Culture - Activity Analysis
FY22 Budget
Budget SummaryFY20
ActualsFY21
Projection
FY21AdoptedBudget
FY22AdoptedBudget Chg % Chg
By Object501000 - Full-Time Wages 85,340 85,101 152,689 155,347 2,658 1.7%
505200 - Other Taxable Comp.-GFIT 540 420 672 672 - 0.0%
505300 - Other Taxable Comp.-HousingStipend 1,600 2,600 2,400 2,400 - 0.0%
508000 - Overtime Wages 6,836 100 - 400 400
509000 - Part-Time Wages 119,948 86,300 152,348 121,556 (30,792) (20.2%)
510000 - FICA Taxes 16,206 13,351 24,058 21,943 (2,115) (8.8%)
514200 - Vision Benefit (7) 54 124 123 (1) (0.8%)
514210 - Health Insurance 8,550 11,404 21,414 23,891 2,477 11.6%
514220 - Dental Benefit 242 600 1,234 1,234 - 0.0%
514230 - Long-Term Care Benefit 894 168 290 310 20 6.9%
514240 - Life Ins and Disability Benefit 926 883 1,620 1,653 33 2.0%
515000 - Retirement (401A) 6,748 6,808 12,724 12,946 222 1.7%
515100 - Retirement Health Savings(RHS) 897 - - - - 0.0%
515200 - Medicare Retirement HealthSavings (RHS) - 333 2,000 2,000 - 0.0%
516000 - Savings Plan (401K) 2,530 2,553 4,772 4,854 82 1.7%
521000 - Office Supplies 390 150 300 300 - 0.0%
522000 - General Operating Supplies 9,293 3,300 6,472 6,190 (282) (4.4%)
522500 - Program Activities 92 - - - - 0.0%
524000 - Supplies/Resale 2,253 500 1,960 2,000 40 2.0%
525000 - Furniture/Fixture 582 - 100 975 875 875.0%
526000 - Machinery/Equipment 2,673 26,105 2,000 2,500 500 25.0%
531000 - IT (Non-Consultant) Services 1,614 1,757 1,757 6,755 4,998 284.5%
531500 - Software Licenses - 3,310 - - - 0.0%
1423 - Gaithersburg Arts Barn
Significant Changes
FY21AdoptedBudget
FY22AdoptedBudget
Increase /(Decrease)
Object - Object Name / Reason for Change
538000 - Performances & Entertainment 82,334 71,850 (10,484)
Reduced due to pandemic which reduces number of performances and revenue opportunity. This line item is arevenue-share.
100.0%
281

General Fund Departmental BudgetsParks, Recreation & Culture - Activity Analysis
FY22 Budget
Budget SummaryFY20
ActualsFY21
Projection
FY21AdoptedBudget
FY22AdoptedBudget Chg % Chg
By Object531600 - Software MaintenanceAgreements 1,140 1,785 1,785 - (1,785) (100.0%)
533000 - Legal 405 410 410 850 440 107.3%
536000 - Miscellaneous ProfessionalServices 4,799 9,250 4,500 4,950 450 10.0%
536300 - Contract Cleaning - - - 700 700 100.0%
536500 - Investigations 31 200 300 300 - 0.0%
538000 - Performances & Entertainment 87,366 20,000 82,334 71,850 (10,484) (12.7%)
541000 - Advertising 11,726 7,415 14,824 10,200 (4,624) (31.2%)
542000 - Awards & Presentations 715 1,115 1,040 1,065 25 2.4%
544000 - Dues/Memberships/Certification 80 200 1,060 520 (540) (50.9%)
546000 - Conf./Seminar/ClassRegistration - - 200 200 - 0.0%
546300 - In-Service Training 450 60 - 750 750 100.0%
547000 - Travel Expense 13 200 1,000 500 (500) (50.0%)
553000 - Printing & Binding 3,481 500 2,500 3,325 825 33.0%
554000 - Signage 166 2,000 2,000 550 (1,450) (72.5%)
556000 - Postage 2,156 300 1,800 2,500 700 38.9%
560000 - Miscellaneous - - 2,000 2,000 - 0.0%
567000 - Rental & Use 700 750 750 2,110 1,360 181.3%
573000 - R&M - Machinery & Equipment 1,620 1,750 1,750 3,669 1,919 109.7%
Total 382,993 291,732 507,187 474,088 (33,099) (6.5%)
Budget SummaryFY20
ActualsFY21
Projection
FY21AdoptedBudget
FY22AdoptedBudget Chg % Chg
By Object SummaryPersonnel Services 251,249 210,675 376,345 349,329 (27,016) (7.2%)
Operating 131,744 81,057 130,842 124,759 (6,083) (4.6%)
Total 382,993 291,732 507,187 474,088 (33,099) (6.5%)
282
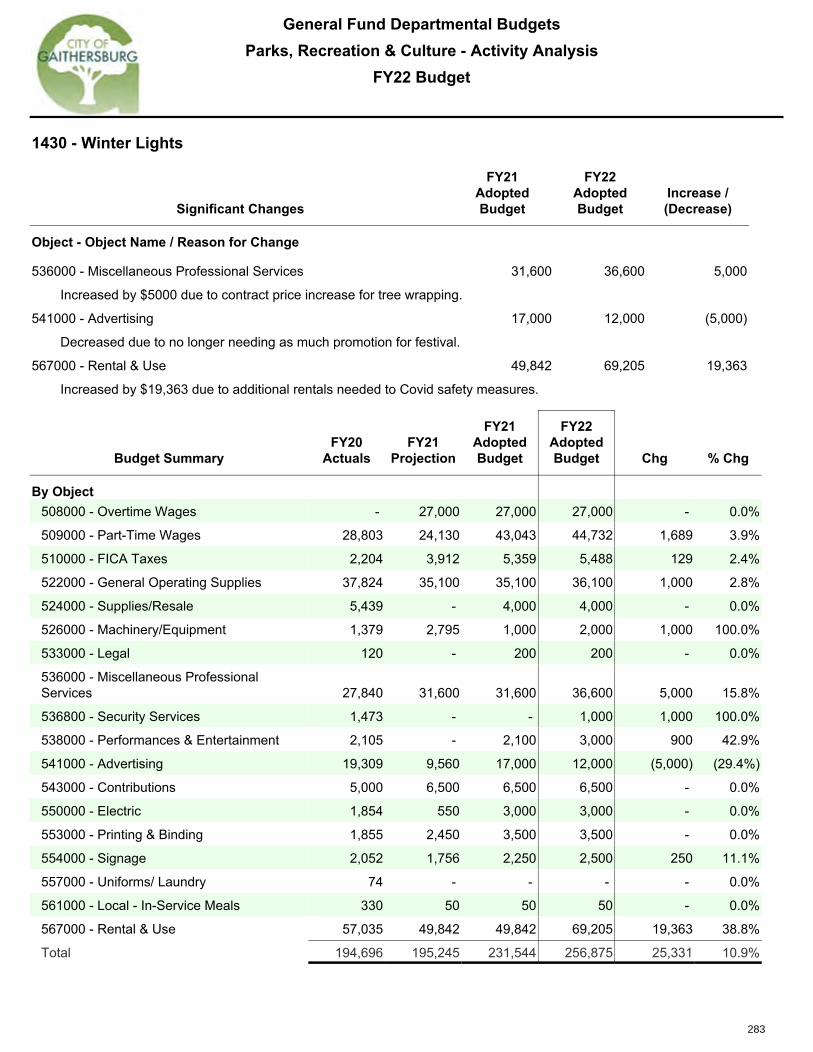
General Fund Departmental BudgetsParks, Recreation & Culture - Activity Analysis
FY22 Budget
Budget SummaryFY20
ActualsFY21
Projection
FY21AdoptedBudget
FY22AdoptedBudget Chg % Chg
By Object508000 - Overtime Wages - 27,000 27,000 27,000 - 0.0%
509000 - Part-Time Wages 28,803 24,130 43,043 44,732 1,689 3.9%
510000 - FICA Taxes 2,204 3,912 5,359 5,488 129 2.4%
522000 - General Operating Supplies 37,824 35,100 35,100 36,100 1,000 2.8%
524000 - Supplies/Resale 5,439 - 4,000 4,000 - 0.0%
526000 - Machinery/Equipment 1,379 2,795 1,000 2,000 1,000 100.0%
533000 - Legal 120 - 200 200 - 0.0%
536000 - Miscellaneous ProfessionalServices 27,840 31,600 31,600 36,600 5,000 15.8%
536800 - Security Services 1,473 - - 1,000 1,000 100.0%
538000 - Performances & Entertainment 2,105 - 2,100 3,000 900 42.9%
541000 - Advertising 19,309 9,560 17,000 12,000 (5,000) (29.4%)
543000 - Contributions 5,000 6,500 6,500 6,500 - 0.0%
550000 - Electric 1,854 550 3,000 3,000 - 0.0%
553000 - Printing & Binding 1,855 2,450 3,500 3,500 - 0.0%
554000 - Signage 2,052 1,756 2,250 2,500 250 11.1%
557000 - Uniforms/ Laundry 74 - - - - 0.0%
561000 - Local - In-Service Meals 330 50 50 50 - 0.0%
567000 - Rental & Use 57,035 49,842 49,842 69,205 19,363 38.8%
Total 194,696 195,245 231,544 256,875 25,331 10.9%
1430 - Winter Lights
Significant Changes
FY21AdoptedBudget
FY22AdoptedBudget
Increase /(Decrease)
Object - Object Name / Reason for Change
536000 - Miscellaneous Professional Services 31,600 36,600 5,000
Increased by $5000 due to contract price increase for tree wrapping.
541000 - Advertising 17,000 12,000 (5,000)
Decreased due to no longer needing as much promotion for festival.
567000 - Rental & Use 49,842 69,205 19,363
Increased by $19,363 due to additional rentals needed to Covid safety measures.
283

General Fund Departmental BudgetsParks, Recreation & Culture - Activity Analysis
FY22 Budget
Budget SummaryFY20
ActualsFY21
Projection
FY21AdoptedBudget
FY22AdoptedBudget Chg % Chg
By Object SummaryPersonnel Services 31,007 55,042 75,402 77,220 1,818 2.4%
Operating 163,688 140,203 156,142 179,655 23,513 15.1%
Total 194,696 195,245 231,544 256,875 25,331 10.9%
284

General Fund Departmental BudgetsParks, Recreation & Culture - Activity Analysis
FY22 Budget
Budget SummaryFY20
ActualsFY21
Projection
FY21AdoptedBudget
FY22AdoptedBudget Chg % Chg
By Object501000 - Full-Time Wages 551,939 495,729 552,215 463,440 (88,775) (16.1%)
505200 - Other Taxable Comp.-GFIT 470 1,512 1,344 1,092 (252) (18.8%)
507000 - Vacation & Sick Payouts 1,582 4,400 - - - 0.0%
508000 - Overtime Wages 2,276 500 - - - 0.0%
509000 - Part-Time Wages 90,180 40,000 131,620 143,311 11,691 8.9%
510000 - FICA Taxes 48,364 41,136 54,175 47,968 (6,207) (11.5%)
514200 - Vision Benefit 40 417 497 486 (11) (2.2%)
514210 - Health Insurance 84,348 74,688 85,293 90,785 5,492 6.4%
514220 - Dental Benefit 1,518 4,107 4,885 4,711 (174) (3.6%)
514230 - Long-Term Care Benefit 424 975 1,166 1,079 (87) (7.5%)
514240 - Life Ins and Disability Benefit 5,433 4,986 5,748 4,849 (899) (15.6%)
515000 - Retirement (401A) 43,934 39,658 46,018 38,610 (7,408) (16.1%)
515100 - Retirement Health Savings(RHS) 9,310 10,190 9,406 4,977 (4,429) (47.1%)
515200 - Medicare Retirement HealthSavings (RHS) 1,616 467 2,084 3,916 1,832 87.9%
516000 - Savings Plan (401K) 15,386 14,871 17,256 14,479 (2,777) (16.1%)
522000 - General Operating Supplies 30,397 11,000 22,035 28,385 6,350 28.8%
524000 - Supplies/Resale - - - 2,000 2,000 100.0%
526000 - Machinery/Equipment 634 500 500 500 - 0.0%
531000 - IT (Non-Consultant) Services 1,256 1,127 1,127 4,975 3,848 341.4%
531500 - Software Licenses - 150 - - - 0.0%
1436 - Special Events
Significant Changes
FY21AdoptedBudget
FY22AdoptedBudget
Increase /(Decrease)
Object - Object Name / Reason for Change
522000 - General Operating Supplies 22,035 28,385 6,350
Increased by $7850 due to modest SummerFest programming.
538000 - Performances & Entertainment 33,320 45,900 12,580
Increased by $12,580 due to inclusion of modest SummerFest programming.
567000 - Rental & Use 92,638 107,675 15,037
Increased by $15,037 due to modest SummerFest programming
285

General Fund Departmental BudgetsParks, Recreation & Culture - Activity Analysis
FY22 Budget
Budget SummaryFY20
ActualsFY21
Projection
FY21AdoptedBudget
FY22AdoptedBudget Chg % Chg
By Object531600 - Software MaintenanceAgreements 2,470 3,315 3,315 - (3,315) (100.0%)
533000 - Legal 210 150 330 560 230 69.7%
536000 - Miscellaneous ProfessionalServices 34,006 58,000 77,469 81,169 3,700 4.8%
536500 - Investigations 156 75 200 200 - 0.0%
536800 - Security Services 18,692 - 19,650 18,450 (1,200) (6.1%)
538000 - Performances & Entertainment 44,578 15,000 33,320 45,900 12,580 37.8%
541000 - Advertising 5,210 18,920 18,920 18,520 (400) (2.1%)
543000 - Contributions 100 - 450 450 - 0.0%
544000 - Dues/Memberships/Certification 320 400 400 550 150 37.5%
546000 - Conf./Seminar/ClassRegistration 3,270 - 1,511 1,511 - 0.0%
546300 - In-Service Training 235 300 - 250 250 100.0%
547000 - Travel Expense 2,267 - 1,750 1,750 - 0.0%
551100 - Cellular Phone 577 650 650 720 70 10.8%
552500 - Gasoline Expense 18 - - - - 0.0%
553000 - Printing & Binding 4,651 3,850 15,421 15,851 430 2.8%
554000 - Signage 3,324 6,500 12,560 14,470 1,910 15.2%
556000 - Postage 139 600 1,500 1,500 - 0.0%
557000 - Uniforms/ Laundry - - 550 550 - 0.0%
560000 - Miscellaneous - 3,400 13,500 12,000 (1,500) (11.1%)
561000 - Local - In-Service Meals 173 - - - - 0.0%
567000 - Rental & Use 38,134 70,000 92,638 107,675 15,037 16.2%
567100 - Rental of Facilities 435 1,100 2,223 2,588 365 16.4%
Total 1,048,071 928,673 1,231,726 1,180,227 (51,499) (4.2%)
Budget SummaryFY20
ActualsFY21
Projection
FY21AdoptedBudget
FY22AdoptedBudget Chg % Chg
By Object SummaryPersonnel Services 856,819 733,636 911,707 819,703 (92,004) (10.1%)
Operating 191,252 195,037 320,019 360,524 40,505 12.7%
Total 1,048,071 928,673 1,231,726 1,180,227 (51,499) (4.2%)
286

General Fund Departmental BudgetsParks, Recreation & Culture - Activity Analysis
FY22 Budget
Budget SummaryFY20
ActualsFY21
Projection
FY21AdoptedBudget
FY22AdoptedBudget Chg % Chg
By Object501000 - Full-Time Wages 98,859 99,136 96,522 98,548 2,026 2.1%
505200 - Other Taxable Comp.-GFIT - 420 336 336 - 0.0%
508000 - Overtime Wages 5 - - - - 0.0%
509000 - Part-Time Wages 53,008 38,000 71,594 77,142 5,548 7.7%
510000 - FICA Taxes 11,291 10,523 13,194 13,781 587 4.4%
514200 - Vision Benefit (16) 100 92 92 - 0.0%
514210 - Health Insurance 16,325 17,681 16,321 17,365 1,044 6.4%
514220 - Dental Benefit (215) 966 891 891 - 0.0%
514230 - Long-Term Care Benefit 144 144 145 155 10 6.9%
514240 - Life Ins and Disability Benefit 960 998 983 1,000 17 1.7%
515000 - Retirement (401A) 7,909 7,931 8,044 8,212 168 2.1%
516000 - Savings Plan (401K) 3,049 2,974 3,016 3,080 64 2.1%
521000 - Office Supplies 440 500 500 500 - 0.0%
522000 - General Operating Supplies 3,256 5,000 5,000 8,000 3,000 60.0%
524000 - Supplies/Resale 4,432 4,500 4,500 4,500 - 0.0%
526000 - Machinery/Equipment 35 500 500 2,200 1,700 340.0%
531000 - IT (Non-Consultant) Services - - - 642 642 100.0%
531600 - Software MaintenanceAgreements 1,002 1,197 1,197 432 (765) (63.9%)
533000 - Legal - 90 90 120 30 33.3%
536000 - Miscellaneous ProfessionalServices - - - 2,500 2,500 100.0%
536300 - Contract Cleaning - - 200 400 200 100.0%
536500 - Investigations - - - 75 75 100.0%
538000 - Performances & Entertainment 1,960 3,500 4,500 4,000 (500) (11.1%)
541000 - Advertising 1,013 1,500 2,000 4,000 2,000 100.0%
1437 - Museums
Significant Changes
FY21AdoptedBudget
FY22AdoptedBudget
Increase /(Decrease)
Object - Object Name / Reason for Change
553000 - Printing & Binding 2,500 7,925 5,425
Increased due to a one-time expense for proposed NASA Education program.
287

General Fund Departmental BudgetsParks, Recreation & Culture - Activity Analysis
FY22 Budget
Budget SummaryFY20
ActualsFY21
Projection
FY21AdoptedBudget
FY22AdoptedBudget Chg % Chg
By Object544000 - Dues/Memberships/Certification 258 200 700 200 (500) (71.4%)
546000 - Conf./Seminar/ClassRegistration 594 200 400 400 - 0.0%
546300 - In-Service Training - 150 - 450 450 100.0%
547000 - Travel Expense 253 - - - - 0.0%
551100 - Cellular Phone 333 480 480 960 480 100.0%
553000 - Printing & Binding 1,131 1,300 2,500 7,925 5,425 217.0%
554000 - Signage 358 2,000 2,000 4,000 2,000 100.0%
556000 - Postage - - 100 100 - 0.0%
567000 - Rental & Use 225 700 1,880 1,410 (470) (25.0%)
Total 206,610 200,690 237,685 263,416 25,731 10.8%
Budget SummaryFY20
ActualsFY21
Projection
FY21AdoptedBudget
FY22AdoptedBudget Chg % Chg
By Object SummaryPersonnel Services 191,319 178,873 211,138 220,602 9,464 4.5%
Operating 15,291 21,817 26,547 42,814 16,267 61.3%
Total 206,610 200,690 237,685 263,416 25,731 10.8%
288

General Fund Departmental BudgetsParks, Recreation & Culture - Activity Analysis
FY22 Budget
Budget SummaryFY20
ActualsFY21
Projection
FY21AdoptedBudget
FY22AdoptedBudget Chg % Chg
By Object501000 - Full-Time Wages 173,836 132,764 180,239 196,668 16,429 9.1%
505200 - Other Taxable Comp.-GFIT 340 840 924 1,008 84 9.1%
507000 - Vacation & Sick Payouts 2,808 2,800 - - - 0.0%
508000 - Overtime Wages 1,611 - - - - 0.0%
509000 - Part-Time Wages 65,571 32,038 80,094 81,014 920 1.1%
510000 - FICA Taxes 17,939 12,672 20,562 21,947 1,385 6.7%
514100 - Group Insurance/Retirees 147 - - - - 0.0%
514200 - Vision Benefit (32) 200 263 271 8 3.0%
514210 - Health Insurance 35,384 36,106 45,124 50,259 5,135 11.4%
514220 - Dental Benefit 634 2,391 2,943 3,010 67 2.3%
514230 - Long-Term Care Benefit 541 288 423 465 42 9.9%
514240 - Life Ins and Disability Benefit 1,611 1,340 1,890 2,060 170 9.0%
515000 - Retirement (401A) 13,840 10,620 15,019 16,389 1,370 9.1%
515050 - Supplemental Retirement (401A) 951 2,392 2,419 2,480 61 2.5%
515100 - Retirement Health Savings(RHS) 3,791 - - - - 0.0%
515200 - Medicare Retirement HealthSavings (RHS) 1,616 - - 2,000 2,000 100.0%
516000 - Savings Plan (401K) 5,190 3,984 5,633 6,146 513 9.1%
521000 - Office Supplies 197 300 300 300 - 0.0%
522000 - General Operating Supplies 3,422 3,130 6,260 6,000 (260) (4.2%)
524000 - Supplies/Resale 4,906 680 6,800 6,800 - 0.0%
525000 - Furniture/Fixture 1,465 2,000 2,000 2,000 - 0.0%
526000 - Machinery/Equipment 4,424 2,000 2,000 1,000 (1,000) (50.0%)
531000 - IT (Non-Consultant) Services 50 - - 963 963 100.0%
531500 - Software Licenses 226 300 300 - (300) (100.0%)
531600 - Software MaintenanceAgreements 760 1,020 1,020 - (1,020) (100.0%)
533000 - Legal 330 30 150 150 - 0.0%
536000 - Miscellaneous ProfessionalServices 1,543 1,571 330 500 170 51.5%
536500 - Investigations 63 - 90 90 - 0.0%
538000 - Performances & Entertainment 6,827 2,000 2,000 4,000 2,000 100.0%
1438 - Kentlands Mansion
289

General Fund Departmental BudgetsParks, Recreation & Culture - Activity Analysis
FY22 Budget
Budget SummaryFY20
ActualsFY21
Projection
FY21AdoptedBudget
FY22AdoptedBudget Chg % Chg
By Object541000 - Advertising 13,401 14,500 14,500 14,500 - 0.0%
542000 - Awards & Presentations 91 - - - - 0.0%
544000 - Dues/Memberships/Certification 40 575 575 200 (375) (65.2%)
546000 - Conf./Seminar/ClassRegistration 12 - 1,105 1,105 - 0.0%
546300 - In-Service Training 180 - - 375 375 100.0%
547000 - Travel Expense 1,942 - 1,990 1,990 - 0.0%
553000 - Printing & Binding 1,891 2,000 2,000 2,000 - 0.0%
554000 - Signage 1,000 800 800 1,000 200 25.0%
556000 - Postage - 350 700 700 - 0.0%
557000 - Uniforms/ Laundry - 300 300 300 - 0.0%
573000 - R&M - Machinery & Equipment 73 124 124 124 - 0.0%
Total 368,617 270,115 398,877 427,814 28,937 7.3%
Budget SummaryFY20
ActualsFY21
Projection
FY21AdoptedBudget
FY22AdoptedBudget Chg % Chg
By Object SummaryPersonnel Services 325,776 238,435 355,533 383,717 28,184 7.9%
Operating 42,841 31,680 43,344 44,097 753 1.7%
Total 368,617 270,115 398,877 427,814 28,937 7.3%
290

General Fund Departmental BudgetsParks, Recreation & Culture - Activity Analysis
FY22 Budget
Budget SummaryFY20
ActualsFY21
Projection
FY21AdoptedBudget
FY22AdoptedBudget Chg % Chg
By Object501000 - Full-Time Wages 392,298 330,426 400,866 317,420 (83,446) (20.8%)
505200 - Other Taxable Comp.-GFIT 533 420 672 756 84 12.5%
507000 - Vacation & Sick Payouts 3,773 3,800 - - - 0.0%
508000 - Overtime Wages 179 - - - - 0.0%
509000 - Part-Time Wages 146,157 64,345 184,339 216,199 31,860 17.3%
510000 - FICA Taxes 40,763 30,232 46,098 41,891 (4,207) (9.1%)
514200 - Vision Benefit (47) 240 295 223 (72) (24.4%)
514210 - Health Insurance 40,522 42,205 47,503 34,218 (13,285) (28.0%)
514220 - Dental Benefit 2,646 3,323 3,496 2,622 (874) (25.0%)
514230 - Long-Term Care Benefit 484 576 725 627 (98) (13.5%)
514240 - Life Ins and Disability Benefit 4,047 3,315 4,157 3,287 (870) (20.9%)
515000 - Retirement (401A) 30,936 26,435 33,406 26,452 (6,954) (20.8%)
515100 - Retirement Health Savings(RHS) 4,266 4,629 4,273 4,547 274 6.4%
515200 - Medicare Retirement HealthSavings (RHS) 2,923 1,992 2,000 4,083 2,083 104.2%
516000 - Savings Plan (401K) 9,636 8,156 10,763 8,026 (2,737) (25.4%)
521000 - Office Supplies 601 75 575 575 - 0.0%
522000 - General Operating Supplies 32,732 7,065 38,444 52,460 14,016 36.5%
522500 - Program Activities 6,831 - 4,620 7,123 2,503 54.2%
526000 - Machinery/Equipment - - 500 500 - 0.0%
531000 - IT (Non-Consultant) Services - - 120 1,605 1,485 1,237.5%
1415 - Recreation Programs and Sports
Significant Changes
FY21AdoptedBudget
FY22AdoptedBudget
Increase /(Decrease)
Object - Object Name / Reason for Change
522000 - General Operating Supplies 38,444 52,460 14,016
Increase due to restoration of programs and alignment with 3-year averages. $14,000 was cut in FY21 due topredicted COVID impact.
537000 - Instructor Services 12,174 4,912 (7,262)
Decrease due to the discontinuation of the Maryland Volleyball Clinic and retirement of tennis instructor.
550000 - Electric 28,323 34,800 6,477
Increase due to projected electric costs based on 3-year average actuals.
291

General Fund Departmental BudgetsParks, Recreation & Culture - Activity Analysis
FY22 Budget
Budget SummaryFY20
ActualsFY21
Projection
FY21AdoptedBudget
FY22AdoptedBudget Chg % Chg
By Object531600 - Software MaintenanceAgreements 950 1,063 1,275 - (1,275) (100.0%)
536000 - Miscellaneous ProfessionalServices 650 - 1,700 900 (800) (47.1%)
536500 - Investigations 1,904 538 3,000 3,000 - 0.0%
537000 - Instructor Services 8,875 - 12,174 4,912 (7,262) (59.7%)
541000 - Advertising 212 496 800 800 - 0.0%
542000 - Awards & Presentations 15,000 4,205 24,612 24,599 (13) (0.1%)
544000 - Dues/Memberships/Certification 2,655 - 3,875 2,600 (1,275) (32.9%)
546000 - Conf./Seminar/ClassRegistration 449 500 1,600 2,290 690 43.1%
546300 - In-Service Training - 90 - 1,900 1,900 100.0%
547000 - Travel Expense 1,143 - 1,650 2,310 660 40.0%
549000 - Scholarship Management 1,373 400 1,000 1,300 300 30.0%
550000 - Electric 32,638 20,055 28,323 34,800 6,477 22.9%
551100 - Cellular Phone 494 720 720 720 - 0.0%
553000 - Printing & Binding 6,130 600 7,247 9,114 1,867 25.8%
554000 - Signage 788 1,250 1,610 2,000 390 24.2%
556000 - Postage 580 900 489 490 1 0.2%
557000 - Uniforms/ Laundry 216 570 2,496 2,254 (242) (9.7%)
561000 - Local - In-Service Meals 62 - - - - 0.0%
567000 - Rental & Use 1,092 1,300 1,300 1,300 - 0.0%
567100 - Rental of Facilities 31,517 1,000 45,375 44,000 (1,375) (3.0%)
Total 826,006 560,921 922,097 861,903 (60,194) (6.5%)
Budget SummaryFY20
ActualsFY21
Projection
FY21AdoptedBudget
FY22AdoptedBudget Chg % Chg
By Object SummaryPersonnel Services 679,115 520,094 738,593 660,351 (78,242) (10.6%)
Operating 146,891 40,827 183,504 201,552 18,048 9.8%
Total 826,006 560,921 922,097 861,903 (60,194) (6.5%)
292

General Fund Departmental BudgetsParks, Recreation & Culture - Activity Analysis
FY22 Budget
Budget SummaryFY20
ActualsFY21
Projection
FY21AdoptedBudget
FY22AdoptedBudget Chg % Chg
By Object501000 - Full-Time Wages 155,147 101,986 130,273 200,675 70,402 54.0%
505100 - Other Taxable Comp.-Multilingual 4,160 2,080 2,080 - (2,080) (100.0%)
505200 - Other Taxable Comp.-GFIT 135 672 336 1,176 840 250.0%
507000 - Vacation & Sick Payouts 3,655 3,700 - - - 0.0%
509000 - Part-Time Wages 85,285 126,930 159,266 176,206 16,940 10.6%
510000 - FICA Taxes 18,834 17,562 22,750 29,560 6,810 29.9%
514200 - Vision Benefit 24 100 74 231 157 212.2%
514210 - Health Insurance 16,118 14,178 17,092 41,235 24,143 141.3%
514220 - Dental Benefit (108) 839 860 2,295 1,435 166.9%
514230 - Long-Term Care Benefit 157 233 290 473 183 63.1%
514240 - Life Ins and Disability Benefit 1,302 1,029 1,384 2,108 724 52.3%
515000 - Retirement (401A) 11,798 8,159 10,856 16,723 5,867 54.0%
515100 - Retirement Health Savings(RHS) 2,533 5,095 - 4,977 4,977 100.0%
515200 - Medicare Retirement HealthSavings (RHS) 77 967 - 4,083 4,083 100.0%
516000 - Savings Plan (401K) 4,486 3,060 4,071 6,271 2,200 54.0%
521000 - Office Supplies 228 200 200 200 - 0.0%
522000 - General Operating Supplies 4,434 4,500 8,725 8,725 - 0.0%
522500 - Program Activities 8,654 1,200 24,015 40,445 16,430 68.4%
526000 - Machinery/Equipment 700 - 1,000 1,000 - 0.0%
531000 - IT (Non-Consultant) Services 566 360 360 1,584 1,224 340.0%
531600 - Software MaintenanceAgreements 1,520 2,127 2,550 - (2,550) (100.0%)
536500 - Investigations 125 31 - - - 0.0%
1417 - Youth Services
Significant Changes
FY21AdoptedBudget
FY22AdoptedBudget
Increase /(Decrease)
Object - Object Name / Reason for Change
522500 - Program Activities 24,015 40,445 16,430
Increase of $14,820 due to stipends associated with new workforce development program (G-works). Additional$1,610 increase due to anticipated admission fee increase for out-of-school-time field trip costs.
293
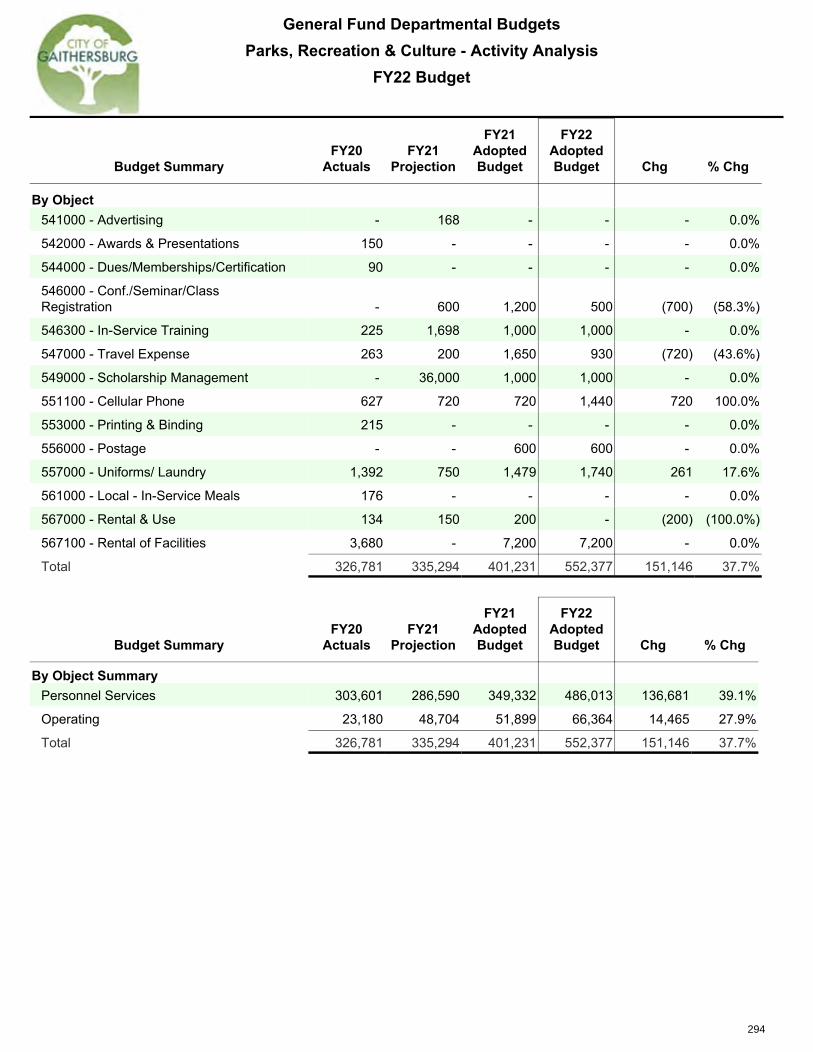
General Fund Departmental BudgetsParks, Recreation & Culture - Activity Analysis
FY22 Budget
Budget SummaryFY20
ActualsFY21
Projection
FY21AdoptedBudget
FY22AdoptedBudget Chg % Chg
By Object541000 - Advertising - 168 - - - 0.0%
542000 - Awards & Presentations 150 - - - - 0.0%
544000 - Dues/Memberships/Certification 90 - - - - 0.0%
546000 - Conf./Seminar/ClassRegistration - 600 1,200 500 (700) (58.3%)
546300 - In-Service Training 225 1,698 1,000 1,000 - 0.0%
547000 - Travel Expense 263 200 1,650 930 (720) (43.6%)
549000 - Scholarship Management - 36,000 1,000 1,000 - 0.0%
551100 - Cellular Phone 627 720 720 1,440 720 100.0%
553000 - Printing & Binding 215 - - - - 0.0%
556000 - Postage - - 600 600 - 0.0%
557000 - Uniforms/ Laundry 1,392 750 1,479 1,740 261 17.6%
561000 - Local - In-Service Meals 176 - - - - 0.0%
567000 - Rental & Use 134 150 200 - (200) (100.0%)
567100 - Rental of Facilities 3,680 - 7,200 7,200 - 0.0%
Total 326,781 335,294 401,231 552,377 151,146 37.7%
Budget SummaryFY20
ActualsFY21
Projection
FY21AdoptedBudget
FY22AdoptedBudget Chg % Chg
By Object SummaryPersonnel Services 303,601 286,590 349,332 486,013 136,681 39.1%
Operating 23,180 48,704 51,899 66,364 14,465 27.9%
Total 326,781 335,294 401,231 552,377 151,146 37.7%
294

General Fund Departmental BudgetsParks, Recreation & Culture - Activity Analysis
FY22 Budget
Budget SummaryFY20
ActualsFY21
Projection
FY21AdoptedBudget
FY22AdoptedBudget Chg % Chg
By Object509000 - Part-Time Wages 286,096 173,650 455,558 361,203 (94,355) (20.7%)
510000 - FICA Taxes 21,886 13,284 34,850 27,632 (7,218) (20.7%)
521000 - Office Supplies 114 400 400 500 100 25.0%
522000 - General Operating Supplies 11,559 10,700 20,763 17,823 (2,940) (14.2%)
522500 - Program Activities 28,017 4,500 34,080 17,870 (16,210) (47.6%)
526000 - Machinery/Equipment 2,995 500 1,750 750 (1,000) (57.1%)
536500 - Investigations - 1,000 1,200 1,200 - 0.0%
538000 - Performances & Entertainment 540 1,940 1,350 6,400 5,050 374.1%
541000 - Advertising 15 3,500 3,500 3,500 - 0.0%
544000 - Dues/Memberships/Certification 455 860 3,325 - (3,325) (100.0%)
546000 - Conf./Seminar/ClassRegistration 15 - 150 700 550 366.7%
546300 - In-Service Training 1,357 3,750 2,500 4,850 2,350 94.0%
547000 - Travel Expense - - 50 1,624 1,574 3,148.0%
549000 - Scholarship Management 30,693 5,300 40,000 29,000 (11,000) (27.5%)
551100 - Cellular Phone 215 760 810 855 45 5.6%
553000 - Printing & Binding 1,432 800 2,000 2,000 - 0.0%
554000 - Signage - - - 650 650 100.0%
1418 - Summer Programs
Significant Changes
FY21AdoptedBudget
FY22AdoptedBudget
Increase /(Decrease)
Object - Object Name / Reason for Change
522500 - Program Activities 34,080 17,870 (16,210)
Decrease due to reduced camper slots for summer of 2021 and expected field trip reduction/cancellations due toCOVID capacity restrictions.
538000 - Performances & Entertainment 1,350 6,400 5,050
Increase due to additional onsite performers and entertainers in lieu of field trips.
549000 - Scholarship Management 40,000 29,000 (11,000)
Decrease due to reduced number of camper slots available in summer 2021, and correlating decrease in thenumber of scholarships awarded.
567100 - Rental of Facilities 52,000 42,500 (9,500)
Decrease due to maximized use of available City facilities during COVID for summer 2021, and reduced costsfor MCPS/CUPF building use.
295

General Fund Departmental BudgetsParks, Recreation & Culture - Activity Analysis
FY22 Budget
Budget SummaryFY20
ActualsFY21
Projection
FY21AdoptedBudget
FY22AdoptedBudget Chg % Chg
By Object556000 - Postage 289 1,000 1,175 1,175 - 0.0%
557000 - Uniforms/ Laundry 1,828 745 1,920 1,931 11 0.6%
567000 - Rental & Use 16,608 - 21,000 20,500 (500) (2.4%)
567100 - Rental of Facilities 37,107 6,000 52,000 42,500 (9,500) (18.3%)
Total 441,221 228,689 678,381 542,663 (135,718) (20.0%)
Budget SummaryFY20
ActualsFY21
Projection
FY21AdoptedBudget
FY22AdoptedBudget Chg % Chg
By Object SummaryPersonnel Services 307,982 186,934 490,408 388,835 (101,573) (20.7%)
Operating 133,239 41,755 187,973 153,828 (34,145) (18.2%)
Total 441,221 228,689 678,381 542,663 (135,718) (20.0%)
296

General Fund Departmental BudgetsParks, Recreation & Culture - Activity Analysis
FY22 Budget
Budget SummaryFY20
ActualsFY21
Projection
FY21AdoptedBudget
FY22AdoptedBudget Chg % Chg
By Object501000 - Full-Time Wages 115,580 120,498 110,041 125,822 15,781 14.3%
505200 - Other Taxable Comp.-GFIT 120 420 336 336 - 0.0%
505300 - Other Taxable Comp.-HousingStipend 3,300 3,900 3,600 3,600 - 0.0%
507000 - Vacation & Sick Payouts 1,858 1,900 - - - 0.0%
508000 - Overtime Wages 1,113 243 - - - 0.0%
509000 - Part-Time Wages 48,206 5,000 71,409 74,227 2,818 3.9%
510000 - FICA Taxes 12,495 9,951 14,531 16,006 1,475 10.2%
514200 - Vision Benefit (23) 200 129 184 55 42.6%
514210 - Health Insurance 30,426 41,366 30,411 40,629 10,218 33.6%
514220 - Dental Benefit 1,356 2,391 1,745 2,206 461 26.4%
514230 - Long-Term Care Benefit 168 288 290 310 20 6.9%
514240 - Life Ins and Disability Benefit 1,123 1,250 1,188 1,354 166 14.0%
515000 - Retirement (401A) 9,245 9,640 9,170 10,485 1,315 14.3%
515200 - Medicare Retirement HealthSavings (RHS) 2,000 1,992 2,000 2,000 - 0.0%
516000 - Savings Plan (401K) 3,475 3,615 3,439 3,932 493 14.3%
521000 - Office Supplies 20 300 300 300 - 0.0%
522000 - General Operating Supplies 5,347 3,000 6,500 6,500 - 0.0%
522500 - Program Activities 285 - 450 2,970 2,520 560.0%
525000 - Furniture/Fixture 900 1,200 2,400 1,000 (1,400) (58.3%)
526000 - Machinery/Equipment 3,733 1,600 2,100 3,300 1,200 57.1%
531000 - IT (Non-Consultant) Services 50 - - - - 0.0%
531500 - Software Licenses - - - 300 300 100.0%
531600 - Software MaintenanceAgreements 1,330 1,489 1,785 - (1,785) (100.0%)
536000 - Miscellaneous ProfessionalServices 710 800 1,600 1,600 - 0.0%
536500 - Investigations 156 - - - - 0.0%
541000 - Advertising 539 400 400 400 - 0.0%
551100 - Cellular Phone 747 720 720 720 - 0.0%
560000 - Miscellaneous 595 - - - - 0.0%
Total 244,854 212,163 264,544 298,181 33,637 12.7%
1419 - Gaithersburg Youth Center at Robertson Park
297

General Fund Departmental BudgetsParks, Recreation & Culture - Activity Analysis
FY22 Budget
Budget SummaryFY20
ActualsFY21
Projection
FY21AdoptedBudget
FY22AdoptedBudget Chg % Chg
By Object SummaryPersonnel Services 230,442 202,654 248,289 281,091 32,802 13.2%
Operating 14,412 9,509 16,255 17,090 835 5.1%
Total 244,854 212,163 264,544 298,181 33,637 12.7%
298

General Fund Departmental BudgetsParks, Recreation & Culture - Activity Analysis
FY22 Budget
Budget SummaryFY20
ActualsFY21
Projection
FY21AdoptedBudget
FY22AdoptedBudget Chg % Chg
By Object509000 - Part-Time Wages 18,499 29,755 37,355 38,780 1,425 3.8%
510000 - FICA Taxes 1,415 2,276 2,857 2,967 110 3.9%
521000 - Office Supplies - 150 175 150 (25) (14.3%)
522000 - General Operating Supplies 995 1,130 1,250 1,000 (250) (20.0%)
522500 - Program Activities 244 450 700 500 (200) (28.6%)
524000 - Supplies/Resale - 250 500 400 (100) (20.0%)
526000 - Machinery/Equipment - - 250 250 - 0.0%
531600 - Software MaintenanceAgreements 190 213 255 - (255) (100.0%)
536000 - Miscellaneous ProfessionalServices - 6,000 - - - 0.0%
536500 - Investigations 63 - - - - 0.0%
541000 - Advertising 361 500 500 400 (100) (20.0%)
546300 - In-Service Training - 480 - - - 0.0%
553000 - Printing & Binding 46 275 275 275 - 0.0%
554000 - Signage - - - 400 400 100.0%
557000 - Uniforms/ Laundry - - - 100 100 100.0%
Total 21,813 41,479 44,117 45,222 1,105 2.5%
Budget SummaryFY20
ActualsFY21
Projection
FY21AdoptedBudget
FY22AdoptedBudget Chg % Chg
By Object SummaryPersonnel Services 19,914 32,031 40,212 41,747 1,535 3.8%
Operating 1,900 9,448 3,905 3,475 (430) (11.0%)
Total 21,813 41,479 44,117 45,222 1,105 2.5%
1420 - Skate Park
299

General Fund Departmental BudgetsParks, Recreation & Culture - Activity Analysis
FY22 Budget
Budget SummaryFY20
ActualsFY21
Projection
FY21AdoptedBudget
FY22AdoptedBudget Chg % Chg
By Object501000 - Full-Time Wages 79,310 49,718 108,776 51,111 (57,665) (53.0%)
505100 - Other Taxable Comp.-Multilingual 693 2,080 - 2,080 2,080 100.0%
505200 - Other Taxable Comp.-GFIT (108) - 420 - (420) (100.0%)
507000 - Vacation & Sick Payouts 2,867 2,900 - - - 0.0%
508000 - Overtime Wages 68 334 - - - 0.0%
509000 - Part-Time Wages 108,392 5,000 140,886 143,018 2,132 1.5%
510000 - FICA Taxes 13,996 4,371 19,477 15,173 (4,304) (22.1%)
514200 - Vision Benefit (16) 39 118 37 (81) (68.6%)
514210 - Health Insurance 26,072 9,259 21,054 9,093 (11,961) (56.8%)
514220 - Dental Benefit 116 - 737 - (737) (100.0%)
514230 - Long-Term Care Benefit 146 144 285 155 (130) (45.6%)
514240 - Life Ins and Disability Benefit 1,012 519 1,140 555 (585) (51.3%)
515000 - Retirement (401A) 6,345 3,978 9,065 4,259 (4,806) (53.0%)
515100 - Retirement Health Savings(RHS) 182 467 466 430 (36) (7.7%)
515200 - Medicare Retirement HealthSavings (RHS) 846 1,992 3,916 2,000 (1,916) (48.9%)
516000 - Savings Plan (401K) 2,379 1,492 3,400 1,597 (1,803) (53.0%)
521000 - Office Supplies 365 375 375 300 (75) (20.0%)
522000 - General Operating Supplies 6,599 4,200 8,400 7,700 (700) (8.3%)
522500 - Program Activities 1,406 - 1,600 2,870 1,270 79.4%
525000 - Furniture/Fixture 3,200 2,200 2,250 2,000 (250) (11.1%)
526000 - Machinery/Equipment 3,681 2,600 5,300 5,300 - 0.0%
531000 - IT (Non-Consultant) Services 376 1,334 327 1,346 1,019 311.6%
531600 - Software MaintenanceAgreements 3,738 4,715 5,537 1,202 (4,335) (78.3%)
536000 - Miscellaneous ProfessionalServices - - - 1,000 1,000 100.0%
536500 - Investigations 29 31 - - - 0.0%
546300 - In-Service Training - 120 - - - 0.0%
549000 - Scholarship Management - 113 - 374 374 100.0%
551100 - Cellular Phone 473 720 720 720 - 0.0%
1424 - Gaithersburg Youth Center at Olde Towne
300

General Fund Departmental BudgetsParks, Recreation & Culture - Activity Analysis
FY22 Budget
Budget SummaryFY20
ActualsFY21
Projection
FY21AdoptedBudget
FY22AdoptedBudget Chg % Chg
By Object553000 - Printing & Binding - 250 250 250 - 0.0%
573000 - R&M - Machinery & Equipment 2,306 2,353 2,790 2,790 - 0.0%
575000 - R&M - Furniture & Equipment - 1,200 1,000 1,000 - 0.0%
Total 264,473 102,504 338,289 256,360 (81,929) (24.2%)
Budget SummaryFY20
ActualsFY21
Projection
FY21AdoptedBudget
FY22AdoptedBudget Chg % Chg
By Object SummaryPersonnel Services 242,301 82,293 309,740 229,508 (80,232) (25.9%)
Operating 22,172 20,211 28,549 26,852 (1,697) (5.9%)
Total 264,473 102,504 338,289 256,360 (81,929) (24.2%)
301

Miniature Golf Course at Bohrer Park
302

DEPARTMENT OF PLANNING & CODE ADMINISTRATION
Director of Planning & Code Administration
Planning & CodeAdministration
Permits and Inspections
PlanningNeighborhood
Services
Animal Control
303

General Fund Departmental BudgetDepartment Overview - Planning & Code
AdministrationFY22 Budget
The department consists of five divisions: Planning and Code Administration, Planning, Permits and Inspections,Neighborhood Services, and Animal Control.
Planning and Code Administration is responsible for providing administrative support for all five divisions. Primarily,staff processes all planning, permitting, licensing, and passport applications and provides assistance to developers,contractors, homeowners, and the general public. The division also provides statistical reports and analysis ofdepartmental activities for budgetary and planning purposes.
Planning is responsible for providing information to citizens, advising officials on zoning and development matters, andprocessing planning-related applications including, but not limited to: rezonings, text amendments, site development,historic area work permits, abandonments, variances, special exceptions, administrative reviews, road code waivers,floodplain administration, transportation project reviews, and subdivision reviews. Staff is also responsible for theadoption and revision of the Elements of the City’s Master Plan. Staff supports the Planning and Historic DistrictCommissions and the Board of Appeals. Promotion of public participation involving citizens, major interest groups, andpublic and private stakeholders are encouraged throughout these many processes. Staff also serves as liaisons to theEnvironmental Affairs Committee and the Transportation Committee. Additionally, the division processes NaturalResource Inventories, Forest Conservation Plans and Tree Removal Permits as well as coordinating annual Arbor Daycelebrations.
Permits and Inspections is responsible for building safety on public and private sites via plans examination, permitissuance, and inspections of building safety and fire code aspects of building construction. In addition, this activityensures the quality of public and private improvements such as streets, storm drains, parks, and homeownerassociations (HOAs) through bond administration, permit issuance and inspections. Environmental standards areaccomplished through the issuance of permits and inspections of stormwater management and sediment control.
Neighborhood Services administers and enforces all aspects of City Code including, but not limited to, publicnuisances, rental housing and landlord-tenant affairs. This division also serves as a community liaison for propertymanagers, HOAs and other public agencies.
Animal Control is a subdivision of Neighborhood Services and is responsible for enforcing Animal Control Ordinancesand promoting the humane treatment of all animals. Typical activities include the processing of animal licenses,sponsorship of rabies clinics, community outreach, and oversight of the City’s Dog Exercise Area (DEA).
Services Provided
Planning & Code Administration BudgetSummary
FY20Actuals
FY21Projection
FY21AdoptedBudget
FY22AdoptedBudget Chg % Chg
By Activity1192 - Planning & Code Administration 907,064 936,692 900,823 945,109 44,286 4.9%
1194 - Planning 1,060,787 1,107,842 1,222,045 1,214,751 (7,294) (0.6%)
1196 - Permits & Inspections 1,700,161 1,739,670 1,790,821 1,723,765 (67,056) (3.7%)
1197 - Neighborhood Services 1,183,506 1,183,255 1,235,670 1,201,559 (34,111) (2.8%)
1198 - Animal Control 368,542 344,446 418,019 442,486 24,467 5.9%
Total 5,220,060 5,311,905 5,567,378 5,527,670 (39,708) (0.7%)
304

General Fund Departmental BudgetDepartment Overview - Planning & Code
AdministrationFY22 Budget
Planning & Code AdministrationBudget Summary
FY20Actuals
FY21Projection
FY21AdoptedBudget
FY22AdoptedBudget Chg % Chg
By Object CategoryPersonnel Services 4,865,424 4,973,871 5,166,978 5,101,968 (65,010) (1.3%)
Operating 326,842 338,034 400,400 425,702 25,302 6.3%
Capital 27,794 - - - - 0.0%
Total 5,220,060 5,311,905 5,567,378 5,527,670 (39,708) (0.7%)
Departmental Personnel Schedule
FY20AdoptedBudget
FY21AdoptedBudget
FY22AdoptedBudget
1192 - Planning & Code Administration
Administrative Assistant I 1 1 1
Administrative Technician I 1 1 1
Administrative Technician II 3 3 3
Administrative Technician III 1 1 1
Permitting Manager 1 1 1
Director of Planning & Code Administration 1 1 1
305

General Fund Departmental BudgetDepartment Overview - Planning & Code
AdministrationFY22 Budget
Departmental Personnel Schedule
FY20AdoptedBudget
FY21AdoptedBudget
FY22AdoptedBudget
Subtotal 8 8 8
1194 - Planning
Planner I 5 3 3
Planner II 1 4 4
GIS Planner 1 1 0
Planner III 1 0 1
Community Planning Manager 0 1 1
Long Range Planning Manager 1 1 1
Planning Division Chief 1 0 0
Part-Time Personnel 0.43 0.43 0.44
Subtotal 10.43 10.43 10.44
1196 - Permits & Inspections
Code Inspector 5 5 5
Chief Electrical Reviewer 1 1 1
Commercial Permitting Manager 1 1 1
Permit Coordinator 1 1 1
Site Development Coordinator 1 1 1
Fire Marshal 1 1 1
Fire Inspector 1 1 1
Permits & Inspections Division Chief 1 1 1
Part-Time Personnel 1.96 2.39 2.17
Subtotal 13.96 14.39 14.17
1197 - Neighborhood Services
Neighborhood Services Coordinator 1 1 1
Neighborhood Services Division Chief 1 1 1
Code Compliance Manager 1 1 1
Code Administration Officer II 3 3 3
Code Administration Officer I 5 6 5
Part-Time Personnel 1.01 0.86 0.82
Subtotal 12.01 12.86 11.82
306

General Fund Departmental BudgetDepartment Overview - Planning & Code
AdministrationFY22 Budget
Departmental Personnel Schedule
FY20AdoptedBudget
FY21AdoptedBudget
FY22AdoptedBudget
1198 - Animal Control
Animal Control Officer I 1 1 1
Animal Control Officer II 1 1 1
Animal Control Officer III 1 1 1
Manager of Animal Services 1 1 1
Part-Time Personnel 0.44 0.4 0.41
Subtotal 4.44 4.4 4.41
Full-Time Personnel 45 46 45
Part-Time Personnel 3.83 4.08 3.83
Total 48.83 50.08 48.83
307

General Fund Departmental BudgetsPlanning & Code Administration - Activity Analysis
FY22 Budget
Budget SummaryFY20
ActualsFY21
Projection
FY21AdoptedBudget
FY22AdoptedBudget Chg % Chg
By Object501000 - Full-Time Wages 556,995 572,252 552,579 569,192 16,613 3.0%
505100 - Other Taxable Comp.-Multilingual 4,160 4,160 4,160 4,160 - 0.0%
505200 - Other Taxable Comp.-GFIT 717 1,680 1,344 1,344 - 0.0%
505300 - Other Taxable Comp.-HousingStipend 13,000 7,800 13,200 7,200 (6,000) (45.5%)
507000 - Vacation & Sick Payouts 1,664 1,800 - - - 0.0%
508000 - Overtime Wages 2,489 150 1,560 1,560 - 0.0%
509000 - Part-Time Wages 1,568 - - - - 0.0%
510000 - FICA Taxes 41,860 44,831 43,452 44,374 922 2.1%
514200 - Vision Benefit (14) 360 295 332 37 12.5%
514210 - Health Insurance 63,852 69,145 63,824 67,908 4,084 6.4%
514220 - Dental Benefit 2,511 5,680 5,241 5,241 - 0.0%
514230 - Long-Term Care Benefit 3,317 1,152 1,166 1,240 74 6.3%
514240 - Life Ins and Disability Benefit 4,567 5,734 5,390 5,461 71 1.3%
515000 - Retirement (401A) 44,389 45,781 46,049 47,434 1,385 3.0%
515100 - Retirement Health Savings(RHS) 12,743 14,353 13,249 14,071 822 6.2%
515200 - Medicare Retirement HealthSavings (RHS) 1,769 1,992 2,084 2,000 (84) (4.0%)
516000 - Savings Plan (401K) 16,392 17,168 17,268 17,789 521 3.0%
519000 - Tuition Reimbursement - - - 1,200 1,200 100.0%
521000 - Office Supplies 4,822 5,000 7,000 7,000 - 0.0%
525000 - Furniture/Fixture - 1,000 1,000 1,000 - 0.0%
526000 - Machinery/Equipment - 500 750 750 - 0.0%
530000 - Accounting & Audit 19,315 35,000 20,000 36,000 16,000 80.0%
Significant Changes
FY21AdoptedBudget
FY22AdoptedBudget
Increase /(Decrease)
Object - Object Name / Reason for Change
530000 - Accounting & Audit 20,000 36,000 16,000
Increase resulting from a significant increase in fees for FY21 due to influx of credit card transactions during thepandemic; expect for credit cards to remain preferred method of payment and include eventual online paymentswith CSS for FY22.
1192 - Planning & Code Administration
308
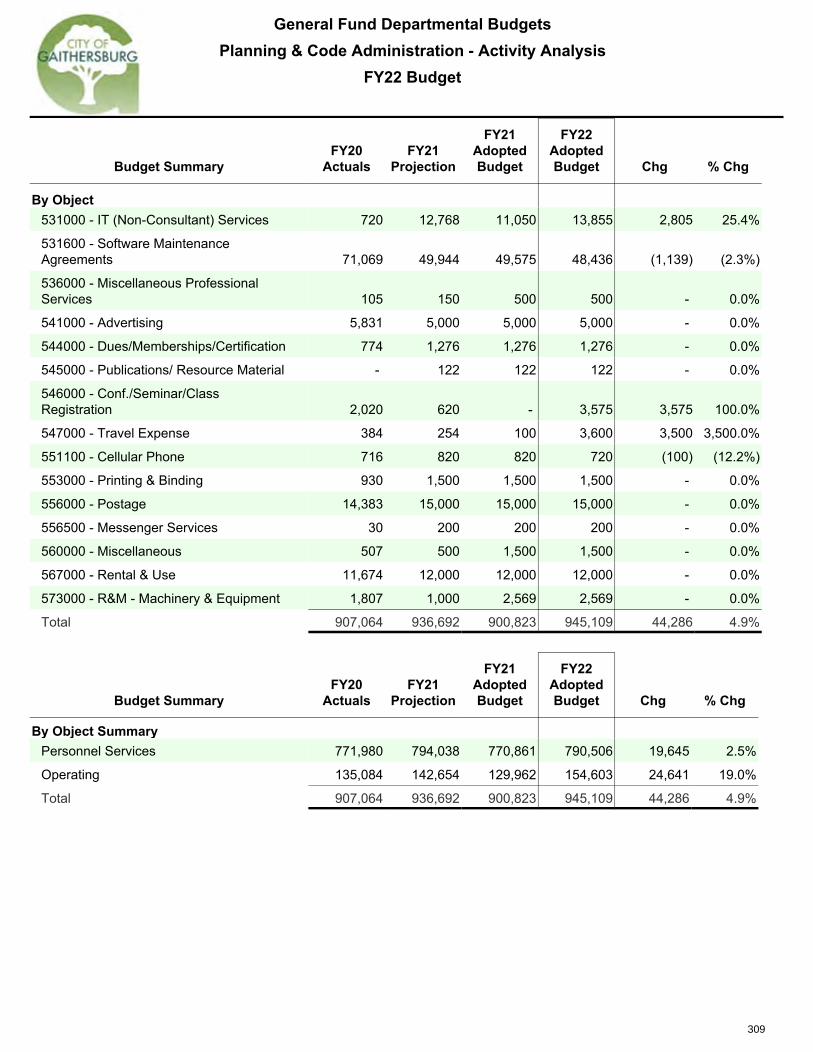
General Fund Departmental BudgetsPlanning & Code Administration - Activity Analysis
FY22 Budget
Budget SummaryFY20
ActualsFY21
Projection
FY21AdoptedBudget
FY22AdoptedBudget Chg % Chg
By Object531000 - IT (Non-Consultant) Services 720 12,768 11,050 13,855 2,805 25.4%
531600 - Software MaintenanceAgreements 71,069 49,944 49,575 48,436 (1,139) (2.3%)
536000 - Miscellaneous ProfessionalServices 105 150 500 500 - 0.0%
541000 - Advertising 5,831 5,000 5,000 5,000 - 0.0%
544000 - Dues/Memberships/Certification 774 1,276 1,276 1,276 - 0.0%
545000 - Publications/ Resource Material - 122 122 122 - 0.0%
546000 - Conf./Seminar/ClassRegistration 2,020 620 - 3,575 3,575 100.0%
547000 - Travel Expense 384 254 100 3,600 3,500 3,500.0%
551100 - Cellular Phone 716 820 820 720 (100) (12.2%)
553000 - Printing & Binding 930 1,500 1,500 1,500 - 0.0%
556000 - Postage 14,383 15,000 15,000 15,000 - 0.0%
556500 - Messenger Services 30 200 200 200 - 0.0%
560000 - Miscellaneous 507 500 1,500 1,500 - 0.0%
567000 - Rental & Use 11,674 12,000 12,000 12,000 - 0.0%
573000 - R&M - Machinery & Equipment 1,807 1,000 2,569 2,569 - 0.0%
Total 907,064 936,692 900,823 945,109 44,286 4.9%
Budget SummaryFY20
ActualsFY21
Projection
FY21AdoptedBudget
FY22AdoptedBudget Chg % Chg
By Object SummaryPersonnel Services 771,980 794,038 770,861 790,506 19,645 2.5%
Operating 135,084 142,654 129,962 154,603 24,641 19.0%
Total 907,064 936,692 900,823 945,109 44,286 4.9%
309

General Fund Departmental BudgetsPlanning & Code Administration - Activity Analysis
FY22 Budget
Budget SummaryFY20
ActualsFY21
Projection
FY21AdoptedBudget
FY22AdoptedBudget Chg % Chg
By Object501000 - Full-Time Wages 689,540 721,441 783,940 779,796 (4,144) (0.5%)
505200 - Other Taxable Comp.-GFIT 1,110 1,680 1,680 1,848 168 10.0%
505300 - Other Taxable Comp.-HousingStipend 2,100 - - - - 0.0%
507000 - Vacation & Sick Payouts 7,039 9,970 - - - 0.0%
508000 - Overtime Wages 137 - - - - 0.0%
509000 - Part-Time Wages 37,336 37,362 36,501 39,393 2,892 7.9%
510000 - FICA Taxes 55,064 58,177 65,404 65,295 (109) (0.2%)
514200 - Vision Benefit 203 545 685 540 (145) (21.2%)
514210 - Health Insurance 94,454 104,749 116,519 111,695 (4,824) (4.1%)
514220 - Dental Benefit 3,202 6,724 7,653 6,603 (1,050) (13.7%)
514230 - Long-Term Care Benefit 797 1,278 1,450 1,550 100 6.9%
514240 - Life Ins and Disability Benefit 6,594 7,251 8,117 8,044 (73) (0.9%)
515000 - Retirement (401A) 73,375 51,634 65,331 58,716 (6,615) (10.1%)
515100 - Retirement Health Savings(RHS) 4,266 4,629 4,273 4,547 274 6.4%
515200 - Medicare Retirement HealthSavings (RHS) 539 5,741 6,000 8,000 2,000 33.3%
516000 - Savings Plan (401K) 20,154 20,950 24,497 22,695 (1,802) (7.4%)
519000 - Tuition Reimbursement (3,815) - - 3,500 3,500 100.0%
525000 - Furniture/Fixture - - 650 650 - 0.0%
526000 - Machinery/Equipment 3,196 932 1,900 1,000 (900) (47.4%)
531000 - IT (Non-Consultant) Services 4,155 4,230 3,133 9,768 6,635 211.8%
531600 - Software MaintenanceAgreements 3,731 4,300 5,718 1,662 (4,056) (70.9%)
532000 - Engineering & Architecture 6,700 12,500 12,500 12,500 - 0.0%
Significant Changes
FY21AdoptedBudget
FY22AdoptedBudget
Increase /(Decrease)
Object - Object Name / Reason for Change
531000 - IT (Non-Consultant) Services 3,133 9,768 6,635
Increase resulting from a transition of Microsoft costs to a subscription-based model. Costs will move from531600 to 531000, and in general, costs will go up.
1194 - Planning
310
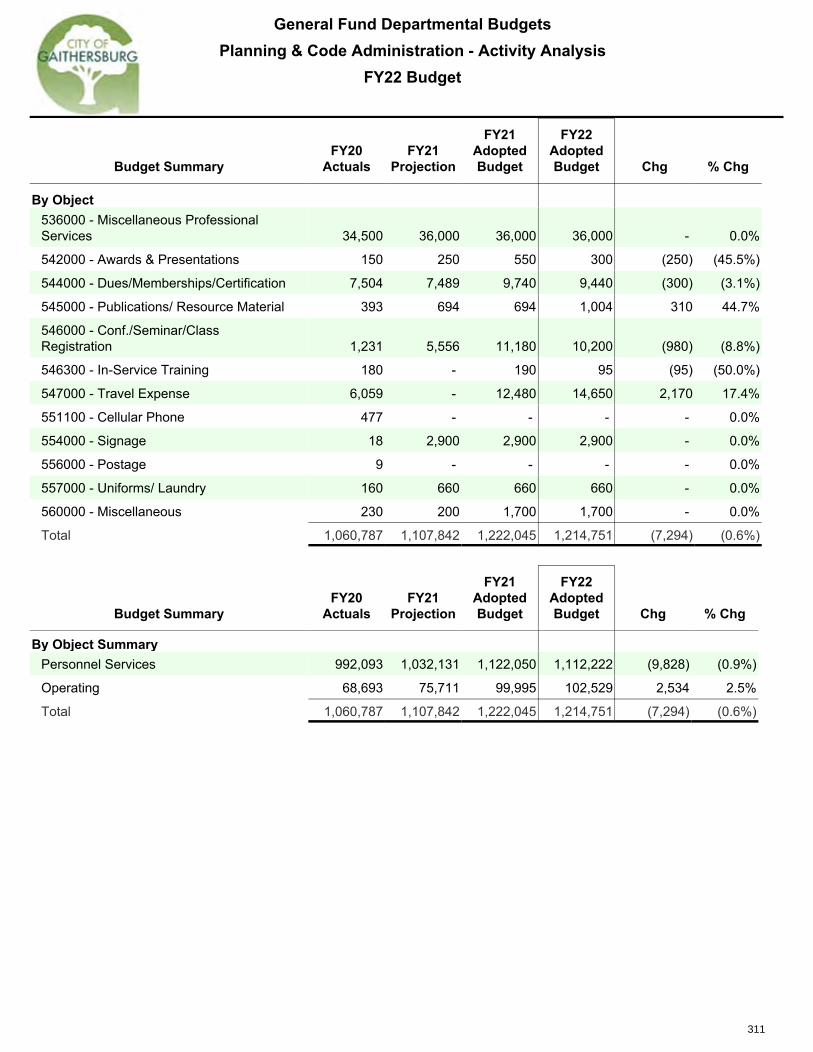
General Fund Departmental BudgetsPlanning & Code Administration - Activity Analysis
FY22 Budget
Budget SummaryFY20
ActualsFY21
Projection
FY21AdoptedBudget
FY22AdoptedBudget Chg % Chg
By Object536000 - Miscellaneous ProfessionalServices 34,500 36,000 36,000 36,000 - 0.0%
542000 - Awards & Presentations 150 250 550 300 (250) (45.5%)
544000 - Dues/Memberships/Certification 7,504 7,489 9,740 9,440 (300) (3.1%)
545000 - Publications/ Resource Material 393 694 694 1,004 310 44.7%
546000 - Conf./Seminar/ClassRegistration 1,231 5,556 11,180 10,200 (980) (8.8%)
546300 - In-Service Training 180 - 190 95 (95) (50.0%)
547000 - Travel Expense 6,059 - 12,480 14,650 2,170 17.4%
551100 - Cellular Phone 477 - - - - 0.0%
554000 - Signage 18 2,900 2,900 2,900 - 0.0%
556000 - Postage 9 - - - - 0.0%
557000 - Uniforms/ Laundry 160 660 660 660 - 0.0%
560000 - Miscellaneous 230 200 1,700 1,700 - 0.0%
Total 1,060,787 1,107,842 1,222,045 1,214,751 (7,294) (0.6%)
Budget SummaryFY20
ActualsFY21
Projection
FY21AdoptedBudget
FY22AdoptedBudget Chg % Chg
By Object SummaryPersonnel Services 992,093 1,032,131 1,122,050 1,112,222 (9,828) (0.9%)
Operating 68,693 75,711 99,995 102,529 2,534 2.5%
Total 1,060,787 1,107,842 1,222,045 1,214,751 (7,294) (0.6%)
311

General Fund Departmental BudgetsPlanning & Code Administration - Activity Analysis
FY22 Budget
Budget SummaryFY20
ActualsFY21
Projection
FY21AdoptedBudget
FY22AdoptedBudget Chg % Chg
By Object501000 - Full-Time Wages 1,127,677 1,154,426 1,138,632 1,081,764 (56,868) (5.0%)
505200 - Other Taxable Comp.-GFIT - 252 336 336 - 0.0%
505300 - Other Taxable Comp.-HousingStipend - 2,600 - 2,400 2,400 100.0%
507000 - Vacation & Sick Payouts 7,364 7,400 - - - 0.0%
508000 - Overtime Wages 3,330 700 1,500 2,400 900 60.0%
509000 - Part-Time Wages 123,965 125,000 166,134 145,620 (20,514) (12.3%)
510000 - FICA Taxes 94,699 98,285 103,026 103,815 789 0.8%
514200 - Vision Benefit 255 787 732 737 5 0.7%
514210 - Health Insurance 121,881 126,185 134,887 123,928 (10,959) (8.1%)
514220 - Dental Benefit 6,789 7,612 8,251 7,023 (1,228) (14.9%)
514230 - Long-Term Care Benefit (244) 1,684 1,740 1,860 120 6.9%
514240 - Life Ins and Disability Benefit 10,680 11,541 11,274 11,420 146 1.3%
515000 - Retirement (401A) 89,942 92,354 94,887 97,144 2,257 2.4%
515100 - Retirement Health Savings(RHS) 11,893 13,718 9,406 14,931 5,525 58.7%
515200 - Medicare Retirement HealthSavings (RHS) 4,000 5,367 6,000 6,000 - 0.0%
516000 - Savings Plan (401K) 33,650 34,634 35,582 36,429 847 2.4%
519000 - Tuition Reimbursement - - - 3,500 3,500 100.0%
522000 - General Operating Supplies 1,491 700 700 700 - 0.0%
525000 - Furniture/Fixture - - - 1,600 1,600 100.0%
526000 - Machinery/Equipment 647 51 2,200 1,000 (1,200) (54.5%)
531000 - IT (Non-Consultant) Services 898 955 904 5,493 4,589 507.6%
531500 - Software Licenses - - 2,400 - (2,400) (100.0%)
531600 - Software MaintenanceAgreements 4,214 4,309 4,987 906 (4,081) (81.8%)
Significant Changes
FY21AdoptedBudget
FY22AdoptedBudget
Increase /(Decrease)
Object - Object Name / Reason for Change
546000 - Conf./Seminar/Class Registration 6,173 11,639 5,466
Increase due to restoration of reduction from FY21 for in person attendance at conferences.
1196 - Permits & Inspections
312

General Fund Departmental BudgetsPlanning & Code Administration - Activity Analysis
FY22 Budget
Budget SummaryFY20
ActualsFY21
Projection
FY21AdoptedBudget
FY22AdoptedBudget Chg % Chg
By Object532000 - Engineering & Architecture 12,865 15,000 22,000 22,000 - 0.0%
536000 - Miscellaneous ProfessionalServices 2,990 - - - - 0.0%
542000 - Awards & Presentations 50 - - - - 0.0%
544000 - Dues/Memberships/Certification 1,713 2,800 2,870 2,870 - 0.0%
545000 - Publications/ Resource Material 3,323 3,200 3,420 3,970 550 16.1%
546000 - Conf./Seminar/ClassRegistration 4,473 950 6,173 11,639 5,466 88.5%
547000 - Travel Expense 7,939 - 6,220 9,220 3,000 48.2%
551100 - Cellular Phone 13,120 14,400 14,400 14,400 - 0.0%
552500 - Gasoline Expense 4,833 5,000 6,500 5,000 (1,500) (23.1%)
553000 - Printing & Binding 734 - - - - 0.0%
557000 - Uniforms/ Laundry 2,321 3,760 2,560 2,560 - 0.0%
560000 - Miscellaneous 190 500 600 600 - 0.0%
574000 - R&M - Vehicles 2,467 5,500 2,500 2,500 - 0.0%
595100 - Furniture & Equipment(Replacement) 10 - - - - 0.0%
Total 1,700,161 1,739,670 1,790,821 1,723,765 (67,056) (3.7%)
Budget SummaryFY20
ActualsFY21
Projection
FY21AdoptedBudget
FY22AdoptedBudget Chg % Chg
By Object SummaryPersonnel Services 1,635,882 1,682,545 1,712,387 1,639,307 (73,080) (4.3%)
Operating 64,269 57,125 78,434 84,458 6,024 7.7%
Capital 10 - - - - 0.0%
Total 1,700,161 1,739,670 1,790,821 1,723,765 (67,056) (3.7%)
313

General Fund Departmental BudgetsPlanning & Code Administration - Activity Analysis
FY22 Budget
Budget SummaryFY20
ActualsFY21
Projection
FY21AdoptedBudget
FY22AdoptedBudget Chg % Chg
By Object501000 - Full-Time Wages 736,505 732,255 758,793 726,986 (31,807) (4.2%)
505100 - Other Taxable Comp.-Multilingual 12,480 10,400 12,480 10,400 (2,080) (16.7%)
505200 - Other Taxable Comp.-GFIT 1,786 2,772 2,856 2,352 (504) (17.6%)
505300 - Other Taxable Comp.-HousingStipend 9,800 14,300 10,800 13,200 2,400 22.2%
507000 - Vacation & Sick Payouts 9,193 9,200 - - - 0.0%
508000 - Overtime Wages 892 500 2,700 2,240 (460) (17.0%)
509000 - Part-Time Wages 21,783 18,000 26,710 24,421 (2,289) (8.6%)
510000 - FICA Taxes 58,572 59,621 64,816 63,797 (1,019) (1.6%)
514200 - Vision Benefit 202 904 890 847 (43) (4.8%)
514210 - Health Insurance 165,276 186,424 179,261 186,591 7,330 4.1%
514220 - Dental Benefit 9,159 11,235 10,080 10,532 452 4.5%
514230 - Long-Term Care Benefit 952 1,530 1,668 1,705 37 2.2%
514240 - Life Ins and Disability Benefit 7,200 7,606 8,064 7,917 (147) (1.8%)
515000 - Retirement (401A) 58,851 54,294 58,968 57,953 (1,015) (1.7%)
515100 - Retirement Health Savings(RHS) 5,060 5,095 5,133 4,977 (156) (3.0%)
515200 - Medicare Retirement HealthSavings (RHS) 2,000 3,234 3,000 4,000 1,000 33.3%
516000 - Savings Plan (401K) 20,034 21,967 21,207 23,408 2,201 10.4%
519000 - Tuition Reimbursement 3,546 3,500 7,000 7,000 - 0.0%
522000 - General Operating Supplies 708 1,000 3,100 2,750 (350) (11.3%)
525000 - Furniture/Fixture 567 800 3,000 - (3,000) (100.0%)
526000 - Machinery/Equipment 119 - 4,000 500 (3,500) (87.5%)
531000 - IT (Non-Consultant) Services 337 334 339 3,543 3,204 945.1%
531600 - Software MaintenanceAgreements 1,900 2,127 2,550 - (2,550) (100.0%)
536000 - Miscellaneous ProfessionalServices - 6,500 6,500 6,500 - 0.0%
536700 - Abatement Services - - 5,000 5,000 - 0.0%
542000 - Awards & Presentations 100 - - - - 0.0%
544000 - Dues/Memberships/Certification 1,297 1,285 1,360 775 (585) (43.0%)
545000 - Publications/ Resource Material 192 400 515 515 - 0.0%
1197 - Neighborhood Services
314

General Fund Departmental BudgetsPlanning & Code Administration - Activity Analysis
FY22 Budget
Budget SummaryFY20
ActualsFY21
Projection
FY21AdoptedBudget
FY22AdoptedBudget Chg % Chg
By Object546000 - Conf./Seminar/ClassRegistration 754 1,000 2,045 2,045 - 0.0%
546300 - In-Service Training 180 - - - - 0.0%
547000 - Travel Expense 1,581 - 2,000 2,500 500 25.0%
547100 - Local Travel Mileage 5 - - - - 0.0%
551100 - Cellular Phone 9,972 10,000 11,780 10,960 (820) (7.0%)
552500 - Gasoline Expense 8,169 8,500 11,500 10,000 (1,500) (13.0%)
557000 - Uniforms/ Laundry 2,025 4,120 3,130 2,620 (510) (16.3%)
560000 - Miscellaneous 237 1,152 1,000 1,000 - 0.0%
567000 - Rental & Use - - 225 225 - 0.0%
574000 - R&M - Vehicles 4,289 3,200 3,200 4,300 1,100 34.4%
596000 - Vehicles/Motor Equipment 27,784 - - - - 0.0%
Total 1,183,506 1,183,255 1,235,670 1,201,559 (34,111) (2.8%)
Budget SummaryFY20
ActualsFY21
Projection
FY21AdoptedBudget
FY22AdoptedBudget Chg % Chg
By Object SummaryPersonnel Services 1,123,292 1,142,837 1,174,426 1,148,326 (26,100) (2.2%)
Operating 32,430 40,418 61,244 53,233 (8,011) (13.1%)
Capital 27,784 - - - - 0.0%
Total 1,183,506 1,183,255 1,235,670 1,201,559 (34,111) (2.8%)
315

General Fund Departmental BudgetsPlanning & Code Administration - Activity Analysis
FY22 Budget
Budget SummaryFY20
ActualsFY21
Projection
FY21AdoptedBudget
FY22AdoptedBudget Chg % Chg
By Object501000 - Full-Time Wages 218,884 200,860 234,408 249,580 15,172 6.5%
505100 - Other Taxable Comp.-Multilingual 2,080 - 2,080 2,080 - 0.0%
505200 - Other Taxable Comp.-GFIT 125 - 336 - (336) (100.0%)
507000 - Vacation & Sick Payouts 1,314 1,300 - - - 0.0%
508000 - Overtime Wages 24,773 21,000 28,080 28,000 (80) (0.3%)
509000 - Part-Time Wages 2,780 6,100 11,451 11,465 14 0.1%
510000 - FICA Taxes 18,550 17,501 21,925 23,147 1,222 5.6%
514200 - Vision Benefit 176 189 252 252 - 0.0%
514210 - Health Insurance 43,917 44,342 51,825 56,248 4,423 8.5%
514220 - Dental Benefit 1,372 2,465 2,979 2,979 - 0.0%
514230 - Long-Term Care Benefit 330 462 581 620 39 6.7%
514240 - Life Ins and Disability Benefit 2,161 2,022 2,477 2,638 161 6.5%
515000 - Retirement (401A) 17,487 16,068 19,534 20,799 1,265 6.5%
515200 - Medicare Retirement HealthSavings (RHS) 2,846 3,984 4,000 6,000 2,000 50.0%
516000 - Savings Plan (401K) 5,380 6,027 7,326 7,799 473 6.5%
522000 - General Operating Supplies 537 1,000 1,250 750 (500) (40.0%)
525000 - Furniture/Fixture - - 400 400 - 0.0%
526000 - Machinery/Equipment 151 - 250 250 - 0.0%
531000 - IT (Non-Consultant) Services - - - 1,284 1,284 100.0%
531600 - Software MaintenanceAgreements 760 851 1,020 - (1,020) (100.0%)
536000 - Miscellaneous ProfessionalServices 107 500 2,000 2,000 - 0.0%
543000 - Contributions 3,500 3,500 3,500 3,500 - 0.0%
544000 - Dues/Memberships/Certification 200 225 225 225 - 0.0%
546000 - Conf./Seminar/ClassRegistration 725 1,200 1,600 1,600 - 0.0%
546300 - In-Service Training 90 - - - - 0.0%
547000 - Travel Expense 2,515 - 2,250 2,250 - 0.0%
551100 - Cellular Phone 5,046 5,240 5,240 5,240 - 0.0%
552500 - Gasoline Expense 4,983 5,900 6,750 6,500 (250) (3.7%)
557000 - Uniforms/ Laundry 5,572 1,110 3,280 3,880 600 18.3%
1198 - Animal Control
316

General Fund Departmental BudgetsPlanning & Code Administration - Activity Analysis
FY22 Budget
Budget SummaryFY20
ActualsFY21
Projection
FY21AdoptedBudget
FY22AdoptedBudget Chg % Chg
By Object560000 - Miscellaneous 991 400 800 800 - 0.0%
574000 - R&M - Vehicles 1,189 2,200 2,200 2,200 - 0.0%
Total 368,542 344,446 418,019 442,486 24,467 5.9%
Budget SummaryFY20
ActualsFY21
Projection
FY21AdoptedBudget
FY22AdoptedBudget Chg % Chg
By Object SummaryPersonnel Services 342,176 322,320 387,254 411,607 24,353 6.3%
Operating 26,366 22,126 30,765 30,879 114 0.4%
Total 368,542 344,446 418,019 442,486 24,467 5.9%
317
MLK Day of Service
318

DEPARTMENT OF POLICE
Chief of Police
Administrative BureauOperations BureauSpecial Operations Bureau
Office of the ChiefAdministration and Emergency
Management
319

General Fund Departmental BudgetDepartment Overview - Police Department
FY22 Budget
The Gaithersburg Police Department shares responsibility for service with the Montgomery County Police, providingcoverage 24 hours a day, 365 days a year. The department responds to calls for service as necessary and utilizescommunity action teams, when appropriate, to solve problems and deal with issues affecting the safety of all Cityneighborhoods. The department operates under the Data Driven Approach to Crime and Traffic Safety (DDACTS).DDACTS focuses the entire police department on overall goal achievement. It is based on identifying a problem areausing data and following up to ensure that police resources are dedicated to the proper locations. The data collectionfollowed by meticulous analysis and deployment of resources based upon problematic areas is at the core of theDDACTS approach.
Services Provided
Police Department Budget SummaryFY20
ActualsFY21
Projection
FY21AdoptedBudget
FY22AdoptedBudget Chg % Chg
By Activity1211 - Police Department 9,715,040 9,652,203 9,710,447 9,950,720 240,273 2.5%
Total 9,715,040 9,652,203 9,710,447 9,950,720 240,273 2.5%
320

General Fund Departmental BudgetDepartment Overview - Police Department
FY22 Budget
Police Department Budget SummaryFY20
ActualsFY21
Projection
FY21AdoptedBudget
FY22AdoptedBudget Chg % Chg
By Object CategoryPersonnel Services 9,077,596 8,941,365 8,972,398 9,068,672 96,274 1.1%
Operating 636,938 710,838 738,049 828,548 90,499 12.3%
Capital 505 - - 53,500 53,500 100.0%
Total 9,715,040 9,652,203 9,710,447 9,950,720 240,273 2.5%
Departmental Personnel Schedule
FY20AdoptedBudget
FY21AdoptedBudget
FY22AdoptedBudget
1211 - Police Department
Administrative Assistant III 1 1 1
Administrative Assistant I 1 0 0
Administrative Assistant II 0 1 1
Administrative Support Supervisor 1 0 0
Police Officer Candidate 3 1 0
Police Administrative Services Supervisor 0 1 1
Police Officer I 8 8 12
Speed Camera Technician Supervisor 1 1 1
Speed Camera Technician 1 1 1
Parking Enforcement Official 1 1 1
Police Officer II 3 8 8
Police Officer III 24 22 18
Police Corporal 8 8 9
Police Accreditation/Property & Evidence Manager 1 1 1
Police Sergeant 9 9 9
Police Lt./Operations Bureau Commander 1 1 1
Police Lt./Administrative Bureau Commander 1 1 1
Police Lt./Special Operations Bureau Commander 1 1 1
Police Training & Emergency Operations Coordinator 1 1 1
Crime Analyst 1 1 1
Police Systems Support Manager 1 1 1
Chief of Police 1 1 1
Part-Time Personnel 3.57 3.82 3.75
Subtotal 72.57 73.82 73.75
321

General Fund Departmental BudgetDepartment Overview - Police Department
FY22 Budget
Full-Time Personnel 69 70 70
Part-Time Personnel 3.57 3.82 3.75
Total 72.57 73.82 73.75
322

General Fund Departmental BudgetsPolice Department - Activity Analysis
FY22 Budget
Budget SummaryFY20
ActualsFY21
Projection
FY21AdoptedBudget
FY22AdoptedBudget Chg % Chg
By Object501000 - Full-Time Wages 5,915,246 5,827,233 5,928,879 5,976,464 47,585 0.8%
Significant Changes
FY21AdoptedBudget
FY22AdoptedBudget
Increase /(Decrease)
Object - Object Name / Reason for Change
523400 - Police Weapons 25,450 86,550 61,100
Increase due to ammunition purchases for FY22; none were budgeted for FY21 and ammunition supply is low.
526000 - Machinery/Equipment 8,000 16,000 8,000
Increase due to purchase of 2 additional portable radios - one for the FY21 approved new position and onespare.
531000 - IT (Non-Consultant) Services 107,632 142,437 34,805
Increase due to City's new subscription model for Microsoft (Microsoft 365) which moves charges from 531600to this account and is also more expensive, as well as certain Axon services for elements of the new policestation that were also moved from 531500 to this account.
531500 - Software Licenses 9,700 200 (9,500)
Decrease due to movement of Axon costs to 531000.
531600 - Software Maintenance Agreements 31,981 20,307 (11,674)
Decrease due to movement of Microsoft costs to 531000.
536000 - Miscellaneous Professional Services 45,600 34,900 (10,700)
Decrease due to reduction of expense for the promotional consultant in FY22 - only the associated liabilityinsurance. The next full promotion process will not be until FY23.
544000 - Dues/Memberships/Certification 6,115 42,833 36,718
Increase due to Metropolitan Washington Council of Governments (MWCOG) dues for public safety initiativesmoving to this activity from activity 1911, Non-Departmental.
551100 - Cellular Phone 54,338 60,098 5,760
Additional funding for the increased number of devices requiring cellular data connections - parkingenforcement, covert crime camera, and additional NetMotion accounts for some teleworking personnel.
552500 - Gasoline Expense 150,000 140,000 (10,000)
Decrease due to reduction in FY22 budget to be more in line with prior year actuals.
574000 - R&M - Vehicles 74,300 65,500 (8,800)
Decrease due to alignment of maintenance costs with historical expenditures.
596000 - Vehicles/Motor Equipment - 53,500 53,500
Increase related to purchase of police vehicle for new position approved in FY21; the vehicle was not funded inFY21.
1211 - Police Department
323

General Fund Departmental BudgetsPolice Department - Activity Analysis
FY22 Budget
Budget SummaryFY20
ActualsFY21
Projection
FY21AdoptedBudget
FY22AdoptedBudget Chg % Chg
By Object505100 - Other Taxable Comp.-Multilingual 23,573 24,960 24,960 24,960 - 0.0%
505200 - Other Taxable Comp.-GFIT 6,397 12,684 9,912 11,760 1,848 18.6%
505300 - Other Taxable Comp.-HousingStipend 18,200 17,100 20,400 16,800 (3,600) (17.6%)
507000 - Vacation & Sick Payouts 114,593 120,300 - - - 0.0%
508000 - Overtime Wages 508,149 330,000 425,000 400,000 (25,000) (5.9%)
509000 - Part-Time Wages 99,385 144,000 116,447 109,213 (7,234) (6.2%)
510000 - FICA Taxes 497,450 487,346 498,114 499,281 1,167 0.2%
514200 - Vision Benefit 231 4,412 4,262 4,237 (25) (0.6%)
514210 - Health Insurance 790,444 832,221 806,117 853,038 46,921 5.8%
514220 - Dental Benefit 36,218 54,331 52,510 52,093 (417) (0.8%)
514230 - Long-Term Care Benefit 5,723 10,260 10,097 11,005 908 9.0%
514240 - Life Ins and Disability Benefit 55,505 58,047 58,253 58,413 160 0.3%
515000 - Retirement (401A) 500,461 466,175 474,312 478,120 3,808 0.8%
515050 - Supplemental Retirement (401A) 229,626 243,136 247,937 249,220 1,283 0.5%
515100 - Retirement Health Savings(RHS) 86,840 93,693 82,935 97,390 14,455 17.4%
515200 - Medicare Retirement HealthSavings (RHS) 17,540 34,185 27,249 36,000 8,751 32.1%
516000 - Savings Plan (401K) 166,901 172,282 172,764 176,678 3,914 2.3%
519000 - Tuition Reimbursement 5,113 9,000 12,250 14,000 1,750 14.3%
521000 - Office Supplies 16,646 20,000 21,000 20,000 (1,000) (4.8%)
522000 - General Operating Supplies 17,172 18,000 18,715 17,815 (900) (4.8%)
522200 - Photo/Audio/Video Supplies 3,413 - - - - 0.0%
523300 - Police Outreach 10,813 7,300 10,300 7,300 (3,000) (29.1%)
523400 - Police Weapons 52,842 25,450 25,450 86,550 61,100 240.1%
526000 - Machinery/Equipment 4,839 8,000 8,000 16,000 8,000 100.0%
530000 - Accounting & Audit 1,429 1,200 1,800 1,800 - 0.0%
531000 - IT (Non-Consultant) Services 93,746 107,632 107,632 142,437 34,805 32.3%
531500 - Software Licenses 670 9,700 9,700 200 (9,500) (97.9%)
531600 - Software MaintenanceAgreements 38,153 35,000 31,981 20,307 (11,674) (36.5%)
536000 - Miscellaneous ProfessionalServices 21,310 45,000 45,600 34,900 (10,700) (23.5%)
536500 - Investigations 125 - - - - 0.0%
324

General Fund Departmental BudgetsPolice Department - Activity Analysis
FY22 Budget
Budget SummaryFY20
ActualsFY21
Projection
FY21AdoptedBudget
FY22AdoptedBudget Chg % Chg
By Object542000 - Awards & Presentations 2,639 1,500 1,500 1,500 - 0.0%
544000 - Dues/Memberships/Certification 1,187 6,115 6,115 42,833 36,718 600.5%
545000 - Publications/ Resource Material 300 560 560 560 - 0.0%
546000 - Conf./Seminar/ClassRegistration 13,196 14,000 18,500 17,050 (1,450) (7.8%)
547000 - Travel Expense 7,380 7,500 10,360 8,500 (1,860) (18.0%)
551100 - Cellular Phone 56,194 54,338 54,338 60,098 5,760 10.6%
552500 - Gasoline Expense 121,163 115,000 150,000 140,000 (10,000) (6.7%)
553000 - Printing & Binding 1,906 2,000 2,500 2,500 - 0.0%
556000 - Postage 740 900 900 900 - 0.0%
556500 - Messenger Services 766 300 465 600 135 29.0%
557000 - Uniforms/ Laundry 60,488 82,580 64,570 62,880 (1,690) (2.6%)
560000 - Miscellaneous 6 - - - - 0.0%
561000 - Local - In-Service Meals 680 900 900 900 - 0.0%
567000 - Rental & Use 38,440 39,970 39,970 44,305 4,335 10.8%
567100 - Rental of Facilities 1,600 3,000 3,000 3,000 - 0.0%
568300 - Police Forfeiture Expenditures 7,845 25,000 10,000 10,000 - 0.0%
573000 - R&M - Machinery & Equipment 20,264 19,893 19,893 20,113 220 1.1%
574000 - R&M - Vehicles 40,986 60,000 74,300 65,500 (8,800) (11.8%)
596000 - Vehicles/Motor Equipment 505 - - 53,500 53,500 100.0%
Total 9,715,040 9,652,203 9,710,447 9,950,720 240,273 2.5%
Budget SummaryFY20
ActualsFY21
Projection
FY21AdoptedBudget
FY22AdoptedBudget Chg % Chg
By Object SummaryPersonnel Services 9,077,596 8,941,365 8,972,398 9,068,672 96,274 1.1%
Operating 636,938 710,838 738,049 828,548 90,499 12.3%
Capital 505 - - 53,500 53,500 100.0%
Total 9,715,040 9,652,203 9,710,447 9,950,720 240,273 2.5%
325

Construction of 16 South
Summit Avenue
326

DEPARTMENT OF PUBLIC WORKS
Director of Public Works
FacilitiesManagement
Building Maintenance
Capital Projects
Environmental Services
City Sustainbility Program
Stormwater Management
NPDES Programs, Standards & Regulations
Capital Projects
Operations
Streets & Special Projects
Mowing & Bulk Pick-Up
Fleet Maintenance
Landscaping & Forestry
Municipal Parks Maintenance
Engineering
Engineering Services
Street Lighting
Traffic Control
Recycling
Administration
327

General Fund Departmental BudgetDepartment Overview - Public Works
FY22 Budget
The mission of the Public Works Department is to improve the quality of life in the City by maintaining and preservingthe City’s infrastructure, parks and facilities in an attractive and safe condition. This department is dedicated toproviding high quality and cost-effective services to our customers.
The Public Works Department is comprised of four (4) administrative divisions as follows:1. Engineering Services2. Facilities and Capital Projects3. Environmental Services4. Operations
The department provides a variety of services including: snow removal; street sweeping; repair and maintenance ofstreets, sidewalks and storm drains; beautification of streets, public buildings, and parks; recycling; and City vehiclemaintenance. It also provides the following engineering services: reviews of land development plans; bridge andculvert inspections and repair; multi-modal access; pavement management; and roadway repaving and rehabilitation. Development of new assets and improvement of existing assets are done through the delivery of capital projects. Thedepartment utilizes a standard approach to project initiation, planning and chartering to ensure that fully developedscopes of work are used to develop construction documents. All staff are adept at project delivery and incrementalimprovement is achieved through the use of data-based metrics. The Environmental Services division is responsible forensuring that the City is in compliance with the National Pollutant Discharge Elimination System (NPDES)requirements of the Maryland Department of the Environment (MDE). This is achieved through the implementation ofstormwater restoration projects, inspection and maintenance of all stormwater practices in the City, spill response andcleanup, and public education and outreach programs.
Services Provided
Public Works Budget SummaryFY20
ActualsFY21
Projection
FY21AdoptedBudget
FY22AdoptedBudget Chg % Chg
311 - Engineering Division
1311 - Public Works Administration 822,814 657,568 815,111 933,679 118,568 14.5%
1345 - Recycling 1,317,900 1,605,369 1,544,894 1,629,458 84,564 5.5%
1351 - Engineering Services 774,137 984,051 975,722 949,133 (26,589) (2.7%)
1393 - Street Lighting 666,303 705,000 705,000 705,000 - 0.0%
311 - Engineering Division 3,581,155 3,951,988 4,040,727 4,217,270 176,543 4.4%
312 - PW Operations Division
1312 - Streets & Special Projects 776,762 955,252 1,095,314 1,130,472 35,158 3.2%
1315 - Fleet Maintenance 657,651 643,202 675,137 663,178 (11,959) (1.8%)
1341 - Landscaping & Forestry 1,099,005 968,375 1,226,890 1,245,052 18,162 1.5%
1343 - Municipal Parks Maintenance 1,986,473 2,095,867 2,068,107 2,107,483 39,376 1.9%
1344 - Mowing & Bulk Pick-Up 2,126,573 2,384,775 2,215,924 2,286,949 71,025 3.2%
1397 - Traffic Control 273,833 314,341 327,661 402,605 74,944 22.9%
312 - PW Operations Division 6,920,296 7,361,812 7,609,033 7,835,739 226,706 3.0%
328

General Fund Departmental BudgetDepartment Overview - Public Works
FY22 Budget
Public Works Budget SummaryFY20
ActualsFY21
Projection
FY21AdoptedBudget
FY22AdoptedBudget Chg % Chg
313 - Environmental Services Division
1134 - City Sustainability Program 91,388 120,321 132,334 136,562 4,228 3.2%
1342 - Environmental Services Operations 546 1,500 6,450 6,450 - 0.0%
313 - Environmental Services Division 91,934 121,821 138,784 143,012 4,228 3.0%
314 - Facilities Management Division
1150 - Facilities Management 1,738,121 1,776,066 1,858,795 2,044,526 185,731 10.0%
1151 - Building & Grounds - City Hall 132,934 140,260 157,379 177,135 19,756 12.6%
1152 - Building & Grounds - 14 FaulksCorner 80,232 55,198 67,037 91,824 24,787 37.0%
1153 - Building & Grounds - Public Works 202,939 184,462 200,663 203,961 3,298 1.6%
1155 - Building & Grounds - Train Station/Freight House 26,008 28,666 35,041 36,877 1,836 5.2%
1158 - Building & Grounds - KentlandsMansion 45,671 51,476 66,710 90,163 23,454 35.2%
1159 - Building & Grounds - BenjaminGaither Center 64,453 60,681 94,787 90,884 (3,903) (4.1%)
1160 - Building & Grounds - CaseyCommunity Center 130,784 120,711 164,422 184,526 20,104 12.2%
1161 - Building & Grounds - Olde TownePavilion 2,389 4,378 5,477 5,721 244 4.5%
1162 - Building & Grounds - 16 SouthSummit Avenue 46,573 22,400 54,146 208,713 154,567 285.5%
1164 - Building & Grounds - GaithersburgAquatic Center 11,677 33,593 19,491 24,865 5,374 27.6%
1165 - Building & Grounds - Activity Center 262,056 233,601 279,628 274,860 (4,768) (1.7%)
1166 - Building & Grounds - GaithersburgArts Barn 49,980 69,425 82,250 79,389 (2,861) (3.5%)
1167 - Building & Grounds - Water Park 72,123 123,940 124,683 123,588 (1,095) (0.9%)
1168 - Building & Grounds - Miniature Golf 12,297 15,169 16,169 16,862 693 4.3%
1169 - Building & Grounds - Skate Park 1,669 5,828 8,479 9,321 842 9.9%
1170 - Building & Grounds - Olde TowneYouth Center 52,790 38,348 42,470 39,685 (2,785) (6.6%)
1172 - Building & Grounds - Robertson ParkYouth Center 53,674 48,149 55,951 52,505 (3,446) (6.2%)
1173 - Building & Grounds - GaithersburgCPSC Park Site 12,378 12,058 15,640 4,000 (11,640) (74.4%)
1175 - Building & Grounds - Parking Facility 70,883 82,613 112,349 528,947 416,598 370.8%
329

General Fund Departmental BudgetDepartment Overview - Public Works
FY22 Budget
Public Works Budget SummaryFY20
ActualsFY21
Projection
FY21AdoptedBudget
FY22AdoptedBudget Chg % Chg
1176 - Building & Grounds - HomelessServices 35,670 37,379 45,249 42,960 (2,289) (5.1%)
314 - Facilities Management Division 3,105,302 3,144,401 3,506,815 4,331,312 824,497 23.5%
Total Public Works 13,698,687 14,580,022 15,295,358 16,527,333 (7,521,733) (49.2%)
Public Works Budget SummaryFY20
ActualsFY21
Projection
FY21AdoptedBudget
FY22AdoptedBudget Chg % Chg
By Object CategoryPersonnel Services 8,516,450 8,349,469 8,675,276 9,001,193 325,917 3.8%
Operating 5,178,925 6,006,675 6,605,082 7,521,140 916,058 13.9%
Capital 3,313 223,878 15,000 5,000 (10,000) (66.7%)
Total 13,698,687 14,580,022 15,295,358 16,527,333 1,231,975 8.1%
Departmental Personnel Schedule
FY20AdoptedBudget
FY21AdoptedBudget
FY22AdoptedBudget
330

General Fund Departmental BudgetDepartment Overview - Public Works
FY22 Budget
Departmental Personnel Schedule
FY20AdoptedBudget
FY21AdoptedBudget
FY22AdoptedBudget
1134 - City Sustainability Program
Sustainability Coordinator 1 1 1
Subtotal 1 1 1
1150 - Facilities Management
Facilities & Equipment Worker I 0 2 2
Facilities & Equipment Technician I 2 1 1
Facilities & Equipment Technician II 1 2 2
Facilities & Equipment Technician III 1 1 1
Capital Projects Program Manager 2 2 2
Project Manager 1 1 1
Facilities Maintenance Supervisor 1 1 1
Capital Projects/Facilities Division Chief 1 1 1
Facilities & Equipment Specialist III 1 1 1
Public Works Program Coordinator 1 1 1
Subtotal 11 13 13
1311 - Public Works Administration
Administrative Assistant I 0 0 1
Project Manager 1 1 1
Public Works Operations Division Chief 1 1 1
Public Works Operations Administrator 1 1 1
Public Works Program Coordinator 1 1 1
Director of Public Works & Engineering 1 1 1
Subtotal 5 5 6
1312 - Streets & Special Projects
Maintenance Worker I 4 2 2
Maintenance Worker II 1 2 1
Maintenance Worker III 0 0 1
Work Force Leader III 0 1 1
Supervisor 1 1 1
Part-Time Personnel 0.68 0.18 0.68
Subtotal 6.68 6.18 6.68
331
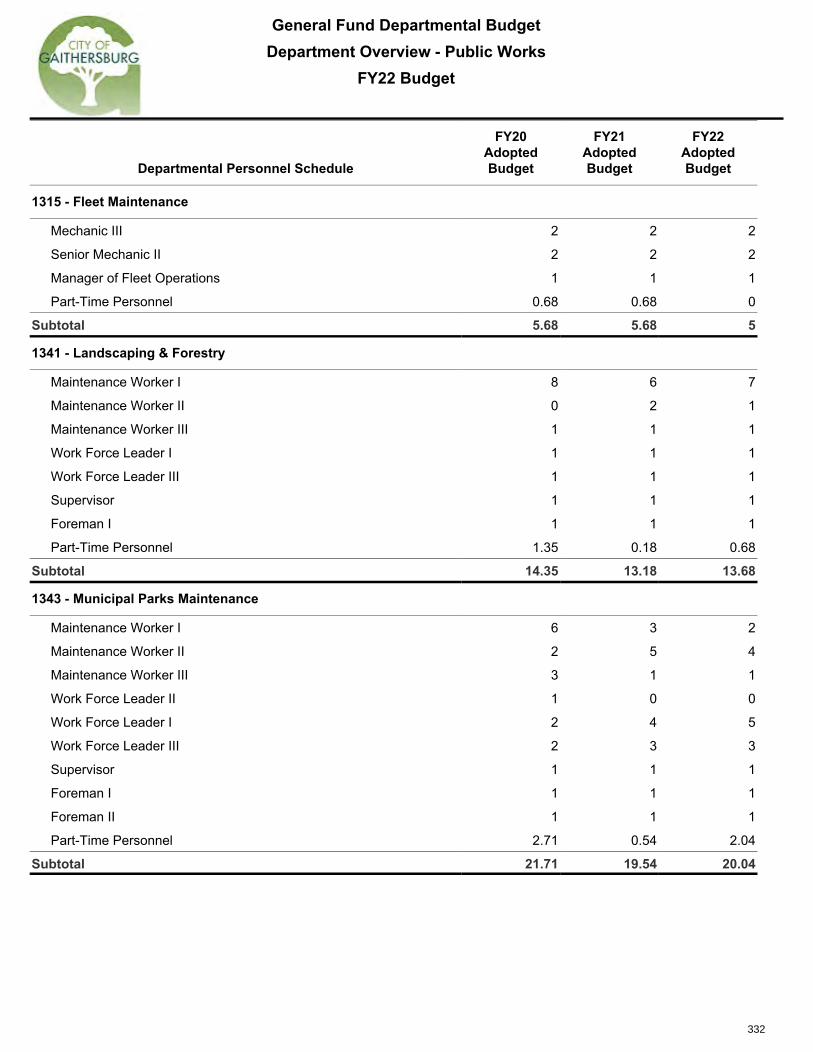
General Fund Departmental BudgetDepartment Overview - Public Works
FY22 Budget
Departmental Personnel Schedule
FY20AdoptedBudget
FY21AdoptedBudget
FY22AdoptedBudget
1315 - Fleet Maintenance
Mechanic III 2 2 2
Senior Mechanic II 2 2 2
Manager of Fleet Operations 1 1 1
Part-Time Personnel 0.68 0.68 0
Subtotal 5.68 5.68 5
1341 - Landscaping & Forestry
Maintenance Worker I 8 6 7
Maintenance Worker II 0 2 1
Maintenance Worker III 1 1 1
Work Force Leader I 1 1 1
Work Force Leader III 1 1 1
Supervisor 1 1 1
Foreman I 1 1 1
Part-Time Personnel 1.35 0.18 0.68
Subtotal 14.35 13.18 13.68
1343 - Municipal Parks Maintenance
Maintenance Worker I 6 3 2
Maintenance Worker II 2 5 4
Maintenance Worker III 3 1 1
Work Force Leader II 1 0 0
Work Force Leader I 2 4 5
Work Force Leader III 2 3 3
Supervisor 1 1 1
Foreman I 1 1 1
Foreman II 1 1 1
Part-Time Personnel 2.71 0.54 2.04
Subtotal 21.71 19.54 20.04
332

General Fund Departmental BudgetDepartment Overview - Public Works
FY22 Budget
Departmental Personnel Schedule
FY20AdoptedBudget
FY21AdoptedBudget
FY22AdoptedBudget
1344 - Mowing & Bulk Pick-Up
Maintenance Worker I 6 6 4
Maintenance Worker II 3 5 7
Maintenance Worker III 4 3 1
Work Force Leader II 1 2 2
Work Force Leader I 4 3 5
Work Force Leader III 2 0 0
Supervisor 1 1 1
Foreman I 0 1 1
Part-Time Personnel 2.71 0.54 2.04
Subtotal 23.71 21.54 23.04
1351 - Engineering Services
Project Engineer 2 4 3
Right-of-Way Inspector 1 1 1
Project Manager 1 0 0
Engineering Services Division Chief 1 1 1
Part-Time Personnel 0.6 0.21 0.61
Subtotal 5.6 6.21 5.61
1397 - Traffic Control
Maintenance Worker III 1 1 1
Work Force Leader III 1 1 1
Part-Time Personnel 1.35 0.18 0.68
Subtotal 3.35 2.18 2.68
Full-Time Personnel 88 91 90
Part-Time Personnel 10.07 2.5 6.74
Total 98.07 93.5 96.74
333

General Fund Departmental BudgetsPublic Works - Activity Analysis
FY22 Budget
Budget SummaryFY20
ActualsFY21
Projection
FY21AdoptedBudget
FY22AdoptedBudget Chg % Chg
By Object501000 - Full-Time Wages 557,537 413,997 540,681 582,368 41,687 7.7%
505200 - Other Taxable Comp.-GFIT 998 1,260 672 1,428 756 112.5%
507000 - Vacation & Sick Payouts 21,134 23,900 - - - 0.0%
510000 - FICA Taxes 40,711 31,765 41,434 47,027 5,593 13.5%
514200 - Vision Benefit 100 355 405 493 88 21.7%
514210 - Health Insurance 85,059 76,746 84,918 103,816 18,898 22.3%
514220 - Dental Benefit 2,115 4,423 4,842 5,626 784 16.2%
514230 - Long-Term Care Benefit 1,070 594 725 937 212 29.2%
514240 - Life Ins and Disability Benefit 5,750 4,140 4,958 5,646 688 13.9%
515000 - Retirement (401A) 44,301 33,120 45,057 49,463 4,406 9.8%
515050 - Supplemental Retirement (401A) 15,690 15,780 15,957 18,721 2,764 17.3%
515200 - Medicare Retirement HealthSavings (RHS) - 167 - 4,083 4,083 100.0%
516000 - Savings Plan (401K) 16,794 12,420 16,897 18,549 1,652 9.8%
519000 - Tuition Reimbursement 396 - 3,500 3,500 - 0.0%
521000 - Office Supplies 2,901 669 650 650 - 0.0%
522000 - General Operating Supplies 10 500 1,000 1,000 - 0.0%
525000 - Furniture/Fixture 350 - - - - 0.0%
526000 - Machinery/Equipment 780 1,500 1,500 3,500 2,000 133.3%
531000 - IT (Non-Consultant) Services 851 7,391 12,644 40,948 28,304 223.9%
531600 - Software MaintenanceAgreements 3,344 3,582 4,174 8,770 4,596 110.1%
536000 - Miscellaneous ProfessionalServices 3,493 3,600 3,600 3,600 - 0.0%
536500 - Investigations 31 - - - - 0.0%
542000 - Awards & Presentations - 150 50 250 200 400.0%
544000 - Dues/Memberships/Certification 4,418 1,500 1,024 2,211 1,187 115.9%
Significant Changes
FY21AdoptedBudget
FY22AdoptedBudget
Increase /(Decrease)
Object - Object Name / Reason for Change
531000 - IT (Non-Consultant) Services 12,644 40,948 28,304
Increase due to the movement of Microsoft licenses into this line item, and the addition of funding for Vueworksrelated to the new asset management system.
1311 - Public Works Administration
334

General Fund Departmental BudgetsPublic Works - Activity Analysis
FY22 Budget
Budget SummaryFY20
ActualsFY21
Projection
FY21AdoptedBudget
FY22AdoptedBudget Chg % Chg
By Object545000 - Publications/ Resource Material 752 - - - - 0.0%
546000 - Conf./Seminar/ClassRegistration 1,154 6,000 10,900 10,900 - 0.0%
547000 - Travel Expense 1,249 - 2,300 2,300 - 0.0%
551000 - Telephone (Landline) 12 - - - - 0.0%
551100 - Cellular Phone 5,094 6,000 9,279 7,359 (1,920) (20.7%)
552500 - Gasoline Expense 2,921 3,250 3,250 4,000 750 23.1%
553000 - Printing & Binding 52 200 370 370 - 0.0%
556000 - Postage 137 100 500 500 - 0.0%
556500 - Messenger Services 39 - - - - 0.0%
557000 - Uniforms/ Laundry 388 159 - 640 640 100.0%
560000 - Miscellaneous 679 1,000 1,000 1,000 - 0.0%
573000 - R&M - Machinery & Equipment 2,001 2,100 2,824 2,824 - 0.0%
574000 - R&M - Vehicles 501 1,200 - 1,200 1,200 100.0%
Total 822,814 657,568 815,111 933,679 118,568 14.5%
Budget SummaryFY20
ActualsFY21
Projection
FY21AdoptedBudget
FY22AdoptedBudget Chg % Chg
By Object SummaryPersonnel Services 791,655 618,667 760,046 841,657 81,611 10.7%
Operating 31,159 38,901 55,065 92,022 36,957 67.1%
Total 822,814 657,568 815,111 933,679 118,568 14.5%
335

General Fund Departmental BudgetsPublic Works - Activity Analysis
FY22 Budget
Budget SummaryFY20
ActualsFY21
Projection
FY21AdoptedBudget
FY22AdoptedBudget Chg % Chg
By Object522000 - General Operating Supplies 32,227 34,894 34,894 54,258 19,364 55.5%
531000 - IT (Non-Consultant) Services 4,125 5,075 13,500 4,500 (9,000) (66.7%)
553000 - Printing & Binding 274 1,200 1,600 2,000 400 25.0%
556000 - Postage 7 - - 4,500 4,500 100.0%
567000 - Rental & Use 1,281,267 1,564,200 1,494,900 1,564,200 69,300 4.6%
Total 1,317,900 1,605,369 1,544,894 1,629,458 84,564 5.5%
Budget SummaryFY20
ActualsFY21
Projection
FY21AdoptedBudget
FY22AdoptedBudget Chg % Chg
By Object SummaryOperating 1,317,900 1,605,369 1,544,894 1,629,458 84,564 5.5%
Total 1,317,900 1,605,369 1,544,894 1,629,458 84,564 5.5%
Significant Changes
FY21AdoptedBudget
FY22AdoptedBudget
Increase /(Decrease)
Object - Object Name / Reason for Change
522000 - General Operating Supplies 34,894 54,258 19,364
Increase due to additional carts & bins for distribution the the nearly 500 new homes coming online over the nextfiscal year. The cost covers 500 carts & 100 bins.
531000 - IT (Non-Consultant) Services 13,500 4,500 (9,000)
Decrease due to reflection of actual software application costs in FY22.
567000 - Rental & Use 1,494,900 1,564,200 69,300
Increase due to a 20% increase in tonnage. The increase in tonnage is a result in people disposing of morerecycled material at home as opposed to at business.
1345 - Recycling
336

General Fund Departmental BudgetsPublic Works - Activity Analysis
FY22 Budget
Budget SummaryFY20
ActualsFY21
Projection
FY21AdoptedBudget
FY22AdoptedBudget Chg % Chg
By Object501000 - Full-Time Wages 470,460 531,430 539,131 492,828 (46,303) (8.6%)
505200 - Other Taxable Comp.-GFIT 678 1,344 504 1,008 504 100.0%
508000 - Overtime Wages 874 - 7,176 7,176 - 0.0%
509000 - Part-Time Wages 51,259 56,897 17,153 48,982 31,829 185.6%
510000 - FICA Taxes 39,269 45,109 44,875 44,960 85 0.2%
514200 - Vision Benefit 91 348 372 313 (59) (15.9%)
514210 - Health Insurance 52,181 76,136 78,675 72,986 (5,689) (7.2%)
514220 - Dental Benefit 538 4,392 4,573 3,951 (622) (13.6%)
514230 - Long-Term Care Benefit 607 726 798 775 (23) (2.9%)
514240 - Life Ins and Disability Benefit 3,347 5,300 5,524 5,016 (508) (9.2%)
515000 - Retirement (401A) 37,061 42,515 44,927 42,442 (2,485) (5.5%)
515100 - Retirement Health Savings(RHS) 4,696 5,095 4,703 4,977 274 5.8%
515200 - Medicare Retirement HealthSavings (RHS) 5,154 6,059 7,000 6,000 (1,000) (14.3%)
516000 - Savings Plan (401K) 13,898 15,942 16,848 15,915 (933) (5.5%)
519000 - Tuition Reimbursement - - 3,500 3,500 - 0.0%
521000 - Office Supplies 262 400 2,500 2,500 - 0.0%
522000 - General Operating Supplies 231 400 400 400 - 0.0%
526000 - Machinery/Equipment 208 750 750 750 - 0.0%
531000 - IT (Non-Consultant) Services 7,616 13,133 6,339 9,610 3,271 51.6%
531500 - Software Licenses 1,308 - - - - 0.0%
531600 - Software MaintenanceAgreements 616 1,154 3,320 307 (3,013) (90.8%)
532000 - Engineering & Architecture 75,647 159,800 159,800 160,100 300 0.2%
544000 - Dues/Memberships/Certification 1,075 2,781 3,292 2,392 (900) (27.3%)
545000 - Publications/ Resource Material 896 1,500 1,870 750 (1,120) (59.9%)
546000 - Conf./Seminar/ClassRegistration 2,145 6,000 12,000 12,000 - 0.0%
546300 - In-Service Training 90 450 - - - 0.0%
547000 - Travel Expense 115 - 125 125 - 0.0%
551100 - Cellular Phone 1,719 1,800 2,500 2,400 (100) (4.0%)
552500 - Gasoline Expense 1,160 990 2,937 3,000 63 2.1%
553000 - Printing & Binding 52 - - - - 0.0%
1351 - Engineering Services
337

General Fund Departmental BudgetsPublic Works - Activity Analysis
FY22 Budget
Budget SummaryFY20
ActualsFY21
Projection
FY21AdoptedBudget
FY22AdoptedBudget Chg % Chg
By Object556000 - Postage 85 100 250 250 - 0.0%
557000 - Uniforms/ Laundry 788 3,000 3,380 3,220 (160) (4.7%)
574000 - R&M - Vehicles 11 500 500 500 - 0.0%
Total 774,137 984,051 975,722 949,133 (26,589) (2.7%)
Budget SummaryFY20
ActualsFY21
Projection
FY21AdoptedBudget
FY22AdoptedBudget Chg % Chg
By Object SummaryPersonnel Services 680,114 791,293 775,759 750,829 (24,930) (3.2%)
Operating 94,024 192,758 199,963 198,304 (1,659) (0.8%)
Total 774,137 984,051 975,722 949,133 (26,589) (2.7%)
338

General Fund Departmental BudgetsPublic Works - Activity Analysis
FY22 Budget
Budget SummaryFY20
ActualsFY21
Projection
FY21AdoptedBudget
FY22AdoptedBudget Chg % Chg
By Object522000 - General Operating Supplies - 7,000 7,000 7,000 - 0.0%
550000 - Electric 586,303 618,000 618,000 618,000 - 0.0%
573000 - R&M - Machinery & Equipment 80,000 80,000 80,000 80,000 - 0.0%
Total 666,303 705,000 705,000 705,000 - 0.0%
Budget SummaryFY20
ActualsFY21
Projection
FY21AdoptedBudget
FY22AdoptedBudget Chg % Chg
By Object SummaryOperating 666,303 705,000 705,000 705,000 - 0.0%
Total 666,303 705,000 705,000 705,000 - 0.0%
1393 - Street Lighting
339

General Fund Departmental BudgetsPublic Works - Activity Analysis
FY22 Budget
Budget SummaryFY20
ActualsFY21
Projection
FY21AdoptedBudget
FY22AdoptedBudget Chg % Chg
By Object501000 - Full-Time Wages 293,815 277,715 313,266 297,997 (15,269) (4.9%)
505300 - Other Taxable Comp.-HousingStipend 3,000 4,200 3,600 3,600 - 0.0%
507000 - Vacation & Sick Payouts 2,835 2,800 - - - 0.0%
508000 - Overtime Wages 17,569 14,500 25,456 26,550 1,094 4.3%
509000 - Part-Time Wages 7,914 7,200 2,404 18,079 15,675 652.0%
510000 - FICA Taxes 24,024 23,228 28,569 28,647 78 0.3%
514200 - Vision Benefit 152 378 413 407 (6) (1.5%)
514210 - Health Insurance 69,444 69,444 81,882 77,951 (3,931) (4.8%)
514220 - Dental Benefit 329 4,208 4,952 4,398 (554) (11.2%)
514230 - Long-Term Care Benefit 625 762 870 937 67 7.7%
514240 - Life Ins and Disability Benefit 2,812 2,827 3,308 3,306 (2) (0.1%)
515000 - Retirement (401A) 23,271 22,218 26,105 26,101 (4) (0.0%)
515050 - Supplemental Retirement (401A) 14,545 13,886 16,316 16,312 (4) (0.0%)
515100 - Retirement Health Savings(RHS) 4,696 5,095 4,703 4,977 274 5.8%
515200 - Medicare Retirement HealthSavings (RHS) 3,539 4,484 4,000 6,083 2,083 52.1%
516000 - Savings Plan (401K) 8,914 8,330 9,790 9,787 (3) (0.0%)
521000 - Office Supplies 17 12 - - - 0.0%
522000 - General Operating Supplies 83,644 168,500 185,000 184,500 (500) (0.3%)
522500 - Program Activities 503 - - - - 0.0%
526000 - Machinery/Equipment 2,578 2,000 3,000 2,000 (1,000) (33.3%)
529000 - Building & Construction Supplies 29,601 42,000 57,000 53,000 (4,000) (7.0%)
531600 - Software MaintenanceAgreements 120 120 110 120 10 9.1%
536000 - Miscellaneous ProfessionalServices 4,843 4,875 5,000 5,000 - 0.0%
Significant Changes
FY21AdoptedBudget
FY22AdoptedBudget
Increase /(Decrease)
Object - Object Name / Reason for Change
536400 - Contract Maintenance Services 225,000 270,500 45,500
Additional funding for plow contractors to help with the first section of Crown Farm, and holiday decoration utilityhookups on South Frederick Avenue.
1312 - Streets & Special Projects
340

General Fund Departmental BudgetsPublic Works - Activity Analysis
FY22 Budget
Budget SummaryFY20
ActualsFY21
Projection
FY21AdoptedBudget
FY22AdoptedBudget Chg % Chg
By Object536400 - Contract Maintenance Services 116,714 198,500 225,000 270,500 45,500 20.2%
536500 - Investigations 63 400 400 400 - 0.0%
544000 - Dues/Memberships/Certification 90 250 1,200 1,200 - 0.0%
546000 - Conf./Seminar/ClassRegistration 2,038 750 2,000 2,000 - 0.0%
546300 - In-Service Training (1,510) - - - - 0.0%
547000 - Travel Expense 581 300 - - - 0.0%
547100 - Local Travel Mileage 16 - - - - 0.0%
551100 - Cellular Phone 565 720 720 720 - 0.0%
552500 - Gasoline Expense 13,636 15,200 18,750 18,000 (750) (4.0%)
557000 - Uniforms/ Laundry 4,427 6,350 6,500 7,200 700 10.8%
560000 - Miscellaneous 3,478 8,500 10,000 10,000 - 0.0%
567000 - Rental & Use 2,194 11,200 15,000 13,200 (1,800) (12.0%)
574000 - R&M - Vehicles 35,683 34,300 40,000 37,500 (2,500) (6.3%)
Total 776,762 955,252 1,095,314 1,130,472 35,158 3.2%
Budget SummaryFY20
ActualsFY21
Projection
FY21AdoptedBudget
FY22AdoptedBudget Chg % Chg
By Object SummaryPersonnel Services 477,483 461,275 525,634 525,132 (502) (0.1%)
Operating 299,278 493,977 569,680 605,340 35,660 6.3%
Total 776,762 955,252 1,095,314 1,130,472 35,158 3.2%
341

General Fund Departmental BudgetsPublic Works - Activity Analysis
FY22 Budget
Budget SummaryFY20
ActualsFY21
Projection
FY21AdoptedBudget
FY22AdoptedBudget Chg % Chg
By Object501000 - Full-Time Wages 381,677 387,819 371,635 383,469 11,834 3.2%
507000 - Vacation & Sick Payouts 4,793 4,800 - - - 0.0%
508000 - Overtime Wages 20,145 12,500 27,750 26,550 (1,200) (4.3%)
509000 - Part-Time Wages 17,417 2,640 23,397 - (23,397) (100.0%)
510000 - FICA Taxes 31,574 30,826 31,738 32,589 851 2.7%
514200 - Vision Benefit 8 380 350 350 - 0.0%
514210 - Health Insurance 74,010 77,567 71,599 76,180 4,581 6.4%
514220 - Dental Benefit 2,540 4,289 3,957 3,957 - 0.0%
514230 - Long-Term Care Benefit 555 720 725 775 50 6.9%
514240 - Life Ins and Disability Benefit 3,779 3,888 3,868 3,981 113 2.9%
515000 - Retirement (401A) 30,453 31,027 30,970 31,956 986 3.2%
515050 - Supplemental Retirement (401A) 19,033 19,391 19,356 19,973 617 3.2%
516000 - Savings Plan (401K) 11,540 11,635 11,613 11,984 371 3.2%
521000 - Office Supplies 134 - - - - 0.0%
522000 - General Operating Supplies 29,434 32,500 35,000 35,000 - 0.0%
526000 - Machinery/Equipment 15,287 11,500 16,500 13,500 (3,000) (18.2%)
531000 - IT (Non-Consultant) Services 2,917 1,428 2,680 4,214 1,534 57.2%
531600 - Software MaintenanceAgreements 5,073 7,342 9,389 3,050 (6,339) (67.5%)
536000 - Miscellaneous ProfessionalServices 544 1,000 3,000 3,000 - 0.0%
542000 - Awards & Presentations - 50 - - - 0.0%
544000 - Dues/Memberships/Certification - - 1,000 500 (500) (50.0%)
546000 - Conf./Seminar/ClassRegistration 495 - 1,500 500 (1,000) (66.7%)
546300 - In-Service Training 180 - - - - 0.0%
552500 - Gasoline Expense 1,341 900 1,500 1,000 (500) (33.3%)
Significant Changes
FY21AdoptedBudget
FY22AdoptedBudget
Increase /(Decrease)
Object - Object Name / Reason for Change
531600 - Software Maintenance Agreements 9,389 3,050 (6,339)
Increase resulting from movement of Microsoft expenses to 531000 - IT (Non-Consultant) Services, FuelMasterto 573000 - R&M - Machinery & Equipment, and no expense for Navistar in FY22.
1315 - Fleet Maintenance
342

General Fund Departmental BudgetsPublic Works - Activity Analysis
FY22 Budget
Budget SummaryFY20
ActualsFY21
Projection
FY21AdoptedBudget
FY22AdoptedBudget Chg % Chg
By Object557000 - Uniforms/ Laundry 3,645 - 5,610 6,000 390 7.0%
560000 - Miscellaneous (0) - - - - 0.0%
573000 - R&M - Machinery & Equipment - - - 2,650 2,650 100.0%
574000 - R&M - Vehicles 897 1,000 2,000 2,000 - 0.0%
575000 - R&M - Furniture & Equipment 180 - - - - 0.0%
Total 657,651 643,202 675,137 663,178 (11,959) (1.8%)
Budget SummaryFY20
ActualsFY21
Projection
FY21AdoptedBudget
FY22AdoptedBudget Chg % Chg
By Object SummaryPersonnel Services 597,523 587,482 596,958 591,764 (5,194) (0.9%)
Operating 60,127 55,720 78,179 71,414 (6,765) (8.7%)
Total 657,651 643,202 675,137 663,178 (11,959) (1.8%)
343

General Fund Departmental BudgetsPublic Works - Activity Analysis
FY22 Budget
Budget SummaryFY20
ActualsFY21
Projection
FY21AdoptedBudget
FY22AdoptedBudget Chg % Chg
By Object501000 - Full-Time Wages 573,421 514,859 626,695 637,635 10,940 1.7%
505200 - Other Taxable Comp.-GFIT 355 756 1,596 1,596 - 0.0%
505300 - Other Taxable Comp.-HousingStipend 3,600 3,900 3,600 3,600 - 0.0%
507000 - Vacation & Sick Payouts 6,093 6,400 - - - 0.0%
508000 - Overtime Wages 25,825 19,500 55,500 26,550 (28,950) (52.2%)
509000 - Part-Time Wages 18,508 2,405 2,405 18,079 15,674 651.7%
510000 - FICA Taxes 45,315 41,419 55,967 54,625 (1,342) (2.4%)
514200 - Vision Benefit 91 623 847 855 8 0.9%
514210 - Health Insurance 180,256 139,718 161,858 187,657 25,799 15.9%
514220 - Dental Benefit 4,058 8,086 10,758 10,040 (718) (6.7%)
514230 - Long-Term Care Benefit 1,050 1,455 1,874 2,043 169 9.0%
514240 - Life Ins and Disability Benefit 5,665 5,208 6,577 6,682 105 1.6%
515000 - Retirement (401A) 46,118 41,190 52,223 53,137 914 1.8%
515050 - Supplemental Retirement (401A) 21,758 25,746 32,641 33,210 569 1.7%
515100 - Retirement Health Savings(RHS) 8,608 5,451 13,680 4,977 (8,703) (63.6%)
515200 - Medicare Retirement HealthSavings (RHS) 5,077 8,033 9,833 14,332 4,499 45.8%
516000 - Savings Plan (401K) 13,717 13,923 18,075 18,363 288 1.6%
521000 - Office Supplies 27 66 - - - 0.0%
522000 - General Operating Supplies 43,607 45,200 50,500 50,500 - 0.0%
526000 - Machinery/Equipment 4,296 6,750 6,750 6,750 - 0.0%
531000 - IT (Non-Consultant) Services - - - 321 321 100.0%
531600 - Software MaintenanceAgreements 380 425 1,851 - (1,851) (100.0%)
536400 - Contract Maintenance Services 37,621 38,000 38,000 38,000 - 0.0%
536500 - Investigations 63 400 400 400 - 0.0%
542000 - Awards & Presentations - 50 - - - 0.0%
544000 - Dues/Memberships/Certification 2,459 2,860 2,860 2,860 - 0.0%
546000 - Conf./Seminar/ClassRegistration 1,007 2,000 3,100 3,100 - 0.0%
546300 - In-Service Training 111 540 - - - 0.0%
547000 - Travel Expense - - 2,000 2,000 - 0.0%
1341 - Landscaping & Forestry
344

General Fund Departmental BudgetsPublic Works - Activity Analysis
FY22 Budget
Budget SummaryFY20
ActualsFY21
Projection
FY21AdoptedBudget
FY22AdoptedBudget Chg % Chg
By Object547100 - Local Travel Mileage 3 - - - - 0.0%
550200 - Water 4,219 4,850 5,000 5,000 - 0.0%
551100 - Cellular Phone 993 720 1,200 2,640 1,440 120.0%
552500 - Gasoline Expense 14,515 14,200 17,500 16,000 (1,500) (8.6%)
557000 - Uniforms/ Laundry 9,365 12,100 12,100 15,600 3,500 28.9%
567000 - Rental & Use 2,410 1,542 1,500 2,000 500 33.3%
574000 - R&M - Vehicles 18,414 - 30,000 26,500 (3,500) (11.7%)
Total 1,099,005 968,375 1,226,890 1,245,052 18,162 1.5%
Budget SummaryFY20
ActualsFY21
Projection
FY21AdoptedBudget
FY22AdoptedBudget Chg % Chg
By Object SummaryPersonnel Services 959,517 838,672 1,054,129 1,073,381 19,252 1.8%
Operating 139,488 129,703 172,761 171,671 (1,090) (0.6%)
Total 1,099,005 968,375 1,226,890 1,245,052 18,162 1.5%
345

General Fund Departmental BudgetsPublic Works - Activity Analysis
FY22 Budget
Budget SummaryFY20
ActualsFY21
Projection
FY21AdoptedBudget
FY22AdoptedBudget Chg % Chg
By Object501000 - Full-Time Wages 1,029,989 1,003,081 1,009,446 988,248 (21,198) (2.1%)
505200 - Other Taxable Comp.-GFIT 150 2,100 2,016 1,680 (336) (16.7%)
505300 - Other Taxable Comp.-HousingStipend 5,500 2,600 6,000 2,400 (3,600) (60.0%)
507000 - Vacation & Sick Payouts 13,795 13,800 - - - 0.0%
508000 - Overtime Wages 74,279 67,340 67,340 63,450 (3,890) (5.8%)
509000 - Part-Time Wages 50,794 7,200 7,171 54,226 47,055 656.2%
510000 - FICA Taxes 85,686 82,800 90,354 88,065 (2,289) (2.5%)
514200 - Vision Benefit 141 1,249 1,266 1,142 (124) (9.8%)
514210 - Health Insurance 223,618 246,932 247,373 240,418 (6,955) (2.8%)
514220 - Dental Benefit 6,670 15,777 16,116 14,458 (1,658) (10.3%)
514230 - Long-Term Care Benefit 1,930 2,624 2,755 2,790 35 1.3%
514240 - Life Ins and Disability Benefit 10,224 10,102 10,618 10,354 (264) (2.5%)
515000 - Retirement (401A) 101,778 80,243 84,121 82,355 (1,766) (2.1%)
515050 - Supplemental Retirement (401A) 50,592 50,157 52,576 51,471 (1,105) (2.1%)
515100 - Retirement Health Savings(RHS) 6,489 10,190 8,976 9,954 978 10.9%
515200 - Medicare Retirement HealthSavings (RHS) 6,001 7,968 8,000 8,000 - 0.0%
516000 - Savings Plan (401K) 30,932 30,091 29,734 30,886 1,152 3.9%
521000 - Office Supplies 68 30 - - - 0.0%
522000 - General Operating Supplies 91,882 95,400 106,800 118,300 11,500 10.8%
526000 - Machinery/Equipment 4,100 6,200 6,750 6,750 - 0.0%
531000 - IT (Non-Consultant) Services - - - 321 321 100.0%
Significant Changes
FY21AdoptedBudget
FY22AdoptedBudget
Increase /(Decrease)
Object - Object Name / Reason for Change
522000 - General Operating Supplies 106,800 118,300 11,500
Increase due to cost for playground replacement parts and need to replace the cargo net climber at Bohrer Park.
536400 - Contract Maintenance Services 174,200 200,700 26,500
Additional funding for the pond management contractor to help with Blue Green Algae, contract tree work, andLED lighting at Morris Park and Diamond Farms Park.
1343 - Municipal Parks Maintenance
346

General Fund Departmental BudgetsPublic Works - Activity Analysis
FY22 Budget
Budget SummaryFY20
ActualsFY21
Projection
FY21AdoptedBudget
FY22AdoptedBudget Chg % Chg
By Object531600 - Software MaintenanceAgreements 190 213 255 - (255) (100.0%)
536400 - Contract Maintenance Services 75,294 190,700 174,200 200,700 26,500 15.2%
536500 - Investigations - 600 1,200 1,200 - 0.0%
542000 - Awards & Presentations 437 - - - - 0.0%
544000 - Dues/Memberships/Certification 1,073 1,500 4,100 4,100 - 0.0%
546000 - Conf./Seminar/ClassRegistration 2,400 1,200 2,875 2,875 - 0.0%
546300 - In-Service Training 270 1,620 - - - 0.0%
547000 - Travel Expense - - 500 500 - 0.0%
550000 - Electric 4,300 6,000 6,000 6,000 - 0.0%
550200 - Water 21,020 14,000 14,000 14,000 - 0.0%
551100 - Cellular Phone 626 1,440 1,440 1,440 - 0.0%
552500 - Gasoline Expense 23,082 18,250 27,125 25,000 (2,125) (7.8%)
554000 - Signage 880 4,500 5,000 5,000 - 0.0%
557000 - Uniforms/ Laundry 12,658 19,200 18,500 21,900 3,400 18.4%
567000 - Rental & Use 1,720 1,943 3,500 2,000 (1,500) (42.9%)
572000 - R&M - Buildings & Facilities 11,978 5,000 9,000 8,000 (1,000) (11.1%)
573000 - R&M - Machinery & Equipment 979 - - - - 0.0%
574000 - R&M - Vehicles 34,946 32,500 43,000 39,500 (3,500) (8.1%)
596000 - Vehicles/Motor Equipment - 61,317 - - - 0.0%
Total 1,986,473 2,095,867 2,068,107 2,107,483 39,376 1.9%
Budget SummaryFY20
ActualsFY21
Projection
FY21AdoptedBudget
FY22AdoptedBudget Chg % Chg
By Object SummaryPersonnel Services 1,698,568 1,634,254 1,643,862 1,649,897 6,035 0.4%
Operating 287,905 400,296 424,245 457,586 33,341 7.9%
Capital - 61,317 - - - 0.0%
Total 1,986,473 2,095,867 2,068,107 2,107,483 39,376 1.9%
347

General Fund Departmental BudgetsPublic Works - Activity Analysis
FY22 Budget
Budget SummaryFY20
ActualsFY21
Projection
FY21AdoptedBudget
FY22AdoptedBudget Chg % Chg
By Object501000 - Full-Time Wages 1,034,687 1,053,069 1,008,080 976,883 (31,197) (3.1%)
505200 - Other Taxable Comp.-GFIT 976 1,680 1,680 1,344 (336) (20.0%)
505300 - Other Taxable Comp.-HousingStipend 17,800 14,300 18,000 13,200 (4,800) (26.7%)
507000 - Vacation & Sick Payouts 10,718 10,700 - - - 0.0%
508000 - Overtime Wages 87,693 79,500 105,450 105,750 300 0.3%
509000 - Part-Time Wages 48,971 21,600 7,186 54,226 47,040 654.6%
510000 - FICA Taxes 88,176 89,517 94,053 96,519 2,466 2.6%
514200 - Vision Benefit (38) 1,580 1,407 1,455 48 3.4%
514210 - Health Insurance 239,861 276,067 252,488 271,133 18,645 7.4%
514220 - Dental Benefit 2,991 17,594 15,920 16,234 314 2.0%
514230 - Long-Term Care Benefit 2,237 3,030 3,045 3,255 210 6.9%
514240 - Life Ins and Disability Benefit 10,279 10,716 10,600 11,046 446 4.2%
515000 - Retirement (401A) 83,273 84,244 84,008 86,971 2,963 3.5%
515050 - Supplemental Retirement (401A) 41,795 46,579 46,452 48,110 1,658 3.6%
515100 - Retirement Health Savings(RHS) 23,051 25,009 23,085 24,455 1,370 5.9%
515200 - Medicare Retirement HealthSavings (RHS) 6,693 8,051 8,000 8,000 - 0.0%
516000 - Savings Plan (401K) 26,497 29,156 27,870 30,117 2,247 8.1%
521000 - Office Supplies 125 200 500 500 - 0.0%
522000 - General Operating Supplies 24,870 19,500 26,500 22,500 (4,000) (15.1%)
526000 - Machinery/Equipment 449 2,500 3,650 2,250 (1,400) (38.4%)
531000 - IT (Non-Consultant) Services - - - 321 321 100.0%
531600 - Software MaintenanceAgreements 190 213 255 - (255) (100.0%)
536000 - Miscellaneous ProfessionalServices 326 - - - - 0.0%
Significant Changes
FY21AdoptedBudget
FY22AdoptedBudget
Increase /(Decrease)
Object - Object Name / Reason for Change
536400 - Contract Maintenance Services 204,100 249,500 45,400
Additional funding for Leaf Removal contractors to assist City leafing crews. The Operations Division will becollecting leaves in Crown Farm.
1344 - Mowing & Bulk Pick-Up
348

General Fund Departmental BudgetsPublic Works - Activity Analysis
FY22 Budget
Budget SummaryFY20
ActualsFY21
Projection
FY21AdoptedBudget
FY22AdoptedBudget Chg % Chg
By Object536400 - Contract Maintenance Services 156,904 204,100 204,100 249,500 45,400 22.2%
536500 - Investigations 94 500 500 500 - 0.0%
544000 - Dues/Memberships/Certification 3,798 500 3,500 3,000 (500) (14.3%)
546000 - Conf./Seminar/ClassRegistration 2,495 - 2,500 1,500 (1,000) (40.0%)
546300 - In-Service Training 270 1,800 - - - 0.0%
551100 - Cellular Phone 1,173 720 720 1,680 960 133.3%
552500 - Gasoline Expense 38,694 32,500 46,875 42,000 (4,875) (10.4%)
557000 - Uniforms/ Laundry 14,971 20,500 20,500 24,500 4,000 19.5%
567000 - Rental & Use 96,232 121,500 124,000 119,500 (4,500) (3.6%)
572000 - R&M - Buildings & Facilities 1 - - - - 0.0%
574000 - R&M - Vehicles 60,320 58,500 75,000 70,500 (4,500) (6.0%)
596000 - Vehicles/Motor Equipment - 149,350 - - - 0.0%
Total 2,126,573 2,384,775 2,215,924 2,286,949 71,025 3.2%
Budget SummaryFY20
ActualsFY21
Projection
FY21AdoptedBudget
FY22AdoptedBudget Chg % Chg
By Object SummaryPersonnel Services 1,725,662 1,772,392 1,707,324 1,748,698 41,374 2.4%
Operating 400,912 463,033 508,600 538,251 29,651 5.8%
Capital - 149,350 - - - 0.0%
Total 2,126,573 2,384,775 2,215,924 2,286,949 71,025 3.2%
349

General Fund Departmental BudgetsPublic Works - Activity Analysis
FY22 Budget
Budget SummaryFY20
ActualsFY21
Projection
FY21AdoptedBudget
FY22AdoptedBudget Chg % Chg
By Object501000 - Full-Time Wages 119,371 119,065 115,756 118,403 2,647 2.3%
505200 - Other Taxable Comp.-GFIT 198 420 336 336 - 0.0%
507000 - Vacation & Sick Payouts 4,254 4,300 - - - 0.0%
508000 - Overtime Wages 9,740 8,500 14,615 16,875 2,260 15.5%
509000 - Part-Time Wages 11,697 7,200 2,405 18,079 15,674 651.7%
510000 - FICA Taxes 10,609 10,342 11,752 12,136 384 3.3%
514200 - Vision Benefit (32) 200 184 184 - 0.0%
514210 - Health Insurance 38,201 47,374 38,186 46,528 8,342 21.8%
514220 - Dental Benefit 1,103 2,850 2,206 2,630 424 19.2%
514230 - Long-Term Care Benefit 221 288 290 310 20 6.9%
514240 - Life Ins and Disability Benefit 1,179 1,198 1,213 1,240 27 2.2%
515000 - Retirement (401A) 9,497 9,526 9,647 9,867 220 2.3%
515050 - Supplemental Retirement (401A) 5,936 5,953 6,029 6,167 138 2.3%
516000 - Savings Plan (401K) 3,573 3,572 3,617 3,700 83 2.3%
522000 - General Operating Supplies 41,432 28,500 45,000 45,000 - 0.0%
526000 - Machinery/Equipment - 500 1,250 1,250 - 0.0%
531500 - Software Licenses - 300 300 - (300) (100.0%)
531600 - Software MaintenanceAgreements 190 213 255 - (255) (100.0%)
536000 - Miscellaneous ProfessionalServices 899 - - - - 0.0%
536400 - Contract Maintenance Services 9,417 52,500 59,500 106,000 46,500 78.2%
544000 - Dues/Memberships/Certification - - 400 400 - 0.0%
546000 - Conf./Seminar/ClassRegistration - - 1,400 1,400 - 0.0%
546300 - In-Service Training 90 - - - - 0.0%
550000 - Electric 3,267 4,250 5,000 3,800 (1,200) (24.0%)
551100 - Cellular Phone 669 720 720 1,200 480 66.7%
Significant Changes
FY21AdoptedBudget
FY22AdoptedBudget
Increase /(Decrease)
Object - Object Name / Reason for Change
536400 - Contract Maintenance Services 59,500 106,000 46,500
Additional funding for painting and signage of all traffic circles in Gaithersburg.
1397 - Traffic Control
350

General Fund Departmental BudgetsPublic Works - Activity Analysis
FY22 Budget
Budget SummaryFY20
ActualsFY21
Projection
FY21AdoptedBudget
FY22AdoptedBudget Chg % Chg
By Object552500 - Gasoline Expense 561 1,470 2,000 1,500 (500) (25.0%)
557000 - Uniforms/ Laundry 1,280 2,600 2,600 2,600 - 0.0%
574000 - R&M - Vehicles 480 2,500 3,000 3,000 - 0.0%
Total 273,833 314,341 327,661 402,605 74,944 22.9%
Budget SummaryFY20
ActualsFY21
Projection
FY21AdoptedBudget
FY22AdoptedBudget Chg % Chg
By Object SummaryPersonnel Services 215,548 220,788 206,236 236,455 30,219 14.7%
Operating 58,285 93,553 121,425 166,150 44,725 36.8%
Total 273,833 314,341 327,661 402,605 74,944 22.9%
351

General Fund Departmental BudgetsPublic Works - Activity Analysis
FY22 Budget
Budget SummaryFY20
ActualsFY21
Projection
FY21AdoptedBudget
FY22AdoptedBudget Chg % Chg
By Object501000 - Full-Time Wages 55,509 65,582 63,960 65,302 1,342 2.1%
505200 - Other Taxable Comp.-GFIT 229 420 336 336 - 0.0%
510000 - FICA Taxes 4,123 5,049 5,123 5,229 106 2.1%
514200 - Vision Benefit (5) 40 37 37 - 0.0%
514210 - Health Insurance 7,162 9,259 8,546 9,093 547 6.4%
514220 - Dental Benefit 682 466 430 430 - 0.0%
514230 - Long-Term Care Benefit 70 144 151 155 4 2.6%
514240 - Life Ins and Disability Benefit 542 661 671 685 14 2.1%
515000 - Retirement (401A) 4,441 5,246 5,330 5,442 112 2.1%
515200 - Medicare Retirement HealthSavings (RHS) 1,616 1,992 2,083 2,000 (83) (4.0%)
516000 - Savings Plan (401K) 1,665 1,968 1,999 2,041 42 2.1%
519000 - Tuition Reimbursement - - - 3,500 3,500 100.0%
522000 - General Operating Supplies 543 - - - - 0.0%
522500 - Program Activities 5,999 17,000 23,200 23,000 (200) (0.9%)
525000 - Furniture/Fixture - - 200 - (200) (100.0%)
526000 - Machinery/Equipment 108 - 250 750 500 200.0%
531000 - IT (Non-Consultant) Services 112 111 113 432 319 282.3%
531600 - Software MaintenanceAgreements 190 213 255 - (255) (100.0%)
536500 - Investigations 31 - - - - 0.0%
541000 - Advertising - 1,200 1,200 750 (450) (37.5%)
542000 - Awards & Presentations 60 600 1,050 1,350 300 28.6%
544000 - Dues/Memberships/Certification 5,960 1,800 3,000 3,000 - 0.0%
545000 - Publications/ Resource Material 505 50 450 450 - 0.0%
546000 - Conf./Seminar/ClassRegistration 400 500 4,400 2,000 (2,400) (54.5%)
546300 - In-Service Training - 90 - - - 0.0%
547000 - Travel Expense 113 - 800 800 - 0.0%
550900 - Other Utilities - 6,230 6,230 7,500 1,270 20.4%
551100 - Cellular Phone - - 720 480 (240) (33.3%)
553000 - Printing & Binding - 400 500 500 - 0.0%
554000 - Signage 1 450 450 450 - 0.0%
1134 - City Sustainability Program
352

General Fund Departmental BudgetsPublic Works - Activity Analysis
FY22 Budget
Budget SummaryFY20
ActualsFY21
Projection
FY21AdoptedBudget
FY22AdoptedBudget Chg % Chg
By Object560000 - Miscellaneous 1,333 850 850 850 - 0.0%
Total 91,388 120,321 132,334 136,562 4,228 3.2%
Budget SummaryFY20
ActualsFY21
Projection
FY21AdoptedBudget
FY22AdoptedBudget Chg % Chg
By Object SummaryPersonnel Services 76,033 90,827 88,666 94,250 5,584 6.3%
Operating 15,355 29,494 43,668 42,312 (1,356) (3.1%)
Total 91,388 120,321 132,334 136,562 4,228 3.2%
353

General Fund Departmental BudgetsPublic Works - Activity Analysis
FY22 Budget
Budget SummaryFY20
ActualsFY21
Projection
FY21AdoptedBudget
FY22AdoptedBudget Chg % Chg
By Object522000 - General Operating Supplies 546 1,500 6,450 6,450 - 0.0%
Total 546 1,500 6,450 6,450 - 0.0%
Budget SummaryFY20
ActualsFY21
Projection
FY21AdoptedBudget
FY22AdoptedBudget Chg % Chg
By Object SummaryOperating 546 1,500 6,450 6,450 - 0.0%
Total 546 1,500 6,450 6,450 - 0.0%
1342 - Environmental Services Operations
354

General Fund Departmental BudgetsPublic Works - Activity Analysis
FY22 Budget
Budget SummaryFY20
ActualsFY21
Projection
FY21AdoptedBudget
FY22AdoptedBudget Chg % Chg
By Object501000 - Full-Time Wages 877,131 880,618 877,769 971,923 94,154 10.7%
505200 - Other Taxable Comp.-GFIT 206 1,680 1,848 2,016 168 9.1%
507000 - Vacation & Sick Payouts 14,803 19,466 - - - 0.0%
508000 - Overtime Wages 30,493 35,000 35,135 48,619 13,484 38.4%
510000 - FICA Taxes 67,985 70,172 72,701 81,324 8,623 11.9%
514200 - Vision Benefit 492 761 762 899 137 18.0%
514210 - Health Insurance 159,132 167,581 165,493 198,732 33,239 20.1%
514220 - Dental Benefit 3,545 9,789 9,619 10,872 1,253 13.0%
514230 - Long-Term Care Benefit 961 1,572 1,667 2,029 362 21.7%
514240 - Life Ins and Disability Benefit 8,430 8,811 8,867 9,810 943 10.6%
515000 - Retirement (401A) 70,031 70,447 73,149 80,992 7,843 10.7%
515050 - Supplemental Retirement (401A) 22,662 26,105 26,464 32,160 5,696 21.5%
515100 - Retirement Health Savings(RHS) 9,392 10,190 9,406 9,954 548 5.8%
515200 - Medicare Retirement HealthSavings (RHS) 2,000 1,824 3,000 6,166 3,166 105.5%
516000 - Savings Plan (401K) 22,828 22,803 23,782 26,634 2,852 12.0%
519000 - Tuition Reimbursement 4,257 7,000 7,000 7,000 - 0.0%
521000 - Office Supplies 2,309 2,000 4,200 4,200 - 0.0%
Significant Changes
FY21AdoptedBudget
FY22AdoptedBudget
Increase /(Decrease)
Object - Object Name / Reason for Change
529000 - Building & Construction Supplies - 6,000 6,000
Increase due to miscellaneous custodial supplies for two new custodians.
531000 - IT (Non-Consultant) Services 60,127 91,042 30,915
Additional cost for renewal of new Computerized Maintenance Management System Software and CapitalFacility Condition Assessment (FCA) Planning Software.
572000 - R&M - Buildings & Facilities 215,000 196,000 (19,000)
Decrease due to realignment of costs from 1150-572000 to 1150-573000.
573000 - R&M - Machinery & Equipment 62,500 75,000 12,500
Increase due to realignment of costs from 1150-572000 to 1150-573000.
595060 - Machinery & Equipment 10,000 - (10,000)
Reduction due to the cost of purchasing new custodial equipment and outfitting new facilities vans.
1150 - Facilities Management
355

General Fund Departmental BudgetsPublic Works - Activity Analysis
FY22 Budget
Budget SummaryFY20
ActualsFY21
Projection
FY21AdoptedBudget
FY22AdoptedBudget Chg % Chg
By Object522000 - General Operating Supplies 3,596 8,000 15,000 12,000 (3,000) (20.0%)
526000 - Machinery/Equipment 11,032 13,000 15,000 15,000 - 0.0%
529000 - Building & Construction Supplies - - - 6,000 6,000 100.0%
531000 - IT (Non-Consultant) Services 38,060 60,127 60,127 91,042 30,915 51.4%
531500 - Software Licenses 2,318 - - - - 0.0%
531600 - Software MaintenanceAgreements 3,539 4,200 4,200 613 (3,587) (85.4%)
536000 - Miscellaneous ProfessionalServices 1,812 - - - - 0.0%
536300 - Contract Cleaning 2,622 3,500 3,500 3,500 - 0.0%
536400 - Contract Maintenance Services 2,146 15,000 28,805 30,191 1,386 4.8%
542000 - Awards & Presentations 50 - - - - 0.0%
544000 - Dues/Memberships/Certification 10,759 8,000 10,350 10,350 - 0.0%
545000 - Publications/ Resource Material 3,955 6,000 3,900 4,400 500 12.8%
546000 - Conf./Seminar/ClassRegistration 16,780 25,000 35,250 35,000 (250) (0.7%)
546300 - In-Service Training 450 - - - - 0.0%
547000 - Travel Expense 1,013 - 2,300 2,300 - 0.0%
550000 - Electric 12,840 8,000 14,000 12,000 (2,000) (14.3%)
550200 - Water 115 - 150 150 - 0.0%
550700 - Solid Waste/Recycling 3,913 5,000 5,000 5,000 - 0.0%
550900 - Other Utilities 3,809 500 3,000 3,000 - 0.0%
551000 - Telephone (Landline) 709 520 560 560 - 0.0%
551100 - Cellular Phone 6,478 6,000 7,640 7,440 (200) (2.6%)
552500 - Gasoline Expense 14,648 10,000 17,750 17,750 - 0.0%
553000 - Printing & Binding - - 2,000 2,000 - 0.0%
556000 - Postage 72 200 200 200 - 0.0%
557000 - Uniforms/ Laundry 4,718 8,000 6,700 6,700 - 0.0%
560000 - Miscellaneous 164 - - - - 0.0%
572000 - R&M - Buildings & Facilities 244,889 190,000 215,000 196,000 (19,000) (8.8%)
573000 - R&M - Machinery & Equipment 43,070 50,000 62,500 75,000 12,500 20.0%
574000 - R&M - Vehicles 4,526 6,700 10,000 10,000 - 0.0%
575000 - R&M - Furniture & Equipment 72 - - - - 0.0%
595060 - Machinery & Equipment 3,313 10,000 10,000 - (10,000) (100.0%)
595100 - Furniture & Equipment(Replacement) - 2,500 5,000 5,000 - 0.0%
356

General Fund Departmental BudgetsPublic Works - Activity Analysis
FY22 Budget
Budget SummaryFY20
ActualsFY21
Projection
FY21AdoptedBudget
FY22AdoptedBudget Chg % Chg
By ObjectTotal 1,738,121 1,776,066 1,858,795 2,044,526 185,731 10.0%
Budget SummaryFY20
ActualsFY21
Projection
FY21AdoptedBudget
FY22AdoptedBudget Chg % Chg
By Object SummaryPersonnel Services 1,294,348 1,333,819 1,316,662 1,489,130 172,468 13.1%
Operating 440,461 429,747 527,132 550,396 23,264 4.4%
Capital 3,313 12,500 15,000 5,000 (10,000) (66.7%)
Total 1,738,121 1,776,066 1,858,795 2,044,526 185,731 10.0%
357

General Fund Departmental BudgetsPublic Works - Activity Analysis
FY22 Budget
Budget SummaryFY20
ActualsFY21
Projection
FY21AdoptedBudget
FY22AdoptedBudget Chg % Chg
By Object529000 - Building & Construction Supplies - - - 9,000 9,000 100.0%
536300 - Contract Cleaning 41,045 43,316 43,316 28,500 (14,816) (34.2%)
536400 - Contract Maintenance Services 12,041 18,000 18,088 19,139 1,051 5.8%
550000 - Electric 15,183 15,000 22,000 19,000 (3,000) (13.6%)
550100 - Gas (Natural) 4,613 5,000 5,000 5,000 - 0.0%
550200 - Water 6,357 5,000 8,000 7,000 (1,000) (12.5%)
550700 - Solid Waste/Recycling 5,444 5,444 5,444 5,444 0 0.0%
551000 - Telephone (Landline) 6,685 8,000 6,675 7,250 575 8.6%
552500 - Gasoline Expense - 500 856 1,000 144 16.8%
572000 - R&M - Buildings & Facilities 41,566 40,000 48,000 75,802 27,802 57.9%
Total 132,934 140,260 157,379 177,135 19,756 12.6%
Budget SummaryFY20
ActualsFY21
Projection
FY21AdoptedBudget
FY22AdoptedBudget Chg % Chg
By Object SummaryOperating 132,934 140,260 157,379 177,135 19,756 12.6%
Total 132,934 140,260 157,379 177,135 19,756 12.6%
Significant Changes
FY21AdoptedBudget
FY22AdoptedBudget
Increase /(Decrease)
Object - Object Name / Reason for Change
529000 - Building & Construction Supplies - 9,000 9,000
Increase due to additional custodial supplies for City Hall for the new custodians to use.
536300 - Contract Cleaning 43,316 28,500 (14,816)
Reduction in contract cleaning costs as two new custodians are hired.
572000 - R&M - Buildings & Facilities 48,000 75,802 27,802
Net increase for the one-time project for the waterproofing project for the basement mechanical room.
1151 - Building & Grounds - City Hall
358

General Fund Departmental BudgetsPublic Works - Activity Analysis
FY22 Budget
Budget SummaryFY20
ActualsFY21
Projection
FY21AdoptedBudget
FY22AdoptedBudget Chg % Chg
By Object536300 - Contract Cleaning 18,345 18,956 18,956 18,956 - 0.0%
536400 - Contract Maintenance Services 3,104 5,609 5,609 6,504 895 16.0%
550000 - Electric 15,270 18,000 20,000 17,000 (3,000) (15.0%)
550100 - Gas (Natural) 1,120 1,000 1,500 1,300 (200) (13.3%)
550200 - Water 2,305 1,200 5,000 4,000 (1,000) (20.0%)
550700 - Solid Waste/Recycling 1,532 1,533 1,533 1,534 1 0.1%
551000 - Telephone (Landline) 2,315 2,700 2,225 2,230 5 0.2%
552500 - Gasoline Expense - 200 214 300 86 40.2%
572000 - R&M - Buildings & Facilities 36,242 6,000 12,000 40,000 28,000 233.3%
Total 80,232 55,198 67,037 91,824 24,787 37.0%
Budget SummaryFY20
ActualsFY21
Projection
FY21AdoptedBudget
FY22AdoptedBudget Chg % Chg
By Object SummaryOperating 80,232 55,198 67,037 91,824 24,787 37.0%
Total 80,232 55,198 67,037 91,824 24,787 37.0%
Significant Changes
FY21AdoptedBudget
FY22AdoptedBudget
Increase /(Decrease)
Object - Object Name / Reason for Change
572000 - R&M - Buildings & Facilities 12,000 40,000 28,000
Increased expenses related to phase 2 of the Window Replacement Project. Phase 1 was completed in FY20.
1152 - Building & Grounds - 14 Faulks Corner
359

General Fund Departmental BudgetsPublic Works - Activity Analysis
FY22 Budget
Budget SummaryFY20
ActualsFY21
Projection
FY21AdoptedBudget
FY22AdoptedBudget Chg % Chg
By Object526000 - Machinery/Equipment - 6,500 6,500 - (6,500) (100.0%)
529000 - Building & Construction Supplies - - - 10,000 10,000 100.0%
536300 - Contract Cleaning 14,427 14,908 14,908 14,908 - 0.0%
536400 - Contract Maintenance Services 13,427 29,934 26,581 26,444 (137) (0.5%)
550000 - Electric 32,368 36,000 40,000 35,000 (5,000) (12.5%)
550100 - Gas (Natural) 16,851 14,000 18,000 18,000 - 0.0%
550200 - Water 5,418 8,500 8,500 8,000 (500) (5.9%)
550700 - Solid Waste/Recycling 3,808 7,000 13,972 13,972 (0) (0.0%)
550900 - Other Utilities 128 120 120 120 - 0.0%
551000 - Telephone (Landline) 2,148 3,000 2,225 2,230 5 0.2%
552500 - Gasoline Expense - 500 1,070 500 (570) (53.3%)
556000 - Postage 12 - - - - 0.0%
572000 - R&M - Buildings & Facilities 114,352 64,000 68,787 74,787 6,000 8.7%
Total 202,939 184,462 200,663 203,961 3,298 1.6%
Budget SummaryFY20
ActualsFY21
Projection
FY21AdoptedBudget
FY22AdoptedBudget Chg % Chg
By Object SummaryOperating 202,939 184,462 200,663 203,961 3,298 1.6%
Total 202,939 184,462 200,663 203,961 3,298 1.6%
Significant Changes
FY21AdoptedBudget
FY22AdoptedBudget
Increase /(Decrease)
Object - Object Name / Reason for Change
526000 - Machinery/Equipment 6,500 - (6,500)
Reduction due to the one-time project in FY21 to upgrade the DPW Gate Pedestal.
529000 - Building & Construction Supplies - 10,000 10,000
Increase due to purchase of custodial supplies for the two new custodians.
550000 - Electric 40,000 35,000 (5,000)
Decrease due to electric consumption consolidation based on energy fixtures being installed.
572000 - R&M - Buildings & Facilities 68,787 74,787 6,000
Net increase over last year due to the cost of the replacement of the two hot water heating pumps that needreplacement.
1153 - Building & Grounds - Public Works
360

General Fund Departmental BudgetsPublic Works - Activity Analysis
FY22 Budget
Budget SummaryFY20
ActualsFY21
Projection
FY21AdoptedBudget
FY22AdoptedBudget Chg % Chg
By Object536300 - Contract Cleaning 3,943 8,500 11,518 11,518 - 0.0%
536400 - Contract Maintenance Services 2,951 3,366 3,366 3,702 336 10.0%
550000 - Electric 13,957 13,000 13,000 15,000 2,000 15.4%
550100 - Gas (Natural) 1,912 1,100 2,500 2,000 (500) (20.0%)
551000 - Telephone (Landline) 534 700 560 560 - 0.0%
572000 - R&M - Buildings & Facilities 2,711 2,000 4,097 4,097 0 0.0%
Total 26,008 28,666 35,041 36,877 1,836 5.2%
Budget SummaryFY20
ActualsFY21
Projection
FY21AdoptedBudget
FY22AdoptedBudget Chg % Chg
By Object SummaryOperating 26,008 28,666 35,041 36,877 1,836 5.2%
Total 26,008 28,666 35,041 36,877 1,836 5.2%
1155 - Building & Grounds - Train Station/Freight House
361

General Fund Departmental BudgetsPublic Works - Activity Analysis
FY22 Budget
Budget SummaryFY20
ActualsFY21
Projection
FY21AdoptedBudget
FY22AdoptedBudget Chg % Chg
By Object536400 - Contract Maintenance Services 9,039 14,000 16,656 16,599 (57) (0.3%)
550000 - Electric 9,630 11,000 13,000 12,000 (1,000) (7.7%)
550100 - Gas (Natural) 5,704 5,000 6,000 6,000 - 0.0%
550200 - Water 5,131 1,200 2,500 2,500 - 0.0%
550700 - Solid Waste/Recycling 3,639 5,676 4,658 4,659 1 0.0%
551000 - Telephone (Landline) 3,751 4,600 3,895 3,905 10 0.3%
572000 - R&M - Buildings & Facilities 8,777 10,000 20,000 44,500 24,500 122.5%
Total 45,671 51,476 66,710 90,163 23,454 35.2%
Budget SummaryFY20
ActualsFY21
Projection
FY21AdoptedBudget
FY22AdoptedBudget Chg % Chg
By Object SummaryOperating 45,671 51,476 66,710 90,163 23,454 35.2%
Total 45,671 51,476 66,710 90,163 23,454 35.2%
Significant Changes
FY21AdoptedBudget
FY22AdoptedBudget
Increase /(Decrease)
Object - Object Name / Reason for Change
572000 - R&M - Buildings & Facilities 20,000 44,500 24,500
Increase due to 0ne-time project cost to replace the 2-chilled water pumps that are over 20 years old.
1158 - Building & Grounds - Kentlands Mansion
362

General Fund Departmental BudgetsPublic Works - Activity Analysis
FY22 Budget
Budget SummaryFY20
ActualsFY21
Projection
FY21AdoptedBudget
FY22AdoptedBudget Chg % Chg
By Object536400 - Contract Maintenance Services 7,168 15,921 20,780 21,777 997 4.8%
550000 - Electric 19,027 20,000 30,000 26,500 (3,500) (11.7%)
550100 - Gas (Natural) 6,813 2,500 5,000 5,000 - 0.0%
550200 - Water 8,403 7,000 15,000 13,600 (1,400) (9.3%)
550700 - Solid Waste/Recycling 3,821 5,960 4,891 4,892 1 0.0%
551000 - Telephone (Landline) 1,160 1,300 1,115 1,115 - 0.0%
572000 - R&M - Buildings & Facilities 18,063 8,000 18,000 18,000 (0) (0.0%)
Total 64,453 60,681 94,787 90,884 (3,903) (4.1%)
Budget SummaryFY20
ActualsFY21
Projection
FY21AdoptedBudget
FY22AdoptedBudget Chg % Chg
By Object SummaryOperating 64,453 60,681 94,787 90,884 (3,903) (4.1%)
Total 64,453 60,681 94,787 90,884 (3,903) (4.1%)
1159 - Building & Grounds - Benjamin Gaither Center
363

General Fund Departmental BudgetsPublic Works - Activity Analysis
FY22 Budget
Budget SummaryFY20
ActualsFY21
Projection
FY21AdoptedBudget
FY22AdoptedBudget Chg % Chg
By Object536300 - Contract Cleaning 65,662 58,000 79,761 79,761 - 0.0%
536400 - Contract Maintenance Services 6,061 12,924 9,589 9,688 99 1.0%
550000 - Electric 27,292 25,000 35,000 33,000 (2,000) (5.7%)
550100 - Gas (Natural) 2,575 1,600 4,000 3,000 (1,000) (25.0%)
550200 - Water 7,126 6,000 9,500 7,500 (2,000) (21.1%)
550700 - Solid Waste/Recycling 3,199 3,787 3,787 3,787 (0) (0.0%)
551000 - Telephone (Landline) 2,682 3,400 2,785 2,790 5 0.2%
572000 - R&M - Buildings & Facilities 16,187 10,000 20,000 45,000 25,000 125.0%
Total 130,784 120,711 164,422 184,526 20,104 12.2%
Budget SummaryFY20
ActualsFY21
Projection
FY21AdoptedBudget
FY22AdoptedBudget Chg % Chg
By Object SummaryOperating 130,784 120,711 164,422 184,526 20,104 12.2%
Total 130,784 120,711 164,422 184,526 20,104 12.2%
Significant Changes
FY21AdoptedBudget
FY22AdoptedBudget
Increase /(Decrease)
Object - Object Name / Reason for Change
572000 - R&M - Buildings & Facilities 20,000 45,000 25,000
Increase due to one-time project to rekey Casey Community Center as there are over 85 keys for this facility.
1160 - Building & Grounds - Casey Community Center
364

General Fund Departmental BudgetsPublic Works - Activity Analysis
FY22 Budget
Budget SummaryFY20
ActualsFY21
Projection
FY21AdoptedBudget
FY22AdoptedBudget Chg % Chg
By Object536300 - Contract Cleaning 799 1,000 1,849 1,900 51 2.8%
536400 - Contract Maintenance Services 828 828 828 1,521 693 83.7%
550000 - Electric 446 1,500 1,500 1,000 (500) (33.3%)
550200 - Water 205 300 300 300 - 0.0%
572000 - R&M - Buildings & Facilities 111 750 1,000 1,000 - 0.0%
Total 2,389 4,378 5,477 5,721 244 4.5%
Budget SummaryFY20
ActualsFY21
Projection
FY21AdoptedBudget
FY22AdoptedBudget Chg % Chg
By Object SummaryOperating 2,389 4,378 5,477 5,721 244 4.5%
Total 2,389 4,378 5,477 5,721 244 4.5%
1161 - Building & Grounds - Olde Towne Pavilion
365

General Fund Departmental BudgetsPublic Works - Activity Analysis
FY22 Budget
Budget SummaryFY20
ActualsFY21
Projection
FY21AdoptedBudget
FY22AdoptedBudget Chg % Chg
By Object529000 - Building & Construction Supplies - - - 32,000 32,000 100.0%
536400 - Contract Maintenance Services 4,491 3,000 6,496 29,818 23,322 359.0%
550000 - Electric 30,969 3,500 25,000 65,000 40,000 160.0%
550100 - Gas (Natural) - - 2,000 12,000 10,000 500.0%
550200 - Water - - 2,000 12,000 10,000 500.0%
550700 - Solid Waste/Recycling - - 3,491 8,750 5,259 150.6%
551000 - Telephone (Landline) 3,133 4,000 1,115 3,345 2,230 200.0%
552500 - Gasoline Expense - - 2,140 4,800 2,660 124.3%
572000 - R&M - Buildings & Facilities 7,980 6,000 6,000 35,000 29,000 483.3%
575000 - R&M - Furniture & Equipment - 5,900 5,904 6,000 96 1.6%
Total 46,573 22,400 54,146 208,713 154,567 285.5%
Significant Changes
FY21AdoptedBudget
FY22AdoptedBudget
Increase /(Decrease)
Object - Object Name / Reason for Change
529000 - Building & Construction Supplies - 32,000 32,000
Increase due to estimated cost for custodial supplies based on anticipated usage for new building at 16 SouthSummit Avenue.
536400 - Contract Maintenance Services 6,496 29,818 23,322
Increase due to cost for required service contracts for regulatory requirements for opening 16 South SummitAvenue.
550000 - Electric 25,000 65,000 40,000
Increase due to estimated cost for electric usage for new service at 16 South Summit Avenue.
550100 - Gas (Natural) 2,000 12,000 10,000
Increase due to estimated cost for natural gas usage for new service at 16 South Summit Avenue.
550200 - Water 2,000 12,000 10,000
Increase due to estimated cost for water usage for new service at 16 South Summit Avenue.
550700 - Solid Waste/Recycling 3,491 8,750 5,259
Increase due to cost for refuse/recycling service for new service at 16 South Summit Avenue.
572000 - R&M - Buildings & Facilities 6,000 35,000 29,000
Increase due to a baseline budget cost for R&M services for the new building is based on using the squarefootage cost of other City Facilities.
1162 - Building & Grounds - 16 South Summit Avenue
366

General Fund Departmental BudgetsPublic Works - Activity Analysis
FY22 Budget
Budget SummaryFY20
ActualsFY21
Projection
FY21AdoptedBudget
FY22AdoptedBudget Chg % Chg
By Object SummaryOperating 46,573 22,400 54,146 208,713 154,567 285.5%
Total 46,573 22,400 54,146 208,713 154,567 285.5%
367

General Fund Departmental BudgetsPublic Works - Activity Analysis
FY22 Budget
Budget SummaryFY20
ActualsFY21
Projection
FY21AdoptedBudget
FY22AdoptedBudget Chg % Chg
By Object536300 - Contract Cleaning 3,764 4,415 4,415 4,415 - 0.0%
536400 - Contract Maintenance Services 576 1,052 1,052 1,626 574 54.6%
550700 - Solid Waste/Recycling 2,301 3,526 2,914 2,914 0 0.0%
551000 - Telephone (Landline) 534 600 560 560 - 0.0%
572000 - R&M - Buildings & Facilities 4,502 16,000 7,500 12,300 4,800 64.0%
573000 - R&M - Machinery & Equipment - 8,000 3,050 3,050 - 0.0%
Total 11,677 33,593 19,491 24,865 5,374 27.6%
Budget SummaryFY20
ActualsFY21
Projection
FY21AdoptedBudget
FY22AdoptedBudget Chg % Chg
By Object SummaryOperating 11,677 33,593 19,491 24,865 5,374 27.6%
Total 11,677 33,593 19,491 24,865 5,374 27.6%
1164 - Building & Grounds - Gaithersburg Aquatic Center
368

General Fund Departmental BudgetsPublic Works - Activity Analysis
FY22 Budget
Budget SummaryFY20
ActualsFY21
Projection
FY21AdoptedBudget
FY22AdoptedBudget Chg % Chg
By Object536300 - Contract Cleaning 106,723 110,000 124,192 124,192 - 0.0%
536400 - Contract Maintenance Services 3,973 12,841 8,467 8,398 (69) (0.8%)
550000 - Electric 60,977 65,000 85,000 81,000 (4,000) (4.7%)
550100 - Gas (Natural) 11,813 9,000 12,500 12,500 - 0.0%
550700 - Solid Waste/Recycling 9,436 11,950 11,950 11,950 0 0.0%
551000 - Telephone (Landline) 4,292 4,450 4,450 4,460 10 0.2%
552500 - Gasoline Expense - 360 1,070 360 (710) (66.4%)
572000 - R&M - Buildings & Facilities 64,841 20,000 32,000 32,000 0 0.0%
Total 262,056 233,601 279,628 274,860 (4,768) (1.7%)
Budget SummaryFY20
ActualsFY21
Projection
FY21AdoptedBudget
FY22AdoptedBudget Chg % Chg
By Object SummaryOperating 262,056 233,601 279,628 274,860 (4,768) (1.7%)
Total 262,056 233,601 279,628 274,860 (4,768) (1.7%)
1165 - Building & Grounds - Activity Center
369

General Fund Departmental BudgetsPublic Works - Activity Analysis
FY22 Budget
Budget SummaryFY20
ActualsFY21
Projection
FY21AdoptedBudget
FY22AdoptedBudget Chg % Chg
By Object536300 - Contract Cleaning 7,805 9,130 9,130 9,130 - 0.0%
536400 - Contract Maintenance Services 6,152 11,000 11,725 11,354 (371) (3.2%)
550000 - Electric 19,043 17,000 31,500 29,000 (2,500) (7.9%)
550100 - Gas (Natural) 3,000 2,400 8,000 8,000 - 0.0%
550200 - Water 2,669 18,000 6,000 6,000 - 0.0%
551000 - Telephone (Landline) 3,842 3,895 3,895 3,905 10 0.3%
572000 - R&M - Buildings & Facilities 7,468 8,000 12,000 12,000 - 0.0%
Total 49,980 69,425 82,250 79,389 (2,861) (3.5%)
Budget SummaryFY20
ActualsFY21
Projection
FY21AdoptedBudget
FY22AdoptedBudget Chg % Chg
By Object SummaryOperating 49,980 69,425 82,250 79,389 (2,861) (3.5%)
Total 49,980 69,425 82,250 79,389 (2,861) (3.5%)
1166 - Building & Grounds - Gaithersburg Arts Barn
370

General Fund Departmental BudgetsPublic Works - Activity Analysis
FY22 Budget
Budget SummaryFY20
ActualsFY21
Projection
FY21AdoptedBudget
FY22AdoptedBudget Chg % Chg
By Object536300 - Contract Cleaning 4,329 9,966 9,966 9,966 - 0.0%
536400 - Contract Maintenance Services 3,887 4,000 4,434 4,838 404 9.1%
550000 - Electric 25,723 30,000 40,000 38,000 (2,000) (5.0%)
550100 - Gas (Natural) 4,154 1,600 2,500 3,000 500 20.0%
550200 - Water 28,056 24,000 35,000 35,000 - 0.0%
550700 - Solid Waste/Recycling 2,587 2,674 2,674 2,674 0 0.0%
551000 - Telephone (Landline) 534 700 560 560 - 0.0%
572000 - R&M - Buildings & Facilities 2,852 47,000 25,000 25,000 0 0.0%
573000 - R&M - Machinery & Equipment - 4,000 4,550 4,550 - 0.0%
Total 72,123 123,940 124,683 123,588 (1,095) (0.9%)
Budget SummaryFY20
ActualsFY21
Projection
FY21AdoptedBudget
FY22AdoptedBudget Chg % Chg
By Object SummaryOperating 72,123 123,940 124,683 123,588 (1,095) (0.9%)
Total 72,123 123,940 124,683 123,588 (1,095) (0.9%)
1167 - Building & Grounds - Water Park
371

General Fund Departmental BudgetsPublic Works - Activity Analysis
FY22 Budget
Budget SummaryFY20
ActualsFY21
Projection
FY21AdoptedBudget
FY22AdoptedBudget Chg % Chg
By Object536400 - Contract Maintenance Services 1,170 1,169 1,169 1,862 693 59.3%
550000 - Electric 7,781 9,000 9,000 9,000 - 0.0%
572000 - R&M - Buildings & Facilities 3,347 5,000 6,000 6,000 - 0.0%
Total 12,297 15,169 16,169 16,862 693 4.3%
Budget SummaryFY20
ActualsFY21
Projection
FY21AdoptedBudget
FY22AdoptedBudget Chg % Chg
By Object SummaryOperating 12,297 15,169 16,169 16,862 693 4.3%
Total 12,297 15,169 16,169 16,862 693 4.3%
1168 - Building & Grounds - Miniature Golf
372

General Fund Departmental BudgetsPublic Works - Activity Analysis
FY22 Budget
Budget SummaryFY20
ActualsFY21
Projection
FY21AdoptedBudget
FY22AdoptedBudget Chg % Chg
By Object536300 - Contract Cleaning 392 1,000 1,651 1,800 149 9.0%
536400 - Contract Maintenance Services 828 828 828 1,521 693 83.7%
572000 - R&M - Buildings & Facilities 449 4,000 6,000 6,000 - 0.0%
Total 1,669 5,828 8,479 9,321 842 9.9%
Budget SummaryFY20
ActualsFY21
Projection
FY21AdoptedBudget
FY22AdoptedBudget Chg % Chg
By Object SummaryOperating 1,669 5,828 8,479 9,321 842 9.9%
Total 1,669 5,828 8,479 9,321 842 9.9%
1169 - Building & Grounds - Skate Park
373

General Fund Departmental BudgetsPublic Works - Activity Analysis
FY22 Budget
Budget SummaryFY20
ActualsFY21
Projection
FY21AdoptedBudget
FY22AdoptedBudget Chg % Chg
By Object536300 - Contract Cleaning 8,677 10,271 10,271 10,271 - 0.0%
536400 - Contract Maintenance Services 2,360 6,706 6,054 3,764 (2,290) (37.8%)
550000 - Electric 10,254 8,000 13,000 12,500 (500) (3.8%)
550200 - Water 1,875 1,800 2,000 2,000 - 0.0%
550700 - Solid Waste/Recycling 1,516 1,900 1,920 1,920 0 0.0%
551000 - Telephone (Landline) 2,145 2,225 2,225 2,230 5 0.2%
572000 - R&M - Buildings & Facilities 25,963 5,300 7,000 7,000 (0) (0.0%)
573000 - R&M - Machinery & Equipment - 2,146 - - - 0.0%
Total 52,790 38,348 42,470 39,685 (2,785) (6.6%)
Budget SummaryFY20
ActualsFY21
Projection
FY21AdoptedBudget
FY22AdoptedBudget Chg % Chg
By Object SummaryOperating 52,790 38,348 42,470 39,685 (2,785) (6.6%)
Total 52,790 38,348 42,470 39,685 (2,785) (6.6%)
1170 - Building & Grounds - Olde Towne Youth Center
374

General Fund Departmental BudgetsPublic Works - Activity Analysis
FY22 Budget
Budget SummaryFY20
ActualsFY21
Projection
FY21AdoptedBudget
FY22AdoptedBudget Chg % Chg
By Object536300 - Contract Cleaning 7,811 9,246 9,246 9,246 - 0.0%
536400 - Contract Maintenance Services 2,783 9,000 7,301 4,351 (2,950) (40.4%)
550000 - Electric 17,197 18,600 20,600 20,600 - 0.0%
550200 - Water 1,388 3,000 7,500 7,000 (500) (6.7%)
550700 - Solid Waste/Recycling 1,641 2,078 2,078 2,078 (0) (0.0%)
551000 - Telephone (Landline) 2,145 2,225 2,225 2,230 5 0.2%
572000 - R&M - Buildings & Facilities 20,709 4,000 7,000 7,000 0 0.0%
Total 53,674 48,149 55,951 52,505 (3,446) (6.2%)
Budget SummaryFY20
ActualsFY21
Projection
FY21AdoptedBudget
FY22AdoptedBudget Chg % Chg
By Object SummaryOperating 53,674 48,149 55,951 52,505 (3,446) (6.2%)
Total 53,674 48,149 55,951 52,505 (3,446) (6.2%)
1172 - Building & Grounds - Robertson Park Youth Center
375

General Fund Departmental BudgetsPublic Works - Activity Analysis
FY22 Budget
Budget SummaryFY20
ActualsFY21
Projection
FY21AdoptedBudget
FY22AdoptedBudget Chg % Chg
By Object536300 - Contract Cleaning 61 - - - - 0.0%
536400 - Contract Maintenance Services 7,733 8,400 11,640 - (11,640) (100.0%)
550000 - Electric 244 - - 1,500 1,500 100.0%
550100 - Gas (Natural) 82 - - - - 0.0%
550200 - Water 3,732 3,658 4,000 2,500 (1,500) (37.5%)
572000 - R&M - Buildings & Facilities 527 - - - - 0.0%
Total 12,378 12,058 15,640 4,000 (11,640) (74.4%)
Budget SummaryFY20
ActualsFY21
Projection
FY21AdoptedBudget
FY22AdoptedBudget Chg % Chg
By Object SummaryOperating 12,378 12,058 15,640 4,000 (11,640) (74.4%)
Total 12,378 12,058 15,640 4,000 (11,640) (74.4%)
Significant Changes
FY21AdoptedBudget
FY22AdoptedBudget
Increase /(Decrease)
Object - Object Name / Reason for Change
536400 - Contract Maintenance Services 11,640 - (11,640)
Decrease due to construction of the new park, mowing service and maintenance of the 2-fire hydrants will not beneeded as they will be removed.
1173 - Building & Grounds - Gaithersburg CPSC Park Site
376

General Fund Departmental BudgetsPublic Works - Activity Analysis
FY22 Budget
Budget SummaryFY20
ActualsFY21
Projection
FY21AdoptedBudget
FY22AdoptedBudget Chg % Chg
By Object536300 - Contract Cleaning 26,161 31,444 31,444 32,000 556 1.8%
536400 - Contract Maintenance Services 12,029 15,792 15,110 17,942 2,832 18.7%
550000 - Electric 23,666 20,276 28,000 25,500 (2,500) (8.9%)
550200 - Water 145 340 400 400 - 0.0%
551000 - Telephone (Landline) 3,751 4,761 3,895 3,905 10 0.3%
572000 - R&M - Buildings & Facilities 5,131 10,000 33,500 449,200 415,700 1,240.9%
Total 70,883 82,613 112,349 528,947 416,598 370.8%
Budget SummaryFY20
ActualsFY21
Projection
FY21AdoptedBudget
FY22AdoptedBudget Chg % Chg
By Object SummaryOperating 70,883 82,613 112,349 528,947 416,598 370.8%
Total 70,883 82,613 112,349 528,947 416,598 370.8%
Significant Changes
FY21AdoptedBudget
FY22AdoptedBudget
Increase /(Decrease)
Object - Object Name / Reason for Change
572000 - R&M - Buildings & Facilities 33,500 449,200 415,700
Additional funding is for parking lot stripping and sealing that is needed every five years. The work was lastdone in the 2016/2017 year. The plan is to do this work in the spring of 2022.
1175 - Building & Grounds - Parking Facility
377

General Fund Departmental BudgetsPublic Works - Activity Analysis
FY22 Budget
Budget SummaryFY20
ActualsFY21
Projection
FY21AdoptedBudget
FY22AdoptedBudget Chg % Chg
By Object536300 - Contract Cleaning 1,186 1,226 1,226 1,300 74 6.0%
536400 - Contract Maintenance Services 3,726 10,554 11,135 10,772 (363) (3.3%)
550000 - Electric 15,009 13,000 15,000 15,000 - 0.0%
550100 - Gas (Natural) 1,835 1,500 2,000 2,000 - 0.0%
550200 - Water 5,920 5,000 9,000 7,000 (2,000) (22.2%)
550700 - Solid Waste/Recycling 518 888 888 888 - 0.0%
572000 - R&M - Buildings & Facilities 7,477 4,500 6,000 6,000 (0) (0.0%)
595100 - Furniture & Equipment(Replacement) - 711 - - - 0.0%
Total 35,670 37,379 45,249 42,960 (2,289) (5.1%)
Budget SummaryFY20
ActualsFY21
Projection
FY21AdoptedBudget
FY22AdoptedBudget Chg % Chg
By Object SummaryOperating 35,670 36,668 45,249 42,960 (2,289) (5.1%)
Capital - 711 - - - 0.0%
Total 35,670 37,379 45,249 42,960 (2,289) (5.1%)
1176 - Building & Grounds - Homeless Services
378

Personnel and SalariesPersonnel Schedule
FY22 Budget
Position Title GradeFY22 Total
No. Positions
Administrative Assistant I 101 2Administrative Technician I 101 1Custodian/Maintenance Worker 101 2Parking Enforcement Official 101 1Administrative Assistant II 102 2Speed Camera Technician 102 1Bus Driver/Site Leader 103 1House Manager 103 1Administrative Assistant III 104 4Administrative Technician II 104 3Recreation Support Assistant 104 2Accounting Specialist 105 2Animal Control Officer I 105 1Digital Content Specialist 105 1Helpdesk Technician I 105 3Human Resources Technician 105 1Neighborhood Services Coordinator 105 1Program Coordinator 105 2Senior Accounting Technician 105 1Sponsorship Program Administrator 105 1Administrative Support Specialist 106 1Administrative Technician III 106 1Animal Control Officer II 106 1Code Administration Officer I 106 5Community Services Case Worker 106 1Facility Coordinator 106 7Grants Administrator 106 1Planner I 106 3Public Works Program Coordinator 106 2Animal Control Officer III 107 1Police Administrative Services Supervisor 107 1Procurement Specialist 107 1Speed Camera Technician Supervisor 107 1Aquatics Facility Coordinator 108 2Assistant Web Administrator 108 1Code Administration Officer II 108 3Community Services Program Coordinator 108 1Crime Analyst 108 1Graphics Specialist 108 1
379

Personnel and SalariesPersonnel Schedule
FY22 Budget
Position Title GradeFY22 Total
No. Positions
Human Resources Generalist II 108 2IT Project Manager I 108 1Network Operations Specialist I 108 2Paralegal 108 1Payroll Coordinator 108 1Primary Counselor 108 1Program Supervisor 108 10Television Production Specialist 108 1Watershed Restoration Specialist 108 1Accountant II 109 1Community Facility Manager 109 6Community Services Senior Program Coordinator 109 1Planner II 109 4Police Accreditation/Property & Evidence Manager 109 1Police Systems Support Manager 109 1Recreation Systems Support Manager 109 1Senior Program Supervisor 109 4Sustainability Coordinator 109 1Chief Electrical Reviewer 110 1Code Inspector 110 5Facilities Maintenance Supervisor 110 1Fire Inspector 110 1GIS Specialist II 110 1Legal Services Coordinator 110 1Legislative Affairs Manager 110 1Manager of Animal Services 110 1Right-of-Way Inspector 110 1Stormwater Inspector 110 1Supervisor 110 4Aquatics Superintendent 111 1Clinical Supervisor/Discharge Coordinator 111 1Communication Specialist 111 1Helpdesk Manager 111 1Manager of Fleet Operations 111 1Municipal Clerk 111 1Arts Administrator 112 1Assistant to the City Manager 112 1Code Compliance Manager 112 1Community Services Project Manager 112 1IT Project Manager III 112 2
380
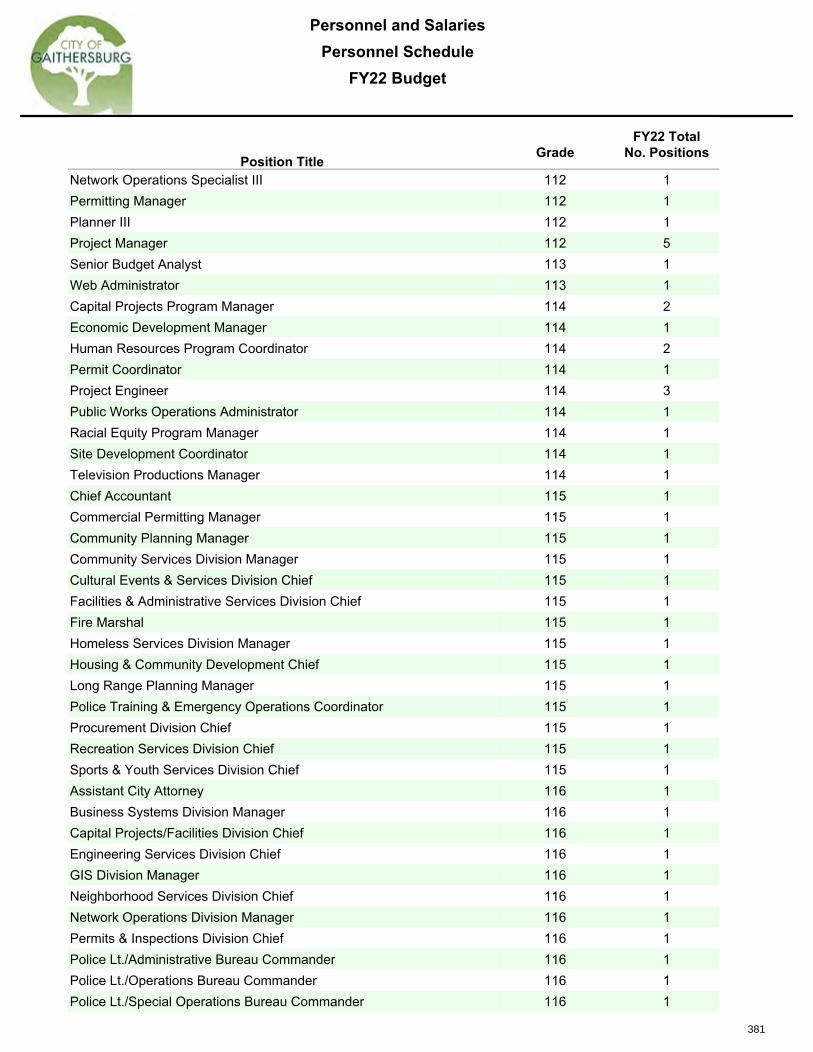
Personnel and SalariesPersonnel Schedule
FY22 Budget
Position Title GradeFY22 Total
No. Positions
Network Operations Specialist III 112 1Permitting Manager 112 1Planner III 112 1Project Manager 112 5Senior Budget Analyst 113 1Web Administrator 113 1Capital Projects Program Manager 114 2Economic Development Manager 114 1Human Resources Program Coordinator 114 2Permit Coordinator 114 1Project Engineer 114 3Public Works Operations Administrator 114 1Racial Equity Program Manager 114 1Site Development Coordinator 114 1Television Productions Manager 114 1Chief Accountant 115 1Commercial Permitting Manager 115 1Community Planning Manager 115 1Community Services Division Manager 115 1Cultural Events & Services Division Chief 115 1Facilities & Administrative Services Division Chief 115 1Fire Marshal 115 1Homeless Services Division Manager 115 1Housing & Community Development Chief 115 1Long Range Planning Manager 115 1Police Training & Emergency Operations Coordinator 115 1Procurement Division Chief 115 1Recreation Services Division Chief 115 1Sports & Youth Services Division Chief 115 1Assistant City Attorney 116 1Business Systems Division Manager 116 1Capital Projects/Facilities Division Chief 116 1Engineering Services Division Chief 116 1GIS Division Manager 116 1Neighborhood Services Division Chief 116 1Network Operations Division Manager 116 1Permits & Inspections Division Chief 116 1Police Lt./Administrative Bureau Commander 116 1Police Lt./Operations Bureau Commander 116 1Police Lt./Special Operations Bureau Commander 116 1
381

Personnel and SalariesPersonnel Schedule
FY22 Budget
Position Title GradeFY22 Total
No. Positions
Public Works Operations Division Chief 116 1Stormwater Program Manager 116 1Comptroller 118 1Deputy City Attorney 118 1Assistant City Manager 119 1Chief of Police 119 1Director of Community & Public Relations 119 1Director of Finance & Administration 119 1Director of Human Resources 119 1Director of Information Technology 119 1Director of Parks, Recreation & Culture 119 1Director of Planning & Code Administration 119 1Director of Public Works & Engineering 119 1Deputy City Manager 120 1Police Officer I 220 12Police Officer II 221 8Police Officer III 222 18Police Corporal 223 9
Police Sergeant 224 9Facilities & Equipment Worker I 301 2Maintenance Worker I 301 15Maintenance Worker II 301 13Maintenance Worker III 301 5Facilities & Equipment Technician I 302 1Facilities & Equipment Technician II 302 2Facilities & Equipment Technician III 302 1Mechanic III 302 2Work Force Leader I 302 11Work Force Leader II 302 2Work Force Leader III 302 6Facilities & Equipment Specialist III 303 1Foreman I 303 3Foreman II 303 1Senior Mechanic II 303 2City Attorney 999 1City Manager 999 1Total Full-Time Employees 325
999 The salaries of the City Manager and City Attorney are determined by the Mayor and City Council.Grades are not assigned to these positions in the Personnel Schedule.
382

Personnel and SalariesSchedule of Salary Ranges
FY22 Budget
Pay Range Minimum Mid Point Maximum
101 35,525 46,183 56,840
102 38,367 50,069 61,771
103 41,436 54,074 66,713
104 44,751 58,401 72,050
105 48,331 63,314 78,297
106 52,197 68,379 84,560
107 55,851 73,165 90,479
108 59,761 78,586 97,411109 63,945 84,088 104,230110 67,782 89,133 110,484
111 71,848 94,480 117,112
112 76,160 100,150 124,140
113 79,967 105,556 131,146114 83,966 110,835 137,704
115 88,164 116,817 145,470
116 92,572 122,658 152,744
117 96,275 128,527 160,779
118 127,890 153,468 179,046
136,842 191,579
120 146,421 204,989
301 35,525 51,119 66,713
302 44,751 64,655 84,560
303 55,851 80,041 104,230
119
Pay Range Minimum Maximum
Pay Range Minimum Mid Point Maximum
General Salary Schedule
Executive Salary Schedule
Public Works Salary Schedule
383

Personnel and SalariesPolice Salary Ranges
FY22 Budget
220 221 222 223 224
FY22 Step PO I PO II PO III Corporal Sergeant
0 59,757 62,746 65,884 69,177 76,095
1 61,405 64,474 67,697 71,082 78,190
2 63,247 66,408 69,728 73,216 80,537
3 65,143 68,401 71,821 75,410 82,953
4 67,097 70,453 73,974 77,675 85,441
5 69,110 72,567 76,193 80,004 88,004
6 71,183 74,744 78,481 82,403 90,644
7 73,320 76,985 80,835 84,876 93,363
8 75,521 79,296 83,259 87,423 96,164
9 77,786 81,672 85,757 90,047 99,051
10 80,119 84,123 88,329 92,746 102,021
11 82,522 86,650 90,980 95,530 105,082
12 84,999 89,246 93,709 98,395 108,234
13 87,548 91,923 96,519 101,345 111,482
14 90,173 94,682 99,414 104,387 114,826
15 92,881 97,524 102,399 107,516 118,270
After one year in Step 15, employee receives COLA adjustment only based on budgetary guidelines.
384

Capital Improvement Plan
Overview
FY22 Budget
Overview The Capital Improvements Plan (CIP) is a projection of the City's capital investments plan over a five-year period. The CIP is both a fiscal and planning device that allows the City to monitor all capital project costs, funding sources, departmental responsibilities and timing schedules. Although no formal system for ranking projects is used, each year the CIP is reviewed within the context of ongoing City, County, State and Federal programs and policies as well as the City's Master Plan and Strategic Directions. The City of Gaithersburg has no debt; therefore, all CIP projects are funded through current year revenues or existing fund balance. Some projects may receive funding in the form of grants, State bond bills, or payments from developers. Estimates for these amounts are included within the relevant project; however, since many of these revenue sources are reimbursement based all funding is transferred from the General Fund. Any revenues received related to a given project replenish the General Fund. The recommended CIP includes five years of projected capital needs. Funding for the current year is provided through a transfer from the General Fund; the Mayor and City Council authorize the transfer through the budget appropriation ordinance. Once appropriated to the CIP, the funds remain within the CIP until spent, unless they are re-appropriated to another use. Over the past several years the City has conducted facility assessments on its building infrastructure in order to develop a long-term strategy for replacement of essential components. These assessments will also allow us to conduct cost benefit analyses as we move forward in the evaluation of renovation/expansion/relocation options. We will also need to look at our existing building structure in the context of lessons learned from the current pandemic especially with regard to workspace requirements and HVAC systems. As a result of this approach, we have limited the number of new projects related to our building infrastructure in the FY22 Budget. Staff will take FY22 to take a deep dive into the analyses and provide the results during the FY23 Budget process. Staff will also be working to formalize the CIP prioritization process beginning in FY22. Capital Defined For purposes of the CIP, capital expenditures are those with an estimated useful life longer than two years, and a total project cost more than $30,000 ($15,000 for technology and no minimum for public art). Items included in the CIP are usually defined within one of the following categories:
1. Acquisition of land, buildings, building improvements or other tangible property for a public purpose.
2. Construction of a significant facility, i.e., buildings, parks, or roads, or the addition to or extension of an existing facility.
3. Nonrecurring rehabilitation, major repair, or energy efficiency endeavors to all or part of a facility that is not considered to be recurring maintenance.
4. Any specific planning, engineering study, or design work related to an individual project falling within the above three categories.
5. Up-front licensing costs, and service costs related to configuration, training, testing and implementation of technology hardware and software.
Each significant capital expenditure is described and included within the CIP as a project. Each project is further assigned to a Capital Fund. A full listing and description of each CIP project can be found within Appendix A of this budget. Capital Funds The CIP is divided into several Capital Funds in order to transparently identify capital spending and saving by purpose. For financial statement purposes, all of these Capital Funds are aggregated together. The Capital Funds used within the CIP are:
385

Capital Improvement Plan
Overview
FY22 Budget
General Capital Projects – This fund is used to account for saving and spending on new assets, non-City owned assets, contingency projects, and other capital projects that do not fit within another fund. Infrastructure – This fund is used to account for saving and spending on infrastructure assets, excluding stormwater assets, such as roads, sidewalks, street lighting, bridges, and other special structures. Facilities – This fund is used to account for saving and spending on existing City buildings and facilities, excluding Parks, Recreation and Culture facilities. Examples of City facilities include: City Hall, Public Works building, salt sheds, Police Station, parking garage in Olde Towne, Wells Robertson House, and DeSellum House. The City has many buildings, all of which periodically need renovations which would be accounted for in this fund. Annual maintenance for facilities is included within the General Fund. Parks – This fund is used to account for saving and spending on existing Parks, Recreation and Culture lands and facilities. Examples of these include: Activity Center, Water Park, Kentland’s Mansion, Casey Community Center, Arts Barn, Kelley Park, Griffin Park, Train Station and Museum and several youth centers. Technology – This fund is used to account for saving and spending on new hardware and software projects or initiatives. Examples of these include: new facility cameras, police body worn cameras, facility management software, and budget software. Although the CIP represents a five year plan, technology needs change so rapidly that often only the next few years are programmed out for the Technology Fund. Replacement of existing assets is accounted for with the Asset Replacement Fund. Art in Public Places – This fund is used to account for funding, saving and spending for public art projects. Significant new construction requires the development of public art. The process of identifying the placement and type of art, securing an artist and creation of the piece often crosses fiscal years. The use of this fund helps tracking for these projects.
Relationship Between the Operating Budget (General Fund) and CIP: Some of the City’s capital projects will result in changes to future operating costs. The City does not currently develop quantitative estimates for project impact on the future years’ operating budgets. When new project requests are made, project managers are requested to identify whether additional staff or other significant future operating costs are anticipated. However, detailed future operating cost estimates are not required. Generally speaking, the following circumstances are expected:
- Studies and assessments may impact the future capital spending as the goal of these projects is to identify other potential improvements. Any future impact on operating costs for these types of projects is unknown prior to the completion of the study.
- Significant renovations are appropriate to classify as capital projects as they might extend the useful life of an asset, or provide additional service capacity. Sometimes these renovations result in energy savings, but that savings is difficult to identify and capture by the City’s current processes. More often these replacements are needed simply to maintain the City’s assets at an operational level.
- Replacement of infrastructure is generally considered to be cost neutral in future years; the replacement schedule should be such that the City is able to get the longest effective life from the asset.
- The year after any significant equipment purchase, the City begins to set funding aside for the eventual replacement of the equipment. Equipment replacement funding is included in the Asset Replacement Fund, and funding for these assets is provided by a transfer from the General Fund. The annual replacement amount is typically set equal to the straight line depreciation of the asset (costs divided by the expected asset life).
- New facilities are expected to have the largest impact on the operating budget as these typically result in increased staffing requirements, energy needs, and maintenance costs.
- New parks are expected to be accompanied by increased maintenance and landscaping costs, and potentially new programming costs.
386

Capital Improvement Plan
Overview
FY22 Budget
The CIP reports are intended to start with the broadest look at the CIP and then move to more detail as follows: Summary Reports
‐ Revenues, Expenditures and Projected Fund Balances – By Fund: this report shows the total CIP broken down by individual Capital Fund, allowing the reader to see the funds being set aside (revenues) and expected to be spent (expenditures) by purpose (General, Infrastructure, Facilities, Parks, Technology and Art in Public Places).
‐ Revenues, Expenditures and Projected Fund Balances – By Object: this report shows the total CIP broken down by type of revenue (grants or transfers in) and expenditure (engineering, design, construction, etc.).
Fund Specific Reports
‐ Revenues, Expenditures and Projected Fund Balances – By Object By Fund: this report shows the total CIP broken down by type of revenue (grants or transfers in) and expenditure (engineering, design, construction, etc.), for each Capital Fund individually.
o Following the Fund Summary is a report showing all projects categorized within this fund along with the project expenditures for the 5 year CIP period.
Appendix Reports
‐ CIP Report Summary Report: this report shows the beginning balances, revenues and expenditures by year for each project, subtotaled by fund.
‐ CIP Project Detail: this section includes individual project details such as the project description, location, manager, and costs by year. New project detail pages can be found at the end of this report.
A summary of the new projects added to the CIP in this budget cycle are described beginning on the following page.
387

Capital Improvement Plan
Project Closure List
FY22 Budget
Each year, Gaithersburg staff review the CIP project list and recommend completed projects for closure. The following projects will be closed as of June 30, 2021 and are not included in the FY 2022 CIP. Any remaining project funding will be transferred to the primary reserve project in the respective CIP fund.
Fund / Project Title Fiscal Year
Opened1
Original Budget2
Final Budget3
302 – General Capital 0000001 – Frederick Ave Demolition 2018 $64,555 $390,143 0000010 – Discovery Park – MedImmune 2018 1,442,534 1,640,700 303 – Infrastructure 0000017 – East Darby Ct Sidewalk Rehab4 2018 50,000 13,812 0000027 – Olde Towne Streetscape5 2018 850,000 - 0000033 – East Deer Park Drive Street Rehab 2018 495,000 248,204 0000115 – Kentlands Blvd Crosswalk Modifications 2019 95,000 70,000 0000138 – Inspiration Lake Dock Replacement6 2020 75,000 8,961 0000148 – Russell Avenue and Odendhal Avenue
Signal Recon 2020 421,000 441,615
0000152 – Curb Installation on Main Street 2021 100,000 90,720 304 – Facilities 0000047 – City Hall Exterior Marquee Sign 2018 118,000 102,369 0000051 – Public Works Vehicle Wash System7 2018 493,500 32,910 0000116 – Activity Center Facility Assessment 2019 42,500 24,093 305 – Parks 0000060 – Water Park Slide Replacement 2018 1,200,000 1,083,141 0000070 – Kelley Park Tennis Courts Rehabilitation8 2018 60,000 - 0000071 – Robertson Park Field Lighting
Improvements9 2018 625,000 -
0000122 – Diamond Farms Park Court #3 New Lighting 2019 55,500 69,000 0000123 – Gym Partition Replacement Activity Center 2019 185,000 180,857
1 The City of Gaithersburg transitioned between project tracking methods in 2018, therefore any projects started prior to the transition will show as being opened in FY18 and were first presented in the FY19 Adopted Budget Book. 2 Original budgets utilizing funds budgeted prior to the transition to the current project ledger are not included in this figure. 3 Funds spent prior to the transition to the current project ledger are not included in this figure; total project cost includes estimated FY21 amounts. 4 Project was closed with all additional costs being moved to project SW0003* - East Darby Court Drainage Repairs. 5 Project has been canceled but may be reconsidered in the future. 6 Project scope originally intended to include replacement of the dock that was removed; due to higher than anticipated cost estimates, the original dock was demolished but will not be replaced. 7 Project was canceled with the intention that it be included in a future large-scale renovation of the public works campus. 8 Project was canceled due to the transfer of this portion of the park to the Montgomery County Public Schools system for the construction of a new elementary school. 9 Project was canceled pending potential impacts of other projects under consideration for Robertson Park.
388

Capital Improvement Plan
Project Closure List
FY22 Budget
Fund / Project Title Fiscal Year
Opened10
Original Budget11
Final Budget12
0000126 – Washingtonian Woods Park Path Replacement
2019 260,000 222,188
0000161 – Kentlands Mansion Bathroom Renovation 2021 40,000 37,987 306 – Technology 0000089 – Public Works Energy Management System 2018 50,000 13,579 0000093 – City Field Asset and Work Order System 2018 200,000 170,000 0000098 – Shared Server Storage 2018 20,000 30,877 307 – Art in Public Places 0000110 – Observatory Park Armillary Sundial Art
Project 2018 12,300 1,000
10 The City of Gaithersburg transitioned between project tracking methods in 2018, therefore any projects started prior to the transition will show as being opened in FY18 and were first presented in the FY19 Adopted Budget Book. 11 Original budgets utilizing funds budgeted prior to the transition to the current project ledger are not included in this figure. 12 Funds spent prior to the transition to the current project ledger are not included in this figure; total project cost includes estimated FY21 amounts.
389

Capital Improvement PlanNew Projects Summary
FY22 Budget
Project Name / Location / DescriptionEstimated
Cost
3303 - Infrastructure CIP
0000168 - Casey Community Center Pedestrian Bridge $156,420This project involves the replacement of a pedestrian bridge behind the Casey Community Center. This bridge iscurrently closed because of its condition. This bridge connects the adjacent residential neighborhood to the center.Project design was completed in FY21 and construction is planned for FY22.
3304 - Facilities CIP
0000169 - City Hall HVAC AHU2 Replacement $190,000This project involves the replacement of one of the three main HVAC units at City Hall that has reached end of lifeand is incurring repeated service calls and component failure. This project will be completed in FY23.
390

Capital Improvement PlanNew Projects Summary
FY22 Budget
Project Name / Location / DescriptionEstimated
Cost
3305 - Parks CIP
0000174 - Miniature Golf Pond Repair $347,000This project involves the removal of the existing PVC pond liner and the installation of a gunite (concrete) pond linerand drain. This is a design build project and will be completed by the end of FY22.
0000173 - Manor House - Roof Replacement $94,500This project involves a roof replacement with asphalt shingles.. The replacement of the ridge beam over the existingkitchen addition will also to take place as part of the roof replacement. To address other building envelope issuespaint removal and painting of North, South and West walls, doors, windows and window trim will also be conductedas part of the project. Design for ridge beam replacement to take place in FY23 followed by construction andpainting in FY24.
0000170 - Asphalt Path Repair and Overlay $800,000This project will involve the repair and overlay of asphalt paths in City parks throughout the City. The City iscurrently assessing all paths in our inventory and will create a strategic plan based on that information. The surveywork will be completed in FY22 and construction will begin in FY23.
0000172 - Blohm Park Trail Improvements $800,000This project involves the installation and enhancement of existing trails within with in Blohm Park. The Citycompleted a stream restoration in the park in FY21 and this project is a follow up to those improvements. Theproject involves naturalistic trails, includes boardwalk sections which allow for educational opportunities regardingthe stream restoration project and will include educational signage elements. This project involves Public OpenSpace which will be less than twenty-five percent.
0000171 - Benjamin Gaither Bathroom Renovations $88,030This project involves the renovation of the men's and women's bathroom facilities at the Benjamin Gaither Center.The project will install new bathroom tile, paint and make modification to the partitions and sink areas.
391

Capital Improvement PlanNew Projects Summary
FY22 Budget
Project Name / Location / DescriptionEstimated
Cost
3306 - Technology CIP
0000176 - GIS Software Migration $40,000This project involves the migration of Casual User Toolbar in the current GIS system to new a GIS application. Thisproject will be completed in FY22.
0000178 - Microsoft 365 Migration $50,000This project involves the migration of City staff and computers from the traditional Office platform to thesubscription-based Microsoft 365 platform. This project will be completed in FY22.
0000175 - Cloud Data Governance $60,000This project the selection and implementation of a product to provide governance capabilities over the increasedamount of City data which will be stored in the cloud as a result of moving to the Microsoft 365 platform. Thisproject will begin in FY22 with completion in early FY23.
0000179 - Museum/Plaza Tech Enhancements $30,000This project involves IT enhancements with the relocation of the Rolling Stock at the Museum Complex. In addition,there will be improved service to public wi-fi at the Museum Complex. This project will be completed in FY23.
0000177 - Meeting Management System Replacement $60,000This project involves the select and implementation of a replacement agenda/meeting management softwaresystem. The project will also involve the migrate years of historical data (agendas, minutes, meeting video) to thenew platform. This project will be completed in FY22.
3307 - Arts in Public Places
0000180 - Community Mural Project $58,000This is multi-year project targets key underpasses areas in the City—especially Olde Towne—for artist-led,community-made murals. The project will bring youth, professional and volunteer artists, and the Gaithersburgcommunity together to creatively reimagine and enliven public spaces. The Father Cuddy underpass is the firstproject to be started and should be completed in FY22. Additional mural projects are anticipated in FY23 andFY24.
Total Estimated Costs New Projects 2,773,950
392

Capital Improvement PlanRevenues, Expenditures and Projected Fund Balances -
By FundFY22 Budget
Fund - NameFY21
Projection FY22 FY23 FY24 FY25 FY26 Total
Revenues and Sources of Funds
302 - General Capital Projects 3,506,017 4,127,577 1,834,960 1,299,960 666,653 400,000 11,835,167
303 - Infrastructure 5,711,822 7,229,000 7,525,000 6,270,000 6,654,000 4,488,000 37,877,822
304 - Facilities 1,432,721 1,635,000 1,375,000 1,180,000 2,950,000 1,075,000 9,647,721
305 - Parks 1,435,674 1,623,500 939,500 500,000 850,000 350,000 5,698,674
306 - Technology 553,543 410,000 335,000 410,000 300,000 300,000 2,308,543
307 - Art in Public Places 139,300 135,000 10,000 - - - 284,300
Total 12,779,077 15,160,077 12,019,460 9,659,960 11,420,653 6,613,000 67,652,227
Expenditures and Uses of Funds
302 - General Capital Projects 15,191,528 12,407,538 4,260,235 1,459,960 816,653 550,000 34,685,914
303 - Infrastructure 6,114,920 12,980,535 9,868,325 6,120,000 5,769,491 5,623,000 46,476,271
304 - Facilities 660,512 2,003,550 2,690,020 105,000 6,115,000 - 11,574,082
305 - Parks 2,729,275 2,524,140 1,891,110 362,000 775,000 200,000 8,481,525
306 - Technology 797,423 747,000 470,000 350,000 25,000 - 2,389,423
307 - Art in Public Places 44,300 375,000 190,000 141,000 - - 750,300
Total 25,537,958 31,037,763 19,369,690 8,537,960 13,501,144 6,373,000 104,357,515
Net Change in Fund Balance (12,758,881) (15,877,686) (7,350,230) 1,122,000 (2,080,491) 240,000 (36,705,288)
Projected Fund Balance
302 - General Capital Projects 16,282,216 8,002,255 5,576,980 5,416,980 5,266,980 5,116,980 5,116,980
303 - Infrastructure 15,536,964 9,785,429 7,442,104 7,592,104 8,476,613 7,341,613 7,341,613
304 - Facilities 6,614,448 6,245,898 4,930,878 6,005,878 2,840,878 3,915,878 3,915,878
305 - Parks 2,960,696 2,060,056 1,108,446 1,246,446 1,321,446 1,471,446 1,471,446
306 - Technology 1,670,027 1,333,027 1,198,027 1,258,027 1,533,027 1,833,027 1,833,027
307 - Art in Public Places 718,961 478,961 298,961 157,961 157,961 157,961 157,961
Total 43,783,312 27,905,626 20,555,396 21,677,396 19,596,905 19,836,905 19,836,905
393

Capital Improvement PlanRevenues, Expenditures and Projected Fund Balance -
By ObjectFY22 Budget
Object GroupFY21
Projection FY22 FY23 FY24 FY25 FY26 Total
Revenues and Sources of Funds
434000 - State Grant - Open Space 350,000 1,072,000 1,247,000 - - - 2,669,000
434100 - State Grant - Miscellaneous - - - - - - -
434940 - State Grant - Bond Bill(s) - 700,000 - - - - 700,000
437150 - County Grant - Miscellaneous 225,000 2,250,000 1,450,000 2,750,000 2,900,000 - 9,575,000
467200 - Miscellaneous 1,400,000 400,000 2,600,000 400,000 - - 4,800,000
499000 - Transfer In - From GeneralFund 5,190,000 548,907 5,372,960 6,509,960 8,520,653 6,253,000 32,395,480
499100 - Transfer In - From CIP 5,614,077 6,642,000 1,349,500 - - 360,000 13,965,577
499200 - Transfer In - 3,547,170 - - - - 3,547,170
Total 12,779,077 15,160,077 12,019,460 9,659,960 11,420,653 6,613,000 67,652,227
Expenditures and Uses of Funds
532000 - Engineering & Architecture 1,116,835 1,823,598 816,775 1,205,000 160,000 120,000 5,242,208
532100 - Concept Design and Outreach - 45,000 10,000 - - - 55,000
532500 - Post-Construction Monitoring - - - - - - -
536000 - Miscellaneous ProfessionalServices 226,215 88,402 203,325 8,000 200,491 - 726,433
560000 - Miscellaneous - - - - - - -
532300 - Construction Oversight - - - - - - -
590000 - Land - - - - - -
591100 - Construction 18,227,881 19,102,812 15,859,090 6,649,960 11,875,653 5,497,000 77,212,396
592000 - Software - - - - - -
595000 - Furniture & Equipment 330,450 1,428,451 606,000 360,000 25,000 96,000 2,845,901
595060 - Machinery & Equipment - 1,595,000 190,000 - 940,000 - 2,725,000
597500 - Construction Management 22,500 12,500 35,000 15,000 - - 85,000
589000 - Transfer to Other Funds 5,614,077 6,942,000 1,649,500 300,000 300,000 660,000 15,465,577
Total 25,537,958 31,037,763 19,369,690 8,537,960 13,501,144 6,373,000 104,357,515
Net Change in Fund Balance (12,758,881) (15,877,686) (7,350,230) 1,122,000 (2,080,491) 240,000 (36,705,288)
Projected Fund Balance 43,783,312 27,905,626 20,555,396 21,677,396 19,596,905 19,836,905 19,836,905
-
-
394

Capital Improvement PlanRevenues, Expenditures and Projected Fund Balance -
By FundFY22 Budget
302 - General Capital ProjectsFY21
Projection FY22 FY23 FY24 FY25 FY26 Total
Revenues and Sources of Funds
434000 - State Grant - Open Space 1,072,000 1,072,000 - - - 2,144,000
434940 - State Grant - Bond Bill(s) - 450,000 - - - - 450,000
499000 - Transfer In - From GeneralFund 1,794,080 (956,593) 752,960 1,299,960 666,653 400,000 3,957,060
499100 - Transfer In - From CIP 1,711,937 15,000 10,000 - - - 1,736,937
499200 - Transfer In - 3,547,170 - - - - 3,547,170
Total 3,506,017 4,127,577 1,834,960 1,299,960 666,653 400,000 11,835,167
Expenditures and Uses of Funds
532000 - Engineering & Architecture 451,744 149,513 55,275 50,000 50,000 50,000 806,532
536000 - Miscellaneous ProfessionalServices 18,500 48,402 - - - - 66,902
591100 - Construction 12,868,254 6,440,672 3,819,960 1,084,960 466,653 200,000 24,880,499
595000 - Furniture & Equipment 13,000 681,451 40,000 10,000 - - 744,451
595060 - Machinery & Equipment - 1,405,000 - - - - 1,405,000
597500 - Construction Management 22,500 12,500 35,000 15,000 - - 85,000
589000 - Transfer to Other Funds 1,817,530 3,670,000 310,000 300,000 300,000 300,000 6,697,530
Total 15,191,528 12,407,538 4,260,235 1,459,960 816,653 550,000 34,685,914
Net Change in Fund Balance (11,685,511) (8,279,961) (2,425,275) (160,000) (150,000) (150,000) (22,850,747)
Projected Fund Balance 16,282,216 8,002,255 5,576,980 5,416,980 5,266,980 5,116,980 5,116,980
-
395

Capital Improvement PlanRevenues, Expenditures and Projected Fund Balance -
By FundFY22 Budget
302 - General Capital Projects
ProjectFY21
Projection FY22 FY23 FY24 FY25 FY26 Total
Expenditures by Project
0000001 - Frederick Ave - Demolition 17,857 - - - - - 17,857
0000002 - Future Property Acquisition andDisposition - - - - - -
0000004 - Olde Towne Plaza 294,560 233,440 - - - - 528,000
0000005 - Contingency 284,678 3,670,000 310,000 300,000 300,000 300,000 5,164,678
0000006 - Future Edison Park Dr Project 1,000,000 - - - - - 1,000,000
0000007 - Gaithersburg Police Station 10,762,547 2,723,557 4,163 - - - 13,490,267
0000008 - Crown Farm Historic Park 733,400 248,360 240,000 - - - 1,221,760
0000009 - Future Energy Efficiency andConservation Projects - 250,000 250,000 250,000 250,000 1,000,000
0000010 - Discovery Park - MedImmune 134,066 - - - - - 134,066
0000011 - Pleasant View Park - CPSC 125,000 3,767,400 2,200,000 - - - 6,092,400
0000114 - Mayor and City CouncilChambers 1,194,830 996,169 1,112 - - - 2,192,111
0000132 - Rolling Stock Relocation - 70,000 15,000 - - - 85,000
0000135 - Olde Towne - Fiber Duct BankInstallation Project 268,895 88,205 - - - - 357,100
0000149 - Buildout of 16 South SummitAvenue - 45,000 440,000 110,000 - - 595,000
0000150 - Installation of Banner Poles 80,000 - - - - - 80,000
0000151 - LED Streetlight Conversion 295,695 565,407 799,960 799,960 266,653 - 2,727,675
Total 15,191,528 12,407,538 4,260,235 1,459,960 816,653 550,000 34,685,914
-
-
396

Capital Improvement PlanRevenues, Expenditures and Projected Fund Balance -
By FundFY22 Budget
303 - InfrastructureFY21
Projection FY22 FY23 FY24 FY25 FY26 Total
Revenues and Sources of Funds
434940 - State Grant - Bond Bill(s) - 250,000 - - - - 250,000
437150 - County Grant - Miscellaneous 225,000 2,250,000 1,450,000 2,750,000 2,900,000 - 9,575,000
467200 - Miscellaneous 1,400,000 400,000 1,800,000 400,000 - - 4,000,000
499000 - Transfer In - From GeneralFund 2,238,920 (388,000) 3,350,000 3,120,000 3,754,000 4,128,000 16,202,920
499100 - Transfer In - From CIP 1,847,902 4,717,000 925,000 - - 360,000 7,849,902
Total 5,711,822 7,229,000 7,525,000 6,270,000 6,654,000 4,488,000 37,877,822
Expenditures and Uses of Funds
532000 - Engineering & Architecture 567,958 1,340,535 545,000 975,000 110,000 70,000 3,608,493
532100 - Concept Design and Outreach - 45,000 10,000 - - - 55,000
536000 - Miscellaneous ProfessionalServices 194,715 - 193,325 - 200,491 - 588,531
591100 - Construction 3,508,345 8,760,000 8,099,000 5,145,000 5,459,000 5,097,000 36,068,345
595000 - Furniture & Equipment - - 96,000 - - 96,000 192,000
589000 - Transfer to Other Funds 1,843,902 2,835,000 925,000 - - 360,000 5,963,902
Total 6,114,920 12,980,535 9,868,325 6,120,000 5,769,491 5,623,000 46,476,271
Net Change in Fund Balance (403,098) (5,751,535) (2,343,325) 150,000 884,509 (1,135,000) (8,598,449)
Projected Fund Balance 15,536,964 9,785,429 7,442,104 7,592,104 8,476,613 7,341,613 7,341,613
397

Capital Improvement PlanRevenues, Expenditures and Projected Fund Balance -
By FundFY22 Budget
303 - Infrastructure
ProjectFY21
Projection FY22 FY23 FY24 FY25 FY26 Total
Expenditures by Project
0000012 - Annual Street Light Program 75,000 135,000 135,000 135,000 135,000 135,000 750,000
0000014 - Relamping of City Lights - - 96,000 - - 96,000 192,000
0000017 - East Darby Ct - SidewalkRehab 50,000 - - - - - 50,000
0000018 - East Side of NIST - Multi-UsePath - 450,000 1,800,000 - - 2,250,000
0000020 - QOP to Conservation Ln -Bicycle Connections - - 100,000 350,000 - 450,000
0000021 - Washingtonian Blvd - BicycleConnections 133,455 1,895,535 - - - - 2,028,990
0000024 - I-370 - Bicycle Connection - - 400,000 1,600,000 - 2,000,000
0000025 - Annual Sidewalk Projects 394,533 270,000 200,000 200,000 200,000 200,000 1,464,533
0000026 - Lakelands –WashingtonianWoods - Bicycle Connection - 45,000 10,000 400,000 550,000 1,300,000 2,305,000
0000027 - Olde Towne Streetscape 923,113 - - - - - 923,113
0000028 - Pavement Re-survey 186,500 - 193,325 - 200,491 - 580,316
0000029 - Road PreventativeMaintenance 206,000 212,000 218,000 225,000 232,000 240,000 1,333,000
0000030 - Preventive MaintenanceProgram Collectors & Arterials 617,000 636,000 654,000 675,000 694,000 715,000 3,991,000
0000031 - Street Resurfacing Program 1,232,000 1,267,000 1,302,000 1,345,000 1,383,000 1,427,000 7,956,000
0000032 - Future Street Reconstruction - 1,750,000 500,000 - - - 2,250,000
0000033 - East Deer Park Drive - StreetRehab 246,796 - - - - - 246,796
0000034 - QOB Street Rehab - DiamondDr to First Field Rd - 1,670,000 - - - - 1,670,000
0000037 - N. Summit Ave and BrookesAve - Signal Recon 435,000 - - - - - 435,000
0000038 - Future Signal Reconstruction 25,000 35,000 425,000 490,000 75,000 750,000 1,800,000
0000039 - E. Diamond Ave and ChestnutSt - Signal Recon - - - - 410,000 410,000
0000042 - Annual Long Span BridgesProgram 8,215 - 60,000 - - - 68,215
0000045 - Future Bridges & CulvertsProjects 567,420 465,000 350,000 350,000 350,000 350,000 2,432,420
0000115 - Kentlands Blvd - CrosswalkModifications 41,000 - - - - - 41,000
0000131 - Pedestrian Path over GreatSeneca Highway - 525,000 3,600,000 - - - 4,125,000
0000136 - Bureau Drive CulvertMaintenance Repair - 250,000 - - - - 250,000
-
-
-
398

Capital Improvement PlanRevenues, Expenditures and Projected Fund Balance -
By FundFY22 Budget
303 - Infrastructure
ProjectFY21
Projection FY22 FY23 FY24 FY25 FY26 Total
0000137 - Diamond Drive CulvertMaintenance Repair Project - 250,000 - - - - 250,000
0000138 - Inspiration Lake DockReplacement 10,000 85,000 - - - - 95,000
0000140 - Upshire Cir. CulvertMaintenance Repair Project - 60,000 - - - - 60,000
0000141 - Victory Farm Drive CulvertMaintenance Project - 150,000 - - - - 150,000
0000142 - ZC22CPR - Tschiffely SquareRoad Culvert Maintenance Repair 25,480 150,000 - - - - 175,480
0000143 - ZC53CPR - Tschiffely SquareCulvert Maintenance Repair Proje 87,603 200,000 - - - - 287,603
0000148 - Russell Avenue and OdendhalAvenue - Signal Recon 429,385 - - - - - 429,385
0000152 - Curb Installation on Main Street 100,000 - - - - - 100,000
0000153 - East Diamond Avenue &Summit Avenue Signal Improvements 25,000 330,000 - - - - 355,000
0000154 - Edison Park Drive & MainStreet 1,750,000 500,000 - - - 2,250,000
0000155 - Pheasant Run DriveImprovements 30,000 50,000 - - - - 80,000
0000156 - Quince Orchard BoulevardShared Use Path 225,000 650,000 750,000 - - - 1,625,000
0000157 - Russell Avenue & ChristopherAvenue Signal Recon 35,000 425,000 - - - 460,000
IN999 - 0000168 - Casey CommunityCenter Pedestrian Bridge 41,420 115,000 - - - - 156,420
Total 6,114,920 12,980,535 9,868,325 6,120,000 5,769,491 5,623,000 46,476,271
-
-
399

Capital Improvement PlanRevenues, Expenditures and Projected Fund Balance -
By FundFY22 Budget
304 - FacilitiesFY21
Projection FY22 FY23 FY24 FY25 FY26 Total
Revenues and Sources of Funds
499000 - Transfer In - From GeneralFund 945,000 630,000 1,375,000 1,180,000 2,950,000 1,075,000 8,155,000
499100 - Transfer In - From CIP 487,721 1,005,000 - - - - 1,492,721
Total 1,432,721 1,635,000 1,375,000 1,180,000 2,950,000 1,075,000 9,647,721
Expenditures and Uses of Funds
532000 - Engineering & Architecture 90,880 78,550 209,000 105,000 - - 483,430
591100 - Construction 63,504 1,735,000 2,291,020 - 5,175,000 - 9,264,524
595060 - Machinery & Equipment - 190,000 190,000 - 940,000 - 1,320,000
589000 - Transfer to Other Funds 506,128 - - - - - 506,128
Total 660,512 2,003,550 2,690,020 105,000 6,115,000 - 11,574,082
Net Change in Fund Balance 772,209 (368,550) (1,315,020) 1,075,000 (3,165,000) 1,075,000 (1,926,361)
Projected Fund Balance 6,614,448 6,245,898 4,930,878 6,005,878 2,840,878 3,915,878 3,915,878
400
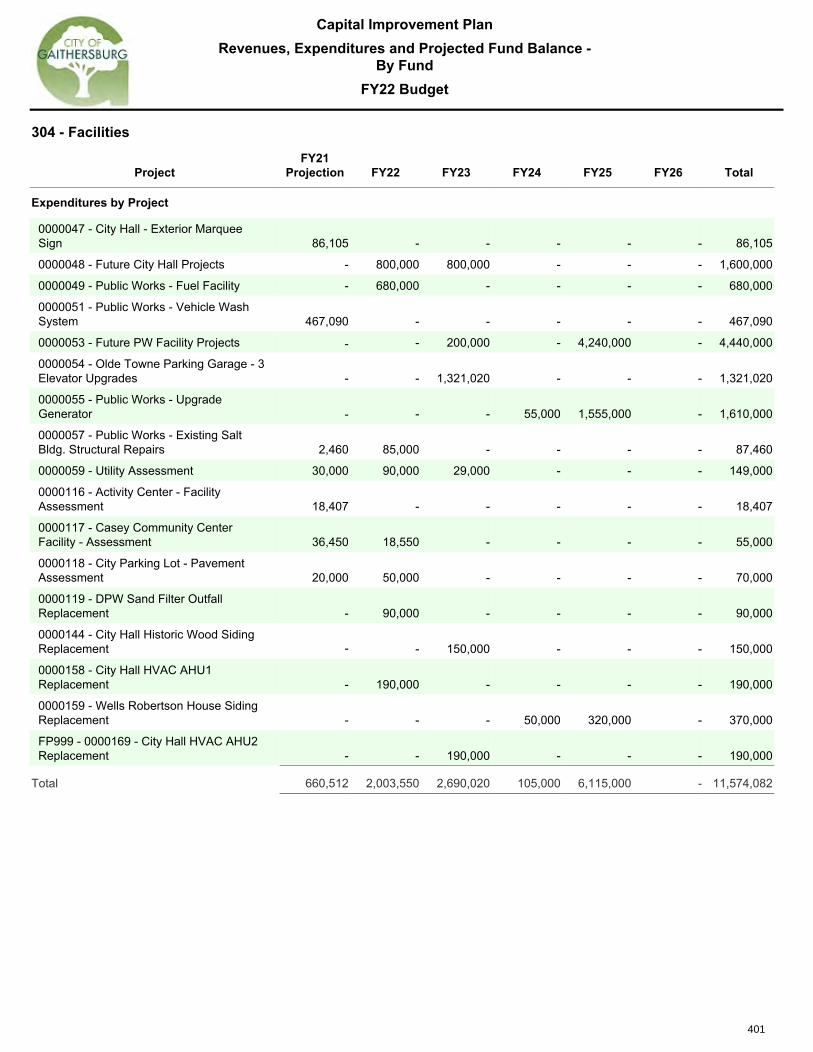
Capital Improvement PlanRevenues, Expenditures and Projected Fund Balance -
By FundFY22 Budget
304 - Facilities
ProjectFY21
Projection FY22 FY23 FY24 FY25 FY26 Total
Expenditures by Project
0000047 - City Hall - Exterior MarqueeSign 86,105 - - - - - 86,105
0000048 - Future City Hall Projects - 800,000 800,000 - - - 1,600,000
0000049 - Public Works - Fuel Facility - 680,000 - - - - 680,000
0000051 - Public Works - Vehicle WashSystem 467,090 - - - - - 467,090
0000053 - Future PW Facility Projects - 200,000 - 4,240,000 - 4,440,000
0000054 - Olde Towne Parking Garage - 3Elevator Upgrades - - 1,321,020 - - - 1,321,020
0000055 - Public Works - UpgradeGenerator - - 55,000 1,555,000 - 1,610,000
0000057 - Public Works - Existing SaltBldg. Structural Repairs 2,460 85,000 - - - - 87,460
0000059 - Utility Assessment 30,000 90,000 29,000 - - - 149,000
0000116 - Activity Center - FacilityAssessment 18,407 - - - - - 18,407
0000117 - Casey Community CenterFacility - Assessment 36,450 18,550 - - - - 55,000
0000118 - City Parking Lot - PavementAssessment 20,000 50,000 - - - - 70,000
0000119 - DPW Sand Filter OutfallReplacement - 90,000 - - - - 90,000
0000144 - City Hall Historic Wood SidingReplacement - 150,000 - - - 150,000
0000158 - City Hall HVAC AHU1Replacement - 190,000 - - - - 190,000
0000159 - Wells Robertson House SidingReplacement - - 50,000 320,000 - 370,000
FP999 - 0000169 - City Hall HVAC AHU2Replacement - - 190,000 - - - 190,000
Total 660,512 2,003,550 2,690,020 105,000 6,115,000 - 11,574,082
-
-
-
-
401

Capital Improvement PlanRevenues, Expenditures and Projected Fund Balance -
By FundFY22 Budget
305 - ParksFY21
Projection FY22 FY23 FY24 FY25 FY26 Total
Revenues and Sources of Funds
434000 - State Grant - Open Space 350,000 - 175,000 - - - 525,000
467200 - Miscellaneous - - 800,000 - - - 800,000
499000 - Transfer In - From GeneralFund 150,000 968,500 (450,000) 500,000 850,000 350,000 2,368,500
499100 - Transfer In - From CIP 935,674 655,000 414,500 - - - 2,005,174
Total 1,435,674 1,623,500 939,500 500,000 850,000 350,000 5,698,674
Expenditures and Uses of Funds
532000 - Engineering & Architecture 6,253 255,000 7,500 75,000 - - 343,753
591100 - Construction 1,775,778 1,832,140 1,469,110 287,000 775,000 200,000 6,339,028
595000 - Furniture & Equipment 11,570 - - - - - 11,570
589000 - Transfer to Other Funds 935,674 437,000 414,500 - - - 1,787,174
Total 2,729,275 2,524,140 1,891,110 362,000 775,000 200,000 8,481,525
Net Change in Fund Balance (1,293,601) (900,640) (951,610) 138,000 75,000 150,000 (2,782,851)
Projected Fund Balance 2,960,696 2,060,056 1,108,446 1,246,446 1,321,446 1,471,446 1,471,446
402

Capital Improvement PlanRevenues, Expenditures and Projected Fund Balance -
By FundFY22 Budget
305 - Parks
ProjectFY21
Projection FY22 FY23 FY24 FY25 FY26 Total
Expenditures by Project
0000060 - Water Park - SlideReplacement 122,644 - - - - - 122,644
0000061 - Activity Center - RoofReplacement 65,000 600,000 - - - 665,000
0000062 - Water Park - Filtration, Motors& Pumps 680,000 9,110 9,110 - - - 698,220
0000067 - Activity Center - UpgradeGenerator - - 75,000 575,000 - 650,000
0000068 - Sound Study Enhancements forRPYC, OTYC and AC Main Gym 7,600 75,000 - - - - 82,600
0000070 - Kelley Park - Tennis CourtsRehabilitation 60,000 - - - - - 60,000
0000071 - Robertson Park - Field LightingImprovements (3 Fields) 80,657 - - - - - 80,657
0000075 - Future Renovation of ExistingParks Projects 637,988 347,000 414,500 - - - 1,399,488
0000079 - Future Benjamin GaitherCenter Projects - 90,000 - - - - 90,000
0000081 - Arts Barn - Boiler/Chiller/Controls Replacement 46,587 - - - - - 46,587
0000082 - Robertson Park Field #3 -Synthetic Turf Installation 760,000 265,000 - - - - 1,025,000
0000120 - Casey Community Center -Electronic Sign 133,000 - - - - 133,000
0000122 - Diamond Farms Park Court #3- New Lighting 69,000 - - - - - 69,000
0000123 - Gymnasium PartitionReplacement - Activity Center 185,000 - - - - - 185,000
0000126 - Washingtonian Woods Park -Path Replacement 41,812 - - - - - 41,812
0000160 - Asphalt Tennis & BasketballCourt Resurfacing - 165,000 - - - - 165,000
0000161 - Kentlands Mansion - SecondFloor Bathroom Renovation 37,987 - - - - - 37,987
0000162 - New Gaithersburg ElementarySchool Turf Field 800,000 - - - - 800,000
PK999 - 0000174 - Miniature Golf PondRepair - 347,000 - - - - 347,000
PK999 - 0000173 - Manor House - RoofReplacement - - 7,500 87,000 - - 94,500
PK999 - 0000170 - Asphalt Path Repairand Overlay - - 200,000 200,000 200,000 200,000 800,000
PK999 - 0000172 - Blohm Park TrailImprovements - 140,000 660,000 - - - 800,000
-
-
-
-
403

Capital Improvement PlanRevenues, Expenditures and Projected Fund Balance -
By FundFY22 Budget
305 - Parks
ProjectFY21
Projection FY22 FY23 FY24 FY25 FY26 Total
PK999 - 0000171 - Benjamin GaitherBathroom Renovations - 88,030 - - - - 88,030
Total 2,729,275 2,524,140 1,891,110 362,000 775,000 200,000 8,481,525
404

Capital Improvement PlanRevenues, Expenditures and Projected Fund Balance -
By FundFY22 Budget
306 - TechnologyFY21
Projection FY22 FY23 FY24 FY25 FY26 Total
Revenues and Sources of Funds
499000 - Transfer In - From GeneralFund 62,000 295,000 335,000 410,000 300,000 300,000 1,702,000
499100 - Transfer In - From CIP 491,543 115,000 - - - - 606,543
Total 553,543 410,000 335,000 410,000 300,000 300,000 2,308,543
Expenditures and Uses of Funds
595000 - Furniture & Equipment 305,880 747,000 470,000 350,000 25,000 - 1,897,880
589000 - Transfer to Other Funds 491,543 - - - - - 491,543
Total 797,423 747,000 470,000 350,000 25,000 - 2,389,423
Net Change in Fund Balance (243,880) (337,000) (135,000) 60,000 275,000 300,000 (80,880)
Projected Fund Balance 1,670,027 1,333,027 1,198,027 1,258,027 1,533,027 1,833,027 1,833,027
405

Capital Improvement PlanRevenues, Expenditures and Projected Fund Balance -
By FundFY22 Budget
306 - Technology
ProjectFY21
Projection FY22 FY23 FY24 FY25 FY26 Total
Expenditures by Project
0000083 - IT - Network InfrastructureImprovements - 15,000 - - - - 15,000
0000084 - City - Facility Cameras System - 15,000 - - - 15,000
0000085 - City - 16 S. Summit Ave.Network Configuration 104,000 6,000 - 30,000 - - 140,000
0000086 - City - Facility Access SecurityImprovements - 35,000 20,000 - - - 55,000
0000087 - City - Intranet WebReplacement - - - 30,000 - - 30,000
0000088 - IT- Remote Data Center - - 30,000 - - 30,000
0000089 - PW - Energy ManagementSystem 50,000 - - - - - 50,000
0000090 - IT - Security Assessment /Testing - - - - - -
0000093 - City - Field Asset & Work OrderSystem 150,000 - - - - - 150,000
0000094 - Police - Public SafetySurveillance Cameras - 100,000 - - - 100,000
0000095 - City - Parking GarageTechnology Improvements - 100,000 - - - 100,000
0000096 - City - Radio System Upgrades - 150,000 - - - - 150,000
0000097 - IT- Data Backup System 85,000 - 25,000 - - 110,000
0000098 - City - Shared Server Storage 29,123 - - - - - 29,123
0000099 - City - City Hall GroundsCameras & Network - - - 25,000 - 25,000
0000100 - City - Wide-Area NetworkEnhancements - 175,000 175,000 - - 350,000
0000101 - City - 16 S. Summit Ave.Training/Conference Rooms - - 35,000 - - 35,000
0000106 - Future Technology Projects 391,000 - - - - - 391,000
0000147 - Fuel Management SystemUpgrade 21,300 40,000 - - - - 61,300
0000163 - 16 South Summit Avenue ITBuildout 50,000 95,000 - 25,000 - - 170,000
0000164 - City Parking ProgramTechnology - 30,000 - - - 30,000
0000165 - Financial SystemImprovements 70,000 - - - - 70,000
0000166 - Park Facilities Audio-VisualImprovements 2,000 6,000 - - - - 8,000
0000167 - Telework Pilot Program - 35,000 - - - - 35,000
IT999 - 0000176 - GIS Software Migration - 40,000 - - - - 40,000
-
-
-
-
-
-
-
-
-
-
-
406

Capital Improvement PlanRevenues, Expenditures and Projected Fund Balance -
By FundFY22 Budget
306 - Technology
ProjectFY21
Projection FY22 FY23 FY24 FY25 FY26 Total
IT999 - 0000178 - Microsoft 365 Migration - 50,000 - - - - 50,000
IT999 - 0000175 - Cloud DataGovernance - 60,000 - - - - 60,000
IT999 - 0000179 - Museum/Plaza TechEnhancements - - 30,000 - - - 30,000
IT999 - 0000177 - Meeting ManagementSystem Replacement - 60,000 - - - - 60,000
Total 797,423 747,000 470,000 350,000 25,000 - 2,389,423
407

Capital Improvement PlanRevenues, Expenditures and Projected Fund Balance -
By FundFY22 Budget
307 - Art in Public PlacesFY21
Projection FY22 FY23 FY24 FY25 FY26 Total
Revenues and Sources of Funds
499000 - Transfer In - From GeneralFund - - 10,000 - - - 10,000
499100 - Transfer In - From CIP 139,300 135,000 - - - - 274,300
Total 139,300 135,000 10,000 - - - 284,300
Expenditures and Uses of Funds
536000 - Miscellaneous ProfessionalServices 13,000 40,000 10,000 8,000 - - 71,000
591100 - Construction 12,000 335,000 180,000 133,000 - - 660,000
589000 - Transfer to Other Funds 19,300 - - - - - 19,300
Total 44,300 375,000 190,000 141,000 - - 750,300
Net Change in Fund Balance 95,000 (240,000) (180,000) (141,000) - - (466,000)
Projected Fund Balance 718,961 478,961 298,961 157,961 157,961 157,961 157,961
408

Capital Improvement PlanRevenues, Expenditures and Projected Fund Balance -
By FundFY22 Budget
307 - Art in Public Places
ProjectFY21
Projection FY22 FY23 FY24 FY25 FY26 Total
Expenditures by Project
0000107 - Olde Towne - Art Project 10,000 210,000 150,000 123,000 - - 493,000
0000108 - Diamond Farms Skate Spot -Art Project 3,000 5,000 - - - - 8,000
0000110 - Observatory Park ArmillarySundial - Art Project 19,300 - - - - - 19,300
0000111 - Park Trail Markers - Art Project 30,000 20,000 - - - 50,000
0000112 - Developer Sponsored City ArtProjects - - - - - -
0000113 - Future Art in Public Places - - - - - -
0000127 - 16 S. Summit Ave Building - ArtProject 12,000 110,000 - - - - 122,000
AP999 - 0000180 - Community MuralProject - 20,000 20,000 18,000 - - 58,000
Total 44,300 375,000 190,000 141,000 - - 750,300
-
-
-
409

Malcolm King Park
410
Stormwater Management FundOverview
FY22 Budget
The Stormwater Program Fund was established in FY16 to provide greater transparency regarding the allocation anduse of funds collected from the Stormwater Program Fee. Funding from the Stormwater Program Fee protects thestormwater infrastructure investment made by all property owners within Gaithersburg and allows the City tocomprehensively manage stormwater by fulfilling maintenance needs, controlling flooding, preventing erosion, andprotecting public safety and property.
The Stormwater Program Fee is based upon the projected costs of the stormwater program to achieve compliance withthe City’s Municipal Separate Storm Sewer System (MS4) permit as well as maintenance and repair of the stormwatersystem. Prior to implementing the Stormwater Program Fee, the City developed projected program costs forstormwater operations including a significant analysis of the cost of compliance for the Chesapeake Bay restorationrequirements under the City’s upcoming MS4 permit. The fee rates approved by the City were not expected to be highenough to completely cover all of the costs of the program; as a result, the General Fund provided a subsidy to theStormwater Fund FY17-20.
The Stormwater Program Fee is calculated from the amount of impervious area on a given property and is collectedfrom all property types including nonprofit and City-owned properties. The fee calculation is based on a billable unit of500 square feet of impervious surface area. For example, a property owner with 1,500 square feet of impervious areawould have three (3) billable units.
The Stormwater Program Fee rate represents the fee for one impervious billing unit, and is used to calculate eachproperty’s total fee. The Mayor and City Council adopt the Stormwater Program Fee rate on a yearly basis. In FY21,the Program updated its data for the rate model and presented the recommended rates for FY22-27 to the Mayor andCity Council at a spring work session. For FY22, a rate of $32.28 was adopted for each billable unit by Council.Therefore, in the example above the property owner would pay a total of $96.84 (3 billable units * $32.28) for the year.
The Stormwater Fund is managed by the Stormwater Program within the Department of Public Works. Operatingexpenses covered by the Stormwater Fund include ongoing yearly maintenance, personnel costs for employees whoare dedicated to stormwater program activities for 100% of their time, and general operating costs associated withdedicated staff, grants, asset management, and compliance with programmatic requirements of the MS4 permit. Asrecommended by the FY21 rate study, the operating expenses now also include a percentage of the personnel costsfor other staff who regularly spend a significant percentage of time on Stormwater issues, a percentage of the City’sadministrative staff’s personnel costs, and asset replacement funding for a sweeper replacement. Capital expendituresinclude replacement costs for aging stormwater and storm drain infrastructure and capital improvement costsassociated with the restoration projects required under the EPA Chesapeake Bay cleanup mandates through the City’sState-issued MS4 permit.
The City’s MS4 permit requires that stormwater management be provided for twenty percent of existing developedlands that have little or no stormwater management. Identified projects to provide that treatment are summarized in thissection and full project descriptions and costs are included in the appendix. Staff anticipates that the identified projects,if fully implemented, will fulfill the restoration requirements by the end of the permit cycle.
At the close of FY21, the City completed two stream restoration projects towards meeting its MS4 goals: one at WestDeer Park and the Great Seneca project near Lakelands and Orchard Ridge Drives. The stream restoration project atBlohm Park is well on its way to completion. Monitoring costs for all stream restoration projects were moved from thecapital project budgets to operating to better reflect project closeout.
Services Provided
411

Stormwater Fund
Project Closure List
FY22 Budget
Each year, Gaithersburg staff review the CIP project list and recommend completed projects for closure. The following projects will be closed as of June 30, 2021 and are not included in the FY 2022 CIP. Any remaining project funding will be transferred to the primary reserve project in the Stormwater Fund.
Project Title Fiscal Year
Opened13
Original Budget14
Final Budget15
SW00007 – Lakelands Drive Stream 2018 625,000 565,193SW00008 – Orchard Ridge Drive Stream 2018 605,000 559,869SW00011 – Solitaire Court Stream16 2018 603,000 74,715SW00018 – Kelley Park Tennis Courts Drainage Improvements17
2018 74,000 -
SW00019 – Kelley Park Parking Lot Drainage Improvements17
2018 74,000 -
13 The City of Gaithersburg transitioned between project tracking methods in 2018, therefore any projects started prior to the transition will show as being opened in FY18 and were first presented in the FY19 Adopted Budget Book. 14 Original budgets utilizing funds budgeted prior to the transition to the current project ledger are not included in this figure. 15 Funds spent prior to the transition to the current project ledger are not included in this figure; total project cost includes estimated FY21 amounts. 16 Project has been combined with Project SW00015 – Solitaire Court Stream Restoration Extension and will be closed. 17 Project was canceled due to the transfer of this portion of the park to the Montgomery County Public Schools system for the construction of a new elementary school.
412

Stormwater Management FundOverview
FY22 Budget
Significant Changes
Activity / Object
FY21AdoptedBudget
FY22AdoptedBudget
Increase /(Decrease)
3360 - SWM Operating
536000 - Miscellaneous Professional Services 518,000 140,000 (378,000)
Decrease due to FY21's one-time items that are not expected in FY22, primarily the consultant cost for the SWFee rate study ($150,000), and the alignment of costs for City storm drain inspections ($263,000) with the Woodstudy.
536400 - Contract Maintenance Services 645,000 359,740 (285,260)
Decrease resulting from alignment of costs with the Wood Stormwater fee rate program study.
589000 - Transfer to Other Funds - 4,281,591 4,281,591
Increase in transfer is composed of reimbursement of prior years' Stormwater subsidies ($4,119,436) to theGeneral Fund and new recurring administrative cost allocation ($162,155) to the Stormwater fund.
589300 - Transfer to Capital Funds - 3,547,170 3,547,170
Increase is due to one-time transfer to the CIP Fund to reimburse for the Stormwater project costs paid out ofthe CIP Fund.
3361 - SW Infrastructure Maintenance & Enhancement
532000 - Engineering & Architecture 211,000 221,000 10,000
Increase is due to additional funding requirements for post construction monitoring as shown in the StormwaterRate Fee Model study.
543000 - Contributions 50,000 150,000 100,000
Increase is due to staff requests for additional funding of the CBT outreach and restoration program toencourage more restoration projects.
548100 - Sponsorships 10,000 30,000 20,000
Increase due to plans to expand engagement and add permeable pavement to program.
577000 - R&M Infrastructure 340,000 262,400 (77,600)
Decrease due to corrugated metal pipe replacement costs moved to Capital for future years and StreetSweeping costs moved to Stormwater in FY22.
589350 - Transfer to Asset Replacement - 38,000 38,000
Increase due to Transfer to Asset Replacement Fund for Sweeper purchased in 2018 with 10 year lifespan.Reserve fund started in FY22.
413

Stormwater Management FundDepartmental Summary
FY22 Budget
Budget Summary by ActivityFY20
ActualsFY21
Projection
FY21AdoptedBudget
FY22AdoptedBudget Chg % Chg
By Activity3360 - SWM Operating 842,415 1,365,181 1,974,527 9,452,219 7,477,692 378.7%
3361 - SW Infrastructure Maintenance &Enhancement 149,131 154,700 611,000 701,400 90,400 14.8%
3362 - Chesapeake Bay Capital Projects 540,926 2,776,160 3,685,495 3,706,046 20,551 0.6%
Total 1,532,472 4,296,041 6,271,022 13,859,665 7,588,643 121.0%
Budget Summary by ObjectFY20
ActualsFY21
Projection
FY21AdoptedBudget
FY22AdoptedBudget Chg % Chg
By Object CategoryPersonnel Services 509,254 627,279 689,747 990,353 300,606 43.6%
Operating 527,279 1,161,559 2,595,325 1,639,151 (956,174) (36.8%)
Capital 495,940 1,760,034 2,985,950 3,113,400 127,450 4.3%
Transfers - 747,169 - 8,116,761 8,116,761 0.0%
Total 1,532,472 4,296,041 6,271,022 13,859,665 7,588,643 121.0%
414

Stormwater Management FundDepartmental Summary
FY22 Budget
Class Name
FY20AdoptedBudget
FY21AdoptedBudget
FY22AdoptedBudget
3360 - SWM Operating
Stormwater Inspector 0 1 1
Project Manager 3 3 3
Stormwater Technician 1 0 0
Watershed Restoration Specialist 1 1 1
Stormwater Program Manager 1 1 1
Part-Time Personnel 0 0 0.5
Subtotal 6 6 6.5
Full-Time Personnel 6 6 6
Part-Time Personnel 0 0 0.5
Total 6 6 6.5
415

Stormwater Management Fund5 Year Financial Plan
FY22 Budget
Revenues and Sources of Funds
Actv Object - NameFY20
ActualsFY21
Projection
FY21AdoptedBudget
FY22Request
FY23Request
FY24Request
FY25Request
FY26Request
5 YearRequest
Total
3360 449200 - Stormwater MGMT PlanReview Fees 150 30,000 30,000 30,000 30,000 30,000 30,000 30,000 150,000
449300 - Stormwater Program Fee 5,317,789 5,400,000 5,650,000 5,228,000 5,398,000 5,575,000 5,591,000 5,605,000 27,397,000
461100 - Interest Earnings 344,036 160,000 298,000 201,600 155,631 124,720 92,434 117,174 691,559
461101 - Change In Unrealized Gain/Loss 392,559 - - - - - - - -
499000 - Transfer In - From GeneralFund 1,233,382 - 169,547 169,547 169,547 169,547 169,547 169,547 847,735
499200 - Transfer In - (208,200) (208,200) (3,931,685) (1,091,595) (1,380,000) (2,486,403) (2,890,000) (11,779,683)
3362 499200 - Transfer In 2,264,704 208,200 208,200 3,931,685 1,091,595 1,380,000 2,486,403 2,890,000 11,779,683
Total Revenues and Sources of Funds 9,552,620 5,590,000 6,147,547 5,629,147 5,753,178 5,899,267 5,882,981 5,921,721 29,086,294
Expenditures and Uses of Funds
Actv Object - NameFY20
ActualsFY21
Projection
FY21AdoptedBudget
FY22Request
FY23Request
FY24Request
FY25Request
FY26Request
5 YearRequest
Total
3360 501000 - Full-Time Wages 384,430 479,040 511,742 779,097 856,347 882,038 908,499 935,754 4,361,735
505200 - Other Taxable Comp.-GFIT 405 672 672 756 779 802 826 851 4,014
508000 - Overtime Wages 558 - - 1,408 - - - - 1,408
509000 - Part-Time Wages - - - 39,998 - - - - 39,998
519000 - Tuition Reimbursement 3,500 3,500 7,000 3,500 3,500 3,500 3,500 3,500 17,500
510000 - FICA Taxes 28,605 36,698 40,832 44,872 42,955 44,244 45,571 46,938 224,580
514200 - Vision Benefit (15) 141 164 150 155 160 165 170 800
514210 - Health Insurance 31,805 23,504 42,136 28,037 28,878 29,744 30,636 31,555 148,850
514220 - Dental Benefit 112 1,183 2,591 1,326 1,366 1,407 1,449 1,492 7,040
514230 - Long-Term Care Benefit 765 792 870 937 965 994 1,024 1,055 4,975
514240 - Life Ins and Disability Benefit 3,778 4,810 5,305 5,377 5,538 5,704 5,875 6,051 28,545
515000 - Retirement (401A) 30,679 38,322 42,645 43,550 44,857 46,203 47,589 49,017 231,216
515100 - Retirement Health Savings(RHS) 6,694 15,285 9,799 14,931 15,379 15,840 16,315 16,804 79,269
416

Stormwater Management Fund5 Year Financial Plan
FY22 Budget
Expenditures and Uses of Funds
Actv Object - NameFY20
ActualsFY21
Projection
FY21AdoptedBudget
FY22Request
FY23Request
FY24Request
FY25Request
FY26Request
5 YearRequest
Total
515200 - Medicare Retirement HealthSavings (RHS) 6,539 8,960 10,000 10,083 10,385 10,697 11,018 11,349 53,532
516000 - Savings Plan (401K) 11,397 14,372 15,991 16,331 13,954 14,373 14,804 15,248 74,710
521000 - Office Supplies 1,184 350 2,700 2,754 2,809 2,865 2,923 2,981 14,332
522000 - General Operating Supplies 24 500 2,500 2,550 2,601 2,653 2,706 2,760 13,270
522500 - Program Activities 1,498 6,000 6,000 10,120 10,322 10,529 10,739 10,954 52,664
525000 - Furniture/Fixture 4,267 - - - - - - - -
526000 - Machinery/Equipment 946 1,100 1,100 5,500 1,144 1,167 1,191 1,214 10,216
531000 - IT (Non-Consultant) Services 4,027 4,206 4,206 4,413 4,501 4,592 4,684 4,778 22,968
531500 - Software Licenses 1,653 - - - - - - - -
531600 - Software MaintenanceAgreements 1,740 2,395 2,545 4,260 4,345 4,432 4,521 4,611 22,169
536000 - Miscellaneous ProfessionalServices 76,868 187,000 518,000 140,000 154,800 167,656 180,568 293,539 936,563
536400 - Contract MaintenanceServices 227,443 530,000 645,000 359,740 417,750 429,270 456,801 471,043 2,134,604
536500 - Investigations 63 - - - - - - - -
544000 - Dues/Memberships/Certification 2,177 1,001 4,377 2,392 2,765 2,488 2,537 2,913 13,095
545000 - Publications/ ResourceMaterial 889 600 1,400 1,428 1,457 1,486 1,515 1,546 7,432
546000 - Conf./Seminar/ClassRegistration 3,252 760 12,782 13,322 13,232 13,847 13,766 14,392 68,559
547000 - Travel Expense 2,957 - 15,540 15,440 17,844 20,161 18,484 20,813 92,742
551100 - Cellular Phone 119 1,000 820 2,020 2,061 2,102 2,144 2,187 10,514
552500 - Gasoline Expense 382 600 2,000 2,040 2,081 2,122 2,165 2,208 10,616
553000 - Printing & Binding 52 - - - - - - - -
556000 - Postage 14 50 350 357 364 371 379 386 1,857
557000 - Uniforms/ Laundry 2,413 1,140 1,960 1,999 2,039 2,080 2,121 2,164 10,403
560000 - Miscellaneous 421 200 1,000 1,020 1,040 1,061 1,082 1,104 5,307
574000 - R&M - Vehicles 770 1,000 2,500 2,550 2,601 2,653 2,706 2,760 13,270
417

Stormwater Management Fund5 Year Financial Plan
FY22 Budget
Expenditures and Uses of Funds
Actv Object - NameFY20
ActualsFY21
Projection
FY21AdoptedBudget
FY22Request
FY23Request
FY24Request
FY25Request
FY26Request
5 YearRequest
Total
577000 - R&M Infrastructure - - 60,000 61,200 62,424 63,672 64,946 66,245 318,487
589000 - Transfer to Other Funds - - - 4,281,591 167,020 172,031 177,192 182,508 4,980,342
589300 - Transfer to Capital Funds - - - 3,547,170 - - - - 3,547,170
3361 532000 - Engineering & Architecture 14,382 63,700 211,000 221,000 222,000 229,520 234,060 230,841 1,137,421
543000 - Contributions 115,789 50,000 50,000 150,000 150,000 200,000 250,000 300,000 1,050,000
548100 - Sponsorships 394 1,000 10,000 30,000 30,000 30,000 30,000 30,000 150,000
577000 - R&M Infrastructure 18,565 40,000 340,000 262,400 264,848 267,345 269,892 272,490 1,336,975
589350 - Transfer to AssetReplacement - - - 38,000 38,000 38,000 38,000 38,000 190,000
3362 532000 - Engineering & Architecture 43,508 268,957 542,045 342,646 291,000 160,000 292,500 285,000 1,371,146
532100 - Concept Design andOutreach 1,479 - 157,500 - 57,000 102,500 80,000 - 239,500
536000 - Miscellaneous ProfessionalServices - - - - - - 200,000 200,000 400,000
589000 - Transfer to Other Funds - 747,169 - 250,000 - - - - 250,000
532300 - Construction Oversight 29,692 97,034 92,501 115,900 226,919 184,248 94,050 189,000 810,117
590000 - Land - - 400,000 - 400,000 - - - 400,000
591100 - Construction 466,248 1,663,000 2,422,449 2,997,500 2,956,250 2,759,000 2,054,250 3,017,500 13,784,500
597500 - Construction Management - - 71,000 - 6,000 5,000 - - 11,000
Total Expenditures and Uses of Funds 1,532,472 4,296,041 6,271,022 13,859,665 6,540,275 5,938,557 5,583,193 6,773,721 38,695,411
Revenues Over (Under) Expenditures 8,020,148 1,293,960 (123,475) (8,230,518) (787,097) (39,290) 299,788 (852,000) (9,609,117)
Projected Fund Balance 25,954,196 27,248,156 25,830,721 19,017,638 18,230,541 18,191,251 18,491,039 17,639,039
418

Stormwater Management FundProject List - Expenditures
FY22 Budget
Proj Project NameEst'd
CreditsFY20
ActualsFY21
Projection
FY21AdoptedBudget
FY22Request
FY23Request
FY24Request
FY25Request
FY26Request
5 YearRequest
Total
SW00024 Bridalwood Retrofit 12 - - - - - 30,000 70,000 550,000 650,000
SW00025 Turtle Pond Retrofit 4 - - - - - 30,000 70,000 550,000 650,000
SW00026 Hyde Park Retrofit 3 - - - - - - 35,000 85,000 120,000
SW00027 Carriage Hills Retrofit 3 - - 35,000 - - - 35,000 85,000 120,000
SW00028 Woodland Hills Retrofit 7 - - - - - 15,000 40,000 15,000 70,000
SW999 SW00041 - Watershed Studies 0 - - - - - - 200,000 200,000 400,000
SW999 SW00037 - Armoring of High Hazardand Significant Hazard Dams 0 - - - 390,000 - - - - 390,000
SW999 SW00038 - East Darby Court DrainageRepair 0 - - - 30,000 - - - - 30,000
SW999 SW00040 - Walder Park DrainageRepair 1 - - - - - 55,000 55,000 - 110,000
SW999 SW00039 - Stormwater Contingency 0 - - - 250,000 - - - - 250,000
SW00002 Muddy Branch West Deer 3 - - - - - - - - -
SW00004 Girard Street Stream 6 - 43,143 86,285 78,044 363,393 363,393 - - 804,830
SW00005 Victory Farm 125 17,075 100,664 - 50,332 1,185,000 1,193,655 - - 2,428,987
SW00006 Amberfield 10 - - - - - - - 100,000 100,000
SW00007 Lakelands Drive Stream 29 250,632 55,824 - - - - - - -
SW00008 Orchard Ridge Drive Stream 26 245,308 15,086 - - - - - - -
SW00009 Watkins Mill Road Stream 39 4,258 1,019,700 1,085,919 900 - - - - 900
SW00010 Travis Avenue Stream 27 454 691,700 733,900 3,000 - - - - 3,000
SW00011 Solitaire Court Stream 0 - 530,293 17,860 - - - - - -
SW00012 Rabbitt Road Stream 41 1,479 40,000 65,000 75,500 865,000 303,500 - - 1,244,000
SW00015 Solitaire Court Stream RestorationExtension 85 21,721 45,000 11,900 2,249,500 64,250 - - - 2,313,750
SW00017 Quince Orchard Blvd. Recon SWM 1 - - 250,000 250,000 - - - - 250,000
SW00018 Kelley Park - Tennis Courts DrainageImprovements 0 - 74,000 - - - - - - -
SW00019 Kelley Park - Parking Lot DrainageImprovements 0 - 74,000 - - - - - - -
419

Stormwater Management FundProject List - Expenditures
FY22 Budget
Proj Project NameEst'd
CreditsFY20
ActualsFY21
Projection
FY21AdoptedBudget
FY22Request
FY23Request
FY24Request
FY25Request
FY26Request
5 YearRequest
Total
SW00020 Victory Farm Retrofit - WSSC 0 - - 457,931 49,135 417,931 387,000 - - 854,066
SW00021 Casey Community Site Installation 1 - - 62,000 - 37,000 110,000 91,000 - 238,000
SW00022 Brighton Weir Retrofit 120 - - 83,000 - 55,000 100,000 1,553,000 1,650,000 3,358,000
SW00023 Green Park Retrofit 6 - - 27,500 - - 57,500 160,500 456,500 674,500
SW00029 DI001 - 122 & 124 Woodland Road 0 - - 60,000 125,000 - - - - 125,000
SW00030 DI002 - 100 Water Street - StreamErosion 1 - - 501,000 - 501,000 400,000 350,000 - 1,251,000
SW00032 DI005 - 14 Chestnut Street - StormDrain Repair / Drain Imp. 0 - 50,000 10,000 - - - - - -
SW00033 Headwaters Drainage Study 0 - - 90,000 40,000 50,000 - - - 90,000
SW00034 Lake Kersten Repairs 0 - 31,250 53,200 89,635 200,595 - - - 290,230
SW00035 Lake Lynnette Repairs 0 - - 20,000 - 35,000 36,700 61,300 - 133,000
SW00036 Lake Placid Repairs 0 - 5,500 35,000 25,000 163,000 129,000 - - 317,000
Total 550 540,926 2,776,160 3,685,495 3,706,046 3,937,169 3,210,748 2,720,800 3,691,500 17,266,263
420

Forest Conservation FundFund OverviewFY22 Budget
Under the Maryland Natural Resources Code and City Code of Ordinances, the City has established a forestry in-lieu fee. This fee is charged when a developer cannot meet forest conservation planting requirements on-site. TheCity maintains a Forest Conservation Fund to account for the receipt and spending of forestry in-lieu fees.
The City’s fee is made up of two parts: the State of Maryland identified minimum (currently $0.30/sq ft in priorityfunding areas which include the City of Gaithersburg) to be adjusted annually for inflation by the State, and a Cityfee. The total fee is currently $3.00/sq ft. Eligible expenditures under Maryland Code are:
“Reforestation and afforestation, including the costs directly related to site identification, acquisition, pre-purchaseand preparation, maintenance of existing forests, and achieving urban canopy goals”
According to the City’s Code of Ordinances, in-lieu fees that exceed the State minimums may be used for anypurpose related to, and furthering the implementation of, the City’s urban forestry goals. For spending purposes, theCity considers the State and the City’s eligibility requirements to be the same and only expenditures meeting bothwill be charged to this fund.
This fund is overseen by staff within the Planning and Code Administration Department. There are no personnelcosts charged to this fund.
This section of the budget includes a fund overview and line item detail schedule.
421
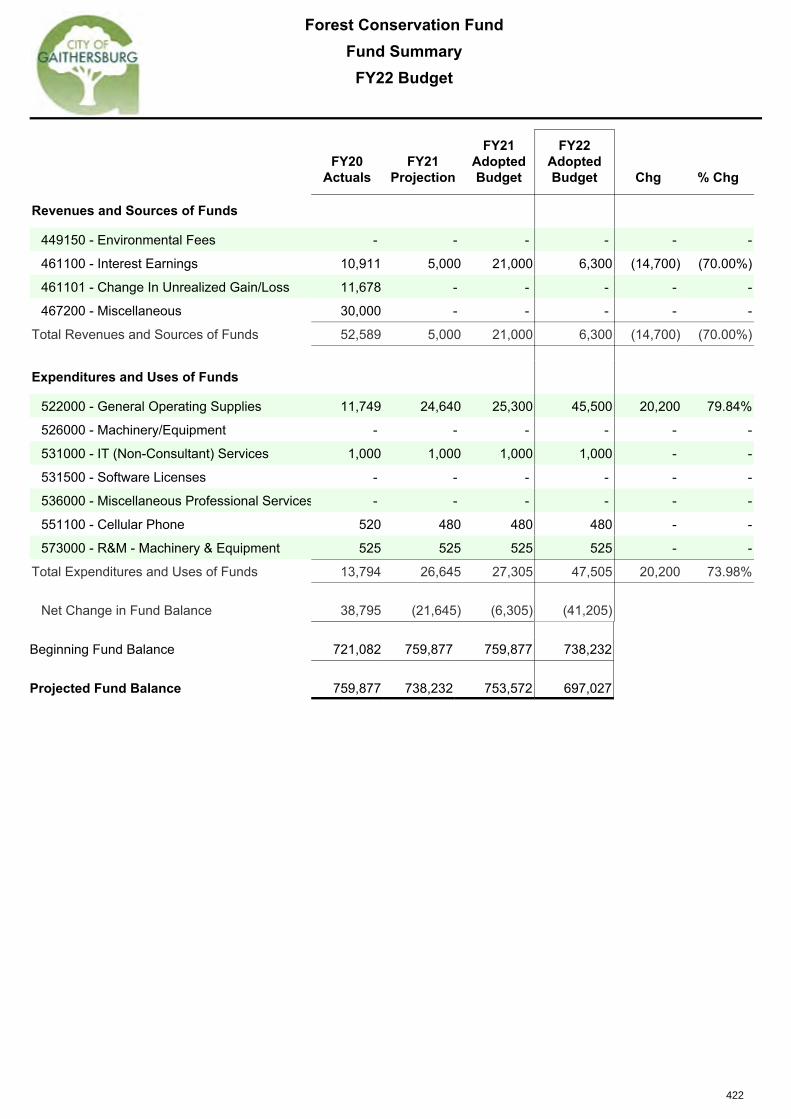
Forest Conservation FundFund Summary
FY22 Budget
FY20Actuals
FY21Projection
FY21AdoptedBudget
FY22AdoptedBudget Chg % Chg
Revenues and Sources of Funds
449150 - Environmental Fees - - - - - -
461100 - Interest Earnings 10,911 5,000 21,000 6,300 (14,700) (70.00%)
461101 - Change In Unrealized Gain/Loss 11,678 - - - - -
467200 - Miscellaneous 30,000 - - - - -
Total Revenues and Sources of Funds 52,589 5,000 21,000 6,300 (14,700) (70.00%)
Expenditures and Uses of Funds
522000 - General Operating Supplies 11,749 24,640 25,300 45,500 20,200 79.84%
526000 - Machinery/Equipment - - - - - -
531000 - IT (Non-Consultant) Services 1,000 1,000 1,000 1,000 - -
531500 - Software Licenses - - - - - -
536000 - Miscellaneous Professional Services - - - - - -
551100 - Cellular Phone 520 480 480 480 - -
573000 - R&M - Machinery & Equipment 525 525 525 525 - -
Total Expenditures and Uses of Funds 13,794 26,645 27,305 47,505 20,200 73.98%
Net Change in Fund Balance 38,795 (21,645) (6,305) (41,205)
Beginning Fund Balance 721,082 759,877 759,877 738,232
Projected Fund Balance 759,877 738,232 753,572 697,027
422

Forest Conservation FundObject Detail - Line Description
FY22 Budget
Operating Expenditures
FY22AdoptedBudget
522000 - General Operating Supplies
Street tree replacement 15,000
volunteer planting project 15,000
Public outreach seedlings 500
Watkins Mill Interchange Planting 15,000
Total 45,500
531000 - IT (Non-Consultant) Services
1,000
Total 1,000
551100 - Cellular Phone
480
Total 480
573000 - R&M - Machinery & Equipment
525
Total 525
Total Operating Expenditures 47,505
423

Asset Replacement FundFund OverviewFY22 Budget
The Asset Replacement Fund’s purpose is to accumulate funding for equipment, vehicles, and software systems thatwill need to be replaced in future years. This can be differentiated from the Capital Budget as the Capital Budgetaccumulates funding for buildings, land or land improvements, and infrastructure. New equipment and vehicles assetsare funded in the General Fund operating budget, unless associated with a capital project or stormwater uses.
Assets may be included in the Asset Replacement Fund if they individually cost more than $5,000 or if they would costmore than $5,000 when considered as a group of assets. Assets may be considered to be grouped together if they arelikely to be replaced at the same time or as a group/set. The Asset Replacement Fund has been further broken downinto several asset categories as follows:
• Gaithersburg Television – This category includes funding for assets used by the Gaithersburg Television activity,such as the cameras, editing system, and audio/visual equipment located in the Control Room, Council Chambers, andCity Hall Gallery. For operating purposes, this activity falls within and is managed by the Department of Community andPublic Relations.
• Information Technology and Security – This category includes funding for Citywide technology assets such as largesoftware applications, services, network infrastructure and storage, police in-squad video systems and radios, phonesystem, copiers, printers, computers, monitors, and scanners. This category is managed by the Department ofInformation Technology.
• Parks, Recreation and Culture – This category includes funding for assets found at the City’s recreational facilitiessuch as the Water Park, Activity Center, Senior Center, Youth Centers, Arts Barn, Mansion, and displays used for theWinter Lights event. Some examples of these assets include: the splash pool play structure, filters and pool interiors,and over 160 light displays. This category is managed by the Department of Parks, Recreation & Culture.
• Police Equipment – This category includes funding for assets used within police operations such as vests, tasers, K9units, guns, and rifles. This category is managed by the Department of Police.
• City Vehicles & Public Works Equipment – This category includes all City vehicles, playground assets and publicworks equipment. Some examples of these assets include: playground equipment at City parks, police cars, and snowand various yard equipment. This category is managed by the Department of Public Works.
Each category is supported by a detailed asset inventory list. This information is used to develop the funding neededfor each asset which can be thought of as approximating straight-line depreciation. Funding is accumulated until theasset has reached the end of its estimated life. At that point, the City would have the funds saved to replace the asset.The Asset Replacement Fund is funded through a transfer from the General Fund.
Although the asset inventory is used to calculate the amount needed to set aside annually, departments are notguaranteed the right to replace a fully funded asset simply because it is funded.
Assets are also not necessarily replaced simply because they have reached the end of the estimated life span.Individual departments would evaluate whether the asset can continue to be used and would only request to replacethose assets that need to be replaced due to obsolesce, inefficiency, and high incidence of repair.
In some years in the past, the City did not fully fund all of the asset replacement accounts. As a result, some of thereplacement accounts have less funding than their calculated balances. The FY22 funding represents the calculatedfunding using the asset inventory list plus 9% of the shortage in the City Vehicles and Public Works Equipmentreplacement category. This would allow for that category to be funded at the calculated balances over the next severalbudget cycles.
The following page summarizes the funding being added to each category, followed by the budgeted list of FY22purchases to be paid for out of this fund.
424

Asset Replacement FundFund Summary
FY22 Budget
Object - NameFY20
ActualsFY21
Projection
FY21AdoptedBudget
FY22AdoptedBudget Chg % Chg
Revenues and Sources of Funds
3810 - Gaithersburg TV AssetReplacement 31,000 28,000 28,000 46,000 18,000 64.29%
3820 - IT & Security Asset Replacement 459,000 532,000 532,000 770,000 238,000 44.74%
3830 - PR&C Asset Replacement 165,000 164,000 164,000 210,000 46,000 28.05%
3840 - Police Asset Replacement 36,000 49,000 49,000 61,000 12,000 24.49%
3850 - City Vehicle & PW AssetReplacement 1,797,000 1,546,300 1,546,300 2,097,000 550,700 35.61%
Total Revenues and Sources of Funds 2,488,000 2,319,300 2,319,300 3,184,000 864,700 37.28%
Expenditures and Uses of Funds
589000 - Transfer to Other Funds 630,000 - - - - -
595110 - Gaithersburg Television FAReplacement - - 52,000 - (52,000) (100.00%)
595120 - IT and Security FA Replacement 578,336 456,000 772,695 639,450 (133,245) (17.24%)
595130 - Parks, Rec, & Culture FAReplacement 19,688 212,576 205,924 200,052 (5,872) (2.85%)
595140 - Police Equipment FAReplacement 8,155 76,900 76,900 78,654 1,754 2.28%
595150 - City Vehicles & PW FAReplacement 1,263,822 1,287,000 1,287,300 1,672,750 385,450 29.94%
Total Expenditures and Uses of Funds 2,500,002 2,032,476 2,394,819 2,590,906 196,087 8.19%
Net Change in Fund Balance (12,002) 286,824 (75,519) 593,094
Projected Balance
3810 - Gaithersburg TV Asset Replacement 136,700 164,700 112,700 210,700
3820 - IT & Security Asset Replacement 3,370,366 3,446,366 3,129,671 3,576,916
3830 - PR&C Asset Replacement 1,099,492 1,050,916 1,057,568 1,060,864
3840 - Police Asset Replacement 133,787 105,887 105,887 88,233
3850 - City Vehicle & PW Asset Replacement 6,923,039 7,182,339 7,182,039 7,606,589
Total Projected Balance 11,663,384 11,950,208 11,587,865 12,543,302
425

Asset Replacement FundPurchase Requests
FY22 Budget
Category and Description Age LocationUnitNo. Qty
UnitCost
FY22Request
3820 - IT & Security Asset Replacement
Budget System 1 1145 1 250,000 250,000
Storage Server 1 1145 1 110,000 110,000
Desktops/laptops 1 1145 60 1,000 60,000
Network switches for City Hall 1 1145 1 50,000 50,000
PW project manager & police laptops 1 1145 10 1,600 16,000
IT staff desktops 1 1145 10 1,500 15,000
Fishman building public safety camera node 1 1145 1 7,500 7,500
Monitoring server 1 1145 1 5,000 5,000
Security cameras 1 1145 5 850 4,250
Misc. hardware contingency (due to equipmentfailures) 1 1145 1 20,000 20,000
Council Chambers Computers (15) 1 1145 0 1 14,500 14,500
Council Chambers Monitors (15) 1 1145 0 1 3,400 3,400
Police Desktop Replacements (21) 1 1145 0 1 20,300 20,300
Police Laptop Replacements (13) 1 1145 0 1 21,100 21,100
Police Desktop-to-Laptop Conversions (13) 1 1145 0 1 21,100 21,100
Police Docking Stations (26) 1 1145 0 1 6,800 6,800
Cable Control Room Replacement UPSs and PDUsfor 16 S. Summit 1 1145 0 1 10,000 10,000
HR card printer 1 1146 1 4,500 4,500
Total 99 549,150 639,450
3830 - PR&C Asset Replacement
OTYC Control Room APC Back-UPS Pro 1500 13 1424 0 1 180 180
OTYC Control RoomApogee Big Ben Master Digital Clock 13 1424 0 1 2,095 2,095
OTYC Control RoomAvid HD I/O 13 1424 0 2 4,000 8,000
OTYC Control RoomAviom A-16D Pro A-Net Distributor 13 1424 0 1 1,200 1,200
OTYC Control RoomAviom AN-16/i 13 1424 0 1 1,199 1,199
OTYC Control RoomC 24 Avid Control Surface 13 1424 0 1 47,000 47,000
OTYC Control RoomEmpirical Labs EL8-X Distressor 13 1424 0 2 1,800 3,600
426

Asset Replacement FundPurchase Requests
FY22 Budget
Category and Description Age LocationUnitNo. Qty
UnitCost
FY22Request
3830 - PR&C Asset Replacement
OTYC Control RoomFocusrite 8 Channel Pre ISA828 13 1424 0 2 2,700 5,400
OTYC Control RoomFurman M-8XL Power Conditioner 13 1424 0 1 150 150
OTYC Control RoomFurman M-8X Power Conditioner 13 1424 0 2 45 90
OTYC Control RoomGlyph GT062 External Hardrive 13 1424 0 2 200 400
OTYC Control RoomJBL Professional 12" Subwoofer 13 1424 0 1 1,700 1,700
OTYC Control RoomJBL Professional 8" Studio Monitors 13 1424 0 1 4,000 4,000
OTYC Control RoomM-Audio Computer Speakers 13 1424 0 1 150 150
OTYC Control RoomSwitch Craft Studio Patch 9625 13 1424 0 8 495 3,960
OTYC Control RoomUniversal Audio 1176LN Limiting Amplifier 13 1424 0 1 2,000 2,000
OTYC Control Roomuniversal Audio T4 Leveling Amplifier 13 1424 0 1 2,000 2,000
OTYC Control RoomUniversal Sequencing Controller 13 1424 0 1 684 684
OTYC Control RoomA-16II Aviom 13 1424 0 8 400 3,200
OTYC Amp & PA StudioFender Frontman 10G Guitar Amp 13 1424 0 1 60 60
OTYC Amp & PA StudioDinosaur Sound DB20 13 1424 0 1 100 100
OTYC Amp & PA StudioFender Frontman 212R Guitar Amp 13 1424 0 1 350 350
OTYC Amp & PA StudioFender Rumble 15 Bass Amp 13 1424 0 1 80 80
OTYC Amp & PA StudioYorkville Powered Elite Loudspeaker LS800P 13 1424 0 1 1,100 1,100
OTYC Control RoomQSC RMX2450 Professional Amplifier 13 1424 0 1 900 900
OTYC Control RoomQSC RMX 2450 Professional Amplifier 13 1424 0 1 900 900
Cross Trainer - Precor E546 9 1426 1 5,000 5,000
Cross Trainer-CLSX Life Fitness (w/arms) 9 1426 0 1 4,500 4,500
427

Asset Replacement FundPurchase Requests
FY22 Budget
Category and Description Age LocationUnitNo. Qty
UnitCost
FY22Request
3830 - PR&C Asset Replacement
SM/MD-sized Display 20+ 1430 0 1 1,838 1,838
SM/MD-Sized Display 20+ 1430 0 1 1,977 1,977
MD-Sized Display 20+ 1430 0 1 9,288 9,288
MD-Sized Display 20+ 1430 0 1 9,345 9,345
MD-Sized Display 20+ 1430 0 1 9,683 9,683
MD/LG-Sized Display 20+ 1430 0 2 11,688 23,376
MD/LG-Sized Display 20+ 1430 0 1 12,811 12,811
LG-Sized Display 20+ 1430 0 1 16,656 16,656
LG-Sized Display 20+ 1430 0 1 15,080 15,080
Total 57 173,354 200,052
3840 - Police Asset Replacement
Ballistic Vests 5 1211 9 1,300 11,700
Rifles Plates & Carriers 5 1211 7 812 5,684
Taser CEWs 5 1211 28 1,300 36,400
Patrol Rifles 10 1211 10 2,487 24,870
Total 54 5,899 78,654
3850 - City Vehicle & PW Asset Replacement
2013 Chevy Impala 7 1150 2240 1 29,500 29,500
2013 Chevy Impala 7 1150 2250 1 29,500 29,500
2014 Chevy Facilities Van 7 1150 2260 1 52,500 52,500
2015 Chevy Facilities Van 6 1150 2270 1 52,500 52,500
2013 Ford Explorer 7 1196 1502 1 38,500 38,500
2013 Ford Explorer 8 1196 1505 1 38,500 38,500
2012 Chevy Impala 9 1197 1400 1 29,500 29,500
2012 Chevy Impala 9 1197 1401 1 29,500 29,500
2012 Chevy Impala 9 1197 1404 1 29,500 29,500
2012 Chevy Animal Control Van 9 1198 2185 1 40,000 40,000
2012 Animal Control Van 9 1198 2195 1 40,000 40,000
2012 Dodge Charger (unmarked) 7 1211 7862 1 50,250 50,250
2015 Ford Explorer (unmarked) 6 1211 7864 1 50,250 50,250
2014 Ford Focus (Parking Enforcement Car) 7 1211 7865 1 29,500 29,500
2016 Ford Explorer (unmarked) 5 1211 7869 1 50,250 50,250
428

Asset Replacement FundPurchase Requests
FY22 Budget
Category and Description Age LocationUnitNo. Qty
UnitCost
FY22Request
3850 - City Vehicle & PW Asset Replacement
2016 Ford Explorer (marked) 5 1211 7874 1 53,500 53,500
American Signal Speed Board 9 1211 7005 1 6,650 6,650
2008 Bucket Truck 13 1312 2406 1 150,000 150,000
2011 John Deere (Rubber Tire Loader) 10 1312 5497 1 205,000 205,000
1985 Hudson Open Trailer 20+ 1312 6433 1 8,000 8,000
2010 Ingersol Air Compressor 10 1312 6439 1 16,000 16,000
Skid Loader Breaker Attachment 20+ 1312 0 1 10,000 10,000
2009 Chevy One Ton Dump 12 1341 2530 1 85,000 85,000
2014 Exmark Riding Mower 7 1343 8921 1 11,500 11,500
2014 Exmark Riding Mower 7 1343 8922 1 11,500 11,500
2008 Ballfield Trailer (16ft) 13 1343 6965 1 7,200 7,200
2009 Ryan Sod Cutter 12 1343 9605 1 5,500 5,500
Park Structures Playground (2) 5 to 12 and 2 to 5 agegroups. ($150,000 Program Open Space Funds) 20 1343 0 1 195,000 195,000
2011 Toro 5910 Wide Area Mower 10 1343 8919 1 125,000 125,000
2010 Leaf Vac Swap Loader 11 1344 6650 1 55,000 55,000
2008 Hudson Box Trailer 13 1344 6500 1 10,200 10,200
Pull Behind Leaf Vac 15 1344 6652 1 55,000 55,000
2013 Exmark Riding Mower 8 1344 8431 1 11,500 11,500
2014 Exmark Riding Mower 7 1344 8432 1 11,500 11,500
2008 Box Mowing Trailer 13 1344 6449 1 10,200 10,200
Titan Line Painter 13 1397 9410 1 10,250 10,250
2008 Chevy Impala 13 1411 1112 1 29,500 29,500
Total 37 1,672,750 1,672,750
429

Housing Program FundFund OverviewFY22 Budget
The City established the Housing Program Fund in FY18 to provide greater transparency for the Housing Initiatives Fund (HIF), for funding dedicated to the Gaithersburg Homeownership Assistance Loan Program (GHALP), and for other affordable housing-related projects approved by the City Council. This fund is managed by the Housing and Community Development staff in the Office of the City Manager.
Housing Initiatives Fund Revenue (HIF)
Initially funded by the Crown Farm developer, the Housing Program Fund collects funds to support affordable housing projects for low and moderate income (LMI) residents. The City Council has approved a fee-in-lieu payment from several developers which is held in the Housing Program Fund. Future revenues will be recognized from any profits from the sale of a Moderately Priced Dwelling Unit (MPDU) or Work Force Housing Unit (WFHU) following expiration of the 30 year control period. Except for HUD revenue from CDBG-funded loans, repayments from the City’s GHALP program will go back into the Housing Program Fund.
HIF Expenditures
In FY22, significant planned expenditures include HIF funds of $250,000 for expanded homeownership opportunities in areas of the City outside of HUD designated LMI census blocks; $600,000 in loans to developers offering affordable housing opportunities in the City; $1,500,000 in loans to multi-family property owners adding approved upgrades to their properties; and other miscellaneous projects including deferred loans to residential property owners wishing to add accessibility enhancements to their homes.
Operating Expenditure Descriptions
Housing Initiatives Expenditures – Expenditures within this budget category would be funded from money received under the City’s HIF.
GHALP Loans – Qualified buyers are eligible for up to $12,000 or $25,000 using a combination of HIF funds, City Fund expenditures and/or CDBG funds.
Community Development Block Grant (CDBG) Expenditures – Expenditures within this budget category would be funded by the federal government through CDBG funding. Funds used under this program carry eligibility criteria, and loan repayments received from loans made with these funds must comply with CDBG program restrictions.
City Fund Expenditures – Expenditures within this budget category would be funded from the City’s General Fund. This funding satisfies any match requirements under the CDBG program and may be used for households up to 100 percent of area median income (AMI). Repayments from these loans are expected to remain within this fund for the GHALP program or other affordable housing programs as approved by the City Council.
430

Housing Program FundFund Summary
FY22 Budget
FY20Actuals
FY21Projection
FY21AdoptedBudget
FY22AdoptedBudget Chg % Chg
Revenues and Sources of Funds
433100 - Federal Grant - CDBG 171,181 100,000 100,000 298,489 198,489 198.5%
461100 - Interest Earnings 45,185 20,000 50,000 25,200 (24,800) (49.6%)
461101 - Change In Unrealized Gain/Loss 47,955 - - - - -
461500 - Interest on Loans 38,855 - 14,720 29,440 14,720 100.0%
467280 - Housing Initiative Fund 142,377 - - - - -
499000 - Transfer In - From General Fund 240,000 240,000 240,000 240,000 - -
Total Revenues and Sources of Funds 685,553 360,000 404,720 593,129 188,409 46.6%
Expenditures and Uses of Funds
560000 - Miscellaneous 11,900 - 1,175,000 2,100,000 925,000 78.7%
562000 - Homeownership AssistanceProgram - 250,000 590,000 788,489 198,489 33.6%
Total Expenditures and Uses of Funds 11,900 250,000 1,765,000 2,888,489 1,123,489 63.7%
Net Change in Fund Balance 673,653 110,000 (1,360,280) (2,295,360)
Beginning Fund Balance 7,484,515 15,642,683 8,158,168 8,268,168
Projected Balance 8,158,168 8,268,168 6,797,888 5,972,808
431

Housing Program FundObject Detail - Line Description
FY22 Budget
Operating Expenditures
FY22AdoptedBudget
560000 - Miscellaneous
Developer loans 600,000
M/F loans 1,500,000
Total 2,100,000
562000 - Homeownership Assistance Program
Homeownership Assistance Program - CDBG 225,000
Homeownership Assistance Program - HIF loan transfer 250,000
Homeowner Rehabilitation Program - CDBG 73,489
Homeownership Assistance Program - City Funded 240,000
Total 788,489
Total Operating Expenditures 2,888,489
432

Glossary
FY22 Budget
Definitions of terms used in the Operating Budget and Capital Improvements Plan are listed below and on the pages that follow. 401 (a). City of Gaithersburg’s Money Purchase Retirement Plan. 401 (a) Money Purchase Supplemental Retirement Plan. This retirement plan is available to 40 hour employees that have physically demanding jobs. This retirement plan has a gradual vesting schedule; and employees are fully vested after 10 years of service. 401 (k). City of Gaithersburg’s salary deferral Savings Plan. 457 Plan. City of Gaithersburg’s Deferred Compensation Plan Accounting System. The total structure of records and procedures, which identify, record, classify, summarize, and report information on the financial position and results of operations of the City. Accrual Basis of Accounting. The method of accounting where transactions are recognized when they occur, regardless of the timing of related cash flows. ADA. Americans with Disabilities Act. Ad Valorem. Imposed at a percentage rate of property value. Annexation. The incorporation of additional land within the domain of the City. Annual Comprehensive Financial Report. The Annual Comprehensive Financial Report is the governmental unit’s official annual financial statements report. Appropriation. An authorization made by the Mayor and Council that permits City Departments to make expenditures of governmental resources for specific purposes within a specific time frame. Assessable Base. The total value of all real and personal property in the City, which is used as a basis for levying taxes. Tax exempt property is excluded from the assessable base. Assessed Valuation. A percentage of appraisal value assigned to real estate and personal property for use as a basis of levying property taxes. Assigned Fund Balance. Fund balance amounts that are constrained by the City’s intent to be used for specific purposes. Assets. Resources owned or held by the City, which have a monetary value. Audit. A formal examination of an organization's or individual's accounts or financial situation. Balanced Budget. A budget in which revenues, including the use of fund balance, are equal to or greater than expenditures. Budget. A plan of financial operation comprised of an estimate of expenditures for a fiscal year and the means of financing those expenditures to fund City services. Budget Year. The Fiscal year (July 1st through June 30th) for which the budget is adopted. CARES Act. Coronavirus Aid, Relief, and Economic Security Act; US law providing economic stimulus to counteract the impacts of the COVID-19 pandemic. Capital Budget. The annual adoption by the Mayor and Council of project appropriations used for the acquisition or construction of major capital facilities. Capital budgets may include multi-year contracts for which a total appropriation covering several years’ planned expenditures are required.
433

Glossary
FY22 Budget
Capital Outlay. Expenditures which may result in the acquisition of, or addition to, fixed assets. Any item with an expected life of more than one year and a value of more than $500 is considered a capital outlay. Capital Improvements Plan (CIP). The annual plan or schedule of project expenditures for public facilities and infrastructure with estimated project costs, sources of funding, and timing of work over a five-year period. COG. Council of Governments Committed Fund Balance. Fund balance amounts that can only be used for specific purposes pursuant to constraints imposed by the formal action of the Mayor & City Council. Community Development Block Grant (CDBG). A Federal grant program administered by the U. S. Department of Housing and Urban Development. Constant Yield. The tax rate that maintains the revenue from property taxes at the same level as the prior year. This rate is computed by the State Department of Assessments and Taxation each year on the basis of the new, adjusted assessable base for each jurisdiction. New property appearing on the tax rolls for the first time is excluded from the calculation. Contingency. Funds budgeted for use in unforeseen circumstances. Department. A major administrative unit of the City which indicates overall management responsibility for an operation or group of related operations within a functional area. Depreciation. An allocation made for the decrease in value of physical assets through wear, deterioration, or obsolescence. DeSellum. One of the oldest families in the City of Gaithersburg. The family owned a sod turf farm which was used at the White House and the land from which many of the City’s neighborhoods were formed. Distinguished Budget Presentation Award Program. A voluntary program administered by the Government Finance Officers Association (GFOA) to encourage governments to publish efficiently organized and easily readable budget documents and to provide peer recognition and technical assistance to the fiscal officers preparing them. Division. An area of the governmental activity organized as an administrative or functional unit within a department. Encumbrance. Obligations incurred in the form of purchase orders, contracts, and similar items that will become payable when goods are delivered or services rendered. Enterprise Funds: Funds used to account for activities which are expected to be 100% self supporting through user charges. Escrow. Money or a bond held by the City for fulfillment of certain conditions, or construction agreements. Expenditure. An amount of money disbursed for the purchase of goods and services. Fees and Credits. Income from any billable service or sale made by the City; for example, program registration fees, permit fees, and licenses. Fiduciary Funds. Funds that cannot be used to support the government’s own programs. It includes pension trust funds and agency funds. Fiscal Year (FY). Any yearly accounting period, regardless of its relationship to a calendar year. The fiscal year for the City begins on July 1 of each year and ends on June 30 of the following year; it is designated by the calendar year in which it ends. For example, fiscal year 2011 began on July 1, 2010, and ended on June 30, 2011. Fixed Assets. Assets of a long-term character, which are intended to continue to be held and used by the City. Examples of fixed assets include items such as land, buildings, machinery, furniture, and other equipment costing $5,000 or more.
434
Glossary
FY22 Budget
Fringe Benefits. Employer payments for social security, retirement, group health, dental insurance, and life insurance. FTE. Full-Time Equivalent positions calculated by dividing hours of work per year by the number of hours worked per year by a full-time employee. Fund. A financial entity to account for revenues and expenditures which are segregated for the purpose of conducting specific operations for attaining certain objectives in accordance with special regulations, restrictions, or limitations and constituting an independent fiscal and accounting entity. Fund Balance. The excess of assets over liabilities for governmental fund types, sometimes called surplus or reserves. Fund balance can also be thought of as the cumulative balance of revenues exceeding expenditures. General Fund. The general operating fund that is used to account for all financial resources except for those required to be accounted for in another fund. This is the principal fund of the City and accounts for the normal recurring activities of the City. Geographic Information System (GIS). The system is used to analyze or display data spatially. GIS most often is represented in the form of multiple pieces of information displayed on a map. Governmental Accounting Standards Board (GASB). The independent agency established under the Financial Accounting Foundation in 1984 as the official body designated to set accounting and financial reporting standards for state and local governments. Governmental Fund Types. Funds which measure changes in financial position, rather than net income. The City includes the majority of its activities in the General Fund and the Capital Projects Fund. Government Finance Officers Association (GFOA). An association of public finance professionals founded in 1906 as the Municipal Finance Officers Association. Grant. A county, state, or federal financial assistance award making payment in cash or in kind for a specified program. HVAC. Heating, Ventilation, and Air Conditioning. HUD. U.S. Department of Housing and Urban Development. ICMA. International City Manager’s Association. Infrastructure. The physical assets of the City (streets, sidewalks, buildings, etc.). Intergovernmental Revenues. Revenues from other governments in the form of grants, entitlements, shared revenues, or payments in lieu of taxes. Investments. Securities, bonds, and real property held for the production of revenues in the form of interest, dividends, and rental or lease payments. Levy. (Verb) To impose taxes for the support of City government activities. (Noun) The total amount of taxes imposed by the City government. Liabilities. Obligations incurred in past or current transactions requiring present or future settlement. Line Item. Detailed expenditure classification established to budget and account for specific goods and services. MHz. Megahertz. Mission Statement. A brief description of the purpose and functions of a department.
435

Glossary
FY22 Budget
Mobile Data Terminal (MDT). An MDT is essentially a mobile computer. The City deploys MDT's in police cars for access to critical public safety information. Modified Accrual Basis of Accounting. Under the modified accrual basis of accounting, revenues are recognized when measurable and available as current assets. Expenditures are generally recognized when the related services or goods are received and the liability is incurred. The City’s governmental funds use the modified accrual basis of accounting. MOU. Memorandum of understanding. N/A. Not available. Non-Departmental Expenditures. Operating expenditures which are not charged directly to specific departments but are a cost to the City as a whole, such as general liability and casualty insurance. Object Classification. A grouping of line items on the basis of the type of goods or services purchased; for example, personal services, operating, and capital outlay. Objectives. Measurable statements of what a program will accomplish to achieve Citywide goals and desired community outcomes. Obligation. A future expenditure requirement incurred by voluntary agreement or legal action. Ordinance. A formal legislative enactment by the City Council. If it is not in conflict with any higher form of law, such as a state statute or constitutional provision, it has the full force and effect of law within the boundaries of the City. Other Post-Employment Benefits (OPEB). Post-employment benefits provided by an employer to plan participants, beneficiaries and covered dependents through a plan or other arrangement that is separate from a plan to provide retirement income. OPEB also include post-employment health care benefits provided through a public employee retirement system or pension plan. In addition to post-employment health care benefits (such as illness, dental, vision and hearing), OPEB may include life insurance and disability income. Pay-As-You-Go. Capital expenditures included in the Capital Improvements Plan, which are fully funded by contributions from the General Fund, State Government or County Government. Per Capita. Per unit of population; by or for each person in the City. Personnel Services. Expenditures, which include salary costs for full-time, part-time, and employment agreements, overtime expenditures, and all associated fringe benefits. Program Open Space. A grant program offered by the State of Maryland for the acquisition and development of raw land to park use. Property Tax. A tax levied on all real and certain personal property, tangible and intangible, according to the property’s assessed valuation. Proprietary Fund. A fund type established for those activities which are designed to recover all costs through user fees. Purchase Order. A document, which authorizes the delivery of specified merchandise or the rendering of certain services and the making of charge for them. Reappropriation. Statutory action to continue the availability, whether for the same or different purposes, of all or part of the unobligated portion of a budget into the next fiscal year. Reserves. See Fund Balance
436

Glossary
FY22 Budget
Resolution. A special or temporary order of the City Council; an order requiring less legal formality than an ordinance or statute. Resources. The actual assets of the City, such as cash, taxes, receivables, land and buildings, including estimated revenues applying to the current fiscal year. Restricted Fund Balance. Fund balance amounts that can only be used for specific purposes, when the constraint has been placed on the use by third parties or enabling legislation. Revenue. Monies received or collected by the City as income, including such items as tax payments, fees, receipts from other governments, fines, forfeitures, and interest income. Self-Insurance. Refers to the City’s participation in the Montgomery County self-insurance fund. Self-insurance allows the City to closely realize the actual claim experience as well as pool insurance buying power with other participating agencies. Stipend. A fixed and regular payment, such as a salary for services rendered or an allowance. Stormwater Management. A means of controlling the quantity and quality of stormwater runoff. Strategic Plan. A plan adopted by the City Council which establishes a City government mission statement, a number of high priority strategic goals, and specific strategies and objectives required to achieve the goals. Structurally Balanced Budget. A budget in which recurring revenues meet or exceed recurring expenditures. Tangible Personal Properties. It is everything used in business and other income generating occupations, it includes: machinery, equipment, furniture and fixtures, but does not include real estate. Tax Base. The part of the economy against which a tax is levied. Tax Duplication. A state of affairs whereby both Montgomery County and the City of Gaithersburg levy property taxes on property in Gaithersburg to pay for services rendered by the City. The County makes a lump sum payment to the City as a mechanism for alleviating the inequities otherwise created by the duplicate taxation. Taxes. Mandatory charge levied by the City for the purpose of financing services performed for the common benefit. Tax Rate. The amount levied per $100 of assessed property value, as determined by the State assessor, on property within the City of Gaithersburg. Transfer. Payments made from one operating fund to another as a contribution to defray the recipient fund’s costs. Trust Fund. Property (such as money or securities) settled or held in trust. UASI. Urban area security initiative. Unassigned Fund Balance. The residual classification for General Fund, fund balance. This category of fund balance represents fund balance that has not been assigned to other funds and that has not been restricted, committed or assigned to specific purposes within the General Fund. User Fees. Charges for services, such as the use of public property, paid by those actually benefiting from the service. Vision. A long-term desired end state. Zoning. The partitioning of the City by ordinance into sections reserved for different purposes (e.g. residential, commercial, and historic).
437

Snowman at Kentlands Main Street Pavilion
438

AppendixCIP Project Summary
FY22 Budget
FY21 FY22 FY23 FY24 FY25 FY26 Total All Years
BegBalance
ProjectedRevenue
ProjectedExpend
EndingBalance
RevenueBudget
ExpendBudget
EndingBalance
RevenueBudget
ExpendBudget
EndingBalance
RevenueBudget
ExpendBudget
EndingBalance
RevenueBudget
ExpendBudget
EndingBalance
RevenueBudget
ExpendBudget
EndingBalance Total Rev Expend
General Capital Projects
0000001 - Frederick Ave - Demolition 17,857 - 17,857 - - - - - - - - - - - - - - - - - 17,857
0000002 - Future Property Acquisitionand Disposition 862,487 - - 862,487 - - 862,487 - - 862,487 - - 862,487 - - 862,487 - - 862,487 - -
0000004 - Olde Towne Plaza 534,911 - 294,560 240,351 - 233,440 6,911 - - 6,911 - - 6,911 - - 6,911 - - 6,911 - 528,000
0000005 - Contingency 1,077,057 1,472,259 284,678 2,264,638 3,547,170 3,670,000 2,141,808 300,000 310,000 2,131,808 300,000 300,000 2,131,808 300,000 300,000 2,131,808 300,000 300,000 2,131,808 6,219,429 5,164,678
0000006 - Future Edison Park DrProject 1,000,000 - 1,000,000 - - - - - - - - - - - - - - - - - 1,000,000
0000007 - Gaithersburg Police Station 12,677,619 1,000,000 10,762,547 2,915,072 - 2,723,557 191,515 - 4,163 187,352 - - 187,352 - - 187,352 - - 187,352 1,000,000 13,490,267
0000008 - Crown Farm Historic Park 2,536,961 - 733,400 1,803,561 - 248,360 1,555,201 - 240,000 1,315,201 - - 1,315,201 - - 1,315,201 - - 1,315,201 - 1,221,760
0000009 - Future Energy Efficiencyand Conservation Projects 853,056 - - 853,056 - - 853,056 100,000 250,000 703,056 100,000 250,000 553,056 100,000 250,000 403,056 100,000 250,000 253,056 400,000 1,000,000
0000010 - Discovery Park -MedImmune 134,066 - 134,066 - - - - - - - - - - - - - - - - - 134,066
0000011 - Pleasant View Park - CPSC 5,533,159 - 125,000 5,408,159 - 3,767,400 1,640,759 575,000 2,200,000 15,759 - - 15,759 - - 15,759 - - 15,759 575,000 6,092,400
0000114 - Mayor and City CouncilChambers 2,523,387 - 1,194,830 1,328,557 - 996,169 332,388 - 1,112 331,276 - - 331,276 - - 331,276 - - 331,276 - 2,192,111
0000132 - Rolling Stock Relocation 75,980 - - 75,980 - 70,000 5,980 10,000 15,000 980 - - 980 - - 980 - - 980 10,000 85,000
0000135 - Olde Towne - Fiber DuctBank Installation Project 141,187 205,000 268,895 77,292 15,000 88,205 4,087 - - 4,087 - - 4,087 - - 4,087 - - 4,087 220,000 357,100
0000149 - Buildout of 16 South SummitAvenue - 450,000 - 450,000 - 45,000 405,000 50,000 440,000 15,000 100,000 110,000 5,000 - - 5,000 - - 5,000 600,000 595,000
0000150 - Installation of Banner Poles - 80,000 80,000 - - - - - - - - - - - - - - - - 80,000 80,000
0000151 - LED Streetlight Conversion - 298,758 295,695 3,063 565,407 565,407 3,063 799,960 799,960 3,063 799,960 799,960 3,063 266,653 266,653 3,063 - - 3,063 2,730,738 2,727,675
General Capital Projects Fund Total 27,967,727 3,506,017 15,191,528 16,282,216 4,127,577 12,407,538 8,002,255 1,834,960 4,260,235 5,576,980 1,299,960 1,459,960 5,416,980 666,653 816,653 5,266,980 400,000 550,000 5,116,980 11,835,167 34,685,914
Infrastructure
0000012 - Annual Street Light Program 504,801 - 75,000 429,801 125,000 135,000 419,801 - 135,000 284,801 125,000 135,000 274,801 - 135,000 139,801 125,000 135,000 129,801 375,000 750,000
0000014 - Relamping of City Lights 34,255 - - 34,255 - - 34,255 96,000 96,000 34,255 - - 34,255 - - 34,255 96,000 96,000 34,255 192,000 192,000
0000017 - East Darby Ct - SidewalkRehab 50,000 - 50,000 - - - - - - - - - - - - - - - - - 50,000
0000018 - East Side of NIST - Multi-Use Path 120,000 - - 120,000 - - 120,000 330,000 450,000 - 1,800,000 1,800,000 - - - - - - - 2,130,000 2,250,000
0000020 - QOP to Conservation Ln -Bicycle Connections 208,689 - - 208,689 - - 208,689 - - 208,689 - 100,000 108,689 245,000 350,000 3,689 - - 3,689 245,000 450,000
0000021 - Washingtonian Blvd -Bicycle Connections 573,673 - 133,455 440,218 1,460,000 1,895,535 4,683 - - 4,683 - - 4,683 - - 4,683 - - 4,683 1,460,000 2,028,990
0000024 - I-370 - Bicycle Connection 50,000 10,000 - 60,000 - - 60,000 - - 60,000 400,000 400,000 60,000 1,600,000 1,600,000 60,000 - - 60,000 2,010,000 2,000,000
0000025 - Annual Sidewalk Projects 485,596 136,188 394,533 227,251 50,000 270,000 7,251 250,000 200,000 57,251 200,000 200,000 57,251 200,000 200,000 57,251 200,000 200,000 57,251 1,036,188 1,464,533
0000026 - Lakelands –WashingtonianWoods - Bicycle Connection 30,000 15,000 - 45,000 10,000 45,000 10,000 400,000 10,000 400,000 550,000 400,000 550,000 1,300,000 550,000 1,300,000 - 1,300,000 - 2,275,000 2,305,000
0000027 - Olde Towne Streetscape 923,113 923,113 - - - - - - - - - - - 923,113
0000028 - Pavement Re-survey 185,620 100,000 186,500 99,120 - - 99,120 100,000 193,325 5,795 100,000 - 105,795 100,000 200,491 5,304 100,000 - 105,304 500,000 580,316
0000029 - Road PreventativeMaintenance 1,965 206,000 206,000 1,965 212,000 212,000 1,965 218,000 218,000 1,965 225,000 225,000 1,965 232,000 232,000 1,965 240,000 240,000 1,965 1,333,000 1,333,000
0000030 - Preventive MaintenanceProgram Collectors & Arterials 675,980 617,000 617,000 675,980 - 636,000 39,980 654,000 654,000 39,980 675,000 675,000 39,980 694,000 694,000 39,980 715,000 715,000 39,980 3,355,000 3,991,000
0000031 - Street Resurfacing Program 778,925 942,000 1,232,000 488,925 1,267,000 1,267,000 488,925 1,302,000 1,302,000 488,925 1,345,000 1,345,000 488,925 1,383,000 1,383,000 488,925 1,427,000 1,427,000 488,925 7,666,000 7,956,000
439

AppendixCIP Project Summary
FY22 Budget
FY21 FY22 FY23 FY24 FY25 FY26 Total All Years
BegBalance
ProjectedRevenue
ProjectedExpend
EndingBalance
RevenueBudget
ExpendBudget
EndingBalance
RevenueBudget
ExpendBudget
EndingBalance
RevenueBudget
ExpendBudget
EndingBalance
RevenueBudget
ExpendBudget
EndingBalance
RevenueBudget
ExpendBudget
EndingBalance Total Rev Expend
Infrastructure
0000032 - Future StreetReconstruction 4,693,740 269,909 - 4,963,649 500,000 1,750,000 3,713,649 500,000 500,000 3,713,649 500,000 - 4,213,649 500,000 - 4,713,649 500,000 - 5,213,649 2,769,909 2,250,000
0000033 - East Deer Park Drive -Street Rehab 246,796 - 246,796 - - - - - - - - - - - - - - - - - 246,796
0000034 - QOB Street Rehab -Diamond Dr to First Field Rd 2,267,533 - - 2,267,533 - 1,670,000 597,533 - - 597,533 - - 597,533 - - 597,533 - - 597,533 - 1,670,000
0000037 - N. Summit Ave and BrookesAve - Signal Recon 265,032 200,000 435,000 30,032 - - 30,032 - - 30,032 - - 30,032 - - 30,032 - - 30,032 200,000 435,000
0000038 - Future SignalReconstruction 642,940 4,385 25,000 622,325 200,000 35,000 787,325 200,000 425,000 562,325 200,000 490,000 272,325 200,000 75,000 397,325 425,000 750,000 72,325 1,229,385 1,800,000
0000039 - E. Diamond Ave andChestnut St - Signal Recon 60,000 - - 60,000 - - 60,000 - - 60,000 - - 60,000 - - 60,000 360,000 410,000 10,000 360,000 410,000
0000042 - Annual Long Span BridgesProgram 248,765 - 8,215 240,550 - - 240,550 - 60,000 180,550 - - 180,550 - - 180,550 - - 180,550 - 68,215
0000045 - Future Bridges & CulvertsProjects 1,678,806 - 567,420 1,111,386 - 465,000 646,386 150,000 350,000 446,386 150,000 350,000 246,386 200,000 350,000 96,386 300,000 350,000 46,386 800,000 2,432,420
0000115 - Kentlands Blvd - CrosswalkModifications 25,000 16,000 41,000 - - - - - - - - - - - - - - - - 16,000 41,000
0000131 - Pedestrian Path over GreatSeneca Highway 706,978 1,752,920 - 2,459,898 - 525,000 1,934,898 1,800,000 3,600,000 134,898 - - 134,898 - - 134,898 - - 134,898 3,552,920 4,125,000
0000136 - Bureau Drive CulvertMaintenance Repair 12,500 240,500 - 253,000 - 250,000 3,000 - - 3,000 - - 3,000 - - 3,000 - - 3,000 240,500 250,000
0000137 - Diamond Drive CulvertMaintenance Repair Project 332,500 - - 332,500 - 250,000 82,500 - - 82,500 - - 82,500 - - 82,500 - - 82,500 - 250,000
0000138 - Inspiration Lake DockReplacement 75,000 20,000 10,000 85,000 - 85,000 - - - - - - - - - - - - - 20,000 95,000
0000140 - Upshire Cir. CulvertMaintenance Repair Project 12,500 50,500 - 63,000 - 60,000 3,000 - - 3,000 - - 3,000 - - 3,000 - - 3,000 50,500 60,000
0000141 - Victory Farm Drive CulvertMaintenance Project 12,500 150,000 - 162,500 - 150,000 12,500 - - 12,500 - - 12,500 - - 12,500 - - 12,500 150,000 150,000
0000142 - ZC22CPR - TschiffelySquare Road Culvert MaintenanceRepair (2,531) 30,000 25,480 1,989 150,000 150,000 1,989 - - 1,989 - - 1,989 - - 1,989 - - 1,989 180,000 175,480
0000143 - ZC53CPR - TschiffelySquare Culvert Maintenance RepairProje 35,000 55,000 87,603 2,397 200,000 200,000 2,397 - - 2,397 - - 2,397 - - 2,397 - - 2,397 255,000 287,603
0000148 - Russell Avenue andOdendhal Avenue - Signal Recon 4,385 425,000 429,385 - - - - - - - - - - - - - - - - 425,000 429,385
0000152 - Curb Installation on MainStreet - 100,000 100,000 - - - - - - - - - - - - - - - - 100,000 100,000
0000153 - East Diamond Avenue &Summit Avenue Signal Improvements - 25,000 25,000 - 355,000 330,000 25,000 - - 25,000 - - 25,000 - - 25,000 - - 25,000 380,000 355,000
0000154 - Edison Park Drive & MainStreet - - - - 1,750,000 1,750,000 - 500,000 500,000 - - - - - - - - - - 2,250,000 2,250,000
0000155 - Pheasant Run DriveImprovements - 80,000 30,000 50,000 - 50,000 - - - - - - - - - - - - - 80,000 80,000
0000156 - Quince Orchard BoulevardShared Use Path - 225,000 225,000 - 800,000 650,000 150,000 600,000 750,000 - - - - - - - - - - 1,625,000 1,625,000
0000157 - Russell Avenue &Christopher Avenue Signal Recon - - - - 35,000 35,000 - 425,000 425,000 - - - - - - - - - - 460,000 460,000
0000168 - Casey Community Center Pedestrian Bridge - 41,420 41,420 - 115,000 115,000 - - - - - - - - - - - - - 156,420 156,420
440

AppendixCIP Project Summary
FY22 Budget
FY21 FY22 FY23 FY24 FY25 FY26 Total All Years
BegBalance
ProjectedRevenue
ProjectedExpend
EndingBalance
RevenueBudget
ExpendBudget
EndingBalance
RevenueBudget
ExpendBudget
EndingBalance
RevenueBudget
ExpendBudget
EndingBalance
RevenueBudget
ExpendBudget
EndingBalance
RevenueBudget
ExpendBudget
EndingBalance Total Rev Expend
Infrastructure
Infrastructure Fund Total 15,940,063 5,711,822 6,114,920 15,536,963 7,229,000 12,980,535 9,785,428 7,525,000 9,868,325 7,442,103 6,270,000 6,120,000 7,592,103 6,654,000 5,769,491 8,476,612 4,488,000 5,623,000 7,341,612 37,877,822 46,476,271
Facilities
0000047 - City Hall - Exterior MarqueeSign 86,105 - 86,105 - - - - - - - - - - - - - - - - - 86,105
0000048 - Future City Hall Projects 1,569,982 220,631 - 1,790,613 200,000 800,000 1,190,613 200,000 800,000 590,613 200,000 - 790,613 200,000 - 990,613 200,000 - 1,190,613 1,220,631 1,600,000
0000049 - Public Works - Fuel Facility 529,478 - - 529,478 155,000 680,000 4,478 - - 4,478 - - 4,478 - - 4,478 - - 4,478 155,000 680,000
0000051 - Public Works - VehicleWash System 467,090 467,090 - - - - - - - - - - - 467,090
0000053 - Future PW Facility Projects 2,662,623 467,090 - 3,129,713 475,000 - 3,604,713 875,000 200,000 4,279,713 875,000 - 5,154,713 875,000 4,240,000 1,789,713 875,000 - 2,664,713 4,442,090 4,440,000
0000054 - Olde Towne Parking Garage- 3 Elevator Upgrades 187,000 400,000 - 587,000 735,000 - 1,322,000 - 1,321,020 980 - - 980 - - 980 - - 980 1,135,000 1,321,020
0000055 - Public Works - UpgradeGenerator - - - - - - - - - - 55,000 55,000 - 1,555,000 1,555,000 - - - - 1,610,000 1,610,000
0000057 - Public Works - Existing SaltBldg. Structural Repairs 85,561 - 2,460 83,101 5,000 85,000 3,101 - - 3,101 - - 3,101 - - 3,101 - - 3,101 5,000 87,460
0000059 - Utility Assessment 185,994 10,000 30,000 165,994 - 90,000 75,994 - 29,000 46,994 - - 46,994 - - 46,994 - - 46,994 10,000 149,000
0000116 - Activity Center - FacilityAssessment 18,407 - 18,407 - - - - - - - - - - - - - - - - - 18,407
0000117 - Casey Community CenterFacility - Assessment - 55,000 36,450 18,550 - 18,550 - - - - - - - - - - - - - 55,000 55,000
0000118 - City Parking Lot - PavementAssessment - 20,000 20,000 - 50,000 50,000 - - - - - - - - - - - - - 70,000 70,000
0000119 - DPW Sand Filter OutfallReplacement 50,000 25,000 - 75,000 15,000 90,000 - - - - - - - - - - - - - 40,000 90,000
0000144 - City Hall Historic WoodSiding Replacement - 45,000 - 45,000 - - 45,000 110,000 150,000 5,000 - - 5,000 - - 5,000 - - 5,000 155,000 150,000
0000158 - City Hall HVAC AHU1Replacement - 190,000 - 190,000 - 190,000 - - - - - - - - - - - - - 190,000 190,000
0000159 - Wells Robertson HouseSiding Replacement - - - - - - - - - - 50,000 50,000 - 320,000 320,000 - - - - 370,000 370,000
0000169 - City Hall HVAC AHU2 Replacement - - - - - - - 190,000 190,000 - - - - - - - - - - 190,000 190,000
Facilities Fund Total 5,842,239 1,432,721 660,512 6,614,449 1,635,000 2,003,550 6,245,899 1,375,000 2,690,020 4,930,879 1,180,000 105,000 6,005,879 2,950,000 6,115,000 2,840,879 1,075,000 - 3,915,879 9,647,721 11,574,082
Parks
0000060 - Water Park - SlideReplacement 122,644 - 122,644 - - - - - - - - - - - - - - - - - 122,644
0000061 - Activity Center - RoofReplacement 928,838 - - 928,838 - 65,000 863,838 - 600,000 263,838 - - 263,838 - - 263,838 - - 263,838 - 665,000
0000062 - Water Park - Filtration,Motors & Pumps 100,000 600,000 680,000 20,000 - 9,110 10,890 - 9,110 1,780 - - 1,780 - - 1,780 - - 1,780 600,000 698,220
0000063 - Future Bohrer Park atSummit Hall Projects 100,000 50,000 150,000 48,500 198,500 50,000 248,500 50,000 298,500 50,000 348,500 50,000 398,500 298,500
0000067 - Activity Center - UpgradeGenerator - - - - - - - - - - 150,000 75,000 75,000 500,000 575,000 - - - - 650,000 650,000
0000068 - Sound Study Enhancementsfor RPYC, OTYC and AC Main Gym 42,260 60,000 7,600 94,660 - 75,000 19,660 - - 19,660 - - 19,660 - - 19,660 - - 19,660 60,000 82,600
0000070 - Kelley Park - Tennis CourtsRehabilitation 60,000 - 60,000 - - - - - - - - - - - - - - - - - 60,000
441

AppendixCIP Project Summary
FY22 Budget
FY21 FY22 FY23 FY24 FY25 FY26 Total All Years
BegBalance
ProjectedRevenue
ProjectedExpend
EndingBalance
RevenueBudget
ExpendBudget
EndingBalance
RevenueBudget
ExpendBudget
EndingBalance
RevenueBudget
ExpendBudget
EndingBalance
RevenueBudget
ExpendBudget
EndingBalance
RevenueBudget
ExpendBudget
EndingBalance Total Rev Expend
Parks
0000071 - Robertson Park - FieldLighting Improvements (3 Fields) 80,657 - 80,657 - - - - - - - - - - - - - - - - - 80,657
0000075 - Future Renovation ofExisting Parks Projects 1,466,262 297,686 637,988 1,125,960 - 347,000 778,960 100,000 414,500 464,460 100,000 - 564,460 100,000 - 664,460 100,000 - 764,460 697,686 1,399,488
0000079 - Future Benjamin GaitherCenter Projects 106,445 - - 106,445 - 90,000 16,445 - - 16,445 - - 16,445 - - 16,445 - - 16,445 - 90,000
0000081 - Arts Barn - Boiler/Chiller/Controls Replacement 10,585 36,001 46,587 - - - - - - - - - - - - - - - - 36,001 46,587
0000082 - Robertson Park Field #3 -Synthetic Turf Installation 1,009,793 20,000 760,000 269,793 - 265,000 4,793 - - 4,793 - - 4,793 - - 4,793 - - 4,793 20,000 1,025,000
0000120 - Casey Community Center -Electronic Sign - - - - 133,000 133,000 - - - - - - - - - - - - - 133,000 133,000
0000122 - Diamond Farms Park Court#3 - New Lighting - 69,000 69,000 - - - - - - - - - - - - - - - - 69,000 69,000
0000123 - Gymnasium PartitionReplacement - Activity Center 185,000 - 185,000 - - - - - - - - - - - - - - - - - 185,000
0000126 - Washingtonian Woods Park- Path Replacement 41,812 - 41,812 - - - - - - - - - - - - - - - - - 41,812
0000160 - Asphalt Tennis & BasketballCourt Resurfacing - 165,000 - 165,000 - 165,000 - - - - - - - - - - - - - 165,000 165,000
0000161 - Kentlands Mansion -Second Floor Bathroom Renovation - 37,987 37,987 - - - - - - - - - - - - - - - - 37,987 37,987
0000162 - New GaithersburgElementary School Turf Field - 100,000 - 100,000 700,000 800,000 - - - - - - - - - - - - - 800,000 800,000
0000174 - Miniature Golf Pond Repair - - - - 347,000 347,000 - - - - - - - - - - - - - 347,000 347,000
0000173 - Manor House -Roof Replacement - - - - - - - 94,500 7,500 87,000 - 87,000 - - - - - - - 94,500 94,500
0000170 - Asphalt Path Repair and Overlay - - - - - - - 200,000 200,000 - 200,000 200,000 - 200,000 200,000 - 200,000 200,000 - 800,000 800,000
0000172 - Blohm Park Trail Improvements - - - - 305,000 140,000 165,000 495,000 660,000 - - - - - - - - - - 800,000 800,000
0000171 - Benjamin Gaither Bathroom Renovations - - - - 90,000 88,030 1,970 - - 1,970 - - 1,970 - - 1,970 - - 1,970 90,000 88,030
Parks Fund Total 4,254,297 1,435,674 2,729,275 2,960,695 1,623,500 2,524,140 2,060,055 939,500 1,891,110 1,108,445 500,000 362,000 1,246,445 850,000 775,000 1,321,445 350,000 200,000 1,471,445 5,698,674 8,481,525
Technology
0000083 - IT - Network InfrastructureImprovements 93,805 - - 93,805 - 15,000 78,805 - - 78,805 - - 78,805 - - 78,805 - - 78,805 - 15,000
0000084 - City - Facility CamerasSystem 33,396 - - 33,396 - - 33,396 - 15,000 18,396 - - 18,396 - - 18,396 - - 18,396 - 15,000
0000085 - City - 16 S. Summit Ave.Network Configuration 100,000 62,000 104,000 58,000 - 6,000 52,000 - - 52,000 30,000 30,000 52,000 - - 52,000 - - 52,000 92,000 140,000
0000086 - City - Facility AccessSecurity Improvements 69,523 - - 69,523 - 35,000 34,523 - 20,000 14,523 - - 14,523 - - 14,523 - - 14,523 - 55,000
0000087 - City - Intranet WebReplacement - - - - - - - - - - 30,000 30,000 - - - - - - - 30,000 30,000
0000088 - IT- Remote Data Center 30,000 - - 30,000 - - 30,000 - - 30,000 - 30,000 - - - - - - - - 30,000
0000089 - PW - Energy ManagementSystem 50,000 - 50,000 - - - - - - - - - - - - - - - - - 50,000
0000090 - IT - Security Assessment /Testing 75,000 - - 75,000 - - 75,000 - - 75,000 - - 75,000 - - 75,000 - - 75,000 - -
442

AppendixCIP Project Summary
FY22 Budget
FY21 FY22 FY23 FY24 FY25 FY26 Total All Years
BegBalance
ProjectedRevenue
ProjectedExpend
EndingBalance
RevenueBudget
ExpendBudget
EndingBalance
RevenueBudget
ExpendBudget
EndingBalance
RevenueBudget
ExpendBudget
EndingBalance
RevenueBudget
ExpendBudget
EndingBalance
RevenueBudget
ExpendBudget
EndingBalance Total Rev Expend
Technology
0000093 - City - Field Asset & WorkOrder System 150,000 - 150,000 - - - - - - - - - - - - - - - - - 150,000
0000094 - Police - Public SafetySurveillance Cameras 100,000 - - 100,000 - - 100,000 - 100,000 - - - - - - - - - - - 100,000
0000095 - City - Parking GarageTechnology Improvements 101,019 - - 101,019 - - 101,019 - 100,000 1,019 - - 1,019 - - 1,019 - - 1,019 - 100,000
0000096 - City - Radio SystemUpgrades 125,000 - - 125,000 25,000 150,000 - - - - - - - - - - - - - 25,000 150,000
0000097 - IT- Data Backup System 5,000 25,000 - 30,000 60,000 85,000 5,000 - - 5,000 20,000 25,000 - - - - - - - 105,000 110,000
0000098 - City - Shared ServerStorage 9,123 20,000 29,123 - - - - - - - - - - - - - - - - 20,000 29,123
0000099 - City - City Hall GroundsCameras & Network 50,000 - - 50,000 - - 50,000 - - 50,000 - - 50,000 - 25,000 25,000 - - 25,000 - 25,000
0000100 - City - Wide-Area NetworkEnhancements 322,000 - - 322,000 - - 322,000 - 175,000 147,000 30,000 175,000 2,000 - - 2,000 - - 2,000 30,000 350,000
0000101 - City - 16 S. Summit Ave.Training/Conference Rooms - - - - - - - 35,000 - 35,000 - 35,000 - - - - - - - 35,000 35,000
0000106 - Future Technology Projects 539,891 100,543 391,000 249,434 85,000 - 334,434 270,000 - 604,434 300,000 - 904,434 300,000 - 1,204,434 300,000 - 1,504,434 1,355,543 391,000
0000147 - Fuel Management SystemUpgrade 60,150 6,000 21,300 44,850 - 40,000 4,850 - - 4,850 - - 4,850 - - 4,850 - - 4,850 6,000 61,300
0000163 - 16 South Summit Avenue ITBuildout - 225,000 50,000 175,000 - 95,000 80,000 - - 80,000 - 25,000 55,000 - - 55,000 - - 55,000 225,000 170,000
0000164 - City Parking ProgramTechnology - - - - 30,000 - 30,000 - 30,000 - - - - - - - - - - 30,000 30,000
0000165 - Financial SystemImprovements - 70,000 - 70,000 - - - - - - - - - - - - - 70,000 70,000
0000166 - Park Facilities Audio-VisualImprovements 2,000 8,000 - 6,000 2,000 - - 2,000 - - 2,000 - - 2,000 - - 2,000 10,000 8,000
0000167 - Telework Pilot Program - 35,000 - - - - - - - - - - - - - 35,000 35,000
- 70,000
- 10,000- 35,000 - 35,000
210,000
Technology Fund Total 1,913,907 553,543 797,423 1,670,027 410,000 747,000 1,333,027 335,000 470,000 1,198,027 410,000 350,000 1,258,027 300,000 25,000 1,533,027 300,000 - 1,833,027 2,308,543 2,389,423
Art in Public Places
0000107 - Olde Towne - Art Project 413,000 80,000 10,000 483,000 - 210,000 273,000 - 150,000 123,000 - 123,000 - - - - - - - 80,000 493,000
0000108 - Diamond Farms Skate Spot- Art Project 8,000 6,000 3,000 11,000 - 5,000 6,000 - - 6,000 - - 6,000 - - 6,000 - - 6,000 6,000 8,000
0000110 - Observatory Park ArmillarySundial - Art Project 19,300 - 19,300 - - - - - - - - - - - - - - - - - 19,300
0000111 - Park Trail Markers - ArtProject 40,000 - - 40,000 - 30,000 10,000 10,000 20,000 - - - - - - - - - - 10,000 50,000
0000112 - Developer Sponsored CityArt Projects 18,000 - - 18,000 - - 18,000 - - 18,000 - - 18,000 - - 18,000 - - 18,000 - -
0000113 - Future Art in Public Places 48,661 13,300 - - 61,961 - - 61,961 - - 61,961 - - 61,961 - - 61,961 13,300 -- 61,961
0000175 - Cloud Data Governance - - 60,000 - - - - - - - - - - - 60,0000000176 - GIS Software Migration - - - - - - - 40,000
0000178 - Microsoft 365 Migration 50,000
- - - - -- -- - 40,000 -
- -
40,000
60,000
40,000
50,00050,000-
- - 60,000
0000177 - Meeting Management System Replacement
0000179- Museum/Plaza Tech Enhancements
-
-
-
-
-
-
-
-
-
-
-
-
-
60,000
50,000
-
60,000
-
-
-
30,000
-
30,000
-
-
-
-
-
-
-
-
-
-
-
-
-
-
-
-
-
-
-
-
-
-
-
-
-
-
-
-
-
-
-
-
-
60,000 60,000
30,000 30,000
443

AppendixCIP Project Summary
FY22 Budget
FY21 FY22 FY23 FY24 FY25 FY26 Total All Years
BegBalance
ProjectedRevenue
ProjectedExpend
EndingBalance
RevenueBudget
ExpendBudget
EndingBalance
RevenueBudget
ExpendBudget
EndingBalance
RevenueBudget
ExpendBudget
EndingBalance
RevenueBudget
ExpendBudget
EndingBalance
RevenueBudget
ExpendBudget
EndingBalance Total Rev Expend
Total Capital Improvements 56,542,193 12,779,077 25,537,958 43,783,311 15,160,077 31,037,763 27,905,625 12,019,460 19,369,690 20,555,395 9,659,960 8,537,960 21,677,395 11,420,653 13,501,144 19,596,904 6,613,000 6,373,000 19,836,904 67,652,227 104,357,515
0000127 - 16 S. Summit Ave Building -Art Project 7,000 40,000 12,000 75,000 110,000 - - - - - - - - - - - - - 115,000 122,000
0000128 - City Event Banners - ArtProject 70,000 - - 70,000 - 70,000 - 70,000 - 70,000 - 70,000 -
0000180 - Community Mural Project - - - - 60,000 20,000 40,000 - 20,000 20,000 - 18,000 2,000 - - 2,000 - - 2,000 60,000 58,000
Art in Public Places Fund Total 623,961 139,300 44,300 718,961 135,000 375,000 478,961 10,000 190,000 298,961 - 141,000 157,961 - - 157,961 - - 157,961 284,300 750,300
35,000
70,000- - -----
444

AppendixCIP Project Detail
FY22 Budget
Prior YearsActuals
FY21Adopted
FY21Projection FY22 FY23 FY24 FY25 FY26 Total
Expenditures and Uses of Funds
589000 - Transfer to Other Funds 315,000 - - - - - - - 315,000
Total Expenditures and Uses of Funds 315,000 - - - - - - - 315,000
Net Change in Fund Balance (315,000) - - - - - - - (315,000)
Beginning Fund Balance 1,177,487 - - - - - - - 1,177,487
Projected Fund Balance 862,487 862,487 862,487 862,487 862,487 862,487 862,487 862,487 862,487
Project302 - General Capital
Project Location
0000002 - Future Property Acquisition andDisposition
Citywide
Fund
Project Manager Dennis Enslinger
Project DescriptionThe City of Gaithersburg has not traditionally issued bonds for capital improvement projects. Instead, it has set aside funding to allow the City to operate under a pay-as-you-go method. This project establishes funding in future years to meet its future property acquisition under this philosophy. This also allows the City to take up opportunities when they become available which is not always related to the budget timeline. When specific projects are identified, funds and expenditures will be transferred to a new project.
302 - General Capital
445

AppendixCIP Project Detail
FY22 Budget
Prior YearsActuals
FY21Adopted
FY21Projection FY22 FY23 FY24 FY25 FY26 Total
Revenues and Sources of Funds
499000 - Transfer In - From General Fund 100,000 - - - - - - - 100,000
499100 - Transfer In - From CIP 1,000,000 - - - - - - - 1,000,000
Total Revenues and Sources of Funds 1,100,000 - - - - - - - 1,100,000
Expenditures and Uses of Funds
532000 - Engineering & Architecture 42,441 - - - - - - - 42,441
560000 - Miscellaneous 3,066 - - - - - - - 3,066
591100 - Construction 1,677,310 - 294,560 233,440 - - - - 2,205,310
Total Expenditures and Uses of Funds 1,722,817 - 294,560 233,440 - - - - 2,250,817
Net Change in Fund Balance (622,817) - (294,560) (233,440) - - - - (1,150,817)
Project 0000004 - Olde Towne Plaza Fund 302 - General Capital
Beginning Fund Balance 1,157,728 - - - - - - - 1,157,728
Projected Fund Balance 534,911 534,911 240,351 6,911 6,911 6,911 6,911 6,911 6,911
Project DescriptionThis project involves the redevelopment and enhancement with additional plaza space and an interactive fountain. Additional improvements include the removal ofthe old plaza and streetscape hardscape components and the replacement of pavers, concrete curb and gutter, asphalt, stormwater management infiltration areas,storm drain, landscaping, lighting, and site furnishings. Work was initially completed in FY19.
Design issues resulted in the need for modification to the plaza in FY20 and FY21, with delays causing the project to extend into FY22.Operating Budget ImpactsThe City will have additional maintenance because of new features such as the interactive fountain.
Project Location Olde Towne Park Plaza, 1 South Summit Avenue Project Manager Thomas Lonergan
446

AppendixCIP Project Detail
FY22 Budget
Prior YearsActuals
FY21Adopted
FY21Projection FY22 FY23 FY24 FY25 FY26 Total
Revenues and Sources of Funds
499000 - Transfer In - From General Fund 625,000 - - - 300,000 300,000 300,000 300,000 1,825,000
499100 - Transfer In - From CIP 1,648,543 1,375,000 1,472,259 - - - - - 3,120,802
499200 - Transfer In - - - 3,547,170 - - - - 3,547,170
Total Revenues and Sources of Funds 2,273,543 1,375,000 1,472,259 3,547,170 300,000 300,000 300,000 300,000 8,492,972
Expenditures and Uses of Funds
532000 - Engineering & Architecture 1,768 - - - - - - - 1,768
560000 - Miscellaneous (757) - - - - - - - (757)
589000 - Transfer to Other Funds 3,549,014 2,159,678 284,678 3,670,000 310,000 300,000 300,000 300,000 8,713,692
591100 - Construction 58,378 - - - - - - - 58,378
Total Expenditures and Uses of Funds 3,608,403 2,159,678 284,678 3,670,000 310,000 300,000 300,000 300,000 8,773,081
Net Change in Fund Balance (1,334,860) (784,678) 1,187,581 (122,830) (10,000) - - - (280,109)
Project 0000005 - Contingency Fund 302 - General Capital
Beginning Fund Balance 2,411,916 - - - - - - - 2,411,916
Projected Fund Balance 1,077,057 292,379 2,264,638 2,141,808 2,131,808 2,131,808 2,131,808 2,131,808 2,131,808
Project DescriptionThis project supports funding for small capital projects identified during the fiscal year that were unanticipated during the budget process and provides contingencyfunding for other CIP projects in the case of cost overages or changes in scope. Typically, project costs are charged to the related project and funding is transferredfrom this CIP to assist the under funded project.
Project Location Citywide Project Manager Dennis Enslinger
447

AppendixCIP Project Detail
FY22 Budget
Prior YearsActuals
FY21Adopted
FY21Projection FY22 FY23 FY24 FY25 FY26 Total
Expenditures and Uses of Funds
589000 - Transfer to Other Funds - 1,000,000 1,000,000 - - - - - 1,000,000
Total Expenditures and Uses of Funds - 1,000,000 1,000,000 - - - - - 1,000,000
Net Change in Fund Balance - (1,000,000) (1,000,000) - - - - - (1,000,000)
Project 0000006 - Future Edison Park Dr Project Fund 302 - General Capital
Beginning Fund Balance 1,000,000 - - - - - - - 1,000,000
Projected Fund Balance 1,000,000 - - - - - - - -
Project DescriptionThe City originally acquired this parcel for the construction of an indoor aquatic center. The City decided not to move forward with the project. Development and/or disposition of this site is pending future Mayor and City Council direction. This site was acquired with Project Open Space funding so there are restrictions on its use and disposition. The balance of this account will be transferred back to Project no. 000005 for use in other CIP projects.
Project Location 51 Edison Park Drive Project Manager TBD
448

AppendixCIP Project Detail
FY22 Budget
Prior YearsActuals
FY21Adopted
FY21Projection FY22 FY23 FY24 FY25 FY26 Total
Revenues and Sources of Funds
434100 - State Grant - Miscellaneous - 1,000,000 - - - - - - -
499000 - Transfer In - From General Fund 3,640,000 - 1,000,000 - - - - - 4,640,000
499100 - Transfer In - From CIP 1,180,543 - - - - - - - 1,180,543
Total Revenues and Sources of Funds 4,820,543 1,000,000 1,000,000 - - - - - 5,820,543
Expenditures and Uses of Funds
532000 - Engineering & Architecture 887,517 225,261 217,852 11,573 4,163 - - - 1,121,105
536000 - Miscellaneous ProfessionalServices - 75,000 18,500 48,402 - - - - 66,902
591100 - Construction 2,394,875 10,264,000 10,513,195 1,307,131 - - - - 14,215,201
595000 - Furniture & Equipment - 525,000 13,000 581,451 - - - - 594,451
595060 - Machinery & Equipment - 775,000 - 775,000 - - - - 775,000
Total Expenditures and Uses of Funds 3,282,392 11,864,261 10,762,547 2,723,557 4,163 - - - 16,772,659
Net Change in Fund Balance 1,538,151 (10,864,261) (9,762,547) (2,723,557) (4,163) - - - (10,952,116)
Project 0000007 - Gaithersburg Police Station Fund 302 - General Capital
Beginning Fund Balance 11,139,468 - - - - - - - 11,139,468
Projected Fund Balance 12,677,619 1,813,358 2,915,072 191,515 187,352 187,352 187,352 187,352 187,352
Project DescriptionConversion of a 3-story office building purchased by the City to be repurposed into a new police station. Design was complete in FY20 and construction started in FY20 (March 2020). Project delays have pushed back the estimated final completion to Fall 2021.
Operating Budget ImpactsThe City will have additional annual maintenance costs related to the renovation of this building.
Project Location 16 South Summit Avenue Project Manager Ron Kaczmarek
449

AppendixCIP Project Detail
FY22 Budget
Project 0000008 - Crown Farm Historic Park Fund 302 - General Capital
Project Location Crown Farm Park, 403 Decoverly Drive Project Manager Melanie Brown
Prior YearsActuals
FY21Adopted
FY21Projection FY22 FY23 FY24 FY25 FY26 Total
Expenditures and Uses of Funds
532000 - Engineering & Architecture 15,000 18,360 - - - - 33,360
589000 - Transfer to Other Funds 495,000 - - - -
591100 - Construction 6,600
- 70,000
- 495,000
223,400 223,400 230,000 240,000 - -
- 495,000
- 700,000
Total Expenditures and Uses of Funds 6,600 788,400 733,400 248,360 240,000 - - - 1,228,360
Net Change in Fund Balance (6,600) (788,400) (733,400) (248,360) (240,000) - - - (1,228,360)
2,543,561 - - - - - - - 2,543,561Beginning Fund Balance
Projected Fund Balance 2,536,961 1,748,561 1,803,561 1,555,201 1,315,201 1,315,201 1,315,201 1,315,201 1,315,201
Project DescriptionThe City acquired this public park site from the developers of the Crown Neighborhood. This project will support its development as a park and rehabilitate several historic farm buildings located on the site. The City took ownership of the park parcel in January of 2020. The project will be done in phases including the renovation of several existing structures and it is anticipated to be completed in FY23.
Based on anticipated costs, funding of $375,000 was transferred back to Project #0000005, Contingency in FY21. An additional $80,000 was sent to Project#0000107 - Olde Towne - Art Project, and $40,000 to Project #0000127 - 16 S. Summit Ave Building - Art Project, as part of the modifications to the Capital Improvement Program resulting from the budget impacts of the COVID-19 pandemic.
Operating Budget ImpactsThere will be additional annual operating costs such as mowing and operational upkeep associated with this new park.
450

AppendixCIP Project Detail
FY22 Budget
Prior YearsActuals
FY21Adopted
FY21Projection FY22 FY23 FY24 FY25 FY26 Total
Revenues and Sources of Funds
499000 - Transfer In - From General Fund 600,000 - - - 100,000 100,000 100,000 100,000 1,000,000
Total Revenues and Sources of Funds 600,000 - - - 100,000 100,000 100,000 100,000 1,000,000
Expenditures and Uses of Funds
532000 - Engineering & Architecture - - - - 50,000 50,000 50,000 50,000 200,000
591100 - Construction - - - - 200,000 200,000 200,000 200,000 800,000
Total Expenditures and Uses of Funds - - - - 250,000 250,000 250,000 250,000 1,000,000
Net Change in Fund Balance 600,000 - - - (150,000) (150,000) (150,000) (150,000) -
Project 0000009 - Future Energy Efficiency andConservation Projects Fund 302 - General Capital
Beginning Fund Balance 253,056 - - - - - - - 253,056
Projected Fund Balance 853,056 853,056 853,056 853,056 703,056 553,056 403,056 253,056 253,056
Project DescriptionThe City of Gaithersburg has not traditionally issued bonds for capital improvement projects. Instead, it has set aside funding to allow the City to operate under a pay-as-you-go method. This project establishes funding in future years to address energy efficiency and conservation projects under this philosophy. When specific projects are identified, funds and expenditures will be transferred to a new project.
Using a Maryland State Energy grant, the City conducted an energy assessment of our facilities that serve low income families in FY18 (paid for out of this fund). This assessment was completed in FY19 and identified a number of energy conservation projects that were prioritized and completed for these facilities. The City does not anticipate any projects in FY22. Should a project arise, a new project will be created and funded through this holding fund.
Project Location Various City facilities Project Manager Ron Kaczmarek
451

AppendixCIP Project Detail
FY22 Budget
Project 0000011 - Pleasant View Park - CPSC Fund 302 - General Capital
Project Location Pleasant View Park, 10901 Darnestown Road Project Manager Sunil Prithviraj
Prior YearsActuals
FY21Adopted
FY21Projection FY22 FY23 FY24 FY25 FY26 Total
Revenues and Sources of Funds
434000 - State Grant - Open Space - - - 1,072,000 1,072,000 - - - 2,144,000
434940 - State Grant - Bond Bill(s) - - - 450,000 - - - - 450,000
499000 - Transfer In - From General Fund 2,615,000 - - (1,522,000) (497,000) - - - 596,000
Total Revenues and Sources of Funds 2,615,000 - - - 575,000 - - - 3,190,000
Expenditures and Uses of Funds
532000 - Engineering & Architecture 537,124 40,000 125,000 40,000 - - - - 702,124
589000 - Transfer to Other Funds 2,500,000 - - - - - - - 2,500,000
591100 - Construction 62,849 3,502,000 - 3,727,400 2,200,000 - - - 5,990,249
Total Expenditures and Uses of Funds 3,099,973 3,542,000 125,000 3,767,400 2,200,000 - - - 9,192,373
Net Change in Fund Balance (484,973) (3,542,000) (125,000) (3,767,400) (1,625,000) - - - (6,002,373)
6,018,132 - - - - - - - 6,018,132Beginning Fund Balance
Projected Fund Balance 5,533,159 1,991,159 5,408,159 1,640,759 15,759 15,759 15,759 15,759 15,759
Project DescriptionThe City acquired the former Consumer Products Safety Commission parcel from the Federal Government for the purpose of constructing a new park. Construction includes major improvements such as walking paths, recreation areas, and allocation of space for future recreation facilities. This project is being funded with Program Open Space (POS) funding which requires a minimum 20% match and is subject to prevailing wage if the POS funding exceeds 50%, which is not expected. Design was completed in FY21. Construction will start in FY22 with completion in FY23.
Operating Budget ImpactsOnce completed, this project will require additional operating funds including utilities, park maintenance and personnel to maintain and operate the new park.
452

AppendixCIP Project Detail
FY22 Budget
Prior YearsActuals
FY21Adopted
FY21Projection FY22 FY23 FY24 FY25 FY26 Total
Revenues and Sources of Funds
499000 - Transfer In - From General Fund 1,120,000 - - - - - - - 1,120,000
499100 - Transfer In - From CIP 1,661,869 - - - - - - - 1,661,869
Total Revenues and Sources of Funds 2,781,869 - - - - - - - 2,781,869
Expenditures and Uses of Funds
532000 - Engineering & Architecture - 6,799 14,067 2,480 1,112 - - - 17,659
536000 - Miscellaneous ProfessionalServices 46,682 - - - - - - - 46,682
591100 - Construction 136,800 1,560,000 1,180,763 263,689 - - - - 1,581,252
595000 - Furniture & Equipment - 100,000 - 100,000 - - - - 100,000
595060 - Machinery & Equipment 75,000 630,000 - 630,000 - - - - 705,000
Total Expenditures and Uses of Funds 258,482 2,296,799 1,194,830 996,169 1,112 - - - 2,450,593
Net Change in Fund Balance 2,523,387 (2,296,799) (1,194,830) (996,169) (1,112) - - - 331,276
Project 0000114 - Mayor and City Council Chambers Fund 302 - General Capital
Beginning Fund Balance - - - - - - - - -
Projected Fund Balance 2,523,387 226,588 1,328,557 332,388 331,276 331,276 331,276 331,276 331,276
Project DescriptionThis project involves the relocation of the Mayor and City Council Chambers to 16 South Summit Avenue from City Hall. This project is scheduled to coincide with the Gaithersburg Police Station. Design was complete in FY20 and construction started in FY20 (March 2020). It is anticipated that the projected will be substantially completed in Fall 2021.Operating Budget ImpactsThere will additional operating costs based on the overall design and additional functions related to the project.
Project Location 16 South Summit Avenue Project Manager Ron Kaczmarek
453

AppendixCIP Project Detail
FY22 Budget
Prior YearsActuals
FY21Adopted
FY21Projection FY22 FY23 FY24 FY25 FY26 Total
Revenues and Sources of Funds
499000 - Transfer In - From General Fund 70,000 - - - - - - - 70,000
499100 - Transfer In - From CIP 45,000 - - - 10,000 - - - 55,000
Total Revenues and Sources of Funds 115,000 - - - 10,000 - - - 125,000
Expenditures and Uses of Funds
532000 - Engineering & Architecture 39,020 - - - - - - - 39,020
591100 - Construction - - - 70,000 15,000 - - - 85,000
Total Expenditures and Uses of Funds 39,020 - - 70,000 15,000 - - - 124,020
Net Change in Fund Balance 75,980 - - (70,000) (5,000) - - - 980
Project 0000132 - Rolling Stock Relocation Fund 302 - General Capital
Beginning Fund Balance - - - - - - - - -
Projected Fund Balance 75,980 75,980 75,980 5,980 980 980 980 980 980
Project DescriptionThis project involves the relocation of the rolling stock (Bud train car) from the old Fishman property (315 E. Diamond Avenue) to the Community Museum Complex(9 S. Summit Avenue). The project will be conducted by the developer of Fishman property with additional funding provided by the City. The project is anticipated tobe completed in FY22/FY23 depending on the developer's construction schedule.
Project LocationAdjacent to the Gaithersburg Community Museum, 9South Summit Avenue Project Manager Sandra Gross
454

AppendixCIP Project Detail
FY22 Budget
Prior YearsActuals
FY21Adopted
FY21Projection FY22 FY23 FY24 FY25 FY26 Total
Revenues and Sources of Funds
499000 - Transfer In - From General Fund - 190,322 190,322 - - - - - 190,322
499100 - Transfer In - From CIP 200,000 14,678 14,678 15,000 - - - - 229,678
Total Revenues and Sources of Funds 200,000 205,000 205,000 15,000 - - - - 420,000
Expenditures and Uses of Funds
532000 - Engineering & Architecture 58,813 5,250 79,825 - - - - - 138,638
591100 - Construction - 300,903 166,570 75,705 - - - - 242,275
597500 - Construction Management - 35,000 22,500 12,500 - - - - 35,000
Total Expenditures and Uses of Funds 58,813 341,153 268,895 88,205 - - - - 415,913
Net Change in Fund Balance 141,187 (136,153) (63,895) (73,205) - - - - 4,087
Project 0000135 - Olde Towne - Fiber Duct Bank InstallationProject Fund 302 - General Capital
Beginning Fund Balance - - - - - - - - -
Projected Fund Balance 141,187 5,034 77,292 4,087 4,087 4,087 4,087 4,087 4,087
Project DescriptionThis project consists of the installation of underground fiber duct bank to interconnect City Facilities in the Olde Towne complex (16 S. Summit Avenue and ParkingGarage) that are not currently on the City’s Network. The design for the project was completed in FY21 and construction will take place in FY21/FY22.Operating Budget ImpactsThis would be considered a new asset; it will need to be added to the asset replacement calculations once it is completed.
Project Location
In the Olde Towne Area around the following CityFacilities (City Hall, City Hall Concert Pavilion, 16South Summit Avenue, and Olde Towne ParkingGarage) Project Manager Melanie Brown
455

AppendixCIP Project Detail
FY22 Budget
Prior YearsActuals
FY21Adopted
FY21Projection FY22 FY23 FY24 FY25 FY26 Total
Revenues and Sources of Funds
499000 - Transfer In - From General Fund - 225,000 225,000 - 50,000 100,000 - - 375,000
499100 - Transfer In - From CIP - 225,000 225,000 - - - - - 225,000
Total Revenues and Sources of Funds - 450,000 450,000 - 50,000 100,000 - - 600,000
Expenditures and Uses of Funds
532000 - Engineering & Architecture - 45,000 - 45,000 - - - - 45,000
591100 - Construction - - - - 365,000 85,000 - - 450,000
595000 - Furniture & Equipment - - - - 40,000 10,000 - - 50,000
597500 - Construction Management - - - - 35,000 15,000 - - 50,000
Total Expenditures and Uses of Funds - 45,000 - 45,000 440,000 110,000 - - 595,000
Net Change in Fund Balance - 405,000 450,000 (45,000) (390,000) (10,000) - - 5,000
Project 0000149 - Buildout of 16 South Summit Avenue Fund 302 - General Capital
Beginning Fund Balance
Projected Fund Balance - 405,000 450,000 405,000 15,000 5,000 5,000 5,000 5,000
Project DescriptionThis project involves the build out of the remaining space (approximately 7,500 sq. ft.) of 16 South Summit Avenue. It is anticipated that one or more departmentswill move from the current City Hall into the new facility. The specific departments which would be relocating have not been selected at this time. Given this fact, it isanticipated that design will begin in FY22 with construction in FY23-24. Operating Budget ImpactsThis will increase the operational budget through additional utilities and facilities costs.
Project Location 16 S. Summit Avenue Project Manager Ron Kaczmarek
456

AppendixCIP Project Detail
FY22 Budget
Prior YearsActuals
FY21Adopted
FY21Projection FY22 FY23 FY24 FY25 FY26 Total
Revenues and Sources of Funds
499000 - Transfer In - From General Fund - 80,000 80,000 - - - - - 80,000
Total Revenues and Sources of Funds - 80,000 80,000 - - - - - 80,000
Expenditures and Uses of Funds
591100 - Construction - 80,000 80,000 - - - - - 80,000
Total Expenditures and Uses of Funds - 80,000 80,000 - - - - - 80,000
Net Change in Fund Balance - - - - - - - - -
Project 0000150 - Installation of Banner Poles Fund 302 - General Capital
Beginning Fund Balance
Projected Fund Balance - - - - - - - - -
Project DescriptionThis project involves looking at the existing light pole infrastructure and determine the best alternative to allow for the installation of banners within Olde Towne and select other areas in the City. The project will begin in FY21 and be completed in FY22.Operating Budget ImpactsThis will increase the operation budget by adding costs for production and installation of banners on a regular basis.
Project Location Select locations in the City Project Manager Sandra Gross
457

AppendixCIP Project Detail
FY22 Budget
Prior YearsActuals
FY21Adopted
FY21Projection FY22 FY23 FY24 FY25 FY26 Total
Revenues and Sources of Funds
499000 - Transfer In - From General Fund - 298,758 298,758 565,407 799,960 799,960 266,653 - 2,730,738
Total Revenues and Sources of Funds - 298,758 298,758 565,407 799,960 799,960 266,653 - 2,730,738
Expenditures and Uses of Funds
532000 - Engineering & Architecture - 32,100 - 32,100 - - - - 32,100
591100 - Construction - 266,658 295,695 533,307 799,960 799,960 266,653 - 2,695,575
Total Expenditures and Uses of Funds - 298,758 295,695 565,407 799,960 799,960 266,653 - 2,727,675
Net Change in Fund Balance - - 3,063 - - - - - 3,063
Project 0000151 - LED Streetlight Conversion Fund 302 - General Capital
Beginning Fund Balance
Projected Fund Balance - - 3,063 3,063 3,063 3,063 3,063 3,063 3,063
Project DescriptionThis project will convert all City owned street lights from high pressure sodium or mercury vapor bulbs to light emitting diodes (LEDs). This project began in FY21 and will be completed in FY25.Operating Budget ImpactsThis project will reduce annual energy costs once it is implemented.
Project Location Citywide Project Manager Deborah Moran
458

AppendixCIP Project Detail
FY22 Budget
Prior YearsActuals
FY21Adopted
FY21Projection FY22 FY23 FY24 FY25 FY26 Total
Revenues and Sources of Funds
499000 - Transfer In - From General Fund 364,683 - - - - 125,000 - 125,000 614,683
499100 - Transfer In - From CIP 143,720 - - 125,000 - - - - 268,720
Total Revenues and Sources of Funds 508,403 - - 125,000 - 125,000 - 125,000 883,403
Expenditures and Uses of Funds
532000 - Engineering & Architecture - 35,000 - 35,000 35,000 35,000 35,000 35,000 175,000
591100 - Construction 53,601 100,000 75,000 100,000 100,000 100,000 100,000 100,000 628,601
Total Expenditures and Uses of Funds 53,601 135,000 75,000 135,000 135,000 135,000 135,000 135,000 803,601
Net Change in Fund Balance 454,801 (135,000) (75,000) (10,000) (135,000) (10,000) (135,000) (10,000) 79,801
Project 0000012 - Annual Street Light Program Fund 303 - Infrastructure
Beginning Fund Balance 50,000 - - - - - - - 50,000
Projected Fund Balance 504,801 369,801 429,801 419,801 284,801 274,801 139,801 129,801 129,801
Project DescriptionThe City of Gaithersburg has not traditionally issued bonds for capital improvement projects. Instead, it has set aside funding to allow the City to operate under apay-as-you-go method. This project establishes funding in future years to fund the Annual Street Light Replacement Program under this philosophy. This is aprogram to install additional "infill" lighting in older communities to bring the lighting levels to the same level as those in newer communities. When specific projectsare identified, funds and expenditures will be transferred to a new project. Operating Budget ImpactsThere will be additional operating budget impacts related to additional electrical charges. When possible LED light fixtures are used.
Project Location Citywide Project Manager Anthony Berger
303 - Infrastructure
459

AppendixCIP Project Detail
FY22 Budget
Prior YearsActuals
FY21Adopted
FY21Projection FY22 FY23 FY24 FY25 FY26 Total
Revenues and Sources of Funds
499000 - Transfer In - From General Fund - - - - 96,000 - - 96,000 192,000
499100 - Transfer In - From CIP 38,176 - - - - - - - 38,176
Total Revenues and Sources of Funds 38,176 - - - 96,000 - - 96,000 230,176
Expenditures and Uses of Funds
532000 - Engineering & Architecture 78,921 - - - - - - - 78,921
595000 - Furniture & Equipment - - - - 96,000 - - 96,000 192,000
Total Expenditures and Uses of Funds 78,921 - - - 96,000 - - 96,000 270,921
Net Change in Fund Balance (40,745) - - - - - - - (40,745)
Project 0000014 - Relamping of City Lights Fund 303 - Infrastructure
Beginning Fund Balance 75,000 - - - - - - - 75,000
Projected Fund Balance 34,255 34,255 34,255 34,255 34,255 34,255 34,255 34,255 34,255
Project DescriptionThis is a program for the group re-lamping of all City maintained lights on a three-year cycle. This program includes replacing all light bulbs, washing and cleaning allluminaires, as well as general maintenance to replace any worn or missing parts. As the City moves to more LED lighting it is anticipated that there will be areduction in expenditures for this project.
Project Location Citywide Project Manager Anthony Berger
460

AppendixCIP Project Detail
FY22 Budget
Prior YearsActuals
FY21Adopted
FY21Projection FY22 FY23 FY24 FY25 FY26 Total
Revenues and Sources of Funds
437150 - County Grant - Miscellaneous - - - - 450,000 1,800,000 - - 2,250,000
499000 - Transfer In - From General Fund 48,000 - - - (120,000) - - - (72,000)
Total Revenues and Sources of Funds 48,000 - - - 330,000 1,800,000 - - 2,178,000
Expenditures and Uses of Funds
532000 - Engineering & Architecture - - - - 450,000 - - - 450,000
591100 - Construction - - - - - 1,800,000 - - 1,800,000
Total Expenditures and Uses of Funds - - - - 450,000 1,800,000 - - 2,250,000
Net Change in Fund Balance 48,000 - - - (120,000) - - - (72,000)
Project 0000018 - East Side of NIST - Multi-Use Path Fund 303 - Infrastructure
Beginning Fund Balance 72,000 - - - - - - - 72,000
Projected Fund Balance 120,000 120,000 120,000 120,000 - - - - -
Project DescriptionThis project is for the construction of a multi-use path along the east side of NIST between MD 117 and Muddy Branch Road. This project may be eligible for fundingthrough the City funds held in the Montgomery County’s Development Impact Fund. If funding is not available, the City may not pursue this project. This project wasoriginally scheduled for design in FY18 and construction in FY19. Based on changing priorities, it is currently scheduled for design in FY23 and construction inFY24.
Project LocationEast side of NIST between MD 117 and MuddyBranch Road Project Manager Mark Kile
461

AppendixCIP Project Detail
FY22 Budget
Prior YearsActuals
FY21Adopted
FY21Projection FY22 FY23 FY24 FY25 FY26 Total
Revenues and Sources of Funds
499000 - Transfer In - From General Fund 208,689 - - - - - 245,000 - 453,689
Total Revenues and Sources of Funds 208,689 - - - - - 245,000 - 453,689
Expenditures and Uses of Funds
532000 - Engineering & Architecture - - - - - 100,000 - - 100,000
591100 - Construction - - - - - - 350,000 - 350,000
Total Expenditures and Uses of Funds - - - - - 100,000 350,000 - 450,000
Net Change in Fund Balance 208,689 - - - - (100,000) (105,000) - 3,689
Project 0000020 - QOP to Conservation Ln - BicycleConnections Fund 303 - Infrastructure
Beginning Fund Balance - - - - - - - - -
Projected Fund Balance 208,689 208,689 208,689 208,689 208,689 108,689 3,689 3,689 3,689
Project DescriptionThis project is located between the Quince Orchard Park Neighborhood and Conservation Lane and will retrofit the existing off-road earth and gravel path to meetcurrent standards. The design phase is scheduled to start in FY24 with the construction phase following in FY25.
Project LocationBetween Quince Orchard Park Neighborhood andConservation Lane Project Manager Mark Kile
462

AppendixCIP Project Detail
FY22 Budget
Prior YearsActuals
FY21Adopted
FY21Projection FY22 FY23 FY24 FY25 FY26 Total
Revenues and Sources of Funds
437150 - County Grant - Miscellaneous - - - 1,450,000 - - - - 1,450,000
499000 - Transfer In - From General Fund 45,000 - - - - - - - 45,000
499100 - Transfer In - From CIP 558,398 - - 10,000 - - - - 568,398
Total Revenues and Sources of Funds 603,398 - - 1,460,000 - - - - 2,063,398
Expenditures and Uses of Funds
532000 - Engineering & Architecture 29,725 200,000 133,455 295,535 - - - - 458,715
591100 - Construction - - - 1,600,000 - - - - 1,600,000
Total Expenditures and Uses of Funds 29,725 200,000 133,455 1,895,535 - - - - 2,058,715
Net Change in Fund Balance 573,673 (200,000) (133,455) (435,535) - - - - 4,683
Project 0000021 - Washingtonian Blvd - BicycleConnections Fund 303 - Infrastructure
Beginning Fund Balance - - - - - - - - -
Projected Fund Balance 573,673 373,673 440,218 4,683 4,683 4,683 4,683 4,683 4,683
Project DescriptionThis project involves the design and construction of low-stress bicycle connections along Washingtonian Blvd. from Sam Eig Highway to Rio Boulevard. This projectmay be eligible for funding through the City funds held in Montgomery County’s Development Impact Fund. Concept level design and engineering have beencompleted, and construction is planned for FY22.
Project LocationWashingtonian Boulevard - between Sam EigHighway and Fields Road Project Manager Mark Kile
463

AppendixCIP Project Detail
FY22 Budget
Prior YearsActuals
FY21Adopted
FY21Projection FY22 FY23 FY24 FY25 FY26 Total
Revenues and Sources of Funds
437150 - County Grant - Miscellaneous - 60,000 - - - 400,000 1,600,000 - 2,000,000
499000 - Transfer In - From General Fund - (50,000) 10,000 - - - - - 10,000
Total Revenues and Sources of Funds - 10,000 10,000 - - 400,000 1,600,000 - 2,010,000
Expenditures and Uses of Funds
532000 - Engineering & Architecture - - - - - 400,000 - - 400,000
532100 - Concept Design and Outreach - 60,000 - - - - - - -
591100 - Construction - - - - - - 1,600,000 - 1,600,000
Total Expenditures and Uses of Funds - 60,000 - - - 400,000 1,600,000 - 2,000,000
Net Change in Fund Balance - (50,000) 10,000 - - - - - 10,000
Project 0000024 - I-370 - Bicycle Connection Fund 303 - Infrastructure
Beginning Fund Balance 50,000 - - - - - - - 50,000
Projected Fund Balance 50,000 - 60,000 60,000 60,000 60,000 60,000 60,000 60,000
Project DescriptionThis project is for design and construction of a low-stress bicycle connection for I-370 from Summit Hall Road to Industrial Drive. This project may be eligible forfunding through the City funds held in Montgomery County’s Development Impact Fund. If funding is not available, the City may not pursue this project. Final designis scheduled in FY24 with construction in FY25.Operating Budget ImpactsUpon completion, this project will require additional operating funds to maintain the constructed facility.
Project Location I-370 from Summit Hall Road to Industrial Drive Project Manager Mark Kile
464

AppendixCIP Project Detail
FY22 Budget
Prior YearsActuals
FY21Adopted
FY21Projection FY22 FY23 FY24 FY25 FY26 Total
Revenues and Sources of Funds
499000 - Transfer In - From General Fund - 100,000 100,000 50,000 250,000 200,000 200,000 200,000 1,000,000
499100 - Transfer In - From CIP 33,743 - 36,188 - - - - - 69,931
Total Revenues and Sources of Funds 33,743 100,000 136,188 50,000 250,000 200,000 200,000 200,000 1,069,931
Expenditures and Uses of Funds
591100 - Construction 33,147 320,000 394,533 270,000 200,000 200,000 200,000 200,000 1,497,680
Total Expenditures and Uses of Funds 33,147 320,000 394,533 270,000 200,000 200,000 200,000 200,000 1,497,680
Net Change in Fund Balance 596 (220,000) (258,345) (220,000) 50,000 - - - (427,749)
Project 0000025 - Annual Sidewalk Projects Fund 303 - Infrastructure
Beginning Fund Balance 485,000 - - - - - - - 485,000
Projected Fund Balance 485,596 265,596 227,251 7,251 57,251 57,251 57,251 57,251 57,251
Project DescriptionThis annual project is for the retrofit of existing sidewalks based on the results of the FY19 pavement resurvey. A survey of both on-road sidewalks and off-roadpathways were included as part of the pavement resurvey. The Pavement Condition Index is used to determine projects for the first two years of the CIP with the outyears being place holders for future projects.
Project Location Citywide Project Manager Mark Scafide
465

AppendixCIP Project Detail
FY22 Budget
Prior YearsActuals
FY21Adopted
FY21Projection FY22 FY23 FY24 FY25 FY26 Total
Revenues and Sources of Funds
437150 - County Grant - Miscellaneous - 45,000 - - 400,000 550,000 1,300,000 - 2,250,000
499000 - Transfer In - From General Fund 30,000 (30,000) 15,000 - - - - - 45,000
499100 - Transfer In - From CIP - - - 10,000 - - - - 10,000
Total Revenues and Sources of Funds 30,000 15,000 15,000 10,000 400,000 550,000 1,300,000 - 2,305,000
Expenditures and Uses of Funds
532000 - Engineering & Architecture - - - - - 400,000 - - 400,000
532100 - Concept Design and Outreach - 45,000 - 45,000 10,000 - - - 55,000
591100 - Construction - - - - - - 550,000 1,300,000 1,850,000
Total Expenditures and Uses of Funds - 45,000 - 45,000 10,000 400,000 550,000 1,300,000 2,305,000
Net Change in Fund Balance 30,000 (30,000) 15,000 (35,000) 390,000 150,000 750,000 (1,300,000) -
Project 0000026 - Lakelands –Washingtonian Woods -Bicycle Connection Fund 303 - Infrastructure
Beginning Fund Balance - - - - - - - - -
Projected Fund Balance 30,000 - 45,000 10,000 400,000 550,000 1,300,000 - -
Project DescriptionThis project is for the design and construction of a bicycle path connection between the Lakelands and Washingtonian Woods neighborhoods. This project may beeligible for funding through the City funds held in Montgomery County’s Development Impact Fund. If funding is not available, the City may not pursue this project.Concept level design was delayed and is expected for FY22. Final design is scheduled for FY24 with construction in FY25 and FY26.Operating Budget ImpactsUpon completion, this project will require additional operating funds to maintain the constructed facility.
Project LocationLakelands neighborhood and Washingtonian Woodsneighborhood Project Manager Mark Kile
466

AppendixCIP Project Detail
FY22 Budget
Prior YearsActuals
FY21Adopted
FY21Projection FY22 FY23 FY24 FY25 FY26 Total
Revenues and Sources of Funds
499000 - Transfer In - From General Fund - 100,000 100,000 - 100,000 100,000 100,000 100,000 500,000
Total Revenues and Sources of Funds - 100,000 100,000 - 100,000 100,000 100,000 100,000 500,000
Expenditures and Uses of Funds
532000 - Engineering & Architecture - 186,500 - - - - - - -
536000 - Miscellaneous ProfessionalServices 114,380 - 186,500 - 193,325 - 200,491 - 694,696
Total Expenditures and Uses of Funds 114,380 186,500 186,500 - 193,325 - 200,491 - 694,696
Net Change in Fund Balance (114,380) (86,500) (86,500) - (93,325) 100,000 (100,491) 100,000 (194,696)
Project 0000028 - Pavement Re-survey Fund 303 - Infrastructure
Beginning Fund Balance 300,000 - - - - - - - 300,000
Projected Fund Balance 185,620 99,120 99,120 99,120 5,795 105,795 5,304 105,304 105,304
Project DescriptionThe City performs a survey of all City maintained roadways on a three year basis to evaluate the condition of City roadways. These surveys rate the surfacecondition of the pavement using a Pavement Condition Index. This rating provides the City with an objective and rational basis for programming maintenance andrepair needs and priorities in a proactive comprehensive fashion. This system may also include an evaluation of sidewalks and paths in the City. The FY21 surveymay be finalized in FY22, with the next survey scheduled for FY25.
Project Location Citywide Project Manager Essay Habteselassie
467

AppendixCIP Project Detail
FY22 Budget
Prior YearsActuals
FY21Adopted
FY21Projection FY22 FY23 FY24 FY25 FY26 Total
Revenues and Sources of Funds
499000 - Transfer In - From General Fund 200,000 206,000 206,000 212,000 218,000 225,000 232,000 240,000 1,533,000
499100 - Transfer In - From CIP 26,983 - - - - - - - 26,983
Total Revenues and Sources of Funds 226,983 206,000 206,000 212,000 218,000 225,000 232,000 240,000 1,559,983
Expenditures and Uses of Funds
591100 - Construction 330,018 206,000 206,000 212,000 218,000 225,000 232,000 240,000 1,663,018
Total Expenditures and Uses of Funds 330,018 206,000 206,000 212,000 218,000 225,000 232,000 240,000 1,663,018
Net Change in Fund Balance (103,035) - - - - - - - (103,035)
Project 0000029 - Road Preventative Maintenance Fund 303 - Infrastructure
Beginning Fund Balance 105,000 - - - - - - - 105,000
Projected Fund Balance 1,965 1,965 1,965 1,965 1,965 1,965 1,965 1,965 1,965
Project DescriptionThis annual program provides for the preventive maintenance of local City streets. One dollar spent on preventive maintenance could eliminate or delay spending 6to 10 dollars on rehabilitation at a later date. The City uses a road pavement index survey to develop its preventative maintenance program. The PavementCondition Index is used to determine projects for the first two years of the CIP with out years being place holders for future projects. The FY22 amount is estimatedbased on the results from the 2019 Pavement Management Services Report recommendations.
Project Location Citywide Project Manager Essay Habteselassie
468

AppendixCIP Project Detail
FY22 Budget
Prior YearsActuals
FY21Adopted
FY21Projection FY22 FY23 FY24 FY25 FY26 Total
Revenues and Sources of Funds
499000 - Transfer In - From General Fund 1,580,000 617,000 617,000 - 654,000 675,000 694,000 715,000 4,935,000
Total Revenues and Sources of Funds 1,580,000 617,000 617,000 - 654,000 675,000 694,000 715,000 4,935,000
Expenditures and Uses of Funds
591100 - Construction 1,364,020 617,000 617,000 636,000 654,000 675,000 694,000 715,000 5,355,020
Total Expenditures and Uses of Funds 1,364,020 617,000 617,000 636,000 654,000 675,000 694,000 715,000 5,355,020
Net Change in Fund Balance 215,980 - - (636,000) - - - - (420,020)
Project 0000030 - Preventive Maintenance ProgramCollectors & Arterials Fund 303 - Infrastructure
Beginning Fund Balance 460,000 - - - - - - - 460,000
Projected Fund Balance 675,980 675,980 675,980 39,980 39,980 39,980 39,980 39,980 39,980
Project DescriptionThis annual program provides preventive maintenance for City collectors and arterials. This will be done by providing a microsurfacing treatment to these roadwaysto extend the life of the pavement. It is a cost-effective method to renew the road surface and seal minor cracks and other irregularities. This creates a protectivelayer which preserves the underlying structure and prevents the need for more expensive repairs in the future. The Pavement Condition Index is used to determineprojects for the first two years of the CIP with out years being place holders for future projects. The FY22 amount is estimated based on the results from the 2019Pavement Management Services Report recommendations.
Project Location Citywide Project Manager Essay Habteselassie
469

AppendixCIP Project Detail
FY22 Budget
Prior YearsActuals
FY21Adopted
FY21Projection FY22 FY23 FY24 FY25 FY26 Total
Revenues and Sources of Funds
499000 - Transfer In - From General Fund 1,620,000 42,000 42,000 - 1,302,000 1,345,000 1,383,000 1,427,000 7,119,000
499100 - Transfer In - From CIP 63,467 1,135,000 900,000 1,267,000 - - - - 2,230,467
Total Revenues and Sources of Funds 1,683,467 1,177,000 942,000 1,267,000 1,302,000 1,345,000 1,383,000 1,427,000 9,349,467
Expenditures and Uses of Funds
591100 - Construction 1,846,729 1,232,000 1,232,000 1,267,000 1,302,000 1,345,000 1,383,000 1,427,000 9,802,729
Total Expenditures and Uses of Funds 1,846,729 1,232,000 1,232,000 1,267,000 1,302,000 1,345,000 1,383,000 1,427,000 9,802,729
Net Change in Fund Balance (163,262) (55,000) (290,000) - - - - - (453,262)
Project 0000031 - Street Resurfacing Program Fund 303 - Infrastructure
Beginning Fund Balance 942,187 - - - - - - - 942,187
Projected Fund Balance 778,925 723,925 488,925 488,925 488,925 488,925 488,925 488,925 488,925
Project DescriptionThis annual project is a rehabilitation program to eliminate roadway defects that affect ride quality and water intrusion into the road base. This work includes millingof the existing pavement, patching of problem areas as needed, then overlaying a new surface as well as the replacement of deteriorated curb and gutter andsidewalk. The Pavement Condition Index is used to determine projects for the first two years with out years being place holders for future projects. The FY22 amountis estimated based on the results from the 2019 Pavement Management Services Report recommendations.
Project Location Citywide Project Manager Upton Reed
470

AppendixCIP Project Detail
FY22 Budget
Prior YearsActuals
FY21Adopted
FY21Projection FY22 FY23 FY24 FY25 FY26 Total
Revenues and Sources of Funds
499000 - Transfer In - From General Fund 2,200,000 - - - 500,000 500,000 500,000 500,000 4,200,000
499100 - Transfer In - From CIP 12,934 - 269,909 500,000 - - - - 782,843
Total Revenues and Sources of Funds 2,212,934 - 269,909 500,000 500,000 500,000 500,000 500,000 4,982,843
Expenditures and Uses of Funds
589000 - Transfer to Other Funds 6,000 - - 1,750,000 500,000 - - - 2,256,000
Total Expenditures and Uses of Funds 6,000 - - 1,750,000 500,000 - - - 2,256,000
Net Change in Fund Balance 2,206,934 - 269,909 (1,250,000) - 500,000 500,000 500,000 2,726,843
Project 0000032 - Future Street Reconstruction Fund 303 - Infrastructure
Beginning Fund Balance 2,486,806 - - - - - - - 2,486,806
Projected Fund Balance 4,693,740 4,693,740 4,963,649 3,713,649 3,713,649 4,213,649 4,713,649 5,213,649 5,213,649
Project DescriptionThe City of Gaithersburg has not traditionally issued bonds for capital improvement projects. Instead, it has set aside funding to allow the City to operate under apay-as-you-go method. This project establishes funding in future years to meet its future street rehabilitation/reconstruction needs under this philosophy. Whenspecific projects are identified, funds and expenditures will be transferred to a new project. Possible treatment strategies include the City’s current method of“reconstruction” in which the roadway is patched and used as the new base, then a overlay is added to the roadway. At the same time all new curb and gutter isreplaced and tied into the new road surface. Some roadways may require full reconstruction which requires replacement of the entire base of the street. ThePavement Condition Index survey is used to identify specific projects.
During FY22 and FY23, funds will be transferred to Project 0000154 - Edison Park Drive & Main Street for the reconstruction of that road.
Project Location Citywide Project Manager Anthony Berger
471

AppendixCIP Project Detail
FY22 Budget
Prior YearsActuals
FY21Adopted
FY21Projection FY22 FY23 FY24 FY25 FY26 Total
Revenues and Sources of Funds
499000 - Transfer In - From General Fund 260,317 - - - - - - - 260,317
Total Revenues and Sources of Funds 260,317 - - - - - - - 260,317
Expenditures and Uses of Funds
532000 - Engineering & Architecture 187,467 - - - - - - - 187,467
589000 - Transfer to Other Funds - - - 500,000 - - - - 500,000
591100 - Construction - 1,170,000 - 1,170,000 - - - - 1,170,000
Total Expenditures and Uses of Funds 187,467 1,170,000 - 1,670,000 - - - - 1,857,467
Net Change in Fund Balance 72,850 (1,170,000) - (1,670,000) - - - - (1,597,150)
Project 0000034 - QOB Street Rehab - Diamond Dr to FirstField Rd Fund 303 - Infrastructure
Beginning Fund Balance 2,194,683 - - - - - - - 2,194,683
Projected Fund Balance 2,267,533 1,097,533 2,267,533 597,533 597,533 597,533 597,533 597,533 597,533
Project DescriptionThis is a comprehensive reconstruction and streetscape project that includes the rehabilitation of Quince Orchard Blvd. from Firstfield Road to Diamond Drive, aswell as the replacement of sidewalk and the removal and replacement of street trees. In addition, the existing HPS lights along Quince Orchard Blvd. will be replacedwith new LED lights. Any necessary stormwater management features will be included in this project but funded from the SWM CIP. As part of a related project, abike facility along Firstfield Road and Quince Orchard Blvd. from MD 117 to MD 124 will be constructed along with a bike facility along Rabbitt Road from theRobertson Park Youth Center to Quince Orchard Blvd. This project is scheduled for construction in FY22.
Project LocationQuince Orchard Boulevard between Firstfield Roadand Quince Orchard Road Project Manager Mark Kile
472

AppendixCIP Project Detail
FY22 Budget
Prior YearsActuals
FY21Adopted
FY21Projection FY22 FY23 FY24 FY25 FY26 Total
Revenues and Sources of Funds
499000 - Transfer In - From General Fund 10,000 200,000 200,000 - - - - - 210,000
499100 - Transfer In - From CIP 12,750 - - - - - - - 12,750
Total Revenues and Sources of Funds 22,750 200,000 200,000 - - - - - 222,750
Expenditures and Uses of Funds
532000 - Engineering & Architecture 7,711 - - - - - - - 7,711
560000 - Miscellaneous 7 - - - - - - - 7
591100 - Construction - 435,000 435,000 - - - - - 435,000
Total Expenditures and Uses of Funds 7,718 435,000 435,000 - - - - - 442,718
Net Change in Fund Balance 15,032 (235,000) (235,000) - - - - - (219,968)
Project 0000037 - N. Summit Ave and Brookes Ave - SignalRecon Fund 303 - Infrastructure
Beginning Fund Balance 250,000 - - - - - - - 250,000
Projected Fund Balance 265,032 30,032 30,032 30,032 30,032 30,032 30,032 30,032 30,032
Project DescriptionThis project involves the replacement of the traffic signal at N. Summit Ave. and Brooks Ave. This project was scheduled for design in FY19 and construction in FY20. This project was rescheduled for final design in FY20 and construction was completed in FY21. Project will be closed out in FY22.
Project LocationNorth Summit Avenue and Brooks Avenueintersection Project Manager Mark Kile
473
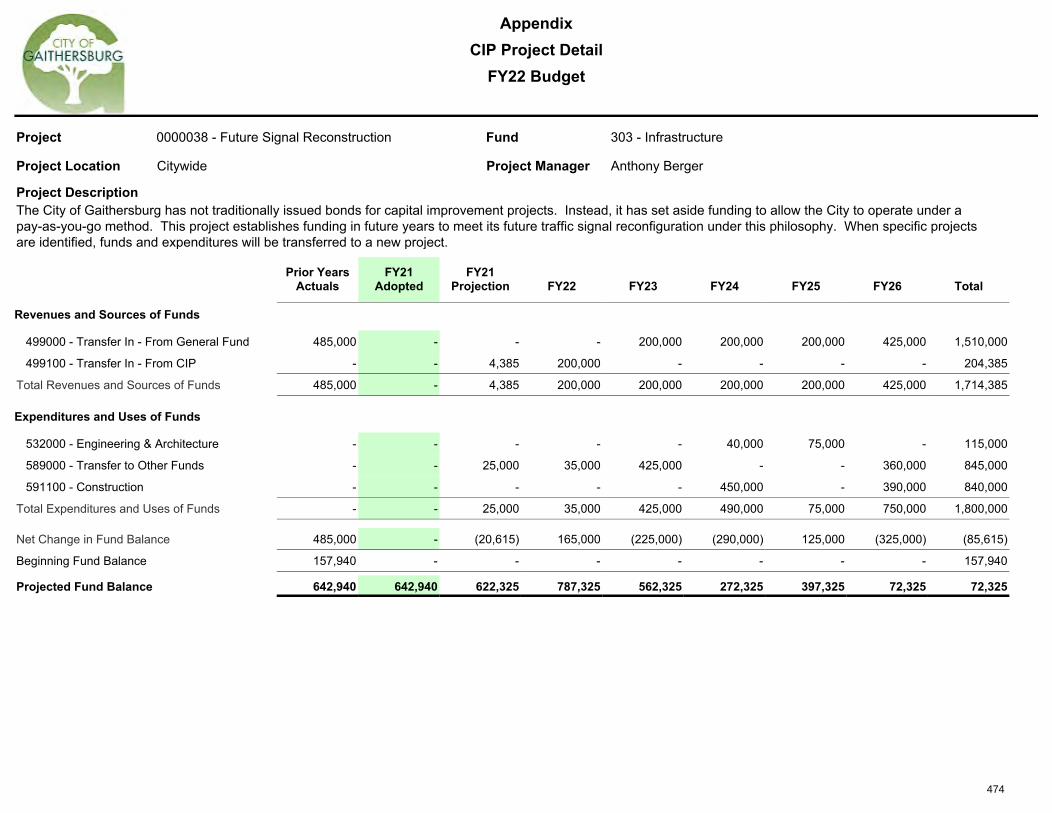
AppendixCIP Project Detail
FY22 Budget
Prior YearsActuals
FY21Adopted
FY21Projection FY22 FY23 FY24 FY25 FY26 Total
Revenues and Sources of Funds
499000 - Transfer In - From General Fund 485,000 - - - 200,000 200,000 200,000 425,000 1,510,000
499100 - Transfer In - From CIP - - 4,385 200,000 - - - - 204,385
Total Revenues and Sources of Funds 485,000 - 4,385 200,000 200,000 200,000 200,000 425,000 1,714,385
Expenditures and Uses of Funds
532000 - Engineering & Architecture - - - - - 40,000 75,000 - 115,000
589000 - Transfer to Other Funds - - 25,000 35,000 425,000 - - 360,000 845,000
591100 - Construction - - - - - 450,000 - 390,000 840,000
Total Expenditures and Uses of Funds - - 25,000 35,000 425,000 490,000 75,000 750,000 1,800,000
Net Change in Fund Balance 485,000 - (20,615) 165,000 (225,000) (290,000) 125,000 (325,000) (85,615)
Project 0000038 - Future Signal Reconstruction Fund 303 - Infrastructure
Beginning Fund Balance 157,940 - - - - - - - 157,940
Projected Fund Balance 642,940 642,940 622,325 787,325 562,325 272,325 397,325 72,325 72,325
Project DescriptionThe City of Gaithersburg has not traditionally issued bonds for capital improvement projects. Instead, it has set aside funding to allow the City to operate under apay-as-you-go method. This project establishes funding in future years to meet its future traffic signal reconfiguration under this philosophy. When specific projectsare identified, funds and expenditures will be transferred to a new project.
Project Location Citywide Project Manager Anthony Berger
474

AppendixCIP Project Detail
FY22 Budget
Prior YearsActuals
FY21Adopted
FY21Projection FY22 FY23 FY24 FY25 FY26 Total
Revenues and Sources of Funds
499000 - Transfer In - From General Fund 50,000 - - - - - - - 50,000
499100 - Transfer In - From CIP - - - - - - - 360,000 360,000
Total Revenues and Sources of Funds 50,000 - - - - - - 360,000 410,000
Expenditures and Uses of Funds
532000 - Engineering & Architecture - - - - - - - 35,000 35,000
591100 - Construction - - - - - - - 375,000 375,000
Total Expenditures and Uses of Funds - - - - - - - 410,000 410,000
Net Change in Fund Balance 50,000 - - - - - - (50,000) -
Project 0000039 - E. Diamond Ave and Chestnut St - SignalRecon Fund 303 - Infrastructure
Beginning Fund Balance 10,000 - - - - - - - 10,000
Projected Fund Balance 60,000 60,000 60,000 60,000 60,000 60,000 60,000 10,000 10,000
Project DescriptionThe project involves the design and reconstruction of the signal at E. Diamond Ave. and Chestnut St. This project was originally scheduled for design in FY20 withconstruction in FY21. Reconstruction of this signal has been reprioritized, with design and construction planned for FY26.
Project Location East Diamond Avenue and Chestnut Street Project Manager Mark Kile
475

AppendixCIP Project Detail
FY22 Budget
Prior YearsActuals
FY21Adopted
FY21Projection FY22 FY23 FY24 FY25 FY26 Total
Revenues and Sources of Funds
499000 - Transfer In - From General Fund 194,142 - - - - - - - 194,142
Total Revenues and Sources of Funds 194,142 - - - - - - - 194,142
Expenditures and Uses of Funds
532000 - Engineering & Architecture - 55,000 - - 60,000 - - - 60,000
536000 - Miscellaneous ProfessionalServices 76,235 - 8,215 - - - - - 84,450
Total Expenditures and Uses of Funds 76,235 55,000 8,215 - 60,000 - - - 144,450
Net Change in Fund Balance 117,907 (55,000) (8,215) - (60,000) - - - 49,692
Project 0000042 - Annual Long Span Bridges Program Fund 303 - Infrastructure
Beginning Fund Balance 130,858 - - - - - - - 130,858
Projected Fund Balance 248,765 193,765 240,550 240,550 180,550 180,550 180,550 180,550 180,550
Project DescriptionThis project provides for the biennial maintenance for the following long span bridges: Bureau Drive, Diamond Drive, Solitaire Court, Upshire Circle, and VictoryFarm Drive. The City conducts biennial inspections of its long-span bridges and then makes any necessary repairs in the following year.
Project Location Citywide Project Manager Essay Habteselassie
476

AppendixCIP Project Detail
FY22 Budget
Prior YearsActuals
FY21Adopted
FY21Projection FY22 FY23 FY24 FY25 FY26 Total
Revenues and Sources of Funds
499000 - Transfer In - From General Fund 1,405,858 - - - 150,000 150,000 200,000 300,000 2,205,858
499100 - Transfer In - From CIP 294,935 - - - - - - - 294,935
Total Revenues and Sources of Funds 1,700,793 - - - 150,000 150,000 200,000 300,000 2,500,793
Expenditures and Uses of Funds
536000 - Miscellaneous ProfessionalServices 1,987 - - - - - - - 1,987
589000 - Transfer to Other Funds 20,000 496,000 567,420 465,000 - - - - 1,052,420
591100 - Construction - - - - 350,000 350,000 350,000 350,000 1,400,000
Total Expenditures and Uses of Funds 21,987 496,000 567,420 465,000 350,000 350,000 350,000 350,000 2,454,407
Net Change in Fund Balance 1,678,806 (496,000) (567,420) (465,000) (200,000) (200,000) (150,000) (50,000) 46,386
Project 0000045 - Future Bridges & Culverts Projects Fund 303 - Infrastructure
Beginning Fund Balance - - - - - - - - -
Projected Fund Balance 1,678,806 1,182,806 1,111,386 646,386 446,386 246,386 96,386 46,386 46,386
Project DescriptionThe City of Gaithersburg has not traditionally issued bonds for capital improvement projects. Instead, it has set aside funding to allow the City to operate under apay-as-you-go method. This project establishes funding in future years to meet its future bridge and culvert improvements under this philosophy. Many of the City'slong span bridges represent significant assets. This project serves as a holding place for future projects.
Project Location Citywide Project Manager Anthony Berger
477

AppendixCIP Project Detail
FY22 Budget
Prior YearsActuals
FY21Adopted
FY21Projection FY22 FY23 FY24 FY25 FY26 Total
Revenues and Sources of Funds
434940 - State Grant - Bond Bill(s) - - - 250,000 - - - - 250,000
467200 - Miscellaneous - 1,400,000 1,400,000 400,000 1,800,000 400,000 - - 4,000,000
499000 - Transfer In - From General Fund 400,000 352,920 352,920 (650,000) - (400,000) - - (297,080)
499100 - Transfer In - From CIP 372,080 - - - - - - - 372,080
Total Revenues and Sources of Funds 772,080 1,752,920 1,752,920 - 1,800,000 - - - 4,325,000
Expenditures and Uses of Funds
532000 - Engineering & Architecture 65,102 350,000 - 525,000 - - - - 590,102
591100 - Construction - 2,050,000 - - 3,600,000 - - - 3,600,000
Total Expenditures and Uses of Funds 65,102 2,400,000 - 525,000 3,600,000 - - - 4,190,102
Net Change in Fund Balance 706,978 (647,080) 1,752,920 (525,000) (1,800,000) - - - 134,898
Project 0000131 - Pedestrian Path over Great SenecaHighway Fund 303 - Infrastructure
Beginning Fund Balance - - - - - - - - -
Projected Fund Balance 706,978 59,898 2,459,898 1,934,898 134,898 134,898 134,898 134,898 134,898
Project Descriptionthis project involves the construction of a pedestrian bridge across Great Seneca Highway at the intersection of Kentlands Blvd. and Orchard Ridge Drive. Theconcept design was completed in FY19, and the detailed design is planned for FY22, with construction planned for FY23.Operating Budget ImpactsThis structure will be a new asset and will require annual maintenance and additional operating budget.
Project LocationIntersection of Great Seneca Highway andKentlands Boulevard Project Manager Anthony Berger
478

AppendixCIP Project Detail
FY22 Budget
Prior YearsActuals
FY21Adopted
FY21Projection FY22 FY23 FY24 FY25 FY26 Total
Revenues and Sources of Funds
499100 - Transfer In - From CIP 12,500 240,500 240,500 - - - - - 253,000
Total Revenues and Sources of Funds 12,500 240,500 240,500 - - - - - 253,000
Expenditures and Uses of Funds
591100 - Construction - 250,000 - 250,000 - - - - 250,000
Total Expenditures and Uses of Funds - 250,000 - 250,000 - - - - 250,000
Net Change in Fund Balance 12,500 (9,500) 240,500 (250,000) - - - - 3,000
Project 0000136 - Bureau Drive Culvert Maintenance Repair Fund 303 - Infrastructure
Beginning Fund Balance - - - - - - - - -
Projected Fund Balance 12,500 3,000 253,000 3,000 3,000 3,000 3,000 3,000 3,000
Project DescriptionThis project involves the repair of structure (MG-02) which is on the National Bridge Inventory and carries an arterial roadway. It is comprised of a single cellcorrugated steel arch at the upstream end and a double cell corrugated aluminum pipe arch at the downstream end. The major repair items will include replacementof the drain pipes at the north wall of the single pipe arch.Project design was completed in FY21 in project 0000042 and repairs are scheduled to be completed in FY22.
Project Location
Bureau Drive over a tributary to Long DraughtBranch (about 200 feet north of West DiamondAvenue and Bureau Drive intersection) Project Manager Essay Habteselassie
479

AppendixCIP Project Detail
FY22 Budget
Prior YearsActuals
FY21Adopted
FY21Projection FY22 FY23 FY24 FY25 FY26 Total
Revenues and Sources of Funds
499100 - Transfer In - From CIP 332,500 - - - - - - - 332,500
Total Revenues and Sources of Funds 332,500 - - - - - - - 332,500
Expenditures and Uses of Funds
591100 - Construction - 250,000 - 250,000 - - - - 250,000
Total Expenditures and Uses of Funds - 250,000 - 250,000 - - - - 250,000
Net Change in Fund Balance 332,500 (250,000) - (250,000) - - - - 82,500
Project 0000137 - Diamond Drive Culvert MaintenanceRepair Project Fund 303 - Infrastructure
Beginning Fund Balance - - - - - - - - -
Projected Fund Balance 332,500 82,500 332,500 82,500 82,500 82,500 82,500 82,500 82,500
Project DescriptionThis project involves the repair of structure (MG-07) which carries a primary residential roadway and is composed of two cells, each 8'X5'4'' arch shape metal pipes.This structure is not on the National Bridge Inventory. The major repair items will be circumferential pipe plating at selected locations, and full length longitudinal pipeplating for both cells.Project design was completed in FY21 in project 0000042 with repairs scheduled to be completed in FY22.
Project Location
Diamond Drive over a tributary leading to ClopperLake (about 300 ft. west of Diamond Drive andQuince Orchard Boulevard intersection) Project Manager Essay Habteselassie
480

AppendixCIP Project Detail
FY22 Budget
Prior YearsActuals
FY21Adopted
FY21Projection FY22 FY23 FY24 FY25 FY26 Total
Revenues and Sources of Funds
499100 - Transfer In - From CIP 12,500 50,500 50,500 - - - - - 63,000
Total Revenues and Sources of Funds 12,500 50,500 50,500 - - - - - 63,000
Expenditures and Uses of Funds
591100 - Construction - 60,000 - 60,000 - - - - 60,000
Total Expenditures and Uses of Funds - 60,000 - 60,000 - - - - 60,000
Net Change in Fund Balance 12,500 (9,500) 50,500 (60,000) - - - - 3,000
Project 0000140 - Upshire Cir. Culvert Maintenance RepairProject Fund 303 - Infrastructure
Beginning Fund Balance - - - - - - - - -
Projected Fund Balance 12,500 3,000 63,000 3,000 3,000 3,000 3,000 3,000 3,000
Project DescriptionThe project involves repair of the deficiencies observed during the inspection of this structure (MG-04) by Montgomery County and will be repaired per the detaildesign performed by the City following the inspection. The structure carries a secondary residential roadway and is on the National Bridge Inventory.Project design was completed in prior years from project 0000042 and construction is scheduled to be completed in FY22.
Project Location
Upshire Circle over a tributary to Shady Branch(about 600 feet north of Upshire Circle andMidsummer Circle intersection) Project Manager Essay Habteselassie
481

AppendixCIP Project Detail
FY22 Budget
Prior YearsActuals
FY21Adopted
FY21Projection FY22 FY23 FY24 FY25 FY26 Total
Revenues and Sources of Funds
499100 - Transfer In - From CIP 12,500 150,000 150,000 - - - - - 162,500
Total Revenues and Sources of Funds 12,500 150,000 150,000 - - - - - 162,500
Expenditures and Uses of Funds
591100 - Construction - 150,000 - 150,000 - - - - 150,000
Total Expenditures and Uses of Funds - 150,000 - 150,000 - - - - 150,000
Net Change in Fund Balance 12,500 - 150,000 (150,000) - - - - 12,500
Project 0000141 - Victory Farm Drive Culvert MaintenanceProject Fund 303 - Infrastructure
Beginning Fund Balance - - - - - - - - -
Projected Fund Balance 12,500 12,500 162,500 12,500 12,500 12,500 12,500 12,500 12,500
Project DescriptionThis project involves the repair of structure (MG-05) which carries an arterial roadway and is comprised of a two cell corrugated metal pipe structure. Thedeficiencies observed during the inspection of this structure by Montgomery County will be repaired per the detail design performed by the City following theinspection. The major repair items will be circumferential pipe plating at selected locations to address corrosions and section losses. Project design was completed in prior years from project 0000042 and construction is scheduled to be completed in FY22
Project Location
This structure is located on Victory Farm Drive overa tributary to Whetstone Run (between Girard Streetand Belle Grove Road) Project Manager Essay Habteselassie
482

AppendixCIP Project Detail
FY22 Budget
Prior YearsActuals
FY21Adopted
FY21Projection FY22 FY23 FY24 FY25 FY26 Total
Revenues and Sources of Funds
499000 - Transfer In - From General Fund 30,000 - - - - - - - 30,000
499100 - Transfer In - From CIP - 20,000 30,000 150,000 - - - - 180,000
Total Revenues and Sources of Funds 30,000 20,000 30,000 150,000 - - - - 210,000
Expenditures and Uses of Funds
532000 - Engineering & Architecture 32,531 50,000 25,480 - - - - - 58,011
591100 - Construction - - - 150,000 - - - - 150,000
Total Expenditures and Uses of Funds 32,531 50,000 25,480 150,000 - - - - 208,011
Net Change in Fund Balance (2,531) (30,000) 4,520 - - - - - 1,989
Project 0000142 - ZC22CPR - Tschiffely Square RoadCulvert Maintenance Repair Fund 303 - Infrastructure
Beginning Fund Balance - - - - - - - - -
Projected Fund Balance (2,531) (32,531) 1,989 1,989 1,989 1,989 1,989 1,989 1,989
Project DescriptionThis project involves the repair the road culvert structure (42" diameter) located at Tschiffely Square. The inspection report recommends replacement of the headwalland other minor repairs. Project design was completed in FY21 with construction scheduled for FY22.
Project LocationTschiffely Square Road over a tributary to LakeLynette Project Manager Essay Habteselassie
483

AppendixCIP Project Detail
FY22 Budget
Prior YearsActuals
FY21Adopted
FY21Projection FY22 FY23 FY24 FY25 FY26 Total
Revenues and Sources of Funds
499000 - Transfer In - From General Fund 15,000 - - - - - - - 15,000
499100 - Transfer In - From CIP 20,000 35,000 55,000 200,000 - - - - 275,000
Total Revenues and Sources of Funds 35,000 35,000 55,000 200,000 - - - - 290,000
Expenditures and Uses of Funds
532000 - Engineering & Architecture - 50,000 87,603 - - - - - 87,603
591100 - Construction - - - 200,000 - - - - 200,000
Total Expenditures and Uses of Funds - 50,000 87,603 200,000 - - - - 287,603
Net Change in Fund Balance 35,000 (15,000) (32,603) - - - - - 2,397
Project 0000143 - ZC53CPR - Tschiffely Square CulvertMaintenance Repair Proje Fund 303 - Infrastructure
Beginning Fund Balance - - - - - - - - -
Projected Fund Balance 35,000 20,000 2,397 2,397 2,397 2,397 2,397 2,397 2,397
Project DescriptionThis project involves the repair the road culvert structure (42" diameter) located at Tschiffely Square. The inspection report recommends replacing two pipes andperforming other repair work due to spalls and cracks on the concrete pipes. Project design was completed in FY21 with construction planned for FY22.
Project LocationTschiffely Square Road over a tributary to LakeHelene Project Manager Essay Habteselassie
484

AppendixCIP Project Detail
FY22 Budget
Prior YearsActuals
FY21Adopted
FY21Projection FY22 FY23 FY24 FY25 FY26 Total
Revenues and Sources of Funds
499100 - Transfer In - From CIP - - 25,000 355,000 - - - - 380,000
Total Revenues and Sources of Funds - - 25,000 355,000 - - - - 380,000
Expenditures and Uses of Funds
532000 - Engineering & Architecture - 25,000 25,000 - - - - - 25,000
591100 - Construction - - - 330,000 - - - - 330,000
Total Expenditures and Uses of Funds - 25,000 25,000 330,000 - - - - 355,000
Net Change in Fund Balance - (25,000) - 25,000 - - - - 25,000
Project 0000153 - East Diamond Avenue & Summit AvenueSignal Improvements Fund 303 - Infrastructure
Beginning Fund Balance
Projected Fund Balance - (25,000) - 25,000 25,000 25,000 25,000 25,000 25,000
Project DescriptionThis project involves improvements to the signal system including upgrading the pedestrian signals and realigning sidewalk ramps for ADA compliance. The projectwill also include intersection lighting improvements. Design was completed in FY21 with construction planned for FY22.
Project LocationIntersection of East Diamond Avenue and SummitAvenue Project Manager Essay Habteselassie
485

AppendixCIP Project Detail
FY22 Budget
Prior YearsActuals
FY21Adopted
FY21Projection FY22 FY23 FY24 FY25 FY26 Total
Revenues and Sources of Funds
499100 - Transfer In - From CIP - - - 1,750,000 500,000 - - - 2,250,000
Total Revenues and Sources of Funds - - - 1,750,000 500,000 - - - 2,250,000
Expenditures and Uses of Funds
532000 - Engineering & Architecture - - - 250,000 - - - - 250,000
591100 - Construction - - - 1,500,000 500,000 - - - 2,000,000
Total Expenditures and Uses of Funds - - - 1,750,000 500,000 - - - 2,250,000
Net Change in Fund Balance - - - - - - - - -
Project 0000154 - Edison Park Drive & Main Street Fund 303 - Infrastructure
Beginning Fund Balance
Projected Fund Balance - - - - - - - - -
Project DescriptionThis project will reconstruct Edison Park Drive with structural pavement capable of carrying heavy vehicle loads as well as resurface Main Street. The project alsoincludes installation of anti parallel parking measures along each road and will address all areas of erosion along the shoulders. Design will be in FY22 withconstruction in FY23.
Project Location
Edison Park Drive & Main Street - each fromDarnestown Road to Montgomery County parking lotdriveway Project Manager Mark Kile
486

AppendixCIP Project Detail
FY22 Budget
Prior YearsActuals
FY21Adopted
FY21Projection FY22 FY23 FY24 FY25 FY26 Total
Revenues and Sources of Funds
499000 - Transfer In - From General Fund - 80,000 80,000 - - - - - 80,000
Total Revenues and Sources of Funds - 80,000 80,000 - - - - - 80,000
Expenditures and Uses of Funds
532000 - Engineering & Architecture - 30,000 30,000 - - - - - 30,000
591100 - Construction - 50,000 - 50,000 - - - - 50,000
Total Expenditures and Uses of Funds - 80,000 30,000 50,000 - - - - 80,000
Net Change in Fund Balance - - 50,000 (50,000) - - - - -
Project 0000155 - Pheasant Run Drive Improvements Fund 303 - Infrastructure
Beginning Fund Balance
Projected Fund Balance - - 50,000 - - - - - -
Project DescriptionThis project will conduct an engineering study and construct improvements that may be necessary related to traffic calming as a result of the opening of the WatkinsMill Interchange. If additional construction funds are necessary, they will be transferred from 0000032 Future Street Construction upon the completion of theengineering study. This project will be completed in FY22.
Project LocationPheasant Run Drive from Clopper Road to LongdraftRoad Project Manager Mark Kile
487

AppendixCIP Project Detail
FY22 Budget
Prior YearsActuals
FY21Adopted
FY21Projection FY22 FY23 FY24 FY25 FY26 Total
Revenues and Sources of Funds
437150 - County Grant - Miscellaneous - 225,000 225,000 800,000 600,000 - - - 1,625,000
Total Revenues and Sources of Funds - 225,000 225,000 800,000 600,000 - - - 1,625,000
Expenditures and Uses of Funds
532000 - Engineering & Architecture - 225,000 225,000 200,000 - - - - 425,000
591100 - Construction - - - 450,000 750,000 - - - 1,200,000
Total Expenditures and Uses of Funds - 225,000 225,000 650,000 750,000 - - - 1,625,000
Net Change in Fund Balance - - - 150,000 (150,000) - - - -
Project 0000156 - Quince Orchard Boulevard Shared UsePath Fund 303 - Infrastructure
Beginning Fund Balance
Projected Fund Balance - - - 150,000 - - - - -
Project DescriptionThis project will construct a shared use path along Quince Orchard and will be incorporated with future roadway reconstruction projects. The Shared Use Path willrun along Quince Orchard Boulevard, starting at First Field Road and terminating at First Field Road and Quince Orchard. The path will require utility relocation, curbrealignment, lighting adjustments and applicable stormwater management. Design began in FY21 with construction planned for FY22/23.Operating Budget ImpactsThere will be additional operating budget impacts related to additional maintenance for the path.
Project Location Quince Orchard Boulevard Project Manager Mark Kile
488

AppendixCIP Project Detail
FY22 Budget
Prior YearsActuals
FY21Adopted
FY21Projection FY22 FY23 FY24 FY25 FY26 Total
Revenues and Sources of Funds
499100 - Transfer In - From CIP - - - 35,000 425,000 - - - 460,000
Total Revenues and Sources of Funds - - - 35,000 425,000 - - - 460,000
Expenditures and Uses of Funds
532000 - Engineering & Architecture - - - 35,000 - - - - 35,000
591100 - Construction - - - - 425,000 - - - 425,000
Total Expenditures and Uses of Funds - - - 35,000 425,000 - - - 460,000
Net Change in Fund Balance - - - - - - - - -
Project 0000157 - Russell Avenue & Christopher AvenueSignal Recon Fund 303 - Infrastructure
Beginning Fund Balance
Projected Fund Balance - - - - - - - - -
Project DescriptionThis project involves improvements to the signal system including upgrading the pedestrian signals and realigning sidewalk ramps for ADA compliance. Design willbe in FY22 with construction in FY23.
Project LocationIntersection of Russell Avenue and ChristopherAvenue Project Manager Anthony Berger
489

AppendixCIP New Project Detail
FY22 Budget
Prior YearsActuals
FY21Adopted
FY21Projection FY22 FY23 FY24 FY25 FY26 Total
Revenues and Sources of Funds
499100 - Transfer In - From CIP - - 41,420 115,000 - - - - 156,420
Total Revenues and Sources of Funds - - 41,420 115,000 - - - - 156,420
Expenditures and Uses of Funds
532000 - Engineering & Architecture - - 41,420 - - - - - 41,420
591100 - Construction - - - 115,000 - - - - 115,000
Total Expenditures and Uses of Funds - - 41,420 115,000 - - - - 156,420
Net Change in Fund Balance - - - - - - - - -
Project 0000168 - Casey Community Center PedestrianBridge
Fund 303 - Infrastructure
Beginning Fund Balance
Projected Fund Balance - - - - - - - - -
Project DescriptionThis project involves the replacement of a pedestrian bridge behind the Casey Community Center. This bridge is currently closed because of its condition. Thisbridge connects the adjacent residential neighborhood to the center. Project design was completed in FY21 and construction is planned for FY22.
Operating Budget ImpactsBecause this is a replacement of an existing bridge there is no additional impacts on the operating budget.
Project LocationBehind the Casey Community Center. 810 SouthFrederick Avenue Project Manager Essay Habteselassie
490

AppendixCIP Project Detail
FY22 Budget
Prior YearsActuals
FY21Adopted
FY21Projection FY22 FY23 FY24 FY25 FY26 Total
Revenues and Sources of Funds
499000 - Transfer In - From General Fund 600,000 200,000 200,000 - 200,000 200,000 200,000 200,000 1,600,000
499100 - Transfer In - From CIP 7,042 - 20,631 200,000 - - - - 227,673
Total Revenues and Sources of Funds 607,042 200,000 220,631 200,000 200,000 200,000 200,000 200,000 1,827,673
Expenditures and Uses of Funds
532000 - Engineering & Architecture - 250,000 - - - - - - -
591100 - Construction 326,877 - - 800,000 800,000 - - - 1,926,877
Total Expenditures and Uses of Funds 326,877 250,000 - 800,000 800,000 - - - 1,926,877
Net Change in Fund Balance 280,165 (50,000) 220,631 (600,000) (600,000) 200,000 200,000 200,000 (99,204)
Project 0000048 - Future City Hall Projects Fund 304 - Facilities
Beginning Fund Balance 1,289,817 - - - - - - - 1,289,817
Projected Fund Balance 1,569,982 1,519,982 1,790,613 1,190,613 590,613 790,613 990,613 1,190,613 1,190,613
Project DescriptionThe City of Gaithersburg has not traditionally issued bonds for capital improvement projects. Instead, it has set aside funding to allow the City to operate under apay-as-you-go method. This project establishes funding in future years to meet City Hall improvements under this philosophy. When specific projects are identified,funds and expenditures will be transferred to a new project.
The City conducted a Facility Condition Assessment and User Needs Analysis of City Hall in FY18. Based on the recommendations of the study, a number ofprojects have been created to address items from this study. Design of some of the highest priority items should take place in FY22 with construction to address theprojects starting in FY22 and FY23 to coincide with the completion of the 16 S. Summit AvenueOperating Budget ImpactsThere will be short term operating impacts to handle relocation of staff while these projects are ongoing.
Project Location City Hall, 31 South Summit Avenue Project Manager Dennis Enslinger
304 - Facilities
491

AppendixCIP Project Detail
FY22 Budget
Prior YearsActuals
FY21Adopted
FY21Projection FY22 FY23 FY24 FY25 FY26 Total
Revenues and Sources of Funds
499000 - Transfer In - From General Fund 212,228 - - 155,000 - - - - 367,228
Total Revenues and Sources of Funds 212,228 - - 155,000 - - - - 367,228
Expenditures and Uses of Funds
532000 - Engineering & Architecture 70,522 - - 30,000 - - - - 100,522
591100 - Construction - - - 650,000 - - - - 650,000
Total Expenditures and Uses of Funds 70,522 - - 680,000 - - - - 750,522
Net Change in Fund Balance 141,706 - - (525,000) - - - - (383,294)
Project 0000049 - Public Works - Fuel Facility Fund 304 - Facilities
Beginning Fund Balance 387,772 - - - - - - - 387,772
Projected Fund Balance 529,478 529,478 529,478 4,478 4,478 4,478 4,478 4,478 4,478
Project DescriptionThis project consists of the replacement of three 10K gallon fuel tanks, new pumps, dispensing units, above-ground diesel exhaust fluid (DEF) tank and DEFenclosure, air hose & compressor, vehicle vacuum and all of the associated plumbing and electrical work. The new tanks will have the added benefit of allowing theCity to go to a higher concentration of ethanol in our unleaded gas (cars) and continuing to use a more environmentally friendly bio-diesel fuel. Design wascompleted in FY20. Construction is scheduled for FY22.
Project Location Public Works, 800 Rabbitt Road Project Manager McNeal Brown
492

AppendixCIP Project Detail
FY22 Budget
Prior YearsActuals
FY21Adopted
FY21Projection FY22 FY23 FY24 FY25 FY26 Total
Revenues and Sources of Funds
499000 - Transfer In - From General Fund 2,412,772 - - 475,000 875,000 875,000 875,000 875,000 6,387,772
499100 - Transfer In - From CIP 249,851 467,090 467,090 - - - - - 716,941
Total Revenues and Sources of Funds 2,662,623 467,090 467,090 475,000 875,000 875,000 875,000 875,000 7,104,713
Expenditures and Uses of Funds
532000 - Engineering & Architecture - - - - 200,000 - - - 200,000
591100 - Construction - - - - - - 3,300,000 - 3,300,000
595060 - Machinery & Equipment - - - - - - 940,000 - 940,000
Total Expenditures and Uses of Funds - - - - 200,000 - 4,240,000 - 4,440,000
Net Change in Fund Balance 2,662,623 467,090 467,090 475,000 675,000 875,000 (3,365,000) 875,000 2,664,713
Project 0000053 - Future PW Facility Projects Fund 304 - Facilities
Beginning Fund Balance - - - - - - - - -
Projected Fund Balance 2,662,623 3,129,713 3,129,713 3,604,713 4,279,713 5,154,713 1,789,713 2,664,713 2,664,713
Project DescriptionThe City of Gaithersburg has not traditionally issued bonds for capital improvement projects. Instead, it has set aside funding to allow the City to operate under apay-as-you-go method. This project establishes funding in future years to meet Public Works facility improvements under this philosophy. When specific projects areidentified, funds and expenditures will be transferred to a new project.
The City conducted a Facility Condition Assessment and User Needs Analysis of the Public Works Facility in FY19. Based on the recommendations of the study, anumber of projects have been created to address items from this study. It is anticipated that the design of recommended improvements will begin in FY23 andconstruction will take place in FY25.
Project Location Public Works, 800 Rabbit Road Project Manager Melanie Brown
493

AppendixCIP Project Detail
FY22 Budget
Prior YearsActuals
FY21Adopted
FY21Projection FY22 FY23 FY24 FY25 FY26 Total
Revenues and Sources of Funds
499000 - Transfer In - From General Fund - 400,000 400,000 - - - - - 400,000
499100 - Transfer In - From CIP - - - 735,000 - - - - 735,000
Total Revenues and Sources of Funds - 400,000 400,000 735,000 - - - - 1,135,000
Expenditures and Uses of Funds
532000 - Engineering & Architecture - 112,000 - - - - - - -
591100 - Construction - - - - 1,321,020 - - - 1,321,020
Total Expenditures and Uses of Funds - 112,000 - - 1,321,020 - - - 1,321,020
Net Change in Fund Balance - 288,000 400,000 735,000 (1,321,020) - - - (186,020)
Project 0000054 - Olde Towne Parking Garage - 3 ElevatorUpgrades Fund 304 - Facilities
Beginning Fund Balance 187,000 - - - - - - - 187,000
Projected Fund Balance 187,000 475,000 587,000 1,322,000 980 980 980 980 980
Project DescriptionThis project involves the design and construction of three new elevators at the Old Towne Parking Garage (OTPG). The elevator cars, controls, hydraulic fluidpumps, signals, sump pumps, tamper switches and pistons will all be replaced. Originally the design portion of this project was planned for FY21 with constructionin FY22, but project has been modified to use a design/build process and will be constructed in FY23. Operating Budget ImpactsNo additional operating impacts are expected. We anticipate a decrease in electric and maintenance costs due to these upgrades.
Project LocationOlde Towne Parking Garage, 112 Olde TowneAvenue Project Manager McNeal Brown
494

AppendixCIP Project Detail
FY22 Budget
Prior YearsActuals
FY21Adopted
FY21Projection FY22 FY23 FY24 FY25 FY26 Total
Revenues and Sources of Funds
499000 - Transfer In - From General Fund - - - - - 55,000 1,555,000 - 1,610,000
Total Revenues and Sources of Funds - - - - - 55,000 1,555,000 - 1,610,000
Expenditures and Uses of Funds
532000 - Engineering & Architecture - - - - - 55,000 - - 55,000
591100 - Construction - - - - - - 1,555,000 - 1,555,000
Total Expenditures and Uses of Funds - - - - - 55,000 1,555,000 - 1,610,000
Net Change in Fund Balance - - - - - - - - -
Project 0000055 - Public Works - Upgrade Generator Fund 304 - Facilities
Beginning Fund Balance - - - - - - - - -
Projected Fund Balance - - - - - - - - -
Project DescriptionThis project involves the upgrade of the current generator at the Public Works (PW) Complex. The current generator will not be able to handle the additional load forany additional facility enhancements. Also, the current generator only supports the fuel pumps and very few operational needs within the facility. If an emergencyoccurred, multiple areas like the fleet shop and other equipment areas would need power to support hurricane, earthquake, and snow removal operations. Thegenerator design will coincide with the larger PW construction project. Design will begin in FY24 and construction in FY25.Operating Budget ImpactsOperating impacts will be additional service contract costs which are roughly $3,500 per year and additional fuel costs charged to Account 1153 - Building &Grounds - Public Service Facility.
Project Location Public Works Complex, 800 Rabbitt Road Project Manager Ron Kaczmarek
495

AppendixCIP Project Detail
FY22 Budget
Prior YearsActuals
FY21Adopted
FY21Projection FY22 FY23 FY24 FY25 FY26 Total
Revenues and Sources of Funds
499000 - Transfer In - From General Fund 106,000 - - - - - - - 106,000
499100 - Transfer In - From CIP - - - 5,000 - - - - 5,000
Total Revenues and Sources of Funds 106,000 - - 5,000 - - - - 111,000
Expenditures and Uses of Funds
532000 - Engineering & Architecture - - 2,460 - - - - - 2,460
591100 - Construction 20,439 - - 85,000 - - - - 105,439
Total Expenditures and Uses of Funds 20,439 - 2,460 85,000 - - - - 107,899
Net Change in Fund Balance 85,561 - (2,460) (80,000) - - - - 3,101
Project 0000057 - Public Works - Existing Salt Bldg.Structural Repairs Fund 304 - Facilities
Beginning Fund Balance - - - - - - - - -
Projected Fund Balance 85,561 85,561 83,101 3,101 3,101 3,101 3,101 3,101 3,101
Project DescriptionThis project involves replacement of four damaged wooden columns in the front of the existing salt barn/open storage building. The existing columns will be replacedwith steel columns that will have concrete footers. This project will be completed in FY22.
Project Location Public Works Facility, 800 Rabbitt Road Project Manager McNeal Brown
496

AppendixCIP Project Detail
FY22 Budget
Prior YearsActuals
FY21Adopted
FY21Projection FY22 FY23 FY24 FY25 FY26 Total
Revenues and Sources of Funds
499000 - Transfer In - From General Fund 45,000 10,000 10,000 - - - - - 55,000
499100 - Transfer In - From CIP 265,000 - - - - - - - 265,000
Total Revenues and Sources of Funds 310,000 10,000 10,000 - - - - - 320,000
Expenditures and Uses of Funds
532000 - Engineering & Architecture 1,500 10,000 30,000 15,000 9,000 - - - 55,500
536000 - Miscellaneous ProfessionalServices 272,506 - - - - - - - 272,506
591100 - Construction - 165,000 - 75,000 20,000 - - - 95,000
Total Expenditures and Uses of Funds 274,006 175,000 30,000 90,000 29,000 - - - 423,006
Net Change in Fund Balance 35,994 (165,000) (20,000) (90,000) (29,000) - - - (103,006)
Project 0000059 - Utility Assessment Fund 304 - Facilities
Beginning Fund Balance 150,000 - - - - - - - 150,000
Projected Fund Balance 185,994 20,994 165,994 75,994 46,994 46,994 46,994 46,994 46,994
Project DescriptionThis project is being conducted to assist the City in tracking reduction of utility use and the City's carbon footprint. Based on a utility study done in FY18, this projectincludes the installation of submeters at two park locations: Robinson Park Youth Center (to track the amount of water the irrigation system uses for the sportsfields), and Bohrer Park complex (to add additional electrical water meters to track usage by the various buildings/structures). Design will be completed in FY22 andconstruction will be completed in FY23.Operating Budget ImpactsBased on these energy projects, there will be a decrease in the operating line items for electric, water, and natural gas based on the projects selected.
Project Location Robertson Park, 801 Rabbitt Road & Bohrer Park,506 South Frederick Avenue Project Manager Ron Kaczmarek
497

AppendixCIP Project Detail
FY22 Budget
Prior YearsActuals
FY21Adopted
FY21Projection FY22 FY23 FY24 FY25 FY26 Total
Revenues and Sources of Funds
499000 - Transfer In - From General Fund - 55,000 55,000 - - - - - 55,000
Total Revenues and Sources of Funds - 55,000 55,000 - - - - - 55,000
Expenditures and Uses of Funds
532000 - Engineering & Architecture - 55,000 36,450 18,550 - - - - 55,000
Total Expenditures and Uses of Funds - 55,000 36,450 18,550 - - - - 55,000
Net Change in Fund Balance - - 18,550 (18,550) - - - - -
Project 0000117 - Casey Community Center Facility -Assessment Fund 304 - Facilities
Beginning Fund Balance
Projected Fund Balance - - 18,550 - - - - - -
Project DescriptionThe project will be to conduct a Facility Condition Assessment (FCA) and Facility User Needs Analysis (FUNA). This project is scheduled for FY21 and will becompleted in FY22.
Project LocationCasey Community Center, 810 South FrederickAvenue Project Manager McNeal Brown
498

AppendixCIP Project Detail
FY22 Budget
Prior YearsActuals
FY21Adopted
FY21Projection FY22 FY23 FY24 FY25 FY26 Total
Revenues and Sources of Funds
499000 - Transfer In - From General Fund - 20,000 20,000 - - - - - 20,000
499100 - Transfer In - From CIP - - - 50,000 - - - - 50,000
Total Revenues and Sources of Funds - 20,000 20,000 50,000 - - - - 70,000
Expenditures and Uses of Funds
532000 - Engineering & Architecture - 20,000 20,000 - - - - - 20,000
591100 - Construction - - - 50,000 - - - - 50,000
Total Expenditures and Uses of Funds - 20,000 20,000 50,000 - - - - 70,000
Net Change in Fund Balance - - - - - - - - -
Project 0000118 - City Parking Lot - Pavement Assessment Fund 304 - Facilities
Beginning Fund Balance
Projected Fund Balance - - - - - - - - -
Project DescriptionThis project involves conducting a Pavement Condition Index inspection on existing parking lots. This data will be used to determine future maintenance needs. Anyfuture expenditures related to repairs will need to be budgeted either in the operations budget or as a future CIP project. This study will be performed in FY22 inconjunction with the FY22 roadway assessment. In FY22, initial minor repairs will be performed on parking lots as further projects are developed.Operating Budget ImpactsThe study will result in a maintenance program for our parking lots that will be funded from the operating budget and additional future CIP Projects.
Project Location Citywide Project Manager McNeal Brown
499

AppendixCIP Project Detail
FY22 Budget
Prior YearsActuals
FY21Adopted
FY21Projection FY22 FY23 FY24 FY25 FY26 Total
Revenues and Sources of Funds
499000 - Transfer In - From General Fund 50,000 25,000 25,000 - - - - - 75,000
499100 - Transfer In - From CIP - - - 15,000 - - - - 15,000
Total Revenues and Sources of Funds 50,000 25,000 25,000 15,000 - - - - 90,000
Expenditures and Uses of Funds
532000 - Engineering & Architecture - - - 15,000 - - - - 15,000
591100 - Construction - 50,000 - 75,000 - - - - 75,000
Total Expenditures and Uses of Funds - 50,000 - 90,000 - - - - 90,000
Net Change in Fund Balance 50,000 (25,000) 25,000 (75,000) - - - - -
Project 0000119 - DPW Sand Filter Outfall Replacement Fund 304 - Facilities
Beginning Fund Balance - - - - - - - - -
Projected Fund Balance 50,000 25,000 75,000 - - - - - -
Project DescriptionThis project involves the replacement of the outfall pipe from the sand filter facility located at the Public Works maintenance yard. Per the CCTV inspection footageand inspection report, the existing corrugated metal pipe (CMP) is corroded and needs to be replaced. No SWM credits are available for conveyance infrastructurereplacement. This project will be completed concurrently with the Rabbitt Road Stream Restoration Project (SW00012) and is scheduled for design in FY22 withconstruction to be completed in FY23.
Project Location Public Works Department, 800 Rabbitt Road Project Manager Sean Stevens
500

AppendixCIP Project Detail
FY22 Budget
Prior YearsActuals
FY21Adopted
FY21Projection FY22 FY23 FY24 FY25 FY26 Total
Revenues and Sources of Funds
499000 - Transfer In - From General Fund - 45,000 45,000 - 110,000 - - - 155,000
Total Revenues and Sources of Funds - 45,000 45,000 - 110,000 - - - 155,000
Expenditures and Uses of Funds
532000 - Engineering & Architecture - 45,000 - - - - - - -
591100 - Construction - - - - 150,000 - - - 150,000
Total Expenditures and Uses of Funds - 45,000 - - 150,000 - - - 150,000
Net Change in Fund Balance - - 45,000 - (40,000) - - - 5,000
Project 0000144 - City Hall Historic Wood SidingReplacement Fund 304 - Facilities
Beginning Fund Balance
Projected Fund Balance - - 45,000 45,000 5,000 5,000 5,000 5,000 5,000
Project DescriptionThe project involves replacing the wood siding, fascia and trim boards on the wood frame portion of City Hall. The project work scope also includes addressing thesheathing and exterior vapor barrier. Design and construction are scheduled for FY23.
Project Location City Hall, 31 South Summit Avenue Project Manager Sunil Prithviraj
501

AppendixCIP Project Detail
FY22 Budget
Prior YearsActuals
FY21Adopted
FY21Projection FY22 FY23 FY24 FY25 FY26 Total
Revenues and Sources of Funds
499000 - Transfer In - From General Fund - 190,000 190,000 - - - - - 190,000
Total Revenues and Sources of Funds - 190,000 190,000 - - - - - 190,000
Expenditures and Uses of Funds
595060 - Machinery & Equipment - 190,000 - 190,000 - - - - 190,000
Total Expenditures and Uses of Funds - 190,000 - 190,000 - - - - 190,000
Net Change in Fund Balance - - 190,000 (190,000) - - - - -
Project 0000158 - City Hall HVAC AHU1 Replacement Fund 304 - Facilities
Beginning Fund Balance
Projected Fund Balance - - 190,000 - - - - - -
Project DescriptionThis project involves the replacement of one of the three main HVAC units at City Hall that has reached end of life and is incurring repeated service calls andcomponent failure. This project will be completed in FY22.Operating Budget ImpactsIt is anticipated that replacement of the unit will reduce facility repair costs.
Project Location City Hall, 31 South Summit Avenue Project Manager McNeal Brown
502

AppendixCIP Project Detail
FY22 Budget
Prior YearsActuals
FY21Adopted
FY21Projection FY22 FY23 FY24 FY25 FY26 Total
Revenues and Sources of Funds
499000 - Transfer In - From General Fund - - - - - 50,000 320,000 - 370,000
Total Revenues and Sources of Funds - - - - - 50,000 320,000 - 370,000
Expenditures and Uses of Funds
532000 - Engineering & Architecture - - - - - 50,000 - - 50,000
591100 - Construction - - - - - - 320,000 - 320,000
Total Expenditures and Uses of Funds - - - - - 50,000 320,000 - 370,000
Net Change in Fund Balance - - - - - - - - -
Project 0000159 - Wells Robertson House SidingReplacement Fund 304 - Facilities
Beginning Fund Balance
Projected Fund Balance - - - - - - - - -
Project DescriptionThis project involves the replacement of the wood siding, porch columns and windows with composite material or wood material. Design is scheduled for FY24 withconstruction in FY25.
Project Location Wells Robertson House, 1 Wells Avenue Project Manager Sunil Prithviraj
503

AppendixCIP New Project Detail
FY22 Budget
Prior YearsActuals
FY21Adopted
FY21Projection FY22 FY23 FY24 FY25 FY26 Total
Revenues and Sources of Funds
499000 - Transfer In - From General Fund - - - - 190,000 - - - 190,000
Total Revenues and Sources of Funds - - - - 190,000 - - - 190,000
Expenditures and Uses of Funds
595060 - Machinery & Equipment - - - - 190,000 - - - 190,000
Total Expenditures and Uses of Funds - - - - 190,000 - - - 190,000
Net Change in Fund Balance - - - - - - - - -
Project 0000169 - City Hall HVAC AHU2 Replacement Fund 304 - Facilities
Beginning Fund Balance
Projected Fund Balance - - - - - - - - -
Project DescriptionThis project involves the replacement of one of the three main HVAC units at City Hall that has reached end of life and is incurring repeated service calls andcomponent failure. This project will be completed in FY23.
Operating Budget ImpactsIt is anticipated that replacement of the unit will reduce facility repair costs.
Project Location City Hall, 31 South Summit Avenue Project Manager McNeal Brown
504

AppendixCIP Project Detail
FY22 Budget
Prior YearsActuals
FY21Adopted
FY21Projection FY22 FY23 FY24 FY25 FY26 Total
Revenues and Sources of Funds
499000 - Transfer In - From General Fund 315,000 - - - - - - - 315,000
Total Revenues and Sources of Funds 315,000 - - - - - - - 315,000
Expenditures and Uses of Funds
532000 - Engineering & Architecture - - - 65,000 - - - - 65,000
591100 - Construction - - - - 600,000 - - - 600,000
Total Expenditures and Uses of Funds - - - 65,000 600,000 - - - 665,000
Net Change in Fund Balance 315,000 - - (65,000) (600,000) - - - (350,000)
Project 0000061 - Activity Center - Roof Replacement Fund 305 - Parks
Beginning Fund Balance 613,838 - - - - - - - 613,838
Projected Fund Balance 928,838 928,838 928,838 863,838 263,838 263,838 263,838 263,838 263,838
Project DescriptionThis project involves the design and construction of the roof replacement of the Activity Center (flat roof sections only). The design was originally scheduled to occurin FY21 with construction scheduled for FY22. Design for this project has been moved to FY22 and construction will occur in FY23.
Project Location Activity Center, 506 South Frederick Avenue Project Manager Sunil Prithviraj
305 - Parks
505

AppendixCIP Project Detail
FY22 Budget
Prior YearsActuals
FY21Adopted
FY21Projection FY22 FY23 FY24 FY25 FY26 Total
Revenues and Sources of Funds
434000 - State Grant - Open Space - 350,000 350,000 - - - - - 350,000
499000 - Transfer In - From General Fund 100,000 - - - - - - - 100,000
499100 - Transfer In - From CIP - 250,000 250,000 - - - - - 250,000
Total Revenues and Sources of Funds 100,000 600,000 600,000 - - - - - 700,000
Expenditures and Uses of Funds
532000 - Engineering & Architecture - 20,000 - - - - - - -
591100 - Construction - 680,000 680,000 9,110 9,110 - - - 698,220
Total Expenditures and Uses of Funds - 700,000 680,000 9,110 9,110 - - - 698,220
Net Change in Fund Balance 100,000 (100,000) (80,000) (9,110) (9,110) - - - 1,780
Project 0000062 - Water Park - Filtration, Motors & Pumps Fund 305 - Parks
Beginning Fund Balance - - - - - - - - -
Projected Fund Balance 100,000 - 20,000 10,890 1,780 1,780 1,780 1,780 1,780
Project DescriptionThis project involves the design and replacement of the pumps, motors and filtration system for the Water Park complex. The project was coordinated as design-build and scheduled for FY20 and FY21. This project is being funded with Program Open Space (POS) funding which requires a minimum 20% match and is subjectto prevailing wage if the POS funding exceeds 50%. This project was completed in FY21 with minor costs in FY22 and FY23.
Project LocationGaithersburg Water Park, 506 South FrederickAvenue Project Manager Sunil Prithviraj
506

AppendixCIP Project Detail
FY22 Budget
Prior YearsActuals
FY21Adopted
FY21Projection FY22 FY23 FY24 FY25 FY26 Total
Revenues and Sources of Funds
499000 - Transfer In - From General Fund 100,000 50,000 50,000 48,500 50,000 50,000 50,000 50,000 398,500
Total Revenues and Sources of Funds 100,000 50,000 50,000 48,500 50,000 50,000 50,000 50,000 398,500
Net Change in Fund Balance 100,000 50,000 50,000 48,500 50,000 50,000 50,000 50,000 398,500
Project 0000063 - Future Bohrer Park at Summit HallProjects Fund 305 - Parks
Beginning Fund Balance - - - - - - - - -
Projected Fund Balance 100,000 150,000 150,000 198,500 248,500 298,500 348,500 398,500 398,500
Project DescriptionThe City of Gaithersburg has not traditionally issued bonds for capital improvement projects. Instead, it has set aside funding to allow the City to operate under apay-as-you-go method. This project establishes funding in future years to meet its future Bohrer Park renovation and improvements under this philosophy. Whenspecific projects are identified, funds and expenditures will be transferred to a new project.
Project LocationBohrer Park at Summit Hall, 506 South FrederickAvenue Project Manager Dennis Enslinger
507

AppendixCIP Project Detail
FY22 Budget
Prior YearsActuals
FY21Adopted
FY21Projection FY22 FY23 FY24 FY25 FY26 Total
Revenues and Sources of Funds
499000 - Transfer In - From General Fund - - - - - 150,000 500,000 - 650,000
Total Revenues and Sources of Funds - - - - - 150,000 500,000 - 650,000
Expenditures and Uses of Funds
532000 - Engineering & Architecture - - - - - 75,000 - - 75,000
591100 - Construction - - - - - - 575,000 - 575,000
Total Expenditures and Uses of Funds - - - - - 75,000 575,000 - 650,000
Net Change in Fund Balance - - - - - 75,000 (75,000) - -
Project 0000067 - Activity Center - Upgrade Generator Fund 305 - Parks
Beginning Fund Balance - - - - - - - - -
Projected Fund Balance - - - - - 75,000 - - -
Project DescriptionThis project involves the replacement and upgrade of the building generator at the Activity Center. Currently, portions of the building do not have backup power, soadditional capacity is necessary in key locations. This project design is scheduled to occur in FY24 and construction in FY25. Operating Budget ImpactsImpacts to budget include additional service contract cost to maintain generator which is about $3,500 per year, plus an additional diesel fuel expense for operation.
Project Location 506 South Summit Avenue Project Manager Ron Kaczmarek
508

AppendixCIP Project Detail
FY22 Budget
Prior YearsActuals
FY21Adopted
FY21Projection FY22 FY23 FY24 FY25 FY26 Total
Revenues and Sources of Funds
499000 - Transfer In - From General Fund 50,000 - - - - - - - 50,000
499100 - Transfer In - From CIP 6,668 60,000 60,000 - - - - - 66,668
Total Revenues and Sources of Funds 56,668 60,000 60,000 - - - - - 116,668
Expenditures and Uses of Funds
532000 - Engineering & Architecture 14,408 - - 15,000 - - - - 29,408
591100 - Construction - 73,000 7,600 60,000 - - - - 67,600
Total Expenditures and Uses of Funds 14,408 73,000 7,600 75,000 - - - - 97,008
Net Change in Fund Balance 42,260 (13,000) 52,400 (75,000) - - - - 19,660
Project 0000068 - Sound Study Enhancements for RPYC,OTYC and AC Main Gym Fund 305 - Parks
Beginning Fund Balance - - - - - - - - -
Projected Fund Balance 42,260 29,260 94,660 19,660 19,660 19,660 19,660 19,660 19,660
Project DescriptionThis project is to mitigate sound issues at the following locations: Olde Towne Youth Center, Robertson Park Youth Center, and Bohrer Park Activity Center in themain gym. A sound study was completed in FY17 and made recommendations for each building. The work scope includes replacement and repair of HVAC ducts,replacement and repair of interior doors and windows, installation of sound absorption panels, and repair wall finishes. Design occurred in FY20 and phase oneconstruction occurred in FY21. A second phase of design and construction will take place in FY22.
Project Location
Olde Towne Youth Center (OTYC), 301 TeachersWay; Robertson Park Youth Center (RPYC), 801Rabbitt Road and Bohrer Park Activity Center(BPAC), 506 South Frederick Avenue Project Manager Sunil Prithviraj
509

AppendixCIP Project Detail
FY22 Budget
Prior YearsActuals
FY21Adopted
FY21Projection FY22 FY23 FY24 FY25 FY26 Total
Revenues and Sources of Funds
499000 - Transfer In - From General Fund 20,000 - - - 100,000 100,000 100,000 100,000 420,000
499100 - Transfer In - From CIP 1,710,262 - 297,686 - - - - - 2,007,948
Total Revenues and Sources of Funds 1,730,262 - 297,686 - 100,000 100,000 100,000 100,000 2,427,948
Expenditures and Uses of Funds
589000 - Transfer to Other Funds 264,000 670,500 637,988 347,000 414,500 - - - 1,663,488
Total Expenditures and Uses of Funds 264,000 670,500 637,988 347,000 414,500 - - - 1,663,488
Net Change in Fund Balance 1,466,262 (670,500) (340,302) (347,000) (314,500) 100,000 100,000 100,000 764,460
Project 0000075 - Future Renovation of Existing ParksProjects Fund 305 - Parks
Beginning Fund Balance - - - - - - - - -
Projected Fund Balance 1,466,262 795,762 1,125,960 778,960 464,460 564,460 664,460 764,460 764,460
Project DescriptionThe City of Gaithersburg has not traditionally issued bonds for capital improvement projects. Instead, it has set aside funding to allow the City to operate under apay-as-you-go method. This project establishes funding in future years to meet its future park renovation and improvements under this philosophy. As new projectscome online, funding is transferred from this project to the new project within the Parks CIP Fund.
Project Location Citywide Project Manager Dennis Enslinger
510

AppendixCIP Project Detail
FY22 Budget
Prior YearsActuals
FY21Adopted
FY21Projection FY22 FY23 FY24 FY25 FY26 Total
Expenditures and Uses of Funds
589000 - Transfer to Other Funds - - - 90,000 - - - - 90,000
Total Expenditures and Uses of Funds - - - 90,000 - - - - 90,000
Net Change in Fund Balance - - - (90,000) - - - - (90,000)
Project 0000079 - Future Benjamin Gaither Center Projects Fund 305 - Parks
Beginning Fund Balance 106,445 - - - - - - - 106,445
Projected Fund Balance 106,445 106,445 106,445 16,445 16,445 16,445 16,445 16,445 16,445
Project DescriptionThe City of Gaithersburg has not traditionally issued bonds for capital improvement projects. Instead, it has set aside funding to allow the City to operate under apay-as-you-go method. This project establishes funding in future years to meet its Benjamin Gaither Center renovation and improvements under this philosophy.When specific projects are identified, funds and expenditures will be transferred to a new project.
Project Location Benjamin Gaither Center, 80 A Bureau Drive Project Manager Dennis Enslinger
511

AppendixCIP Project Detail
FY22 Budget
Prior YearsActuals
FY21Adopted
FY21Projection FY22 FY23 FY24 FY25 FY26 Total
Revenues and Sources of Funds
499000 - Transfer In - From General Fund 350,000 - - - - - - - 350,000
499100 - Transfer In - From CIP - - 36,001 - - - - - 36,001
Total Revenues and Sources of Funds 350,000 - 36,001 - - - - - 386,001
Expenditures and Uses of Funds
532000 - Engineering & Architecture 58,166 - 6,253 - - - - - 64,419
591100 - Construction 656,249 - 40,334 - - - - - 696,583
Total Expenditures and Uses of Funds 714,415 - 46,587 - - - - - 761,002
Net Change in Fund Balance (364,415) - (10,586) - - - - - (375,001)
Project 0000081 - Arts Barn - Boiler/Chiller/ControlsReplacement Fund 305 - Parks
Beginning Fund Balance 375,000 - - - - - - - 375,000
Projected Fund Balance 10,585 10,585 (1) (1) (1) (1) (1) (1) (1)
Project DescriptionThis project originally involved the replacement of the cooling tower, building controls, the boiler and twenty-three (23) water sourced heat pumps. The project wascompleted in FY21. This project will be closed in FY22. Operating Budget ImpactsThe City will see a cost savings in electric and natural gas for this building related to the installation of new energy efficient equipment.
Project Location Arts Barn, 311 Kent Square Road Project Manager McNeal Brown
512

AppendixCIP Project Detail
FY22 Budget
Prior YearsActuals
FY21Adopted
FY21Projection FY22 FY23 FY24 FY25 FY26 Total
Revenues and Sources of Funds
499000 - Transfer In - From General Fund 965,000 - - - - - - - 965,000
499100 - Transfer In - From CIP - - 20,000 - - - - - 20,000
Total Revenues and Sources of Funds 965,000 - 20,000 - - - - - 985,000
Expenditures and Uses of Funds
591100 - Construction 41,000 - 760,000 265,000 - - - - 1,066,000
Total Expenditures and Uses of Funds 41,000 - 760,000 265,000 - - - - 1,066,000
Net Change in Fund Balance 924,000 - (740,000) (265,000) - - - - (81,000)
Project 0000082 - Robertson Park Field #3 - Synthetic TurfInstallation Fund 305 - Parks
Beginning Fund Balance 85,793 - - - - - - - 85,793
Projected Fund Balance 1,009,793 1,009,793 269,793 4,793 4,793 4,793 4,793 4,793 4,793
Project DescriptionThe project involves construction of a synthetic turf field on the soccer/multi-use field #3. This project is a design-build project. This project is funded throughProgram Open Space (POS) funding, which requires a minimum match of 20% and requires compliance with prevailing wage if the POS funds exceed 50%. Thesynthetic turf system changed to an organic infill system in October 2020. The project is under construction and will be completed in FY22. Operating Budget ImpactsThere will be additional maintenance costs associated with this field construction.
Project Location Robertson Park, 801 Rabbitt Road Project Manager Kevin Etters
513

AppendixCIP Project Detail
FY22 Budget
Prior YearsActuals
FY21Adopted
FY21Projection FY22 FY23 FY24 FY25 FY26 Total
Revenues and Sources of Funds
499100 - Transfer In - From CIP - - - 133,000 - - - - 133,000
Total Revenues and Sources of Funds - - - 133,000 - - - - 133,000
Expenditures and Uses of Funds
532000 - Engineering & Architecture - - - 35,000 - - - - 35,000
591100 - Construction - - - 98,000 - - - - 98,000
Total Expenditures and Uses of Funds - - - 133,000 - - - - 133,000
Net Change in Fund Balance - - - - - - - - -
Project 0000120 - Casey Community Center - ElectronicSign Fund 305 - Parks
Beginning Fund Balance
Projected Fund Balance - - - - - - - - -
Project DescriptionThis project involves the replacement of the existing message board sign with an electronic message board sign at Casey Community Center. This project isscheduled for FY22 as a design-build project.Operating Budget ImpactsThis item will need to be added to the asset replacement list once the project is completed. This project will also add approximately $1,200 annually to Account1160, Building & Grounds - Casey Community Center, for the additional electrical usage for this sign and a $45 monthly service charge for wireless communication.
Project LocationCasey Community Center, 810 South FrederickAvenue Project Manager Sunil Prithviraj
514

AppendixCIP Project Detail
FY22 Budget
Prior YearsActuals
FY21Adopted
FY21Projection FY22 FY23 FY24 FY25 FY26 Total
Revenues and Sources of Funds
499100 - Transfer In - From CIP - 165,000 165,000 - - - - - 165,000
Total Revenues and Sources of Funds - 165,000 165,000 - - - - - 165,000
Expenditures and Uses of Funds
591100 - Construction - 165,000 - 165,000 - - - - 165,000
Total Expenditures and Uses of Funds - 165,000 - 165,000 - - - - 165,000
Net Change in Fund Balance - - 165,000 (165,000) - - - - -
Project 0000160 - Asphalt Tennis & Basketball CourtResurfacing Fund 305 - Parks
Beginning Fund Balance
Projected Fund Balance - - 165,000 - - - - - -
Project DescriptionThis project involves the resurfacing of tennis and basketball courts along with installation of replacement equipment in a number of parks. Project Locations: DuvallPark, 14 Holly Drive – One (1) full basketball court. Griffith Park, 29 South Summit Avenue – Two (2) tennis courts and two (2) half basketball courts. Morris Park,520 Summit Hall Road – One (1) full basketball court.This project has experienced some delays and will be completed in FY22.Operating Budget ImpactsLess time will be spent clearing debris, such as leaves, from the tennis courts because of the addition of double wide fence gates.
Project Location
Duvall Park, 14 Holly Drive; Griffith Park, 29 SouthSummit Avenue; and Morris Park, 520 Summit HallRoad Project Manager Kevin Etters
515

AppendixCIP Project Detail
FY22 Budget
Prior YearsActuals
FY21Adopted
FY21Projection FY22 FY23 FY24 FY25 FY26 Total
Revenues and Sources of Funds
467200 - Miscellaneous - - - - 800,000 - - - 800,000
499000 - Transfer In - From General Fund - 100,000 100,000 700,000 (800,000) - - - -
Total Revenues and Sources of Funds - 100,000 100,000 700,000 - - - - 800,000
Expenditures and Uses of Funds
591100 - Construction - 100,000 - 800,000 - - - - 800,000
Total Expenditures and Uses of Funds - 100,000 - 800,000 - - - - 800,000
Net Change in Fund Balance - - 100,000 (100,000) - - - - -
Project 0000162 - New Gaithersburg Elementary SchoolTurf Field Fund 305 - Parks
Beginning Fund Balance
Projected Fund Balance - - 100,000 - - - - - -
Project DescriptionThis project involves the design and construction of a synthetic field in construction with the development of a new elementary school at Kelley park. MontgomeryCounty Schools and the City have entered into an agreement where the City will construction the field and MSCPS will reimburse the City in an amount not toexceed $800,000. The project was designed in FY21 and construction will be completed in FY22.Operating Budget ImpactsThe City will have additional maintenance and replacement costs associated with this facility after construction.
Project Location Kelley Park, 400 Victory Farm Drive Project Manager Kevin Etters
516
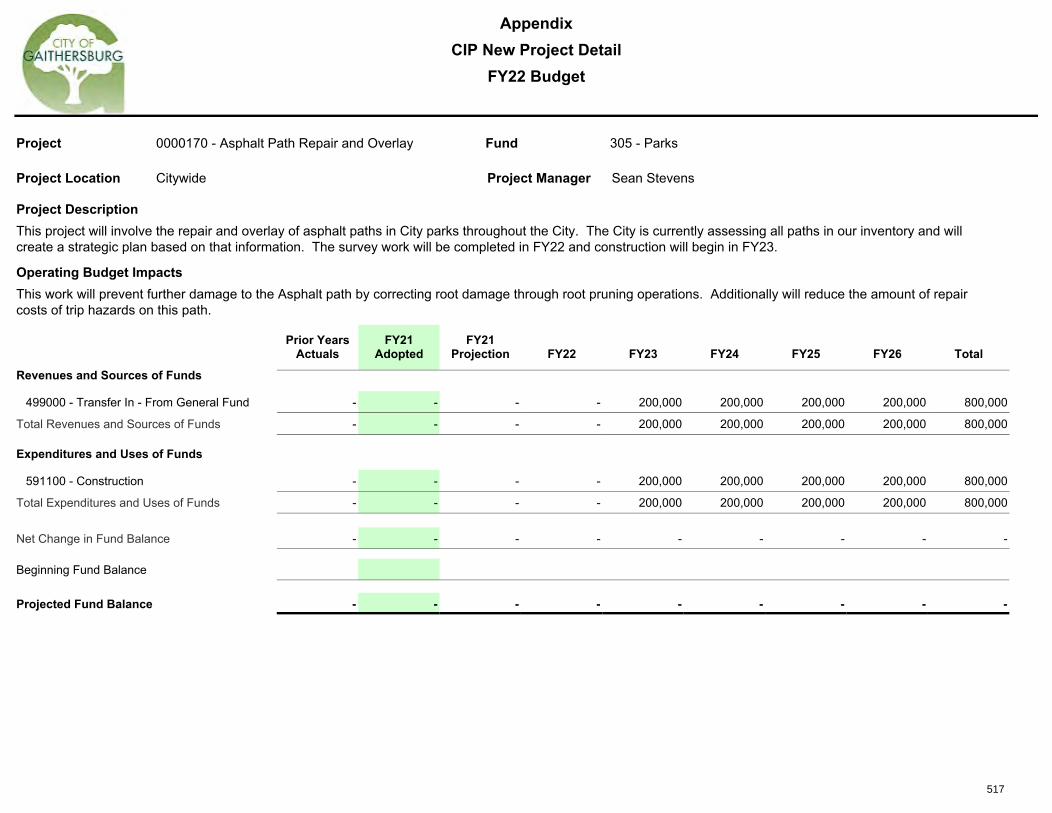
AppendixCIP New Project Detail
FY22 Budget
Prior YearsActuals
FY21Adopted
FY21Projection FY22 FY23 FY24 FY25 FY26 Total
Revenues and Sources of Funds
499000 - Transfer In - From General Fund - - - - 200,000 200,000 200,000 200,000 800,000
Total Revenues and Sources of Funds - - - - 200,000 200,000 200,000 200,000 800,000
Expenditures and Uses of Funds
591100 - Construction - - - - 200,000 200,000 200,000 200,000 800,000
Total Expenditures and Uses of Funds - - - - 200,000 200,000 200,000 200,000 800,000
Net Change in Fund Balance - - - - - - - - -
Project 0000170 - Asphalt Path Repair and Overlay Fund 305 - Parks
Beginning Fund Balance
Projected Fund Balance - - - - - - - - -
Project DescriptionThis project will involve the repair and overlay of asphalt paths in City parks throughout the City. The City is currently assessing all paths in our inventory and willcreate a strategic plan based on that information. The survey work will be completed in FY22 and construction will begin in FY23.
Operating Budget ImpactsThis work will prevent further damage to the Asphalt path by correcting root damage through root pruning operations. Additionally will reduce the amount of repaircosts of trip hazards on this path.
Project Location Citywide Project Manager Sean Stevens
517

AppendixCIP New Project Detail
FY22 Budget
Prior YearsActuals
FY21Adopted
FY21Projection FY22 FY23 FY24 FY25 FY26 Total
Revenues and Sources of Funds
499100 - Transfer In - From CIP - - - 90,000 - - - - 90,000
Total Revenues and Sources of Funds - - - 90,000 - - - - 90,000
Expenditures and Uses of Funds
591100 - Construction - - - 88,030 - - - - 88,030
Total Expenditures and Uses of Funds - - - 88,030 - - - - 88,030
Net Change in Fund Balance - - - 1,970 - - - - 1,970
Project 0000171 - Benjamin Gaither Bathroom Renovations Fund 305 - Parks
Beginning Fund Balance
Projected Fund Balance - - - 1,970 1,970 1,970 1,970 1,970 1,970
Project DescriptionThis project involves the renovation of the men's and women's bathroom facilities at the Benjamin Gaither Center. The project will install new bathroom tile, paintand make modification to the partitions and sink areas.
Project Location Benjamin Gaither Center,80 Bureau Drive A Project Manager Ron Kaczmarek
518

AppendixCIP New Project Detail
FY22 Budget
Prior YearsActuals
FY21Adopted
FY21Projection FY22 FY23 FY24 FY25 FY26 Total
Revenues and Sources of Funds
434000 - State Grant - Open Space - - - - 175,000 - - - 175,000
499000 - Transfer In - From General Fund - - - 220,000 - - - - 220,000
499100 - Transfer In - From CIP - - - 85,000 320,000 - - - 405,000
Total Revenues and Sources of Funds - - - 305,000 495,000 - - - 800,000
Expenditures and Uses of Funds
532000 - Engineering & Architecture - - - 140,000 - - - - 140,000
591100 - Construction - - - - 660,000 - - - 660,000
Total Expenditures and Uses of Funds - - - 140,000 660,000 - - - 800,000
Net Change in Fund Balance - - - 165,000 (165,000) - - - -
Project 0000172 - Blohm Park Trail Improvements Fund 305 - Parks
Beginning Fund Balance
Projected Fund Balance - - - 165,000 - - - - -
Project DescriptionThis project involves the installation and enhancement of existing trails within with in Blohm Park. The City completed a stream restoration in the park in FY21 andthis project is a follow up to those improvements. The project involves naturalistic trails, includes boardwalk sections which allow for educational opportunitiesregarding the stream restoration project and will include educational signage elements. This project involves Public Open Space which will be less than twenty-fivepercent.
Operating Budget ImpactsThis project will have long term maintenance costs that will impact the operating budget.
Project Location Blohm Park, 18900 Watkins Mill Road Project Manager Anthony Berger
519

AppendixCIP New Project Detail
FY22 Budget
Prior YearsActuals
FY21Adopted
FY21Projection FY22 FY23 FY24 FY25 FY26 Total
Revenues and Sources of Funds
499100 - Transfer In - From CIP - - - - 94,500 - - - 94,500
Total Revenues and Sources of Funds - - - - 94,500 - - - 94,500
Expenditures and Uses of Funds
532000 - Engineering & Architecture - - - - 7,500 - - - 7,500
591100 - Construction - - - - - 87,000 - - 87,000
Total Expenditures and Uses of Funds - - - - 7,500 87,000 - - 94,500
Net Change in Fund Balance - - - - 87,000 (87,000) - - -
Project 0000173 - Manor House - Roof Replacement Fund 305 - Parks
Beginning Fund Balance
Projected Fund Balance - - - - 87,000 - - - -
Project DescriptionThis project involves a roof replacement with asphalt shingles.. The replacement of the ridge beam over the existing kitchen addition will also to take place as part ofthe roof replacement. To address other building envelope issues paint removal and painting of North, South and West walls, doors, windows and window trim willalso be conducted as part of the project. Design for ridge beam replacement to take place in FY23 followed by construction and painting in FY24.
Operating Budget ImpactsOnce project is complete there should be minimal annual maintenance costs, if any.
Project Location Manor House, 500 South Frederick Avenue Project Manager Ron Kaczmarek
520

AppendixCIP New Project Detail
FY22 Budget
Prior YearsActuals
FY21Adopted
FY21Projection FY22 FY23 FY24 FY25 FY26 Total
Revenues and Sources of Funds
499100 - Transfer In - From CIP - - - 347,000 - - - - 347,000
Total Revenues and Sources of Funds - - - 347,000 - - - - 347,000
Expenditures and Uses of Funds
591100 - Construction - - - 347,000 - - - - 347,000
Total Expenditures and Uses of Funds - - - 347,000 - - - - 347,000
Net Change in Fund Balance - - - - - - - - -
Project 0000174 - Miniature Golf Pond Repair Fund 305 - Parks
Beginning Fund Balance
Projected Fund Balance - - - - - - - - -
Project DescriptionThis project involves the removal of the existing PVC pond liner and the installation of a gunite (concrete) pond liner and drain. This is a design build project and willbe completed by the end of FY22.
Operating Budget ImpactsRepairing the miniature golf pond will reduce the costs associated with yearly repairs. The current condition of the pond liner requires more man hours each year tocorrect deficiencies prior to opening the miniature golf course.
Project Location Miniature Golf Facility, 514 South Frederick Avenue Project Manager Mark Scafide
521

AppendixCIP Project Detail
FY22 Budget
Prior YearsActuals
FY21Adopted
FY21Projection FY22 FY23 FY24 FY25 FY26 Total
Revenues and Sources of Funds
499000 - Transfer In - From General Fund 13,000 - - - - - - - 13,000
Total Revenues and Sources of Funds 13,000 - - - - - - - 13,000
Expenditures and Uses of Funds
595000 - Furniture & Equipment 12,195 - - 15,000 - - - - 27,195
Total Expenditures and Uses of Funds 12,195 - - 15,000 - - - - 27,195
Net Change in Fund Balance 805 - - (15,000) - - - - (14,195)
Project 0000083 - IT - Network Infrastructure Improvements Fund 306 - Technology
Beginning Fund Balance 93,000 - - - - - - - 93,000
Projected Fund Balance 93,805 93,805 93,805 78,805 78,805 78,805 78,805 78,805 78,805
Project DescriptionThis project supports improving the City's network infrastructure. Expenditures are currently budgeted for FY22.
Project Location Citywide Project Manager Pete Cottrell
306 - Technology
522

AppendixCIP Project Detail
FY22 Budget
Prior YearsActuals
FY21Adopted
FY21Projection FY22 FY23 FY24 FY25 FY26 Total
Expenditures and Uses of Funds
595000 - Furniture & Equipment 28,604 - - - 15,000 - - - 43,604
Total Expenditures and Uses of Funds 28,604 - - - 15,000 - - - 43,604
Net Change in Fund Balance (28,604) - - - (15,000) - - - (43,604)
Project 0000084 - City - Facility Cameras System Fund 306 - Technology
Beginning Fund Balance 62,000 - - - - - - - 62,000
Projected Fund Balance 33,396 33,396 33,396 33,396 18,396 18,396 18,396 18,396 18,396
Project DescriptionThis ongoing project is for the build-out of the City's networked security cameras and supporting infrastructure (servers, storage, etc.). Expenditures are currentlybudgeted for FY23.
Project Location Citywide Project Manager Pete Cottrell
523

AppendixCIP Project Detail
FY22 Budget
Prior YearsActuals
FY21Adopted
FY21Projection FY22 FY23 FY24 FY25 FY26 Total
Revenues and Sources of Funds
499000 - Transfer In - From General Fund 50,000 62,000 62,000 - - 30,000 - - 142,000
Total Revenues and Sources of Funds 50,000 62,000 62,000 - - 30,000 - - 142,000
Expenditures and Uses of Funds
595000 - Furniture & Equipment - 162,000 104,000 6,000 - 30,000 - - 140,000
Total Expenditures and Uses of Funds - 162,000 104,000 6,000 - 30,000 - - 140,000
Net Change in Fund Balance 50,000 (100,000) (42,000) (6,000) - - - - 2,000
Project 0000085 - City - 16 S. Summit Ave. NetworkConfiguration Fund 306 - Technology
Beginning Fund Balance 50,000 - - - - - - - 50,000
Projected Fund Balance 100,000 - 58,000 52,000 52,000 52,000 52,000 52,000 52,000
Project DescriptionThis project supports the acquisition of network services for the new 16 South Summit Avenue and the integration of the site into the City's network. Expenditures are currently budgeted for FY22 and FY24.
Project Location 16 South Summit Avenue Project Manager Pete Cottrell
524

AppendixCIP Project Detail
FY22 Budget
Prior YearsActuals
FY21Adopted
FY21Projection FY22 FY23 FY24 FY25 FY26 Total
Expenditures and Uses of Funds
595000 - Furniture & Equipment 10,477 10,000 - 35,000 20,000 - - - 65,477
Total Expenditures and Uses of Funds 10,477 10,000 - 35,000 20,000 - - - 65,477
Net Change in Fund Balance (10,477) (10,000) - (35,000) (20,000) - - - (65,477)
Project 0000086 - City - Facility Access SecurityImprovements Fund 306 - Technology
Beginning Fund Balance 80,000 - - - - - - - 80,000
Projected Fund Balance 69,523 59,523 69,523 34,523 14,523 14,523 14,523 14,523 14,523
Project DescriptionThis project supports the addition of City facilities to the City's access control system. Expenditures are currently budgeted for FY22 and FY23.
Project Location Citywide Project Manager Pete Cottrell
525

AppendixCIP Project Detail
FY22 Budget
Prior YearsActuals
FY21Adopted
FY21Projection FY22 FY23 FY24 FY25 FY26 Total
Revenues and Sources of Funds
499000 - Transfer In - From General Fund - - - - - 30,000 - - 30,000
Total Revenues and Sources of Funds - - - - - 30,000 - - 30,000
Expenditures and Uses of Funds
589000 - Transfer to Other Funds 500 - - - - - - - 500
592000 - Software 27,500 - - - - - - - 27,500
595000 - Furniture & Equipment - - - - - 30,000 - - 30,000
Total Expenditures and Uses of Funds 28,000 - - - - 30,000 - - 58,000
Net Change in Fund Balance (28,000) - - - - - - - (28,000)
Project 0000087 - City - Intranet Web Replacement Fund 306 - Technology
Beginning Fund Balance 28,000 - - - - - - - 28,000
Projected Fund Balance - - - - - - - - -
Project DescriptionThis project supports the implementation of an intranet website to replace the City's current website.Expenditures are currently budgeted for FY24.
Project Location Citywide Project Manager Pete Cottrell
526

AppendixCIP Project Detail
FY22 Budget
Prior YearsActuals
FY21Adopted
FY21Projection FY22 FY23 FY24 FY25 FY26 Total
Expenditures and Uses of Funds
595000 - Furniture & Equipment - - - - - 30,000 - - 30,000
Total Expenditures and Uses of Funds - - - - - 30,000 - - 30,000
Net Change in Fund Balance - - - - - (30,000) - - (30,000)
Project 0000088 - IT- Remote Data Center Fund 306 - Technology
Beginning Fund Balance 30,000 - - - - - - - 30,000
Projected Fund Balance 30,000 30,000 30,000 30,000 30,000 - - - -
Project DescriptionThis project supports the building of a true datacom/small server room at the PW facility. This project is schedule for completion in FY24.
Project Location Public Works, 800 Rabbitt Road Project Manager Pete Cottrell
527

AppendixCIP Project Detail
FY22 Budget
Prior YearsActuals
FY21Adopted
FY21Projection FY22 FY23 FY24 FY25 FY26 Total
Net Change in Fund Balance - - - - - - - - -
Beginning Fund Balance 75,000 - - - - - - - 75,000
Projected Fund Balance 75,000 75,000 75,000 75,000 75,000 75,000 75,000 75,000 75,000
Project
Project Description
Project Location
Fund 306 - Technology0000090 - IT - Security Assessment / Testing
Citywide Project Manager Pete Cottrell
This project supports the selection and engagement of a vendor to perform an independent 3rd-party security evaluation of the City's network and computersystems. There are currently no expenditures budgeted.
528

AppendixCIP Project Detail
FY22 Budget
Prior YearsActuals
FY21Adopted
FY21Projection FY22 FY23 FY24 FY25 FY26 Total
Expenditures and Uses of Funds
595000 - Furniture & Equipment - - - - 100,000 - - - 100,000
Total Expenditures and Uses of Funds - - - - 100,000 - - - 100,000
Net Change in Fund Balance - - - - (100,000) - - - (100,000)
Project 0000094 - Police - Public Safety SurveillanceCameras Fund 306 - Technology
Beginning Fund Balance 100,000 - - - - - - - 100,000
Projected Fund Balance 100,000 100,000 100,000 100,000 - - - - -
Project DescriptionThis project supports the replacement and enhancement of the public safety cameras system installed in Olde Towne on Summit Ave. and E. Diamond Ave. Expenditures are currently budgeted for FY23.
Project Location Olde Towne Project Manager Pete Cottrell
529

AppendixCIP Project Detail
FY22 Budget
Prior YearsActuals
FY21Adopted
FY21Projection FY22 FY23 FY24 FY25 FY26 Total
Revenues and Sources of Funds
499000 - Transfer In - From General Fund 50,000 - - - - - - - 50,000
Total Revenues and Sources of Funds 50,000 - - - - - - - 50,000
Expenditures and Uses of Funds
595000 - Furniture & Equipment - - - - 100,000 - - - 100,000
Total Expenditures and Uses of Funds - - - - 100,000 - - - 100,000
Net Change in Fund Balance 50,000 - - - (100,000) - - - (50,000)
Project 0000095 - City - Parking Garage TechnologyImprovements Fund 306 - Technology
Beginning Fund Balance 51,019 - - - - - - - 51,019
Projected Fund Balance 101,019 101,019 101,019 101,019 1,019 1,019 1,019 1,019 1,019
Project DescriptionThis project supports the introduction of technology (security cameras, parking management/payment systems, etc.) into the Olde Towne parking garage. This project is scheduled for completion in FY23.
Project LocationOlde Towne Parking Garage, 112 Olde TowneAvenue Project Manager Pete Cottrell
530

AppendixCIP Project Detail
FY22 Budget
Prior YearsActuals
FY21Adopted
FY21Projection FY22 FY23 FY24 FY25 FY26 Total
Revenues and Sources of Funds
499000 - Transfer In - From General Fund 75,000 - - - - - - - 75,000
499100 - Transfer In - From CIP - - - 25,000 - - - - 25,000
Total Revenues and Sources of Funds 75,000 - - 25,000 - - - - 100,000
Expenditures and Uses of Funds
595000 - Furniture & Equipment - 70,000 - 150,000 - - - - 150,000
Total Expenditures and Uses of Funds - 70,000 - 150,000 - - - - 150,000
Net Change in Fund Balance 75,000 (70,000) - (125,000) - - - - (50,000)
Project 0000096 - City - Radio System Upgrades Fund 306 - Technology
Beginning Fund Balance 50,000 - - - - - - - 50,000
Projected Fund Balance 125,000 55,000 125,000 - - - - - -
Project DescriptionThis project would support the replacement and enhancement of the City's radio system, including: the transition from analog to digital technology, a second antennafor improved coverage, and possibly the collection of GPS-based location information. This project is scheduled for FY22.
Project Location Citywide Project Manager Pete Cottrell
531

AppendixCIP Project Detail
FY22 Budget
Prior YearsActuals
FY21Adopted
FY21Projection FY22 FY23 FY24 FY25 FY26 Total
Revenues and Sources of Funds
499000 - Transfer In - From General Fund - - - - - 20,000 - - 20,000
499100 - Transfer In - From CIP - 25,000 25,000 60,000 - - - - 85,000
Total Revenues and Sources of Funds - 25,000 25,000 60,000 - 20,000 - - 105,000
Expenditures and Uses of Funds
595000 - Furniture & Equipment 25,000 - - 85,000 - 25,000 - - 135,000
Total Expenditures and Uses of Funds 25,000 - - 85,000 - 25,000 - - 135,000
Net Change in Fund Balance (25,000) 25,000 25,000 (25,000) - (5,000) - - (30,000)
Project 0000097 - IT- Data Backup System Fund 306 - Technology
Beginning Fund Balance 30,000 - - - - - - - 30,000
Projected Fund Balance 5,000 30,000 30,000 5,000 5,000 - - - -
Project DescriptionThis project supports the maintenance and expansion of the City's data backup system, which includes software and hardware components. This project isscheduled for FY22 and FY24.
Project Location City Hall, 31 South Summit Avenue Project Manager Pete Cottrell
532

AppendixCIP Project Detail
FY22 Budget
Prior YearsActuals
FY21Adopted
FY21Projection FY22 FY23 FY24 FY25 FY26 Total
Revenues and Sources of Funds
499000 - Transfer In - From General Fund 50,000 - - - - - - - 50,000
Total Revenues and Sources of Funds 50,000 - - - - - - - 50,000
Expenditures and Uses of Funds
595000 - Furniture & Equipment - - - - - - 25,000 - 25,000
Total Expenditures and Uses of Funds - - - - - - 25,000 - 25,000
Net Change in Fund Balance 50,000 - - - - - (25,000) - 25,000
Project 0000099 - City - City Hall Grounds Cameras &Network Fund 306 - Technology
Beginning Fund Balance - - - - - - - - -
Projected Fund Balance 50,000 50,000 50,000 50,000 50,000 50,000 25,000 25,000 25,000
Project DescriptionThis project would support the expansion of the City's network and camera system into the City Hall parking area. The project is dependent upon PW/Facilitiesredoing the lights in the parking lot, because the cameras and the network would require cabling to be installed in new conduit laid under the pavement. Anexpenditure is currently budgeted for FY25.
Project Location City Hall, 31 South Summit Avenue Project Manager Pete Cottrell
533

AppendixCIP Project Detail
FY22 Budget
Prior YearsActuals
FY21Adopted
FY21Projection FY22 FY23 FY24 FY25 FY26 Total
Revenues and Sources of Funds
499000 - Transfer In - From General Fund 322,000 - - - - 30,000 - - 352,000
Total Revenues and Sources of Funds 322,000 - - - - 30,000 - - 352,000
Expenditures and Uses of Funds
595000 - Furniture & Equipment - - - - 175,000 175,000 - - 350,000
Total Expenditures and Uses of Funds - - - - 175,000 175,000 - - 350,000
Net Change in Fund Balance 322,000 - - - (175,000) (145,000) - - 2,000
Project 0000100 - City - Wide-Area Network Enhancements Fund 306 - Technology
Beginning Fund Balance - - - - - - - - -
Projected Fund Balance 322,000 322,000 322,000 322,000 147,000 2,000 2,000 2,000 2,000
Project DescriptionThis project will support architectural updates and expansions to the City's Wide-Area Network (WAN), which connects all City sites on an internal network.Expenditures are currently budgeted for FY23 and FY24.
Project Location Citywide Project Manager Pete Cottrell
534

AppendixCIP Project Detail
FY22 Budget
Prior YearsActuals
FY21Adopted
FY21Projection FY22 FY23 FY24 FY25 FY26 Total
Revenues and Sources of Funds
499000 - Transfer In - From General Fund - - - - 35,000 - - - 35,000
Total Revenues and Sources of Funds - - - - 35,000 - - - 35,000
Expenditures and Uses of Funds
595000 - Furniture & Equipment - - - - - 35,000 - - 35,000
Total Expenditures and Uses of Funds - - - - - 35,000 - - 35,000
Net Change in Fund Balance - - - - 35,000 (35,000) - - -
Project 0000101 - City - 16 S. Summit Ave. Training/Conference Rooms Fund 306 - Technology
Beginning Fund Balance - - - - - - - - -
Projected Fund Balance - - - - 35,000 - - - -
Project DescriptionThis project will support the addition of computers and presentation systems for conference rooms in the new 16 S. Summit Ave. building, as well as implementationof a computer-based training facility. The training room portion may be dependent upon a phase 2 implementation for the remaining third floor space after the firstphase has been completed. This project is currently scheduled for FY24.
Project Location 16 South Summit Avenue Project Manager Pete Cottrell
535

AppendixCIP Project Detail
FY22 Budget
Prior YearsActuals
FY21Adopted
FY21Projection FY22 FY23 FY24 FY25 FY26 Total
Revenues and Sources of Funds
499000 - Transfer In - From General Fund 235,000 - - 85,000 270,000 300,000 300,000 300,000 1,490,000
499100 - Transfer In - From CIP 289,891 - 100,543 - - - - - 390,434
Total Revenues and Sources of Funds 524,891 - 100,543 85,000 270,000 300,000 300,000 300,000 1,880,434
Expenditures and Uses of Funds
589000 - Transfer to Other Funds - 385,000 391,000 - - - - - 391,000
Total Expenditures and Uses of Funds - 385,000 391,000 - - - - - 391,000
Net Change in Fund Balance 524,891 (385,000) (290,457) 85,000 270,000 300,000 300,000 300,000 1,489,434
Project 0000106 - Future Technology Projects Fund 306 - Technology
Beginning Fund Balance 15,000 - - - - - - - 15,000
Projected Fund Balance 539,891 154,891 249,434 334,434 604,434 904,434 1,204,434 1,504,434 1,504,434
Project DescriptionThe City of Gaithersburg has not traditionally issued bonds for capital improvement projects. Instead, it has set aside funding to allow the City to operate under apay-as-you-go method. This project establishes funding in future years to meet City Hall improvements under this philosophy. When specific projects are identified,funds and expenditures will be transferred to a new project.
Project Location Citywide Project Manager Pete Cottrell
536

AppendixCIP Project Detail
FY22 Budget
Prior YearsActuals
FY21Adopted
FY21Projection FY22 FY23 FY24 FY25 FY26 Total
Revenues and Sources of Funds
499000 - Transfer In - From General Fund 65,000 - - - - - - - 65,000
499100 - Transfer In - From CIP - - 6,000 - - - - - 6,000
Total Revenues and Sources of Funds 65,000 - 6,000 - - - - - 71,000
Expenditures and Uses of Funds
595000 - Furniture & Equipment 4,850 - 21,300 40,000 - - - - 66,150
Total Expenditures and Uses of Funds 4,850 - 21,300 40,000 - - - - 66,150
Net Change in Fund Balance 60,150 - (15,300) (40,000) - - - - 4,850
Project 0000147 - Fuel Management System Upgrade Fund 306 - Technology
Beginning Fund Balance - - - - - - - - -
Projected Fund Balance 60,150 60,150 44,850 4,850 4,850 4,850 4,850 4,850 4,850
Project DescriptionThis project supports the modernization of the existing fuel management system. It is anticipated this project will be completed in FY22.
Operating Budget ImpactsThe new sensors will replace the current ones, which have been under maintenance, so it is anticipated that operating budget costs will be similar.
Project Location Public Works, 800 Rabbitt Road Project Manager Pete Cottrell
537

AppendixCIP Project Detail
FY22 Budget
Prior YearsActuals
FY21Adopted
FY21Projection FY22 FY23 FY24 FY25 FY26 Total
Revenues and Sources of Funds
499100 - Transfer In - From CIP - 225,000 225,000 - - - - - 225,000
Total Revenues and Sources of Funds - 225,000 225,000 - - - - - 225,000
Expenditures and Uses of Funds
595000 - Furniture & Equipment - 200,000 50,000 95,000 - 25,000 - - 170,000
Total Expenditures and Uses of Funds - 200,000 50,000 95,000 - 25,000 - - 170,000
Net Change in Fund Balance - 25,000 175,000 (95,000) - (25,000) - - 55,000
Project 0000163 - 16 South Summit Avenue IT Buildout Fund 306 - Technology
Beginning Fund Balance
Projected Fund Balance - 25,000 175,000 80,000 80,000 55,000 55,000 55,000 55,000
Project DescriptionThis project will complete the IT infrastructure that was not included in the base construction for the new Police Station/Council Chambers at 16 S. Summit Avenue. This project began in FY21 with a two- phase completion in FY22 and FY24.Operating Budget ImpactsFor the most part, equipment going into the building will be expansions of existing infrastructure (e.g. additional computer, network devices, etc.) so operating budgetfor maintenance of these infrastructure will increase accordingly.
Project Location 16 South Summit Avenue Project Manager Pete Cottrell
538

AppendixCIP Project Detail
FY22 Budget
Prior YearsActuals
FY21Adopted
FY21Projection FY22 FY23 FY24 FY25 FY26 Total
Revenues and Sources of Funds
499100 - Transfer In - From CIP - - - 30,000 - - - - 30,000
Total Revenues and Sources of Funds - - - 30,000 - - - - 30,000
Expenditures and Uses of Funds
595000 - Furniture & Equipment - - - - 30,000 - - - 30,000
Total Expenditures and Uses of Funds - - - - 30,000 - - - 30,000
Net Change in Fund Balance - - - 30,000 (30,000) - - - -
Project 0000164 - City Parking Program Technology Fund 306 - Technology
Beginning Fund Balance
Projected Fund Balance - - - 30,000 - - - - -
Project DescriptionThis project will support a new IT infrastructure to the City Parking Program. This project is dependent upon further direction from the Mayor and City Council. Thisproject is anticipated for completion in FY23.Operating Budget ImpactsRequirements and technologies have yet to be identified, so unknown at this time.
Project Location Citywide Project Manager Pete Cottrell
539

AppendixCIP Project Detail
FY22 Budget
Prior YearsActuals
FY21Adopted
FY21Projection FY22 FY23 FY24 FY25 FY26 Total
Revenues and Sources of Funds
499100 - Transfer In - From CIP - 70,000 70,000 - - - - - 70,000
Total Revenues and Sources of Funds - 70,000 70,000 - - - - - 70,000
Expenditures and Uses of Funds
595000 - Furniture & Equipment - 70,000 - 70,000 - - - - 70,000
Total Expenditures and Uses of Funds - 70,000 - 70,000 - - - - 70,000
Net Change in Fund Balance - - 70,000 (70,000) - - - - -
Project 0000165 - Financial System Improvements Fund 306 - Technology
Beginning Fund Balance
Projected Fund Balance - - 70,000 - - - - - -
Project DescriptionThis project will add new functionality to the City's Munis financial system. This project will be completed in FY22. Operating Budget ImpactsThe additional ACFR-builder module will increase the annual maintenance cost for Munis by some amount ($2K - $4K). Some of the funds in this project are for one-time consulting and implementation and shouldn't have recurring charges.
Project Location Citywide Project Manager Pete Cottrell
540

AppendixCIP Project Detail
FY22 Budget
Prior YearsActuals
FY21Adopted
FY21Projection FY22 FY23 FY24 FY25 FY26 Total
Revenues and Sources of Funds
499100 - Transfer In - From CIP - 10,000 10,000 - - - - - 10,000
Total Revenues and Sources of Funds - 10,000 10,000 - - - - - 10,000
Expenditures and Uses of Funds
595000 - Furniture & Equipment - 10,000 2,000 6,000 - - - - 8,000
Total Expenditures and Uses of Funds - 10,000 2,000 6,000 - - - - 8,000
Net Change in Fund Balance - - 8,000 (6,000) - - - - 2,000
Project 0000166 - Park Facilities Audio-VisualImprovements Fund 306 - Technology
Beginning Fund Balance
Projected Fund Balance - - 8,000 2,000 2,000 2,000 2,000 2,000 2,000
Project DescriptionThis project will add or enhance the audio-visual capabilities at several Parks facilities. This project began in FY21 and will be completed in FY22.
Project Location Select park locations Citywide Project Manager Pete Cottrell
541

AppendixCIP Project Detail
FY22 Budget
Prior YearsActuals
FY21Adopted
FY21Projection FY22 FY23 FY24 FY25 FY26 Total
Revenues and Sources of Funds
499100 - Transfer In - From CIP - 35,000 35,000 - - - - - 35,000
Total Revenues and Sources of Funds - 35,000 35,000 - - - - - 35,000
Expenditures and Uses of Funds
595000 - Furniture & Equipment - 35,000 - 35,000 - - - - 35,000
Total Expenditures and Uses of Funds - 35,000 - 35,000 - - - - 35,000
Net Change in Fund Balance - - 35,000 (35,000) - - - - -
Project 0000167 - Telework Pilot Program 306 - Technology
Beginning Fund Balance
Projected Fund Balance - - 35,000 - - - - - -
Project DescriptionThis project will fund expenditures related to the implementation of a telework pilot program. The project will be completed in FY22.Operating Budget ImpactsIt is anticipated that there will be operating budget impacts. However, until the program is defined the actual impact is no known.
Project Location Citywide
Fund
Project Manager Pete Cottrell
542

AppendixCIP New Project Detail
FY22 Budget
Prior YearsActuals
FY21Adopted
FY21Projection FY22 FY23 FY24 FY25 FY26 Total
Revenues and Sources of Funds
499000 - Transfer In - From General Fund - - - 60,000 - - - - 60,000
Total Revenues and Sources of Funds - - - 60,000 - - - - 60,000
Expenditures and Uses of Funds
595000 - Furniture & Equipment - - - 60,000 - - - - 60,000
Total Expenditures and Uses of Funds - - - 60,000 - - - - 60,000
Net Change in Fund Balance - - - - - - - - -
Project 0000175 - Cloud Data Governance Fund 306 - Technology
Beginning Fund Balance
Projected Fund Balance - - - - - - - - -
Project DescriptionThis project the selection and implementation of a product to provide governance capabilities over the increased amount of City data which will be stored in the cloudas a result of moving to the Microsoft 365 platform. This project will begin in FY22 with completion in early FY23.
Operating Budget ImpactsThere will be a recurring operating cost for the use of this product, possibly close to the original implementation request for this project.
Project Location Citywide Project Manager Pete Cottrell
543

AppendixCIP New Project Detail
FY22 Budget
Prior YearsActuals
FY21Adopted
FY21Projection FY22 FY23 FY24 FY25 FY26 Total
Revenues and Sources of Funds
499000 - Transfer In - From General Fund - - - 40,000 - - - - 40,000
Total Revenues and Sources of Funds - - - 40,000 - - - - 40,000
Expenditures and Uses of Funds
595000 - Furniture & Equipment - - - 40,000 - - - - 40,000
Total Expenditures and Uses of Funds - - - 40,000 - - - - 40,000
Net Change in Fund Balance - - - - - - - - -
Project 0000176 - GIS Software Migration Fund 306 - Technology
Beginning Fund Balance
Projected Fund Balance - - - - - - - - -
Project DescriptionThis project involves the migration of Casual User Toolbar in the current GIS system to new a GIS application. This project will be completed in FY22.
Project Location Citywide Project Manager Pete Cottrell
544

AppendixCIP New Project Detail
FY22 Budget
Prior YearsActuals
FY21Adopted
FY21Projection FY22 FY23 FY24 FY25 FY26 Total
Revenues and Sources of Funds
499000 - Transfer In - From General Fund - - - 60,000 - - - - 60,000
Total Revenues and Sources of Funds - - - 60,000 - - - - 60,000
Expenditures and Uses of Funds
595000 - Furniture & Equipment - - - 60,000 - - - - 60,000
Total Expenditures and Uses of Funds - - - 60,000 - - - - 60,000
Net Change in Fund Balance - - - - - - - - -
Project 0000177 - Meeting Management SystemReplacement
Fund 306 - Technology
Beginning Fund Balance
Projected Fund Balance - - - - - - - - -
Project DescriptionThis project involves the select and implementation of a replacement agenda/meeting management software system. The project will also involve the migrate yearsof historical data (agendas, minutes, meeting video) to the new platform. This project will be completed in FY22.
Operating Budget ImpactsIt is anticipated that there will be impacts to the operating budget. The amount of recurring expense will depend on the system selected.
Project Location Citywide Project Manager Pete Cottrell
545

AppendixCIP New Project Detail
FY22 Budget
Prior YearsActuals
FY21Adopted
FY21Projection FY22 FY23 FY24 FY25 FY26 Total
Revenues and Sources of Funds
499000 - Transfer In - From General Fund - - - 50,000 - - - - 50,000
Total Revenues and Sources of Funds - - - 50,000 - - - - 50,000
Expenditures and Uses of Funds
595000 - Furniture & Equipment - - - 50,000 - - - - 50,000
Total Expenditures and Uses of Funds - - - 50,000 - - - - 50,000
Net Change in Fund Balance - - - - - - - - -
Project 0000178 - Microsoft 365 Migration Fund 306 - Technology
Beginning Fund Balance
Projected Fund Balance - - - - - - - - -
Project DescriptionThis project involves the migration of City staff and computers from the traditional Office platform to the subscription-based Microsoft 365 platform. This project willbe completed in FY22.
Operating Budget ImpactsThe new model is subscription-based and a change from how the City has operated for the past 12 years. This will result an annual budget expenses rather than aonetime investment.
Project Location Citywide Project Manager Pete Cottrell
546

AppendixCIP New Project Detail
FY22 Budget
Prior YearsActuals
FY21Adopted
FY21Projection FY22 FY23 FY24 FY25 FY26 Total
Revenues and Sources of Funds
499000 - Transfer In - From General Fund - - - - 30,000 - - - 30,000
Total Revenues and Sources of Funds - - - - 30,000 - - - 30,000
Expenditures and Uses of Funds
595000 - Furniture & Equipment - - - - 30,000 - - - 30,000
Total Expenditures and Uses of Funds - - - - 30,000 - - - 30,000
Net Change in Fund Balance - - - - - - - - -
Project 0000179 - Museum/Plaza Tech Enhancements Fund 306 - Technology
Beginning Fund Balance
Projected Fund Balance - - - - - - - - -
Project DescriptionThis project involves IT enhancements with the relocation of the Rolling Stock at the Museum Complex. In addition, there will be improved service to public wi-fi atthe Museum Complex. This project will be completed in FY23.
Operating Budget ImpactsIt is anticipated that there will be a minimal impact to the operating budget because of the need for annual service costs for additional devices.
Project Location Rolling Stock, 9 South Summit Avenue Project Manager Pete Cottrell
547

AppendixCIP Project Detail
FY22 Budget
Prior YearsActuals
FY21Adopted
FY21Projection FY22 FY23 FY24 FY25 FY26 Total
Revenues and Sources of Funds
499000 - Transfer In - From General Fund 100,000 - - - - - - - 100,000
499100 - Transfer In - From CIP 220,000 80,000 80,000 - - - - - 300,000
Total Revenues and Sources of Funds 320,000 80,000 80,000 - - - - - 400,000
Expenditures and Uses of Funds
536000 - Miscellaneous ProfessionalServices - 10,000 10,000 10,000 - - - - 20,000
591100 - Construction - 155,000 - 200,000 150,000 123,000 - - 473,000
Total Expenditures and Uses of Funds - 165,000 10,000 210,000 150,000 123,000 - - 493,000
Net Change in Fund Balance 320,000 (85,000) 70,000 (210,000) (150,000) (123,000) - - (93,000)
Project 0000107 - Olde Towne - Art Project Fund 307 - Art in Public Places
Beginning Fund Balance 93,000 - - - - - - - 93,000
Projected Fund Balance 413,000 328,000 483,000 273,000 123,000 - - - -
Project DescriptionThe City of Gaithersburg is working to enhance the gateways to our community. This project involves the intersection of Shady Grove Road at I-370 both the overand underpass, The project is in the final solicitation stages and will move to design in FY22 working with Maryland Department of Transportation. Construction willbegin in FY22-23 with final installation in FY23-24. Operating Budget ImpactsThis project will increase the operating budget with ongoing electrical utility, equipment upgrades/replacements, and maintenance costs.
Project Location Frederick Avenue (Route 355) at I-370 Overpass Project Manager Shellie Williams
307 - Art in Public Places
548

AppendixCIP Project Detail
FY22 Budget
Prior YearsActuals
FY21Adopted
FY21Projection FY22 FY23 FY24 FY25 FY26 Total
Revenues and Sources of Funds
499000 - Transfer In - From General Fund 6,000 - - - - - - - 6,000
499100 - Transfer In - From CIP - - 6,000 - - - - - 6,000
Total Revenues and Sources of Funds 6,000 - 6,000 - - - - - 12,000
Expenditures and Uses of Funds
536000 - Miscellaneous ProfessionalServices - - 3,000 - - - - - 3,000
591100 - Construction - - - 5,000 - - - - 5,000
Total Expenditures and Uses of Funds - - 3,000 5,000 - - - - 8,000
Net Change in Fund Balance 6,000 - 3,000 (5,000) - - - - 4,000
Project 0000108 - Diamond Farms Skate Spot - Art Project Fund 307 - Art in Public Places
Beginning Fund Balance 2,000 - - - - - - - 2,000
Projected Fund Balance 8,000 8,000 11,000 6,000 6,000 6,000 6,000 6,000 6,000
Project DescriptionThis project will enhance the Diamond Farms Skate Spot and through public engagement with artists create a sense of pride of place. The design scope includescommunity workshops with local skaters and residents. Due to the pandemic, construction and installation will occur in FY22. Additional funds are sought to expandthe installation footprint and ensure a more equitable distribution of AIPP funds in the City.Operating Budget ImpactsThis project will increase the operating budget with only minor maintenance costs.
Project LocationDiamond Farms Skate Spot, 857 Quince OrchardBoulevard Project Manager Shellie Williams
549
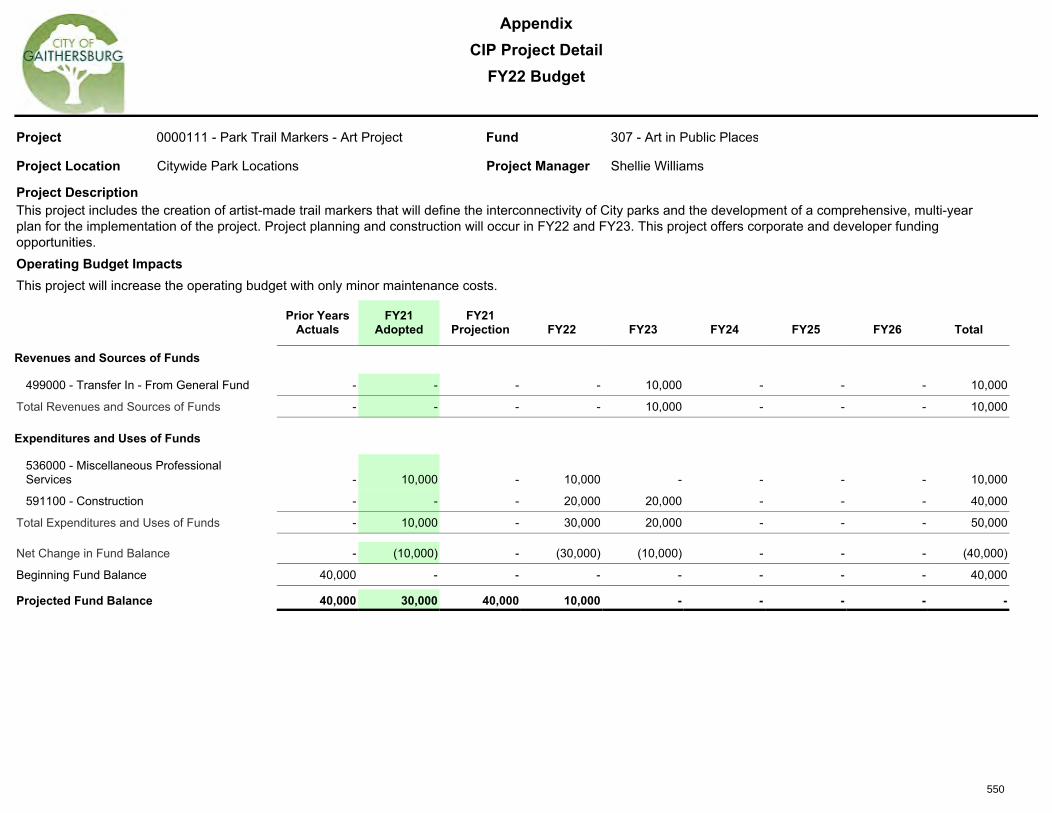
AppendixCIP Project Detail
FY22 Budget
Prior YearsActuals
FY21Adopted
FY21Projection FY22 FY23 FY24 FY25 FY26 Total
Revenues and Sources of Funds
499000 - Transfer In - From General Fund - - - - 10,000 - - - 10,000
Total Revenues and Sources of Funds - - - - 10,000 - - - 10,000
Expenditures and Uses of Funds
536000 - Miscellaneous ProfessionalServices - 10,000 - 10,000 - - - - 10,000
591100 - Construction - - - 20,000 20,000 - - - 40,000
Total Expenditures and Uses of Funds - 10,000 - 30,000 20,000 - - - 50,000
Net Change in Fund Balance - (10,000) - (30,000) (10,000) - - - (40,000)
Project 0000111 - Park Trail Markers - Art Project Fund 307 - Art in Public Places
Beginning Fund Balance 40,000 - - - - - - - 40,000
Projected Fund Balance 40,000 30,000 40,000 10,000 - - - - -
Project DescriptionThis project includes the creation of artist-made trail markers that will define the interconnectivity of City parks and the development of a comprehensive, multi-year plan for the implementation of the project. Project planning and construction will occur in FY22 and FY23. This project offers corporate and developer funding opportunities.Operating Budget ImpactsThis project will increase the operating budget with only minor maintenance costs.
Project Location Citywide Park Locations Project Manager Shellie Williams
550

AppendixCIP Project Detail
FY22 Budget
Prior YearsActuals
FY21Adopted
FY21Projection FY22 FY23 FY24 FY25 FY26 Total
Revenues and Sources of Funds
499000 - Transfer In - From General Fund 18,000 - - - - - - - 18,000
Total Revenues and Sources of Funds 18,000 - - - - - - - 18,000
Net Change in Fund Balance 18,000 - - - - - - - 18,000
Project 0000112 - Developer Sponsored City Art Projects Fund 307 - Art in Public Places
Beginning Fund Balance - - - - - - - - -
Projected Fund Balance 18,000 18,000 18,000 18,000 18,000 18,000 18,000 18,000 18,000
Project DescriptionThe project serves as a source for possible developer sponsored art projects which are not individually programmed. Projects will be recognized and recommendedby the City Planning and Code Administration as meeting the criteria for participating in the City’s Arts in Public Places program. Preliminary tasks for such a projectinclude assessment of site for suitability and development of design criteria, and solicitation. Because these projects are not known at the time of the budget, theexpenditures serve as place holders and any remaining funds are returned to the Future Art in Public Places project. There are no anticipated expenditures.Operating Budget ImpactsThis project will increase the operating budget with only minor maintenance costs.
Project Location Citywide Project Manager Shellie Williams
551

AppendixCIP Project Detail
FY22 Budget
Prior YearsActuals
FY21Adopted
FY21Projection FY22 FY23 FY24 FY25 FY26 Total
Revenues and Sources of Funds
499000 - Transfer In - From General Fund 43,000 - - - - - - - 43,000
499100 - Transfer In - From CIP 3,000 - 13,300 - - - - - 16,300
Total Revenues and Sources of Funds 46,000 - 13,300 - - - - - 59,300
Net Change in Fund Balance 46,000 - 13,300 - - - - - 59,300
Project 0000113 - Future Art in Public Places Fund 307 - Art in Public Places
Beginning Fund Balance 2,661 - - - - - - - 2,661
Projected Fund Balance 48,661 48,661 61,961 61,961 61,961 61,961 61,961 61,961 61,961
Project DescriptionThis project serves as a place holder for future projects not yet defined in scope or location, which require dedicated funding sources. This allows the City to takeadvantage of public art opportunities when projects are time-sensitive such as when external grant and donor funding is available. When a project is developed, anew project will be established and funding will be transferred from this project.
Project Location Citywide Project Manager Shellie Williams
552

AppendixCIP Project Detail
FY22 Budget
Prior YearsActuals
FY21Adopted
FY21Projection FY22 FY23 FY24 FY25 FY26 Total
Revenues and Sources of Funds
499000 - Transfer In - From General Fund 7,000 - - - - - - - 7,000
499100 - Transfer In - From CIP - 40,000 40,000 75,000 - - - - 115,000
Total Revenues and Sources of Funds 7,000 40,000 40,000 75,000 - - - - 122,000
Expenditures and Uses of Funds
536000 - Miscellaneous ProfessionalServices - 10,000 - 10,000 - - - - 10,000
591100 - Construction - - 12,000 100,000 - - - - 112,000
Total Expenditures and Uses of Funds - 10,000 12,000 110,000 - - - - 122,000
Net Change in Fund Balance 7,000 30,000 28,000 (35,000) - - - - -
Project 0000127 - 16 S. Summit Ave Building - Art Project Fund 307 - Art in Public Places
Beginning Fund Balance - - - - - - - - -
Projected Fund Balance 7,000 37,000 35,000 - - - - - -
Project DescriptionThis project involves the design, construction and installation of a sculptural art piece at the municipal building at 16 S. Summit Ave. that reflects community service, diversity and citizenship in Gaithersburg. This project began in FY20 and will be completed in FY22.Operating Budget ImpactsThis project will impact the operational budget through additional maintenance requirements.
Project Location 16 South Summit Avenue Project Manager Shellie Williams
553

AppendixCIP Project Detail
FY22 Budget
Project Fund 307 - Art in Public Places
Project Location
0000128 - City Event Banners - Art Project
Olde Towne and MD 355 Corridor Project Manager Shellie Williams
Prior YearsActuals
FY21Adopted
FY21Projection FY22 FY23 FY24 FY25 FY26 Total
Revenues and Sources of Funds
499000 - Transfer In - From General Fund 70,000 - - - - - - - 70,000
Total Revenues and Sources of Funds 70,000 - - - - - - - 70,000
Net Change in Fund Balance 70,000 - - - - - - - 70,000
- - - - - - - - -Beginning Fund Balance
Projected Fund Balance 70,000 70,000 70,000 70,000 70,000 70,000 70,000 70,000 70,000
Project DescriptionDesign and construction of artist-designed street banners that graphically reference Gaithersburg with quality-of-life imagery that depicts the City’s arts and culture, parks, community engagement, diversity, history and heritage. Banners will be installed in Olde Towne and along Maryland Route 355. The project has been on hold while waiting for Pepco’s approval to use their poles. Construction and installation are dependent on Pepco and an easement approval from the State Highway Administration.Operating Budget ImpactsThere will be construction and Pepco fees to upgrade selected poles; in-house installation and maintenance costs; equipment and banner replacements.
554

AppendixCIP New Project Detail
FY22 Budget
Prior YearsActuals
FY21Adopted
FY21Projection FY22 FY23 FY24 FY25 FY26 Total
Revenues and Sources of Funds
499100 - Transfer In - From CIP - - - 60,000 - - - - 60,000
Total Revenues and Sources of Funds - - - 60,000 - - - - 60,000
Expenditures and Uses of Funds
536000 - Miscellaneous ProfessionalServices - - - 10,000 10,000 8,000 - - 28,000
591100 - Construction - - - 10,000 10,000 10,000 - - 30,000
Total Expenditures and Uses of Funds - - - 20,000 20,000 18,000 - - 58,000
Net Change in Fund Balance - - - 40,000 (20,000) (18,000) - - 2,000
Project 0000180 - Community Mural Project Fund 307 - Art in Public Places
Beginning Fund Balance
Projected Fund Balance - - - 40,000 20,000 2,000 2,000 2,000 2,000
Project DescriptionThis is multi-year project targets key underpasses areas in the City—especially Olde Towne—for artist-led, community-made murals. The project will bring youth,professional and volunteer artists, and the Gaithersburg community together to creatively reimagine and enliven public spaces. The Father Cuddy underpass is thefirst project to be started and should be completed in FY22. Additional mural projects are anticipated in FY23 and FY24.
Operating Budget ImpactsMinimal cleaning and repair will be required every 5 years which will have a low budget impact. More costly maintenance costs will occur every 10-15 years with theneed to repaint with new image.
Project Location Citywide Project Manager Shellie Williams
555

Ribbon Cutting at Discovery Park
556

AppendixStormwater Projects Summary
By Project, By Fund
FY21 FY22 FY23 FY24 FY25 FY26 Total All Years
Beg.Balance
Proj'dRev.
Proj'dExpend.
Rev.Budget
ExpendBudget
Rev.Budget
ExpendBudget
Rev.Budget
ExpendBudget
Rev.Budget
ExpendBudget
Rev.Budget
ExpendBudget
EndingBalance Rev. Expend
Stormwater Management
SW00002 - Muddy Branch West Deer 37,416 - - - - - 37,416 -
SW00004 - Girard Street Stream 493,904 - 43,143 - 78,044 - 363,393 360,000 363,393 - - - - 5,932 360,000 847,973
SW00005 - Victory Farm 2,609,391 100,664 - 50,332 - 1,185,000 - 1,193,655 - - - - 79,740 - 2,529,651
SW00006 - Amberfield 468,597 - - - - - - 31,403 - - 100,000 400,000 31,403 100,000
SW00007 - Lakelands Drive Stream 55,824 55,824 - - - - - - - - - - - - 55,824
SW00008 - Orchard Ridge DriveStream 15,086 - 15,086 - - - - - - - - - - - - 15,086
SW00009 - Watkins Mill Road Stream 1,121,388 - 1,019,700 - 900 - - - - - - - - 100,788 - 1,020,600
SW00010 - Travis Avenue Stream 776,442 - 691,700 - 3,000 - - - - - - - - 81,742 - 694,700
SW00011 - Solitaire Court Stream 530,293 530,293 - - - - - - - - - - - - 530,293
SW00012 - Rabbitt Road Stream 550,418 40,000 - 75,500 450,000 865,000 300,000 303,500 - - - - 16,418 750,000 1,284,000
SW00015 - Solitaire Court StreamRestoration Extension 493,756 - 45,000 1,950,000 2,249,500 50,000 64,250 - - - - - - 135,006 2,000,000 2,358,750
SW00017 - Quince Orchard Blvd.Recon SWM 250,000 250,000 - - - - - 250,000
SW00018 - Kelley Park - Tennis CourtsDrainage Improvements 74,000 74,000 - - - - - - 74,000
SW00019 - Kelley Park - Parking LotDrainage Improvements 74,000 74,000 - - - - - - 74,000
SW00020 - Victory Farm Retrofit -WSSC 784,000 - - - 49,135 120,000 417,931 - 387,000 - - - - 49,934 120,000 854,066
SW00021 - Casey Community SiteInstallation 77,000 80,000 - 85,000 37,000 - 110,000 - 91,000 - - 4,000 165,000 238,000
SW00022 - Brighton Weir Retrofit 220,000 - - - - 55,000 - 100,000 1,540,000 1,553,000 1,650,000 1,650,000 52,000 3,190,000 3,358,000
SW00023 - Green Park Retrofit 165,000 - - - - - 57,500 60,000 160,500 490,000 456,500 40,500 550,000 674,500
SW00024 - Bridalwood Retrofit 600,000 - - - - 50,000 30,000 - 70,000 - 550,000 - 50,000 650,000
SW00025 - Turtle Pond Retrofit 350,000 - - - - - 30,000 300,000 70,000 - 550,000 - 300,000 650,000
SW00026 - Hyde Park Retrofit 120,000 - - - - 550,000 - - 35,000 - 85,000 550,000 550,000 120,000
SW00027 - Carriage Hills Retrofit 120,000 - - - - - - - 35,000 550,000 85,000 550,000 550,000 120,000
SW00028 - Woodland Hills Retrofit 70,000 - - - - - 15,000 300,000 40,000 - 15,000 300,000 300,000 70,000
SW00029 - DI001 - 122 & 124Woodland Road 148,500 - - - 125,000 - - - - - - - - 23,500 - 125,000
SW00030 - DI002 - 100 Water Street -Stream Erosion 501,000 - 750,000 - - 501,000 - 400,000 - 350,000 - - - 750,000 1,251,000
SW00032 - DI005 - 14 Chestnut Street- Storm Drain Repair / Drain Imp. 100,000 10,000 50,000 - - - - - - - - - - 60,000 10,000 50,000
SW00033 - Headwaters DrainageStudy - 90,000 - 40,000 - 50,000 - - - - - - - 90,000 90,000
SW00034 - Lake Kersten Repairs - 53,200 31,250 67,685 89,635 200,595 200,595 - - - - - - - 321,480 321,480
557

AppendixStormwater Projects Summary
By Project, By Fund
FY21 FY22 FY23 FY24 FY25 FY26 Total All Years
Beg.Balance
Proj'dRev.
Proj'dExpend.
Rev.Budget
ExpendBudget
Rev.Budget
ExpendBudget
Rev.Budget
ExpendBudget
Rev.Budget
ExpendBudget
Rev.Budget
ExpendBudget
EndingBalance Rev. Expend
Stormwater Management
SW00035 - Lake Lynnette Repairs - 20,000 - - 50,000 35,000 65,000 36,700 - 61,300 - - 2,000 135,000 133,000
SW00036 - Lake Placid Repairs - 35,000 5,500 164,000 25,000 136,000 163,000 - 129,000 - - - - 12,500 335,000 322,500
SW00041 - Watershed Studies - - - - - - - - - 200,000 200,000 200,000 200,000 - 400,000 400,000
SW00037 - Armoring of High Hazard and Significant Hazard Dams - - - 390,000 390,000 - - - - - - - - - 390,000 390,000
SW00038 - East Darby Court Drainage Repair - - - 30,000 30,000 - - - - - - - - - 30,000 30,000
SW00040 - Walder Park Drainage Repair - - - - - - - 55,000 55,000 55,000 55,000 - - - 110,000 110,000
SW00039 - Stormwater Contingency - - - 500,000 250,000 - - - - - - - - 250,000 500,000 250,000
Stormwater Management Fund Total 10,806,014 208,200 2,776,160 3,931,685 3,706,046 1,091,595 3,937,169 1,380,000 3,210,748 2,486,403 2,720,800 2,890,000 3,691,500 2,751,476 11,987,883 20,042,423
558

AppendixStormwater Project Detail
FY22 Budget
Prior YearsActuals
FY21Adopted
FY21Projection FY22 FY23 FY24 FY25 FY26 Total
Revenues and Sources of Funds
499200 - Transfer In 1,080 - - - - 360,000 - - 361,080
Total Revenues and Sources of Funds 1,080 - - - - 360,000 - - 361,080Expenditures and Uses of Funds
532000 - Engineering & Architecture 2,140 86,285 43,143 78,044 - - - - 123,327
532300 - Construction Oversight - - - - 53,393 53,393 - - 106,786
591100 - Construction - - - - 310,000 310,000 - - 620,000
Total Expenditures and Uses of Funds 2,140 86,285 43,143 78,044 363,393 363,393 - - 850,113
Net Change in Fund Balance (1,060) (86,285) (43,143) (78,044) (363,393) (3,393) - - (489,033)
Beginning Fund Balance 494,964 - - - - - - - -
Projected Fund Balance 493,904 407,619 450,762 372,718 9,325 5,932 5,932 5,932 5,932
Project Description Estimated Credits 6
The project includes stream restoration of approximately 930 linear feet for reconnecting, grading, stabilizing, realigning, and repairing the existing stream channel (sites 2012-1aand 2012-2 per the Middle Great Seneca Creek Watershed Study). The intent is to implement restoration to the maximum extent possible. The potential credit achievement hasbeen estimated at 3-9 credits.
The original anticipated budget has been amended from $510,000 to $897,000, due to market price changes, scope revisions for wet pond design (refer to SW00005) and toinclude construction management services.
Schedule Impacts: The original time frame contemplated completion of the concept phase in FY18 with full design proceeding in FY19 and construction beginning in FY20.During the concept phase, it was determined that the scope of the Victory Farm project (SW00005) could be revised to increase the credit achieved with minor impacts to thesestream designs. This scope revision was finalized in March 2019 resulting in the revised schedule of 60% design completion in FY21, 100% design completion in FY22, andconstruction in FY23/FY24.
Operating Budget ImpactsStream restoration projects require five (5) years of post-construction monitoring and the cost is noted under the Infrastructure Maintenance (3361) portion of the StormwaterFund budget.
Project SW00004 - Girard Street Stream
Project Location North of Girard Street, to the northeast of the intersection of Girard Street and Whetstone Glen Street
Project Manager Pearce Wroe
559

AppendixStormwater Project Detail
FY22 Budget
Prior YearsActuals
FY21Adopted
FY21Projection FY22 FY23 FY24 FY25 FY26 Total
Revenues and Sources of Funds
499200 - Transfer In 12,733 - - - - - - - 12,733
Total Revenues and Sources of Funds 12,733 - - - - - - - 12,733Expenditures and Uses of Funds
532000 - Engineering & Architecture 23,263 - 100,664 50,332 - - - - 174,259
532300 - Construction Oversight - - - - 60,000 68,655 - - 128,655
591100 - Construction - - - - 1,125,000 1,125,000 - - 2,250,000
Total Expenditures and Uses of Funds 23,263 - 100,664 50,332 1,185,000 1,193,655 - - 2,552,914
Net Change in Fund Balance (10,530) - (100,664) (50,332) (1,185,000) (1,193,655) - - (2,540,181)
Beginning Fund Balance 2,619,920 - - - - - - - -
Projected Fund Balance 2,609,391 2,609,391 2,508,727 2,458,395 1,273,395 79,740 79,740 79,740 79,740
Project Description Estimated Credits 125
The stormwater facility is an existing concrete structure which retains stormwater in a stream over a large area. It was constructed in 1973 and modified in 1999; the originalscope contemplated minor revisions to the concrete structure to better retain stormwater and reduce erosion. During the concept phase it was determined that retrofitting a pondwould better serve the needs of the City as it greatly increases pollutant removal and erosion reduction. The potential credit achievement has been estimated at 125 credits.
The original anticipated budget has been amended from $2.62M to $2.56M, due to the cost of increased design and construction management services being offset byforecasted construction scope of the pond retrofit.
Schedule Impacts: The original time frame contemplated completion of the concept phase in FY18 with full design proceeding in FY20 and construction beginning in FY22. Thescope revision of the pond retrofit was finalized in March 2019, resulting in the revised schedule of 100% design completion in FY22 and construction in FY23/FY24.
Operating Budget ImpactsThe retrofit of the pond to a wet pond will most likely require additional maintenance of inspections, dredging and re-grading of the pond bottom, and concrete structure repairsperiodically.
Project SW00005 - Victory Farm
Project Location South of Forest Oak Middle School (sites 2012-1a and 2012-2 per the Middle Great Seneca Creek Watershed Study)
Project Manager Pearce Wroe
560

AppendixStormwater Project Detail
FY22 Budget
Prior YearsActuals
FY21Adopted
FY21Projection FY22 FY23 FY24 FY25 FY26 Total
Revenues and Sources of Funds
499200 - Transfer In - - - - - - 31,403 - 31,403
Total Revenues and Sources of Funds - - - - - - 31,403 - 31,403Expenditures and Uses of Funds
532000 - Engineering & Architecture - - - - - - - 100,000 100,000
Total Expenditures and Uses of Funds - - - - - - - 100,000 100,000
Net Change in Fund Balance - - - - - - 31,403 (100,000) (468,597)
Beginning Fund Balance 468,597 - - - - - - - -
Projected Fund Balance 468,597 468,597 468,597 468,597 468,597 468,597 500,000 400,000 400,000
Project Description Estimated Credits 10
This is an existing Common Ownership Community (COC) stormwater management facility, originally implemented in 1987. Currently, it is a dry pond providing only waterquantity treatment (no water quality treatment). The scope of the project will be to retrofit this facility to incorporate water quality treatment to maximize credit achievement for the12 impervious drainage acres flowing to the facility. This project’s design was budgeted within FY16, placed on hold in FY17 to allow for the development and approval of a Citypolicy in performing work on COC facilities. Concept layout decision with public outreach and final design will be completed in FY26. Construction is planned for FY27.
Operating Budget ImpactsTBD; City may assume structural maintenance responsibility depending on COC facility policy.
Project SW00006 - Amberfield
Project Location The north side of MD 119 (Great Seneca Highway) near Muddy Branch Road
Project Manager Patrick Fitzgerald
561

AppendixStormwater Project Detail
FY22 Budget
Prior YearsActuals
FY21Adopted
FY21Projection FY22 FY23 FY24 FY25 FY26 Total
Revenues and Sources of Funds
499200 - Transfer In 757,882 - - - - - - - 757,882
Total Revenues and Sources of Funds 757,882 - - - - - - - 757,882Expenditures and Uses of Funds
532000 - Engineering & Architecture 106,494 - 1,700 - - - - - 108,194
532300 - Construction Oversight - 50,350 50,000 900 - - - - 50,900
591100 - Construction - 1,007,069 968,000 - - - - - 968,000
597500 - Construction Management - 28,500 - - - - - - -
Total Expenditures and Uses of Funds 106,494 1,085,919 1,019,700 900 - - - - 1,127,094
Net Change in Fund Balance 651,388 (1,085,919) (1,019,700) (900) - - - - (369,212)
Beginning Fund Balance 470,000 - - - - - - - -
Projected Fund Balance 1,121,388 35,469 101,688 100,788 100,788 100,788 100,788 100,788 100,788
Project Description Estimated Credits 39
The project includes approximately 1,300 linear feet of restoration of Whetstone Run in Blohm Park including floodplain reconnection, grading, stabilizing, and repairing the existing stream channel. The intent is to implement restoration to the maximum extent possible. A specimen tree was impacted by the construction. The credits are estimated to be 39 based on the state's guidance of April, 2019.
Schedule impacts: The original time frame contemplated completion of design in FY18, but scope revisions due to the status of bridge inspections delayed the final design until FY20. Construction was completed in FY21.
Operating Budget ImpactsStream restoration projects require five (5) years of post-construction monitoring and the cost is noted under the Infrastructure Maintenance (3361) portion of the StormwaterFund budget.
Project SW00009 - Watkins Mill Road Stream
Project Location West of Watkins Mill Road in the northeastern portion of Blohm Park (see the Middle Great Seneca Creek Watershed Study site GST-1)
Project Manager Beth Forbes
562

AppendixStormwater Project Detail
FY22 Budget
Prior YearsActuals
FY21Adopted
FY21Projection FY22 FY23 FY24 FY25 FY26 Total
Revenues and Sources of Funds
499200 - Transfer In 477,055 - - - - - - - 477,055
Total Revenues and Sources of Funds 477,055 - - - - - - - 477,055Expenditures and Uses of Funds
532000 - Engineering & Architecture 64,613 - 1,700 - - - - - 66,313
532300 - Construction Oversight - 33,520 45,000 3,000 - - - - 48,000
591100 - Construction - 670,380 645,000 - - - - - 645,000
597500 - Construction Management - 30,000 - - - - - - -
Total Expenditures and Uses of Funds 64,613 733,900 691,700 3,000 - - - - 759,313
Net Change in Fund Balance 412,442 (733,900) (691,700) (3,000) - - - - (282,258)
Beginning Fund Balance 364,000 - - - - - - - -
Projected Fund Balance 776,442 42,542 84,742 81,742 81,742 81,742 81,742 81,742 81,742
Project Description Estimated Credits 27
The project includes approximately 900 linear feet of restoration of Watkins Mill Run in Blohm Park including grading, stabilizing, and repairing the existing stream channel. The intent is to implement restoration to the maximum extent possible. A specimen tree was impacted by the construction. The credits are estimated to be 27 based on the state's guidance of April, 2019.
Schedule impacts: The original time frame contemplated completion of design in FY18, but scope revisions due to the status of bridge inspections delayed the final design until FY20. Construction was completed in FY21.
Operating Budget ImpactsStream restoration projects require five (5) years of post-construction monitoring and the cost is noted under the Infrastructure Maintenance (3361) portion of the StormwaterFund budget.
Project SW00010 - Travis Avenue Stream
Project LocationNorth of Travis Avenue between Watkins Mill Road and Knoll Mist Lane in Blohm Park (see the Middle Great Seneca Creek Watershed Studysites GST-2a and GST-2b)
Project Manager Beth Forbes
563

AppendixStormwater Project Detail
FY22 Budget
Prior YearsActuals
FY21Adopted
FY21Projection FY22 FY23 FY24 FY25 FY26 Total
Revenues and Sources of Funds
499200 - Transfer In - - - - 450,000 300,000 - - 750,000
Total Revenues and Sources of Funds - - - - 450,000 300,000 - - 750,000Expenditures and Uses of Funds
532000 - Engineering & Architecture 36,779 65,000 40,000 75,500 - - - - 152,279
532100 - Concept Design and Outreach 2,803 - - - - - - - 2,803
532300 - Construction Oversight - - - - 40,000 28,500 - - 68,500
591100 - Construction - - - - 825,000 275,000 - - 1,100,000
Total Expenditures and Uses of Funds 39,582 65,000 40,000 75,500 865,000 303,500 - - 1,323,582
Net Change in Fund Balance (39,582) (65,000) (40,000) (75,500) (415,000) (3,500) - - (573,582)
Beginning Fund Balance 590,000 - - - - - - - -
Projected Fund Balance 550,418 485,418 510,418 434,918 19,918 16,418 16,418 16,418 16,418
Project Description Estimated Credits 41
The stream section (including site Rabbitt East #4 Stream Restoration per the Lower Great Seneca Creek Watershed Study) includes over 1,100 linear feet located on LongDraught Branch Tributary. The scope of the project will range from spot treatment to full restoration depending on degradation and consultant's recommendations during thedesign process. The intent is to implement restoration to the maximum extent possible. The potential credit achievement has been estimated at 37 credits. Upfront work,including survey and concept layouts, was submitted to DPW in FY18. Due to staffing concerns, this project was put on hold until FY20. Additional scope is being included in theFY22 budget to investigate the feasibility of restoring the gap between this project and the completed SHA stream restoration project upstream. The DPW sand filter outfallreplacement is also being planned concurrently with this project, but funding for that portion is provided separately under Facilities CIP Project #0000119. Final Design Plans(30% through 100%) are anticipated for completion in FY22 and construction is anticipated to occur in FY23 and FY24.
Operating Budget ImpactsStream restoration projects require five (5) years of post-construction monitoring and the cost is noted under the Infrastructure Maintenance (3361) portion of the StormwaterFund budget.
Project SW00012 - Rabbitt Road Stream
Project Location North of Rabbitt Road between Pointer Ridge Drive and Quince Orchard Boulevard
Project Manager Patrick Fitzgerald
564

AppendixStormwater Project Detail
FY22 Budget
Prior YearsActuals
FY21Adopted
FY21Projection FY22 FY23 FY24 FY25 FY26 Total
Revenues and Sources of Funds
499200 - Transfer In 141,508 - - 1,950,000 50,000 - - - 2,141,508
Total Revenues and Sources of Funds 141,508 - - 1,950,000 50,000 - - - 2,141,508Expenditures and Uses of Funds
532000 - Engineering & Architecture 117,752 11,900 45,000 2,000 35,000 - - - 199,752
532300 - Construction Oversight - - - 95,000 3,000 - - - 98,000
591100 - Construction - - - 2,152,500 26,250 - - - 2,178,750
Total Expenditures and Uses of Funds 117,752 11,900 45,000 2,249,500 64,250 - - - 2,476,502
Net Change in Fund Balance 23,756 (11,900) (45,000) (299,500) (14,250) - - - (334,994)
Beginning Fund Balance 470,000 - - - - - - - -
Projected Fund Balance 493,756 481,856 448,756 149,256 135,006 135,006 135,006 135,006 135,006
Project Description Estimated Credits 85
This project will restore approximately 2200 linear feet of stream which will include reconnecting, grading, stabilizing, and repairing the stream channel in Diamond Farms Park. A storm drain outfall repair at the upstream end of the project is also included. A portion of this project appeared in the FY21 CIP as SW00011. Approximately 86 equivalent-acre credits are expected upon completion. The project was originally conceived as a pond and 267 linear feet of restoration. The proposed pond was not well received by the public and the restoration was lengthened to ensure its future stability. Schedule Impacts: The original time frame contemplated completion of design in FY18, however, scope revisions delayed the 90% design until FY21. 100% design completion was completed in FY21 and construction is planned in FY22 and FY23.
Operating Budget ImpactsStream restoration projects require five (5) years of post-construction monitoring and the cost is noted under the Infrastructure Maintenance (3361) portion of the StormwaterFund budget.
Project SW00015 - Solitaire Court StreamRestoration Extension
Project Location Diamond Farm Park
Project Manager Beth Forbes
565

AppendixStormwater Project Detail
FY22 Budget
Prior YearsActuals
FY21Adopted
FY21Projection FY22 FY23 FY24 FY25 FY26 Total
Expenditures and Uses of Funds
591100 - Construction - 250,000 - 250,000 - - - - 250,000
Total Expenditures and Uses of Funds - 250,000 - 250,000 - - - - 250,000
Net Change in Fund Balance - (250,000) - (250,000) - - - - (250,000)
Beginning Fund Balance 250,000 - - - - - - - -
Projected Fund Balance 250,000 - 250,000 - - - - - -
Project Description Estimated Credits 1
This project will support the design and construction of corresponding stormwater management for the Quince Orchard Boulevard reconstruction project. The scope of the projectis to provide enhanced stormwater treatment along Quince Orchard Boulevard where no stormwater treatment currently exists. Funding has been moved to FY22 to allow forfurther scoping of the overall project.
The number of equivalent-acre credits is an estimate based on similar projects, but will be subject to updates as the project scope is further developed.
Operating Budget ImpactsNew facilities will enter the City's maintenance and inspection program.
Project SW00017 - Quince Orchard Blvd. ReconSWM
Project Location Along Quince Orchard Boulevard, from Rabbitt Road to Diamond Drive
Project Manager Patrick Fitzgerald
566
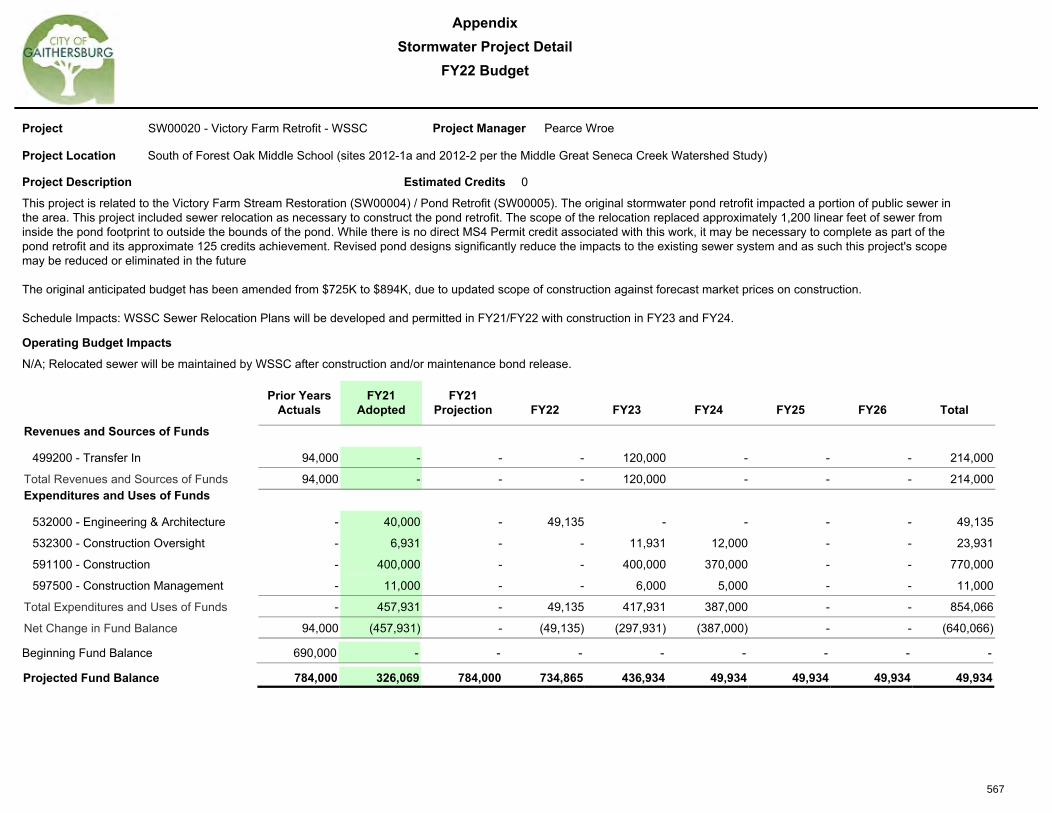
AppendixStormwater Project Detail
FY22 Budget
Prior YearsActuals
FY21Adopted
FY21Projection FY22 FY23 FY24 FY25 FY26 Total
Revenues and Sources of Funds
499200 - Transfer In 94,000 - - - 120,000 - - - 214,000
Total Revenues and Sources of Funds 94,000 - - - 120,000 - - - 214,000Expenditures and Uses of Funds
532000 - Engineering & Architecture - 40,000 - 49,135 - - - - 49,135
532300 - Construction Oversight - 6,931 - - 11,931 12,000 - - 23,931
591100 - Construction - 400,000 - - 400,000 370,000 - - 770,000
597500 - Construction Management - 11,000 - - 6,000 5,000 - - 11,000
Total Expenditures and Uses of Funds - 457,931 - 49,135 417,931 387,000 - - 854,066
Net Change in Fund Balance 94,000 (457,931) - (49,135) (297,931) (387,000) - - (640,066)
Beginning Fund Balance 690,000 - - - - - - - -
Projected Fund Balance 784,000 326,069 784,000 734,865 436,934 49,934 49,934 49,934 49,934
Project Description Estimated Credits 0
This project is related to the Victory Farm Stream Restoration (SW00004) / Pond Retrofit (SW00005). The original stormwater pond retrofit impacted a portion of public sewer inthe area. This project included sewer relocation as necessary to construct the pond retrofit. The scope of the relocation replaced approximately 1,200 linear feet of sewer frominside the pond footprint to outside the bounds of the pond. While there is no direct MS4 Permit credit associated with this work, it may be necessary to complete as part of thepond retrofit and its approximate 125 credits achievement. Revised pond designs significantly reduce the impacts to the existing sewer system and as such this project's scopemay be reduced or eliminated in the future
The original anticipated budget has been amended from $725K to $894K, due to updated scope of construction against forecast market prices on construction.
Schedule Impacts: WSSC Sewer Relocation Plans will be developed and permitted in FY21/FY22 with construction in FY23 and FY24.
Operating Budget ImpactsN/A; Relocated sewer will be maintained by WSSC after construction and/or maintenance bond release.
Project SW00020 - Victory Farm Retrofit - WSSC
Project Location South of Forest Oak Middle School (sites 2012-1a and 2012-2 per the Middle Great Seneca Creek Watershed Study)
Project Manager Pearce Wroe
567

AppendixStormwater Project Detail
FY22 Budget
Prior YearsActuals
FY21Adopted
FY21Projection FY22 FY23 FY24 FY25 FY26 Total
Revenues and Sources of Funds
499200 - Transfer In - - - 80,000 85,000 - - - 165,000
Total Revenues and Sources of Funds - - - 80,000 85,000 - - - 165,000Expenditures and Uses of Funds
532000 - Engineering & Architecture - 30,000 - - 15,000 30,000 - - 45,000
532100 - Concept Design and Outreach - 32,000 - - 22,000 - - - 22,000
532300 - Construction Oversight - - - - - 5,000 6,000 - 11,000
591100 - Construction - - - - - 75,000 85,000 - 160,000
Total Expenditures and Uses of Funds - 62,000 - - 37,000 110,000 91,000 - 238,000
Net Change in Fund Balance - (62,000) - 80,000 48,000 (110,000) (91,000) - (73,000)
Beginning Fund Balance 77,000 - - - - - - - -
Projected Fund Balance 77,000 15,000 77,000 157,000 205,000 95,000 4,000 4,000 4,000
Project Description Estimated Credits 1
A feasible project was originally identified at this site during the Muddy Branch Watershed Assessment. The goal of this project is to build upon that conceptual design to providea site-wide stormwater management system.
Due to the complexity of this project, an initial feasibility study will be conducted for the site in FY23. Design costs in FY23-24 are contingent upon favorable findings of the initialfeasibility study. It is anticipated that in FY24-25 funding will support the construction of this project.
Operating Budget ImpactsNew facilities will enter the City's inspection and maintenance program. Primary maintenance for the proposed facility includes annual landscaping.
Project SW00021 - Casey Community SiteInstallation
Project Location Casey Community Center, 810 South Frederick Avenue
Project Manager Beth Forbes
568

AppendixStormwater Project Detail
FY22 Budget
Prior YearsActuals
FY21Adopted
FY21Projection FY22 FY23 FY24 FY25 FY26 Total
Revenues and Sources of Funds
499200 - Transfer In - - - - - - 1,540,000 1,650,000 3,190,000
Total Revenues and Sources of Funds - - - - - - 1,540,000 1,650,000 3,190,000Expenditures and Uses of Funds
532000 - Engineering & Architecture - 20,000 - - 20,000 100,000 15,000 - 135,000
532100 - Concept Design and Outreach - 63,000 - - 35,000 - - - 35,000
532300 - Construction Oversight - - - - - - 75,000 82,500 157,500
591100 - Construction - - - - - - 1,463,000 1,567,500 3,030,500
Total Expenditures and Uses of Funds - 83,000 - - 55,000 100,000 1,553,000 1,650,000 3,358,000
Net Change in Fund Balance - (83,000) - - (55,000) (100,000) (13,000) - (168,000)
Beginning Fund Balance 220,000 - - - - - - - -
Projected Fund Balance 220,000 137,000 220,000 220,000 165,000 65,000 52,000 52,000 52,000
Project Description Estimated Credits 120
Brighton Weir was originally constructed in the 1970s and was rebuilt in 2004 to meet embankment standards. It currently provides a minimum of water quantity control and aninsignificant amount of water quality treatment. Originally proposed as retrofit project, preliminary information from a state permitting agency indicates that a retrofit of the existingfacility might be difficult to permit.This project would fund a study for a cost-benefit analysis of retrofitting the facility to provide water quality treatment versus other possible projects in Malcolm King Park. Thedrainage area to this facility is large (approximately 2000 acres) and is approximately 50 percent impervious. Significant water quality credits might be realized at this location.
The study would begin in FY23. Conceptual designs of the most feasible project(s) identified in the study would move into a full design in FY24 with construction in FY25-27.
Operating Budget ImpactsImpacts to the operating budget would begin in FY26 and would be assessed upon completion of concept design. Until construction activity begins, the existing facility willcontinue to be inspected and maintained by the current schedule.
Project SW00022 - Brighton Weir Retrofit
Project Location Brighton Weir is a city-owned dry pond within Malcolm King Park between School and Coral Reef Drives
Project Manager Beth Forbes
569

AppendixStormwater Project Detail
FY22 Budget
Prior YearsActuals
FY21Adopted
FY21Projection FY22 FY23 FY24 FY25 FY26 Total
Revenues and Sources of Funds
499200 - Transfer In - - - - - - 60,000 490,000 550,000
Total Revenues and Sources of Funds - - - - - - 60,000 490,000 550,000Expenditures and Uses of Funds
532000 - Engineering & Architecture - - - - - 30,000 107,500 - 137,500
532100 - Concept Design and Outreach - 27,500 - - - 27,500 - - 27,500
532300 - Construction Oversight - - - - - - 3,000 6,500 9,500
591100 - Construction - - - - - - 50,000 450,000 500,000
Total Expenditures and Uses of Funds - 27,500 - - - 57,500 160,500 456,500 674,500
Net Change in Fund Balance - (27,500) - - - (57,500) (100,500) 33,500 (124,500)
Beginning Fund Balance 165,000 - - - - - - - -
Projected Fund Balance 165,000 137,500 165,000 165,000 165,000 107,500 7,000 40,500 40,500
Project Description Estimated Credits 6
A dry pond at Green Park was originally approved in 1991. Designed under the 1985 Stormwater Management standards, it provides water quantity controls only and does notprovide any water quality treatment. A preliminary concept for this site was prepared during the Muddy Branch Watershed Study (2014) with others that also showed promise aslow-cost, low-impact opportunities. The current scope of this project will be to conduct a detailed review of options based on the current best management practices and inaccordance with the uses of the park. The potential credit achievement has been estimated at 5-8 credits. Concept design will be conducted in FY24 with final design in FY25(contingent upon favorable findings of the concept design) and construction in FY25-26.
Operating Budget ImpactsThe existing facility will continue to be inspected and maintained per current schedule. Additional impacts will be assessed upon completion of concept design.
Project SW00023 - Green Park Retrofit
Project Location City-owned dry pond between the southern end of Curry Ford Lane and Sam Eig Highway
Project Manager Beth Forbes
570

AppendixStormwater Project Detail
FY22 Budget
Prior YearsActuals
FY21Adopted
FY21Projection FY22 FY23 FY24 FY25 FY26 Total
Revenues and Sources of Funds
499200 - Transfer In - - - - - 50,000 - - 50,000
Total Revenues and Sources of Funds - - - - - 50,000 - - 50,000Expenditures and Uses of Funds
532000 - Engineering & Architecture - - - - - - 70,000 - 70,000
532100 - Concept Design and Outreach - - - - - 30,000 - - 30,000
532300 - Construction Oversight - - - - - - - 50,000 50,000
591100 - Construction - - - - - - - 500,000 500,000
Total Expenditures and Uses of Funds - - - - - 30,000 70,000 550,000 650,000
Net Change in Fund Balance - - - - - 20,000 (70,000) (550,000) (600,000)
Beginning Fund Balance 600,000 - - - - - - - -
Projected Fund Balance 600,000 600,000 600,000 600,000 600,000 620,000 550,000 - -
Project Description Estimated Credits 12
This facility was estimated to be implemented between 1980-1990. Currently, it provides little water quantity and no water quality treatment. The scope of the project will be toretrofit the existing facility to maximize credit achievement for the approximately 29.7 impervious drainage acres flowing to the facility. The potential credit achievement has beenestimated at 10-15 credits.
It is anticipated that the concept design will be conducted in FY24. Final design will occur in FY25 which is contingent upon favorable findings of the concept design. Constructionis slated for FY26.
Operating Budget ImpactsThe existing facility will continue to be inspected and maintained per current schedule. Additional impacts will be assessed upon completion of concept design.
Project SW00024 - Bridalwood Retrofit
Project Location City-owned dry pond, between Bradenton Court and Great Seneca Highway
Project Manager Patrick Fitzgerald
571

AppendixStormwater Project Detail
FY22 Budget
Prior YearsActuals
FY21Adopted
FY21Projection FY22 FY23 FY24 FY25 FY26 Total
Revenues and Sources of Funds
499200 - Transfer In - - - - - - 300,000 - 300,000
Total Revenues and Sources of Funds - - - - - - 300,000 - 300,000Expenditures and Uses of Funds
532000 - Engineering & Architecture - - - - - - 70,000 - 70,000
532100 - Concept Design and Outreach - - - - - 30,000 - - 30,000
532300 - Construction Oversight - - - - - - - 50,000 50,000
591100 - Construction - - - - - - - 500,000 500,000
Total Expenditures and Uses of Funds - - - - - 30,000 70,000 550,000 650,000
Net Change in Fund Balance - - - - - (30,000) 230,000 (550,000) (350,000)
Beginning Fund Balance 350,000 - - - - - - - -
Projected Fund Balance 350,000 350,000 350,000 350,000 350,000 320,000 550,000 - -
Project Description Estimated Credits 4
This facility was estimated to be constructed in the 2002-2003 period. Currently, it provides little water quantity and no water quality treatment. The scope of the project will be toretrofit the existing facility to maximize credit achievement for the approximately 5 impervious acres flowing to the facility. The potential credit achievement has been estimated at3-5 credits.
It is anticipated that the concept design will be completed in FY24, with the final design completed in FY25. This is contingent upon favorable findings of the concept design.Construction is slated for FY26.
Operating Budget ImpactsThe existing facility will continue to be inspected and maintained per current schedule. Additional impacts will be assessed upon completion of concept design.
Project SW00025 - Turtle Pond Retrofit
Project Location City-owned dry pond, near the intersection of Still Creek Lane and Turtle Pond Lane
Project Manager Pearce Wroe
572

AppendixStormwater Project Detail
FY22 Budget
Prior YearsActuals
FY21Adopted
FY21Projection FY22 FY23 FY24 FY25 FY26 Total
Revenues and Sources of Funds
499200 - Transfer In - - - - - 550,000 - - 550,000
Total Revenues and Sources of Funds - - - - - 550,000 - - 550,000Expenditures and Uses of Funds
532000 - Engineering & Architecture - - - - - - - 85,000 85,000
532100 - Concept Design and Outreach - - - - - - 35,000 - 35,000
Total Expenditures and Uses of Funds - - - - - - 35,000 85,000 120,000
Net Change in Fund Balance - - - - - 550,000 (35,000) (85,000) (120,000)
Beginning Fund Balance 120,000 - - - - - - - -
Projected Fund Balance 120,000 120,000 120,000 120,000 120,000 670,000 635,000 550,000 550,000
Project Description Estimated Credits 3
This appears to be an existing HOA-owned sediment control basin with documentation supporting the original intent to convert it into a stormwater management facility. Thisproject site was estimated to be implemented in the 1970s. Currently, it provides no water quantity and no water quality treatment. The scope of the project will be to retrofit theexisting project site to maximize credit achievement for the approximately 3 impervious acres flowing to the facility.
This project was budgeted within FY18 and subsequently moved to FY21 to allow for the development and approval of a City policy in performing work on HOA facilities. Thispolicy has been further delayed and so it is anticipated that the concept design will be conducted in FY25. Final design will occur in FY26, contingent upon favorable findings ofthe concept design. Construction is slated for FY27.
Operating Budget ImpactsTo be determined. The City may assume structural maintenance responsibility depending on HOA facility policy.
Project SW00026 - Hyde Park Retrofit
Project Location Between Carlsbad Drive and Christopher Avenue
Project Manager Pearce Wroe
573

AppendixStormwater Project Detail
FY22 Budget
Prior YearsActuals
FY21Adopted
FY21Projection FY22 FY23 FY24 FY25 FY26 Total
Revenues and Sources of Funds
499200 - Transfer In - - - - - - - 550,000 550,000
Total Revenues and Sources of Funds - - - - - - - 550,000 550,000Expenditures and Uses of Funds
532000 - Engineering & Architecture - - - - - - - 85,000 85,000
532100 - Concept Design and Outreach - 35,000 - - - - 35,000 - 35,000
Total Expenditures and Uses of Funds - 35,000 - - - - 35,000 85,000 120,000
Net Change in Fund Balance - (35,000) - - - - (35,000) 465,000 (120,000)
Beginning Fund Balance 120,000 - - - - - - - -
Projected Fund Balance 120,000 85,000 120,000 120,000 120,000 120,000 85,000 550,000 550,000
Project Description Estimated Credits 3
This appears to be an existing Common Ownership Community-owned sediment basin with documentation supporting the original intent to convert it into a stormwatermanagement facility. This project site is estimated to have been implemented between 1981-1987. Currently, it provides no water quantity and no water quality treatment. Thescope of the project will be to install a stormwater management facility to utilize the existing project site to maximize credit achievement for the approximately 3 impervious acresflowing to the facility. This project was originally budgeted within FY18 and subsequently moved to FY25 to allow for the development and approval of a City policy in performingwork on COC facilities. It is anticipated that the concept design will be conducted in FY25. Final design will occur in FY26, contingent upon favorable findings of the conceptdesign. Construction is slated for FY27.
Operating Budget ImpactsTo be determined; The City may assume structural maintenance responsibility depending on COC facility policy.
Project SW00027 - Carriage Hills Retrofit
Project Location Near the end of Wild Forest Drive
Project Manager Patrick Fitzgerald
574

AppendixStormwater Project Detail
FY22 Budget
Prior YearsActuals
FY21Adopted
FY21Projection FY22 FY23 FY24 FY25 FY26 Total
Revenues and Sources of Funds
499200 - Transfer In - - - - - - 300,000 - 300,000
Total Revenues and Sources of Funds - - - - - - 300,000 - 300,000Expenditures and Uses of Funds
532000 - Engineering & Architecture - - - - - - 30,000 15,000 45,000
532100 - Concept Design and Outreach - - - - - 15,000 10,000 - 25,000
Total Expenditures and Uses of Funds - - - - - 15,000 40,000 15,000 70,000
Net Change in Fund Balance - - - - - (15,000) 260,000 (15,000) (70,000)
Beginning Fund Balance 70,000 - - - - - - - -
Projected Fund Balance 70,000 70,000 70,000 70,000 70,000 55,000 315,000 300,000 300,000
Project Description Estimated Credits 7
This is an existing Common Ownership Community-owned (COC) dry pond estimated to have been implemented in the 1980s. Currently, it provides little water quantity and nowater quality treatment. The scope of the project will be to install a stormwater management facility to utilize the existing facility to maximize credit achievement for theapproximately 8.6 impervious acres flowing to the facility. The potential credit achievement has been estimated at 6-8 credits.
This project was originally budgeted within FY18 and subsequently moved to FY24 to allow for development and approval of City policy in performing work on COC facilities. It isanticipated that the concept design will begin in FY24 and completed in FY25. Final design will begin in FY26, which is contingent upon favorable findings of the concept design.Final design is anticipated to be completed in FY26 with construction occurring in FY27.
Operating Budget ImpactsTo be determined; The City may assume structural maintenance responsibility depending on COC facility policy.
Project SW00028 - Woodland Hills Retrofit
Project Location Near the intersection of Travis Avenue and Watkins Mill Road
Project Manager Patrick Fitzgerald
575

AppendixStormwater Project Detail
FY22 Budget
Prior YearsActuals
FY21Adopted
FY21Projection FY22 FY23 FY24 FY25 FY26 Total
Revenues and Sources of Funds
499200 - Transfer In 148,500 - - - - - - - 148,500
Total Revenues and Sources of Funds 148,500 - - - - - - - 148,500Expenditures and Uses of Funds
591100 - Construction - 60,000 - 125,000 - - - - 125,000
Total Expenditures and Uses of Funds - 60,000 - 125,000 - - - - 125,000
Net Change in Fund Balance 148,500 (60,000) - (125,000) - - - - 23,500
Beginning Fund Balance - - - - - - - - -
Projected Fund Balance 148,500 88,500 148,500 23,500 23,500 23,500 23,500 23,500 23,500
Project Description Estimated Credits 0
This project will address the drainage issue at 122 & 124 Woodland Road. The existing headwall and downstream storm drain pipe are inadequate to convey larger storm events, creating ponding and flash flooding for these two properties. Design was conducted in-house in late FY21. Construction for this project will begin in FY22 and be completed in FY22.
Operating Budget ImpactsNone. Once corrective action taken, normal maintenance will be routine.
Project SW00029 - DI001 - 122 & 124 WoodlandRoad
Project Location 122-124 Woodlawn Road
Project Manager Pearce Wroe
576

AppendixStormwater Project Detail
FY22 Budget
Prior YearsActuals
FY21Adopted
FY21Projection FY22 FY23 FY24 FY25 FY26 Total
Revenues and Sources of Funds
499200 - Transfer In 501,000 - - 750,000 - - - - 1,251,000
Total Revenues and Sources of Funds 501,000 - - 750,000 - - - - 1,251,000Expenditures and Uses of Funds
532000 - Engineering & Architecture - 101,000 - - 101,000 - - - 101,000
590000 - Land - 400,000 - - 400,000 - - - 400,000
591100 - Construction - - - - - 400,000 350,000 - 750,000
Total Expenditures and Uses of Funds - 501,000 - - 501,000 400,000 350,000 - 1,251,000
Net Change in Fund Balance 501,000 (501,000) - 750,000 (501,000) (400,000) (350,000) - -
Beginning Fund Balance - - - - - - - - -
Projected Fund Balance 501,000 - 501,000 1,251,000 750,000 350,000 - - -
Project Description Estimated Credits 1
This project is located in the Lower Great Seneca Watershed and defines the scope of remediation of severe erosion to the Long Draught Branch stream in the vicinity of 100Water Street. The scope of the project includes geotechnical testing, surveyor services, engineering services, and contemplates acquiring adjacent property(ies) to increase theprotection footprint. The scope of remediation will include reconnecting, grading, stabilizing, realigning, and repairing the existing stream channel.Design for this project will begin in FY23. It is anticipated that property acquisition will be required as part of the project. Construction is scheduled to begin in FY24.
Project SW00030 - DI002 - 100 Water Street -Stream Erosion
Project Location 100 Water Street
Project Manager Patrick Fitzgerald
577

AppendixStormwater Project Detail
FY22 Budget
Project SW00032 - DI005 - 14 Chestnut Street -Storm Drain Repair / Drain Imp.
Project Location 14 Chestnut Street
Project Manager Pearce Wroe
Prior YearsActuals
FY21Adopted
FY21Projection FY22 FY23 FY24 FY25 FY26 Total
Revenues and Sources of Funds
499200 - Transfer In 100,000 10,000 10,000 - - - - - 110,000
Total Revenues and Sources of Funds 100,000 10,000 10,000 - - - - - 110,000Expenditures and Uses of Funds
591100 - Construction - 10,000 50,000 - - - - - 50,000
Total Expenditures and Uses of Funds - 10,000 50,000 - - - - - 50,000
Net Change in Fund Balance 100,000 - (40,000) - - - - - 60,000
- - - - - - - - -Beginning Fund Balance
Projected Fund Balance 100,000 100,000 60,000 60,000 60,000 60,000 60,000 60,000 60,000
Project Description Estimated Credits 0
This project repairs / replaces failing infrastructure of a 15” metal pipe (it is rusted out and collapsing) with 15” reinforced concrete pipe as well as at-grade improvements such as pavement and curb/gutter. No records exist for the storm drain design, so a limited topographical survey will be required to ensure replacement mitigates the extents of improvements. Driveway access to adjacent business will be maintained as much as possible via construction phasing and traffic controls. Construction was anticipated in FY21.
Operating Budget ImpactsNo change in operating budget is expected. Improvements will require routine maintenance as is already required for existing conditions.
578

AppendixStormwater Project Detail
FY22 Budget
Prior YearsActuals
FY21Adopted
FY21Projection FY22 FY23 FY24 FY25 FY26 Total
Revenues and Sources of Funds
499200 - Transfer In - 90,000 90,000 - - - - - 90,000
Total Revenues and Sources of Funds - 90,000 90,000 - - - - - 90,000Expenditures and Uses of Funds
532000 - Engineering & Architecture - 90,000 - 40,000 50,000 - - - 90,000
Total Expenditures and Uses of Funds - 90,000 - 40,000 50,000 - - - 90,000
Net Change in Fund Balance - - 90,000 (40,000) (50,000) - - - -
Beginning Fund Balance
Projected Fund Balance - - 90,000 50,000 - - - - -
Project Description Estimated Credits 0
This project involves the study of stormwater infrastructure in Olde Towne, East Deer Park, and other nearby subdivisions. High-intensity, short-duration rainfall events haveresulted in damaging stormwater runoff in the Olde Towne (163 acres) and East Deer Park (143 acres) drainage catchments. Between 2017 and 2019, staff responded to sevendrainage complaints from the East Deer Park community and five complaints from the Olde Towne subdivision. Drainage issues such as forming sinkholes, separated stormdrain lines, and overwhelmed storm drain inlets are the most commonly reported issues. Community outreach will be included in the project scope. This project would be startedin FY22 and completed in FY23.
Operating Budget ImpactsNone
Project SW00033 - Headwaters Drainage Study
Project Location Olde Towne, East Deer Park, and other nearby subdivisions
Project Manager Michael Weyand
579

AppendixStormwater Project Detail
FY22 Budget
Prior YearsActuals
FY21Adopted
FY21Projection FY22 FY23 FY24 FY25 FY26 Total
Revenues and Sources of Funds
499200 - Transfer In - 53,200 53,200 67,685 200,595 - - - 321,480
Total Revenues and Sources of Funds - 53,200 53,200 67,685 200,595 - - - 321,480Expenditures and Uses of Funds
532000 - Engineering & Architecture - 25,000 31,250 22,635 - - - - 53,885
532300 - Construction Oversight - 1,700 - 17,000 50,595 - - - 67,595
591100 - Construction - 25,000 - 50,000 150,000 - - - 200,000
597500 - Construction Management - 1,500 - - - - - - -
Total Expenditures and Uses of Funds - 53,200 31,250 89,635 200,595 - - - 321,480
Net Change in Fund Balance - - 21,950 (21,950) - - - - -
Beginning Fund Balance
Projected Fund Balance - - 21,950 - - - - - -
Project Description Estimated Credits 0
This project would provide design and construction funding for the replacement of Lake Kersten’s filter diaphragm, originally constructed in 2003. Lake Kersten is the smallest ofthe Kentlands-area lakes. It is connected to Lake Nirvana (constructed in 1967) through a culvert. The state’s dam inspector has reported visible seepage at the downstream toeof Lake Kersten’s embankment. Design is expected in FY22 with construction in FY22-23.
Project SW00034 - Lake Kersten Repairs
Project Location Main Street
Project Manager Patrick Fitzgerald
580

AppendixStormwater Project Detail
FY22 Budget
Prior YearsActuals
FY21Adopted
FY21Projection FY22 FY23 FY24 FY25 FY26 Total
Revenues and Sources of Funds
499200 - Transfer In - 20,000 20,000 - 50,000 65,000 - - 135,000
Total Revenues and Sources of Funds - 20,000 20,000 - 50,000 65,000 - - 135,000Expenditures and Uses of Funds
532000 - Engineering & Architecture - 20,000 - - 35,000 - - - 35,000
532300 - Construction Oversight - - - - - 3,700 6,300 - 10,000
591100 - Construction - - - - - 33,000 55,000 - 88,000
Total Expenditures and Uses of Funds - 20,000 - - 35,000 36,700 61,300 - 133,000
Net Change in Fund Balance - - 20,000 - 15,000 28,300 (61,300) - 2,000
Beginning Fund Balance
Projected Fund Balance - - 20,000 20,000 35,000 63,300 2,000 2,000 2,000
Project Description Estimated Credits 0
This project would provide design and construction funding for a filter diaphragm at Lake Lynette’s embankment. This lake was constructed in 1993 as a part of the Kentlandsdevelopment. Seepage is visible on the downstream toe of Lake Lynette’s embankment. Design is expected in FY23 with construction in FY24-25.
Project SW00035 - Lake Lynnette Repairs
Project Location Firehouse Lane
Project Manager Beth Forbes
581

AppendixStormwater Project Detail
FY22 Budget
Prior YearsActuals
FY21Adopted
FY21Projection FY22 FY23 FY24 FY25 FY26 Total
Revenues and Sources of Funds
499200 - Transfer In - 35,000 35,000 164,000 136,000 - - - 335,000
Total Revenues and Sources of Funds - 35,000 35,000 164,000 136,000 - - - 335,000Expenditures and Uses of Funds
532000 - Engineering & Architecture - 35,000 5,500 25,000 35,000 - - - 65,500
532300 - Construction Oversight - - - - 8,000 9,000 - - 17,000
591100 - Construction - - - - 120,000 120,000 - - 240,000
Total Expenditures and Uses of Funds - 35,000 5,500 25,000 163,000 129,000 - - 322,500
Net Change in Fund Balance - - 29,500 139,000 (27,000) (129,000) - - 12,500
Beginning Fund Balance
Projected Fund Balance - - 29,500 168,500 141,500 12,500 12,500 12,500 12,500
Project Description Estimated Credits 0
This project would provide design and construction funding for repairs of Lake Placid’s structural elements and stabilize an outfall. Lake Placid, the largest of the Kentlands-arealakes, was constructed in the mid-1960s as a part of a National Geographic facility. The lake’s riser structure was repaired in 2009. Repair of its spillway was deferred until adecision on a proposed aquatic center was made. Three items are included in this project: lining the principal spillway, installing a filter diaphragm to control seepage through theembankment, and stabilizing the outfall of the emergency spillway. Design is expected in FY22-23 with construction in FY23-24.
Project SW00036 - Lake Placid Repairs
Project Location Edison Park Drive
Project Manager Pearce Wroe
582

AppendixStormwater New Project Detail
FY22 Budget
Prior YearsActuals
FY21Adopted
FY21Projection FY22 FY23 FY24 FY25 FY26 Total
Revenues and Sources of Funds
499200 - Transfer In - - - 390,000 - - - - 390,000
Total Revenues and Sources of Funds - - - 390,000 - - - - 390,000Expenditures and Uses of Funds
591100 - Construction - - - 390,000 - - - - 390,000
Total Expenditures and Uses of Funds - - - 390,000 - - - - 390,000
Net Change in Fund Balance - - - - - - - -
Beginning Fund Balance
Projected Fund Balance - - - - - - - - -
Project Description Estimated Credits 0
This project involves the armoring up High Hazard and Significant Hazard Dams as requested by the State of Maryland in their annual inspections. Approximately 1,910 linearfeet located at Lynette (Upstream - 210LF and Downstream - 275LF), Helene (Downstream - 225LF), Kirsten (Upstream - 310 LF), Summit Hall (Upstream - 330LF) and Varuna(Upstream - 560LF). This project will be completed in FY22.
Project
Project Location
SW00037 - Armoring of High Hazard and Significant Hazard Dams
Kentlands/Lakelands Neighborhoods
Project Manager Sean Stevens
583

AppendixStormwater New Project Detail
FY22 Budget
Prior YearsActuals
FY21Adopted
FY21Projection FY22 FY23 FY24 FY25 FY26 Total
Revenues and Sources of Funds
499200 - Transfer In - - - 30,000 - - - - 30,000
Total Revenues and Sources of Funds - - - 30,000 - - - - 30,000Expenditures and Uses of Funds
591100 - Construction - - - 30,000 - - - - 30,000
Total Expenditures and Uses of Funds - - - 30,000 - - - - 30,000
Net Change in Fund Balance - - - - - - - -
Beginning Fund Balance
Projected Fund Balance - - - - - - - - -
Project Description Estimated Credits 0
This project will be an in-house design project to mitigate drainage issues in East Darby Court. New storm drains to be constructed in the parking/sidewalk area in front oftownhomes. This project will be completed in FY22.
Operating Budget Impacts
None
Project
Project Location
SW00038 - East Darby Court Drainage Repair
East Darby Court
Project Manager Pearce Wroe
584

AppendixStormwater New Project Detail
FY22 Budget
Prior YearsActuals
FY21Adopted
FY21Projection FY22 FY23 FY24 FY25 FY26 Total
Revenues and Sources of Funds
499200 - Transfer In - - - 500,000 - - - - 500,000
Total Revenues and Sources of Funds - - - 500,000 - - - - 500,000Expenditures and Uses of Funds
589000 - Transfer to Other Funds - - - 250,000 - - - - 250,000
Total Expenditures and Uses of Funds - - - 250,000 - - - - 250,000
Net Change in Fund Balance - - 250,000 - - - - 250,000
Beginning Fund Balance
Projected Fund Balance - - - 250,000 250,000 250,000 250,000 250,000 250,000
Project Description Estimated Credits 0
This project supports funding for small capital projects in the Stormwater Fund identified during the fiscal year that were unanticipated during the budget process and providescontingency funding for other Stormwater CIP projects in the case of cost overages or changes in scope. Typically, project costs are charged to the related project and funding istransferred from this CIP to assist the under funded project.
ProjectSW00039 - Stormwater Contingency
Project Location
Project Manager Beth Forbes
585

AppendixStormwater New Project Detail
FY22 Budget
Prior YearsActuals
FY21Adopted
FY21Projection FY22 FY23 FY24 FY25 FY26 Total
Revenues and Sources of Funds
499200 - Transfer In - - - - - 55,000 55,000 - 110,000
Total Revenues and Sources of Funds - - - - - 55,000 55,000 - 110,000Expenditures and Uses of Funds
532300 - Construction Oversight - - - - - 4,000 3,750 - 7,750
591100 - Construction - - - - - 51,000 51,250 - 102,250
Total Expenditures and Uses of Funds - - - - - 55,000 55,000 - 110,000
Net Change in Fund Balance - - - - - - - -
Beginning Fund Balance
Projected Fund Balance - - - - - - - - -
Project Description Estimated Credits 1
This project is an in-house design project to mitigate drainage issues in the vicinity of Walder Park. The project involves regrading portions of the park and installing storm drainsand a bioretention facility will ameliorate drainage issues at 109 West Deer Park Road. The project will begin in FY24 with completion in FY25.
Operating Budget Impacts
This project will impact the Stormwater Operating Budget related to facility inspections and maintenance.
Project
Project Location
SW00040 - Walder Park Drainage Repair
Walder Park, 302 Cedar Avenue
Project Manager Pearce Wroe
586

AppendixStormwater New Project Detail
FY22 Budget
Prior YearsActuals
FY21Adopted
FY21Projection FY22 FY23 FY24 FY25 FY26 Total
Revenues and Sources of Funds
499200 - Transfer In - - - - - - 200,000 200,000 400,000
Total Revenues and Sources of Funds - - - - - - 200,000 200,000 400,000Expenditures and Uses of Funds
536000 - Miscellaneous Professional Servic - - - - - - 200,000 200,000 400,000
Total Expenditures and Uses of Funds - - - - - - 200,000 200,000 400,000
Net Change in Fund Balance - - - - - - - -
Beginning Fund Balance
Projected Fund Balance - - - - - - - - -
Project Description Estimated Credits 0
This project would update the watershed studies for each of the three City watersheds: Muddy Branch, Lower Great Seneca Creek, and Middle Great Seneca Creek. This projectwill begin in FY25 and will be completed in FY26.
Project
Project Location
SW00041 - Watershed Studies
Citywide
Project Manager Beth Forbes
587

Winter Lights Leashes N' Lights
588

This Page Intentionally Left Blank

City of Gaithersburg, MD
Department of Finance and Administration 31 South Summit Avenue Gaithersburg, Maryland 20877
301.258.6320 – gaithersburgmd.gov