city of everett, 2019
TRANSCRIPT
2019C O M P R E H E N S I V E A N N U A L
F I N A N C I A L R E P O R T
City of Everett , Washington
For the year ended December 31, 2019

CITY OF EVERETT, WASHINGTON
COMPREHENSIVE ANNUAL FINANCIAL REPORT
FOR THE YEAR ENDED
DECEMBER 31, 2019
FINANCE DIRECTOR-TREASURER SUSY HAUGEN

PREPARED BY DEPARTMENT OF FINANCE FINANCE DIRECTOR-TREASURER Susy J. Haugen, MSF BUDGET MANAGER Rae Ann Weighter, CPA ACCOUNTING MANAGER Young M. Lee, CPA ASSISTANT ACCOUNTING MANAGER MARY LAMB, CPA SENIOR FINANCIAL ANALYST WAI POON SENIOR FINANCIAL ANALYST Tatiana Sarmiento, CPA FINANCIAL ACCOUNTANT Edward Eugenio ACCOUNTING TECHNICIAN Jeffrey Coomber Jim Souder For comments or questions, contact: City of Everett, Accounting Division 425.257.8604
CITY OF EVERETT INTRODUCTORY SECTION
2019 COMPREHENSIVE ANNUAL FINANCIAL REPORT PAGE i
TABLE OF CONTENTS INTRODUCTORY SECTION PAGE
Table of Contents ...................................................................................................................................................... i Letter of Transmittal ................................................................................................................................................. 1 Principal Officials ...................................................................................................................................................... 6 Organization Chart ................................................................................................................................................... 7 Certificate of Achievement for Excellence in Financial Reporting ............................................................................ 8 FINANCIAL SECTION
Independent Auditor's Report ................................................................................................................................... 9
Management’s Discussion and Analysis ................................................................................................................ 12
Basic Financial Statements
Government Wide Financial Statements: Statement of Net Position ..................................................................................................................... 25 Statement of Activities .......................................................................................................................... 26
Fund Financial Statements: Balance Sheet - Governmental Funds .................................................................................................. 28 Reconciliation of the Balance Sheet – Governmental Funds to the Statement of Net Position ............................................................................................................. 29 Statement of Revenues, Expenditures, and Changes in Fund Balances – Governmental Funds ........ 30 Reconciliation of the Statement of Revenues, Expenditures, and Changes in Fund Balances of Governmental Funds to the Statement of Activities ...................................................................... 31 Statement of Net Position – Proprietary Funds ..................................................................................... 32 Statement of Revenues, Expenses, and Changes in Fund Net Position – Proprietary Funds .............. 33 Statement of Cash Flows – Proprietary Funds ...................................................................................... 34 Statement of Fiduciary Net Position – Fiduciary Funds ........................................................................ 36 Statement of Changes in Fiduciary Net Position – Fiduciary Funds ..................................................... 37
Notes to the Financial Statements ................................................................................................................. 38
Required Supplementary Information Schedule of Revenues, Expenditures and Changes in Fund Balances – Budget and Actual General Fund ......................................................................................................................................... 91 Note A – Explanation of Difference between Budgetary Revenues and Expenditures and GAAP Revenues and Expenditures ...................................................................................................... 92 Schedule of Revenues, Expenditures and Changes in Fund Balances – Budget and Actual Emergency Medical Services Fund ....................................................................................................... 93 Pension Funds ............................................................................................................................................... 94 Other Post Employment Benefit Funds ....................................................................................................... 102
Combining and Individual Fund Statements and Schedules Governmental Funds: Combining Balance Sheet – Nonmajor Governmental Funds ............................................................. 105 Combining Statement of Revenues, Expenditures, and Changes in Fund Balances – Nonmajor Governmental Funds ..................................................................................................... 106 Combining Balance Sheet – Nonmajor Special Revenue Funds ........................................................ 107 Combining Statement of Revenues, Expenditures, and Changes in Fund Balances – Nonmajor Special Revenue Funds ................................................................................................ 111 Combining Balance Sheet – Nonmajor Debt Service Funds ............................................................... 115

CITY OF EVERETT INTRODUCTORY SECTION
PAGE ii 2019 COMPREHENSIVE ANNUAL FINANCIAL REPORT
FINANCIAL SECTION (continued) PAGE
Combining Statement of Revenues, Expenditures, and Changes in Fund Balances – Nonmajor Debt Service Funds ....................................................................................................... 116 Combining Balance Sheet – Nonmajor Capital Project Funds ............................................................ 117 Combining Statement of Revenues, Expenditures, and Changes in Fund Balances – Nonmajor Capital Project Funds .................................................................................................... 119
Schedule of Revenues, Expenditures, and Changes in Fund Balances - Budget and Actual Parks & Recreation Fund ............................................................................................................... 121 Library Fund ................................................................................................................................... 122 Municipal Arts Fund ....................................................................................................................... 123 Conference Center Fund................................................................................................................ 124 General Government Special Projects Fund .................................................................................. 125 Street Improvement Fund .............................................................................................................. 126 Streets Fund .................................................................................................................................. 127 Motor Vehicle Equipment Replacement Fund ................................................................................ 128 Hotel/Motel Tax Fund ..................................................................................................................... 129 Cumulative Reserve Real Property Acquisition Fund .................................................................... 130 Property Management Fund .......................................................................................................... 131 Cumulative Reserve Parks Fund ................................................................................................... 132 Senior Center Reserve Fund ......................................................................................................... 133 Animals Fund ................................................................................................................................. 134 Cumulative Reserve Library Fund .................................................................................................. 135 General Government Special Projects Fund .................................................................................. 136 Criminal Justice Fund..................................................................................................................... 137 Traffic Mitigation Fund.................................................................................................................... 138 Transportation Benefit District Fund ............................................................................................... 139 Contingency Reserve Fund ............................................................................................................ 140 Everett CDE LLC Fund .................................................................................................................. 141 CHIP Loan Program Fund .............................................................................................................. 142 Community Development Block Grants Fund ................................................................................ 143 Bond Redemption Fund ................................................................................................................. 144 L.I.D. Guaranty Fund ..................................................................................................................... 145 Consolidated L.I.D. Bond Redemption Fund .................................................................................. 146 Proprietary Funds:
Combining Statement of Net Position – Nonmajor Enterprise Funds .................................................. 147 Combining Statement of Revenues, Expenses, and Changes in Fund Net Position – Nonmajor Enterprise Funds ........................................................................................................... 148 Combining Statement of Cash Flows – Nonmajor Enterprise Funds .................................................. 149 Combining Statement of Net Position – Internal Service Funds.......................................................... 151 Combining Statement of Revenues, Expenses, and Changes in Fund Net Position – Internal Service Funds ................................................................................................................... 153 Combining Statement of Cash Flows – Internal Service Funds .......................................................... 155 Fiduciary Funds: Combining Statement of Fiduciary Net Position – Trust Funds ........................................................... 157 Combining Statement of Changes in Fiduciary Net Position –Trust Funds ......................................... 158

CITY OF EVERETT INTRODUCTORY SECTION
2019 COMPREHENSIVE ANNUAL FINANCIAL REPORT PAGE iii
STATISTICAL SECTION PAGE Statistical Section Overview ................................................................................................................................. 159
Financial Trends:
Net Position by Component – Last Ten Fiscal Years .......................................................................... 160 Changes in Net Position – Last Ten Fiscal Years ............................................................................... 161 Fund Balances of Governmental Funds – Last Ten Fiscal Years ....................................................... 164 Changes in Fund Balances of Governmental Funds – Last Ten Fiscal Years .................................... 165 General Governmental Tax Revenues by Source - Last Ten Fiscal Years ......................................... 166
Revenue Capacity:
Water Produced and Consumed & Wastewater Treated – Last Ten Fiscal Years .............................. 167 Annual Tap Sales - Last Ten Fiscal Years .......................................................................................... 168 Number of Water and Sewer Customers by Type - Last Ten Fiscal Years ......................................... 169 Water and Sewer Rates – Last Ten Fiscal Years ............................................................................... 170 Largest Water/Sewer Customers – Current Year and Nine Years Ago ............................................... 171 Taxable Assessed Value and Estimated Actual Value of Property – Last Ten Fiscal Years ............... 172 Property Tax Levies and Collections - Last Ten Fiscal Years ............................................................. 173 Direct and Overlapping Property Tax Rates – Last Ten Fiscal Years ................................................. 174 Principal Property Taxpayers – Current Year and Nine Years Ago ..................................................... 175
Debt Capacity:
Ratios of Outstanding Debt by Type – Last Ten Fiscal Years ............................................................. 176 Ratios of General Bonded Debt Outstanding – Last Ten Fiscal Years ............................................... 177 Direct and Overlapping Governmental Activities Debt ........................................................................ 178 Legal Debt Margin Information – Last Ten Fiscal Years ..................................................................... 179 Pledged-Revenue Coverage – Last Ten Fiscal Years ........................................................................ 180
Demographic and Economic Information:
Demographic and Economic Statistics – Last Ten Fiscal Years ......................................................... 181 Principal Employers – Current Year and Nine Years Ago ................................................................... 183
Operating Information:
Full-Time Equivalent City Government Employees by Function – Last Ten Fiscal Years ................... 184 Operating Indicators by Function/Program – Last Ten Fiscal Years ................................................... 185 Capital Asset Statistics by Function/Program – Last Ten Fiscal Years ............................................... 188

CITY OF EVERETT INTRODUCTORY SECTION
PAGE iv 2019 COMPREHENSIVE ANNUAL FINANCIAL REPORT
This page is intentionally left blank.

Finance & Budget 2930 Wetmore Ave Suite 9H
Everett, WA 98201 425.257.8700
425.257.8611 fax [email protected]
everettwa.gov
July 30, 2020 Ms. Cassie Franklin, Mayor and Everett City Council City of Everett Everett, Washington
Dear Mayor Franklin and City Council Members:
The City of Everett Comprehensive Annual Financial Report (CAFR) for the fiscal year ended December 31, 2019, is hereby submitted. The CAFR consists of management’s representations concerning the finances of the City of Everett (City). Consequently, management assumes full responsibility for the completeness and reliability of the information presented in this report. To provide a reasonable basis for making these representations, City management has established a comprehensive internal control framework that is designed both to protect the government’s assets from loss, theft, or misuse and to compile sufficient reliable information for the preparation of the City’s financial statements in conformity with Generally Accepted Accounting Principles (GAAP). Because the cost of internal controls should not outweigh their benefits, the City’s comprehensive framework of internal controls is designed to provide reasonable, rather than absolute, assurance that the financial statements will be free from material misstatement. The City’s financial statements have been audited by the Washington State Auditor’s Office. The independent auditor issued an unmodified (“clean”) opinion that the City of Everett’s financial statements, for the fiscal year ended December 31, 2019, are fairly presented in conformity with GAAP. The auditor’s report is presented as the first component of the financial section of this report. The independent audit of the City’s financial statements is part of a broader, federally mandated “Single Audit” designed to meet the special needs of federal grantor agencies. The standards governing Single Audit engagements require the independent auditor to report not only on the fair presentation of the financial statements, but also the audited government’s internal controls and compliance with legal requirements, with special emphasis on internal controls and legal requirements involving the administration of federal awards. The City’s Single Audit Report is issued separately and is available upon request. Another state mandate requires the Washington State Auditor’s Office to perform additional tests of compliance with state laws and regulations as required by the Revised Code of Washington (RCW) 43.09.260. This statute requires the State Auditor to inquire as to whether the City complied with the laws and the Constitution of the State of Washington, the City’s own ordinances, and the requirements of the State Auditor's Office. The City’s State compliance report is also available upon request. GAAP require that management provide a narrative introduction, overview, and analysis to accompany the basic financial statements in the form of the Management’s Discussion and Analysis (MD&A). This

CITY OF EVERETT INTRODUCTORY SECTION
PAGE 2 2019 COMPREHENSIVE ANNUAL FINANCIAL REPORT
letter of transmittal is designed to complement the MD&A and should be read in conjunction with it. The City’s MD&A can be found immediately following the independent auditor’s report. THE CITY OF EVERETT AND ITS SERVICES
The City of Everett was incorporated on May 4, 1893. Located at the mouth of the Snohomish River, Everett is 28 miles north of Seattle and 85 miles south of the Canadian border. The City, built along the shores of Port Gardner Bay, encompasses roughly 42 square miles of land and is bordered by 10 miles of freshwater and 11 miles of saltwater shoreline. The City currently serves a population of 111,800. Everett operates under a Mayor-Council form of government. Under its charter, it has all powers granted to like cities by the Constitution and laws of the State of Washington. The City is a general-purpose governmental entity and provides the full range of municipal services allowed by statute or charter. These services include police, fire, emergency medical, street maintenance, planning and zoning, libraries, parks and recreation, and general administrative services. In addition to its general government services, the City operates five enterprises: water and sewer utility, solid waste (recycling) utility, two golf courses, a transit system, and a parking garage. The City also includes, as part of its reporting entity, the City of Everett CDE LLC, whose purpose is to help alleviate poverty and incentivize investments into low-income community census tracts, and the Everett Public Facilities District (EPFD), a municipal corporation of the State of Washington, which operates and maintains the Angel of the Winds Arena. Additional information on these separate legal entities can be found in Note 1A in the Notes to the Financial Statements. The annual budget serves as the foundation for the City’s financial planning and control. The City Council is required to adopt a final budget prior to the start of the ensuing fiscal year and prior to the expenditure of any City funds. Budgetary controls are maintained to ensure compliance with legal provisions embodied in the annual appropriated budget. With the exception of construction funds, which receive project-life budget authority through plans and systems ordinances, activities of all City funds are included in the annual budget process. A budget increase or decrease to a fund must be authorized by the City Council via ordinance, while appropriations within a fund may be moved internally with the Mayor’s approval. LOCAL ECONOMY
At the close of 2019 and into early 2020, we expected the Puget Sound Region’s economy would continue on a modestly upward trend, similar to what the City experienced over the last couple of years. The arrival of a pandemic that would shut down the nation’s economy was nowhere on our radar. The onset of the COVID-19 pandemic and resulting social distancing have since plunged the U.S. economy into a recession, which marked the end of the longest economic recovery on record. Due to the high degree of uncertainty regarding the extent to which the COVID-19 pandemic will persist, it is difficult to predict the extent and duration of its impact on our local economy. Economists expect inflation to be just 0.9% in 2020, down from 1.5% in the previous forecast. The lower inflation forecast is primarily due to impacts of COVID-19. Food prices have been higher as a result of supply disruptions and a shift away from restaurants and towards more meals at home. Conversely, gas prices have dropped with the decrease in consumption.

CITY OF EVERETT INTRODUCTORY SECTION
2019 COMPREHENSIVE ANNUAL FINANCIAL REPORT PAGE 3
The Boeing Company, along with ancillary companies that provide goods and services to Boeing, continue to play an important role in the local economy. Consequently, Boeing’s production cycle has a significant impact on both City revenues and the state of the local business community. In response to the pandemic, Boeing shut down its production plant in Everett for more than 3 weeks. The severe impact of the pandemic on the airline industry is also making itself felt in Everett’s aerospace industry sector with plane order cancelations and delayed deliveries. The following chart illustrates Boeing’s historical airplane deliveries over the past ten years. Due to the grounding of the 737 Max, which is built in Renton, Washington, Boeing delivered less than half as many planes in 2019 than it did in 2018.
461 474
601637
725762 748 763
806
308
0
100
200
300
400
500
600
700
800
900
2010 2011 2012 2013 2014 2015 2016 2017 2018 2019
Boeing Deliveries: 2010 - 2019
In addition to the 747, 767 tanker, 777, and 787 plane models, Boeing will build the next generation 777x at the Everett plant. Construction on new facilities to house this activity is complete. This important decision will help secure Boeing’s continued presence and the future of the aerospace industry in the region for years to come. LONG-TERM FINANCIAL PLANNING
The City uses a five-year forecasting model to plan for future budgetary impacts. On the expense side of the City’s budget, maintaining a competitive compensation and benefits package in order to attract and retain a high-quality workforce stands out as a challenge. On the revenue side, areas of concern include property tax growth restrictions and legislated tax shifts. The City also maintains long-term capital planning models for both the general government and its enterprise funds. General government capital programs include Capital Improvement Program (CIP) 1, which focuses on major repairs and replacements for existing general government structures; CIP 2, which is dedicated to paying debt service on the construction of the Everett Events Center; CIP 3, which funds park and street improvements, and CIP 4, which accumulates funding for facility expansions or new acquisitions. The City’s enterprise activities, which include the Water and Sewer Utility, Everett Transit, and Golf, also use long-term capital models to ensure that resources are available to maintain critical systems and expand capacity as required.
CITY OF EVERETT INTRODUCTORY SECTION
PAGE 4 2019 COMPREHENSIVE ANNUAL FINANCIAL REPORT
The City continued annual contributions to the LEOFF 1 police and fire pension and OPEB (other post-employment benefits) funds in the 2019 budget. The target year to achieve full funding of these obligations is 2030 – nearly three decades before obligations are complete. RELEVANT FINANCIAL POLICIES
City policy requires the regular monitoring and reporting of revenues and expenditures to Administration and City Council. This regular monitoring allows the City to take proactive measures in the event that the economy underperforms. The City continues to adhere to its General Government Fund Balance Policy, adopted in 2004, which limits annual operating expenses to annual operating revenues, and targets the General Government Fund balance at 20 percent of the annual revenue forecast. Part of this policy states that revenues in excess of operating expenditures may be transferred to a capital reserve, long-term obligation, or debt service fund. MAJOR INITIATIVES
Major initiatives focus on the City’s seven budget priorities: Responsible and Responsive Government, Safe Community, Economic & Cultural Vitality, Transportation & Infrastructure, Education and Workforce Development, Engaged & Informed Community, and Housing and Affordability: Responsible and Responsive Government
• Update the City’s recruiting processes to attract and retain a workforce that better reflects our city’s diverse community
• Complete the voter-approved redistricting project for the 2021 City Council elections • Update the City’s Climate Action Plan
Safe Community • Complete testing and evaluation of a body-worn camera program for the police department • Continue investment in the gang response unit • Continue investment in the Community Outreach and Enforcement Team, which pairs social
workers with police officers to address street-level social issues in the community
Economic & Cultural Vitality • Establish a certified creative district and mural program in downtown Everett • Invest in park improvements, including the Phil Johnson Ballfields and Forest Park playground
renovations • Continue efforts on the Metro Everett initiative and Visit Everett tourism and marketing
campaigns
Transportation & Infrastructure • Add two additional electric buses to Everett Transit’s fleet, financed by a combination of federal
grants and the Volkswagen settlement • Complete the Grand Avenue Park Bridge, which combines infrastructure for new stormwater
and sewer pipelines with easy pedestrian access from Grand Avenue Park to the waterfront
Education & Workforce Development • Continue to support the Everett Career Link internship program, which connects local
businesses with high school students • Continue to advocate for Everett’s WSU and Everett Community College higher education
programs at the state legislature

CITY OF EVERETT INTRODUCTORY SECTION
2019 COMPREHENSIVE ANNUAL FINANCIAL REPORT PAGE 5
Engaged & Informed Community • Continue outreach efforts, including online access to city records and data • Increase outreach efforts to engage the community in the budget development process
Housing & Affordability • Continue to offer the federally funded Community Housing Improvement Program to fund
housing repairs for low-income residents • Participate in Snohomish County’s Housing Affordability Regional Taskforce (HART) to ensure
that affordable housing options exist in all cities and unincorporated areas of Snohomish County
AWARDS AND ACKNOWLEDGEMENTS
The Government Finance Officers Association of the United States and Canada (GFOA) awarded a Certificate of Achievement for Excellence in Financial Reporting to the City of Everett for its comprehensive annual financial report for the year ended December 31, 2018. This was the 22nd consecutive year that the City has achieved this prestigious award. In order to be awarded a certificate of achievement, the City must publish an easily readable and efficiently organized comprehensive annual financial report. This report must satisfy both generally accepted accounting principles and applicable legal requirements. A certificate of achievement is valid for a period of one year only. We believe that our current comprehensive annual financial report continues to meet the Certificate of Achievement Program’s requirements and we are submitting it to the GFOA to determine its eligibility for another certificate. The preparation of this Comprehensive Annual Financial Report was made possible by the dedicated service of the entire staff of the Finance Department. The efforts of the Accounting Division are especially instrumental in the compilation of the information required for preparing this report. All members of the department are to be commended for their consistent dedication to excellence in local government finance. It is to their credit that the citizens of the City of Everett can rely on this report as the definitive discussion of all City financial operations. Sincerely,
Susy Haugen Finance Director-Treasurer

CITY OF EVERETT INTRODUCTORY SECTION
PAGE 6 2019 COMPREHENSIVE ANNUAL FINANCIAL REPORT
CITY OF EVERETT
PRINCIPAL OFFICIALS
Elected Officials Term Expires Mayor ........................................................................... 12/31/21 ......................................................... Cassie J Franklin City Councilmembers: Position No. 1 .............................................................. 12/31/21 ................................................................ Paul Roberts Position No. 2 .............................................................. 12/31/21 ................................................... Jeff Moore, President Position No. 3 .............................................................. 12/31/21 ................................................................ Scott Murphy Position No. 4 .............................................................. 12/31/21 ..................................................................... Liz Vogeli Position No. 5 .............................................................. 12/31/19 .................................................................. Scott Bader Position No. 6 .............................................................. 12/31/19 ..................................................... Brenda Stonecipher Position No. 7 .............................................................. 12/31/19 .................................................................. Judy Tuohy Appointed Officials
Chief of Staff .................................................................................................................................................... Lyle Ryan Deputy Mayor ............................................................................................................................................... Nick Harper Executive Director, Parks, Communications & Cultural Arts ................................................................... Lori Cummings Executive Director, Government Affairs .................................................................................................... Bob Bolerjack Executive Director, Transportation & Infrastructure................................................................................... Paul Kaftanski City Attorney.................................................................................................................................................... David Hall Chief of Police ....................................................................................................................................... Dan Templeman Fire Chief ................................................................................................................................................ David DeMarco Public Works Director ......................................................................................................................................Ryan Sass Planning Director ........................................................................................................................................... Allan Giffen Finance Director-Treasurer ........................................................................................................................ Susy Haugen Communications Director ........................................................................................................................ Kimberley Cline Economic Development Director .............................................................................................................. Dan Eernissee Human Resources Director ....................................................................................................................... Kandy Bartlett Community Development Director ........................................................................................................ Julie Frauenholtz Information Technology Director ............................................................................................................... Steven Hellyer Library Director.......................................................................................................................................... Abigail Cooley Transportation Services Director ................................................................................................................. Tom Hingson City Clerk ................................................................................................................................................... Sharon Fuller

CITY OF EVERETT INTRODUCTORY SECTION
2019 COMPREHENSIVE ANNUAL FINANCIAL REPORT PAGE 7
CITY OF EVERETT
ORGANIZATION CHART
RESIDENTS
City CouncilMayor
Judicial
Legal
Chief of Staff
Exec DirectorParks,
Communications&
Cultural Arts
Deputy Mayor
Communications&
Marketing
Parks
Finance Fire/EMS
Public WorksUtilities
&Engineering
Human Resources
Community, Planning, & Economic
Development
Library
Exec Director Government
AffairsAnimal ServicesSenior Center
Police
Information Technology
Community DevelopmentPlanningEconomic
Development
Long Range PlanningLand UsePermit Services
Exec DirectorTransportation
&Infrast ructure
Facilities Transit
Fleet Maintenance Cultural
Arts
Tourism
CITY OF EVERETT INTRODUCTORY SECTION
PAGE 8 2019 COMPREHENSIVE ANNUAL FINANCIAL REPORT
CITY OF EVERETT PRINCIPAL OFFICIALS
CITY OF EVERETT FINANCIAL SECTION
2019 COMPREHENSIVE ANNUAL FINANCIAL REPORT PAGE 9

CITY OF EVERETT FINANCIAL SECTION
PAGE 10 2019 COMPREHENSIVE ANNUAL FINANCIAL REPORT

CITY OF EVERETT FINANCIAL SECTION
2019 COMPREHENSIVE ANNUAL FINANCIAL REPORT PAGE 11

CITY OF EVERETT FINANCIAL SECTION
PAGE 12 2019 COMPREHENSIVE ANNUAL FINANCIAL REPORT
MANAGEMENT’S DISCUSSION AND ANALYSIS
This section of the City of Everett’s annual financial report provides a narrative overview of the City’s financial activities for the fiscal year ended December 31, 2019. The intent of this discussion and analysis is to review the City’s financial performance as a whole. Please read it in conjunction with the Letter of Transmittal, the Financial Statements, and the Notes to the Financial Statements. 2019 FINANCIAL HIGHLIGHTS
• At December 31, 2019, the City’s net position, the amount by which total assets and deferred outflows exceed total liabilities and deferred inflows, totaled $1 billion. Of this amount, $828 million, or 80%, is invested in capital assets that support the activities of the City. Of the remaining net position, $118.5 million is unrestricted and may be used to meet the City’s ongoing obligations.
• The net position of governmental activities is $462 million, an increase of $27 million, or 6% from 2018. The increase is due in large part to significant investment in capital assets and an increase in revenues from property taxes, investment earnings, and grants.
• The net position of business-type activities is $570.2 million, which represents an increase of $40 million, or 7.5% over 2018. Growth is due primarily to significant investment in capital assets supported by grants and capital contributions.
OVERVIEW OF THE FINANCIAL STATEMENTS The minimum requirements of the City’s annual financial report include the Management’s Discussion and Analysis (MD&A), the basic financial statements, and required supplementary information. This discussion and analysis provides an overview of the City’s basic financial statements, which consist of three components: 1) government-wide financial statements, 2) fund financial statements, and 3) notes to the financial statements. In addition to the required components, the City’s annual report includes other voluntary supplementary information. The additional supplementary information includes a section with combining statements that provides details about the City’s non-major funds and internal service funds -- all of which are added together and presented in single columns in the basic financial statements. BASIC FINANCIAL STATEMENTS GOVERNMENT-WIDE FINANCIAL STATEMENTS Government-wide financial statements provide readers with a broad overview of the City’s finances in a manner similar to a private-sector business. They provide both short-term and long-term information about the City’s financial status as a whole. The government-wide statements distinguish between functions of the City that are principally supported by taxes (referred to as "governmental activities") from functions that are intended to recover all or a significant portion of their costs through user fees and charges (referred to as "business-type activities"). The City also includes the Everett Public Facilities District (EPFD) as a discretely presented component unit in its report. A component unit is a governmental unit over which the City can exercise influence and/or may be obligated to provide a financial subsidy. The EPFD is presented in a separate column in the government-wide statements. This presentation allows users of the government-wide financial statements to focus on the primary government as well as address the City’s relative relationship with the EPFD. The Statement of Net Position presents information on all of the City’s assets, deferred outflow of resources, liabilities, and deferred inflow of resources, with the difference between assets and outflows minus liabilities and inflows reported as net position. This statement combines and consolidates governmental funds’ current financial resources (short-term spendable resources) with capital assets and long-term obligations. The Statement of Net position serves a purpose similar to that of the Balance Sheet of a private-sector business. Over time, increases or decreases in net position may serve as one indicator of whether the financial position of the City is improving or deteriorating. The Statement of Activities presents information on the net cost of each governmental and business-type activity as well as information on how the government's net position changed during the fiscal year. This statement also

CITY OF EVERETT FINANCIAL SECTION
2019 COMPREHENSIVE ANNUAL FINANCIAL REPORT PAGE 13
separates program revenue (revenue generated by specific activities through charges for services, grants, and contributions) from general revenue (revenue provided by taxes and other sources not tied to a particular activity). By separating program revenue from general revenue, users of the financial statements can identify the extent to which each activity relies on taxes for funding. All changes in net position are reported using the accrual basis of accounting, which is similar to the accounting used by private-sector businesses. The accrual basis of accounting requires that revenues are reported when earned and expenses are reported when incurred, regardless of the timing of when cash is received or paid. For instance, uncollected taxes and unpaid vendor invoices for items received in the current fiscal year are included in the statement of activities as revenue and expense, even though the cash associated with these items will not be received or distributed until future fiscal periods. FUND FINANCIAL STATEMENTS While the government–wide statements look at the City as a whole and focus on types of activities (general government versus business-type activities), the fund financial statements provide a more detailed look at the City’s individual major funds and combined fund types. A fund is a grouping of related accounts that is used to maintain control over resources that have been segregated for specific activities or objectives. The City uses funds to ensure and demonstrate fiscal accountability and compliance with finance-related legal requirements. The City’s funds fall into three types: governmental funds, proprietary funds, and fiduciary funds. Governmental funds account for most of the City’s tax-supported activities and are used to account for essentially the same functions reported as governmental activities in the government-wide financial statements. However, unlike the government-wide financial statements, the focus of governmental fund financial statements is on near-term inflows and outflows of spendable resources and on balances of spendable resources available at the end of the fiscal year. Such information is useful in evaluating whether there are more, or less, financial resources that can be spent in the near future to finance City services. Approximately 16.5% of total governmental fund balance is considered nonspendable and not available to finance City services in the near future. Nonspendable balances consist mainly of loans receivable from the component unit, Everett Public Facilities District. The Governmental Funds Balance Sheet and the Governmental Funds Statement of Revenues, Expenditures, and Changes in Fund Balances present separate columns of financial data for the General Fund, Bond Redemption Fund, and Emergency Medical Services Fund. These are the City’s major governmental funds. Data from the remaining governmental funds are combined and presented in a single, aggregated column in the fund statements. Individual fund data for each of the non-major governmental funds is provided as combining statements following the basic financial statements. Because the focus of governmental fund financial statements is narrower than that of the government-wide financial statements, it is useful to compare information presented for governmental funds with similar information presented for governmental activities in the government-wide financial statements. This gives the reader a better understanding of the long-term impact of the government's near-term financing decisions. Both the Governmental Funds Balance Sheet and the Governmental Funds Statement of Revenues, Expenditures, and Changes in Fund Balances provide a reconciliation to the governmental activities column in the government-wide statements to facilitate this comparison. The City maintains budgetary controls over its governmental funds. Budgetary controls ensure compliance with legal provisions embodied in the annual appropriated budget. Governmental fund budgets are established in accordance with state law and are adopted on a fund level. General Fund and Emergency Medical Services Fund budget variances are presented as required supplementary information following the notes to the financial statements and reviewed later in this discussion and analysis. Proprietary funds are used to account for the City’s business-type activities where all, or part, of the costs of activities are supported by fees and charges that are paid directly by those who benefit from the activities. The fund level statements provide the same type of information as the government-wide financial statements, only in more detail, since both apply the accrual basis of accounting. In comparing the total assets and total liabilities between the two statements, you will notice only slight differences. One notable difference is that the "due from other funds" (asset) and the "due to other funds" (liability) are combined in a single line called “Internal balances” in the assets section of the government-wide Statement of Net Position. The City reports two types of proprietary funds: enterprise and internal service funds. Enterprise funds are used to report the same functions presented as business-type activities in the government-wide financial statements. Internal service funds are used to report activities that provide supplies and services to various City departments and to

CITY OF EVERETT FINANCIAL SECTION
PAGE 14 2019 COMPREHENSIVE ANNUAL FINANCIAL REPORT
accumulate and allocate the associated costs of providing these supplies and services to the various functions. The revenues and expenses of internal service funds that are duplicated in other funds are eliminated in the government-wide statements. The net difference between revenues and expenses is allocated to other funds and becomes the only reconciling item between government-wide financial statements and Proprietary Funds Statement of Net Position and Statement of Revenues, Expenses, and Changes in Fund Net Position. Because the internal service funds primarily benefit governmental, rather than business-type activities, the internal service funds are aggregated and included within governmental activities in the government-wide Statement of Net Position. The Proprietary Funds Statement of Net Position and the Proprietary Funds Statement of Revenues, Expenses, and Changes in Fund Net Position present separate columns of financial data for the Water and Sewer Utility Fund and the Transit Fund. These are the City’s major enterprise funds. Data from the remaining enterprise funds are combined and presented in a single, aggregated column in the fund statements. Individual fund data for each of the non-major enterprise funds, as well as the internal service funds, are provided in combining statements following the basic financial statements. Fiduciary Funds are used to account for resources held by the City in a trustee capacity, or as an agent for outside individuals or private organizations. Fiduciary funds are not reported in the government-wide financial statements because the resources of those funds are not available to support the City’s own operations. The City’s fiduciary activities are reported in a separate Statement of Fiduciary Net Position and a Statement of Changes in Fiduciary Net Position as part of the basic financial statements. NOTES TO THE FINANCIAL STATEMENTS The notes provide additional information that is essential to a full understanding of the data provided, and are an integral part of the government-wide and fund financial statements. OTHER INFORMATION In addition to the basic financial statements and accompanying notes, this report contains certain required supplementary information concerning the City’s Fire and Police Pension Funds and Other Post Employment Benefit Funds. Information is also provided for the City’s participation in state retirement plans. The combining statements referred to earlier for non-major governmental and enterprise funds, as well as internal services funds, are presented immediately following the required supplementary information. GOVERNMENT-WIDE FINANCIAL ANALYSIS As noted earlier, changes in net position over time may serve as a useful indicator of a government's financial position. The City's total net position at December 31, 2018, was $965 million. At December 31, 2019, the total net position was $1 billion. As the following chart illustrates, the City’s net position was relatively unchanged from 2010 through 2013, grew moderately through 2017, remained stable in 2018 and showed increased growth in 2019.
400
600
800
1000
1200
2010 2011 2012 2013 2014 2015 2016 2017 2018 2019
City's Total Net Position(in millions)
CITY OF EVERETT FINANCIAL SECTION
2019 COMPREHENSIVE ANNUAL FINANCIAL REPORT PAGE 15
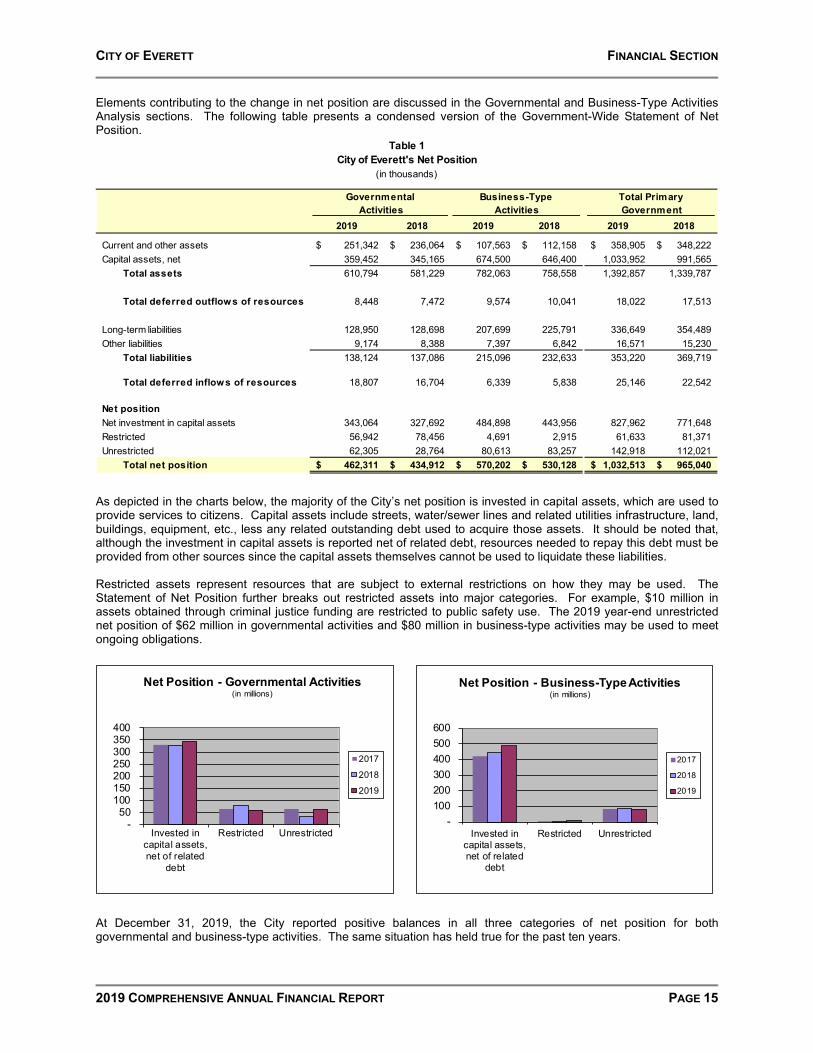
Elements contributing to the change in net position are discussed in the Governmental and Business-Type Activities Analysis sections. The following table presents a condensed version of the Government-Wide Statement of Net Position.
2019 2018 2019 2018 2019 2018
Current and other assets 251,342$ 236,064$ 107,563$ 112,158$ 358,905$ 348,222$ Capital assets, net 359,452 345,165 674,500 646,400 1,033,952 991,565
Total assets 610,794 581,229 782,063 758,558 1,392,857 1,339,787
Total deferred outflows of resources 8,448 7,472 9,574 10,041 18,022 17,513
Long-term liabilities 128,950 128,698 207,699 225,791 336,649 354,489 Other liabilities 9,174 8,388 7,397 6,842 16,571 15,230
Total liabilities 138,124 137,086 215,096 232,633 353,220 369,719
Total deferred inflows of resources 18,807 16,704 6,339 5,838 25,146 22,542
Net positionNet investment in capital assets 343,064 327,692 484,898 443,956 827,962 771,648 Restricted 56,942 78,456 4,691 2,915 61,633 81,371 Unrestricted 62,305 28,764 80,613 83,257 142,918 112,021
Total net position 462,311$ 434,912$ 570,202$ 530,128$ 1,032,513$ 965,040$
Table 1City of Everett's Net Position
Governmental Activities
Business-Type Activities
Total Primary Government
(in thousands)
As depicted in the charts below, the majority of the City’s net position is invested in capital assets, which are used to provide services to citizens. Capital assets include streets, water/sewer lines and related utilities infrastructure, land, buildings, equipment, etc., less any related outstanding debt used to acquire those assets. It should be noted that, although the investment in capital assets is reported net of related debt, resources needed to repay this debt must be provided from other sources since the capital assets themselves cannot be used to liquidate these liabilities. Restricted assets represent resources that are subject to external restrictions on how they may be used. The Statement of Net Position further breaks out restricted assets into major categories. For example, $10 million in assets obtained through criminal justice funding are restricted to public safety use. The 2019 year-end unrestricted net position of $62 million in governmental activities and $80 million in business-type activities may be used to meet ongoing obligations.
- 50
100 150 200 250 300 350 400
Invested incapital assets,net of related
debt
Restricted Unrestricted
Net Position - Governmental Activities(in millions)
2017
2018
2019
- 100 200 300 400 500 600
Invested incapital assets,net of related
debt
Restricted Unrestricted
Net Position - Business-Type Activities(in millions)
2017
2018
2019
At December 31, 2019, the City reported positive balances in all three categories of net position for both governmental and business-type activities. The same situation has held true for the past ten years.

CITY OF EVERETT FINANCIAL SECTION
PAGE 16 2019 COMPREHENSIVE ANNUAL FINANCIAL REPORT
The following table contains condensed financial information derived from the government-wide statement of activities comparing the current year to the prior year.
2019 2018 2019 2018 2019 2018Revenues
Program revenues:Charges for services 20,118$ 16,580$ 106,280$ 104,766$ 126,398$ 121,346$ Operating grants and contributions 9,221 4,864 2,103 2,304 11,324 7,168 Capital grants and contributions 9,363 1,396 13,597 4,958 22,960 6,354
General revenues:Property taxes 46,897 43,436 - - 46,897 43,436 Sales taxes 33,227 32,501 20,802 20,170 54,029 52,671 Business taxes 35,584 35,491 94 81 35,678 35,572 Other taxes 14,411 14,909 - - 14,411 14,909 Sale of assets 1,635 128 90 90 1,725 218 Interest and investment earnings 4,235 3,048 3,186 2,341 7,421 5,389
TOTAL REVENUES 174,691$ 152,353$ 146,152$ 134,710$ 320,843$ 287,063$
Program ExpensesGovernmental activities:
General government services 21,923$ 24,495$ -$ -$ 21,923$ 24,495$ Police 45,743 39,223 - - 45,743 39,223 Fire 34,992 31,526 - - 34,992 31,526 Engineering & construction services 5,764 5,702 - - 5,764 5,702 Transportation 11,398 11,017 - - 11,398 11,017 Community services 5,839 3,796 - - 5,839 3,796 Library 4,753 4,269 - - 4,753 4,269 Culture and recreation 13,574 13,535 - - 13,574 13,535 Judicial 2,315 2,155 - - 2,315 2,155 Social services 1,217 1,226 - - 1,217 1,226 Interest on long-term debt 863 860 - - 863 860
Business-type activities:Water - - 33,899 34,465 33,899 34,465 Sew er - - 40,361 37,068 40,361 37,068 Solid w aste - - 995 636 995 636 Parking - - 1,631 312 1,631 312 Transit - - 27,792 26,457 27,792 26,457 Golf - - 4,286 4,281 4,286 4,281
TOTAL EXPENSES 148,381$ 137,804$ 108,964$ 103,219$ 257,345$ 241,023$ Increases (decreases) in net position beforespecial items and transfers 26,310$ 14,549$ 37,188$ 31,491$ 63,498$ 46,040$
Special Item (3,970) - - - (3,970) - Transfers 5,059 5,698 (5,059) (5,698) - - Increase in net position 27,399$ 20,247$ 32,129$ 25,793$ 59,528$ 46,040$ Net position - beginning 434,912 456,375 530,128 504,335 965,040 960,710 Prior period adjustment - (41,710) 7,945 - 7,945 (41,710)
Net position - ending 462,311$ 434,912$ 570,202$ 530,128$ 1,032,513$ 965,040$
Table 2City of Everett's Changes in Net Position
Governmental Activities
Business-Type Activities
Total Primary Government
(in thousands)
CITY OF EVERETT FINANCIAL SECTION
2019 COMPREHENSIVE ANNUAL FINANCIAL REPORT PAGE 17
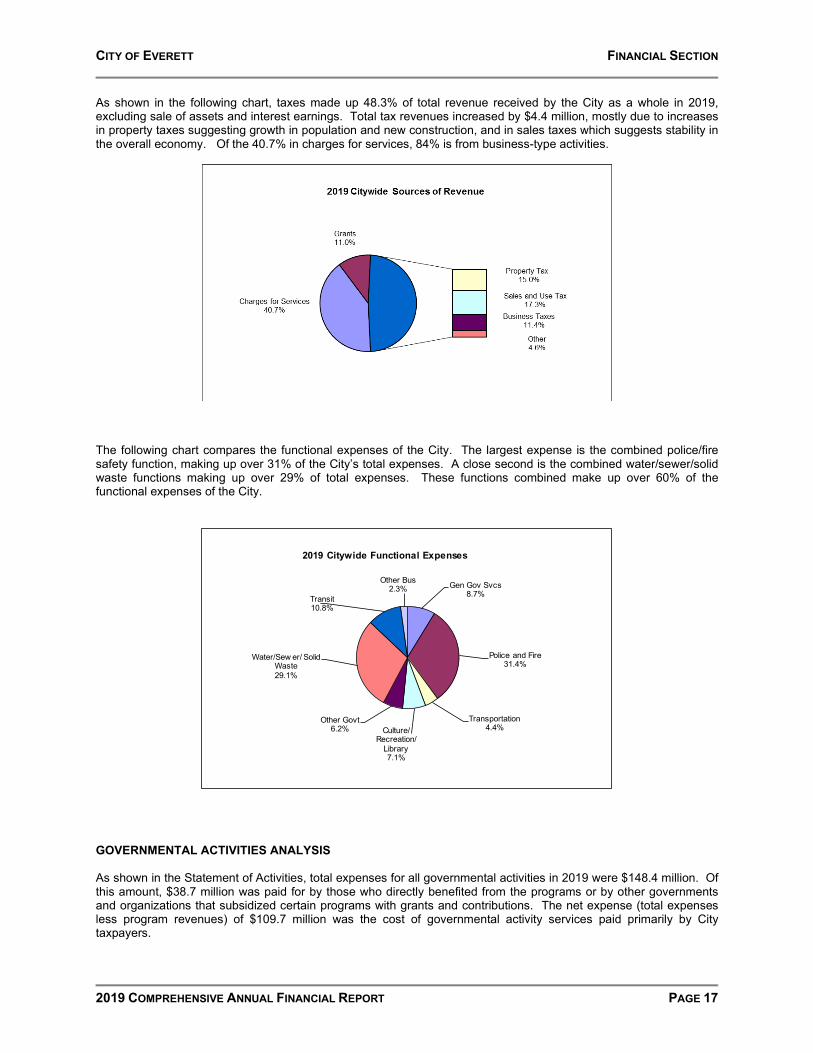
As shown in the following chart, taxes made up 48.3% of total revenue received by the City as a whole in 2019, excluding sale of assets and interest earnings. Total tax revenues increased by $4.4 million, mostly due to increases in property taxes suggesting growth in population and new construction, and in sales taxes which suggests stability in the overall economy. Of the 40.7% in charges for services, 84% is from business-type activities.
The following chart compares the functional expenses of the City. The largest expense is the combined police/fire safety function, making up over 31% of the City’s total expenses. A close second is the combined water/sewer/solid waste functions making up over 29% of total expenses. These functions combined make up over 60% of the functional expenses of the City.
Gen Gov Svcs8.7%
Police and Fire31.4%
Transportation4.4%Culture/
Recreation/Library7.1%
Other Govt6.2%
Water/Sew er/ Solid Waste29.1%
Transit10.8%
Other Bus2.3%
2019 Citywide Functional Expenses
GOVERNMENTAL ACTIVITIES ANALYSIS As shown in the Statement of Activities, total expenses for all governmental activities in 2019 were $148.4 million. Of this amount, $38.7 million was paid for by those who directly benefited from the programs or by other governments and organizations that subsidized certain programs with grants and contributions. The net expense (total expenses less program revenues) of $109.7 million was the cost of governmental activity services paid primarily by City taxpayers.

CITY OF EVERETT FINANCIAL SECTION
PAGE 18 2019 COMPREHENSIVE ANNUAL FINANCIAL REPORT
Revenues Total governmental activity revenues (excluding transfers and sale of assets) increased $20.8 million, due to an increase in several sources: property taxes increased $3.5 million over 2018 due to an increase in the EMS levy rate, the 1% annual increase in total levy, and the addition of new construction to the taxable base; interest earnings increased $1.2 million because of continuing improvement in the investment market; sales and business tax revenues increased $0.8 million. The increase in these revenue sources suggests an improving economic environment. In support of the major capital projects listed later in this discussion and analysis, grant and capital contribution revenues increased $12.3 million. Charges for services increased $3.5 million due mainly to the receipt of retroactive GEMT transport fees in the Fire activity.
Expenses Total governmental activity expenses for 2019 were $148.4 million, an increase of $10.6 million from 2018. Police and Fire activities account for 54.4% of governmental activity expenses and account for 94% of the increase. A combination of increase in community services and decrease in general government services accounts for the remaining 6%. The largest contributor to the increase in governmental activity was the change in pension assets, liabilities, and deferred inflows and outflows of the state sponsored pension plans as well as the City’s single-employer pension and OPEB plans. Expense changes in the state plan depend on the City’s allocation percentage of the state plans which is based on the amount of employer contributions. The change in expense for the Police and Fire pension and OPEB plans, which are presented as fiduciary trust funds in the basic financial statements, depends on actuarial analysis. Changes in net pension expense can vary significantly from year-to-year due to changes in assumptions in determining liability and expense. Another contributing factor is an increase in wages arising from COLA adjustments of between 2.5 % - 3% and increased net FTE in Fire and Police from filling vacant positions.
$-
$5,000
$10,000
$15,000
$20,000
$25,000
$30,000
$35,000
$40,000
$45,000
$50,000
Generalgovernment
services
Police Fire Eng & constservices
Transportation Communityservices
Library Culture andrecreation
Judicial Social services Interest onlong-term debt
Governmental Activities - Program Revenues and Expenses(in thousands)
Expenses
Revenues

CITY OF EVERETT FINANCIAL SECTION
2019 COMPREHENSIVE ANNUAL FINANCIAL REPORT PAGE 19
BUSINESS-TYPE ACTIVITIES ANALYSIS In 2019, program revenues provided $122 million to cover $109 million in business-type activity expenses, providing a net gain of $13 million. Revenues Total business-type revenues increased $11.4 million from the prior year. As shown in the following chart, the majority of business-type activity revenue is from charges for services, which grew by $1.5 million from 2018 due mainly to a rate increase implemented to address the City’s water and sewer utility capital replacement and improvement programs and inflation-based cost increases in operations and maintenance, as well as an increase in bus fare in Transit. Interest earnings increased $0.8 million due to an improving investment market. These increases were enhanced by a $8.6 million increase in grants and capital contributions arising from the acceptance of the City’s segment share of the Kimberley-Clark deep water outfall. See Note 19 for more information on this acquisition by the Sewer function. Grant and capital contribution revenue can fluctuate widely from year to year based on a number of factors, including the availability of federal and state grants, whether the City has applied for and received grant awards, and whether the City has major capital projects in progress. Sales tax growth of 3% indicates continuing consumer confidence and a strengthening business climate.
Charges for services72.6%
Total grants and
contributions10.7%
Taxes14.3%
Other earnings
0.1%
Interest and Investment earnings
2.3%
Business-Type Activities - Revenues by Sources
Expenses Total business-type expenses for 2019 were $109 million, an increase of $5.7 million from 2018. The increase is shared by the combined water/sewer function due to major maintenance and repair programs related to the rate increases implemented in 2016 – 2019, the transit function related to an increase in the allocation of GASB 68 expense arising from the state retirement plans, and a major repair project in the parking fund. The chart below depicts the revenues and expenses for each of the City’s business-type programs. As shown, Water, Sewer, Solid Waste, and Golf each generated enough program revenue (primarily user fees) to cover operating costs, while Transit and Parking did not. These activities are discussed in more detail in the Business-type Funds Analysis section.

CITY OF EVERETT FINANCIAL SECTION
PAGE 20 2019 COMPREHENSIVE ANNUAL FINANCIAL REPORT
FUND-LEVEL FINANCIAL ANALYSIS GOVERNMENTAL FUNDS As discussed previously, governmental funds are reported in the fund statements with a short-term, spendable resources focus. This information is useful in assessing whether resources available at year-end are adequate to cover upcoming financing requirements. GASB Statement No. 54 established fund balance classifications that comprise a hierarchy based on the extent to which a government is bound to observe constraints imposed upon the use of the resources reported in governmental funds. The five components of fund balance are as follows:
• Non-spendable fund balance - examples are inventory and prepaid items.
• Restricted fund balance: externally enforceable legal restrictions such as those related to traffic mitigation revenue and grant receipts.
• Committed fund balance: funds that can only be used for purposes pursuant to constraints imposed by formal action of the City Council.
• Assigned fund balance: amounts that reflect the City’s intended use of resources in the special revenue, capital projects, and debt service funds.
• Unassigned fund balance: residual net resources that are not properly classified in one of the above four categories.
At year-end, the governmental funds reported a combined ending fund balance of $171 million. This is a $7 million increase from the prior year-end. The increase is due to improvement in the local economy, which positively influenced tax revenues--property tax and sales tax in particular. Approximately 58.4% of the total ending fund balance of governmental funds is classified as either assigned or unassigned, which means the funds are available for spending at the City’s discretion. General Fund – The general fund is the City’s primary operating fund and the largest funding source for day-to-day service delivery. As a result of the requirements established by GASB Statement No. 54, several funds previously classified as special revenue funds are now combined in reporting with the general fund. Without the consolidation, the general fund balance increased by $3.4 million or 5.25%. The increase was mostly due to increased tax revenues and charges for services as well as transfers in offset by an increase in expenses in general government services and security. Bond Redemption Fund – This major governmental fund is reported as a debt service fund because it receives funding sources that are assigned to the redemption of capital debt. This fund reports a fund balance of zero as other financing sources are used for debt service payments, all within the current year. As the name indicates, this fund accumulates cash to pay for debt service which varies from year to year depending on the receipt of refunding debt proceeds and the requirements of redeeming current period principal and interest. This fund received $24.4 million in refunding debt proceeds and $3 million transfers in to refund $25.6 million in general obligation bonds as well as $1.7 million in principal and interest of outstanding debt. See Note 12 for additional information. Emergency Medical Services Fund – This is a special revenue fund, receiving over 50% of its revenue from a dedicated property tax which generated $9.2 million in 2019. Another 36% of revenue, or $6.5 million was from the GEMT payment program, which is a federal program other than grants, and 11.6% was charges for services of $2.1 million from transport and contract ambulance services. The GEMT program was initiated in 2019 and payments received of $4.7 million were retroactive for the years 2016-2018. Other Governmental Funds – Total fund balance for other governmental funds decreased by $1.9 million, primarily due to the re-categorization of major funds. The capital improvement reserve fund which is included in nonmajor funds in 2019 was presented as a major fund in 2018, and the emergency medical services fund moved from a nonmajor fund in 2018 to a major fund in 2019. Before these re-categorizations, other governmental funds balance increased $3.6 million, mostly in capital project funds other than the capital reserve fund. Capital projects funds received $4.6 million in grants revenue and $14.3 million in transfers more than in 2018 and expended $16.1 million more in capital projects. See the major projects section later in this discussion and analysis.
CITY OF EVERETT FINANCIAL SECTION
2019 COMPREHENSIVE ANNUAL FINANCIAL REPORT PAGE 21
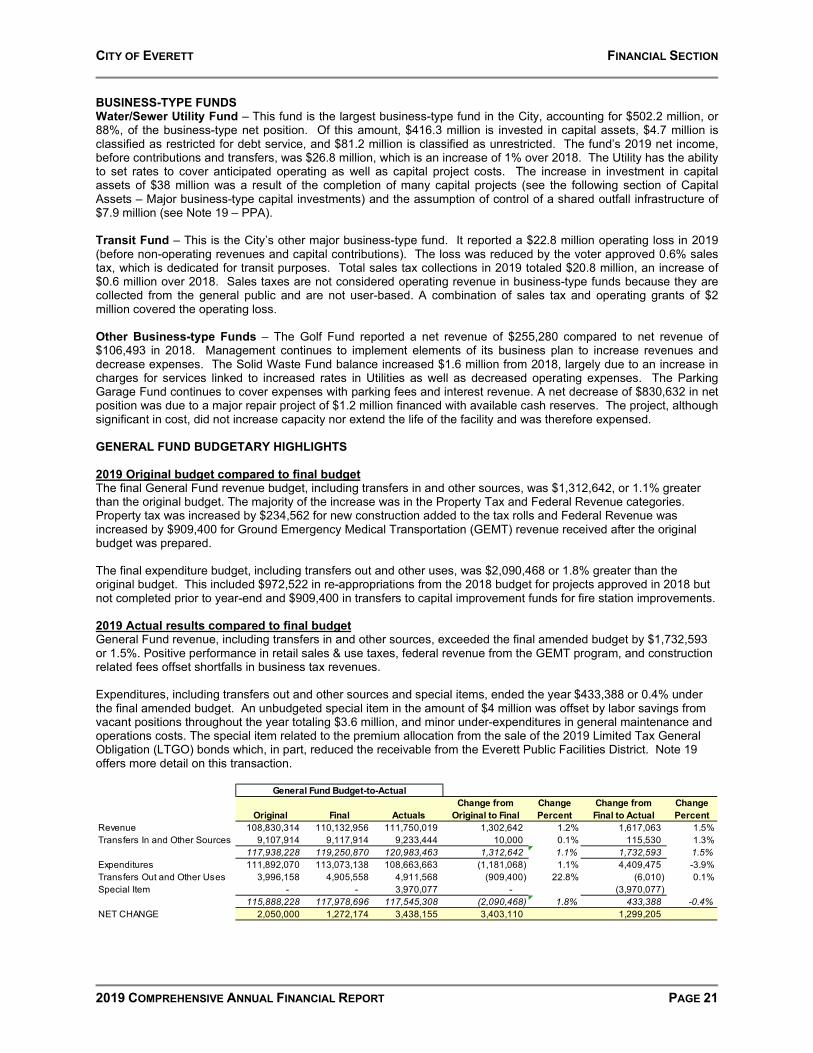
BUSINESS-TYPE FUNDS Water/Sewer Utility Fund – This fund is the largest business-type fund in the City, accounting for $502.2 million, or 88%, of the business-type net position. Of this amount, $416.3 million is invested in capital assets, $4.7 million is classified as restricted for debt service, and $81.2 million is classified as unrestricted. The fund’s 2019 net income, before contributions and transfers, was $26.8 million, which is an increase of 1% over 2018. The Utility has the ability to set rates to cover anticipated operating as well as capital project costs. The increase in investment in capital assets of $38 million was a result of the completion of many capital projects (see the following section of Capital Assets – Major business-type capital investments) and the assumption of control of a shared outfall infrastructure of $7.9 million (see Note 19 – PPA). Transit Fund – This is the City’s other major business-type fund. It reported a $22.8 million operating loss in 2019 (before non-operating revenues and capital contributions). The loss was reduced by the voter approved 0.6% sales tax, which is dedicated for transit purposes. Total sales tax collections in 2019 totaled $20.8 million, an increase of $0.6 million over 2018. Sales taxes are not considered operating revenue in business-type funds because they are collected from the general public and are not user-based. A combination of sales tax and operating grants of $2 million covered the operating loss. Other Business-type Funds – The Golf Fund reported a net revenue of $255,280 compared to net revenue of $106,493 in 2018. Management continues to implement elements of its business plan to increase revenues and decrease expenses. The Solid Waste Fund balance increased $1.6 million from 2018, largely due to an increase in charges for services linked to increased rates in Utilities as well as decreased operating expenses. The Parking Garage Fund continues to cover expenses with parking fees and interest revenue. A net decrease of $830,632 in net position was due to a major repair project of $1.2 million financed with available cash reserves. The project, although significant in cost, did not increase capacity nor extend the life of the facility and was therefore expensed. GENERAL FUND BUDGETARY HIGHLIGHTS 2019 Original budget compared to final budget The final General Fund revenue budget, including transfers in and other sources, was $1,312,642, or 1.1% greater than the original budget. The majority of the increase was in the Property Tax and Federal Revenue categories. Property tax was increased by $234,562 for new construction added to the tax rolls and Federal Revenue was increased by $909,400 for Ground Emergency Medical Transportation (GEMT) revenue received after the original budget was prepared. The final expenditure budget, including transfers out and other uses, was $2,090,468 or 1.8% greater than the original budget. This included $972,522 in re-appropriations from the 2018 budget for projects approved in 2018 but not completed prior to year-end and $909,400 in transfers to capital improvement funds for fire station improvements. 2019 Actual results compared to final budget General Fund revenue, including transfers in and other sources, exceeded the final amended budget by $1,732,593 or 1.5%. Positive performance in retail sales & use taxes, federal revenue from the GEMT program, and construction related fees offset shortfalls in business tax revenues. Expenditures, including transfers out and other sources and special items, ended the year $433,388 or 0.4% under the final amended budget. An unbudgeted special item in the amount of $4 million was offset by labor savings from vacant positions throughout the year totaling $3.6 million, and minor under-expenditures in general maintenance and operations costs. The special item related to the premium allocation from the sale of the 2019 Limited Tax General Obligation (LTGO) bonds which, in part, reduced the receivable from the Everett Public Facilities District. Note 19 offers more detail on this transaction.
Change from Change Change from ChangeOriginal Final Actuals Original to Final Percent Final to Actual Percent
Revenue 108,830,314 110,132,956 111,750,019 1,302,642 1.2% 1,617,063 1.5%Transfers In and Other Sources 9,107,914 9,117,914 9,233,444 10,000 0.1% 115,530 1.3%
117,938,228 119,250,870 120,983,463 1,312,642 1.1% 1,732,593 1.5%Expenditures 111,892,070 113,073,138 108,663,663 (1,181,068) 1.1% 4,409,475 -3.9%Transfers Out and Other Uses 3,996,158 4,905,558 4,911,568 (909,400) 22.8% (6,010) 0.1%Special Item - - 3,970,077 - (3,970,077)
115,888,228 117,978,696 117,545,308 (2,090,468) 1.8% 433,388 -0.4%NET CHANGE 2,050,000 1,272,174 3,438,155 3,403,110 1,299,205
General Fund Budget-to-Actual

CITY OF EVERETT FINANCIAL SECTION
PAGE 22 2019 COMPREHENSIVE ANNUAL FINANCIAL REPORT
CAPITAL ASSET AND DEBT ADMINISTRATION CAPITAL ASSETS As of December 31, 2019, the City of Everett’s investment in capital assets, including construction in progress, for its governmental and business-type activities amounted to $1 billion. The year-end balance represents a net increase (additions less retirements and depreciation) of $34.4 million from the end of the prior year.
2019 2018 2019 2018 2019 2018Land 59,932$ 60,410$ 45,415$ 37,983$ 105,347$ 98,393$ Buildings 62,020 58,136 152,772 157,647 214,792 215,783 Improvements other than buildings 17,172 18,018 410,559 401,588 427,731 419,606 Infrastructure 185,840 188,917 4,232 1,447 190,072 190,364 Machinery and equipment 18,517 14,792 21,021 18,902 39,538 33,694 Intangibles 174 207 8,908 9,166 9,082 9,373 Construction in progress 15,797 4,685 31,594 27,613 47,391 32,298
359,452$ 345,165$ 674,501$ 654,346$ 1,033,953$ 999,511$
Governmental Activities Total ActivitiesBusiness-Type Activities
Table 3City of Everett's Capital Assets
(net of accumulated depreciation)(in thousands)
Major governmental capital asset investments for the year included (in millions):
• Downtown Streetscape ................................................................................... $ 6.1
• Library South Everett branch expansion ............................................................ 5.8
• Vehicle replacement .......................................................................................... 5.1
• Phil Johnson ballfields renovation ...................................................................... 3.7
Major business-type capital asset investments for the year included (in millions):
• Water pollution control facility upgrades ...................................................... $ 7.4
• Sewer replacement project ................................................................................ 6.0
• Port Gardner CSO storage upgrades................................................................. 5.7
• Water main replacements .................................................................................. 4.7
• Vehicle replacements......................................................................................... 4.4
• Grand Avenue Park bridge ................................................................................ 3.9
• Northwest stormwater separation ...................................................................... 3.2
• North Broadway roadway improvements ........................................................... 1.9
• Biosolids application site .................................................................................... 1.2
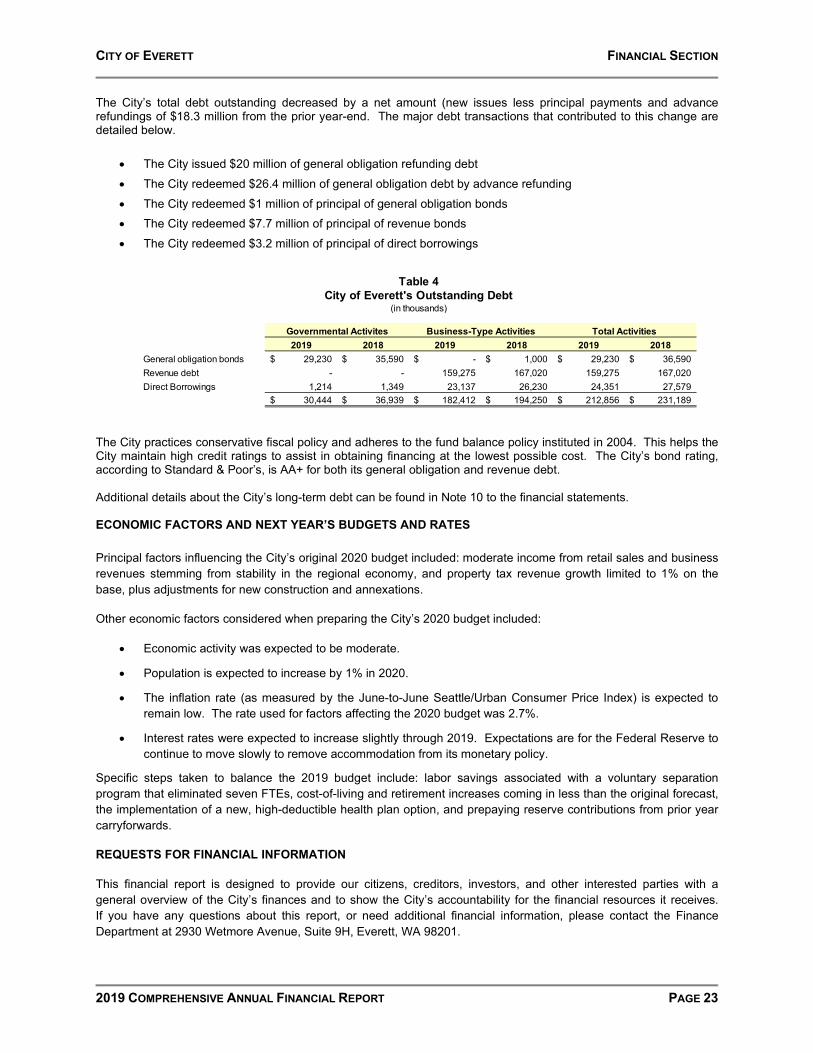
Additional information about the City of Everett’s capital assets can be found in Note 6 to the financial statements. DEBT ADMINISTRATION As shown in the table below, the City’s total outstanding debt at December 31, 2019 was $212.9 million. Of this amount, $29.2 million is bonded debt backed by the full faith and credit of the City, $159.3 million is bonded debt secured solely by water and sewer user fees, and $23.4 million is in direct borrowings consisting mainly of Public Works Trust Fund and State Revolving Fund loans. The remaining $1 million is a tax-exempt installment loan to replace city street lights with LED lighting.
CITY OF EVERETT FINANCIAL SECTION
2019 COMPREHENSIVE ANNUAL FINANCIAL REPORT PAGE 23
The City’s total debt outstanding decreased by a net amount (new issues less principal payments and advance refundings of $18.3 million from the prior year-end. The major debt transactions that contributed to this change are detailed below.
• The City issued $20 million of general obligation refunding debt • The City redeemed $26.4 million of general obligation debt by advance refunding • The City redeemed $1 million of principal of general obligation bonds • The City redeemed $7.7 million of principal of revenue bonds • The City redeemed $3.2 million of principal of direct borrowings
2019 2018 2019 2018 2019 2018General obligation bonds 29,230$ 35,590$ -$ 1,000$ 29,230$ 36,590$ Revenue debt - - 159,275 167,020 159,275 167,020 Direct Borrowings 1,214 1,349 23,137 26,230 24,351 27,579
30,444$ 36,939$ 182,412$ 194,250$ 212,856$ 231,189$
Table 4City of Everett's Outstanding Debt
Governmental Activites Business-Type Activities Total Activities
(in thousands)
The City practices conservative fiscal policy and adheres to the fund balance policy instituted in 2004. This helps the City maintain high credit ratings to assist in obtaining financing at the lowest possible cost. The City’s bond rating, according to Standard & Poor’s, is AA+ for both its general obligation and revenue debt. Additional details about the City’s long-term debt can be found in Note 10 to the financial statements. ECONOMIC FACTORS AND NEXT YEAR’S BUDGETS AND RATES Principal factors influencing the City’s original 2020 budget included: moderate income from retail sales and business revenues stemming from stability in the regional economy, and property tax revenue growth limited to 1% on the base, plus adjustments for new construction and annexations.
Other economic factors considered when preparing the City’s 2020 budget included:
• Economic activity was expected to be moderate.
• Population is expected to increase by 1% in 2020.
• The inflation rate (as measured by the June-to-June Seattle/Urban Consumer Price Index) is expected to remain low. The rate used for factors affecting the 2020 budget was 2.7%.
• Interest rates were expected to increase slightly through 2019. Expectations are for the Federal Reserve to continue to move slowly to remove accommodation from its monetary policy.
Specific steps taken to balance the 2019 budget include: labor savings associated with a voluntary separation program that eliminated seven FTEs, cost-of-living and retirement increases coming in less than the original forecast, the implementation of a new, high-deductible health plan option, and prepaying reserve contributions from prior year carryforwards.
REQUESTS FOR FINANCIAL INFORMATION This financial report is designed to provide our citizens, creditors, investors, and other interested parties with a general overview of the City’s finances and to show the City’s accountability for the financial resources it receives. If you have any questions about this report, or need additional financial information, please contact the Finance Department at 2930 Wetmore Avenue, Suite 9H, Everett, WA 98201.

CITY OF EVERETT FINANCIAL SECTION
PAGE 24 2019 COMPREHENSIVE ANNUAL FINANCIAL REPORT
This page is intentionally left blank.

CITY OF EVERETT FINANCIAL SECTION
2019 COMPREHENSIVE ANNUAL FINANCIAL REPORT PAGE 25
STATEMENT OF NET POSTION
DECEMBER 31, 2019
The accompanying notes are an integral part of this statement.
Primary Government Component Unit
EVERETT PUBLICGOVERNMENTAL BUSINESS-TYPE FACILITIES
ACTIVITIES ACTIVITIES TOTAL DISTRICT
ASSETS Cash and cash equivalents 50,533,181$ 30,539,944$ 81,073,125$ 4,496,724$ Deposits w ith trustees 57,323 346,569 403,892 - Investments 95,658,039 62,392,987 158,051,026 - Receivables, net 56,533,411 13,594,669 70,128,080 873,738 Internal balances 6,751,156 (6,751,156) - - Inventories 719,784 1,177,763 1,897,547 - Prepayments 656,718 145,083 801,801 266,066 Restricted:
Cash and cash equivalents - 3,084,587 3,084,587 1,398,776 Investments - 2,355,982 2,355,982 - Special assessments 96,699 2,520 99,219 - Net pension assets 38,634,003 3,898 38,637,901 -
Investment in joint venture 1,701,261 669,332 2,370,593 - Land 59,932,345 45,415,315 105,347,660 257,074 Construction in progress 15,797,033 31,594,457 47,391,490 - Capital assets, net (Note 6) 283,722,614 597,490,694 881,213,308 34,973,944 TOTAL ASSETS 610,793,567$ 782,062,644$ 1,392,856,211$ 42,266,322$
DEFERRED OUTFLOWS OF RESOURCES Deferred charge on refunding -$ 6,920,746$ 6,920,746$ 76,581$ Deferred outf low related to asset retirement obligatio 270,000 - 270,000 - Deferred outf low s related to pensions 7,895,435 2,653,827 10,549,262 - Deferred outf low s related OPEB 282,531 - 282,531 -
TOTAL DEFERRED OUTFLOWS OF RESOURCES 8,447,966$ 9,574,573$ 18,022,539$ 76,581$
LIABILITIES Accounts payable and other current liabilities 9,004,935$ 6,713,347$ 15,718,282$ 1,148,549$ Unearned revenues 168,761 683,536 852,297 2,397,820 Non-current liabilities (Note 12):
Due w ithin one year 15,803,307 13,879,645 29,682,952 585,000 Due in more than one year 50,976,649 184,760,229 235,736,878 40,426,895
Net Pension Liabilities 13,680,197 9,059,393 22,739,590 - Net OPEB Liabilities 48,489,965 - 48,489,965 -
TOTAL LIABILITIES 138,123,814$ 215,096,150$ 353,219,964$ 44,558,264$
DEFERRED INFLOWS OF RESOURCES Deferred inflow s related to pensions 18,594,953$ 6,339,363$ 24,934,316$ -$ Deferred inflow s related to OPEB 211,801 - 211,801 - Deferred inflow s related to service agreements - - - 56,250
TOTAL DEFERRED INFLOWS OF RESOURCES 18,806,754$ 6,339,363$ 25,146,117$ 56,250$
NET POSITIONNet Investment in capital assets 343,064,040$ 484,897,967$ 827,962,007$ (5,704,296)$ Restricted for:
Capital projects 1,828,744 - 1,828,744 - Debt service 169,067 4,690,569 4,859,636 1,398,776 Public safety 10,709,009 - 10,709,009 - Transportation 12,568,201 - 12,568,201 - Parks and recreation 1,732,717 - 1,732,717 - Community development projects 14,907,158 - 14,907,158 - Library 115,388 - 115,388 - Tourism 452,125 - 452,125 - Economy 205,088 - 205,088 - Related to pension 14,254,288 - 14,254,288 -
Unrestricted 62,305,140 80,613,168 142,918,308 2,033,909 TOTAL NET POSITION 462,310,965$ 570,201,704$ 1,032,512,669$ (2,271,611)$
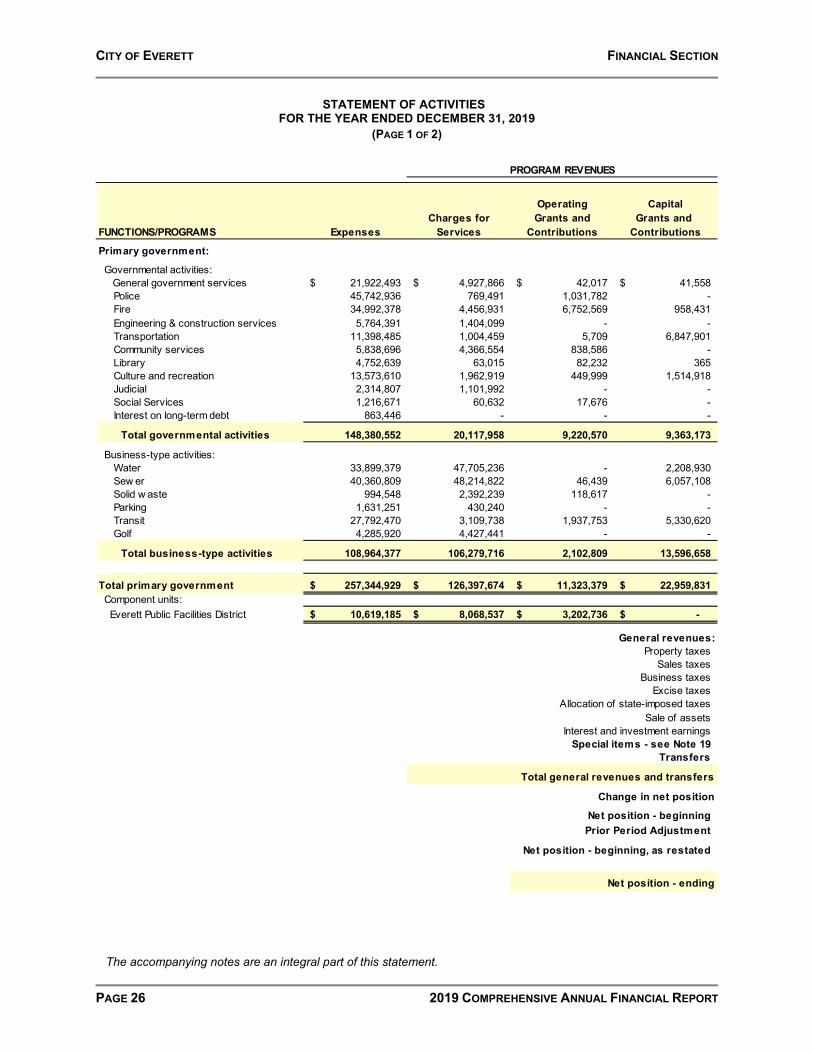
CITY OF EVERETT FINANCIAL SECTION
PAGE 26 2019 COMPREHENSIVE ANNUAL FINANCIAL REPORT
STATEMENT OF ACTIVITIES FOR THE YEAR ENDED DECEMBER 31, 2019
(PAGE 1 OF 2)
The accompanying notes are an integral part of this statement.
Operating CapitalCharges for Grants and Grants and
FUNCTIONS/PROGRAMS Expenses Services Contributions Contributions
Primary government:
Governmental activities: General government services 21,922,493$ 4,927,866$ 42,017$ 41,558$ Police 45,742,936 769,491 1,031,782 - Fire 34,992,378 4,456,931 6,752,569 958,431 Engineering & construction services 5,764,391 1,404,099 - - Transportation 11,398,485 1,004,459 5,709 6,847,901 Community services 5,838,696 4,366,554 838,586 - Library 4,752,639 63,015 82,232 365 Culture and recreation 13,573,610 1,962,919 449,999 1,514,918 Judicial 2,314,807 1,101,992 - - Social Services 1,216,671 60,632 17,676 - Interest on long-term debt 863,446 - - -
Total governmental activities 148,380,552 20,117,958 9,220,570 9,363,173
Business-type activities:Water 33,899,379 47,705,236 - 2,208,930 Sew er 40,360,809 48,214,822 46,439 6,057,108 Solid w aste 994,548 2,392,239 118,617 - Parking 1,631,251 430,240 - - Transit 27,792,470 3,109,738 1,937,753 5,330,620 Golf 4,285,920 4,427,441 - -
Total business-type activities 108,964,377 106,279,716 2,102,809 13,596,658
Total primary government 257,344,929$ 126,397,674$ 11,323,379$ 22,959,831$ Component units:
Everett Public Facilities District 10,619,185$ 8,068,537$ 3,202,736$ -$
General revenues:Property taxes
Sales taxesBusiness taxes
Excise taxesAllocation of state-imposed taxes
Sale of assets Interest and investment earnings
Special items - see Note 19Transfers
Total general revenues and transfers
Change in net position
Net position - beginningPrior Period Adjustment
Net position - beginning, as restated
Net position - ending
PROGRAM REVENUES

CITY OF EVERETT FINANCIAL SECTION
2019 COMPREHENSIVE ANNUAL FINANCIAL REPORT PAGE 27
STATEMENT OF ACTIVITIES FOR THE YEAR ENDED DECEMBER 31, 2019
(PAGE 2 OF 2)
The accompanying notes are an integral part of this statement.
Component UnitEverett Public
Governmental Business-Type FacilitiesActivities Activities Total District
(16,911,052)$ -$ (16,911,052)$ (43,941,663) - (43,941,663) (22,824,447) - (22,824,447) (4,360,292) - (4,360,292) (3,540,416) - (3,540,416)
(633,556) - (633,556) (4,607,027) - (4,607,027) (9,645,774) - (9,645,774) (1,212,815) - (1,212,815) (1,138,363) - (1,138,363)
(863,446) - (863,446)
(109,678,851) - (109,678,851)
- 16,014,787 16,014,787 - 13,957,560 13,957,560 - 1,516,308 1,516,308 - (1,201,011) (1,201,011) - (17,414,359) (17,414,359) - 141,521 141,521
- 13,014,806 13,014,806
(109,678,851)$ 13,014,806$ (96,664,045)$
652,088$
46,896,606 - 46,896,606 33,227,298 20,802,068 54,029,366 35,584,401 93,792 35,678,193 9,566,933 - 9,566,933 4,844,322 - 4,844,322 1,634,505 90,224 1,724,729 4,234,752 3,186,480 7,421,232 164,580
(3,970,077) - (3,970,077) 3,826,011 5,059,293 (5,059,293) -
137,078,033 19,113,271 156,191,304 3,990,591
27,399,182 32,128,077 59,527,259 4,642,679
434,911,783 530,127,755 965,039,538 (6,914,290) - 7,945,872 7,945,872
434,911,783 538,073,627 972,985,410
462,310,965$ 570,201,704$ 1,032,512,669$ (2,271,611)$
Primary Government
NET (EXPENSE) REVENUE AND CHANGES IN NET POSITION

CITY OF EVERETT FINANCIAL SECTION
PAGE 28 2019 COMPREHENSIVE ANNUAL FINANCIAL REPORT
BALANCE SHEET GOVERNMENTAL FUNDS
DECEMBER 31, 2019
The accompanying notes are an integral part of this statement.
GENERAL FUND
BONDREDEMPTION
FUND
EMREGENCY MEDICAL
SERVICES FUND
OTHER GOVERNMENTAL
FUNDS
TOTAL GOVERNMENTAL
FUNDS
ASSETSCash and cash equivalents 18,879,364$ -$ 2,553,598$ 19,889,495$ 41,322,457$ Change and imprest funds 50,165 - - - 50,165 Deposits w ith trustee 57,323 - - - 57,323 Investments 35,401,927 - 4,907,538 37,743,693 78,053,158 Receivables, net
Taxes 12,201,730 - - 1,801,096 14,002,826 Customer accounts 1,469,222 - 22,417 1,270,051 2,761,690 Interest 448,654 - 8,385 242,091 699,130 Interfund receivable 159,825 - - - 159,825 Due from other governmental units 174,047 - - 3,828,651 4,002,698 Due from component unit 20,391,580 - - 55,065 20,446,645
Prepayments 558,860 - - - 558,860 Special assessments - non-current - - - 96,700 96,700 Notes/contracts receivable 1,140,000 - - 13,487,350 14,627,350 Advances to other funds 6,134,168 - - - 6,134,168
TOTAL ASSETS 97,066,865$ -$ 7,491,938$ 78,414,192$ 182,972,995$
LIABILITIES Wages payable 3,003,980$ -$ 351,838$ 45,033$ 3,400,851$ Accounts payable 2,025,769 - 123,676 1,228,369 3,377,814 Interfund payable - - - 159,825 159,825 Due to other governmental units 171,337 - - 112,336 283,673 Taxes Payable 3,987 - - 6,230 10,217 Custodial accounts 312,479 - - - 312,479 Revenues collected in advance 80,575 - - 64,286 144,861 Other liabilities 693,420 - - 3,767 697,187
TOTAL LIABILITIES 6,291,547 - 475,514 1,619,846 8,386,907
DEFERRED INFLOWS OF RESOURCESUnavailable revenues-property taxes 943,914 - - - 943,914 Unavailable revenues-special assessments - - - 96,699 96,699 Unavailable revenues-other 2,419,803 - - 27,838 2,447,641
TOTAL DEFERRED INFLOWS OF RESOURCES 3,363,717 - - 124,537 3,488,254
FUND BALANCESNonspendable 28,224,608 - - - 28,224,608 Restricted - - - 42,687,497 42,687,497 Committed 168,339 - - - 168,339 Assigned - - 7,016,424 33,982,312 40,998,736 Unassigned 59,018,654 - - - 59,018,654
TOTAL FUND BALANCES 87,411,601 - 7,016,424 76,669,809 171,097,834
TOTAL LIABILITIES, DEFERRED INFLOWS OF RESOURCES AND FUND BALANCES 97,066,865$ -$ 7,491,938$ 78,414,192$ 182,972,995$

CITY OF EVERETT FINANCIAL SECTION
2019 COMPREHENSIVE ANNUAL FINANCIAL REPORT PAGE 29
RECONCILIATION OF THE BALANCE SHEET - GOVERNMENTAL FUNDS
TO THE STATEMENT OF NET POSITION DECEMBER 31, 2019
The accompanying notes are an integral part of this statement.
Total Fund Balances reported on the Balance Sheet - Governmental Funds $ 171,097,834
Capital assets reported in the government-wide Statement of Net Position are not reported in the Balance Sheet - Governmental Funds 358,144,754
Net pension assets, liabilities, deferred outflows, and deferred inflows of the City's proportionate share of the State-sponsored retirement plans reported in the government-wide Statement of Net Position are not in the Balance Sheet - Governmental Funds 16,848,026
Assets and liabilities of internal service funds included in governmental activities in the government-wide Statement of Net Position are not reported in the Balance Sheet - Governmental Funds 11,650,407
Unearned revenues reported in the Balance Sheet - Governmental Funds not reported in the government-wide Statement of Net Position 3,464,353
Net investment in joint venture reported in the government-wide Statement of Net Position is not reported in the Balance Sheet - Governmental Funds 1,701,261
Accrued receivables reported in the government-wide Statement of Net Position are not reported in the Balance Sheet - Governmental Funds 665,000
Discount on notes receivable reported in the government-wide Statement of Net Position are not reported in the Balance Sheet - Governmental Funds (1,012,261) Accrued pollution remediation liability reported in the government-wide Statement of Net Position are not reported in the Balance Sheet - Governmental Funds (3,349,457)
Net pension and net OPEB assets, liabilities, deferred outflows, and deferred inflows of the City's single-employer Fire and Police retirement plans are reported in the government-wide Statement of Net Position but not in the Balance Sheet - Governmental Funds (47,555,785)
Long-term debt reported in the government-wide Statement of Net Position is not reported in the Balance Sheet - Governmental Funds (49,343,167)
Total Net Position reported on the government-wide Statement of Net Position $ 462,310,965
Amounts reported for governmental activities in the Balance Sheet -
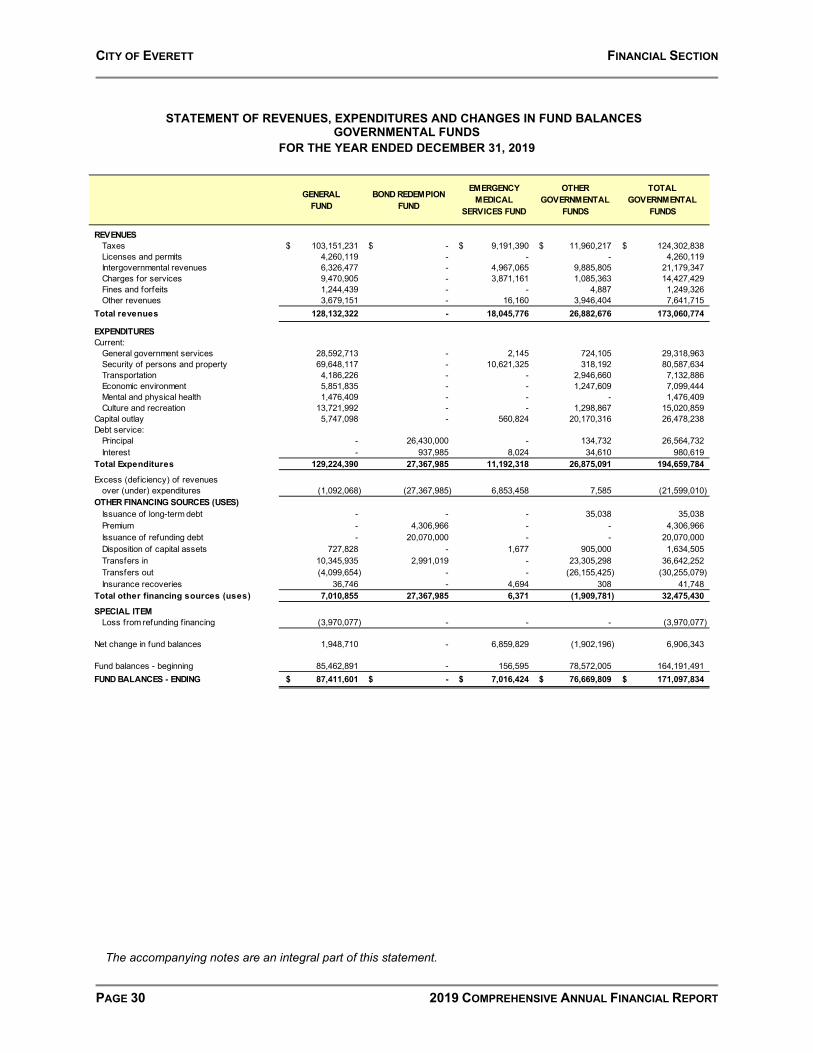
CITY OF EVERETT FINANCIAL SECTION
PAGE 30 2019 COMPREHENSIVE ANNUAL FINANCIAL REPORT
STATEMENT OF REVENUES, EXPENDITURES AND CHANGES IN FUND BALANCES
GOVERNMENTAL FUNDS FOR THE YEAR ENDED DECEMBER 31, 2019
The accompanying notes are an integral part of this statement.
GENERAL FUND
BOND REDEMPION FUND
EMERGENCY MEDICAL
SERVICES FUND
OTHER GOVERNMENTAL
FUNDS
TOTALGOVERNMENTAL
FUNDS
REVENUESTaxes 103,151,231$ -$ 9,191,390$ 11,960,217$ 124,302,838$ Licenses and permits 4,260,119 - - - 4,260,119 Intergovernmental revenues 6,326,477 - 4,967,065 9,885,805 21,179,347 Charges for services 9,470,905 - 3,871,161 1,085,363 14,427,429 Fines and forfeits 1,244,439 - - 4,887 1,249,326 Other revenues 3,679,151 - 16,160 3,946,404 7,641,715
Total revenues 128,132,322 - 18,045,776 26,882,676 173,060,774
EXPENDITURESCurrent:
General government services 28,592,713 - 2,145 724,105 29,318,963 Security of persons and property 69,648,117 - 10,621,325 318,192 80,587,634 Transportation 4,186,226 - - 2,946,660 7,132,886 Economic environment 5,851,835 - - 1,247,609 7,099,444 Mental and physical health 1,476,409 - - - 1,476,409 Culture and recreation 13,721,992 - - 1,298,867 15,020,859
Capital outlay 5,747,098 - 560,824 20,170,316 26,478,238 Debt service:
Principal - 26,430,000 - 134,732 26,564,732 Interest - 937,985 8,024 34,610 980,619
Total Expenditures 129,224,390 27,367,985 11,192,318 26,875,091 194,659,784
Excess (deficiency) of revenuesover (under) expenditures (1,092,068) (27,367,985) 6,853,458 7,585 (21,599,010)
OTHER FINANCING SOURCES (USES)Issuance of long-term debt - - - 35,038 35,038 Premium - 4,306,966 - - 4,306,966 Issuance of refunding debt - 20,070,000 - - 20,070,000 Disposition of capital assets 727,828 - 1,677 905,000 1,634,505 Transfers in 10,345,935 2,991,019 - 23,305,298 36,642,252 Transfers out (4,099,654) - - (26,155,425) (30,255,079) Insurance recoveries 36,746 - 4,694 308 41,748
Total other financing sources (uses) 7,010,855 27,367,985 6,371 (1,909,781) 32,475,430
SPECIAL ITEMLoss from refunding f inancing (3,970,077) - - - (3,970,077)
Net change in fund balances 1,948,710 - 6,859,829 (1,902,196) 6,906,343
Fund balances - beginning 85,462,891 - 156,595 78,572,005 164,191,491 FUND BALANCES - ENDING 87,411,601$ -$ 7,016,424$ 76,669,809$ 171,097,834$

CITY OF EVERETT FINANCIAL SECTION
2019 COMPREHENSIVE ANNUAL FINANCIAL REPORT PAGE 31
RECONCILIATION OF THE STATEMENT OF REVENUES, EXPENDITURES, AND
CHANGES IN FUND BALANCES OF GOVERNMENTAL FUNDS TO THE STATEMENT OF ACTIVITIES
FOR THE YEAR ENDED DECEMBER 31, 2019
The accompanying notes are an integral part of this statement.
$ 6,906,343
Governmental funds report capital outlays as expenditures. Government-wide statements establish capital outlays as assets and allocate the cost of depreciable assets over their estimated useful lives as depreciation expense. This item represents the amount by which capital outlay and accquisitions exceed depreciation expense in the current period. 15,626,463
Increase (decrease) in governmental pension expense as a result of the requirements of GASB 68. 6,917,332
Governmental funds report the proceeds from the issuance of long-term debt (e.g., bonds and leases) as revenues and the associated issuance costs as expense in the period the debt is issued. Government-wide statements report long-term debt as a liability and amortize issuance costs as expense over the life of the obligation. This item represents the net effect of these differences in the treatment of long-term debt and related items during the current period. 2,261,877 Internal service funds are used by management to charge the costs of fleet management, management information systems, self-insurance, employee health benefits, and telecommunications to individual funds. The net revenue (expense) of certain activities of internal service funds is reported with governmental activities. 900,675 Increase (decrease) to investment in joint venture reported in the government-wide statements during the current period. 237,917 Increase (decrease) to accrued receivables in the government-wide statements during the current period. 87,211 Increase (decrease) to non-current unearned revenue on the Balance Sheet - Governmental Funds during the current period. 32,351 Increase (decrease) to notes and interest receivable on the government-wide statements during the current period. 22,774 The (increase) decrease in accrued compensated absences is reported in the government-wide Statement of Activities but not the Governmental Funds Statement of Revenues, Expenditures and Changes in Fund Balances. (268,093) Disposition of capital assets (i.e., sales, trade-ins and transfers) results in a decrease in capital assets reported in the government-wide statements during the current period. (1,306,404) Increase (decrease) to the combined net pension asset and net OPEB liability on the government-wide statements during the current period. (4,019,264)
Change in net position of governmental activities reported on the government-wide Statement of Activities $ 27,399,182
Expenditures and Changes in Fund Balances differ from amounts reported in the government-wide Statement of Activities by the following items:
Net change in fund balances for total governmental funds reported on the Statement of Revenues, Expenditures and Changes in Fund Balances

CITY OF EVERETT FINANCIAL SECTION
PAGE 32 2019 COMPREHENSIVE ANNUAL FINANCIAL REPORT
STATEMENT OF NET POSITION PROPRIETARY FUNDS DECEMBER 31, 2019
BUSINESS TYPE ACTIVITIES
GOVERNMENTAL
ACTIVITIES -
WATER &SEWERUTILITY
TRANSIT OTHER
ENTERPRISEFUNDS TOTAL
INTERNALSERVICEFUNDS
CURRENT ASSETSCash and cash equivalents 26,877,229$ 1,836,753$ 1,825,962$ 30,539,944$ 9,160,557$ Deposits w ith Trustee - 346,569 - 346,569 - Investments 55,355,356 3,528,476 3,509,155 62,392,987 17,604,877 Bond covenant accounts: Restricted cash and cash equivalents 2,828,382 - - 2,828,382 - Restricted investments 1,862,187 - - 1,862,187 - Receivables, net Taxes - 3,578,870 - 3,578,870 - Customer accounts 7,137,274 74,129 188,912 7,400,315 192,482 Interest 476,433 29,769 25,150 531,352 118,645 Interfund loans 603,850 - - 603,850 - Due from other governments 848,122 1,213,429 22,581 2,084,132 29,207 Prepayments - - - - 97,858 Inventory 1,074,552 - 103,211 1,177,763 719,784
Total Current Assets 97,063,385 10,607,995 5,674,971 113,346,351 27,923,410
NONCURRENT ASSETSRestricted cash and cash equivalents - 256,205 - 256,205 - Prepayments 145,083 - - 145,083 - Restricted investments - 493,795 - 493,795 - Special assessments 2,520 - - 2,520 - Investment in joint venture 669,332 - - 669,332 -
Net position in pensions 3,898 - - 3,898 - Land 30,143,985 14,311,708 959,622 45,415,315 - Construction in progress 30,754,374 840,083 - 31,594,457 - Capital assets, net of depreciation (Note 6) 544,045,109 39,204,613 14,240,972 597,490,694 1,307,239
Total Noncurrent Assets 605,764,301 55,106,404 15,200,594 676,071,299 1,307,239 TOTAL ASSETS 702,827,686 65,714,399 20,875,565 789,417,650 29,230,649 DEFERRED OUTFLOWS OF RESOURCES Refunding of debt 6,920,746 - - 6,920,746 -
Related to asset retirement obligations - - - - 120,000 Resources related to pensions 1,486,987 1,112,144 54,696 2,653,827 431,103 TOTAL DEFFERED OUTFLOWS OF RESOURCES 8,407,733 1,112,144 54,696 9,574,573 551,103
COMBINED ASSETS AND DEFERRED OUTFLOW OF RESOURCES 711,235,419$ 66,826,543$ 20,930,261$ 798,992,223$ 29,781,752$
LIABILITIES
CURRENT LIABILITIESWages and benefits payable 1,462,656$ 769,938$ 52,323$ 2,284,917$ 153,157$ Accounts payable 1,646,894 877,873 288,556 2,813,323 619,081 Claims and judgments payable - - - - 7,113,264 Interest payable 601,169 - - 601,169 - Taxes payable 167,481 2,484 13,767 183,732 506 Interfund loans payable - - 603,850 603,850 - Due to other governments - 482,606 - 482,606 - Unearned revenue - 428,822 252,194 681,016 - Current portion of long-term debt 12,301,924 - - 12,301,924 - Other current liabilities 1,031,732 143,592 - 1,175,324 207,430
Total Current Liabilities 17,211,856 2,705,315 1,210,690 21,127,861 8,093,438
NONCURRENT LIABILITIESCapital Leases Payable 10,386 - - 10,386 - Revenue bonds payable 163,029,363 - - 163,029,363 - Claims and judgments payable - - - - 6,583,469 Special assessment bonds payable 2,520 - - 2,520 - Advances from other funds - - 6,134,168 6,134,168 - Loans payable 20,028,537 - - 20,028,537 - Net pension liability 4,068,171 4,923,744 67,478 9,059,393 3,277,523 Liabilities payable from restricted assets - 750,000 - 750,000 - Other long-term liabilities 886,463 480,884 324,593 1,691,940 183,130
Total Noncurrent Liabilities 188,025,440 6,154,628 6,526,239 200,706,307 10,044,122 TOTAL LIABILITIES 205,237,296 8,859,943 7,736,929 221,834,168 18,137,560 DEFERRED INFLOWS OF RESOURCES
Resources related to pensions 3,780,464 2,400,540 158,359 6,339,363 610,774 TOTAL DEFFERED INFLOWS OF RESOURCES 3,780,464 2,400,540 158,359 6,339,363 610,774
COMBINED LIABILITIES AND DEFERRED INFLOW OF RESOURCES 209,017,760$ 11,260,483$ 7,895,288$ 228,173,531$ 18,748,334$ NET POSITION
Net Investment in Capital Assets 416,328,958 53,374,236 15,194,773 484,897,967 1,270,993 Restricted for debt service 4,690,569 - - 4,690,569 - Unrestricted 81,198,132 2,191,824 (2,159,800) 81,230,156 9,762,425
TOTAL NET POSITION 502,217,659$ 55,566,060$ 13,034,973$ 570,818,692 11,033,418$
Amounts reported for business-type activities in the statement of net position are different because:The net effect of activities allocated from internal service funds ispresented as an internal balance on the statement of net position. (616,988)
Net position of business-type activities 570,201,704$
The accompanying notes are an integral part of this statement.
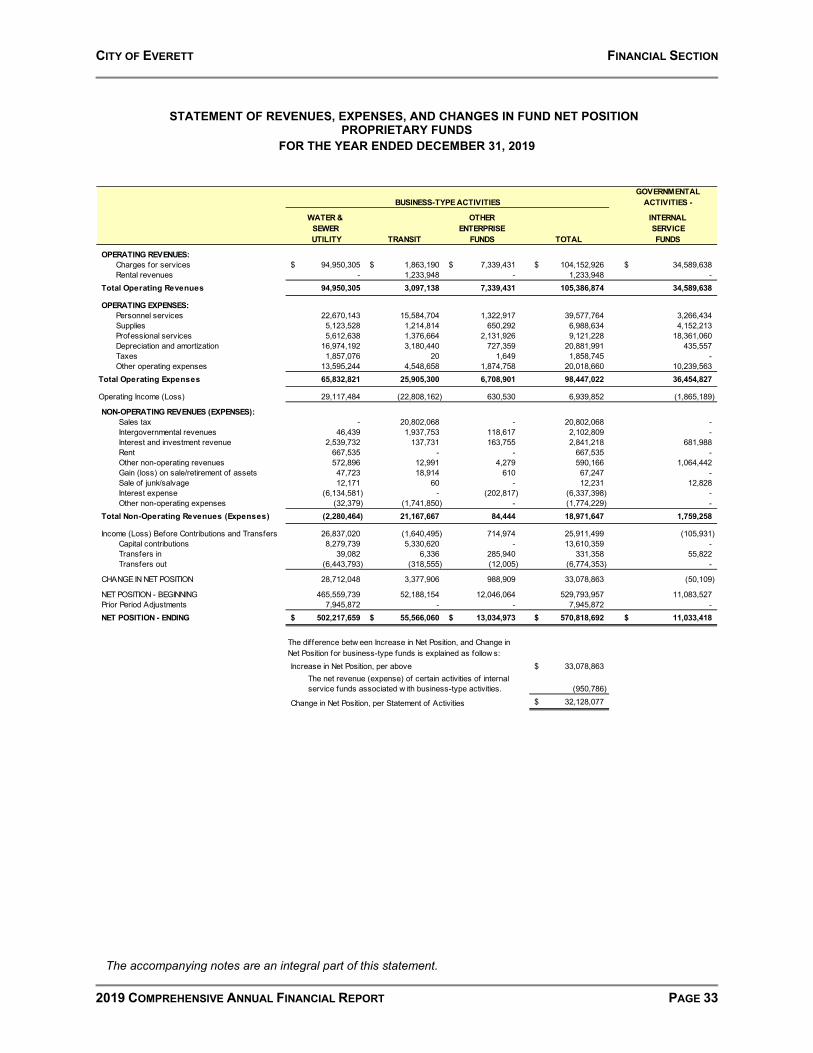
CITY OF EVERETT FINANCIAL SECTION
2019 COMPREHENSIVE ANNUAL FINANCIAL REPORT PAGE 33
STATEMENT OF REVENUES, EXPENSES, AND CHANGES IN FUND NET POSITION
PROPRIETARY FUNDS FOR THE YEAR ENDED DECEMBER 31, 2019
The accompanying notes are an integral part of this statement.
GOVERNMENTALACTIVITIES -
WATER &SEWER
UTILITY TRANSIT
OTHER ENTERPRISE
FUNDS TOTAL
INTERNALSERVICEFUNDS
OPERATING REVENUES:Charges for services 94,950,305$ 1,863,190$ 7,339,431$ 104,152,926$ 34,589,638$ Rental revenues - 1,233,948 - 1,233,948 -
Total Operating Revenues 94,950,305 3,097,138 7,339,431 105,386,874 34,589,638
OPERATING EXPENSES:Personnel services 22,670,143 15,584,704 1,322,917 39,577,764 3,266,434 Supplies 5,123,528 1,214,814 650,292 6,988,634 4,152,213 Professional services 5,612,638 1,376,664 2,131,926 9,121,228 18,361,060 Depreciation and amortization 16,974,192 3,180,440 727,359 20,881,991 435,557 Taxes 1,857,076 20 1,649 1,858,745 - Other operating expenses 13,595,244 4,548,658 1,874,758 20,018,660 10,239,563
Total Operating Expenses 65,832,821 25,905,300 6,708,901 98,447,022 36,454,827
Operating Income (Loss) 29,117,484 (22,808,162) 630,530 6,939,852 (1,865,189)
NON-OPERATING REVENUES (EXPENSES):Sales tax - 20,802,068 - 20,802,068 - Intergovernmental revenues 46,439 1,937,753 118,617 2,102,809 - Interest and investment revenue 2,539,732 137,731 163,755 2,841,218 681,988 Rent 667,535 - - 667,535 - Other non-operating revenues 572,896 12,991 4,279 590,166 1,064,442 Gain (loss) on sale/retirement of assets 47,723 18,914 610 67,247 - Sale of junk/salvage 12,171 60 - 12,231 12,828 Interest expense (6,134,581) - (202,817) (6,337,398) - Other non-operating expenses (32,379) (1,741,850) - (1,774,229) -
Total Non-Operating Revenues (Expenses) (2,280,464) 21,167,667 84,444 18,971,647 1,759,258
Income (Loss) Before Contributions and Transfers 26,837,020 (1,640,495) 714,974 25,911,499 (105,931) Capital contributions 8,279,739 5,330,620 - 13,610,359 - Transfers in 39,082 6,336 285,940 331,358 55,822 Transfers out (6,443,793) (318,555) (12,005) (6,774,353) -
CHANGE IN NET POSITION 28,712,048 3,377,906 988,909 33,078,863 (50,109)
NET POSITION - BEGINNING 465,559,739 52,188,154 12,046,064 529,793,957 11,083,527 Prior Period Adjustments 7,945,872 - - 7,945,872 - NET POSITION - ENDING 502,217,659$ 55,566,060$ 13,034,973$ 570,818,692$ 11,033,418$
Increase in Net Position, per above 33,078,863$ The net revenue (expense) of certain activities of internalservice funds associated w ith business-type activities. (950,786)
Change in Net Position, per Statement of Activities 32,128,077$
BUSINESS-TYPE ACTIVITIES
The difference betw een Increase in Net Position, and Change in Net Position for business-type funds is explained as follow s:

CITY OF EVERETT FINANCIAL SECTION
PAGE 34 2019 COMPREHENSIVE ANNUAL FINANCIAL REPORT
STATEMENT OF CASH FLOWS
PROPRIETARY FUNDS FOR THE YEAR ENDED DECEMBER 31, 2019
(Page 1 of 2)
The accompanying notes are an integral part of this statement.
GOVERNMENTALACTIVITIES -
WATER &SEWERUTILITY
TRANSIT
OTHER ENTERPRISE
FUNDS
TOTAL
INTERNALSERVICEFUNDS
CASH FLOWS FROM OPERATING ACTIVITIES:Receipts from customers and users 95,413,622$ 2,770,473$ 7,356,685$ 105,540,780$ 474,168$ Receipts from interfund services provided 705,816 116,916 - 822,732 34,086,570 Payments to suppliers (18,117,420) (2,056,175) (4,338,013) (24,511,608) (25,960,212) Payments to employees (26,738,092) (15,276,857) (1,369,369) (43,384,318) (3,205,331) Payments for interfund services used (7,550,842) (5,117,989) (176,935) (12,845,766) (516,672) Claims paid - - - - (4,575,308) Other receipts 834,891 13,051 4,279 852,221 1,408,559 Other payments (32,379) (1,700,732) - (1,733,111) - Net cash provided (used) by operating activities 44,515,596 (21,251,313) 1,476,647 24,740,930 1,711,774
CASH FLOWS FROM NONCAPITAL FINANCING ACTIVITIES:Sales tax received - 20,902,198 - 20,902,198 - Receipts from non-capital grants 53,122 2,008,398 106,237 2,167,757 - Interfund loan payments received 234,850 - - 234,850 - Interest received on interfund loans 31,749 - - 31,749 - Proceeds from interfund loans - - 15,150 15,150 - Principal paid on interfund loans - - (460,000) (460,000) - Interest paid on interfund loans - - (166,710) (166,710) - Transfers to other funds (6,443,793) (318,555) (12,005) (6,774,353) - Transfers from other funds 39,082 6,336 285,940 331,358 55,822 Net cash provided (used) by noncapital financing activities (6,084,990) 22,598,377 (231,388) 16,281,999 55,822
CASH FLOWS FROM CAPITAL AND RELATED FINANCING ACTIVITIES:
Principal paid on capital debt (10,821,083) - (1,000,000) (11,821,083) - Interest paid on capital debt (6,810,280) - (42,500) (6,852,780) - Receipts from capital grants 985,320 5,827,513 - 6,812,833 - Proceeds from sale of capital assets 70,699 18,914 610 90,223 - Capital contributions 6,583,052 - - 6,583,052 - Acquisition and construction of capital assets (35,797,443) (5,764,884) (156,739) (41,719,066) (378,331) Net cash provided (used) by capital and related financing activ (45,789,735) 81,543 (1,198,629) (46,906,821) (378,331)
CASH FLOWS FROM INVESTING ACTIVITIES:Proceeds from sale of investments 32,125,725 329,808 1,478,123 33,933,656 5,829,303 Purchase of investments - - (284,456) (284,456) - Investment income 1,579,510 106,166 116,750 1,802,426 454,751 Net cash provided (used) by investing activities 33,705,235 435,974 1,310,417 35,451,626 6,284,054
Net Increase (Decrease) in Cash and Cash Equivalents 26,346,106 1,864,581 1,357,047 29,567,734 7,673,319 Cash and Cash Equivalents, January 1 3,359,505 574,946 468,915 4,403,366 1,487,238 CASH AND CASH EQUIVALENTS, DECEMBER 31 29,705,611$ 2,439,527$ 1,825,962$ 33,971,100$ 9,160,557$
Current Cash and Cash Equivalents 26,877,229$ 2,183,322$ 1,825,962$ 30,886,513$ 9,160,557$ Restricted Cash and Cash Equivalents 2,828,382 256,205 - 3,084,587 - CASH AND CASH EQUIVALENTS, DECEMBER 31 29,705,611$ 2,439,527$ 1,825,962$ 33,971,100$ 9,160,557$
BUSINESS-TYPE ACTIVITIES

CITY OF EVERETT FINANCIAL SECTION
2019 COMPREHENSIVE ANNUAL FINANCIAL REPORT PAGE 35
STATEMENT OF CASH FLOWS
PROPRIETARY FUNDS FOR THE YEAR ENDED DECEMBER 31, 2019
(Page 2 of 2)
The accompanying notes are an integral part of this statement.
GOVERNMENTALACTIVITIES -
WATER &SEWERUTILITY
TRANSIT
OTHER ENTERPRISE
FUNDS
TOTAL
INTERNALSERVICEFUNDS
BUSINESS-TYPE ACTIVITIES
RECONCILIATION OF OPERATING INCOME (LOSS) TO NET CASH PROVIDED (USED) BY OPERATING ACTIVITIES:Operating income (loss) 29,117,484$ (22,808,162)$ 630,530$ 6,939,852$ (1,865,189)$ Adjustments to Reconcile Operating Income to Net Cash Provided (Used) by Operating Activities:
Depreciation and amortization 16,974,192 3,180,440 727,358 20,881,990 435,557 Other non-operating receipts 1,252,602 13,051 4,279 1,269,932 1,077,270 Other non-operating disbursements (32,379) (1,700,732) - (1,733,111) - GASB 68 pension expense adjustments (4,347,664) 236,472 (36,519) (4,147,711) 188,257
Change in Assets and Liabilities:(Increase) decrease in inventories 120,318 - 32,737 153,055 (174,138) (Increase) decrease in receivables 748,063 (294,304) 5,517 459,276 302,389 (Increase) decrease in prepaid expenses 6,909 4,757 - 11,666 (2,142) Increase (decrease) in accounts and other payables 554,954 (29,869) 114,609 639,694 1,877,167 Increase (decrease) in compensated absences 122,723 61,274 (13,601) 170,396 (127,397) Increase (decrease) in other current liabilities (1,606) 85,760 11,737 95,891 -
TOTAL ADJUSTMENTS 15,398,112 1,556,849 846,117 17,801,078 3,576,963
Net cash provided (used) by operating activities 44,515,596$ (21,251,313)$ 1,476,647$ 24,740,930$ 1,711,774$
SCHEDULE OF NON-CASH CAPITAL AND RELATED FINANCING ACTIVITIES:Non-Cash Financing, Capital and Investing Activities:
Capital assets contributed by other funds 1,253,029$ -$ -$ 1,253,029$ -$ Capital assets contributed by private developers 214,074 - - 214,074 - Increase (decrease) in fair value of investments 703,746 30,659 37,850 772,255 182,721 Capital grants earned, not received - 464,855 - 464,855 - Operating grants earned, not received 17,937 360,115 22,581 400,633 -
TOTAL NON-CASH ACTIVITIES 2,188,786$ 855,629$ 60,431$ 3,104,846$ 182,721$

CITY OF EVERETT FINANCIAL SECTION
PAGE 36 2019 COMPREHENSIVE ANNUAL FINANCIAL REPORT
STATEMENT OF FIDUCIARY NET POSITION
FIDUCIARY FUNDS DECEMBER 31, 2019
The accompanying notes are an integral part of this statement.
CUSTODIAL
FUNDS DOWNTOWN
BUSINESS IMPROVEMENT
AREA
ASSETS Cash and cash equivalents 1,903,077$ 51,107$ Investments
Agency Bonds 42,603,723 - Accounts receivable - net - 47,808 Interest receivable 17,310 - Other Prepayments 1,672 -
Total Current Assets 44,525,782 98,915
TOTAL ASSETS 44,525,782$ 98,915$
LIABILITIESAccounts payable 66,639$ -$
Total Current Liabilities 66,639 -
TOTAL LIABILITIES 66,639 -
NET POSITIONNet Position restricted for pensions 15,854,319 - Net Position restricted for post employment b 28,604,824 - Net Position restricted for custodial funds - 98,915 Total held in trust 44,459,143$ 98,915$
PENSION (AND OTHER
EMPLOYEE BENEFIT) TRUST
FUNDS

CITY OF EVERETT FINANCIAL SECTION
2019 COMPREHENSIVE ANNUAL FINANCIAL REPORT PAGE 37
STATEMENT OF CHANGES IN FIDUCIARY NET POSITION
FIDUCIARY FUNDS FOR THE YEAR ENDED DECEMBER 31, 2019
The accompanying notes are an integral part of this statement.
CUSTODIAL
FUNDS DOWNTOWN
BUSINESS IMPROVEMENT
AREA
ADDITIONS:Contributions Employer 1,828,300$ -$ State 180,065 - Other contributions 2,614 - Total contributions 2,010,979 -
Assessments for improvement area 456,328 Investment income
Interest 994,349 - Net appreciation (depreciation) in fair value 1,190,370 -
Net investment income 2,184,719 -
TOTAL ADDITIONS 4,195,698 456,328
DEDUCTIONS:Benefits 3,737,185 - Administrative expense 86,650 - Assessments distributed to improvement area - 475,375
TOTAL DEDUCTIONS 3,823,835 475,375
CHANGE IN NET POSITIONPension benefits 434,375 Postemployment healthcare benefits (62,512) Business Improvement Area (19,047)
NET POSITION RESTRICTED FOR EMPLOYEES' PENSION BENEFITS
Employees' pension benefits, January 1 15,419,944
NET POSITION RESTRICTED FOR POSTEMPLOYMENT HEALTHCARE BENEFITS
Postemployment healthcare benefits, January 1 28,667,336 NET POSITION RESTRICTED FOR BUSINESS IMPROVEMENT AREA
Business Improvement Area, January 1 117,962 NET POSITION - ENDING 44,459,143$ 98,915$
PENSION (AND OTHER
EMPLOYEE BENEFIT) TRUST
FUNDS

CITY OF EVERETT FINANCIAL SECTION
PAGE 38 2019 COMPREHENSIVE ANNUAL FINANCIAL REPORT
NOTES TO THE FINANCIAL STATEMENTS FOR THE YEAR ENDED DECEMBER 31, 2019
NOTE TABLE OF CONTENTS PAGE 1 SUMMARY OF SIGNIFICANT ACCOUNTING POLICIES ................................................. 39 A. Reporting Entity ...................................................................................................... 39 B. Implementation of New Accounting Principle .......................................................... 40 C. Government-Wide and Fund Financial Statements ................................................ 41 D. Measurement Focus, Basis of Accounting, and Financial Statement Presentation .......................................................................................... 41 E. Assets, Deferred Outflows of Resources, Liabilities, Deferred Inflows of Resources and Net Position/Fund Balance ............................. 43
2 RECONCILIATION OF GOVERNMENT-WIDE AND FUND FINANCIAL STATEMENTS ............................................................................................... 48
3 STEWARDSHIP, COMPLIANCE AND ACCOUNTABILITY ............................................... 50 4 DEPOSITS AND INVESTMENTS ...................................................................................... 51 5 PROPERTY TAXES ........................................................................................................... 54 6 CAPITAL ASSETS AND DEPRECIATION ......................................................................... 55 7 PENSION PLANS .............................................................................................................. 57 8 OTHER POST EMPLOYMENT BENEFITS ....................................................................... 70 9 RISK MANAGEMENT ........................................................................................................ 74 10 LONG-TERM DEBT ........................................................................................................... 76 11 LEASES AND OTHER CONTRACTUAL COMMITMENTS ............................................... 80 12 CHANGES IN LONG-TERM LIABILITIES .......................................................................... 82 13 CONTINGENCIES AND LITIGATION ................................................................................ 83 14 INTERFUND BALANCES AND TRANSFERS ................................................................... 83 15 RECEIVABLE AND PAYABLE BALANCES ....................................................................... 84 16 JOINT VENTURES AND RELATED ORGANIZATIONS .................................................... 85 17 POLLUTION REMEDIATION AND ASSET RETIREMENT OBLIGATIONS ...................... 87 18 TAX ABATEMENTS……………………………………………………………………………… 88 19 OTHER DISCLOSURES………………………………………………………………………… 89 A. Prior Period Adjustments ........................................................................................ 89 B. Special Items .......................................................................................................... 90 C. Subsequent Events ................................................................................................. 90

CITY OF EVERETT FINANCIAL SECTION
2019 COMPREHENSIVE ANNUAL FINANCIAL REPORT PAGE 39
NOTE 1 - SUMMARY OF SIGNIFICANT ACCOUNTING POLICIES The financial statements of the City of Everett are prepared in conformity with generally accepted accounting principles (GAAP) as applied to governmental units. The Governmental Accounting Standards Board (GASB) is the accepted standard setting body for establishing governmental accounting and financial reporting principles. Significant accounting policies are described below. A. REPORTING ENTITY The City of Everett was incorporated on May 4, 1893. The City operates under a Mayor-Council form of government, and, under its charter, has all powers granted to like cities by the constitution and laws of the State of Washington. The City is a general-purpose government providing police, fire, emergency medical service, water distribution, sewage collection and treatment, transit services, street maintenance, planning and zoning, libraries, parks and recreation, and general administrative services - the full range of municipal services contemplated by statute or charter. As required by generally accepted accounting principles, the City of Everett includes all governmental activities, organizations, and functions (referred to in this note as “organizations,” whether they are structured as funds, departments, agencies, boards, or commissions) for which the City of Everett is financially accountable. Also included are other organizations for which the nature and significance of their relationship with the City of Everett are such that exclusion would cause the City’s financial statements to be misleading or incomplete. The City of Everett is financially accountable for other entities that are considered component units if: (1) it appoints a voting majority of the governing body and (a) it is able to impose its will on the organization or (b) there is a potential for the organization to provide specific financial benefits to or impose specific financial burdens on the City, or (2) it is the sole corporate member of a not-for-profit corporation. Each blended and discretely presented component unit has a December 31 year-end. Blended Component Units – Although legally separate entities, blended component units are, in substance, part of the government’s operations. Therefore, data from these units are combined with data of the primary government. The Industrial Development Corporation (IDC) of the City of Everett, a public nonprofit corporation, is authorized to facilitate the issuance of tax-exempt nonrecourse revenue bonds to finance industrial development within the corporate boundaries of the City. The local government, through the public corporation, lends its name to confer tax-exempt status on the bonds issued. Neither the local government, the public corporation, nor the state government pledges its credit to repayment of the bonds. The funds for repayment of the bonds come from private lenders and must be repaid by the company for which the industrial development facilities are financed and built. Currently, there are no outstanding bonds.
The entire IDC’s governing body is comprised of City council members and the mayor, who serves ex officio. As a result, the City is the sole corporate member of a not-for-profit corporation. The IDC’s account balances and transactions are included in the City’s financial statements as a special revenue fund. The transactions, if any, are minimal; therefore, separate financial statements have not been issued. The City of Everett CDE LLC, a community development entity (CDE) formed by the City in February 2009, is a separate legal entity whose purpose is to help alleviate poverty and incentivize investment into low-income community census tracts. The Everett CDE LLC applied for New Market Tax Credits (NMTC) in April of 2009. In October 2009, the US Treasury Department awarded $25 million in NMTC to City of Everett CDE LLC. The City of Everett CDE LLC is wholly owned and controlled by the City. The volunteer board members, who are appointed by the mayor and approved by City Council, serve solely in an advisory capacity. The CDE’s account balances and transactions are included in the City’s financial statements as a special revenue fund. Discretely Presented Component Unit – The discretely presented component unit is reported in a separate column in the combined financial statements to emphasize that it is legally separate from the government.
CITY OF EVERETT FINANCIAL SECTION
PAGE 40 2019 COMPREHENSIVE ANNUAL FINANCIAL REPORT
The Everett Public Facilities District (PFD), a municipal corporation of the State of Washington, was established by City ordinance in March 2001, to finance, design, construct, operate, and maintain a special events center. The PFD is included in the City’s reporting entity as a discretely presented component unit because of the financial accountability relationship. The Board of Directors consists of five members, all appointed by the Everett City Council. In October 2015, the PFD entered into a catering and concession agreement with Spectra Food Services and Hospitality (Spectra). The agreement provided for a payment of $375,000 by Spectra towards capital improvements in the Regional Special Events Center. This payment is amortized over the term of the agreement of 63 months as there is a repayment obligation for the unearned balance should the agreement be terminated early. The unamortized balance of deferred inflows of resources at December 31, 2019 was $56,250. In October 2014, the City issued the 2014 LTGO Refunding Bonds to refinance its outstanding 2003 LTGO Variable Rate debt and to refinance the Everett Public Facilities District (EPFD) outstanding project revenue bonds. The 2014 LTGO Refunding Bonds were floating rate bonds that were issued for a five-year term and bore interest based on the Securities Industry and Financial Markets (SIFMA) short-term index rate. The portion of the 2014 LTGO Refunding Bonds that were issued to refinance EPFD debt were referred to as the 2014 EPFD LTGO Refunding Bonds. In November 2019, the City issued fixed-rate Limited Tax General Obligation (LTGO) Refunding Bonds to refinance the outstanding 2014 LTGO Refunding Bonds, which had come to the end of the initial five-year period. The portion of the 2019 LTGO Refunding Bonds attributed to the 2014 EPFD LTGO Refunding Bonds is referred to as the 2019 EPFD LTGO Refunding Bonds. The City is responsible for all debt service payments associated with the 2019 LTGO Refunding Bonds. However, the PFD agrees to reimburse the City the amount of principal and interest paid on the 2019 EPFD LTGO Refunding Bonds. As of December 31, 2019, the outstanding 2019 PFD Refunding Bonds balance was $18,865,800. Interest paid and assessed as well as principal payments made on PFD bond obligations are $1,525,780 as of December 31, 2019. The City loaned PFD $665,000 for the upgrade of the arena scoreboard. Interest accrued on this loan as of December 31, 2019, is $55,065. In 2018, per RCW 39.34 the City and the PFD entered into an interlocal agreement in which the City agrees to a contingent loan guarantee to support 2018 Refunding Bond debt. This guarantee is extended through the final maturity date of December 1, 2041. As a condition of the interlocal agreement, the PFD created the 2018 Reserve Account to secure the payment of principal and interest on the 2018 Bonds. The reserve requirement is maintained by cash deposit, a Qualified Letter of Credit or Qualified Insurance. Payments for the PFD’s 2018 principal and interest are expected to be made from the PFD tax revenues and net project revenues. As of December 31, 2019, the PFD had outstanding 2018 Refunding Bond debt of $19,090,000. Complete financial statements may be obtained at the PFD administrative offices, Attn: Director of Finance, Everett Public Facilities District, 2000 Hewitt Avenue, Suite 200, Everett, Washington 98201. B. IMPLEMENTATION OF NEW ACCOUNTING PRINCIPLES Effective January 1, 2019, the City adopted the provisions of the following GASB Pronouncements: Statement No. 83, Certain Asset Retirement Obligations – addresses accounting and financial reporting for certain asset retirement obligation liabilities and a corresponding deferred outflow of resources. Asset retirement obligations ("ARO") represent the best estimate of the current value of cash outlays expected to be incurred for legally enforceable retirement obligations of tangible capital assets. Recognition occurs when the liability is both incurred and reasonably estimable. The liability is incurred upon the acquisition, construction, development or normal operation of tangible long-lived assets together with the occurrence of an external event that obligates the government to perform the asset retirement activities as in the enactment of laws, regulations, contracts, or court judgments. The deferred outflows of resources should be reduced and recognized as outflows of resources (an expense) in a systematic and rational manner over the estimated useful life of the tangible capital asset. The provisions of this statement have been incorporated into these financial statements (see Note 17). Statement No. 84, Fiduciary Activities – establishes criteria for identifying fiduciary activities that meet the criteria of whether a government controls the assets of the fiduciary activity and the beneficiaries with whom a fiduciary relationship exists. This Statement describes four fiduciary funds that should be reported, if applicable as (1) pension
CITY OF EVERETT FINANCIAL SECTION
2019 COMPREHENSIVE ANNUAL FINANCIAL REPORT PAGE 41
(and other employee benefit) trust funds, (2) investment trust funds, (3) private-purpose trust funds, and (4) custodial funds. The City reports pension and other employee benefits trust funds and one custodial fund. The provisions of this statement have been adopted and incorporated into these financial statements (see Fiduciary Fund Statements). Statement No. 88, Certain Disclosures Related to Debt, including Direct Borrowings and Direct Placements – improves financial reporting by consistently providing users of financial statements with essential information, including unused lines of credit, assets pledged as collateral for the debt, and terms specified in debt agreements related to significant events of default with finance-related consequences, significant termination events with finance-related consequences, and significant subjective acceleration clauses. This Statement also requires that existing and additional information be provided for direct borrowings and direct placements of debt separately from other debt. The provisions of this statement have been adopted and incorporated into these financial statements (see Notes 10 and 12). Statement No. 90, Majority Equity Interests – the primary objectives are to improve the consistency and comparability of reporting a government’s majority equity interest in a legally separate organization and to improve the relevance of financial statement information for certain component units. The City is implementing this statement for possible future application to equity holdings. There was no impact to these financial statements as a result of implementing this standard. C. GOVERNMENT-WIDE AND FUND FINANCIAL STATEMENTS The government-wide financial statements (i.e., the statement of net position and the statement of activities) report information on all of the non-fiduciary activities of the primary government and its component units. For the most part, the effect of interfund activity has been removed from these statements. Governmental activities, which normally are supported by taxes and intergovernmental revenues, are reported separately from business-type activities, which rely to a significant extent on fees and charges for support. Likewise, the primary government is reported separately from certain legally separate component units for which the primary government is financially accountable. The statement of activities demonstrates the degree to which the direct expenses of a given function or program are offset by program revenues. Direct expenses are those that are clearly identifiable with a specific function or program. Additionally, the City’s cost allocation plan allocates a portion of costs to individual functions. These costs reduce the total costs of the function or program providing the service while being included as part of the program expenses reported for the various functional activities that benefit from these services. Program revenues include 1) charges to customers or applicants who purchase, use, or directly benefit from goods, services, or privileges provided by a given function or segment and 2) grants and contributions that are restricted to meeting the operational or capital requirements of a particular function or segment. Taxes and other items not properly included among program revenues are reported as general revenues. Separate fund financial statements are provided for governmental funds, proprietary funds, and fiduciary funds, even though the latter are excluded from the government-wide financial statements. Major individual governmental funds and major individual enterprise funds are reported as separate columns in the fund financial statements. D. MEASUREMENT FOCUS, BASIS OF ACCOUNTING, AND FINANCIAL STATEMENT PRESENTATION The government-wide financial statements are reported using the economic resources measurement focus and accrual basis of accounting, as are the proprietary fund and fiduciary fund financial statements. Revenues are recorded when earned and expenses are recorded when a liability is incurred, regardless of the timing of related cash flows. Property taxes are recognized as revenues in the year for which they are levied. Grants and similar items are recognized as revenue as soon as all eligibility requirements imposed by the provider have been met. Governmental fund financial statements are reported using the current financial resources measurement focus and the modified accrual basis of accounting. Revenues are recognized as soon as they are both measurable and available. Revenues are considered available when they are collectible within the current period or soon enough thereafter to pay liabilities of the current period. For this purpose, the City considers revenues available if they are collected within 60 days of the end of the current fiscal period. Expenditures generally are recorded when a liability is incurred, as under accrual accounting. However, debt service expenditures, as well as expenditures related to compensated absences and claims and judgments, are recorded only when payment is due.

CITY OF EVERETT FINANCIAL SECTION
PAGE 42 2019 COMPREHENSIVE ANNUAL FINANCIAL REPORT
Several major revenue sources associated with the current period are considered to be susceptible to accrual and so have been recognized as revenues of the current fiscal period. These major revenues include property taxes; business and occupation taxes; real estate excise taxes; sales tax; natural gas, telephone, and electric taxes; licenses; and interest. Only the portion of special assessment receivable due within the current fiscal period is considered susceptible to accrual as revenue of the current period. All other revenue items are considered measurable and available only when cash is received by the City. The City reports the following major governmental funds:
The general fund is the City’s operating fund. It accounts for all financial resources of the general government, except those required to be accounted for in another fund.
The bond redemption fund, which is a debt service fund, accounts for the activity and reserves associated with refunding and redemption of general government bonds. The major funding sources for this fund include the proceeds of refunding bond debt and transfers in from the general government. The major expenditures of this fund are for the redemption of debt.
The emergency medical services fund, which is a special revenue fund, accounts for the paramedic program funded by a special property tax levy passed by the citizens of Everett, and ambulance transport fees.
The City reports the following major proprietary funds:
The water and sewer utility fund accounts for the distribution and filtration of water, the collection and treatment of wastewater, the collection and treatment of sewage, and for surface water management.
The transit fund accounts for public transit transportation services, including van service for the elderly and persons with disabilities and a commute trip reduction program. The transit fund also accounts for the operation of Everett Station.
Additionally, the City reports the following fund types:
Internal service funds account for the City’s self-insured medical and chiropractic health benefits, general liability, workers’ compensation, and property insurance coverage, fleet management services, telecommunication services, and information technology services provided to other departments on a cost reimbursement basis.
Pension trust funds account for the activities of the police and fire pension funds, which accumulate resources for pension benefit payments and post-employment health care benefits to qualified public safety employees.
Custodial funds report fiduciary activities that are not held in a trust or equivalent arrangement that meets specific criteria. The City uses a custodial fund to account for the Downtown Business Improvement Area.
As a rule, the effect of interfund activity has been eliminated for the government-wide financial statements. Exceptions to this general rule are charges between the government’s water and sewer functions and various other functions of the government. Elimination of these charges would distort the direct costs and program revenues reported for the various functions concerned. Amounts reported as program revenues include 1) charges to customers, 2) operating grants and contributions, and 3) capital grants and contributions, including special assessments. Internally dedicated resources are reported as general revenues rather than program revenues. All taxes are considered general revenues. Proprietary funds distinguish operating revenues and expenses from nonoperating items. Operating revenues and expenses generally result from providing services and producing and delivering goods in connection with a proprietary fund’s principal ongoing operations. The principal operating revenues of the Utilities Fund, Solid Waste Utility Fund, Transit Fund, Parking Garage Fund, Golf Fund, and the internal service funds are charges to customers for sales and services. Operating expenses for enterprise funds and internal service funds include the cost of sales and services, administrative expenses, and depreciation on capital assets. All revenues and expenses not meeting this definition are reported as nonoperating revenues and expenses.
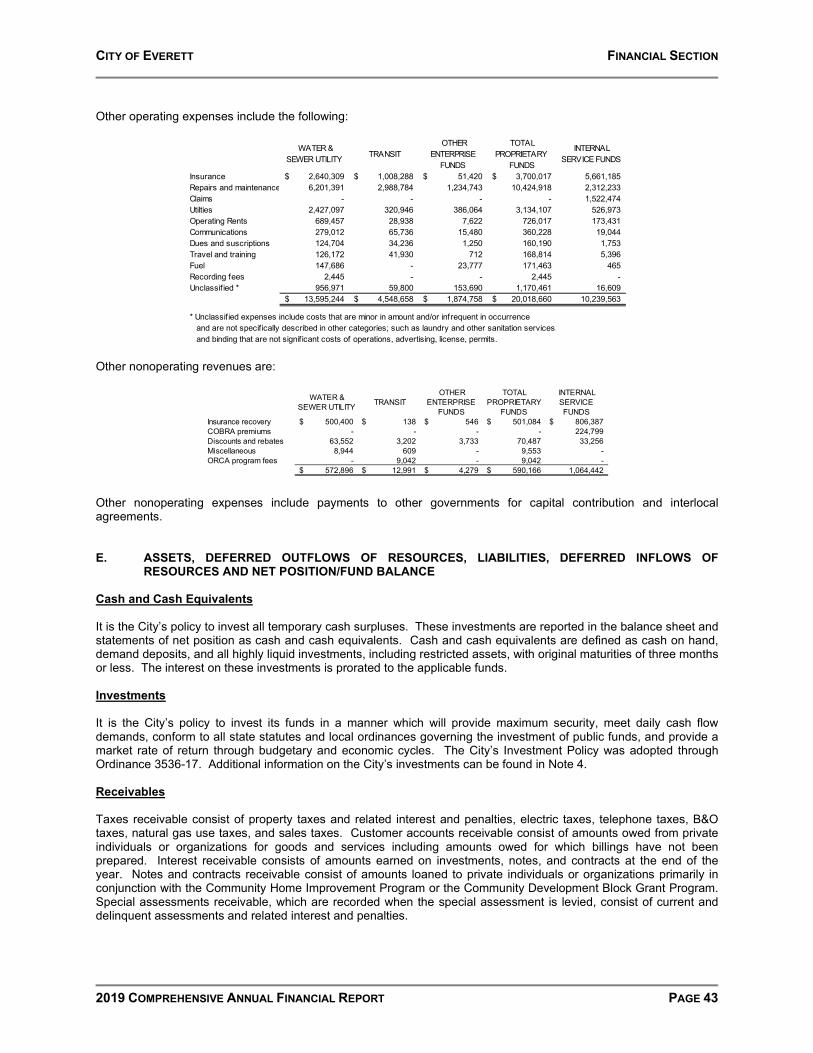
CITY OF EVERETT FINANCIAL SECTION
2019 COMPREHENSIVE ANNUAL FINANCIAL REPORT PAGE 43
Other operating expenses include the following:
WATER & SEWER UTILITY TRANSIT
OTHER ENTERPRISE
FUNDS
TOTAL PROPRIETARY
FUNDS
INTERNAL SERVICE FUNDS
Insurance 2,640,309$ 1,008,288$ 51,420$ 3,700,017$ 5,661,185 Repairs and maintenance 6,201,391 2,988,784 1,234,743 10,424,918 2,312,233 Claims - - - - 1,522,474 Utilties 2,427,097 320,946 386,064 3,134,107 526,973 Operating Rents 689,457 28,938 7,622 726,017 173,431 Communications 279,012 65,736 15,480 360,228 19,044 Dues and suscriptions 124,704 34,236 1,250 160,190 1,753 Travel and training 126,172 41,930 712 168,814 5,396 Fuel 147,686 - 23,777 171,463 465 Recording fees 2,445 - - 2,445 - Unclassif ied * 956,971 59,800 153,690 1,170,461 16,609
13,595,244$ 4,548,658$ 1,874,758$ 20,018,660$ 10,239,563
* Unclassif ied expenses include costs that are minor in amount and/or infrequent in occurrence and are not specif ically described in other categories; such as laundry and other sanitation services, and binding that are not signif icant costs of operations, advertising, license, permits.
Other nonoperating revenues are:
WATER & SEWER UTILITY TRANSIT
OTHER ENTERPRISE
FUNDS
TOTAL PROPRIETARY
FUNDS
INTERNAL SERVICE FUNDS
Insurance recovery 500,400$ 138$ 546$ 501,084$ 806,387$ COBRA premiums - - - - 224,799 Discounts and rebates 63,552 3,202 3,733 70,487 33,256 Miscellaneous 8,944 609 - 9,553 - ORCA program fees - 9,042 - 9,042 -
572,896$ 12,991$ 4,279$ 590,166$ 1,064,442
Other nonoperating expenses include payments to other governments for capital contribution and interlocal agreements. E. ASSETS, DEFERRED OUTFLOWS OF RESOURCES, LIABILITIES, DEFERRED INFLOWS OF
RESOURCES AND NET POSITION/FUND BALANCE Cash and Cash Equivalents It is the City’s policy to invest all temporary cash surpluses. These investments are reported in the balance sheet and statements of net position as cash and cash equivalents. Cash and cash equivalents are defined as cash on hand, demand deposits, and all highly liquid investments, including restricted assets, with original maturities of three months or less. The interest on these investments is prorated to the applicable funds. Investments It is the City’s policy to invest its funds in a manner which will provide maximum security, meet daily cash flow demands, conform to all state statutes and local ordinances governing the investment of public funds, and provide a market rate of return through budgetary and economic cycles. The City’s Investment Policy was adopted through Ordinance 3536-17. Additional information on the City’s investments can be found in Note 4. Receivables Taxes receivable consist of property taxes and related interest and penalties, electric taxes, telephone taxes, B&O taxes, natural gas use taxes, and sales taxes. Customer accounts receivable consist of amounts owed from private individuals or organizations for goods and services including amounts owed for which billings have not been prepared. Interest receivable consists of amounts earned on investments, notes, and contracts at the end of the year. Notes and contracts receivable consist of amounts loaned to private individuals or organizations primarily in conjunction with the Community Home Improvement Program or the Community Development Block Grant Program. Special assessments receivable, which are recorded when the special assessment is levied, consist of current and delinquent assessments and related interest and penalties.
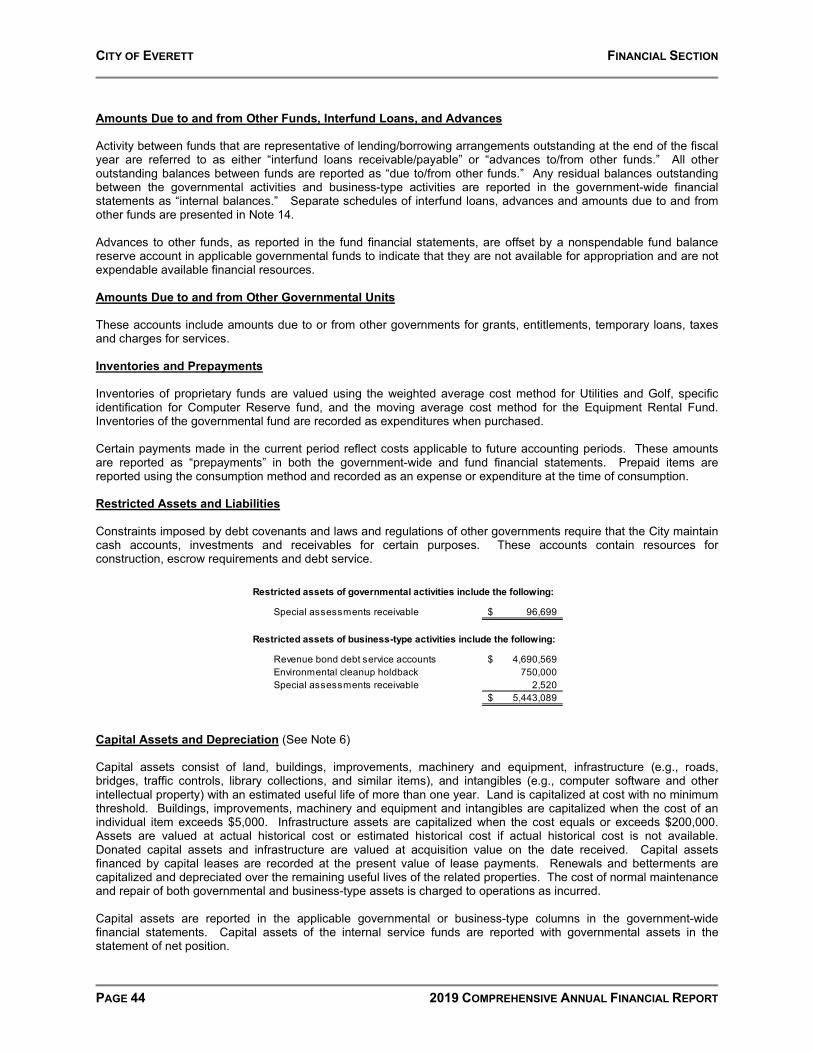
CITY OF EVERETT FINANCIAL SECTION
PAGE 44 2019 COMPREHENSIVE ANNUAL FINANCIAL REPORT
Amounts Due to and from Other Funds, Interfund Loans, and Advances Activity between funds that are representative of lending/borrowing arrangements outstanding at the end of the fiscal year are referred to as either “interfund loans receivable/payable” or “advances to/from other funds.” All other outstanding balances between funds are reported as “due to/from other funds.” Any residual balances outstanding between the governmental activities and business-type activities are reported in the government-wide financial statements as “internal balances.” Separate schedules of interfund loans, advances and amounts due to and from other funds are presented in Note 14. Advances to other funds, as reported in the fund financial statements, are offset by a nonspendable fund balance reserve account in applicable governmental funds to indicate that they are not available for appropriation and are not expendable available financial resources. Amounts Due to and from Other Governmental Units These accounts include amounts due to or from other governments for grants, entitlements, temporary loans, taxes and charges for services. Inventories and Prepayments Inventories of proprietary funds are valued using the weighted average cost method for Utilities and Golf, specific identification for Computer Reserve fund, and the moving average cost method for the Equipment Rental Fund. Inventories of the governmental fund are recorded as expenditures when purchased. Certain payments made in the current period reflect costs applicable to future accounting periods. These amounts are reported as “prepayments” in both the government-wide and fund financial statements. Prepaid items are reported using the consumption method and recorded as an expense or expenditure at the time of consumption. Restricted Assets and Liabilities Constraints imposed by debt covenants and laws and regulations of other governments require that the City maintain cash accounts, investments and receivables for certain purposes. These accounts contain resources for construction, escrow requirements and debt service.
Restricted assets of governmental activities include the following:
Special assessments receivable 96,699$
Restricted assets of business-type activities include the following:
Revenue bond debt service accounts 4,690,569$ Environmental cleanup holdback 750,000 Special assessments receivable 2,520
5,443,089$
Capital Assets and Depreciation (See Note 6) Capital assets consist of land, buildings, improvements, machinery and equipment, infrastructure (e.g., roads, bridges, traffic controls, library collections, and similar items), and intangibles (e.g., computer software and other intellectual property) with an estimated useful life of more than one year. Land is capitalized at cost with no minimum threshold. Buildings, improvements, machinery and equipment and intangibles are capitalized when the cost of an individual item exceeds $5,000. Infrastructure assets are capitalized when the cost equals or exceeds $200,000. Assets are valued at actual historical cost or estimated historical cost if actual historical cost is not available. Donated capital assets and infrastructure are valued at acquisition value on the date received. Capital assets financed by capital leases are recorded at the present value of lease payments. Renewals and betterments are capitalized and depreciated over the remaining useful lives of the related properties. The cost of normal maintenance and repair of both governmental and business-type assets is charged to operations as incurred. Capital assets are reported in the applicable governmental or business-type columns in the government-wide financial statements. Capital assets of the internal service funds are reported with governmental assets in the statement of net position.
CITY OF EVERETT FINANCIAL SECTION
2019 COMPREHENSIVE ANNUAL FINANCIAL REPORT PAGE 45
Annual depreciation is recorded as an expense of the related activity. Provision for depreciation is computed using the straight-line method over estimated service life as follows. Certain facts or circumstances of specific assets may require amortization over shorter or longer periods. Estimated Service Life Buildings 25-50 Years Improvements Other Than Buildings 5-50 Years Infrastructure 10-100 Years Machinery and Equipment 2-20 Years Intangibles 2-45 Years Compensated Absences It is the City’s policy to permit employees to accumulate earned but unused sick leave and vacation benefits. Employees may accumulate a maximum of between 960 and 1,176 hours of sick leave, depending upon the collective bargaining unit agreement or City ordinance that applies to them. Upon separation from City employment, eligible employees will be compensated between 0 and 588 hours of their sick leave balance, depending upon the applicable collective bargaining agreement or City ordinance. A long-term liability for a portion of accumulated sick leave is recorded in the government-wide and proprietary fund financial statements using the vesting method. A liability for these amounts is reported in governmental funds only if they have matured, for example, as a result of employee resignations or retirements. Eligible employees may accumulate a maximum of between 384 and 448 hours of vacation leave in accordance with the applicable collective bargaining agreement or City ordinance but may not accumulate more than two full years of earned vacation. At the time of retirement or separation from the City, eligible employees will be compensated for a maximum of 240 to 448 hours of their accrued vacation balance, again depending on the applicable collective bargaining agreement or City ordinance. All vacation pay is accrued when incurred in the government-wide and proprietary fund financial statements. A liability for these amounts is reported in governmental funds only if they have matured. Deferred Outflows/Inflows of Resources In addition to assets, the statement of net position reports a separate section for deferred outflows of resources. This represents a consumption of net position that applies to a future period(s) and will not be recognized as an outflow of resources (as either an expense or expenditure) until that period. The City has four items that qualify for reporting in the statement of net position: deferred loss on refunding, deferred outflow related to asset retirement obligations (ARO), deferred outflows related to pension, and deferred outflows related to other post-employment benefits (OPEB).
A deferred loss on refunding results from the difference in the carrying value of refunded debt and its reacquisition price. This amount is deferred and amortized over the shorter of the life of the refunded or refunding debt.
Deferred outflows related to ARO are amortized (expensed) over the useful life of the underlying asset. Deferred outflows related to pensions consist of contributions to the State of Washington pension plans from
July 1 to December 31 of the current fiscal year, the difference between expected and actual experience, changes in assumptions, and changes in proportionate share. Changes in proportionate share are deferred and amortized over the average remaining expected service lives of all employees in the plans. Deferred outflows also arise from the difference between projected and actual investment earnings on pension plan investments in the single-employer police and fire pension plans and are scheduled to amortize over five years.
Deferred outflows related to other post-employment benefits (OPEB) arise from the difference between projected and actual investment earnings on pension plan investments in the single-employer police and fire pension plans and are scheduled to amortize over five years.
In addition to liabilities, the statement of net position and balance sheet report a separate section for deferred inflows of resources. This represents an acquisition of net position that applies to a future period(s) and that will not be recognized as an inflow of resources (revenue) until that period.

CITY OF EVERETT FINANCIAL SECTION
PAGE 46 2019 COMPREHENSIVE ANNUAL FINANCIAL REPORT
The City has four items at the fund level that qualify for reporting in this category: (1) unavailable property taxes recorded as receivables, (2) unavailable special assessments recorded as non-current receivable, (3) unavailable interest revenue relating to loans, and (4) deferred inflows related to pensions. Items (1) – (3) are accrued at the entity-wide level and are no longer deferred inflows of resources.
At the entity-wide level, deferred inflows are related to pension in both the single-employer and state sponsored plans and to OPEB in the single-employer plans. Deferred inflows arise from differences between expected and actual experience, differences between projected and actual investment earnings on pension plan assets, changes of assumption, and changes in proportion and difference between contribution and proportionate share of contributions.
Pensions For purposes of measuring the net pension liability, deferred outflows of resources and deferred inflows of resources related to pensions, and pension expense, information about the fiduciary net position of the City’s proportionate share of all state sponsored pension plans in which the City participates (See Note 7) and additions to/deductions from those plans’ fiduciary net positions have been determined on the same basis as they are reported by the Washington State Department of Retirement Systems. For this purpose, benefit payments (including refunds of employee contributions) are recognized when due and payable in accordance with the benefit terms. Investments are reported at fair value. For purposes of measuring the net pension liability, deferred outflow of resources and deferred inflows of resources related to pensions, and pension expense, information about the fiduciary net position of the City’s Police and Fire pension plans and additions to/deductions from the plan fiduciary net positions have been determined on the same basis as they are reported by the plans. For this purpose, benefit payments are recognized when due and payable in accordance with the benefit terms. Investments are reported at fair value. Short-term Debt Debt with a term of one year or less at the time of issue is considered short-term debt. The City did not issue short-term debt during 2019. Long-term Debt In the fund financial statements of proprietary fund types and in the government-wide financial statements, long-term debt and other long-term obligations are reported as liabilities in the applicable governmental activities, business-type activities or proprietary fund type statement of net position. Bond premiums and discounts are deferred and amortized over the life of the bonds. Bonds payable are reported net of the applicable bond premium or discount. Bond insurance costs are reported as prepaid charges and amortized over the term of the related debt. In the fund financial statements, governmental fund types recognize bond premiums and discounts, as well as bond issuance costs, during the current period. The face amount of debt issued is reported as other financing sources. Premiums received on debt issuances are reported as other financing sources while discounts on debt issuances are reported as other financing uses. Issuance costs, whether withheld from the actual debt proceeds received or not, are reported as debt service expenditures. Detailed information on long-term debt outstanding at year-end is presented in Note 10 and Note 12. Other accrued liabilities These accounts include accrued employee benefits, customer deposits, and pollution remediation liabilities. Fund Balances The components for reporting the City’s governmental fund balances are nonspendable, restricted, committed, assigned and unassigned. Nonspendable fund balance cannot be spent because it is either not in spendable form, such as inventory or prepaid expense, or is legally or contractually required to remain intact. Restricted fund balance includes amounts of which the use is subject to constraints imposed by external parties, including creditors, grantors, and laws and regulations of other governments.
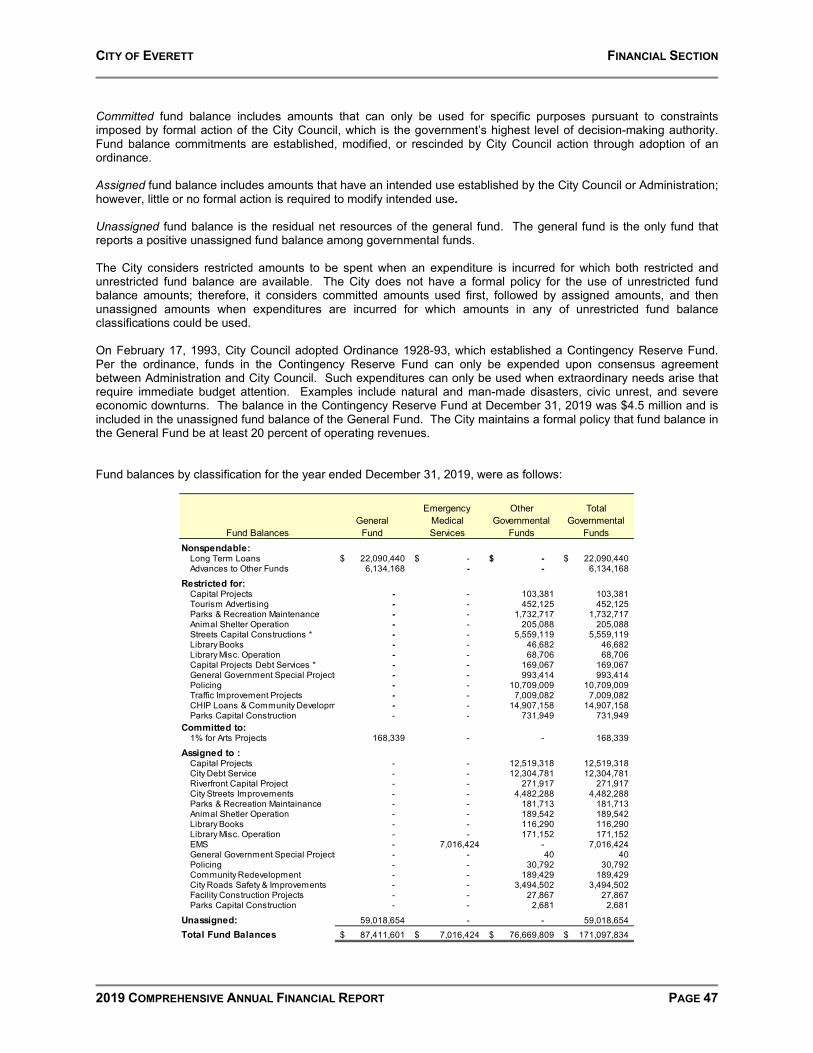
CITY OF EVERETT FINANCIAL SECTION
2019 COMPREHENSIVE ANNUAL FINANCIAL REPORT PAGE 47
Committed fund balance includes amounts that can only be used for specific purposes pursuant to constraints imposed by formal action of the City Council, which is the government’s highest level of decision-making authority. Fund balance commitments are established, modified, or rescinded by City Council action through adoption of an ordinance. Assigned fund balance includes amounts that have an intended use established by the City Council or Administration; however, little or no formal action is required to modify intended use. Unassigned fund balance is the residual net resources of the general fund. The general fund is the only fund that reports a positive unassigned fund balance among governmental funds. The City considers restricted amounts to be spent when an expenditure is incurred for which both restricted and unrestricted fund balance are available. The City does not have a formal policy for the use of unrestricted fund balance amounts; therefore, it considers committed amounts used first, followed by assigned amounts, and then unassigned amounts when expenditures are incurred for which amounts in any of unrestricted fund balance classifications could be used. On February 17, 1993, City Council adopted Ordinance 1928-93, which established a Contingency Reserve Fund. Per the ordinance, funds in the Contingency Reserve Fund can only be expended upon consensus agreement between Administration and City Council. Such expenditures can only be used when extraordinary needs arise that require immediate budget attention. Examples include natural and man-made disasters, civic unrest, and severe economic downturns. The balance in the Contingency Reserve Fund at December 31, 2019 was $4.5 million and is included in the unassigned fund balance of the General Fund. The City maintains a formal policy that fund balance in the General Fund be at least 20 percent of operating revenues. Fund balances by classification for the year ended December 31, 2019, were as follows:
Fund BalancesGeneral
Fund
Emergency Medical Services
Other Governmental
Funds
TotalGovernmental
FundsNonspendable:
Long Term Loans 22,090,440$ -$ -$ 22,090,440$ Advances to Other Funds 6,134,168 - - 6,134,168
Restricted for:Capital Projects - - 103,381 103,381 Tourism Advertising - - 452,125 452,125 Parks & Recreation Maintenance - - 1,732,717 1,732,717 Animal Shelter Operation - - 205,088 205,088 Streets Capital Constructions * - - 5,559,119 5,559,119 Library Books - - 46,682 46,682 Library Misc. Operation - - 68,706 68,706 Capital Projects Debt Services * - - 169,067 169,067 General Government Special Projects - - 993,414 993,414 Policing - - 10,709,009 10,709,009 Traffic Improvement Projects - - 7,009,082 7,009,082 CHIP Loans & Community Developm - - 14,907,158 14,907,158 Parks Capital Construction - - 731,949 731,949
Committed to:1% for Arts Projects 168,339 - - 168,339
Assigned to :Capital Projects - - 12,519,318 12,519,318 City Debt Service - - 12,304,781 12,304,781 Riverfront Capital Project - - 271,917 271,917 City Streets Improvements - - 4,482,288 4,482,288 Parks & Recreation Maintainance - - 181,713 181,713 Animal Shetler Operation - - 189,542 189,542 Library Books - - 116,290 116,290 Library Misc. Operation - - 171,152 171,152 EMS - 7,016,424 - 7,016,424 General Government Special Projects - - 40 40 Policing - - 30,792 30,792 Community Redevelopment - - 189,429 189,429 City Roads Safety & Improvements - - 3,494,502 3,494,502 Facility Construction Projects - - 27,867 27,867 Parks Capital Construction - - 2,681 2,681
Unassigned: 59,018,654 - - 59,018,654 Total Fund Balances 87,411,601$ 7,016,424$ 76,669,809$ 171,097,834$

CITY OF EVERETT FINANCIAL SECTION
PAGE 48 2019 COMPREHENSIVE ANNUAL FINANCIAL REPORT
NOTE 2 - RECONCILIATION OF GOVERNMENT-WIDE AND FUND FINANCIAL STATEMENTS
• Explanation of certain differences between the governmental fund balance sheet and the government-
wide statement of net position. The governmental funds balance sheet includes reconciliation between Total Fund Balances – Governmental Funds and Total Net Position-Governmental Activities as reported in the government-wide statement of net position. Certain items in the reconciliation are a combination of items reported at net. These items are detailed as follows:
Capital assets not reported in total governmental funds: Cost of capital assets 537,205,925$ Accumulated depreciation (179,061,171)
Net adjustment to increase total fund balances of governmental funds to arrive at net position of governmental activities. 358,144,754$
Long-term debt not reported in total governmental funds: Bonds payable (30,443,901)$ Compensated absences accrued (14,054,570) Unamortized balance of bond premiums (4,799,634) Accrued interest payable (45,062)
Net adjustment to reduce total fund balances of government funds to arrive at net position of governmental activities (49,343,167)$
Amounts related to Police and Fire pension benefit:Police pension asset and deferred outflows 256,212$ Police OPEB liability and deferred outflows (22,168,942) Fire pension asset and deferred outflows 607,244 Fire OPEB liability and deferred outflows (26,250,299)
Net adjustment to reduce total fund balances of governmental funds to arrive at net position of governmental activities. (47,555,785)$
Internal service funds reported separately with business-type funds: Internal service funds - total fund equity 11,033,419$ Amount allocated to internal balances - business-type activities 616,988
Net adjustment to increase total fund balances of governmental funds to arrive at net position of governmental activities. 11,650,407$

CITY OF EVERETT FINANCIAL SECTION
2019 COMPREHENSIVE ANNUAL FINANCIAL REPORT PAGE 49
• Explanation of certain differences between the governmental fund statement of revenues, expenditures, and changes in fund balances and the government-wide statement of activities.
The governmental fund statement of revenues, expenditures, and changes in fund balances includes reconciliation between the Net changes in fund balances (Total Governmental Funds) and the Change in net position as reported in the government-wide Statement of Activities. Certain items in the reconciliation are a combination of items reported at net. These items are detailed as follows:
The net effect of various miscellaneous transactions involving capital assets: Book value of disposed assets:
Cost of government-type capital assets disposed (7,610,548)$ Accumulated depreciation of disposed assets 7,557,173 Assets transferred from internal service to governmental funds (13,701)
Book value of property transferred from governmental to business-type funds (1,239,328) Net adjustment to increase (reduce) net change in fund balances-total governmental funds to arrive at change in net position of governmental activities (1,306,404)$
The amount by which depreciation exceeds capital outlays in the current period: Expenditures that are capitalized 24,499,480$
Current depreciation expense (11,285,775)
Fair value of assets received from private development 41,558
Fair value of assets received from private contribution 726,400
Fair value of assets recevied form another governmental unit 1,644,800
Net adjustment to increase (reduce) net change in fund balance-total governmental funds to arrive at change in net position of governmental activities 15,626,463$
The net effect of the differences in the treatment of long-term debt and related items: Proceeds of long-term debt (24,376,965)$ Principal payments on long-term debt 26,564,732$ Decrease (increase) in interest payable 3,729 Amortization of bond premium 70,381
Net adjustment to increase (reduce) net change in fund balances-total governmental funds to arrive at change in net position of governmental activities 2,261,877$
The net effect of the differences in the treatment of Police and Fire pension benefits:Police pension expenses (132,869)$ Police OPEB expenses (3,266,082) Fire pension expenses (251,240) Fire OPEB expenses (369,073)
Net adjustment to increase (reduce) net change in fund balances-total governmental funds to arrive at change in net position of governmental activities (4,019,264)$
The net revenue (expense) of certain activities of internal service funds: Interest revenue allocated from internal service funds to governmental activities 336,726$ Net expense allocated from internal service funds to governmental activities 508,127 Interfund transfers out 55,822
Net adjustment to reduce net change in fund balances-total governmental funds to arrive at change in net position of governmental activities 900,675$

CITY OF EVERETT FINANCIAL SECTION
PAGE 50 2019 COMPREHENSIVE ANNUAL FINANCIAL REPORT
NOTE 3 - STEWARDSHIP, COMPLIANCE AND ACCOUNTABILITY
Budget Scope of Budget Annual appropriated budgets are adopted for the general fund, special revenue funds, and debt service funds, on a basis consistent with generally accepted accounting principles. Budget-to-actual comparison schedules are presented for these funds. Annual appropriated budgets are also adopted for the proprietary funds; however, they are “management budgets” and are not required to be presented in these statements. Budgets for capital project funds are adopted at the individual-project level and for fiscal periods that correspond to the projects. Because these funds are not budgeted on an annual basis, budgetary comparisons are not presented. Legal budgetary control is established at the fund level. Subsidiary revenue and expenditure ledgers are used to compare the budgeted amounts with actual revenues and expenditures. As a management control device, the subsidiary ledgers are used to monitor expenditures for individual functions and activities by object class. Annual appropriations for all operating funds lapse at year-end. Amending the Budget The Mayor is authorized to transfer appropriations between programs within any fund; however, any revisions that alter the total expenditures of a fund must be approved by the City Council. When City Council determines that it is in the best interest of the City to increase or decrease the appropriation for a particular fund, it may do so by ordinance approved by one more than the majority after holding public hearings. The budget was amended by ordinance three times in 2019. The financial statements contain the original and final budget information. The original budget is the first complete appropriated budget. The final budget is the original budget adjusted by all reserves, transfers, allocations, supplemental appropriations, and other legally authorized changes. Compliance
As of December 31, 2019, the following funds reported deficits in fund balance or net position:
Fund 440 – Golf Fund had a deficit net position of $4,236,154. To eliminate the deficit, the City continues elements of its business plan to increase revenue and decrease expenses. Fund 507 – Telecommunications Fund had a deficit net position of $1,126,022. The deficit was due to applying the accounting principle changes of GASB 68. Future increase of interfund assessments should help in eliminating this deficit.
There were no other material violations of finance-related legal or contractual provisions in any of the funds of the City.

CITY OF EVERETT FINANCIAL SECTION
2019 COMPREHENSIVE ANNUAL FINANCIAL REPORT PAGE 51
NOTE 4 – DEPOSITS AND INVESTMENTS
Deposits The City’s deposits and certificates of deposit are entirely covered by the Federal Depository Insurance Corporation (FDIC) or by collateral held in a multiple financial institution collateral pool administered by the Washington Public Deposit Protection Commission (PDPC). Investments All investments of the City’s funds are obligations of the U.S. Government, U.S. agency issues, the State of Washington Local Government Investment Pool, or deposits with Washington State Banks that are approved by the Washington State Protection Commission (PDPC) to accept public funds. U.S. Agency and U.S. Treasury Securities classified in Level 2 are valued by the City’s custodian, Wells Fargo, using quoted prices for similar securities and interest rates. The City is a participant in the Local Government Investment Pool, The LGIP was created by Chapter 294, Laws of 1986 and began operations in July 1986. The LGIP is a short-term investment pool of the state of Washington, available to eligible governmental entities as defined by Revised Code of Washington (RCW) 43.250.020. Participation is voluntary. The LGIP is managed and operated by the Office of the State Treasurer (OST). The State Finance Committee is the administrator of the statute that created the pool and adopts appropriate rules. The State Treasurer is responsible for establishing the investment policy for the pool and reviews the policy annually. Any proposed changes are reviewed by the LGIP Advisory Committee. The terms of the policy are designed to ensure the safety and liquidity of the funds deposited in the LGIP. The State Treasurer and designated investment officers adhere to all restrictions on the investment of funds established by law and policy. The LGIP portfolio is invested in a manner that meets the maturity, quality, diversification and liquidity requirements set forth by the GASB for external investment pools that elect to measure, for financial reporting purposes, investments at amortized cost. The funds are limited to high quality obligations with regulated maximum and average maturities, the effect of which is to minimize both market and credit risk. The LGIP does not have any legally binding guarantees of share value. The LGIP transacts with its participants at a stable net asset value per share of $1.00, the same method used for reporting. Participants may contribute and withdraw funds on a daily basis. The LGIP does not impose liquidity fees or redemption gates on participant withdrawals. The Office of the State Treasurer prepares a stand-alone LGIP financial report. A copy of the report is available from the Office of the State Treasurer, PO Box 40200, Olympia, Washington 98504-0200, online at http://www.tre.wa.gov. The LEOFF 1 Police and Fire Pension funds are invested by RBC Wealth Management. Investment earnings and redemptions are temporarily placed in the RBC in the RBC Insured Deposits account until reinvested in Treasury or Agency bonds. The RBC Insured Deposits fund places investments in Federal Deposit Insurance Corporation (FDIC) -insured banks offering up to $5,000,000 in FDIC-insurance coverage. Deposits in excess of $5,000,000 are temporarily placed in the RBC U.S. Government Money Market Fund, which consists of securities backed by the US government and are covered by Securities Investor Protection Corporation (SIPC) and Excess SIPC. Interest Rate Risk Interest rate risk is the risk that changes in interest rates of debt instruments will adversely affect the fair value of an investment. To mitigate the effect of interest rate risk, the portfolio is invested in high quality, highly liquid obligations with limited maximum and average maturities. The City’s Investment Policy limits the effective duration of the portfolio to a maximum of five, and the maximum maturity of any investment to 10 years. The LGIP is a short-term investment pool. To provide for safety and liquidity of funds, the LGIP consists of only those high quality, short-term instruments authorized by statute. Investments are restricted to fixed rate securities that mature in 397 days or less, except for securities utilized in repurchase agreements and U.S. government and supranational floating or variable rate securities which may have a maximum maturity of 762 days, provided they have reset dates within one year and that on any reset date can reasonably be expected to have a fair value that approximates their amortized cost. The portfolio’s weighted average maturity (WAM) will not exceed 60 days, and a weighted average life (WAL) will not exceed 120 days.

CITY OF EVERETT FINANCIAL SECTION
PAGE 52 2019 COMPREHENSIVE ANNUAL FINANCIAL REPORT
The following schedule presents the investments and related maturities as of fiscal year end.
Fair Value Hierarchy Securities classified as Level 1 in the fair value hierarchy are valued using prices quoted in active markets for identical securities, Level 2 securities are valued using observable inputs, and Level 3 securities are valued using unobservable inputs. U.S. Agency and U.S. Treasury Securities classified in Level 2 are valued by the City’s custodian, Wells Fargo, using quoted prices for similar securities and interest rates. Wells Fargo’s primary vendor source is Interactive Data (IDC). The pricing methodology includes obtaining feeds from a number of live data sources, including active market makers and inter-dealer brokers. Sources are reviewed based on their historical accuracy for individual issues and maturity ranges. Secondary vendor sources include Bloomberg, Pricing Direct, and Thomson Reuters. The level of fair value measurement is based on the lowest level of significant input for the security type in its entirety. There are no Level 1 or Level 3 security classifications to report. LGIP investments and RBC deposits are stated at amortized cost which approximates fair value. For bank deposits and repurchase agreements, the cost-based measure equals their carrying amount. Monthly, the fair value net asset value per share is calculated and compared to the amortized cost net asset value per share to verify that the LGIP’s shadow price does not deviate by more than one half of 1 percent from the amortized cost of the portfolio.
Investment Type Fair Value Less than 1 1 - 5 Over 5 yearsU.S. Agency Securities - Primary Gov't 162,498,963$ 18,002,860$ 85,675,982$ 58,820,121$ U.S. Agency Securities - Pension 38,383,842 5,969,035$ 27,156,266 5,258,541 U.S. Treasuries - Pension 2,125,514 - 1,567,973 557,541 Total Investments 203,008,318$ 23,971,895$ 114,400,221$ 64,636,203$
Deposits Amortized Cost Less than 1 1 - 5 Over 5 yearsLGIP 80,822,888$ 80,822,888$ RBC Deposit 813,290 813,290 Total Deposits 81,636,179$ 81,636,179$
Total 284,644,497$ 105,608,073$ 114,400,221$ 64,636,203$
Maturity (in Years)
Maturity (in Years)
Investments by Fair Value Total
Quoted Prices in Active Markets
for Identical Assets
(Level 1)
Significant Other Observable
Inputs (Level 2)
Significant Unobservable
Inputs (Level 3)
DescriptionFAMCA 3,556,621$ -$ $ 3,556,621 -$ FFCB 66,675,717 - 66,675,717 - FHLB 51,014,949 - 51,014,949 - FHLMC 31,253,085 - 31,253,085 - FNMA 9,998,590 - 9,998,590 - Total - Primary Gov't 162,498,963$ -$ 162,498,963$ -$
DescriptionFFCB 9,460,498$ -$ 9,460,498$ -$ FHLB 9,717,248 - 9,717,248 - FHLMC 9,634,658 - 9,634,658 - FNMA 9,571,438 - 9,571,438 - U.S. Treasuries 2,125,513 2,125,513 Total - LEOFF 1 Pension 40,509,355$ -$ 40,509,355$ -$
DepositsLGIP 80,822,888$ RBC Deposit 813,290 Total Deposits 81,636,179$
Total By Fair Value 284,644,497$

CITY OF EVERETT FINANCIAL SECTION
2019 COMPREHENSIVE ANNUAL FINANCIAL REPORT PAGE 53
Credit Risk Safety of principal is the foremost objective of the City’s investment program. City investments are undertaken in a conservative manner that seeks to ensure the preservation of the portfolio’s capital. The City holds investments in Government Agencies, all of which hold AA+ ratings from Standard & Poor’s and Aaa from Moody’s Investor Services. Concentration of Credit Risk Concentration of credit risk is the risk of loss attributed to the magnitude of a government’s investment in a single issuer. The City mitigates concentration of credit risk by limiting the purchase of securities of any one issuer, with the exception of U.S. Treasury and the Local Government Investment Pool as follows:
At December 31, 2019, U.S. Agencies comprised 71 percent of the City’s portfolio, including Federal Farm Credit Bureau (27 percent), Federal Home Loan Bank (21 percent), Federal Home Loan Mortgage Corporation (14 percent), and Federal National Mortgage Association (7 percent). In addition, 28 percent of the portfolio was in the LGIP. Custodial Credit Risk Custodial credit risk is the risk that, in the event a depository institution or counterparty fails, the City will not be able to recover the value of its deposits, investments or collateral securities that are in the possession of an outside party. Investments held as deposits in financial institutions are insured by the Federal Deposit Insurance Corporation and/or collateralized. Collateral protection is administered by the Washington Public Deposit Protection Commission (PDPC). The PDPC, created by the Legislature per Chapter 39.58 of the Revised Code of Washington, constitutes a multiple financial institution collateral pool comprised of securities pledged to secure uninsured public deposits. Pledged securities are held by the PDPC’s agent in the name of the collateral pool. The City’s investment policy requires that securities purchased be held by a custodian, acting as an independent third party, in its safekeeping or trust department. Interest Allocation Interest earnings are distributed monthly among funds based on average cash balances. However, in certain cases where a fund’s resources derive from another fund, investment income is reported in the fund that is providing the resources rather than the fund that reports the underlying investment. These special distributions include the following:
Fund Reporting Investment Fund Receiving Investment IncomeFund 115 - Special Projects Fund 002 - General FundFund 160 - Rainy Day Fund Fund 002 - General FundFund 162 - Capital Improvement Fund - CIP 4 Fund 002 - General FundFund 342 – City Facilities Construction Fund Fund 002 - General FundFund 354 – Parks CIP 3 Construction Fund Fund 154 – Real Estate Excise Tax Fund
Maximum Holdings Maximum HoldingsPortfolio Issuer
U.S. Treasury Notes, Bonds or Certificates 100% N/A
Government Sponsored Enterprises 90% 40%Investment Deposits 20% 10%Certificates of Deposit 20% 10%Bankers Acceptances 20% 5%Repurchase Agreements 20% 10%Washington State Bonds 20% N/ALocal Government Bonds 20% 5%LGIP 100% N/ACommercial Paper 10% 5%
Issuer Type
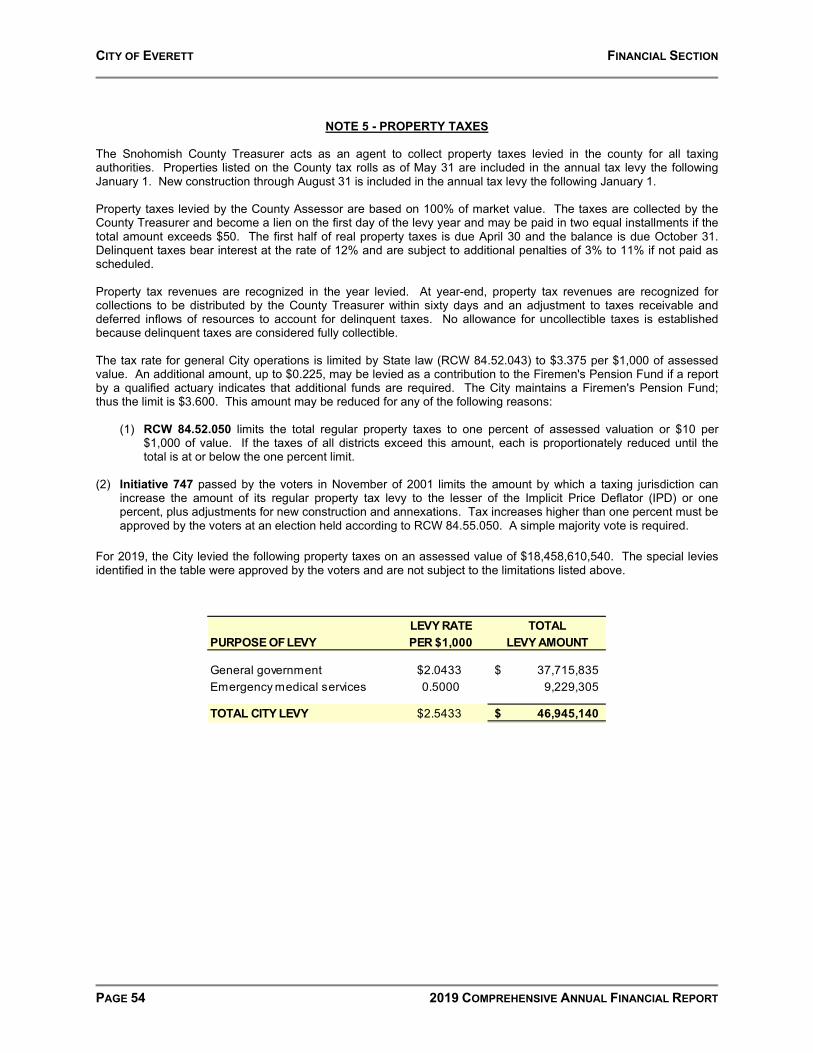
CITY OF EVERETT FINANCIAL SECTION
PAGE 54 2019 COMPREHENSIVE ANNUAL FINANCIAL REPORT
NOTE 5 - PROPERTY TAXES The Snohomish County Treasurer acts as an agent to collect property taxes levied in the county for all taxing authorities. Properties listed on the County tax rolls as of May 31 are included in the annual tax levy the following January 1. New construction through August 31 is included in the annual tax levy the following January 1. Property taxes levied by the County Assessor are based on 100% of market value. The taxes are collected by the County Treasurer and become a lien on the first day of the levy year and may be paid in two equal installments if the total amount exceeds $50. The first half of real property taxes is due April 30 and the balance is due October 31. Delinquent taxes bear interest at the rate of 12% and are subject to additional penalties of 3% to 11% if not paid as scheduled. Property tax revenues are recognized in the year levied. At year-end, property tax revenues are recognized for collections to be distributed by the County Treasurer within sixty days and an adjustment to taxes receivable and deferred inflows of resources to account for delinquent taxes. No allowance for uncollectible taxes is established because delinquent taxes are considered fully collectible. The tax rate for general City operations is limited by State law (RCW 84.52.043) to $3.375 per $1,000 of assessed value. An additional amount, up to $0.225, may be levied as a contribution to the Firemen's Pension Fund if a report by a qualified actuary indicates that additional funds are required. The City maintains a Firemen's Pension Fund; thus the limit is $3.600. This amount may be reduced for any of the following reasons:
(1) RCW 84.52.050 limits the total regular property taxes to one percent of assessed valuation or $10 per $1,000 of value. If the taxes of all districts exceed this amount, each is proportionately reduced until the total is at or below the one percent limit.
(2) Initiative 747 passed by the voters in November of 2001 limits the amount by which a taxing jurisdiction can
increase the amount of its regular property tax levy to the lesser of the Implicit Price Deflator (IPD) or one percent, plus adjustments for new construction and annexations. Tax increases higher than one percent must be approved by the voters at an election held according to RCW 84.55.050. A simple majority vote is required.
For 2019, the City levied the following property taxes on an assessed value of $18,458,610,540. The special levies identified in the table were approved by the voters and are not subject to the limitations listed above.
LEVY RATE TOTALPURPOSE OF LEVY PER $1,000 LEVY AMOUNT
General government $2.0433 37,715,835$ Emergency medical services 0.5000 9,229,305
TOTAL CITY LEVY $2.5433 46,945,140$

CITY OF EVERETT FINANCIAL SECTION
2019 COMPREHENSIVE ANNUAL FINANCIAL REPORT PAGE 55
NOTE 6 - CAPITAL ASSETS AND DEPRECIATION A summary of changes in governmental capital assets appears as follows:
BEGINNING ENDINGBALANCE BALANCE
GOVERNMENTAL ACTIVITIES 01/01/19 ADDITIONS TRANSFERS DELETIONS 12/31/19
Capital assets, not being depreciated or amortized: Land 60,409,823$ 726,400$ (1,203,878)$ -$ 59,932,345$ Construction in progress* 4,685,810 19,231,949 (7,336,521) (784,205) 15,797,033
Total capital assets, not being depreciated or amortized 65,095,633 19,958,349 (8,540,399) (784,205) 75,729,378
Capital assets, being depreciated or amortized: Buildings 103,074,966 - 6,325,309 - 109,400,275 Improvements other than buildings 43,094,878 95,154 438,330 - 43,628,362 Infrastructure 274,804,877 2,142,350 537,432 (4,683,029) 272,801,630 Machinery and equipment 36,983,775 5,836,449 (31,606) (3,074,965) 39,713,653 Intangibles 1,331,498 66,940 - - 1,398,438 Total capital assets being depreciated or amortized 459,289,994 8,140,893 7,269,465 (7,757,994) 466,942,358
Less accumulated depreciation or amortization for: Buildings (44,939,439) (2,440,390) - - (47,379,829) Improvements other than buildings (25,077,007) (1,378,754) - - (26,455,761) Infrastructure (85,887,691) (5,757,828) - 4,683,029 (86,962,490) Machinery and equipment (22,192,311) (2,044,636) 17,905 3,021,588 (21,197,454) Intangibles (1,124,487) (99,723) - - (1,224,210) Total accumulated depreciation and amortization (179,220,935) (11,721,331) 17,905 7,704,617 (183,219,744)
Total capital assets being depreciated or amortized, net 280,069,059 (3,580,438) 7,287,370 (53,377) 283,722,614
Governmental activities capital assets, net 345,164,692$ 16,377,911$ (1,253,029)$ (837,582)$ 359,451,992$
* The deletion of construction in progress costs of $784,205 in governmental activities represents project costs that did not result in a capital asset and that were expensed in the current year. A summary of changes in business-type capital assets appears as follows:
BEGINNING ENDINGBALANCE BALANCE
BUSINESS-TYPE ACTIVITIES 01/01/19 ADDITIONS TRANSFERS DELETIONS 12/31/19
Capital assets, not being depreciated: Land 37,983,353$ 512,300$ 6,919,662$ -$ 45,415,315$ Construction in progress* 27,613,376 34,847,025 (30,183,279) (682,665) 31,594,457 Total capital assets, not being depreciated 65,596,729 35,359,325 (23,263,617) (682,665) 77,009,772
Capital assets, being depreciated Buildings 242,415,591 - - - 242,415,591 Improvements other than buildings 611,773,140 214,074 21,611,746 - 633,598,960 Infrastructure 2,118,141 - 2,891,199 - 5,009,340 Machinery and equipment 46,550,271 4,915,513 31,606 (2,739,466) 48,757,924 Intangibles 16,201,205 - - (7,493) 16,193,712 Total capital assets being depreciated 919,058,348 5,129,587 24,534,551 (2,746,959) 945,975,527
Less accumulated depreciation for: Buildings (84,769,305) (4,874,644) - - (89,643,949) Improvements other than buildings (210,185,415) (12,854,742) - - (223,040,157) Infrastructure (671,126) (105,907) - - (777,033) Machinery and equipment (27,648,513) (2,787,552) (17,905) 2,716,489 (27,737,481) Intangibles (7,034,561) (259,145) - 7,493 (7,286,213) Total accumulated depreciation (330,308,920) (20,881,990) (17,905) 2,723,982 (348,484,833)
Total assets being depreciated, net 588,749,428 (15,752,403) 24,516,646 (22,977) 597,490,694
Business-type activities capital assets, net 654,346,157$ 19,606,922$ 1,253,029$ (705,642)$ 674,500,466$

CITY OF EVERETT FINANCIAL SECTION
PAGE 56 2019 COMPREHENSIVE ANNUAL FINANCIAL REPORT
* The deletion of construction in progress costs of $682,665 in business-type activities represents project costs that did not result in a capital asset and that were expensed in the current year. Depreciation expense was charged to functions/programs of the primary government as follows:
GOVERNMENTAL ACTIVITIESGeneral government services 520,754$ Police 858,574 Fire 869,080 Engineering & construction services 100,599 Transportation 5,494,643 Community services 362,002 Library 728,300 Culture and recreation 2,328,742 Judicial 175,700 Internal service allocated to business-type activities 282,936
Total depreciation - governmental activities 11,721,330$
BUSINESS-TYPE ACTIVITIESWater 7,562,569$ Sewer 9,557,185 Solid waste 484,326 Parking 12,503 Transit 3,317,815 Golf 230,530 Internal service allocated to business-type activities (282,936) Total depreciation - business-type activities 20,881,992$
Total depreciation - all activities 32,603,322$

CITY OF EVERETT FINANCIAL SECTION
2019 COMPREHENSIVE ANNUAL FINANCIAL REPORT PAGE 57
NOTE 7 - PENSION PLANS
The following table represents the aggregate pension amounts for all plans for the year 2019:
Pension liabilities (22,739,590)$ Pension assets 38,637,901$ Deferred outlfows of resources 10,549,262$ Deferred inflows of resources (24,934,315)$ Pension expense/expenditures 1,570,770$
Aggregate Pension Amounts - All Plans
STATE SPONSORED PENSION PLANS Substantially all City’s full-time and qualifying part-time employees participate in one of the following statewide retirement systems administered by the Washington State Department of Retirement Systems, under cost-sharing, multiple-employer public employee defined benefit and defined contribution retirement plans. The state legislature establishes and amends laws pertaining to the creation and administration of all public retirement systems. The Department of Retirement Systems (DRS), a department within the primary government of the State of Washington, issues a publicly available comprehensive annual financial report (CAFR) that includes financial statements and required supplementary information for each plan. The DRS CAFR may be obtained by writing to: Department of Retirement Systems Communications Unit P.O. Box 48380 Olympia, WA 98540-8380 Or the DRS CAFR may be downloaded from the DRS website at www.drs.wa.gov. Public Employees’ Retirement System (PERS) PERS members include elected officials; state employees; employees of the Supreme, Appeals and Superior Courts; employees of the legislature; employees of district and municipal courts; employees of local governments; and higher education employees not participating in higher education retirement programs. PERS is comprised of three separate pension plans for membership purposes. PERS plans 1 and 2 are defined benefit plans, and PERS plan 3 is a defined benefit plan with a defined contribution component. PERS Plan 1 provides retirement, disability and death benefits. Retirement benefits are determined as two percent of the member’s average final compensation (AFC) times the member’s years of service. The AFC is the average of the member’s 24 highest consecutive service months. Members are eligible for retirement from active status at any age with at least 30 years of service, at age 55 with at least 25 years of service, or at age 60 with at least five years of service. Members retiring from active status prior to the age of 65 may receive actuarially reduced benefits. Retirement benefits are actuarially reduced to reflect the choice of a survivor benefit. Other benefits include duty and non-duty disability payments, an optional cost-of-living adjustment (COLA), and a one-time duty-related death benefit, if found eligible by the Department of Labor and Industries. PERS 1 members were vested after the completion of five years of eligible service. The plan was closed to new entrants on September 30, 1977. Contributions The PERS Plan 1 member contribution rate is established by State statute at 6 percent. The employer contribution rate is developed by the Office of the State Actuary and includes an administrative expense component that is currently set at 0.18 percent. Each biennium, the state Pension Funding Council adopts Plan 1 employer contribution rates. The PERS Plan 1 required contribution rates (expressed as a percentage of covered payroll) for 2019 were as follows:
PERS Plan 1 Actual Contribution Rates Employer Employee* January – June 2019

CITY OF EVERETT FINANCIAL SECTION
PAGE 58 2019 COMPREHENSIVE ANNUAL FINANCIAL REPORT
PERS Plan 1 7.52% 6.00% PERS Plan 1 UAAL 5.13% Administrative Fee 0.18%
Total 12.83% 6.00% July – December 2019 PERS Plan 1 7.92% 6.00% PERS Plan 1 UAAL 4.76% Administrative Fee 0.18%
Total 12.86% 6.00%
* For employees participating in Judicial Benefit Multiplier Program (JBM), the contribution rate was 12.26%. PERS Plan 2/3 provides retirement, disability and death benefits. Retirement benefits are determined as two percent of the member’s average final compensation (AFC) times the member’s years of service for Plan 2 and 1 percent of AFC for Plan 3. The AFC is the average of the member’s 60 highest-paid consecutive service months. There is no cap on years of service credit. Members are eligible for retirement with a full benefit at 65 with at least five years of service credit. Retirement before age 65 is considered an early retirement. PERS Plan 2/3 members who have at least 20 years of service credit and are 55 years of age or older, are eligible for early retirement with a benefit that is reduced by a factor that varies according to age for each year before age 65. PERS Plan 2/3 members who have 30 or more years of service credit and are at least 55 years old can retire under one of two provisions:
• With a benefit that is reduced by three percent for each year before age 65; or
• With a benefit that has a smaller (or no) reduction (depending on age) that imposes stricter return-to-work rules.
PERS Plan 2/3 members hired on or after May 1, 2013 have the option to retire early by accepting a reduction of five percent for each year of retirement before age 65. This option is available only to those who are age 55 or older and have at least 30 years of service credit. PERS Plan 2/3 retirement benefits are also actuarially reduced to reflect the choice of a survivor benefit. Other PERS Plan 2/3 benefits include duty and non-duty disability payments, a cost-of-living allowance (based on the CPI), capped at three percent annually and a one-time duty related death benefit, if found eligible by the Department of Labor and Industries. PERS 2 members are vested after completing five years of eligible service. Plan 3 members are vested in the defined benefit portion of their plan after ten years of service; or after five years of service if 12 months of that service are earned after age 44. PERS Plan 3 defined contribution benefits are totally dependent on employee contributions and investment earnings on those contributions. PERS Plan 3 members choose their contribution rate upon joining membership and have a chance to change rates upon changing employers. As established by statute, Plan 3 required defined contribution rates are set at a minimum of 5 percent and escalate to 15 percent with a choice of six options. Employers do not contribute to the defined contribution benefits. PERS Plan 3 members are immediately vested in the defined contribution portion of their plan. Contributions The PERS Plan 2/3 employer and employee contribution rates are developed by the Office of the State Actuary to fully fund Plan 2 and the defined benefit portion of Plan 3. The Plan 2/3 employer rates include a component to address the PERS Plan 1 UAAL and an administrative expense that is currently set at 0.18 percent. Each biennium, the state Pension Funding Council adopts Plan 2 employer and employee contribution rates and Plan 3 contribution rates. The PERS Plan 2/3 required contribution rates (expressed as a percentage of covered payroll) for 2019 were as follows:
PERS Plan 2/3 Actual Contribution Rates Employer 2/3 Employee 2* January – June 2019 PERS Plan 2/3 7.52% 7.41% PERS Plan 1 UAAL 5.13% Administrative Fee 0.18% Employee PERS Plan 3 Varies
Total 12.83% 7.41% July – December 2019

CITY OF EVERETT FINANCIAL SECTION
2019 COMPREHENSIVE ANNUAL FINANCIAL REPORT PAGE 59
PERS Plan 2/3 7.92% 7.90% PERS Plan 1 UAAL 4.76% Administrative Fee 0.18% Employee PERS Plan 3 Varies
Total 12.86% 7.90%
* For employees participating in JBM, the contribution rate was 18.53% to 19.75%. The City’s actual PERS plan contributions were $3,170,621 to PERS Plan 1 and $4,672,076 to PERS Plan 2/3 for the year ended December 31, 2019. Public Safety Employees’ Retirement System (PSERS 2) PSERS Plan 2 was created by the 2004 Legislature and became effective July 1, 2006. To be eligible for membership, an employee must work on a full time basis and:
• Have completed a certified criminal justice training course with authority to arrest, conduct criminal
investigations, enforce the criminal laws of Washington, and carry a firearm as part of the job; or
• Have primary responsibility to ensure the custody and security of incarcerated or probationary individuals; or
• Function as a limited authority Washington peace officer, as defined in RCW 10.93.020; or
• Have primary responsibility to supervise eligible members who meet the above criteria. PSERS membership includes:
• PSERS 2 or 3 employees hired by a covered employer before July 1, 2006, who met at least one of the PSERS eligibility criteria and elected membership during the period of July 1, 2006 to September 30, 2006; and
• Employees hired on or after July 1, 2006 by a covered employer, that meet at least one of the PSERS eligibility criteria.
PSERS covered employers include:
• Certain State of Washington agencies (Department of Corrections, Department of Natural Resources, Gambling Commission, Liquor and Cannabis Board, Parks and Recreation Commission, and Washington State Patrol),
• Washington State Counties,
• Washington State Cities (except for Seattle, Spokane, and Tacoma),
• Correctional entities formed by PSERS employers under the Interlocal Cooperation Act. PSERS Plan 2 provides retirement, disability and death benefits. Retirement benefits are determined as two percent of the average final compensation (AFC) for each year of service. The AFC is based on the member’s 60 consecutive highest creditable months of service. Benefits are actuarially reduced for each year that the member’s age is less than 60 (with ten or more service credit years in PSERS), or less than 65 (with fewer than ten service credit years). There is no cap on years of service credit. Members are eligible for retirement at the age of 65 with five years of service; or at the age of 60 with at least ten years of PSERS service credit; or at age 53 with 20 years of service. Retirement before age 60 is considered an early retirement. PSERS members who retire prior to the age of 60 receive reduced benefits. If retirement is at age 53 or older with at least 20 years of service, a three percent per year reduction for each year between the age at retirement and age 60 applies. PSERS Plan 2 retirement benefits are actuarially reduced to reflect the choice of a survivor benefit. Other benefits include duty and non-duty disability payments, an optional cost-of living adjustment (COLA), and a one-time duty-related death benefit, if found eligible by the Department of Labor and Industries. PSERS Plan 2 members are vested after completing five years of eligible service.

CITY OF EVERETT FINANCIAL SECTION
PAGE 60 2019 COMPREHENSIVE ANNUAL FINANCIAL REPORT
Contributions The PSERS Plan 2 employer and employee contribution rates are developed by the Office of the State Actuary to fully fund Plan 2. The Plan 2 employer rates include components to address the PERS Plan 1 unfunded actuarial accrued liability and administrative expense currently set at 0.18 percent. Each biennium, the state Pension Funding Council adopts Plan 2 employer and employee contribution rates. The PSERS Plan 2 required contribution rates (expressed as a percentage of current-year covered payroll) for 2019 were as follows:
PSERS Plan 2 Actual Contribution Rates Employer Employee January – June 2019 PSERS Plan 2 7.07% 7.07% PERS Plan 1 UAAL 5.13% Administrative Fee 0.18%
Total 12.38% 7.07% July – December 2019 PSERS Plan 2 7.20% 7.20% PERS Plan 1 UAAL 4.76% Administrative Fee 0.18%
Total 12.14% 7.20%
The City’s actual plan contributions were $68,487 to PSERS Plan 2 for the year ended December 31, 2019. Law Enforcement Officers’ and Fire Fighters’ Retirement System (LEOFF) LEOFF membership includes all full-time, fully compensated, local law enforcement commissioned officers, firefighters, and as of July 24, 2005, emergency medical technicians. LEOFF is comprised of two separate defined benefit plans. LEOFF Plan 1 provides retirement, disability and death benefits. Retirement benefits are determined per year of service calculated as a percent of final average salary (FAS) as follows:
• 20+ years of service – 2.0% of FAS • 10-19 years of service – 1.5% of FAS • 5-9 years of service – 1% of FAS
The FAS is the basic monthly salary received at the time of retirement, provided a member has held the same position or rank for 12 months preceding the date of retirement. Otherwise, it is the average of the highest consecutive 24 months’ salary within the last ten years of service. Members are eligible for retirement with five years of service at the age of 50. Other benefits include duty and non-duty disability payments, a cost-of living adjustment (COLA), and a one-time duty-related death benefit, if found eligible by the Department of Labor and Industries. LEOFF 1 members were vested after the completion of five years of eligible service. The plan was closed to new entrants on September 30, 1977. Contributions Starting on July 1, 2000, LEOFF Plan 1 employers and employees contribute zero percent, as long as the plan remains fully funded. The LEOFF Plan I had no required employer or employee contributions for fiscal year 2019. Employers paid only the administrative expense of 0.18 percent of covered payroll. LEOFF Plan 2 provides retirement, disability and death benefits. Retirement benefits are determined as two percent of the final average salary (FAS) per year of service (the FAS is based on the highest consecutive 60 months). Members are eligible for retirement with a full benefit at 53 with at least five years of service credit. Members who retire prior to the age of 53 receive reduced benefits. If the member has at least 20 years of service and is age 50, the reduction is three percent for each year prior to age 53. Otherwise, the benefits are actuarially reduced for each year prior to age 53. LEOFF 2 retirement benefits are also actuarially reduced to reflect the choice of a survivor benefit. Other benefits include duty and non-duty disability payments, a cost-of-living allowance (based on the CPI),
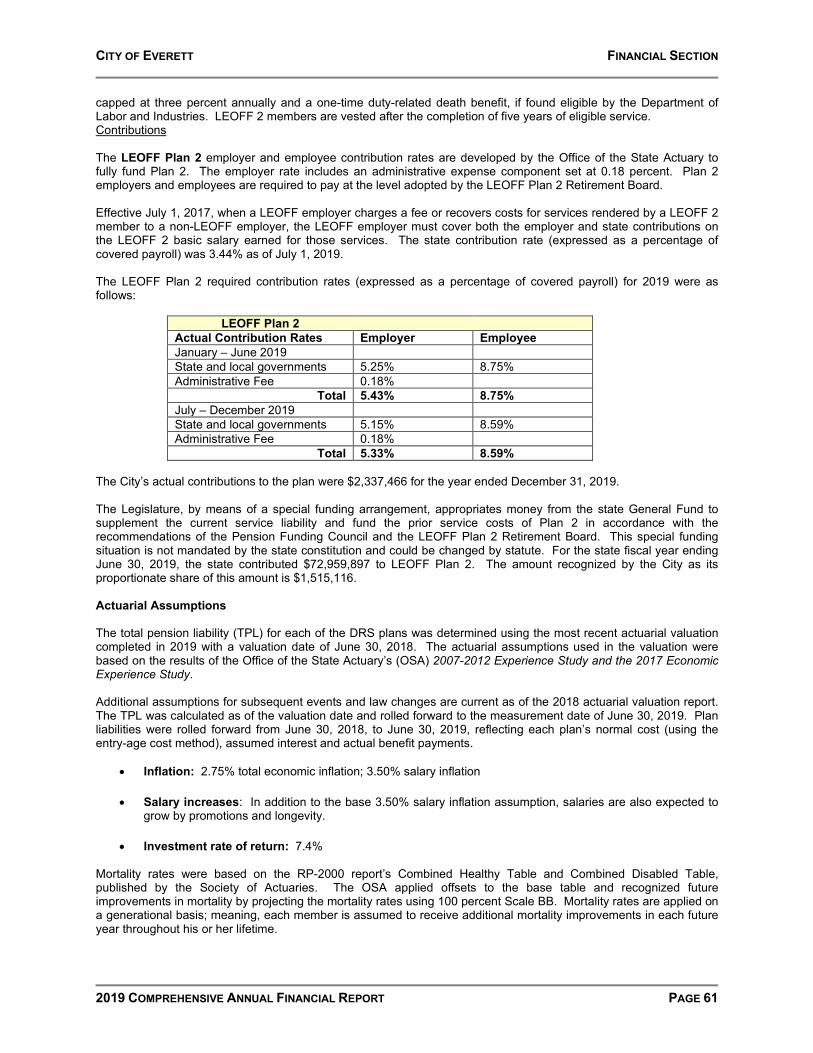
CITY OF EVERETT FINANCIAL SECTION
2019 COMPREHENSIVE ANNUAL FINANCIAL REPORT PAGE 61
capped at three percent annually and a one-time duty-related death benefit, if found eligible by the Department of Labor and Industries. LEOFF 2 members are vested after the completion of five years of eligible service. Contributions The LEOFF Plan 2 employer and employee contribution rates are developed by the Office of the State Actuary to fully fund Plan 2. The employer rate includes an administrative expense component set at 0.18 percent. Plan 2 employers and employees are required to pay at the level adopted by the LEOFF Plan 2 Retirement Board. Effective July 1, 2017, when a LEOFF employer charges a fee or recovers costs for services rendered by a LEOFF 2 member to a non-LEOFF employer, the LEOFF employer must cover both the employer and state contributions on the LEOFF 2 basic salary earned for those services. The state contribution rate (expressed as a percentage of covered payroll) was 3.44% as of July 1, 2019. The LEOFF Plan 2 required contribution rates (expressed as a percentage of covered payroll) for 2019 were as follows:
LEOFF Plan 2
Actual Contribution Rates Employer Employee January – June 2019 State and local governments 5.25% 8.75% Administrative Fee 0.18%
Total 5.43% 8.75% July – December 2019 State and local governments 5.15% 8.59% Administrative Fee 0.18%
Total 5.33% 8.59% The City’s actual contributions to the plan were $2,337,466 for the year ended December 31, 2019. The Legislature, by means of a special funding arrangement, appropriates money from the state General Fund to supplement the current service liability and fund the prior service costs of Plan 2 in accordance with the recommendations of the Pension Funding Council and the LEOFF Plan 2 Retirement Board. This special funding situation is not mandated by the state constitution and could be changed by statute. For the state fiscal year ending June 30, 2019, the state contributed $72,959,897 to LEOFF Plan 2. The amount recognized by the City as its proportionate share of this amount is $1,515,116. Actuarial Assumptions The total pension liability (TPL) for each of the DRS plans was determined using the most recent actuarial valuation completed in 2019 with a valuation date of June 30, 2018. The actuarial assumptions used in the valuation were based on the results of the Office of the State Actuary’s (OSA) 2007-2012 Experience Study and the 2017 Economic Experience Study. Additional assumptions for subsequent events and law changes are current as of the 2018 actuarial valuation report. The TPL was calculated as of the valuation date and rolled forward to the measurement date of June 30, 2019. Plan liabilities were rolled forward from June 30, 2018, to June 30, 2019, reflecting each plan’s normal cost (using the entry-age cost method), assumed interest and actual benefit payments.
• Inflation: 2.75% total economic inflation; 3.50% salary inflation
• Salary increases: In addition to the base 3.50% salary inflation assumption, salaries are also expected to grow by promotions and longevity.
• Investment rate of return: 7.4% Mortality rates were based on the RP-2000 report’s Combined Healthy Table and Combined Disabled Table, published by the Society of Actuaries. The OSA applied offsets to the base table and recognized future improvements in mortality by projecting the mortality rates using 100 percent Scale BB. Mortality rates are applied on a generational basis; meaning, each member is assumed to receive additional mortality improvements in each future year throughout his or her lifetime.
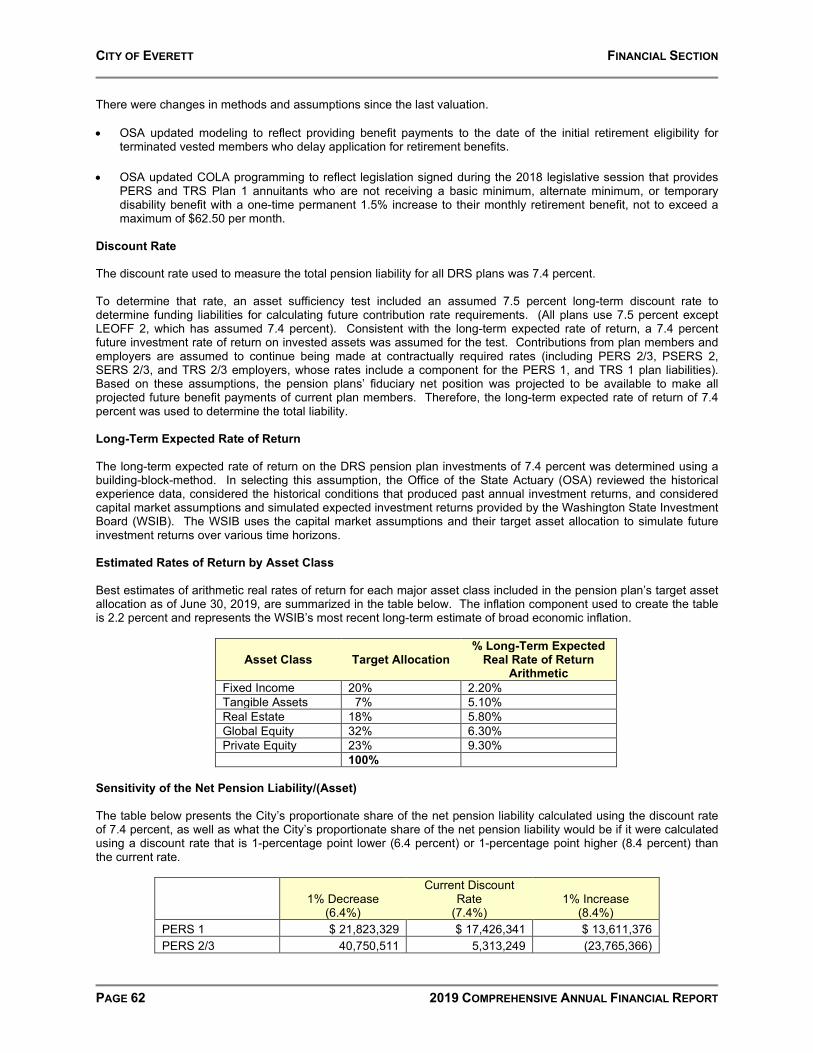
CITY OF EVERETT FINANCIAL SECTION
PAGE 62 2019 COMPREHENSIVE ANNUAL FINANCIAL REPORT
There were changes in methods and assumptions since the last valuation. • OSA updated modeling to reflect providing benefit payments to the date of the initial retirement eligibility for
terminated vested members who delay application for retirement benefits.
• OSA updated COLA programming to reflect legislation signed during the 2018 legislative session that provides PERS and TRS Plan 1 annuitants who are not receiving a basic minimum, alternate minimum, or temporary disability benefit with a one-time permanent 1.5% increase to their monthly retirement benefit, not to exceed a maximum of $62.50 per month.
Discount Rate The discount rate used to measure the total pension liability for all DRS plans was 7.4 percent. To determine that rate, an asset sufficiency test included an assumed 7.5 percent long-term discount rate to determine funding liabilities for calculating future contribution rate requirements. (All plans use 7.5 percent except LEOFF 2, which has assumed 7.4 percent). Consistent with the long-term expected rate of return, a 7.4 percent future investment rate of return on invested assets was assumed for the test. Contributions from plan members and employers are assumed to continue being made at contractually required rates (including PERS 2/3, PSERS 2, SERS 2/3, and TRS 2/3 employers, whose rates include a component for the PERS 1, and TRS 1 plan liabilities). Based on these assumptions, the pension plans’ fiduciary net position was projected to be available to make all projected future benefit payments of current plan members. Therefore, the long-term expected rate of return of 7.4 percent was used to determine the total liability. Long-Term Expected Rate of Return The long-term expected rate of return on the DRS pension plan investments of 7.4 percent was determined using a building-block-method. In selecting this assumption, the Office of the State Actuary (OSA) reviewed the historical experience data, considered the historical conditions that produced past annual investment returns, and considered capital market assumptions and simulated expected investment returns provided by the Washington State Investment Board (WSIB). The WSIB uses the capital market assumptions and their target asset allocation to simulate future investment returns over various time horizons. Estimated Rates of Return by Asset Class Best estimates of arithmetic real rates of return for each major asset class included in the pension plan’s target asset allocation as of June 30, 2019, are summarized in the table below. The inflation component used to create the table is 2.2 percent and represents the WSIB’s most recent long-term estimate of broad economic inflation.
Asset Class
Target Allocation
% Long-Term Expected Real Rate of Return
Arithmetic Fixed Income 20% 2.20% Tangible Assets 7% 5.10% Real Estate 18% 5.80% Global Equity 32% 6.30% Private Equity 23% 9.30% 100%
Sensitivity of the Net Pension Liability/(Asset) The table below presents the City’s proportionate share of the net pension liability calculated using the discount rate of 7.4 percent, as well as what the City’s proportionate share of the net pension liability would be if it were calculated using a discount rate that is 1-percentage point lower (6.4 percent) or 1-percentage point higher (8.4 percent) than the current rate.
1% Decrease
(6.4%)
Current Discount Rate
(7.4%) 1% Increase
(8.4%) PERS 1 $ 21,823,329 $ 17,426,341 $ 13,611,376 PERS 2/3 40,750,511 5,313,249 (23,765,366)

CITY OF EVERETT FINANCIAL SECTION
2019 COMPREHENSIVE ANNUAL FINANCIAL REPORT PAGE 63
PSERS 2 264,062 (25,578) (253,114) LEOFF 1 (7,295,232) (8,917,797) (10,318,726) LEOFF 2 (5,405,620) (29,071,509) (48,388,290)
Pension Plan Fiduciary Net Position Detailed information about the State’s pension plans’ fiduciary net position is available in the separately issued DRS financial report. Pension Liabilities (Assets), Pension Expense, and Deferred Outflows of Resources and Deferred Inflows of Resources Related to Pensions At June 30, 2019, the City reported a total pension liability of $22,739,590 and pension assets of $38,014,884 for its proportionate share of the net pension liabilities as follows:
Liability (or Asset) PERS 1 $ 17,426,341 PERS 2/3 5,313,249 PSERS 2 (25,578) LEOFF 1 (8,917,797) LEOFF 2 (29,071,509)
The amount of the asset reported above for LEOFF Plans 1 and 2 reflects a reduction for State pension support provided to the city. The amount recognized by the City as its proportionate share of the net pension asset, the related State support, and the total portion of the net pension asset that was associated with the City were as follows:
LEOFF 1 Asset LEOFF 2 Asset Employer’s proportionate share $ 8,917,797 $ 29,071,509 State’s proportionate share of the net pension asset associated with the employer
60,319,757 19,037,943
TOTAL 69,237,554 48,109,452 At June 30, the City’s proportionate share of the collective net pension liabilities was as follows:
Proportionate Share 6/30/18
Proportionate Share 6/30/19
Change in Proportion
PERS 1 0.475870% 0.453179% (0.022691%) PERS 2/3 0.565717% 0.547002% (0.018715%) PSERS 2 0.210589% 0.196691% (0.013898%) LEOFF 1 0.446110% 0.451166% 0.005056% LEOFF 2 1.277707% 1.254871% (0.022836%)
Employer contribution transmittals received and processed by the DRS for the fiscal year ended June 30 are used as the basis for determining each employer’s proportionate share of the collective pension amounts reported by the DRS in the Schedules of Employer and Nonemployer Allocations for all plans except LEOFF 1. LEOFF Plan 1 allocation percentages are based on the total historical employer contributions to LEOFF 1 from 1971 through 2000 and the retirement benefit payments in fiscal year 2019. Historical data was obtained from a 2011 study by the Office of the State Actuary (OSA). In fiscal year 2019, the state of Washington contributed 87.12 percent of LEOFF 1 employer contributions and all other employers contributed the remaining 12.88 percent of employer contributions. LEOFF 1 is fully funded and no further employer contributions have been required since June 2000. If the plan becomes underfunded, funding of the remaining liability will require new legislation. The allocation method the plan chose reflects the projected long-term contribution effort based on historical data. In fiscal year 2019, the state of Washington contributed 39.57 percent of LEOFF 2 employer contributions pursuant to RCW 41.26.725 and all other employers contributed the remaining 60.43 percent of employer contributions.

CITY OF EVERETT FINANCIAL SECTION
PAGE 64 2019 COMPREHENSIVE ANNUAL FINANCIAL REPORT
The collective net pension liability (asset) was measured as of June 30, 2019, and the actuarial valuation date on which the total pension liability (asset) is based was as of June 30, 2018, with update procedures used to roll forward the total pension liability to the measurement date. Pension Expense For the year ended December 31, 2019, the City recognized pension expense as follows:
Deferred Outflows of Resources and Deferred Inflows of Resources At December 31, 2019, the City reported deferred outflows of resources and deferred inflows of resources related to pensions from the following sources:
Total Deferred Outflows of Resources
Deferred Inflows of Resources
Differences between expected and actual experience $ 3,635,813 $ (1,667,364) Net difference between projected and actual investment earnings on pension plan investments
$ - $ ( 15,827,646)
Changes of assumptions $ 184,154 $ (5,514,484) Changes in proportion and differences between contributions and proportionate share of contributions
$ 845,946 $ (1,768,793)
Contributions subsequent to the measurement date $ 5,486,882 $ - TOTAL $ 10,152,795 $ (24,778,287)
PERS 1 Deferred Outflows of
Resources Deferred Inflows of
Resources Differences between expected and actual experience $ - $ - Net difference between projected and actual investment earnings on pension plan investments
$ -
$ (1,164,226)
Changes of assumptions $ - $ - Changes in proportion and differences between contributions and proportionate share of contributions
$ -
$ -
Contributions subsequent to the measurement date $ 1,637,517 $ - TOTAL $ 1,637,517 $ (1,164,226)
PERS 2/3 Deferred Outflows of
Resources Deferred Inflows of
Resources Differences between expected and actual experience $ 1,522,258 $ (1,142,319) Net difference between projected and actual investment earnings on pension plan investments
$ -
$ (7,733,927)
Changes of assumptions $ 136,055 $ (2,229,262) Changes in proportion and differences between contributions and proportionate share of contributions
$ 70,405
$ (1,396,447)
Contributions subsequent to the measurement date $ 2,576,834 $ - TOTAL $ 4,305,552 $ (12,501,955)
PSERS 2 Deferred Outflows
of Resources Deferred Inflows of
Resources Differences between expected and actual experience $ 21,600 $ (2,262) Net difference between projected and actual investment earnings on pension plan investments
$ -
$ (44,417)
Pension Expense PERS 1 $ (257,027) PERS 2/3 1,048,552 PSERS 2 41,459 LEOFF 1 (551,685) LEOFF 2 585,862 TOTAL 867,161
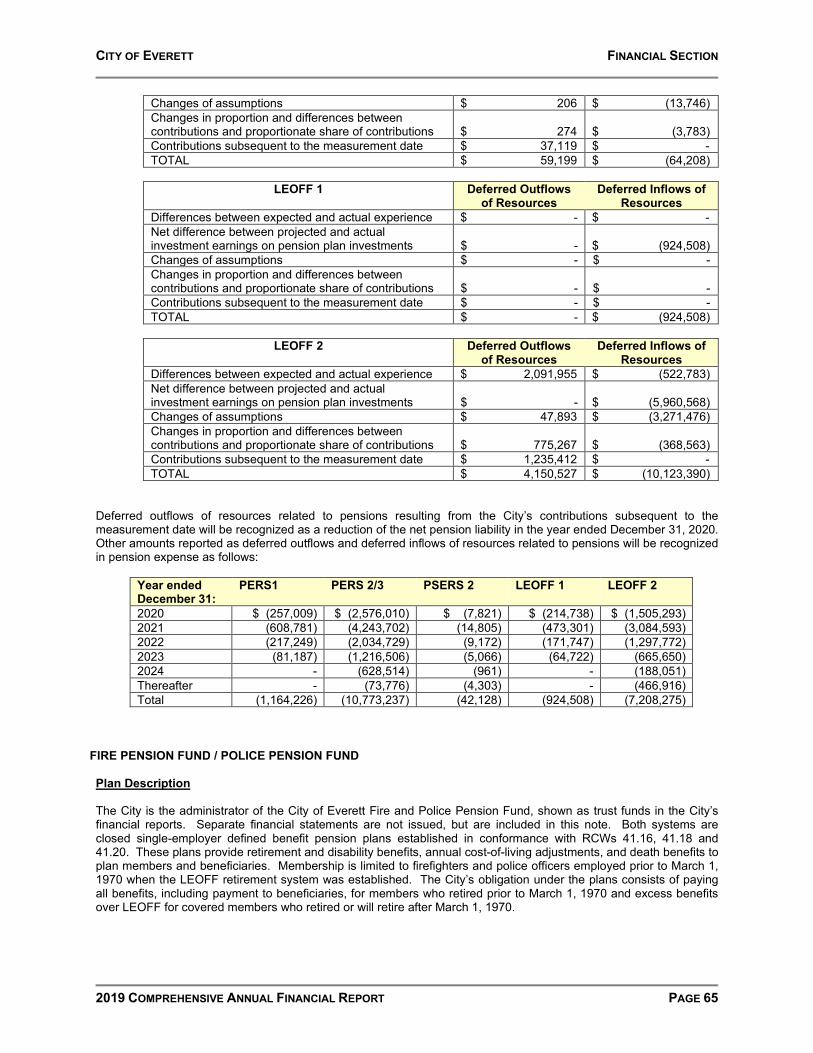
CITY OF EVERETT FINANCIAL SECTION
2019 COMPREHENSIVE ANNUAL FINANCIAL REPORT PAGE 65
Changes of assumptions $ 206 $ (13,746) Changes in proportion and differences between contributions and proportionate share of contributions
$ 274
$ (3,783)
Contributions subsequent to the measurement date $ 37,119 $ - TOTAL $ 59,199 $ (64,208)
LEOFF 1 Deferred Outflows
of Resources Deferred Inflows of
Resources Differences between expected and actual experience $ - $ - Net difference between projected and actual investment earnings on pension plan investments
$ -
$ (924,508)
Changes of assumptions $ - $ - Changes in proportion and differences between contributions and proportionate share of contributions
$ -
$ -
Contributions subsequent to the measurement date $ - $ - TOTAL $ - $ (924,508)
LEOFF 2 Deferred Outflows
of Resources Deferred Inflows of
Resources Differences between expected and actual experience $ 2,091,955 $ (522,783) Net difference between projected and actual investment earnings on pension plan investments
$ -
$ (5,960,568)
Changes of assumptions $ 47,893 $ (3,271,476) Changes in proportion and differences between contributions and proportionate share of contributions
$ 775,267
$ (368,563)
Contributions subsequent to the measurement date $ 1,235,412 $ - TOTAL $ 4,150,527 $ (10,123,390)
Deferred outflows of resources related to pensions resulting from the City’s contributions subsequent to the measurement date will be recognized as a reduction of the net pension liability in the year ended December 31, 2020. Other amounts reported as deferred outflows and deferred inflows of resources related to pensions will be recognized in pension expense as follows:
Year ended December 31:
PERS1 PERS 2/3 PSERS 2 LEOFF 1 LEOFF 2
2020 $ (257,009) $ (2,576,010) $ (7,821) $ (214,738) $ (1,505,293) 2021 (608,781) (4,243,702) (14,805) (473,301) (3,084,593) 2022 (217,249) (2,034,729) (9,172) (171,747) (1,297,772) 2023 (81,187) (1,216,506) (5,066) (64,722) (665,650) 2024 - (628,514) (961) - (188,051) Thereafter - (73,776) (4,303) - (466,916) Total (1,164,226) (10,773,237) (42,128) (924,508) (7,208,275)
FIRE PENSION FUND / POLICE PENSION FUND Plan Description The City is the administrator of the City of Everett Fire and Police Pension Fund, shown as trust funds in the City’s financial reports. Separate financial statements are not issued, but are included in this note. Both systems are closed single-employer defined benefit pension plans established in conformance with RCWs 41.16, 41.18 and 41.20. These plans provide retirement and disability benefits, annual cost-of-living adjustments, and death benefits to plan members and beneficiaries. Membership is limited to firefighters and police officers employed prior to March 1, 1970 when the LEOFF retirement system was established. The City’s obligation under the plans consists of paying all benefits, including payment to beneficiaries, for members who retired prior to March 1, 1970 and excess benefits over LEOFF for covered members who retired or will retire after March 1, 1970.

CITY OF EVERETT FINANCIAL SECTION
PAGE 66 2019 COMPREHENSIVE ANNUAL FINANCIAL REPORT
The Fire Pension Fund is administered by a fire pension board comprised of the mayor or a designated representative who shall be an elected official of the City, who shall be the chairperson of the board, the City council finance committee chairperson, the City clerk, and two regularly employed or retired fire fighters elected by secret ballot of the employed and retired fire fighters. The Police Pension Fund is administered by a police pension board comprised of the mayor or a designated representative who shall be an elected official of the City, the City clerk, the City treasurer, president of the City council, and three active or retired members of the police department elected by active and retired members of the police department. Membership of the Plans consisted of the following as of December 31, 2019:
Plan Members Fire Pension Police PensionInactive employees (or their beneficiaries) currently receiving benefits 86 43Inactive employees entitled to but not yet receiving benefits 0 0Active employees 0 0
Fire Pension members are eligible for retirement after serving 25 years and reaching the age of 50. Members retiring with 25 years of service are paid 50 percent of the basic salary attached to the rank held at the date of retirement. Members retiring with more than 25 years of service will receive an additional 2% of their base for each full year of additional service up to a maximum of five additional years.
Police Pension members are eligible for retirement after serving for 25 years. Members retiring with 25 years of service are paid 50 percent of the basic salary attached to the position held for the year preceding the date of retirement, up to the position of captain. Members retiring with more than 25 years of service will receive an additional 2% of their base for each full year of additional service up to a maximum of five additional years.
There were no changes in benefit provisions in the current year. Summary of Significant Accounting Policies The Fire Pension Fund and the Police Pension Fund financial statements are reported using the economic resources measurement focus and accrual basis of accounting. Employer contributions to each plan are recognized when due and the employer has made a formal commitment to provide the contributions. Benefits and refunds are recognized when due and payable in accordance with the terms of each plan. Investments Investments are reported at fair value, as provided by the custodian. It is the policy of the Pension Board to pursue an investment strategy based on the prudent person standard, which persons of prudence, discretion, and intelligence exercise in the management of their own affairs, not for speculation, but for investment, considering probable safety of their capital as well as the probable income to be derived. With the exception of US Treasury, no more than 50% of the total investment portfolio can be invested in a single security type and no more than 25% can be invested with a single financial institution. Concentrations The pension plans investments are mostly held in the following government sponsored enterprise (GSE) issued securities:
AgenciesFFCB 1,093,987 22% 2,483,316 24%FHLB 1,227,640 25% 2,413,531 23%FHLMC 1,167,130 24% 2,458,179 24%FNMA 1,201,199 24% 2,390,477 23%TREASURY 216,840 4% 549,763 5%Total Investments 4,906,796 100% 10,295,266 100%
Police Fire
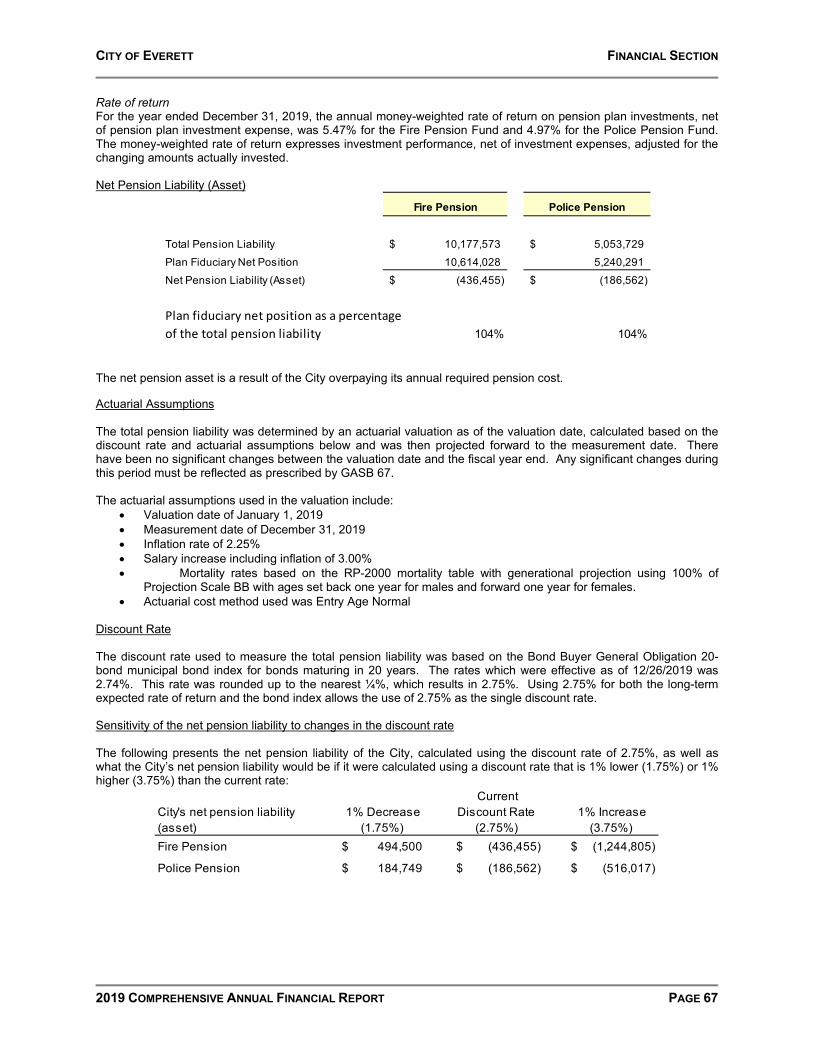
CITY OF EVERETT FINANCIAL SECTION
2019 COMPREHENSIVE ANNUAL FINANCIAL REPORT PAGE 67
Rate of return For the year ended December 31, 2019, the annual money-weighted rate of return on pension plan investments, net of pension plan investment expense, was 5.47% for the Fire Pension Fund and 4.97% for the Police Pension Fund. The money-weighted rate of return expresses investment performance, net of investment expenses, adjusted for the changing amounts actually invested. Net Pension Liability (Asset)
Fire Pension Police Pension
Total Pension Liability 10,177,573$ 5,053,729$ Plan Fiduciary Net Position 10,614,028 5,240,291 Net Pension Liability (Asset) (436,455)$ (186,562)$
Plan fiduciary net position as a percentageof the total pension liability 104% 104%
The net pension asset is a result of the City overpaying its annual required pension cost. Actuarial Assumptions The total pension liability was determined by an actuarial valuation as of the valuation date, calculated based on the discount rate and actuarial assumptions below and was then projected forward to the measurement date. There have been no significant changes between the valuation date and the fiscal year end. Any significant changes during this period must be reflected as prescribed by GASB 67. The actuarial assumptions used in the valuation include:
• Valuation date of January 1, 2019 • Measurement date of December 31, 2019 • Inflation rate of 2.25% • Salary increase including inflation of 3.00% • Mortality rates based on the RP-2000 mortality table with generational projection using 100% of
Projection Scale BB with ages set back one year for males and forward one year for females. • Actuarial cost method used was Entry Age Normal
Discount Rate The discount rate used to measure the total pension liability was based on the Bond Buyer General Obligation 20-bond municipal bond index for bonds maturing in 20 years. The rates which were effective as of 12/26/2019 was 2.74%. This rate was rounded up to the nearest ¼%, which results in 2.75%. Using 2.75% for both the long-term expected rate of return and the bond index allows the use of 2.75% as the single discount rate. Sensitivity of the net pension liability to changes in the discount rate The following presents the net pension liability of the City, calculated using the discount rate of 2.75%, as well as what the City’s net pension liability would be if it were calculated using a discount rate that is 1% lower (1.75%) or 1% higher (3.75%) than the current rate:
City's net pension liability (asset)
1% Decrease (1.75%)
Current Discount Rate
(2.75%) 1% Increase
(3.75%) Fire Pension 494,500$ (436,455)$ (1,244,805)$
Police Pension 184,749$ (186,562)$ (516,017)$
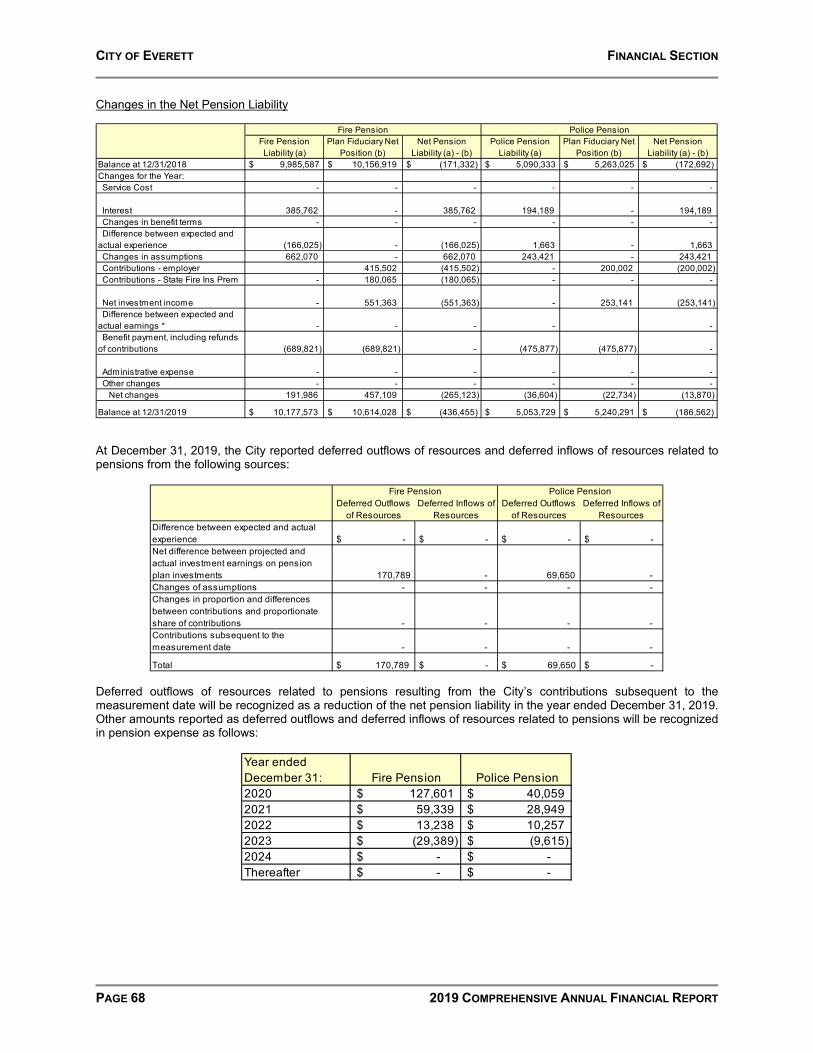
CITY OF EVERETT FINANCIAL SECTION
PAGE 68 2019 COMPREHENSIVE ANNUAL FINANCIAL REPORT
Changes in the Net Pension Liability
Fire Pension Police PensionFire Pension Liability (a)
Plan Fiduciary Net Position (b)
Net Pension Liability (a) - (b)
Police Pension Liability (a)
Plan Fiduciary Net Position (b)
Net Pension Liability (a) - (b)
Balance at 12/31/2018 $ 9,985,587 $ 10,156,919 $ (171,332) $ 5,090,333 $ 5,263,025 $ (172,692)Changes for the Year: Service Cost - - - - - -
Interest 385,762 - 385,762 194,189 - 194,189 Changes in benefit terms - - - - - - Difference between expected and actual experience (166,025) - (166,025) 1,663 - 1,663 Changes in assumptions 662,070 - 662,070 243,421 - 243,421 Contributions - employer 415,502 (415,502) - 200,002 (200,002) Contributions - State Fire Ins Prem - 180,065 (180,065) - - -
Net investment income - 551,363 (551,363) - 253,141 (253,141) Difference between expected and actual earnings * - - - - - Benefit payment, including refunds of contributions (689,821) (689,821) - (475,877) (475,877) -
Administrative expense - - - - - - Other changes - - - - - - Net changes 191,986 457,109 (265,123) (36,604) (22,734) (13,870)
Balance at 12/31/2019 $ 10,177,573 $ 10,614,028 $ (436,455) $ 5,053,729 $ 5,240,291 $ (186,562)
At December 31, 2019, the City reported deferred outflows of resources and deferred inflows of resources related to pensions from the following sources:
Fire Pension Police PensionDeferred Outflows
of ResourcesDeferred Inflows of
ResourcesDeferred Outflows
of ResourcesDeferred Inflows of
ResourcesDifference between expected and actual experience $ - $ - $ - $ - Net difference between projected and actual investment earnings on pension plan investments 170,789 - 69,650 - Changes of assumptions - - - - Changes in proportion and differences between contributions and proportionate share of contributions - - - - Contributions subsequent to the measurement date - - - -
Total $ 170,789 $ - $ 69,650 $ -
Deferred outflows of resources related to pensions resulting from the City’s contributions subsequent to the measurement date will be recognized as a reduction of the net pension liability in the year ended December 31, 2019. Other amounts reported as deferred outflows and deferred inflows of resources related to pensions will be recognized in pension expense as follows:
Year ended December 31: Fire Pension Police Pension 2020 127,601$ 40,059$ 2021 59,339$ 28,949$ 2022 13,238$ 10,257$ 2023 (29,389)$ (9,615)$ 2024 -$ -$ Thereafter -$ -$
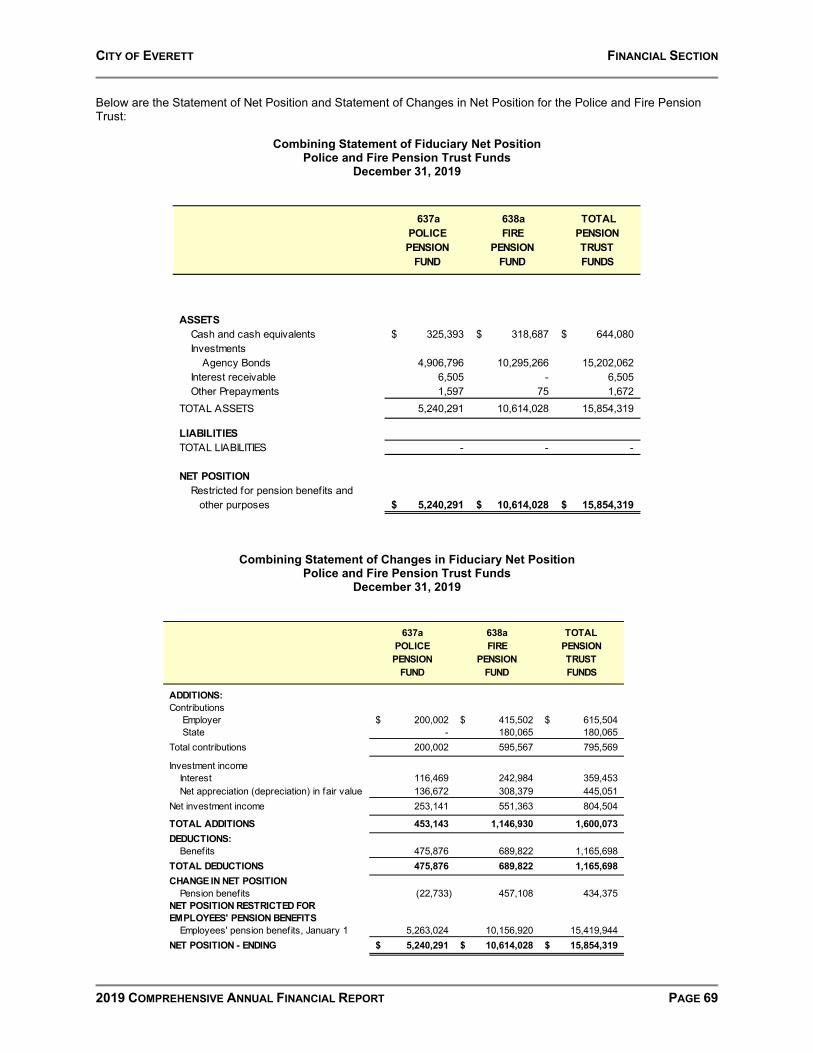
CITY OF EVERETT FINANCIAL SECTION
2019 COMPREHENSIVE ANNUAL FINANCIAL REPORT PAGE 69
Below are the Statement of Net Position and Statement of Changes in Net Position for the Police and Fire Pension Trust:
Combining Statement of Fiduciary Net Position Police and Fire Pension Trust Funds
December 31, 2019
Combining Statement of Changes in Fiduciary Net Position Police and Fire Pension Trust Funds
December 31, 2019
637aPOLICEPENSION
FUND
638aFIRE
PENSIONFUND
TOTALPENSIONTRUSTFUNDS
ASSETSCash and cash equivalents 325,393$ 318,687$ 644,080$ Investments
Agency Bonds 4,906,796 10,295,266 15,202,062 Interest receivable 6,505 - 6,505 Other Prepayments 1,597 75 1,672
TOTAL ASSETS 5,240,291 10,614,028 15,854,319
LIABILITIESTOTAL LIABILITIES - - -
NET POSITIONRestricted for pension benefits and other purposes 5,240,291$ 10,614,028$ 15,854,319$
637aPOLICEPENSION
FUND
638aFIRE
PENSIONFUND
TOTALPENSIONTRUSTFUNDS
ADDITIONS:Contributions Employer 200,002$ 415,502$ 615,504$ State - 180,065 180,065 Total contributions 200,002 595,567 795,569
Investment incomeInterest 116,469 242,984 359,453 Net appreciation (depreciation) in fair value 136,672 308,379 445,051
Net investment income 253,141 551,363 804,504
TOTAL ADDITIONS 453,143 1,146,930 1,600,073 DEDUCTIONS:
Benefits 475,876 689,822 1,165,698 TOTAL DEDUCTIONS 475,876 689,822 1,165,698CHANGE IN NET POSITION
Pension benefits (22,733) 457,108 434,375 NET POSITION RESTRICTED FOR EMPLOYEES' PENSION BENEFITS
Employees' pension benefits, January 1 5,263,024 10,156,920 15,419,944 NET POSITION - ENDING 5,240,291$ 10,614,028$ 15,854,319$

CITY OF EVERETT FINANCIAL SECTION
PAGE 70 2019 COMPREHENSIVE ANNUAL FINANCIAL REPORT
NOTE 8 - OTHER POST EMPLOYMENT BENEFITS (OPEB)
The following table represents the aggregate OPEB amounts for all plans subject to the requirements of GASB Statement 75 for the year 2019:
Aggregate OPEB Amounts - All Plans TotalOPEB liabilities (48,489,965)$ OPEB assets -$ Deferred outlfows of resources 282,531$ Deferred inflows of resources (211,807)$ OPEB expense/expenditures 5,143,956$
Plan Descriptions The City is the administrator of the City of Everett Fire and Police Other Postemployment Benefit (OPEB) Plans. Both plans are closed single-employer defined benefit healthcare plans shown as trust funds in the City’s financial reports. Separate financial statements are not issued, but are included in this note. In accordance with RCW 41.26, the City provides lifetime medical care for firefighters and law enforcement officers employed prior to October 1, 1977. The City is self-insured and pays actual claims incurred by plan participants. The City carries individual and aggregate stop loss insurance to mitigate the risk associated with being self-insured. The plans are administered by the same boards that administer the Fire and Police Pension Plans as described in Note 7. Neither Fire nor Police retirees contribute towards the cost of his/her medical care. The primary sources of funding for both plans are property taxes levied by the City and interest earnings. In addition, the City receives a small Medicare D subsidy. In 2019, the City received $115,940 in Medicare D reimbursements, which were split between the two funds. Administrative costs are financed through interest earnings. There are no active firefighter plan participants and 103 firefighter retirees currently receiving benefits. There are no active law enforcement plan participants and 76 law enforcement retirees currently receiving benefits. Summary of Significant Accounting Policies The Fire Healthcare Fund and the Police Healthcare Fund financial statements are prepared using the accrual basis of accounting. Employer contributions to each plan are recognized when due and the employer has made a formal commitment to provide the contributions. Benefits and refunds are recognized when due and payable in accordance with the terms of each plan. Investments Investments are reported at fair value, as provided by the custodian. It is the policy of the Pension Board to pursue an investment strategy based on the prudent person standard, which persons of prudence, discretion, and intelligence exercise in the management of their own affairs, not for speculation, but for investment, considering probable safety of their capital as well as the probable income to be derived. With the exception of US Treasury, no more than 50% of the total investment portfolio can be invested in a single security type and no more than 25% can be invested with a single financial institution. Concentrations The OPEB plans investments are mostly held in the following government sponsored enterprise (GSE) issued securities:
AgenciesFFCB 2,436,786 22% 3,970,001 24%FHLB 2,739,766 25% 3,859,903 23%FHLMC 2,602,597 24% 3,930,344 24%FNMA 2,679,822 24% 3,823,532 23%TREASURY 491,555 4% 867,355 5%Total Investments 10,950,526 100% 16,451,135 100%
Police Fire

CITY OF EVERETT FINANCIAL SECTION
2019 COMPREHENSIVE ANNUAL FINANCIAL REPORT PAGE 71
Rate of return For the year ended December 31, 2019, the annual money-weighted rate of return on OPEB plan investments, net of OPEB plan investment expense, was 5.23% for the Fire OPEB Fund and 4.58% for the Police OPEB Fund. The money-weighted rate of return expresses investment performance, net of investment expenses, adjusted for the changing amounts actually invested. Net OPEB Liability
Fire OPEB Police OPEB
Total OPEB Liability 43,281,008$ 33,813,781$ Plan Fiduciary Net Position 17,023,319 11,581,505 Net OPEB Liability (Asset) 26,257,689$ 22,232,276$
Plan fiduciary net position as a percentageof the total OPEB liability 39% 34%
Actuarial Assumptions The total OPEB liability was determined by an actuarial valuation as of January 1, 2019, calculated based on the discount rate and actuarial assumptions below, and was then projected forward to the measurement date of December 31, 2019.
Mortality rates were based on the RP-2000 Mortality Table with generational projection using 100% of Projection Scale BB, with ages set back one year for males and set forward one year for females. Discount Rate The discount rate used to measure the total OPEB liability was based on the Bond Buyer General Obligation 20-bond municipal bond index for bonds maturing in 20 years. The rates which were effective as of 12/26/2019 was 2.74%. This rate was rounded up to the nearest ¼%, which results in 2.75%. Using 2.75% for both the long-term expected rate of return and the bond index allows the use of 2.75% as the single discount rate. Sensitivity of the net OPEB liability to changes in the discount rate The following presents the net OPEB liability of the City, calculated using the discount rate of 2.75%, as well as what the City’s net OPEB liability would be if it were calculated using a discount rate that is 1% lower (1.75%) or 1% higher (3.75%) than the current rate:

CITY OF EVERETT FINANCIAL SECTION
PAGE 72 2019 COMPREHENSIVE ANNUAL FINANCIAL REPORT
City's net OPEB liability (asset) 1% Decrease
(1.75%)
Current Discount Rate
(2.75%) 1% Increase
(3.75%) Fire OPEB 32,125,623$ 26,257,689$ 21,378,104$
Police OPEB 26,973,704$ 22,232,276$ 18,309,450$
Changes in the Net OPEB Liability
Fire OPEB Police OPEBFire OPEB Liability
(a)Plan Fiduciary Net
Position (b)Net OPEB Liability
(a) - (b)Police OPEB Liability (a)
Plan Fiduciary Net Position (b)
Net OPEB Liability (a) - (b)
Balance at 12/31/2018 $ 43,166,944 $ 17,296,642 $ 25,870,302 $ 30,365,180 $ 11,370,694 $ 18,994,486 Changes for the Year: Service Cost - - - - - - Interest 1,694,851 - 1,694,851 1,195,509 - 1,195,509 Changes in benefit terms - - - - - - Difference between expected and actual experience (615,997) - (615,997) 1,758,417 - 1,758,417 Changes in assumptions 642,326 - 642,326 1,459,046 - 1,459,046 Contributions - employer 509,090 (509,090) - 703,706 (703,706) Contributions - emplyees - - - - - - Net investment income - 872,846 (872,846) - 509,983 (509,983) Difference between expected and actual earnings * - - - - - Benefit payment, including refunds of contributions (1,607,116) (1,607,116) - (964,371) (964,371) - Administrative expense - (48,143) 48,143 - (38,507) 38,507 Other changes - - - - - - Net changes 114,064 (273,323) 387,387 3,448,601 210,811 3,237,790
Balance at 12/31/2019 $ 43,281,008 $ 17,023,319 $ 26,257,689 $ 33,813,781 $ 11,581,505 $ 22,232,276
At December 31, 2019, the City reported deferred outflows of resources and deferred inflows of resources related to OPEB from the following sources:
Deferred Outflows of Resources
Deferred Inflows of Resources
Deferred Outflows of Resources
Deferred Inflows of Resources
Difference between expected and actual experience $ - $ - $ - $ - Net difference between projected and actual investment earnings on OPEB plan investments 7,390 63,334 Changes of assumptions - - - - Changes in proportion and differences between contributions and proportionate share of contributions - - - - Contributions subsequent to the measurement date - - - -
Total $ 7,390 $ - $ 63,334 $ -
Fire OPEB Police OPEB

CITY OF EVERETT FINANCIAL SECTION
2019 COMPREHENSIVE ANNUAL FINANCIAL REPORT PAGE 73
Deferred outflows of resources related to OPEB resulting from the City’s contributions subsequent to the measurement date will be recognized as a reduction of the net OPEB liability in the year ended December 31, 2019. Other amounts reported as deferred outflows and deferred inflows of resources related to OPEB will be recognized in OPEB expense as follows:
Year ended December 31: Fire OPEB Police OPEB
2020 16,041$ 25,183$ 2021 16,041$ 25,183$ 2022 16,043$ 25,184$ 2023 (40,735)$ (12,216)$
Thereafter -$ -$
Below are the Statement of Net Position and Statement of Changes in Net Position for the Police and Fire OPEB Trust funds:
Combining Statement of Fiduciary Net Position
Police and Fire Health Care Trust Funds December 31, 2019
Combining Statement of Changes in Fiduciary Net Position Police and Fire Healthcare Trust Funds
December 31, 2019
637bPOLICE
HEALTHCAREFUND
638bFIRE
HEALTHCAREFUND
TOTAL HEALTHCARE
TRUSTFUNDS
ASSETSCash and cash equivalents 647,764$ 611,233$ 1,258,997$
Agency Bonds 10,950,526 16,451,135 27,401,661 Interest receivable 10,805 - 10,805
TOTAL ASSETS 11,609,095 17,062,368 28,671,463
LIABILITIESAccounts payable 27,590 39,049 66,639
TOTAL LIABILITIES 27,590 39,049 66,639
NET POSITIONRestricted for pension benefits and other purposes 11,581,505$ 17,023,319$ 28,604,824$
637bPOLICE
HEALTHCAREFUND
638bFIRE
HEALTHCAREFUND
TOTALHEALTHCARE
TRUSTFUNDS
ADDITIONS:Contributions Employer 703,706$ 509,090$ 1,212,796$ Other contributions - 2,614 2,614 Total contributions 703,706 511,704 1,215,410
Investment income Interest 252,702 382,194 634,896 Net appreciation (depreciation) in fair value 257,281 488,038 745,319 Net investment income 509,983 870,232 1,380,215
TOTAL ADDITIONS 1,213,689 1,381,936 2,595,625 DEDUCTIONS: Benefits 964,371 1,607,116 2,571,487 Administrative expense 38,507 48,143 86,650 TOTAL DEDUCTIONS 1,002,878 1,655,259 2,658,137 CHANGE IN NET POSITION
Postemployment healthcare benefits 210,811 (273,323) (62,512) NET POSITION RESTRICTED FOR POSTEMPLOYMENT HEALTHCARE BENEFITS
Postemployment healthcare benefits, January 1 11,370,694 17,296,642 28,667,336 NET POSITION - ENDING 11,581,505$ 17,023,319$ 28,604,824$

CITY OF EVERETT FINANCIAL SECTION
PAGE 74 2019 COMPREHENSIVE ANNUAL FINANCIAL REPORT
NOTE 9 - RISK MANAGEMENT
The City of Everett is exposed to various risks of loss from torts; theft of, damage to, or destruction of assets; business interruption; errors and omissions; injuries to employees; and natural disasters. The City combines the reporting of risk management activities into one internal service fund – The Self-Insurance Fund – to account for and finance uninsured risks. All departments of the City make payments through interfund assessments to the self-insurance fund based on estimates of the amounts needed to pay prior and current year claims and to establish a reserve for catastrophic losses. For the year ending 12/31/2019, the self-insured retention for general liability, auto liability (excluding transit), law enforcement liability, errors and omissions liability and employment practices liability was $1,250,000 per occurrence. Workers’ compensation is self-insured, and effective July 1, 2014, subject to a maximum retention of $1,500,000 for police officer, fire fighter and bus driver classifications per occurrence, and $1,000,000 for all other classifications per occurrence. Unemployment compensation costs are self-insured by paying the actual benefit cost. The liability arising out of the operations of the George Culmback Dam are also self-insured. The Culmback Dam is a joint project with Snohomish County PUD No. 1. As such, payment of claims and expenses would be jointly shared between the two entities. To date, there has never been a claim made arising out of the dam operations. The reserve balance in said fund is sufficient to address the current self-insured retention of $2,000,000. The City purchases commercial insurance for claims in excess of the self-insured retentions and for all other risks of loss. Settled claims have not exceeded this commercial coverage in any of the past three fiscal years. Everett Transit is a member of the Washington State Transit Insurance Pool (WSTIP). Liability coverage is provided through the Pool with limits of $20,000,000 and a $0 deductible for auto and general liability, and limits of $20,000,000 with a $5,000 deductible for public officials liability. Claims liabilities are based on the estimated ultimate cost of settling the claim, including case reserves and incurred but not reported (IBNR) claims. Case reserves for general, auto (excluding Transit), employment and law enforcement liabilities are estimated and projected by the Risk Management Division and the City’s third-party administrator on a case-by-case basis using historical experience. Case reserves for Transit liability claims are estimated by the Transit pool, WSTIP. Case reserves for workers’ compensation claims are estimated by the City’s third-party administrator using statistical reserving formulas and historical experience. Claims liabilities include estimates for expenses related to adjusting/investigating and defending the claim or lawsuit. At December 31, 2019, the estimated liability totaled $11,055,639, consisting of $7,187,212 for tort liability, $3,793,652 for workers’ compensation, and $74,775 for unemployment compensation. These estimates are based on the provisions of Governmental Accounting Standards Board Statement No. 10, which requires that a liability for claims be reported if information prior to the issuance of the financial statements indicates that it is probable that a liability has been incurred at the date of the financial statements and the amount of the loss can be reasonably estimated. Claims liabilities are not discounted. Changes in the funds’ claims liability amounts in fiscal 2018 and 2019 were:
BALANCE AT CURRENT CURRENT YEAR BALANCE ATBEGINNING OF YEAR CHANGES CLAIM FISCALFISCAL YEAR CLAIMS IN ESTIMATES PAYMENTS YEAR END
Tort Liability:2019 5,105,887 588,681 2,292,181 (799,537) 7,187,212 2018 4,433,267 460,184 1,458,258 (1,245,822) 5,105,887
Workers'Compensation:
2019 3,335,431 1,270,198 1,048,791 (1,860,768) 3,793,652 2018 4,399,890 994,713 (84,184) (1,974,988) 3,335,431
UnemploymentCompensation:
2019 100,794 86,279 2,741 (115,039) 74,775 2018 108,601 116,301 30,960 (155,068) 100,794

CITY OF EVERETT FINANCIAL SECTION
2019 COMPREHENSIVE ANNUAL FINANCIAL REPORT PAGE 75
In 1995, the City created a self-insured health benefits program for its employees as a means to contain rising health benefit costs. Health Benefits Reserve Fund 508 was established to account for the disbursement of actual medical expenses, associated administrative costs, and reserves for this program. The City added a self-insured dental benefit program in 2016. In order to mitigate its risk exposure, the City holds individual and aggregate stop loss insurance, and maintains both claims fluctuation and liability reserves. The claims fluctuation liability reserve was $2,641,094 at December 31, 2019 based on an analysis of the most recent twelve months of incurred claims with applied monthly completion factors, as required by Washington Administrative Code (WAC) 200-110-040(a). Changes in the fund’s claims liability in fiscal years 2018 and 2019 appear as follows:
BALANCE AT CURRENT CURRENT YEAR BALANCE ATBEGINNING OF YEAR CHANGES CLAIM FISCALFISCAL YEAR CLAIMS IN ESTIMATES PAYMENTS YEAR END
IBNR Liability2019 3,196,634 14,663,023 (555,541) (14,663,022) 2,641,094 2018 2,587,463 18,707,756 21,451 (18,120,036) 3,196,634

CITY OF EVERETT FINANCIAL SECTION
PAGE 76 2019 COMPREHENSIVE ANNUAL FINANCIAL REPORT
NOTE 10 - LONG-TERM DEBT
General Obligation Bonds The City issues general obligation bonds to finance the purchase, acquisition, and/or the construction of capital assets. General obligation bonds have been issued for both general government and business-type activities and are being repaid from the applicable resources. General obligation bonds are direct obligations and pledge the full faith and credit of the government. These bonds generally are issued as 20 to 25-year serial bonds. General obligation bonds outstanding at December 31, 2019, are as follows:
DATE OF AMOUNTDATE OF FINAL INTEREST ORIGINALLY REDEMPTIONS DEBT
NAME OF ISSUE / PURPOSE ISSUE MATURITY RATE(S) ISSUED TO DATE OUTSTANDING12 LTGO and Refunding Bonds - Capital 10-04-12 12-01-26 2.00-4.00% 13,935,000$ 4,775,000$ 9,160,000$ 14 Floating Rate LTGO Bonds - Capital 11-03-14 12-13-34 Variable 35,865,000 35,865,000 - 19 LTGO and Refunding Bonds - Capital 11-04-19 12-01-34 3.00-5.00% 20,070,000 - 20,070,000 TOTAL GENERAL OBLIGATION BONDS 69,870,000$ 40,640,000$ 29,230,000$
Business Activities 10 LTGO Bonds - capital 03-26-10 12-01-19 1.00-4.25% 10,500,000$ 10,500,000$ -$ Total Business Activities 10,500,000$ 10,500,000$ -$
TOTAL GENERAL OBLIGATION BONDS 80,370,000$ 51,140,000$ 29,230,000$
Annual debt service requirements to maturity for general obligation bonds are as follows:
YEAR ENDING TOTALDECEMBER 31, PRINCIPAL INTEREST REQUIREMENTS
2020 2,410,000 1,275,305 3,685,305 2021 2,940,000 1,125,490 4,065,490 2022 2,505,000 1,002,940 3,507,940 2023 1,965,000 916,090 2,881,090 2024 1,520,000 852,215 2,372,215
2025 - 2029 8,050,000 3,253,970 11,303,970 2030 - 2034 9,840,000 1,165,700 11,005,700
TOTAL 29,230,000$ 9,591,710$ 38,821,710$
GOVERNMENTAL ACTIVITES
Interest on the 2014 Floating Rate Bonds is paid at a rate to be determined weekly using the rate equal to the weekly Securities Industry and Financial Markets Association Municipal Swap Index (SIFMA). Revenue Debt The City issues bonds where the City pledges income derived from the acquired or constructed assets to pay the debt service. The revenue bonds listed below will be repaid solely from water/sewer customer net revenues and are payable through 2040. The total principal and interest remaining to be paid on the bonds is $213,230,066. Principal and interest expense for the current year and total customer net revenues were $14,294,951 and $49,698,024 respectively. Proceeds from the bonds were used for capital purposes related to improving the water/sewer system, including water distribution system improvements, pipeline replacements, water tanks rehabilitation, wastewater pollution control facility expansion, sewer system capacity improvements, and sewer system replacements.

CITY OF EVERETT FINANCIAL SECTION
2019 COMPREHENSIVE ANNUAL FINANCIAL REPORT PAGE 77
Revenue bonds outstanding at December 31, 2019 are as follows:
DATE OF AMOUNTDATE OF FINAL INTEREST ORIGINALLY REDEMPTIONS DEBT
NAME OF ISSUE / PURPOSE ISSUE MATURITY RATE(S) ISSUED TO DATE OUTSTANDING11 Water/Sewer Revenue Bonds - capital 03-09-11 12-01-35 2.5-5.0% 51,000,000 49,225,000 1,775,000 13 Water/Sewer Revenue Bonds - capital 03-01-13 12-01-30 3.0-5.0% 62,145,000 15,840,000 46,305,000 15 Water/Sewer Revenue Bonds - capital 11-03-15 12-01-40 2.0-5.0% 50,525,000 6,025,000 44,500,000 16 Water/Sewer Revenue Bonds - capital 12-01-16 12-01-35 3.1-5.0% 68,050,000 1,355,000 66,695,000 TOTAL REVENUE BONDS 231,720,000$ 72,445,000$ 159,275,000$
Annual debt service requirements to maturity for revenue bonds are as follows:
YEAR ENDING TOTALDECEMBER 31, PRINCIPAL INTEREST REQUIREMENTS
2020 8,135,000 6,162,701 14,297,701 2021 8,485,000 5,807,251 14,292,251 2022 8,855,000 5,435,201 14,290,201 2023 9,250,000 5,045,701 14,295,701 2024 9,660,000 4,637,501 14,297,501
2025 - 2029 54,285,000 17,173,988 71,458,988 2030 - 2034 41,035,000 7,542,182 48,577,182 2035 - 2039 16,645,000 2,048,169 18,693,169
2040 2,925,000 102,375 3,027,375 TOTAL 159,275,000$ 53,955,066$ 213,230,066$
BUSINESS-TYPE ACTIVITIES
Refunded Debt In 2019, the City issued $20,070,000 of general obligation refunding bonds and used existing resources of $1,437,664 to purchase US government securities that were placed in an irrevocable trust with an escrow agent for the purpose of generating resources for all future debt service payments on $25,630,000 of refunded 2014 Floating Rate Bonds. As a result, the refunded bonds are considered to be defeased and the liability has been removed from the governmental activities column of the statement of net position. This advance refunding was undertaken to reduce total debt service payments over the next 14 years by $984,604 and resulted in an economic gain of $863,020. In prior years, the City defeased certain general obligation bonds by placing the proceeds of new bonds in an irrevocable trust to provide for all future debt service payments on the old bonds. Accordingly, the trust account assets and the liability for defeased bonds are not included in the City’s financial statements. At December 31, 2019, $115,050,000 of bonds outstanding are considered defeased. Direct Borrowing The City has received government loans and other notes to provide for construction of capital projects. The Governmental Activities Public Works Trust Fund loan and tax exempt installment loans will be paid from the Capital Improvement Reserve Fund. The Business Activities Public Works Trust Fund loans, State Revolving Fund loans, and property purchase loans will be paid from water/sewer revenues.

CITY OF EVERETT FINANCIAL SECTION
PAGE 78 2019 COMPREHENSIVE ANNUAL FINANCIAL REPORT
Direct borrowing outstanding, as of December 31, 2019, is presented below:
DATE OF AMOUNTDATE OF FINAL INTEREST ORIGINALLY REDEMPTIONS DEBT
NAME OF ISSUE/PURPOSE ISSUE MATURITY RATE(S) ISSUED TO DATE OUTSTANDINGGovernmental ActivitiesPublic Works Trust Fund Loan - 112th Street 12-22-02 07-01-22 0.50% 1,000,000 834,704 165,296 Tax Exempt Installment Loan - LED Lighting 08-25-15 05-07-30 2.97% 1,362,903 314,299 1,048,604 Total Governmental Activities 2,362,903$ 1,149,003$ 1,213,900$
Business Activities PWTFL Sewer Basement Flooding Reduction 07-01-01 07-01-21 1.00% 1,881,000$ 1,683,000$ 198,000$ PWTFL Water Transmission Line 07-01-01 07-01-21 1.00% 4,252,792 3,805,817 446,975 PWTFL Cross-Town Effluent Pipeline 05-13-03 07-01-23 0.50% 5,490,000 4,331,000 1,159,000 PWTFL Water Transmission Lines #2-3 11-17-03 11-17-23 0.50% 841,671 662,016 179,655 PWTFL Treatment Plant Upgrade 04-25-05 07-01-25 0.50% 9,500,000 6,333,333 3,166,667 PWTFL Water Pollution Facility Expansion 06-25-06 07-01-26 0.50% 7,000,000 4,421,053 2,578,947 SRF Clearwell No. 2 03-03-06 10-01-25 1.50% 4,040,000 2,704,558 1,335,442 SRF Clearwell No. 2 12-21-07 10-01-26 1.50% 4,040,000 2,551,579 1,488,421 SRF Clearwell No. 2 03-03-08 10-01-27 1.50% 3,030,000 1,754,211 1,275,789 SRF Clearwell No. 2 08-22-08 10-01-28 1.50% 4,040,000 2,120,124 1,919,876 SRF Recovered Water Outfall 08-05-09 10-01-29 1.50% 1,376,473 651,974 724,499 SRF Bond Street CSO 02-26-14 03-06-33 2.90% 1,994,497 519,199 1,475,298 WPTFL WPCF Plant Expansion Phase C 01-31-13 06-01-32 0.50% 10,000,000 2,870,555 7,129,445 Mukilteo Water District 01-01-11 09-30-24 7.82% 140,883 111,687 29,196 Mailfinance Inc. 10-30-17 07-31-21 2.53% 70,214 40,550 29,664
Total Business Activities 57,697,530$ 34,560,656$ 23,136,874$
TOTAL OTHER LONG-TERM DEBT 60,060,432$ 35,709,658$ 24,350,774$
Annual debt service requirements to maturity for direct borrowing are as follows:
YEAR ENDING TOTAL TOTALDECEMBER 31, PRINCIPAL INTEREST REQUIREMENTS PRINCIPAL INTEREST REQUIREMENTS
2020 137,098 31,969 169,067 3,097,948 228,259 3,326,208 2021 139,533 29,259 168,792 3,091,719 196,056 3,287,775 2022 142,040 26,475 168,515 2,761,587 165,268 2,926,855 2023 89,524 23,618 113,142 2,764,399 140,256 2,904,655 2024 92,183 20,959 113,142 2,432,640 115,161 2,547,801
2025 - 2029 503,644 62,066 565,710 6,903,849 275,622 7,179,472 2030 - 2032 109,879 3,263 113,142 2,084,730 42,467 2,127,198
TOTAL 1,213,900$ 197,610$ 1,411,510$ 23,136,874$ 1,163,090$ 24,299,963$
GOVERNMENTAL ACTIVITES BUSINESS-TYPE ACTIVITES
Bond Covenants, Limitations and Restrictions At December 31, 2019, restricted assets of enterprise funds include $ 4,690,569 for bond redemption. The City has also purchased a surety policy to cover all outstanding Water and Sewer Revenue Bonds. These represent redemption funds and reserve requirements as contained in the various bond ordinances. There are a number of other limitations and restrictions contained in the various bond indentures. The City is in compliance with all significant limitations and restrictions. The outstanding tax exempt installment loan from direct borrowings related to government-type activities of $1,048,604 contains a provision that in an event of default, (1) outstanding amounts are due immediately, (2) properties acquired using the loan proceeds may be repossessed and disposed of.

CITY OF EVERETT FINANCIAL SECTION
2019 COMPREHENSIVE ANNUAL FINANCIAL REPORT PAGE 79
RCW 39.36.020 provides cities with three segments of debt capacity, each equal to two and one-half percent of the City’s assessed valuation, for a total debt capacity of seven and one-half percent (7.5%). Allowable uses of these segments are as follows: Segment 1 - General Governmental Purposes
The City can incur debt up to one and one-half percent (1.5%) of its assessed valuation solely with a vote of the legislative body (often referred to as “councilmanic” debt). To use the remaining one percent (1.0%), a 60 percent vote in favor of the issue by at least 40 percent of the voters voting in the last general election is required.
Segment 2 - City-Owned Water and Sewer Purposes The City can incur debt up to an additional two and one-half percent (2.5%) for water and sewer purposes with a 60 percent vote in favor of the issue by at least 40 percent of the voters voting in the last general election.
Segment 3 - Acquiring and Developing Open Space, Parks Facilities, and Capital Facilities Associated with Economic
Development The City can incur debt up to an additional two and one-half percent (2.5%) for acquiring and developing open space, parks facilities, and capital facilities associated with economic development with a 60 percent vote in favor of the issue by at least 40 percent of the voters voting in the last general election.
At December 31, 2019 the debt limits for the City were as follows:
Water & Sewer Park & CapitalPurposes Facilities
Without Vote With Vote With Vote With Vote(Councilmanic)
1.50% 1.00% 2.50% 2.50%
Legal Limits, Net 276,879,158$ 184,586,106$ 461,465,264$ 461,465,264$
Net Outstanding Indebtedness 30,443,900 - - -
Margin Available 246,435,258$ 184,586,106$ 461,465,264$ 461,465,264$
GovernmentalPurposes
Only general obligation debt is subject to the legal debt limit capacity restrictions. Revenue bonds and Local Improvement District (LID) bonds are not limited because no taxing power or general fund pledge is provided as security.
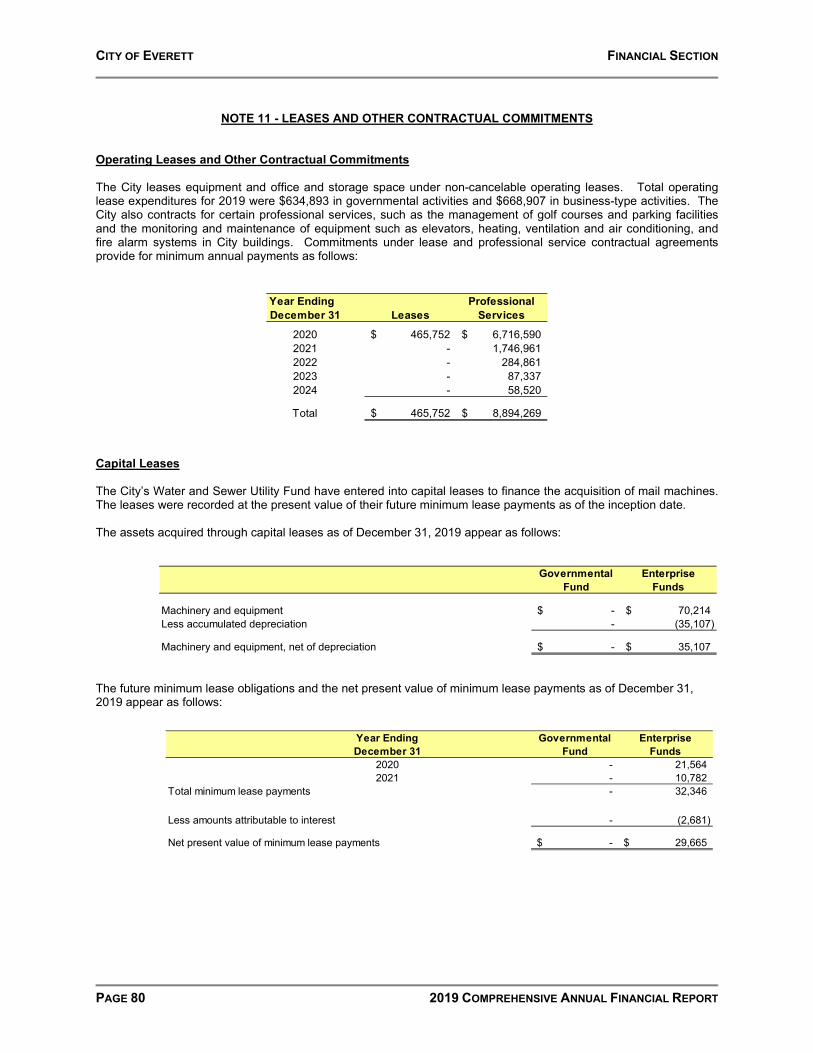
CITY OF EVERETT FINANCIAL SECTION
PAGE 80 2019 COMPREHENSIVE ANNUAL FINANCIAL REPORT
NOTE 11 - LEASES AND OTHER CONTRACTUAL COMMITMENTS
Operating Leases and Other Contractual Commitments The City leases equipment and office and storage space under non-cancelable operating leases. Total operating lease expenditures for 2019 were $634,893 in governmental activities and $668,907 in business-type activities. The City also contracts for certain professional services, such as the management of golf courses and parking facilities and the monitoring and maintenance of equipment such as elevators, heating, ventilation and air conditioning, and fire alarm systems in City buildings. Commitments under lease and professional service contractual agreements provide for minimum annual payments as follows:
Year Ending ProfessionalDecember 31 Leases Services
2020 465,752$ 6,716,590$ 2021 - 1,746,961 2022 - 284,861 2023 - 87,337 2024 - 58,520
Total 465,752$ 8,894,269$
Capital Leases The City’s Water and Sewer Utility Fund have entered into capital leases to finance the acquisition of mail machines. The leases were recorded at the present value of their future minimum lease payments as of the inception date. The assets acquired through capital leases as of December 31, 2019 appear as follows:
The future minimum lease obligations and the net present value of minimum lease payments as of December 31, 2019 appear as follows:
Year Ending Governmental EnterpriseDecember 31 Fund Funds
2020 - 21,564 2021 - 10,782
Total minimum lease payments - 32,346
Less amounts attributable to interest - (2,681)
Net present value of minimum lease payments -$ 29,665$
Governmental EnterpriseFund Funds
Machinery and equipment -$ 70,214$ Less accumulated depreciation - (35,107)
Machinery and equipment, net of depreciation -$ 35,107$

CITY OF EVERETT FINANCIAL SECTION
2019 COMPREHENSIVE ANNUAL FINANCIAL REPORT PAGE 81
Construction Commitments As of December 31, 2019, the City had other outstanding contractual commitments, which include construction and engineering contracts for capital projects currently in progress. The City's major significant outstanding contract obligations are summarized as follows:
Expended RemainingPROJECT To Date CommitmentVarious City Facilities Roofing/Siding projects 867,587$ 499,446$
Alverson Stormwater Separation Project 1,315,991 144,191
Cleveland Ave Sewer System Replacement 5,771,225 216,687
Everett Downtown Streetscape Rucker - Hoyt 6,683,922 3,579,717
Grand Avenue Park Bridge 11,972,645 2,156,696
North Wetmore Stormwater Separation 3,221,236 174,499
Pacific Ave to Interurban Trail Bicycle Safety Project 303,689 216,467
Watermain Replacement "Q" Evergreen Way 1,630,841 198,077
Watermain Replacement "U" - 1,698,633
WPCF FEN Chlorination Building Upgrade 7,528,021 205,697
Everett parks improvement projects 4,887,574 3,001,782
Total 44,182,733$ 12,091,893$

CITY OF EVERETT FINANCIAL SECTION
PAGE 82 2019 COMPREHENSIVE ANNUAL FINANCIAL REPORT
NOTE 12 - CHANGES IN LONG-TERM LIABILITIES
Changes in Long-term Liabilities During the year ended December 31, 2019, the following changes occurred in long-term liabilities:
Beginning EndingBalance Balance Due Within01/01/19 Additions Reductions 12/31/19 One Year
Governmental ActivitiesBonds payable:
General obligation bonds 35,590,000$ 20,070,000$ (26,430,000)$ 29,230,000 2,410,000$ Plus deferred amounts:
For issuance premiums 563,050 4,306,966 (70,381) 4,799,635 357,512 Total bonds payable: 36,153,050 24,376,966 (26,500,381) 34,029,635 2,767,512
Direct Borrowing 1,348,633 - (134,733) 1,213,900 137,098 Pollution remediation liability 3,349,457 - - 3,349,457 1,104,457 Asset retirement obligation - 270,000 - 270,000 - OPEB Liabilities 44,864,787 3,889,937 (264,759) 48,489,965 - Net Pension Liabilities 17,181,524 13,680,197 (17,181,524) 13,680,197 - Claims and judgements 11,738,746 19,951,894 (17,993,907) 13,696,733 7,113,264 Compensated absences 14,061,186 9,470,254 (9,311,208) 14,220,232 4,680,976 Governmental activity
long-term liabilities: 128,697,383$ 71,639,248$ (71,386,512)$ 128,950,119$ 15,803,307$
Business-Type ActivitiesBonds payable:
General obligation bonds 1,000,000$ -$ (1,000,000)$ -$ -$ Revenue bonds 167,020,000 - (7,745,000) 159,275,000 8,135,000 Plus deferred amounts:
For issuance premiums 14,030,160 - (1,071,823) 12,958,337 1,068,973 Total bonds payable: 182,050,160 - (9,816,823) 172,233,337 9,203,973
Direct Borrowing 26,230,402 - (3,093,528) 23,136,874 3,097,948 Pollution remediation liability 1,121,500 - (677,908) 443,592 143,592 Net Pension Liabilities 13,732,715 9,059,393 (13,732,715) 9,059,393 - Compensated absences 2,655,677 3,573,317 (3,402,922) 2,826,072 1,434,132 Business-type activity
long-term liabilities: 225,790,454$ 12,632,710$ (30,723,896)$ 207,699,268$ 13,879,645$
Internal service funds predominantly serve the governmental funds. Accordingly, long-term liabilities related to internal service funds are included as part of the above totals for governmental activities. At year-end $165,662 of internal service funds compensated absences and $3,277,523 of internal service funds pension cost liability are included in the above amounts. Claims and judgments and OPEB liabilities are generally liquidated by the general fund. Compensated absences and pension liabilities are liquidated by the funds in which the liabilities are recorded.

CITY OF EVERETT FINANCIAL SECTION
2019 COMPREHENSIVE ANNUAL FINANCIAL REPORT PAGE 83
NOTE 13 - CONTINGENCIES AND LITIGATION
In the normal course of its various operations, the City is involved in lawsuits and is the recipient of claims for damages alleging the City is responsible for damage incurred by third parties. Claims and/or litigation arise in such areas as police civil liability, automobile liability, street and sidewalk design and/or maintenance, zoning, building and other land-use regulations, equipment operation, as well as other areas. These claims or lawsuits are a relatively natural consequence of conducting the City's business. The City of Everett self-insures to cover the majority of its liability risk. The City has recorded in its financial statements all material liabilities, including an estimate for situations which are not yet resolved, but where, based on available information, management believes it is probable that the City will have to make payment. In the opinion of management, the City's insurance policies and self-insurance reserves are adequate to pay all known or pending claims. The City participates in a number of federal- and state-assisted programs. These grants are subject to audit by the grantors or their representatives. Such audits could result in requests for reimbursement to grantor agencies for expenditures disallowed under the terms of the grants. City management believes that such disallowances, if any, would be immaterial.
NOTE 14 - INTERFUND BALANCES AND TRANSFERS Loans between funds are classified as either interfund loans receivable and payable or advances to and from other funds, depending on the time period for which the loan was made. The City uses interfund loans primarily to meet short-term cash flow requirements while waiting for grant reimbursements. Advances to and from other funds are typically loans that are not expected to be repaid within one year from the date of the financial statements. There is currently one outstanding advance between the General Fund and Golf. It was established to internally finance Golf general obligation bonds that were called in 2007 and 2008 and to finance operating deficits that occurred in 2008 and early 2009. All long-term advances have planned repayment schedules. Interfund loan balances at December 31, 2019 appear as follows:
INTERFUND INTERFUND ADVANCES ADVANCESLOANS LOANS TO OTHER FROM OTHER
RECEIVABLE PAYABLE FUNDS FUNDS
General Fund 159,825$ -$ 6,134,168$ -$ Nonmajor Governmental Funds - 159,825 - - Nonmajor Enterprise Funds - - - 6,134,168
TOTAL 159,825$ 159,825$ 6,134,168$ 6,134,168$
Interfund transfers are the flow of assets without a reciprocal return of assets, goods or services in return. The City uses transfers to (1) move revenues from the fund that statute or budget requires to collect them to the fund that statute or budget requires to expend them, (2) move receipts restricted to debt service from the funds collecting the receipts to the debt service fund as debt service payments become due, and (3) use unrestricted revenues collected in the general fund to finance various programs accounted for in other funds in accordance with budgetary authorizations.

CITY OF EVERETT FINANCIAL SECTION
PAGE 84 2019 COMPREHENSIVE ANNUAL FINANCIAL REPORT
Interfund transfer activity for the year ending December 31, 2019 appears as follows:
A transfer is considered significant if it is for a transaction that does not occur on a routine basis or is inconsistent with the customary activities of the fund making the transfer. In 2019, the following significant transfers were completed:
• $1,110,090 from Fund 002 – General Fund, to Fund 210 – Debt Service Fund • $2,575,398 from Fund 002 – General Fund, to Fund 301 – Capital Improvement Reserve Fund • $2,395,508 from Fund 156 – Criminal Justice Fund, to Fund 002 – General Fund. • $1,499,930 from Fund 159 – Transportation Benefit District, To Fund 119 – Public Works – Street
Improvement, a Special Revenue Fund. • $1,025,027 from Fund 301 – Capital Improvement Reserve Fund, to General Fund • $1,880,929 from Fund 301 – Capital Improvement Reserve Fund, to Fund 210 – Debt Service Fund
NOTE 15 - RECEIVABLE AND PAYABLE BALANCES
Receivables at December 31, 2019 appear as follows:
Bond Water Nonmajor InternalGeneral Redemption & Sewer Governmental Enterprise Service
Fund Fund Utility Transit Funds Funds Funds TOTALTRANSFERS OUT
General Fund -$ 1,110,090$ 39,082$ 6,336$ 2,635,398$ 285,940$ 22,809$ 4,099,655$ Water & Sewer Utility 6,422,784 - - - - - 21,008 6,443,792 Transit 318,555 - - - - - - 318,555 Nonmajor Governmental Funds 3,604,596 1,880,929 - - 20,669,900 - - 26,155,425 Nonmajor Enterprise Funds - - - - - - 12,005 12,005
TOTAL 10,345,935$ 2,991,019$ 39,082$ 6,336$ 23,305,298$ 285,940$ 55,822$ 37,029,432$
TRANSFERS IN
Customer Due from Other NotesTaxes Accounts Interest Governments Receivable TOTAL
Governmental Activities:General Fund 12,201,730$ 2,134,221$ 448,654$ 20,565,627$ 127,739$ 35,477,971$ Nonmajor Governmental Funds 1,801,096 1,292,468 250,476 3,883,716 13,487,350 20,715,106 Internal Service Funds - 192,482 118,645 - 29,207 340,334
Total Governmental Activities 14,002,826$ 3,619,171$ 817,775$ 24,449,343$ 13,644,296$ 56,533,411$
Business-Type Activities:Water & Sewer Utility -$ 7,137,274$ 476,433$ 848,122$ -$ 8,461,829$ Transit 3,578,870 74,129 29,769 1,213,429 - 4,896,197 Nonmajor Enterprise Funds - 188,912 25,150 22,581 - 236,643
Total Business-Type Activities 3,578,870$ 7,400,315$ 531,352$ 2,084,132$ -$ 13,594,669$
Governmental Activities General Fund - Customer Accounts include $665,000 from PFD for Scoreboard Due from Other Governments include $29,391,580 from PFD for 2019 Refunding Bonds (See Note 1) and $55,065 from PFD for accrued interest on Scoreboard loan Notes Receivable excludes $1,012,261 discount on notes reported in the Government Wide Statement of Net Position The receivables from PFD are not expected to be collected within one year

CITY OF EVERETT FINANCIAL SECTION
2019 COMPREHENSIVE ANNUAL FINANCIAL REPORT PAGE 85
Payables at December 31, 2019 appear as follows:
Wages & Accounts Due to Other Custodial OtherBenefits Payable Interest Taxes Governments Accounts Liabilities TOTAL
Governmental Activities:General Fund $3,003,981 $2,025,770 45,062$ 3,987$ 171,338$ 312,480$ 693,420$ 6,256,038$ Nonmajor Governmental Funds 396,871 1,352,045 - 6,230 112,336 - 3,767 1,871,249 Internal Service Funds 50,631 619,081 - 506 - - 207,430 877,648
Total 3,451,483$ 3,996,896$ 45,062$ 10,723$ 283,674$ 312,480$ 904,617$ 9,004,935$
Business-Type Activities:Water & Sewer Utility 551,689$ 1,646,894$ 601,169$ 167,481$ -$ -$ 1,031,732$ 3,998,965$ Transit 279,586 877,873 - 2,484 482,606 750,000 - 2,392,549 Nonmajor Enterprise Funds 19,510 288,556 - 13,767 - - - 321,833
Total 850,785$ 2,813,323$ 601,169$ 183,732$ 482,606$ 750,000$ 1,031,732$ 6,713,347$
The wages and benefits total excludes the following short term vacation and sick leave accruals which are included with non-current liabilities at the entity wide level:
Governmental Activities Internal Service Fund 102,532$
Business-Type Activities Water and Sewer 910,968$ Transit 490,352 Nonmajor Enterprise 32,813
1,434,133$
NOTE 16 - JOINT VENTURES AND RELATED ORGANIZATIONS Joint Ventures - The City, in conjunction with other governmental entities, participates in six joint ventures. Using the same criteria applied to the other organizations to determine the reporting entity, these joint ventures have not been included in the City’s annual financial statements. The Snohomish River Regional Water Authority (SRRWA) was created for the planning, development, ownership, management and financing of water supply sources and transmission, and other water supply facilities, either by itself or in cooperation with other municipal providers of utilities. The primary purpose is to facilitate efficient water resource development and utilization through interlocal cooperation. The SRRWA board is comprised of one representative of each of three members, who is an elected public official designated in writing, authorized to represent the member in meetings of the membership and Board of Directors. The City has a 41.67 percent interest in the joint venture at December 31, 2019 and recorded an investment in the joint venture in the utility fund of $669,332. As of December 31, 2019, the SRRWA had accumulated sufficient resources and was not experiencing any fiscal stress. Separate financial statements for the joint venture may be obtained from the City of Everett, Utilities Finance Manager, 3200 Cedar Street, Everett, WA 98201. One Regional Card for All (ORCA) was established by interlocal agreement for the operating phase of the Regional Fare Integration Project also known as the Smart Card Project. This agreement among City of Everett (Everett Transit), Snohomish County Transit Authority (Community Transit), Sound Transit, King County Metro, Pierce Transit, Kitsap Transit and Washington State Ferries commenced April 1, 2009. Pursuant to the Interlocal Cooperation Act, chapter 39.34 RCW, the participating agencies jointly exercise their powers to better coordinate their respective services and fare payment systems in order to improve the availability, reliability and convenience of public transportation services within their service areas and throughout the region served by the agencies. Everett Transit’s undivided interest in the assets, liabilities and operations of the ORCA smart card are consolidated within these financial statements on a proportionate basis. Everett Transit’s interest in the central cash accounts as of December 31, 2019, is $278,078 which represents unearned fare revenue. Everett Transit’s percentage share of the operating expense for 2019 was 0.76% and capital expense is 0.76%. Separate financial statements for the joint venture may be obtained from Sound Transit, ORCA Regional Fare Coordination System, 401 S Jackson St, Seattle, WA 98104-2826. Snohomish County 911 (SnoCo911) is a cash basis, special purpose district, created under the Interlocal Cooperation Act as codified in RCW 39.34. This established the statutory authority necessary for Snohomish County, the cities, towns, fire districts, police districts and other service districts to enter into a contract and agreement to jointly establish, maintain and operate a support communications center. As of January 1, 2019, SnoCo911 assumed control and management of SERS activities. Control of SnoCo911 is with a 16-member Board of Directors which is
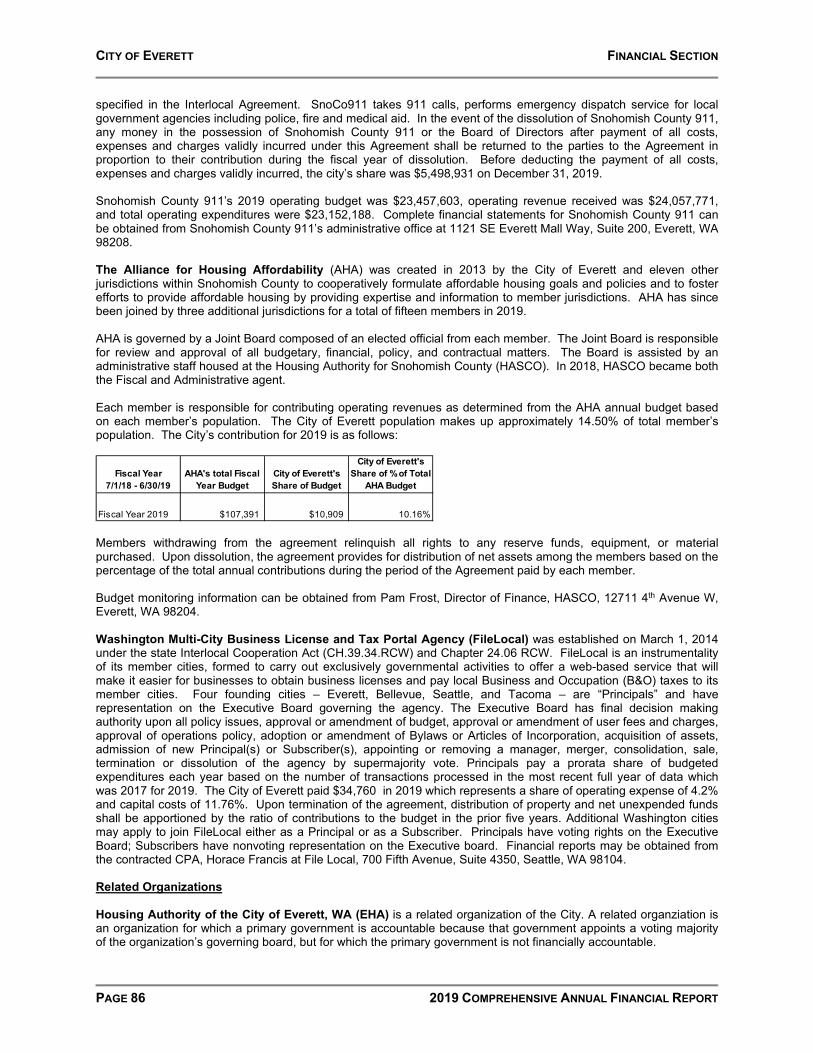
CITY OF EVERETT FINANCIAL SECTION
PAGE 86 2019 COMPREHENSIVE ANNUAL FINANCIAL REPORT
specified in the Interlocal Agreement. SnoCo911 takes 911 calls, performs emergency dispatch service for local government agencies including police, fire and medical aid. In the event of the dissolution of Snohomish County 911, any money in the possession of Snohomish County 911 or the Board of Directors after payment of all costs, expenses and charges validly incurred under this Agreement shall be returned to the parties to the Agreement in proportion to their contribution during the fiscal year of dissolution. Before deducting the payment of all costs, expenses and charges validly incurred, the city’s share was $5,498,931 on December 31, 2019. Snohomish County 911’s 2019 operating budget was $23,457,603, operating revenue received was $24,057,771, and total operating expenditures were $23,152,188. Complete financial statements for Snohomish County 911 can be obtained from Snohomish County 911’s administrative office at 1121 SE Everett Mall Way, Suite 200, Everett, WA 98208. The Alliance for Housing Affordability (AHA) was created in 2013 by the City of Everett and eleven other jurisdictions within Snohomish County to cooperatively formulate affordable housing goals and policies and to foster efforts to provide affordable housing by providing expertise and information to member jurisdictions. AHA has since been joined by three additional jurisdictions for a total of fifteen members in 2019. AHA is governed by a Joint Board composed of an elected official from each member. The Joint Board is responsible for review and approval of all budgetary, financial, policy, and contractual matters. The Board is assisted by an administrative staff housed at the Housing Authority for Snohomish County (HASCO). In 2018, HASCO became both the Fiscal and Administrative agent. Each member is responsible for contributing operating revenues as determined from the AHA annual budget based on each member’s population. The City of Everett population makes up approximately 14.50% of total member’s population. The City’s contribution for 2019 is as follows:
Fiscal Year 7/1/18 - 6/30/19
AHA's total Fiscal Year Budget
City of Everett's Share of Budget
City of Everett's Share of % of Total
AHA Budget
Fiscal Year 2019 $107,391 $10,909 10.16% Members withdrawing from the agreement relinquish all rights to any reserve funds, equipment, or material purchased. Upon dissolution, the agreement provides for distribution of net assets among the members based on the percentage of the total annual contributions during the period of the Agreement paid by each member. Budget monitoring information can be obtained from Pam Frost, Director of Finance, HASCO, 12711 4th Avenue W, Everett, WA 98204. Washington Multi-City Business License and Tax Portal Agency (FileLocal) was established on March 1, 2014 under the state Interlocal Cooperation Act (CH.39.34.RCW) and Chapter 24.06 RCW. FileLocal is an instrumentality of its member cities, formed to carry out exclusively governmental activities to offer a web-based service that will make it easier for businesses to obtain business licenses and pay local Business and Occupation (B&O) taxes to its member cities. Four founding cities – Everett, Bellevue, Seattle, and Tacoma – are “Principals” and have representation on the Executive Board governing the agency. The Executive Board has final decision making authority upon all policy issues, approval or amendment of budget, approval or amendment of user fees and charges, approval of operations policy, adoption or amendment of Bylaws or Articles of Incorporation, acquisition of assets, admission of new Principal(s) or Subscriber(s), appointing or removing a manager, merger, consolidation, sale, termination or dissolution of the agency by supermajority vote. Principals pay a prorata share of budgeted expenditures each year based on the number of transactions processed in the most recent full year of data which was 2017 for 2019. The City of Everett paid $34,760 in 2019 which represents a share of operating expense of 4.2% and capital costs of 11.76%. Upon termination of the agreement, distribution of property and net unexpended funds shall be apportioned by the ratio of contributions to the budget in the prior five years. Additional Washington cities may apply to join FileLocal either as a Principal or as a Subscriber. Principals have voting rights on the Executive Board; Subscribers have nonvoting representation on the Executive board. Financial reports may be obtained from the contracted CPA, Horace Francis at File Local, 700 Fifth Avenue, Suite 4350, Seattle, WA 98104. Related Organizations Housing Authority of the City of Everett, WA (EHA) is a related organization of the City. A related organziation is an organization for which a primary government is accountable because that government appoints a voting majority of the organization’s governing board, but for which the primary government is not financially accountable.

CITY OF EVERETT FINANCIAL SECTION
2019 COMPREHENSIVE ANNUAL FINANCIAL REPORT PAGE 87
The Housing Authority of the City of Everett (EHA) was created in 1942 as a public body corporate and politic to provide safe, descent, and sanitrary housing for low and moderate income residents of the City of Everett. EHA is a legally separate entity, governed by a six-member Board of Commissioners appointed by the Mayor for five-year terms, subject to approval by the City Council. The Board approves the policies of EHA and hires the Executive Director who directs the daily operations of EHA. The City does not have the ability to affect the operations of EHA, nor does EHA provide a financial benefit to or impose a financial burden on the City. As the City of Everett is not financially accountable for EHA, the financial information of EHA is not included in the financial statements of the City. Financial information may be obtained from Executive Director, Housing Authority of the City of Everett, 3107 Colby Avenue, Everett, WA, 98201.
NOTE 17 - POLLUTION REMEDIATION AND ASSET RETIREMENT OBLIGATIONS Pollution Remediation Obligations The City recorded the following pollution remediation obligations as other liabilities in its financial statements as of December 31, 2019, in accordance with GASB Statement No. 49:
GOVERNMENTAL BUSINESS-TYPESITE ACTIVITIES ACTIVITIES
4000 Block South Second Avenue $ 1,400,000
2731 36th Street Southeast 100,000 2808 10th Street 459,542 721 E. Marine View Dr 639,915 145 Alverson Boulevard 750,000 144 West Marine View Drive 300,000$ 3600 Smith Street 143,592
TOTALS 3,349,457$ 443,592$
The City identified a release of contaminants at the 4000 block of South Second Avenue, Everett, Washington, and will be pursuing a Voluntary Cleanup Program (VCP) agreement with the Washington State Department of Ecology (DOE) when the project commences. As of December 31, 2019, the City estimated the liability with regard to pollution remediation at this site to be $1,400,000. The City identified a release of contaminants at 2731 36th Street Southeast, Everett, Washington, and entered into a VCP agreement with the DOE to remediate the site in previous periods. The City remediated the soil contamination portion of the site during 2010 and then let lapse the VCP agreement with DOE. In the interim, the City continued to test and manage the site under a voluntary action for groundwater. At the completion of the interim action, a VCP agreement is expected to be re-engaged. As of December 31, 2019, the City concluded that additional remediation was needed, and estimated the liability with regard to pollution remediation at this site to be $100,000. Three sites located at 2808 10th Street, 721 E. Marine View Drive, and 145 Alverson Boulevard, Everett, Washington were identified as contaminated by releases from the neighboring former ASARCO plant. As of December 31, 2019, the City estimated the liability with regard to pollution remediation at these sites to be $459,542, $639,915, and $750,000, respectively. The site located at 144 West Marine View Drive, Everett, Washington had previously been identified as contaminated by releases from the neighboring former ASARCO plant. The City voluntarily remediated the site in 1998 in conjunction with a VCP agreement with the DOE. The City had expected to receive a notice of no further action from the DOE upon completion of the DOE’s Final Cleanup Action Plan for ASARCO. The City’s original VCP agreement expired, a new VCP agreement was reinstated in 2008, and the DOE requested the City to send the DOE an analysis
CITY OF EVERETT FINANCIAL SECTION
PAGE 88 2019 COMPREHENSIVE ANNUAL FINANCIAL REPORT
of current soil samples at the site. The City engaged an independent engineering firm to analyze soil samples at the site and submit its findings to the DOE, this work was performed during 2009, and the City submitted several alternative remediation proposals to the DOE for consideration. As of December 31, 2019, the City estimated liability with regard to pollution remediation at this site to be $300,000. The land at 3600 Smith Street for a new transit operations center was purchased in 2017. Per purchase agreement, the City set up an environmental holdback $750,000, from which the City may withdraw if the City incurs costs for eligible remediation work in excess of $821,500. An engineering report estimated cleanup cost $1.1 million. DOE has accepted Cleanup Action Plan and VCP site work was begun in 2017 and continued into 2019. DOE will continue to monitor groundwater quality. As of December 31, 2019, the City estimated liability with regard to pollution remediation at this site to be $143,592. The estimated liability for each of these sites was prepared using the Expected Cash Flow Technique, which measures the liability as the sum of probability-weighted amounts in a range of possible estimated amounts. This is an estimate only, and potential for change exists resulting from price fluctuations, technology changes or changes in applicable laws or regulations. The estimates and underlying assumptions will be re-evaluated on an annual basis. Asset Retirement Obligations The City is obligated by Washington Administrative Code (WAC) to take specific actions when retiring underground storage tanks (USTs) in accordance with section WAC 173-360A-0810. The Code requires that the City take certain steps to permanently take USTs out the service including the removal, transportation and disposal of liquid, sludge, hazardous waste, as well as removal or capping tanks and piping. The City currently has 9 underground tanks with a remaining useful life ranging from 1 to 4 years. The ARO for the underground storage tanks was estimated at $270,000 as of December 31, 2019 based on the best estimate of City management representatives with expertise in environmental issues.
NOTE 18 - TAX ABATEMENTS As of December 31, 2019, the City provides tax abatements through two programs – the Multifamily Housing Property Tax Exemption, and the New Job Tax Credit. Multifamily Housing Property Tax Exemption The Multifamily Housing Property Tax Exemption program provides property tax exemptions to stimulate the construction of new multifamily housing and the rehabilitation of existing vacant and underutilized buildings for multifamily housing in the City’s urban center, in keeping with the goals of the Growth Management Act (Chapter 36.70A RCW). The value of new construction, conversion, and rehabilitation improvements qualifying under this program are exempt from ad valorem property taxation for:
• Ten years provided applications have been submitted prior to July 22, 2007;
• Eight years if applications were submitted on or after July 22, 2007; or
• Twelve years if applications were submitted on or after July 22, 2007, the property otherwise qualifies for the exemption under Chapter 84.14 RCW, and the owner commits to renting or selling at least twenty percent of the multifamily housing units as affordable housing units to low- and moderate-income households.
Tax exemptions are obtained through application by the property owner to the Director of Planning and Community Development. Property owners receiving tax exemptions are required to file a notarized annual declaration with the Director indicating ongoing compliance, which is verified by City staff through an on-site verification. New Jobs Tax Credit The purpose of the New Jobs Tax Credit is to encourage business growth or relocation into the City. In order to qualify for the tax credit, businesses must create fifty or more new full-time employment positions within four consecutive quarters. The credit is equal to one thousand dollars for each new full-time employment position

CITY OF EVERETT FINANCIAL SECTION
2019 COMPREHENSIVE ANNUAL FINANCIAL REPORT PAGE 89
created, and is used to reduce the amount of Business & Occupation tax owed by the business. A business may claim credit under this program multiple times, up to a cap of five hundred thousand per business. Businesses must complete an application and submit it to the City Clerk. Businesses receiving the New Jobs Tax Credit must maintain the total number of full-time employment positions existing at the time the credit is claimed for a period of three years. If the business does not maintain the total number of full-time employment positions for three years, the credit will be forfeit and the business will be required to pay any amount of credit previously received.
Tax Abatement Program Amount of Taxes Abated Multifamily Property Tax Exemption $116,511 New Jobs Tax Credit $139,650
State of Washington Sales Tax Exemptions The State of Washington has tax abatement agreements that allow for sales/use tax exemptions and deferrals. State exemptions that apply to the City of Everett include: Exemption for Computer Hardware, Software, and Peripherals (Aerospace) Sales of computer hardware, computer peripherals, or software, used primarily in the development, design, and engineering of aerospace products or in providing aerospace services, or to sales of or charges made for labor and services rendered in respect to installing the computer hardware, computer peripherals, or software are exempt from retail sales tax per RCW 85.08.975 and 82.12.975. The amount of taxpayer savings in 2019 was $934,216. High Technology Sales and Use Tax Deferral The State established a program of business and occupation tax credits for qualified research and development expenditures as well as a tax deferral program for high-technology research and development and pilot scale manufacturing facilities per RCW 82.63. The State of Washington is prohibited by RCW 82.32.330 from disclosing detail on the amount of abatements provided. Exemption for the Construction of New Facilities Used to Manufacture Commercial Airplanes, Fuselages, or Wings of Commercial Airplanes (Aerospace) Purchases for the construction of new buildings, including labor and services rendered, used to manufacture commercial airplanes or fuselages or wings of commercial airplanes are exempt from sales and use tax per RCW 82.08.980 and 82.12.980. The exemption also applies to new buildings or parts of new buildings used for storing raw materials or finished products used to manufacture commercial airplanes and certain commercial airplane parts. Port districts, political subdivisions, or municipal corporations may also use the sales and use tax exemption when constructing new facilities to lease to these manufacturers. The eligible purchaser must present a Buyers' Retail Sales Tax exemption Certificate to the seller at the time of purchase. The State of Washington is prohibited by RCW 82.32.330 from disclosing detail on the amount of abatements provided.
NOTE 19 - OTHER DISCLOSURES
A. PRIOR PERIOD ADJUSTMENTS
In 1999, the City and Kimberley-Clark (K-C) agreed to jointly build a deep water outfall into Possession Sound. Under a Joint Use Agreement, K-C owned 50.5% and Everett owned 49.5%. Total project costs in 2005 were $19,667,999. The City and K-C shared operation and maintenance costs until K-C mill shut down, at which time the City entered into a Form of Bill of Sale with K-C and assumed full ownership of the outfall by the First Amendment to the Joint Use Agreement. The bill of sale transferred and conveyed the K-C Capacity and the Joint use Facilities and all existing property rights known at the time of the execution of the amendment to vest in the City the ownership of, and all rights to operate, the Joint Use Facilities. The amendment was adopted by City Council in August 2015.
In 2019, Everett recorded the transfer of the outfall in the Utilities fund at the original K-C 50.5% share of $9,932,340 and accumulated depreciation of $1,986,468. The effect of this transfer was a capital contribution in a prior period of $7,945,872.

CITY OF EVERETT FINANCIAL SECTION
PAGE 90 2019 COMPREHENSIVE ANNUAL FINANCIAL REPORT
B. SPECIAL ITEMS
The city issued the 2019 LTGO and Refunding Bonds to defease the 2014 Floating Rate LTGO Bonds and recorded a loss of $3,970,077. Gains or losses on refunding are generally deferred and amortized over the shorter of the life of the refunded bonds or the new bond issue. Due to the unusual terms of the 2014 issue, the bonds had a mandatory refund date of 2019, making the life of the refunded issue zero years. The loss on refunding is therefore reported as a current period loss in its entirety.
The Everett Public Facilities District recognized a reduction of debt payable to the City of Everett of $3,826,011 as a result of the same refunding activity.
C. SUBSEQUENT EVENTS
In February 2020, the Governor of the state of Washington declared a state of emergency in response to the spread of a deadly new virus. In the weeks following the declaration, precautionary measures to slow the spread of the virus were ordered. These measures include closing schools, colleges and universities, cancelling public events, prohibiting public and private gatherings, and requiring people to stay home unless they are leaving for an essential function.
In response to the Governor’s mandate, the City closed all non-essential services and required all employees able to do so to telecommute. An initial assessment of the economic impact on revenues projects a loss of revenue between $11.4 million and $21.1 million, with a weighted average loss of $14 million, or about 10%, in 2020 and continuing revenue reductions in 2021 and beyond.
Budget amendments propose a reduction in force through the combined use of voluntary separation (VSP), layoffs and furloughs that include 160 full and part-time positions as well as the suspension of programs such as the senior center, Forest Park swimming pool, and parks, recreation and arts programs for an initial budget reduction of about $2.5 million.
At the time of the issue of these statements, the City was in Phase 2 of a 4-phase State recovery plan with precautionary measures still in place. The length of time these measures will be in place, and the full extent of the financial impact on the City of Everett is unknown at this time.
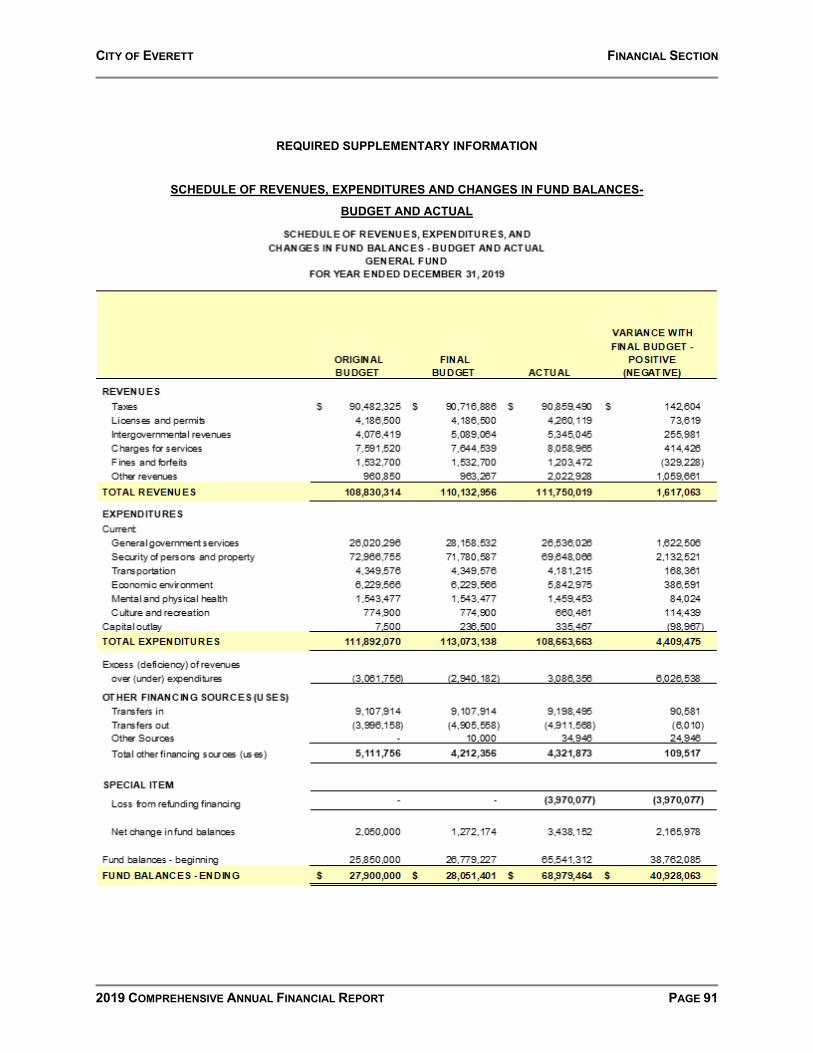
CITY OF EVERETT FINANCIAL SECTION
2019 COMPREHENSIVE ANNUAL FINANCIAL REPORT PAGE 91
REQUIRED SUPPLEMENTARY INFORMATION
SCHEDULE OF REVENUES, EXPENDITURES AND CHANGES IN FUND BALANCES-
BUDGET AND ACTUAL

CITY OF EVERETT FINANCIAL SECTION
PAGE 92 2019 COMPREHENSIVE ANNUAL FINANCIAL REPORT
Required Supplementary Information
Schedule of Revenues, Expenditures, and Changes in Fund Balances – Budget and Actual
Note to RSI Note A – Explanation of Difference between General Fund Budgetary Revenues and Expenditures and GAAP Revenues and Expenditures The annual budgets are adopted on a basis consistent with generally accepted accounting principles. With the implementation of GASB 54, the funds listed below, which were previously reported as Special Revenue funds will continue to be budgeted and operational, but will be consolidated with the General Fund for reporting purposes.
Revenues
Actual Amount 111,750,019$
Differences - Budget to GAAP Add funds no longer meeting the definition of special revenue funds per GASB Statement No. 54 to General Fund
Parks & Recreation Fund 8,712,606 Library Fund 4,851,430 Municipal Arts Fund 738,945 Conference Center Fund 119,391 Motor Vehicle Equip Repl Fund 1,135,381 Cum Reserve Real Prop Acq Fund 55,984 Property Management Fund 701,797 Senior Center Reserve Fund 75,285 Contingency Reserve Fund (8,516)
Total revenues as reported on the statement of revenues, expenditures, and changes in fund balance - general fund 128,132,322$
Expenditures
Actual Amount 108,663,663$
Differences - Budget to GAAP Add funds no longer meeting the definition of special revenue funds per GASB Statement No. 54 to General Fund
Parks & Recreation Fund 8,280,305 Library Fund 4,608,457 Municipal Arts Fund 856,489 Conference Center Fund 37,440 General Gov’t Special Proj Fund 8,860 Motor Vehicle Equip Repl Fund 4,645,346 Cum Reserve Real Prop Acq Fund 100,546 Property Management Fund 1,956,141 Senior Center Reserve Fund 67,143
Total expenditures as reported on the statement of revenues, expenditures, and changes in fund balance - general fund 129,224,390$
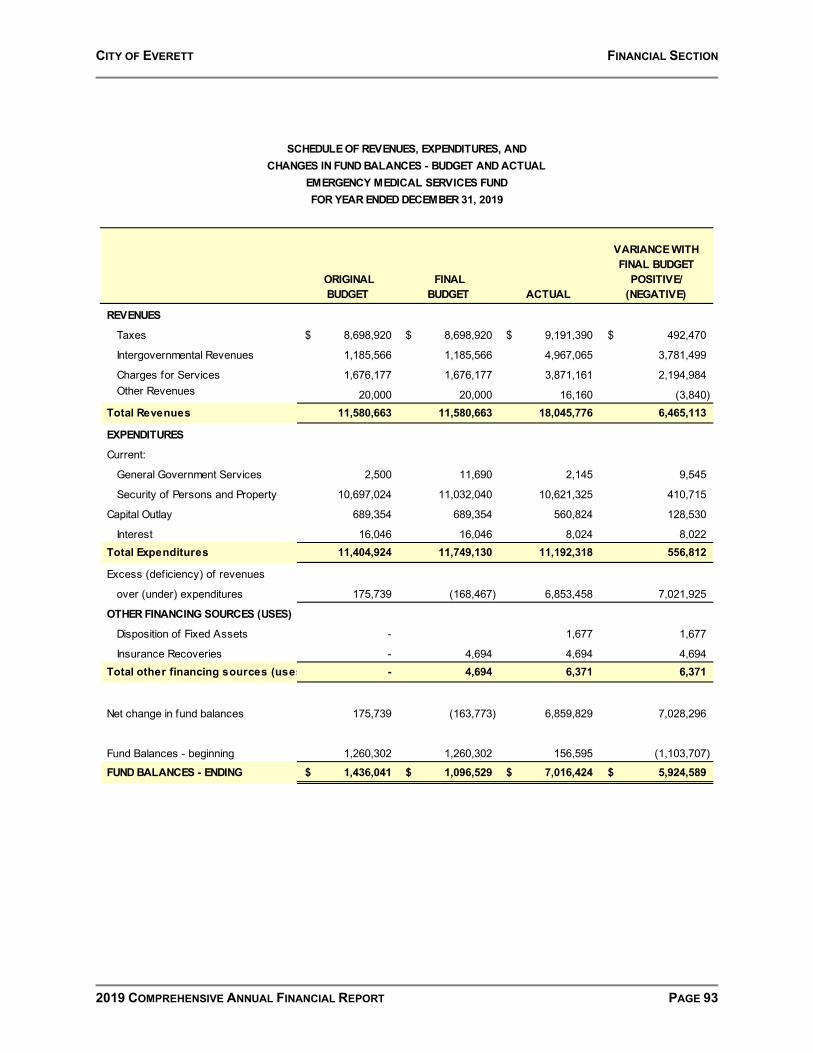
CITY OF EVERETT FINANCIAL SECTION
2019 COMPREHENSIVE ANNUAL FINANCIAL REPORT PAGE 93
ORIGINAL BUDGET
FINAL BUDGET ACTUAL
VARIANCE WITH FINAL BUDGET
POSITIVE/(NEGATIVE)
REVENUES
Taxes 8,698,920$ 8,698,920$ 9,191,390$ 492,470$
Intergovernmental Revenues 1,185,566 1,185,566 4,967,065 3,781,499
Charges for Services 1,676,177 1,676,177 3,871,161 2,194,984 Other Revenues 20,000 20,000 16,160 (3,840)
Total Revenues 11,580,663 11,580,663 18,045,776 6,465,113
EXPENDITURES
Current:
General Government Services 2,500 11,690 2,145 9,545
Security of Persons and Property 10,697,024 11,032,040 10,621,325 410,715
Capital Outlay 689,354 689,354 560,824 128,530
Interest 16,046 16,046 8,024 8,022 Total Expenditures 11,404,924 11,749,130 11,192,318 556,812
Excess (deficiency) of revenues
over (under) expenditures 175,739 (168,467) 6,853,458 7,021,925
OTHER FINANCING SOURCES (USES)
Disposition of Fixed Assets - 1,677 1,677
Insurance Recoveries - 4,694 4,694 4,694 Total other financing sources (uses - 4,694 6,371 6,371
Net change in fund balances 175,739 (163,773) 6,859,829 7,028,296
Fund Balances - beginning 1,260,302 1,260,302 156,595 (1,103,707)
FUND BALANCES - ENDING 1,436,041$ 1,096,529$ 7,016,424$ 5,924,589$
SCHEDULE OF REVENUES, EXPENDITURES, ANDCHANGES IN FUND BALANCES - BUDGET AND ACTUAL
EMERGENCY MEDICAL SERVICES FUNDFOR YEAR ENDED DECEMBER 31, 2019
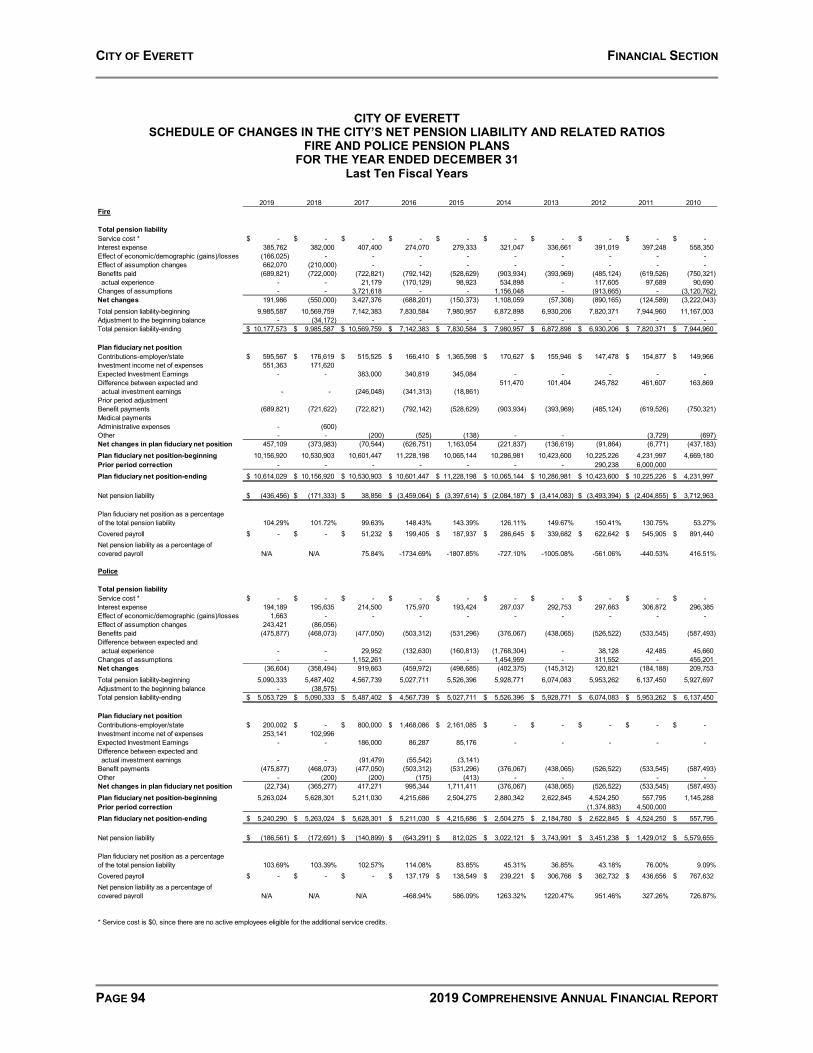
CITY OF EVERETT FINANCIAL SECTION
PAGE 94 2019 COMPREHENSIVE ANNUAL FINANCIAL REPORT
CITY OF EVERETT
SCHEDULE OF CHANGES IN THE CITY’S NET PENSION LIABILITY AND RELATED RATIOS FIRE AND POLICE PENSION PLANS
FOR THE YEAR ENDED DECEMBER 31 Last Ten Fiscal Years
2019 2018 2017 2016 2015 2014 2013 2012 2011 2010Fire
Total pension liabilityService cost * -$ -$ -$ -$ -$ -$ -$ -$ -$ -$ Interest expense 385,762 382,000 407,400 274,070 279,333 321,047 336,661 391,019 397,248 558,350 Effect of economic/demographic (gains)/losses (166,025) - - - - - - - - - Effect of assumption changes 662,070 (210,000) - - - - - - - - Benefits paid (689,821) (722,000) (722,821) (792,142) (528,629) (903,934) (393,969) (485,124) (619,526) (750,321) actual experience - - 21,179 (170,129) 98,923 534,898 - 117,605 97,689 90,690 Changes of assumptions - - 3,721,618 - - 1,156,048 - (913,665) - (3,120,762) Net changes 191,986 (550,000) 3,427,376 (688,201) (150,373) 1,108,059 (57,308) (890,165) (124,589) (3,222,043) Total pension liability-beginning 9,985,587 10,569,759 7,142,383 7,830,584 7,980,957 6,872,898 6,930,206 7,820,371 7,944,960 11,167,003 Adjustment to the beginning balance - (34,172) - - - - - - - - Total pension liability-ending 10,177,573$ 9,985,587$ 10,569,759$ 7,142,383$ 7,830,584$ 7,980,957$ 6,872,898$ 6,930,206$ 7,820,371$ 7,944,960$
Plan fiduciary net positionContributions-employer/state 595,567$ 176,619$ 515,525$ 166,410$ 1,365,598$ 170,627$ 155,946$ 147,478$ 154,877$ 149,966$ Investment income net of expenses 551,363 171,620 Expected Investment Earnings - - 383,000 340,819 345,084 - - - - - Difference between expected and 511,470 101,404 245,782 461,607 163,869 actual investment earnings - - (246,048) (341,313) (18,861)Prior period adjustmentBenefit payments (689,821) (721,622) (722,821) (792,142) (528,629) (903,934) (393,969) (485,124) (619,526) (750,321) Medical paymentsAdministrative expenses - (600) Other - - (200) (525) (138) - - (3,729) (697) Net changes in plan fiduciary net position 457,109 (373,983) (70,544) (626,751) 1,163,054 (221,837) (136,619) (91,864) (6,771) (437,183) Plan fiduciary net position-beginning 10,156,920 10,530,903 10,601,447 11,228,198 10,065,144 10,286,981 10,423,600 10,225,226 4,231,997 4,669,180 Prior period correction - - - - - - - 290,238 6,000,000 Plan fiduciary net position-ending 10,614,029$ 10,156,920$ 10,530,903$ 10,601,447$ 11,228,198$ 10,065,144$ 10,286,981$ 10,423,600$ 10,225,226$ 4,231,997$
Net pension liability (436,456)$ (171,333)$ 38,856$ (3,459,064)$ (3,397,614)$ (2,084,187)$ (3,414,083)$ (3,493,394)$ (2,404,855)$ 3,712,963$
Plan fiduciary net position as a percentage of the total pension liability 104.29% 101.72% 99.63% 148.43% 143.39% 126.11% 149.67% 150.41% 130.75% 53.27%Covered payroll -$ -$ 51,232$ 199,405$ 187,937$ 286,645$ 339,682$ 622,642$ 545,905$ 891,440$ Net pension liability as a percentage of covered payroll N/A N/A 75.84% -1734.69% -1807.85% -727.10% -1005.08% -561.06% -440.53% 416.51%
Police
Total pension liabilityService cost * -$ -$ -$ -$ -$ -$ -$ -$ -$ -$ Interest expense 194,189 195,635 214,500 175,970 193,424 287,037 292,753 297,663 306,872 296,385 Effect of economic/demographic (gains)/losses 1,663 - - - - - - - - - Effect of assumption changes 243,421 (86,056) Benefits paid (475,877) (468,073) (477,050) (503,312) (531,296) (376,067) (438,065) (526,522) (533,545) (587,493) Difference between expected and actual experience - - 29,952 (132,630) (160,813) (1,768,304) - 38,128 42,485 45,660 Changes of assumptions - - 1,152,261 - - 1,454,959 - 311,552 - 455,201 Net changes (36,604) (358,494) 919,663 (459,972) (498,685) (402,375) (145,312) 120,821 (184,188) 209,753 Total pension liability-beginning 5,090,333 5,487,402 4,567,739 5,027,711 5,526,396 5,928,771 6,074,083 5,953,262 6,137,450 5,927,697 Adjustment to the beginning balance - (38,575) Total pension liability-ending 5,053,729$ 5,090,333$ 5,487,402$ 4,567,739$ 5,027,711$ 5,526,396$ 5,928,771$ 6,074,083$ 5,953,262$ 6,137,450$
Plan fiduciary net positionContributions-employer/state 200,002$ -$ 800,000$ 1,468,086$ 2,161,085$ -$ -$ -$ -$ -$ Investment income net of expenses 253,141 102,996 Expected Investment Earnings - - 186,000 86,287 85,176 - - - - - Difference between expected and actual investment earnings - - (91,479) (55,542) (3,141)Benefit payments (475,877) (468,073) (477,050) (503,312) (531,296) (376,067) (438,065) (526,522) (533,545) (587,493) Other - (200) (200) (175) (413) - - - - Net changes in plan fiduciary net position (22,734) (365,277) 417,271 995,344 1,711,411 (376,067) (438,065) (526,522) (533,545) (587,493) Plan fiduciary net position-beginning 5,263,024 5,628,301 5,211,030 4,215,686 2,504,275 2,880,342 2,622,845 4,524,250 557,795 1,145,288 Prior period correction (1,374,883) 4,500,000 Plan fiduciary net position-ending 5,240,290$ 5,263,024$ 5,628,301$ 5,211,030$ 4,215,686$ 2,504,275$ 2,184,780$ 2,622,845$ 4,524,250$ 557,795$
Net pension liability (186,561)$ (172,691)$ (140,899)$ (643,291)$ 812,025$ 3,022,121$ 3,743,991$ 3,451,238$ 1,429,012$ 5,579,655$
Plan fiduciary net position as a percentage of the total pension liability 103.69% 103.39% 102.57% 114.08% 83.85% 45.31% 36.85% 43.18% 76.00% 9.09%Covered payroll -$ -$ -$ 137,179$ 138,549$ 239,221$ 306,766$ 362,732$ 436,656$ 767,632$ Net pension liability as a percentage of covered payroll N/A N/A N/A -468.94% 586.09% 1263.32% 1220.47% 951.46% 327.26% 726.87%
* Service cost is $0, since there are no active employees eligible for the additional service credits.

CITY OF EVERETT FINANCIAL SECTION
2019 COMPREHENSIVE ANNUAL FINANCIAL REPORT PAGE 95
CITY OF EVERETT SCHEDULE OF EMPLOYER CONTRIBUTIONS
FIRE AND POLICE PENSION PLANS FOR THE YEAR ENDED DECEMBER 31
Last Ten Fiscal Years
Fire 2019 2018 2017 2016 2015 2014 2013 2012 2011 2010
Actuarially determined contribution -$ 21,000$ 20,000$ (85,143)$ (81,088)$ (187,676)$ (178,998)$ (131,810)$ (125,850)$ 105,226$ Contributions 415,502 - 350,000 166,410 1,365,599 170,627 155,946 147,478 154,877 149,966 Contribution deficiency (excess) (415,502)$ 21,000$ (330,000)$ (251,553)$ (1,446,687)$ (358,303)$ (334,944)$ (279,288)$ (280,727)$ (44,740)$
Covered payroll -$ -$ 51,232$ 199,405$ 187,937$ 286,645$ 339,682$ 622,642$ 545,905$ 891,440$
Contributions as a percentage of covered payroll N/A N/A 683.17% 83.45% 726.63% 59.53% 45.91% 23.69% 28.37% 16.82%
PoliceActuarially determined contribution -$ 41,000$ 40,000$ 144,972$ 138,069$ 185,912$ 177,059$ 131,541$ 125,278$ 111,447$ Contributions 200,002 - 800,000 1,468,086 2,161,085 - - - - - Contribution deficiency (excess) (200,002)$ 41,000$ (760,000)$ (1,323,114)$ (2,023,016)$ 185,912$ 177,059$ 131,541$ 125,278$ 111,447$
Covered payroll -$ -$ -$ 137,178$ 138,549$ 239,221$ 306,766$ 362,732$ 436,656$ 767,632$
Contributions as a percentage of covered payroll N/A N/A N/A 1070.21% 1559.80% 0.00% 0.00% 0.00% 0.00% 0.00%
Valuation date:Actuarially determined contribution rates are as of January 1, 2019.
Methods and assumptions used to determine contribution rates:Actuarial cost method Entry age normal cost Amortization period Closed 30 year amortization period of the unfunded obligation beginning January 1, 2000.Asset valuation method Actuarial value of assets equal to market valueInflation 2.25%Salary increase 3.00%Investment rate of return 2.75%Mortality Service-retired members and spouses: RP-2000 Mortality Table (combined healthy) with generational projection using 100% of Projections Scale BB,
with ages set back one year for males and set forward one year for females. Disabled members: RP-2000 Mortality Table (combined healthy) with generational projection using 100% of Projections Scale BB,
with ages set forward two years.Retirement age All actives are retired as of the valuation date.

CITY OF EVERETT FINANCIAL SECTION
PAGE 96 2019 COMPREHENSIVE ANNUAL FINANCIAL REPORT
CITY OF EVERETT SCHEDULE OF INVESTMENT RETURNS
FIRE AND POLICE PENSION PLANS FOR THE YEAR ENDED DECEMBER 31
Last Ten Fiscal Years
Annual money-weighted rate of return, net of investment expenses 2019 2018 2017 2016 2015 2014 2013 2012 2011 2010
Fire 5.47% 1.67% 1.87% 0.05% 3.14% 9.76% -6.52% 2.14% 7.48% 3.76%Police 4.97% 1.92% 1.84% -0.01% 3.18% 9.82% -6.31% 2.68% 6.40% 3.66%

CITY OF EVERETT FINANCIAL SECTION
2019 COMPREHENSIVE ANNUAL FINANCIAL REPORT PAGE 97
2019 2018 2017 2016 2015
Employer's proportion of the net pension liability (asset) % 0.451166% 0.446110% 0.439348% 0.434225% 0.431425%
Employer's proportionate share of the net pension liability $ (8,917,797) (8,099,136) (6,665,876) (4,473,759) (5,199,625)
State's proportionate share of the net pension liability (asset) associated with the employer $ (60,319,757) (54,782,355) (45,087,820) (30,260,397) (35,170,132)
TOTAL $ (69,237,554) (62,881,491) (51,753,696) (34,734,156) (40,369,757)
Covered payroll $ - - 141,324 249,534 237,134
Employer's proportionate share of the net pension liability as a percentage of covered payroll % -4716.73% -1792.85% -2192.69%
Plan fiduciary net position as a percentage of the total pension liability % 148.78% 144.42% 135.96% 123.74% 127.36%
Notes to Schedule:*Until a full 10-year trend is compiled, only information for those years available is presented.
City of EverettSchedule of Proportionate Share of the Net Pension Liability
LEOFF 1As of June 30, 2019
Last Ten Fiscal Years*
2019 2018 2017 2016 2015
Employer's proportion of the net pension liability (asset) % 1.254871% 1.277707% 1.302978% 1.307804% 1.945509%
Employer's proportionate share of the net pension liability $ (29,071,509) (25,940,238) (18,081,113) (7,606,580) (12,037,039)
State's proportionate share of the net pension liability (asset) associated with the employer $ (19,037,943) (16,795,815) (11,728,880) (4,958,937) (7,847,274)
TOTAL $ (48,109,452) (42,736,053) (29,809,993) (12,565,517) (19,884,313)
Covered payroll $ 43,708,227 42,288,542 40,759,097 39,618,462 33,991,128
Employer's proportionate share of the net pension liability as a percentage of covered payroll % -66.51% -61.34% -44.36% -19.20% -35.41%
Plan fiduciary net position as a percentage of the total pension liability % 119.43% 118.50% 113.36% 106.04% 111.67%
Notes to Schedule:*Until a full 10-year trend is compiled, only information for those years available is presented.
As of June 30, 2019Last Ten Fiscal Years*
LEOFF 2
City of EverettSchedule of Proportionate Share of the Net Pension Liability

CITY OF EVERETT FINANCIAL SECTION
PAGE 98 2019 COMPREHENSIVE ANNUAL FINANCIAL REPORT
2019 2018 2017 2016 2015
Employer's proportion of the net pension liability (asset) % 0.453179% 0.475870% 0.485018% 0.509161% 0.479404%
Employer's proportionate share of the net pension liability $ 17,426,341 21,252,516 23,014,482 27,344,344 25,077,288
TOTAL $ 17,426,341 21,252,516 23,014,482 27,344,344 25,077,288
Covered payroll $ 61,699,645 61,198,921 59,020,113 58,907,060 52,435,930
Employer's proportionate share of the net pension liability as a percentage of covered payroll % 28.24% 34.73% 38.99% 46.42% 47.82%
Plan fiduciary net position as a percentage of the total pension liability % 67.12% 63.22% 61.24% 57.03% 59.10%
Notes to Schedule:*Until a full 10-year trend is compiled, only information for those years available is presented.
City of EverettSchedule of Proportionate Share of the Net Pension Liability
PERS 1As of June 30, 2019
Last Ten Fiscal Years*
2019 2018 2017 2016 2015
Employer's proportion of the net pension liability (asset) % 0.547002% 0.565717% 0.577585% 0.597904% 0.562203%
Employer's proportionate share of the net pension liability $ 5,313,249 9,659,114 20,068,318 30,103,994 20,087,834
TOTAL $ 5,313,249 9,659,114 20,068,318 30,103,994 20,087,834
Covered payroll $ 59,469,268 58,859,395 56,628,484 56,301,378 49,849,648
Employer's proportionate share of the net pension liability as a percentage of covered payroll % 8.93% 16.41% 35.44% 53.47% 40.30%
Plan fiduciary net position as a percentage of the total pension liability % 97.77% 95.77% 90.97% 85.82% 89.20%
Notes to Schedule:*Until a full 10-year trend is compiled, only information for those years available is presented.
Schedule of Proportionate Share of the Net Pension LiabilityPERS 2 & 3
As of June 30, 2019Last Ten Fiscal Years*
City of Everett
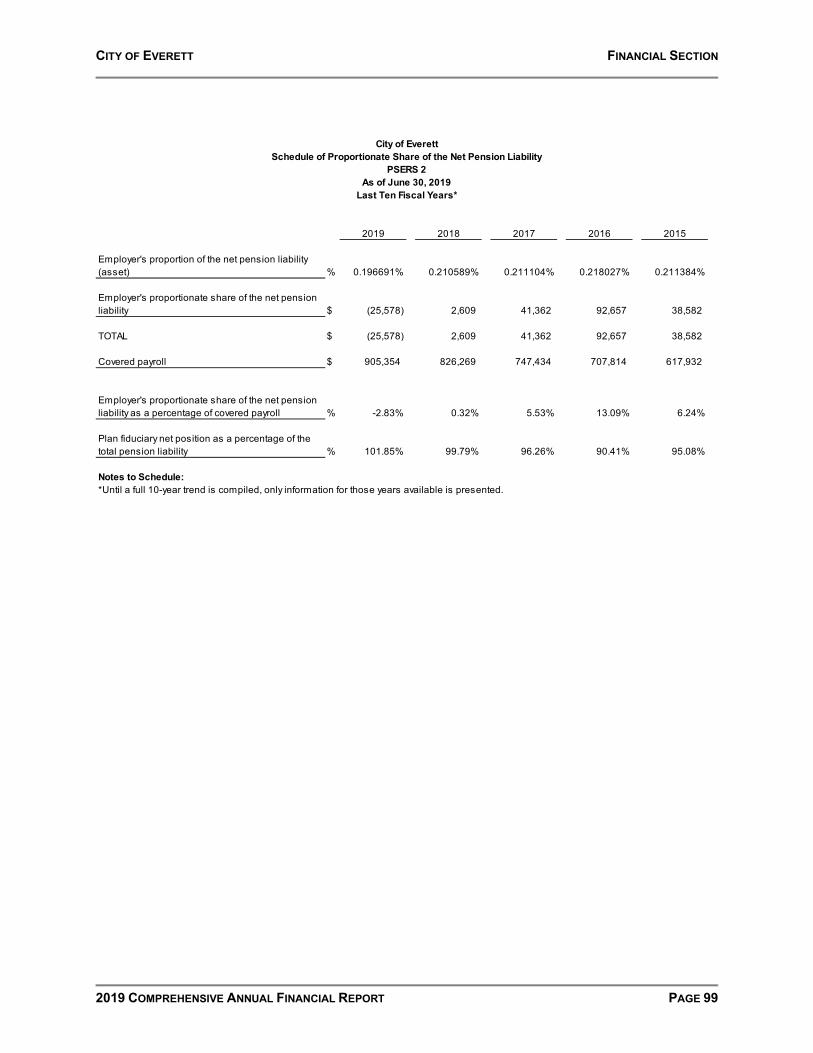
CITY OF EVERETT FINANCIAL SECTION
2019 COMPREHENSIVE ANNUAL FINANCIAL REPORT PAGE 99
2019 2018 2017 2016 2015
Employer's proportion of the net pension liability (asset) % 0.196691% 0.210589% 0.211104% 0.218027% 0.211384%
Employer's proportionate share of the net pension liability $ (25,578) 2,609 41,362 92,657 38,582
TOTAL $ (25,578) 2,609 41,362 92,657 38,582
Covered payroll $ 905,354 826,269 747,434 707,814 617,932
Employer's proportionate share of the net pension liability as a percentage of covered payroll % -2.83% 0.32% 5.53% 13.09% 6.24%
Plan fiduciary net position as a percentage of the total pension liability % 101.85% 99.79% 96.26% 90.41% 95.08%
Notes to Schedule:*Until a full 10-year trend is compiled, only information for those years available is presented.
Last Ten Fiscal Years*
City of EverettSchedule of Proportionate Share of the Net Pension Liability
PSERS 2As of June 30, 2019
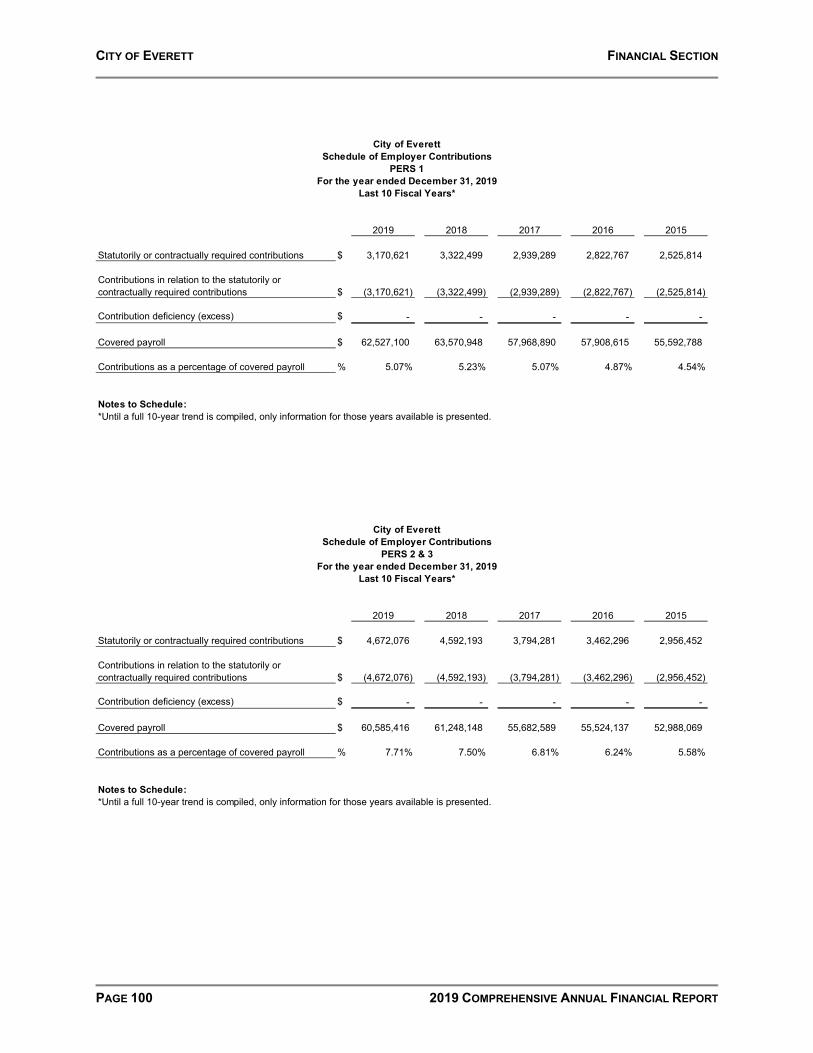
CITY OF EVERETT FINANCIAL SECTION
PAGE 100 2019 COMPREHENSIVE ANNUAL FINANCIAL REPORT
2019 2018 2017 2016 2015
Statutorily or contractually required contributions $ 3,170,621 3,322,499 2,939,289 2,822,767 2,525,814
Contributions in relation to the statutorily or contractually required contributions $ (3,170,621) (3,322,499) (2,939,289) (2,822,767) (2,525,814)
Contribution deficiency (excess) $ - - - - -
Covered payroll $ 62,527,100 63,570,948 57,968,890 57,908,615 55,592,788
Contributions as a percentage of covered payroll % 5.07% 5.23% 5.07% 4.87% 4.54%
Notes to Schedule:*Until a full 10-year trend is compiled, only information for those years available is presented.
City of EverettSchedule of Employer Contributions
PERS 1For the year ended December 31, 2019
Last 10 Fiscal Years*
2019 2018 2017 2016 2015
Statutorily or contractually required contributions $ 4,672,076 4,592,193 3,794,281 3,462,296 2,956,452
Contributions in relation to the statutorily or contractually required contributions $ (4,672,076) (4,592,193) (3,794,281) (3,462,296) (2,956,452)
Contribution deficiency (excess) $ - - - - -
Covered payroll $ 60,585,416 61,248,148 55,682,589 55,524,137 52,988,069
Contributions as a percentage of covered payroll % 7.71% 7.50% 6.81% 6.24% 5.58%
Notes to Schedule:*Until a full 10-year trend is compiled, only information for those years available is presented.
City of EverettSchedule of Employer Contributions
PERS 2 & 3For the year ended December 31, 2019
Last 10 Fiscal Years*
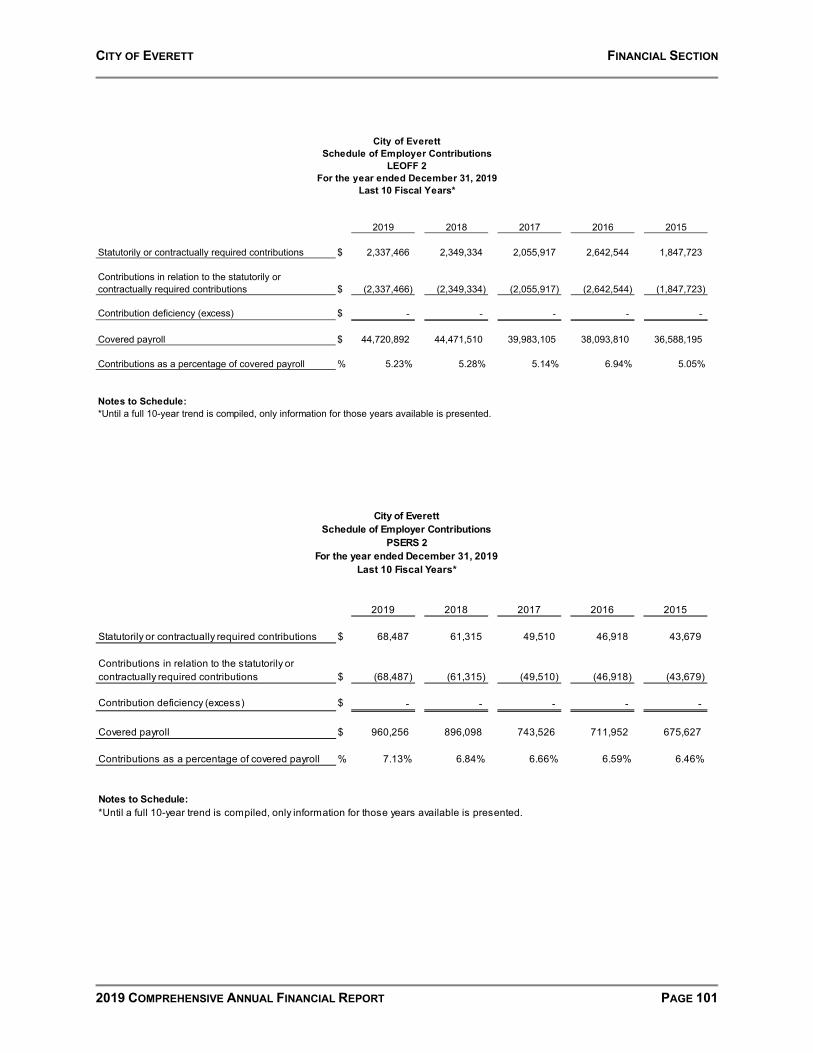
CITY OF EVERETT FINANCIAL SECTION
2019 COMPREHENSIVE ANNUAL FINANCIAL REPORT PAGE 101
2019 2018 2017 2016 2015
Statutorily or contractually required contributions $ 2,337,466 2,349,334 2,055,917 2,642,544 1,847,723
Contributions in relation to the statutorily or contractually required contributions $ (2,337,466) (2,349,334) (2,055,917) (2,642,544) (1,847,723)
Contribution deficiency (excess) $ - - - - -
Covered payroll $ 44,720,892 44,471,510 39,983,105 38,093,810 36,588,195
Contributions as a percentage of covered payroll % 5.23% 5.28% 5.14% 6.94% 5.05%
Notes to Schedule:*Until a full 10-year trend is compiled, only information for those years available is presented.
Schedule of Employer ContributionsLEOFF 2
For the year ended December 31, 2019Last 10 Fiscal Years*
City of Everett
2019 2018 2017 2016 2015
Statutorily or contractually required contributions $ 68,487 61,315 49,510 46,918 43,679
Contributions in relation to the statutorily or contractually required contributions $ (68,487) (61,315) (49,510) (46,918) (43,679)
Contribution deficiency (excess) $ - - - - -
Covered payroll $ 960,256 896,098 743,526 711,952 675,627
Contributions as a percentage of covered payroll % 7.13% 6.84% 6.66% 6.59% 6.46%
Notes to Schedule:*Until a full 10-year trend is compiled, only information for those years available is presented.
PSERS 2For the year ended December 31, 2019
Last 10 Fiscal Years*
City of EverettSchedule of Employer Contributions
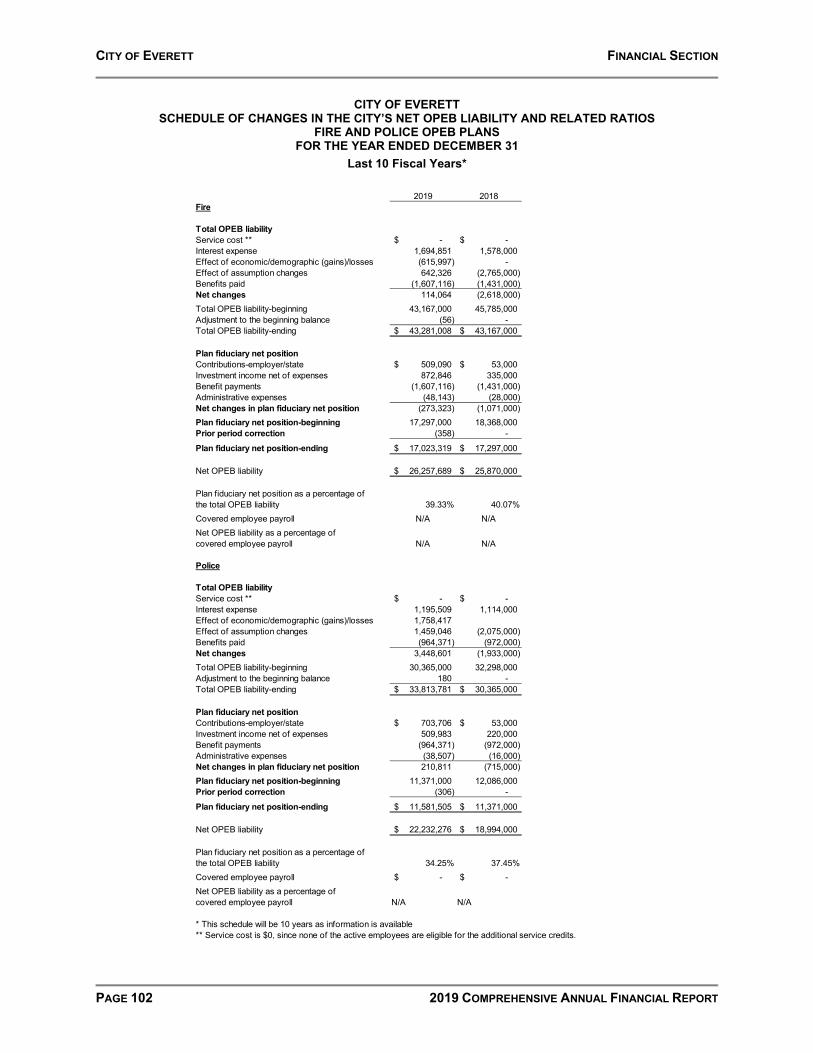
CITY OF EVERETT FINANCIAL SECTION
PAGE 102 2019 COMPREHENSIVE ANNUAL FINANCIAL REPORT
CITY OF EVERETT SCHEDULE OF CHANGES IN THE CITY’S NET OPEB LIABILITY AND RELATED RATIOS
FIRE AND POLICE OPEB PLANS FOR THE YEAR ENDED DECEMBER 31
Last 10 Fiscal Years*
2019 2018Fire
Total OPEB liabilityService cost ** -$ -$ Interest expense 1,694,851 1,578,000 Effect of economic/demographic (gains)/losses (615,997) - Effect of assumption changes 642,326 (2,765,000) Benefits paid (1,607,116) (1,431,000) Net changes 114,064 (2,618,000) Total OPEB liability-beginning 43,167,000 45,785,000 Adjustment to the beginning balance (56) - Total OPEB liability-ending 43,281,008$ 43,167,000$
Plan fiduciary net positionContributions-employer/state 509,090$ 53,000$ Investment income net of expenses 872,846 335,000 Benefit payments (1,607,116) (1,431,000) Administrative expenses (48,143) (28,000) Net changes in plan fiduciary net position (273,323) (1,071,000) Plan fiduciary net position-beginning 17,297,000 18,368,000 Prior period correction (358) -
Plan fiduciary net position-ending 17,023,319$ 17,297,000$
Net OPEB liability 26,257,689$ 25,870,000$
Plan fiduciary net position as a percentage of the total OPEB liability 39.33% 40.07%Covered employee payroll N/A N/ANet OPEB liability as a percentage of covered employee payroll N/A N/A
Police
Total OPEB liabilityService cost ** -$ -$ Interest expense 1,195,509 1,114,000 Effect of economic/demographic (gains)/losses 1,758,417 Effect of assumption changes 1,459,046 (2,075,000) Benefits paid (964,371) (972,000) Net changes 3,448,601 (1,933,000) Total OPEB liability-beginning 30,365,000 32,298,000 Adjustment to the beginning balance 180 - Total OPEB liability-ending 33,813,781$ 30,365,000$
Plan fiduciary net positionContributions-employer/state 703,706$ 53,000$ Investment income net of expenses 509,983 220,000 Benefit payments (964,371) (972,000) Administrative expenses (38,507) (16,000) Net changes in plan fiduciary net position 210,811 (715,000) Plan fiduciary net position-beginning 11,371,000 12,086,000 Prior period correction (306) -
Plan fiduciary net position-ending 11,581,505$ 11,371,000$
Net OPEB liability 22,232,276$ 18,994,000$
Plan fiduciary net position as a percentage of the total OPEB liability 34.25% 37.45%Covered employee payroll -$ -$ Net OPEB liability as a percentage of covered employee payroll N/A N/A
* This schedule will be 10 years as information is available** Service cost is $0, since none of the active employees are eligible for the additional service credits.
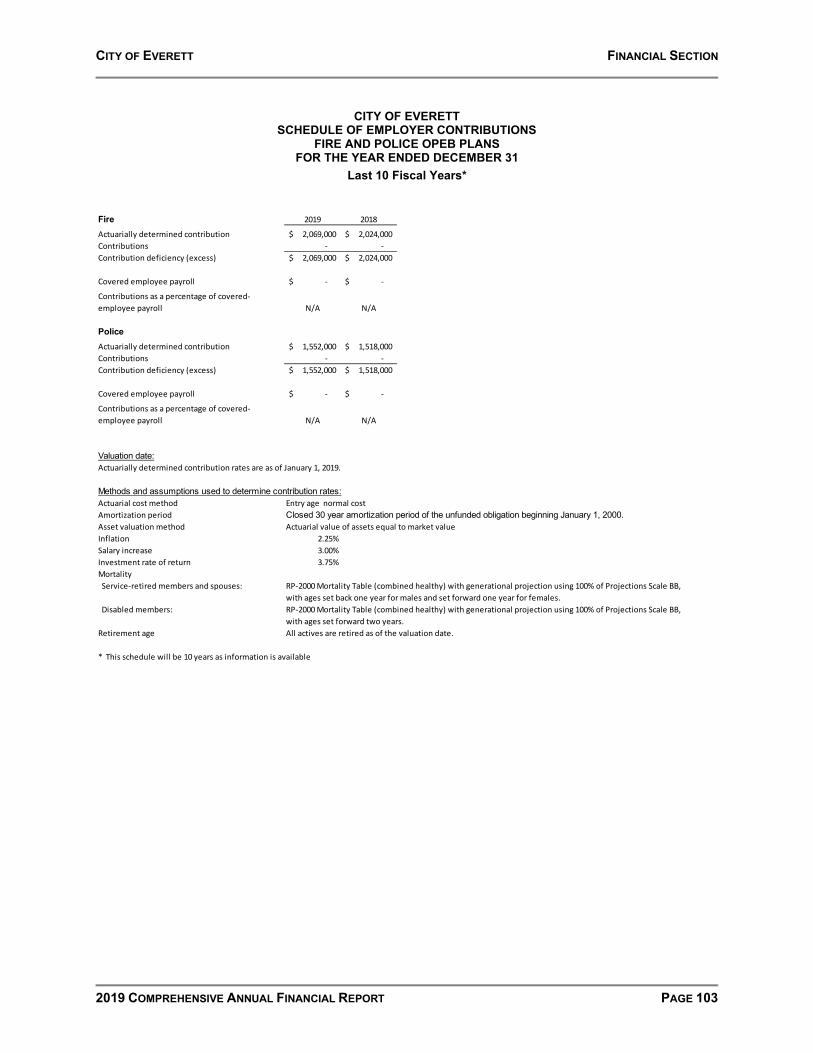
CITY OF EVERETT FINANCIAL SECTION
2019 COMPREHENSIVE ANNUAL FINANCIAL REPORT PAGE 103
CITY OF EVERETT
SCHEDULE OF EMPLOYER CONTRIBUTIONS FIRE AND POLICE OPEB PLANS
FOR THE YEAR ENDED DECEMBER 31 Last 10 Fiscal Years*
Fire 2019 2018
Actuarially determined contribution 2,069,000$ 2,024,000$ Contributions - - Contribution deficiency (excess) 2,069,000$ 2,024,000$
Covered employee payroll -$ -$
Contributions as a percentage of covered-employee payroll N/A N/A
PoliceActuarially determined contribution 1,552,000$ 1,518,000$ Contributions - - Contribution deficiency (excess) 1,552,000$ 1,518,000$
Covered employee payroll -$ -$
Contributions as a percentage of covered-employee payroll N/A N/A
Valuation date:Actuarially determined contribution rates are as of January 1, 2019.
Methods and assumptions used to determine contribution rates:Actuarial cost method Entry age normal cost Amortization period Closed 30 year amortization period of the unfunded obligation beginning January 1, 2000.Asset valuation method Actuarial value of assets equal to market valueInflation 2.25%Salary increase 3.00%Investment rate of return 3.75%Mortality Service-retired members and spouses: RP-2000 Mortality Table (combined healthy) with generational projection using 100% of Projections Scale BB,
with ages set back one year for males and set forward one year for females. Disabled members: RP-2000 Mortality Table (combined healthy) with generational projection using 100% of Projections Scale BB,
with ages set forward two years.Retirement age All actives are retired as of the valuation date.
* This schedule will be 10 years as information is available
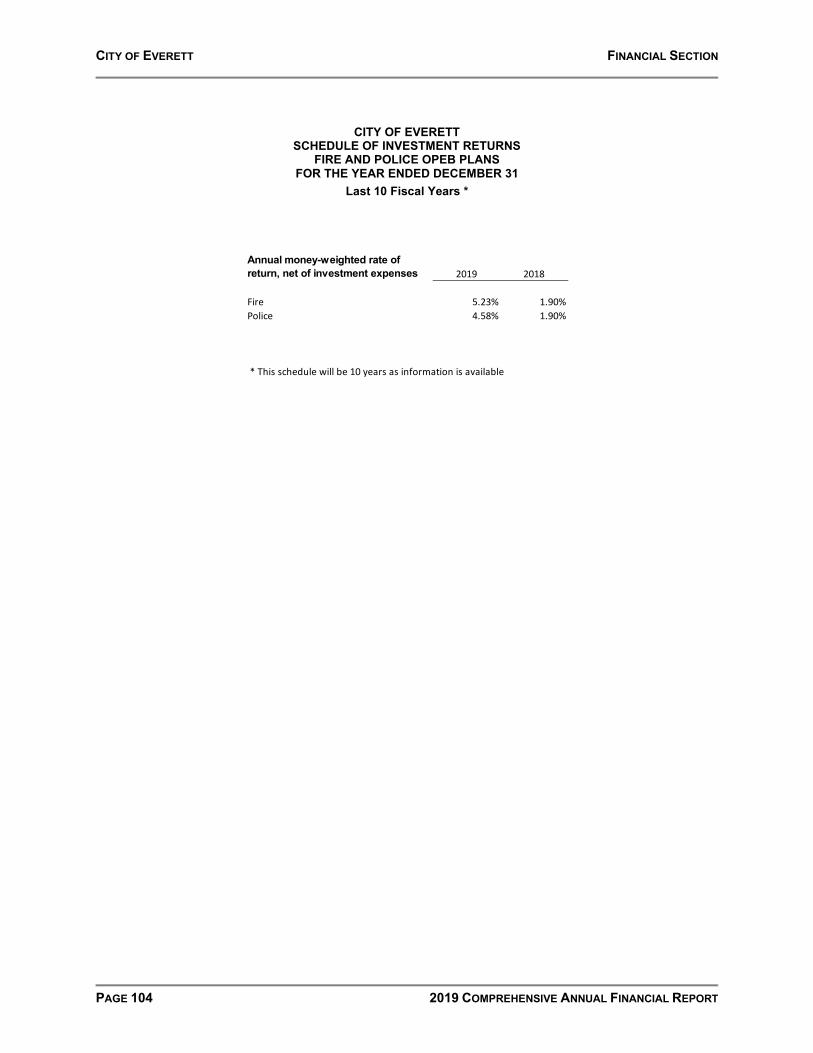
CITY OF EVERETT FINANCIAL SECTION
PAGE 104 2019 COMPREHENSIVE ANNUAL FINANCIAL REPORT
CITY OF EVERETT SCHEDULE OF INVESTMENT RETURNS
FIRE AND POLICE OPEB PLANS FOR THE YEAR ENDED DECEMBER 31
Last 10 Fiscal Years *
Annual money-weighted rate of return, net of investment expenses 2019 2018
Fire 5.23% 1.90%Police 4.58% 1.90%
* This schedule will be 10 years as information is available
COMBINING AND INDIVIDUAL FUND STATEMENTS AND SCHEDULES
GOVERNMENTAL FUNDS

CITY OF EVERETT FINANCIAL SECTION
2019 COMPREHENSIVE ANNUAL FINANCIAL REPORT PAGE 105
COMBINING BALANCE SHEET NONMAJOR GOVERNMENTAL FUNDS
DECEMBER 31, 2019
SPECIAL REVENUE DEBT SERVICE
CAPITAL PROJECTS
TOTAL NONMAJOR
GOVERNMENTAL FUNDS
ASSETS Cash and cash equivalents 9,343,914$ 8,428$ 10,537,153$ 19,889,495$ Investments 17,477,058 16,198 20,250,437 37,743,693 Receivables, net
Taxes 1,218,498 - 582,598 1,801,096 Customer accounts 1,250,877 - 19,174 1,270,051 Interest 107,691 - 134,400 242,091 Due from other governmental units 249,300 - 3,579,351 3,828,651 Due from component unit - - 55,065 55,065
Special assessments - non-current - 96,700 - 96,700 Notes/contracts receivable 13,487,350 - - 13,487,350
TOTAL ASSETS 43,134,688$ 121,326$ 35,158,178$ 78,414,192$
LIABILITIES Wages payable 45,033$ -$ -$ 45,033$ Accounts payable 366,656 6,709 855,004 1,228,369 Interfund payable 159,825 - - 159,825 Due to other governmental units 112,336 - - 112,336 Taxes Payable - - 6,230 6,230 Revenues collected in advance 64,286 - - 64,286 Other liabilities 3,767 - - 3,767
TOTAL LIABILITIES 751,903 6,709 861,234 1,619,846
DEFERRED INFLOWS OF RESOURCESUnavailable revenues-special assessments - 96,699 - 96,699 Unavailable revenues-other 27,838 - - 27,838
TOTAL DEFERRED INFLOWS OF RESOURCES 27,838 96,699 - 124,537
FUND BALANCESRestricted 36,993,701 - 5,693,796 42,687,497 Assigned 5,361,246 17,918 28,603,148 33,982,312
TOTAL FUND BALANCES 42,354,947 17,918 34,296,944 76,669,809
TOTAL LIABILITIES, DEFERRED INFLOWS OF RESOURCES AND FUND BALANCES 43,134,688$ 121,326$ 35,158,178$ 78,414,192$ 0 0 0 0
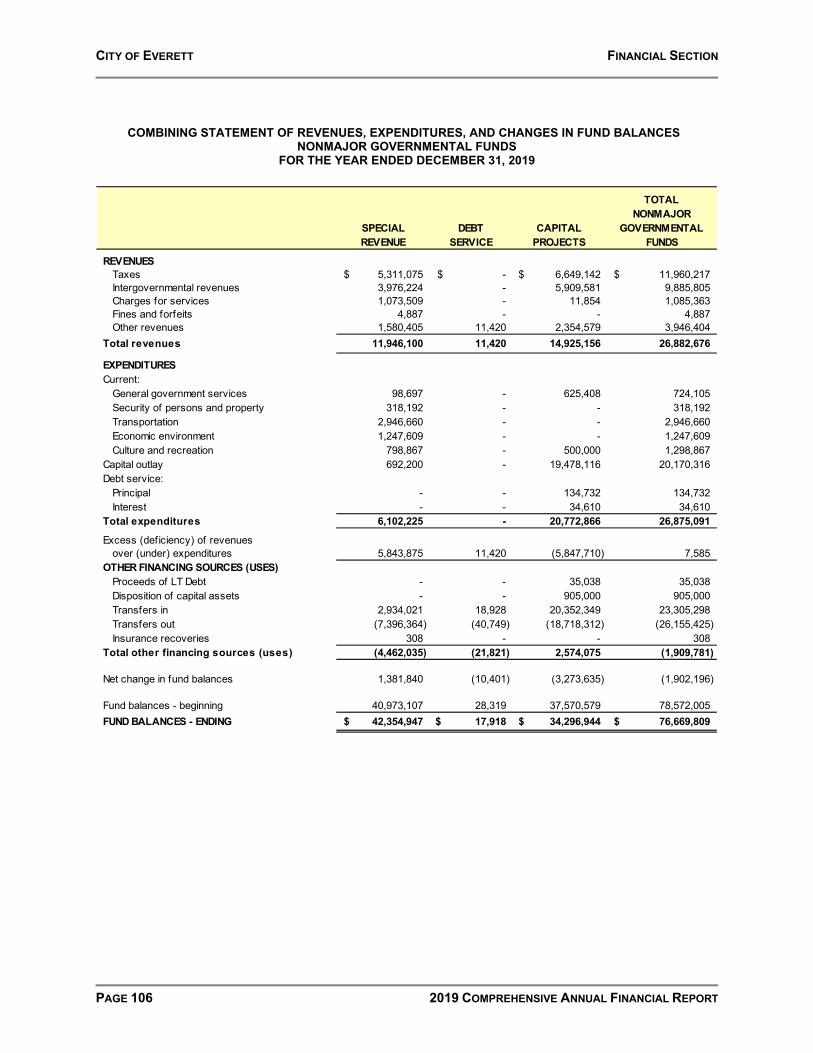
CITY OF EVERETT FINANCIAL SECTION
PAGE 106 2019 COMPREHENSIVE ANNUAL FINANCIAL REPORT
COMBINING STATEMENT OF REVENUES, EXPENDITURES, AND CHANGES IN FUND BALANCES NONMAJOR GOVERNMENTAL FUNDS
FOR THE YEAR ENDED DECEMBER 31, 2019
SPECIAL
REVENUEDEBT
SERVICECAPITAL
PROJECTS
TOTAL NONMAJOR
GOVERNMENTAL FUNDS
REVENUESTaxes 5,311,075$ -$ 6,649,142$ 11,960,217$ Intergovernmental revenues 3,976,224 - 5,909,581 9,885,805 Charges for services 1,073,509 - 11,854 1,085,363 Fines and forfeits 4,887 - - 4,887 Other revenues 1,580,405 11,420 2,354,579 3,946,404
Total revenues 11,946,100 11,420 14,925,156 26,882,676
EXPENDITURESCurrent:
General government services 98,697 - 625,408 724,105 Security of persons and property 318,192 - - 318,192 Transportation 2,946,660 - - 2,946,660 Economic environment 1,247,609 - - 1,247,609 Culture and recreation 798,867 - 500,000 1,298,867
Capital outlay 692,200 - 19,478,116 20,170,316 Debt service:
Principal - - 134,732 134,732 Interest - - 34,610 34,610
Total expenditures 6,102,225 - 20,772,866 26,875,091
Excess (deficiency) of revenuesover (under) expenditures 5,843,875 11,420 (5,847,710) 7,585
OTHER FINANCING SOURCES (USES)Proceeds of LT Debt - - 35,038 35,038 Disposition of capital assets - - 905,000 905,000 Transfers in 2,934,021 18,928 20,352,349 23,305,298 Transfers out (7,396,364) (40,749) (18,718,312) (26,155,425) Insurance recoveries 308 - - 308
Total other financing sources (uses) (4,462,035) (21,821) 2,574,075 (1,909,781)
Net change in fund balances 1,381,840 (10,401) (3,273,635) (1,902,196)
Fund balances - beginning 40,973,107 28,319 37,570,579 78,572,005 FUND BALANCES - ENDING 42,354,947$ 17,918$ 34,296,944$ 76,669,809$

SPECIAL REVENUE FUNDS 119 The Street Improvement Fund accounts for street overlay improvement projects. 120 The Streets Fund accounts for maintenance and operation of all transportation routes,
preparation of streets planned for overlay and maintenance of the Central Business District area.
138 The Motel Tax Fund accumulates the hotel/motel tax for tourism promotion and publicity
of the City, promotion of an arts center and capital improvements at the stadium. 148 The Cumulative Reserve for Parks Fund accounts for money accumulated for capital
improvements and acquisition of land for parks. 151 The Fund for Animals is a reserve fund that accumulates contributions for animal
welfare issues and medical expenses. 152 The Cumulative Reserve for Library Fund accounts for specific capital items and
projects that relate to the library program and for literary and cultural services for the intellectual improvement of the individual.
155 The General Government Special Projects Fund accounts for the special projects
funded in whole or in part with restricted revenues. 156 The Criminal Justice Fund accounts for the enhancement of new programs of the police
department, prosecutor’s office and municipal court. 157 The Traffic Mitigation Fund is a reserve fund for traffic improvements resulting from
development in Everett. 159 The Transportation Benefit District Fund accounts for funding for the preservation,
maintenance, and construction of local transportation infrastructure in Everett. 170 The City of Everett CDE LLC is a blended component unit of the City. The City of
Everett CDE LLC is a separate legal entity whose purpose is to help alleviate poverty and incentivize investments into low income community census tracts.
197 The Community Housing Improvement Program (CHIP) Loan Fund accounts for low
interest loans to low-income homeowners in several Everett Neighborhoods. Loans are provided through a loan pool of HUD Block Grant funds.
198 The Community Development Block Grants Fund accounts for a variety of housing
and community development programs aimed primarily at low and moderate-income persons and the prevention or elimination of slums and blight. The financing is from Community Block Grant HUD funds.

Funds previously reported as Special Revenue Funds combined with the General Fund Because the city legally adopts budgets for these funds individually, budget to actual comparisons for these funds are presented along with the other governmental funds Schedule of Revenues, Expenditures, and Changes in Fund Balances – Budget To Actual 101 The Parks and Recreation Fund accounts for the operations of the City's park system
and swimming pool. 110 The Library Fund accounts for the operation of the two City libraries. 112 The Municipal Arts Fund accounts for the maintenance and operations of the City’s
performing arts facility, city municipal arts programs, and the 1% for Art program. 114 The Conference Center Fund accounts for the maintenance and operations at the City’s
Special Events Center.
115 The General Government Special Projects Fund accounts for specific non-recurring projects.
126 The Motor Vehicle and Equipment Replacement Reserve Fund accumulates funding
to provide for the replacement of general government motor vehicles and equipment. 145 The Cumulative Reserve for Real Property Acquisition Fund accounts for real
property acquisitions. 146 The Property Management Fund accounts for several city-owned commercial buildings,
and the general government building maintenance and repair reserve. 149 The Senior Center Reserve Fund accounts for funding of senior center activities and
special events. 160 The Contingency Reserve Fund is a reserve fund for emergencies and contingency
expenses funded from the general fund in the form of a general property tax allocation. Expenditure of moneys will be based on a consensus between Administration and the City Council.

CITY OF EVERETT FINANCIAL SECTION
2019 COMPREHENSIVE ANNUAL FINANCIAL REPORT PAGE 107
COMBINING BALANCE SHEET NONMAJOR SPECIAL REVENUE FUNDS
DECEMBER 31, 2019 (Page 1 of 4)
119
STREETIMPROVEMENT
FUND
120STREETS
FUND
138HOTEL/MOTEL TAX
FUND
148CUM. RESERVE
PARKSFUND
ASSETS Cash and cash equivalents 810,903$ 633,924$ 203,768$ 228,588$ Investments 1,558,404 1,218,284 391,604 439,304 Receivables, net
Taxes 113,528 242,976 88,274 - Customer accounts - - - 1,250,000 Interest 14,727 11,690 - 1,448 Due from other governmental units - - - -
Notes/contracts receivable - - - -
TOTAL ASSETS 2,497,562$ 2,106,874$ 683,646$ 1,919,340$
LIABILITIES Wages payable 815$ 34,591$ -$ -$ Accounts payable 4,840 81,902 230,993 1,910 Interfund payable - - - - Due to other governmental units - - - - Revenues collected in advance - - - - Other liabilities - - 528 3,000
TOTAL LIABILITIES 5,655 116,493 231,521 4,910
DEFERRED INFLOWS OF RESOURCESUnavailable revenues-other - - - -
TOTAL DEFERRED INFLOWS OF REVENUES - - - -
FUND BALANCESRestricted - - 452,125 1,732,717 Assigned 2,491,907 1,990,381 - 181,713
TOTAL FUND BALANCES 2,491,907 1,990,381 452,125 1,914,430
TOTAL LIABILITIES, DEFERRED INFLOWS OF RESOURCES AND FUND BALANCES 2,497,562$ 2,106,874$ 683,646$ 1,919,340$

CITY OF EVERETT FINANCIAL SECTION
PAGE 108 2019 COMPREHENSIVE ANNUAL FINANCIAL REPORT
COMBINING BALANCE SHEET NONMAJOR SPECIAL REVENUE FUNDS
DECEMBER 31, 2019 (Page 2 of 4)
151ANIMALS
FUND
152CUM. RESERVE
LIBRARYFUND
155GENERAL
GOVERNMENTSPECIAL PROJECTS
FUND
156CRIMINALJUSTICE
FUND
ASSETS Cash and cash equivalents 135,169$ 138,078$ 340,013$ 3,490,102$ Investments 259,769 265,361 653,441 6,707,324 Receivables, net
Taxes - - - 514,270 Customer accounts - 697 - - Interest - - - 48,797 Due from other governmental units - - - 52,590
Notes/contracts receivable - - - -
TOTAL ASSETS 394,938$ 404,136$ 993,454$ 10,813,083$
LIABILITIES Wages payable -$ -$ -$ -$ Accounts payable 308 1,067 - 45,444 Interfund payable - - - - Due to other governmental units - - - - Revenues collected in advance - - - - Other liabilities - 239 - -
TOTAL LIABILITIES 308 1,306 - 45,444
DEFERRED INFLOWS OF RESOURCESUnavailable revenues-other - - - 27,838
TOTAL DEFERRED INFLOWS OF REVENUES - - - 27,838
FUND BALANCESRestricted 205,088 115,388 993,414 10,709,009 Assigned 189,542 287,442 40 30,792
TOTAL FUND BALANCES 394,630 402,830 993,454 10,739,801
TOTAL LIABILITIES, DEFERRED INFLOWS OF RESOURCES AND FUND BALANCES 394,938$ 404,136$ 993,454$ 10,813,083$

CITY OF EVERETT FINANCIAL SECTION
2019 COMPREHENSIVE ANNUAL FINANCIAL REPORT PAGE 109
COMBINING BALANCE SHEET NONMAJOR SPECIAL REVENUE FUNDS
DECEMBER 31, 2019 (Page 3 of 4)
157TRAFFIC
MITIGATIONFUND
159Transportation
Benefit Dist.FUND
170Everett
CDE LLCFUND
ASSETS Cash and cash equivalents 2,388,261$ 208,867$ 251,123$ Investments 4,589,792 401,403 2,412 Receivables, net
Taxes - 259,450 - Customer accounts - - 180 Interest 31,029 - - Due from other governmental units - - -
Notes/contracts receivable - - -
TOTAL ASSETS 7,009,082$ 869,720$ 253,715$
LIABILITIES Wages payable -$ -$ -$ Accounts payable - - - Interfund payable - - - Due to other governmental units - - - Revenues collected in advance - - 64,286 Other liabilities - - -
TOTAL LIABILITIES - - 64,286
DEFERRED INFLOWS OF RESOURCESUnavailable revenues-other - - -
TOTAL DEFERRED INFLOWS OF REVENUES - - -
FUND BALANCESRestricted 7,009,082 869,720 - Assigned - - 189,429
TOTAL FUND BALANCES 7,009,082 869,720 189,429
TOTAL LIABILITIES, DEFERRED INFLOWS OF RESOURCES AND FUND BALANCES 7,009,082$ 869,720$ 253,715$
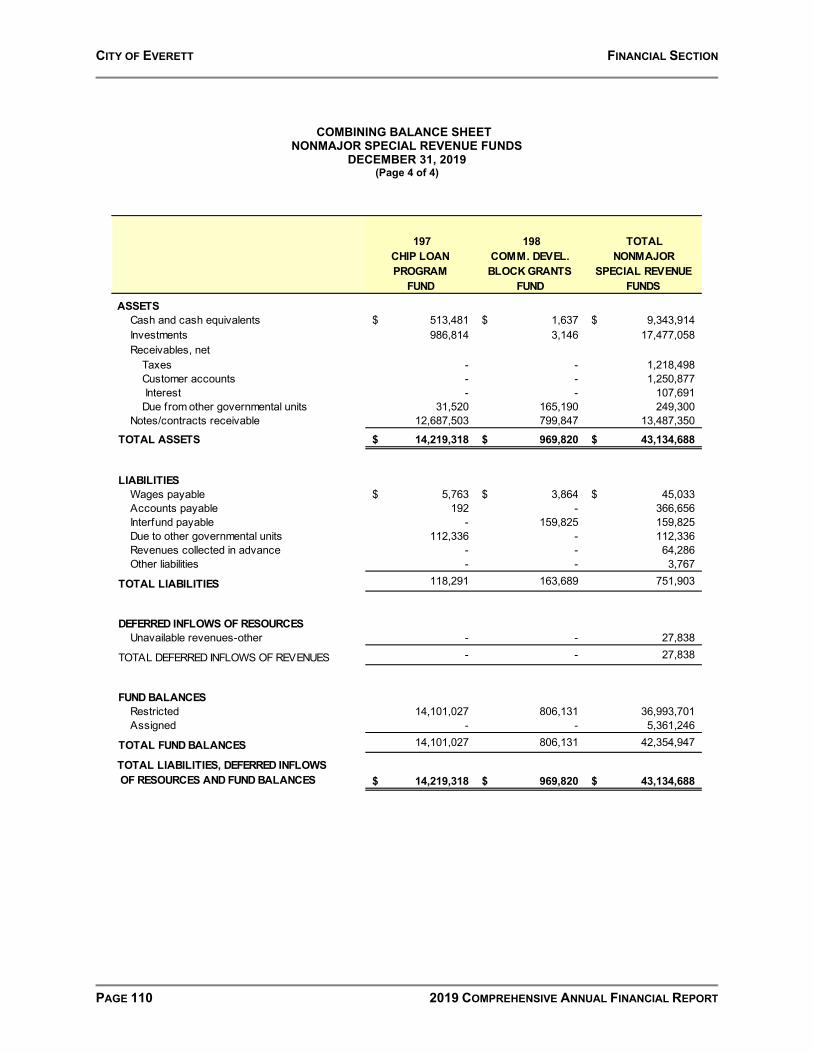
CITY OF EVERETT FINANCIAL SECTION
PAGE 110 2019 COMPREHENSIVE ANNUAL FINANCIAL REPORT
COMBINING BALANCE SHEET NONMAJOR SPECIAL REVENUE FUNDS
DECEMBER 31, 2019 (Page 4 of 4)
197CHIP LOANPROGRAM
FUND
198COMM. DEVEL.BLOCK GRANTS
FUND
TOTAL NONMAJOR
SPECIAL REVENUEFUNDS
ASSETS Cash and cash equivalents 513,481$ 1,637$ 9,343,914$ Investments 986,814 3,146 17,477,058 Receivables, net
Taxes - - 1,218,498 Customer accounts - - 1,250,877 Interest - - 107,691 Due from other governmental units 31,520 165,190 249,300
Notes/contracts receivable 12,687,503 799,847 13,487,350
TOTAL ASSETS 14,219,318$ 969,820$ 43,134,688$
LIABILITIES Wages payable 5,763$ 3,864$ 45,033$ Accounts payable 192 - 366,656 Interfund payable - 159,825 159,825 Due to other governmental units 112,336 - 112,336 Revenues collected in advance - - 64,286 Other liabilities - - 3,767
TOTAL LIABILITIES 118,291 163,689 751,903
DEFERRED INFLOWS OF RESOURCESUnavailable revenues-other - - 27,838
TOTAL DEFERRED INFLOWS OF REVENUES - - 27,838
FUND BALANCESRestricted 14,101,027 806,131 36,993,701 Assigned - - 5,361,246
TOTAL FUND BALANCES 14,101,027 806,131 42,354,947
TOTAL LIABILITIES, DEFERRED INFLOWS OF RESOURCES AND FUND BALANCES 14,219,318$ 969,820$ 43,134,688$

CITY OF EVERETT FINANCIAL SECTION
2019 COMPREHENSIVE ANNUAL FINANCIAL REPORT PAGE 111
COMBINING STATEMENT OF REVENUES, EXPENDITURES, AND CHANGES IN FUND BALANCES NONMAJOR SPECIAL REVENUE FUNDS
FOR THE YEAR ENDED DECEMBER 31, 2019 (Page 1 of 4)
119STREET
IMPROVEMENTFUND
120STREETS
FUND
138HOTEL/MOTEL TAX
FUND
148CUM. RESERVE
PARKSFUND
REVENUESTaxes -$ 903,733$ 680,749$ -$ Intergovernmental revenues 799,252 1,709,557 - - Charges for services - - - 674 Fines and forfeits - - - - Other revenues 53,911 54,796 18,033 474,664
Total revenues 853,163 2,668,086 698,782 475,338
EXPENDITURESCurrent:General government services - - - - Security of persons and property - - - - Transportation - 2,946,660 - - Economic environment - - - 9,381 Culture and recreation - - 740,570 23,686
Capital outlay 661,139 - - 13,997 Total expenditures 661,139 2,946,660 740,570 47,064
Excess (deficiency) of revenuesover (under) expenditures 192,024 (278,574) (41,788) 428,274
OTHER FINANCING SOURCES (USES)Transfers in 1,897,915 - - - Transfers out (1,091,769) - (143,629) (1,036,106) Insurance recoveries - 308 - - Total other financing sources (uses) 806,146 308 (143,629) (1,036,106)
Net change in fund balances 998,170 (278,266) (185,417) (607,832)
Fund balances - beginning 1,493,737 2,268,647 637,542 2,522,262
FUND BALANCES - ENDING 2,491,907$ 1,990,381$ 452,125$ 1,914,430$

CITY OF EVERETT FINANCIAL SECTION
PAGE 112 2019 COMPREHENSIVE ANNUAL FINANCIAL REPORT
COMBINING STATEMENT OF REVENUES, EXPENDITURES, AND CHANGES IN FUND BALANCES NONMAJOR SPECIAL REVENUE FUNDS
FOR THE YEAR ENDED DECEMBER 31, 2019 (Page 2 of 4)
151ANIMALS
FUND
152CUM. RESERVE
LIBRARYFUND
155GENERAL GOVERNMENT
SPECIAL PROJECTSFUND
156CRIMINALJUSTICE
FUND
REVENUESTaxes -$ -$ -$ 2,179,416$ Intergovernmental revenues - - - 764,840 Charges for services 8,071 1,783 - 215,045 Fines and forfeits - - - 4,887 Other revenues 114,162 107,538 17,700 302,068
Total revenues 122,233 109,321 17,700 3,466,256
EXPENDITURESCurrent:General government services - - - 86,902 Security of persons and property - - - 318,192 Transportation - - - - Economic environment 135,016 - 60,352 - Culture and recreation - 34,611 - -
Capital outlay - 16,994 - - Total expenditures 135,016 51,605 60,352 405,094
Excess (deficiency) of revenuesover (under) expenditures (12,783) 57,716 (42,652) 3,061,162
OTHER FINANCING SOURCES (USES)Transfers in - - 1,036,106 - Transfers out - (40,000) - (2,395,508) Insurance recoveries - - - - Total other financing sources (uses) - (40,000) 1,036,106 (2,395,508)
Net change in fund balances (12,783) 17,716 993,454 665,654
Fund balances - beginning 407,413 385,114 - 10,074,147
FUND BALANCES - ENDING 394,630$ 402,830$ 993,454$ 10,739,801$
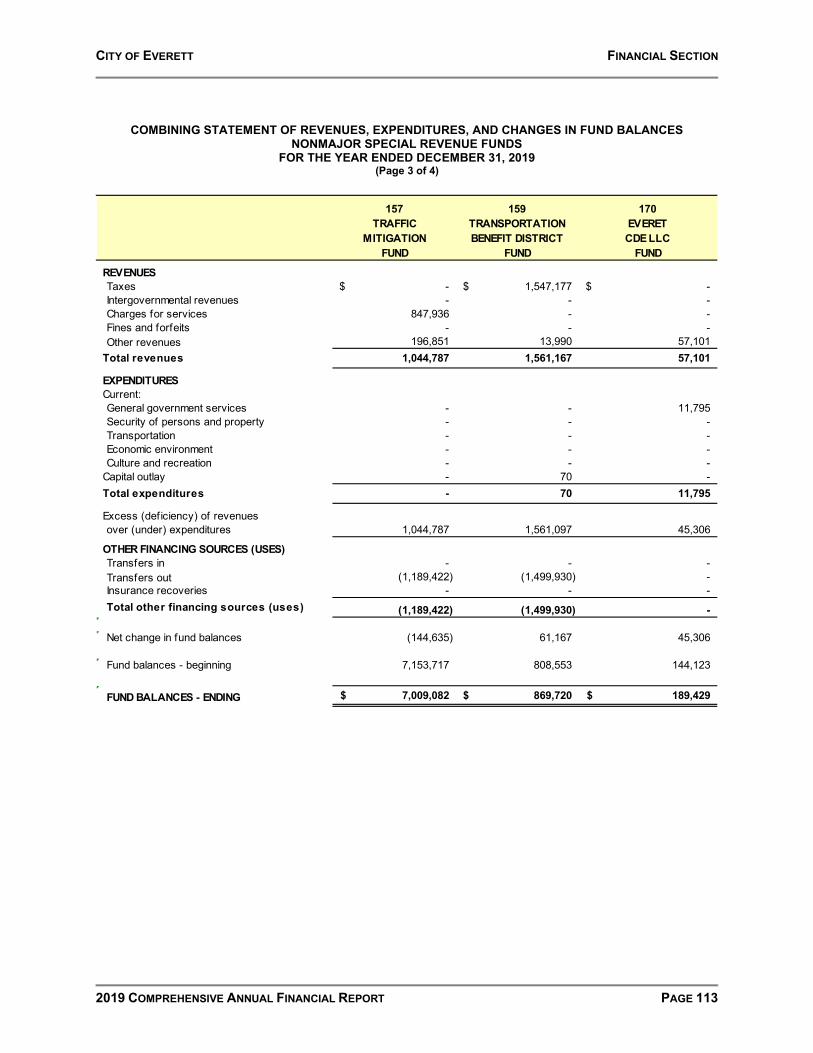
CITY OF EVERETT FINANCIAL SECTION
2019 COMPREHENSIVE ANNUAL FINANCIAL REPORT PAGE 113
COMBINING STATEMENT OF REVENUES, EXPENDITURES, AND CHANGES IN FUND BALANCES NONMAJOR SPECIAL REVENUE FUNDS
FOR THE YEAR ENDED DECEMBER 31, 2019 (Page 3 of 4)
157TRAFFIC
MITIGATIONFUND
159TRANSPORTATION BENEFIT DISTRICT
FUND
170 EVERETCDE LLC
FUND
REVENUESTaxes -$ 1,547,177$ -$ Intergovernmental revenues - - - Charges for services 847,936 - - Fines and forfeits - - - Other revenues 196,851 13,990 57,101
Total revenues 1,044,787 1,561,167 57,101
EXPENDITURESCurrent:General government services - - 11,795 Security of persons and property - - - Transportation - - - Economic environment - - - Culture and recreation - - -
Capital outlay - 70 - Total expenditures - 70 11,795
Excess (deficiency) of revenuesover (under) expenditures 1,044,787 1,561,097 45,306
OTHER FINANCING SOURCES (USES)Transfers in - - - Transfers out (1,189,422) (1,499,930) - Insurance recoveries - - - Total other financing sources (uses) (1,189,422) (1,499,930) -
Net change in fund balances (144,635) 61,167 45,306
Fund balances - beginning 7,153,717 808,553 144,123
FUND BALANCES - ENDING 7,009,082$ 869,720$ 189,429$
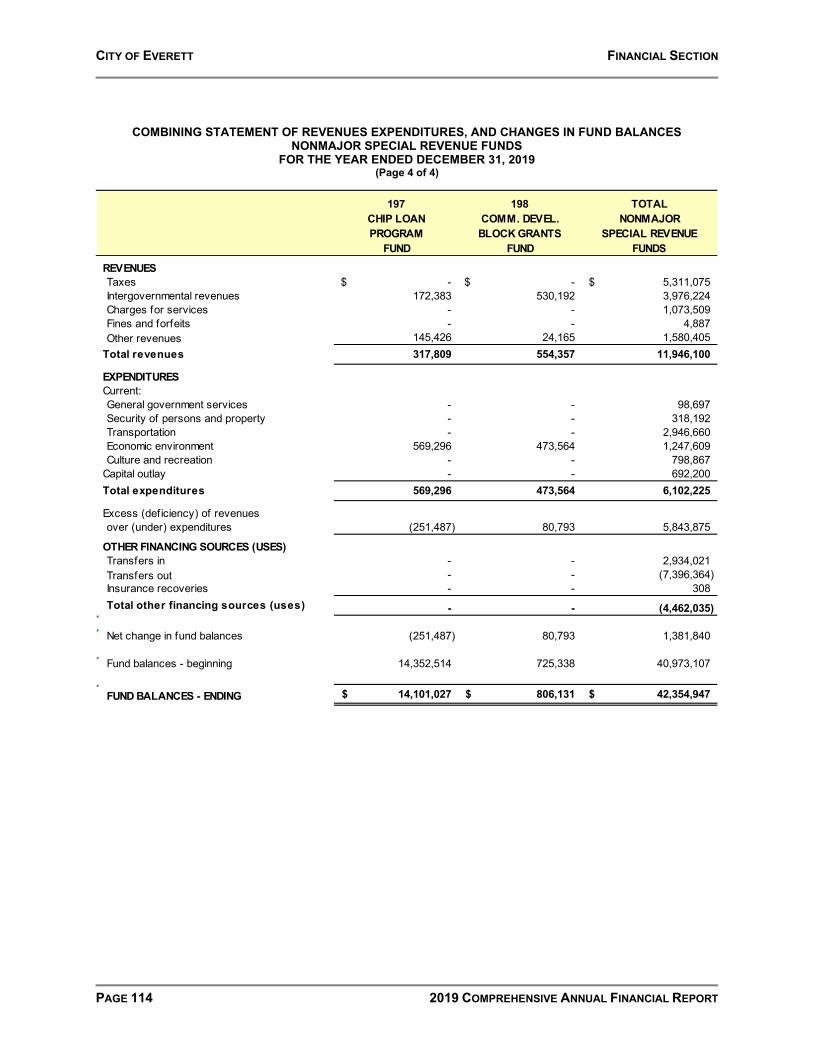
CITY OF EVERETT FINANCIAL SECTION
PAGE 114 2019 COMPREHENSIVE ANNUAL FINANCIAL REPORT
COMBINING STATEMENT OF REVENUES EXPENDITURES, AND CHANGES IN FUND BALANCES NONMAJOR SPECIAL REVENUE FUNDS
FOR THE YEAR ENDED DECEMBER 31, 2019 (Page 4 of 4)
197CHIP LOANPROGRAM
FUND
198COMM. DEVEL.BLOCK GRANTS
FUND
TOTALNONMAJOR
SPECIAL REVENUEFUNDS
REVENUESTaxes -$ -$ 5,311,075$ Intergovernmental revenues 172,383 530,192 3,976,224 Charges for services - - 1,073,509 Fines and forfeits - - 4,887 Other revenues 145,426 24,165 1,580,405
Total revenues 317,809 554,357 11,946,100
EXPENDITURESCurrent:General government services - - 98,697 Security of persons and property - - 318,192 Transportation - - 2,946,660 Economic environment 569,296 473,564 1,247,609 Culture and recreation - - 798,867
Capital outlay - - 692,200 Total expenditures 569,296 473,564 6,102,225
Excess (deficiency) of revenuesover (under) expenditures (251,487) 80,793 5,843,875
OTHER FINANCING SOURCES (USES)Transfers in - - 2,934,021 Transfers out - - (7,396,364) Insurance recoveries - - 308 Total other financing sources (uses) - - (4,462,035)
Net change in fund balances (251,487) 80,793 1,381,840
Fund balances - beginning 14,352,514 725,338 40,973,107
FUND BALANCES - ENDING 14,101,027$ 806,131$ 42,354,947$

DEBT SERVICE FUNDS 243 The Local Improvement District (LID) Guaranty Fund was established in 1919 to
guarantee the payments of LID bonds and other short-term obligations. 299 The Consolidated Local Improvement District (LID) Bond Redemption Fund collects
special assessments levied against benefited properties for payment of principal and interest for special assessment bond issues.

CITY OF EVERETT FINANCIAL SECTION
2019 COMPREHENSIVE ANNUAL FINANCIAL REPORT PAGE 115
COMBINING BALANCE SHEET NONMAJOR DEBT SERVICE FUNDS
DECEMBER 31, 2019
243L.I.D.
GUARANTYFUND
299CONSOLIDATED
L.I.D. BONDREDEMPTION
FUND
TOTAL NONMAJOR
DEBT SERVICE
ASSETSCash and cash equivalents 173$ 8,255$ 8,428$ Investments 333 15,865 16,198 Special assessments - non-current - 96,700 96,700
TOTAL ASSETS 506$ 120,820$ 121,326$
LIABILITIES Accounts payable -$ 6,709$ 6,709$
TOTAL LIABILITIES - 6,709 6,709
DEFERRED INFLOWS OF RESOURCESUnavailable revenues-special assessments -$ 96,699$ 96,699$
TOTAL DEFERRED INFLOWS OF RESOURCES - 96,699 96,699
FUND BALANCESAssigned 506 17,412 17,918
TOTAL FUND BALANCES 506 17,412 17,918
TOTAL LIABILITIES, DEFERRED INFLOWS OF RESOURCES AND FUND BALANCES 506$ 120,820$ 121,326$

CITY OF EVERETT FINANCIAL SECTION
PAGE 116 2019 COMPREHENSIVE ANNUAL FINANCIAL REPORT
COMBINING STATEMENT OF REVENUES, EXPENDITURES, AND CHANGES IN FUND BALANCES NONMAJOR DEBT SERVICE FUNDS
FOR THE YEAR ENDED DECEMBER 31, 2019
243
L.I.D.GUARANTY
FUND
299CONSOLIDATED
L.I.D. BONDREDEMPTION
FUND
TOTALNONMAJOR
DEBT SERVICEFUNDS
REVENUESOther revenues 422$ 10,998$ 11,420$
Total revenues 422 10,998 11,420
EXPENDITURESTotal expenditures - - -
Excess (deficiency) of revenuesover (under) expenditures 422 10,998 11,420
OTHER FINANCING SOURCES (USES)Transfers in 18,928 - 18,928 Transfers out (21,821) (18,928) (40,749) Total other financing sources (uses) (2,893) (18,928) (21,821)
Net change in fund balances (2,471) (7,930) (10,401)
Fund balances - beginning 2,977 25,342 28,319
FUND BALANCES - ENDING 506$ 17,412$ 17,918$

CAPITAL PROJECTS FUNDS 301 The Capital Improvement Reserve Fund accounts for the activity and reserves
associated with community, recreational, and public safety imrpovements. 303 The Public Works Improvement Project Fund accounts for Public Works enhancement
and improvement projects. 308 The Riverfront District Development Fund accounts for general government projects
related to the Riverfront District development. 342 The City Facilities Construction Fund accounts for construction of new city facilities. 354 The Parks CIP 3 Construction Fund accounts for the design and construction of various
park improvements funded by the City of Everett Capital Improvement Program III.
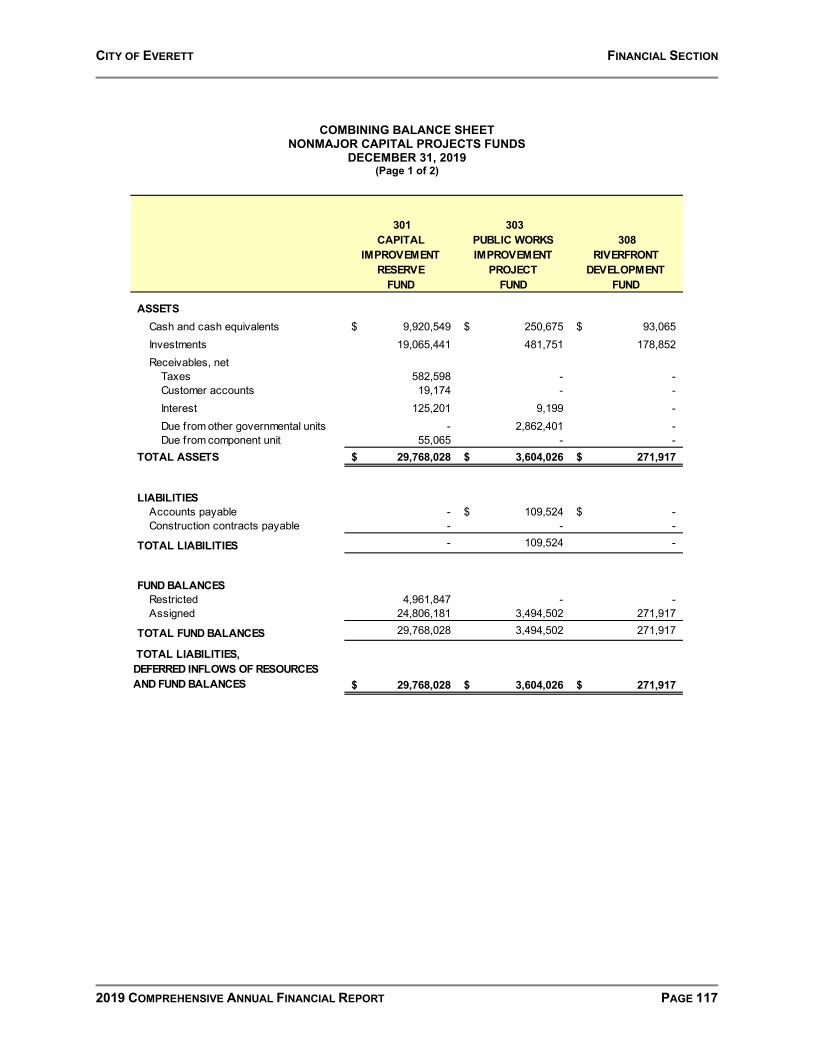
CITY OF EVERETT FINANCIAL SECTION
2019 COMPREHENSIVE ANNUAL FINANCIAL REPORT PAGE 117
COMBINING BALANCE SHEET NONMAJOR CAPITAL PROJECTS FUNDS
DECEMBER 31, 2019 (Page 1 of 2)
301CAPITAL
IMPROVEMENTRESERVE
FUND
303PUBLIC WORKSIMPROVEMENT
PROJECTFUND
308RIVERFRONT
DEVELOPMENTFUND
ASSETSCash and cash equivalents 9,920,549$ 250,675$ 93,065$ Investments 19,065,441 481,751 178,852 Receivables, net
Taxes 582,598 - - Customer accounts 19,174 - - Interest 125,201 9,199 - Due from other governmental units - 2,862,401 - Due from component unit 55,065 - -
TOTAL ASSETS 29,768,028$ 3,604,026$ 271,917$
LIABILITIES Accounts payable - 109,524$ -$ Construction contracts payable - - -
TOTAL LIABILITIES - 109,524 -
FUND BALANCESRestricted 4,961,847 - - Assigned 24,806,181 3,494,502 271,917
TOTAL FUND BALANCES 29,768,028 3,494,502 271,917
TOTAL LIABILITIES, DEFERRED INFLOWS OF RESOURCES AND FUND BALANCES 29,768,028$ 3,604,026$ 271,917$
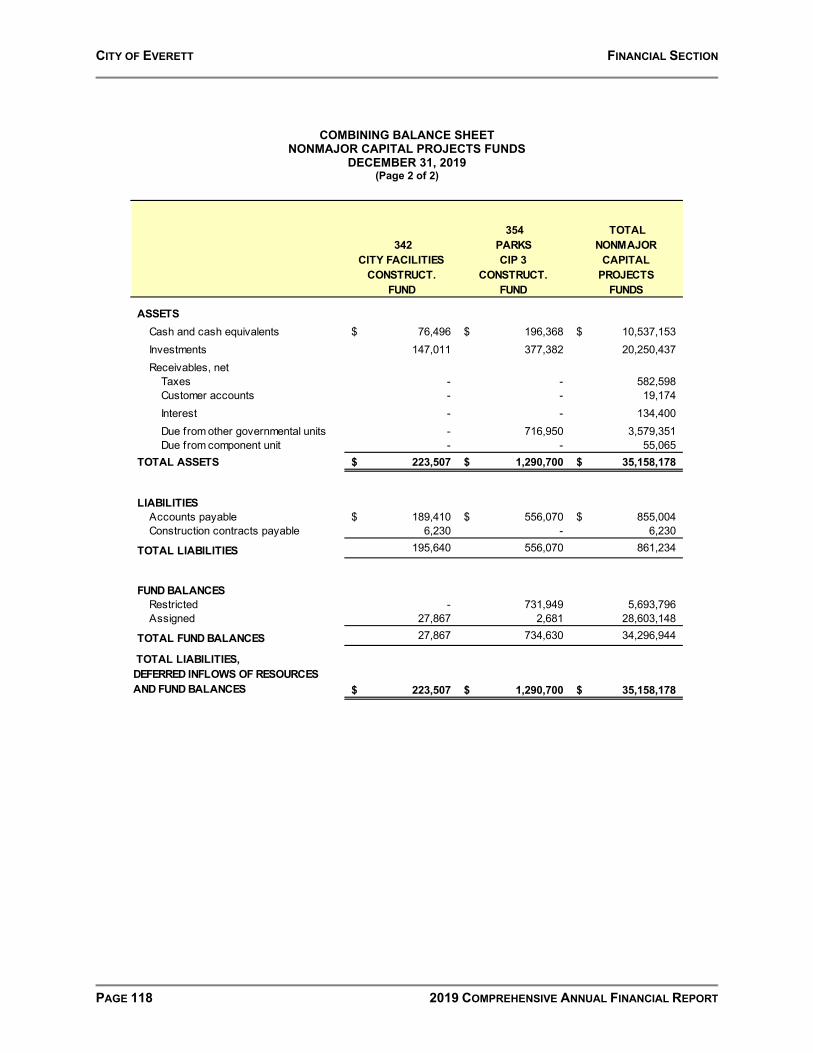
CITY OF EVERETT FINANCIAL SECTION
PAGE 118 2019 COMPREHENSIVE ANNUAL FINANCIAL REPORT
COMBINING BALANCE SHEET NONMAJOR CAPITAL PROJECTS FUNDS
DECEMBER 31, 2019 (Page 2 of 2)
342CITY FACILITIES
CONSTRUCT.FUND
354PARKSCIP 3
CONSTRUCT.FUND
TOTAL NONMAJOR
CAPITALPROJECTS
FUNDS
ASSETSCash and cash equivalents 76,496$ 196,368$ 10,537,153$ Investments 147,011 377,382 20,250,437 Receivables, net
Taxes - - 582,598 Customer accounts - - 19,174 Interest - - 134,400 Due from other governmental units - 716,950 3,579,351 Due from component unit - - 55,065
TOTAL ASSETS 223,507$ 1,290,700$ 35,158,178$
LIABILITIES Accounts payable 189,410$ 556,070$ 855,004$ Construction contracts payable 6,230 - 6,230
TOTAL LIABILITIES 195,640 556,070 861,234
FUND BALANCESRestricted - 731,949 5,693,796 Assigned 27,867 2,681 28,603,148
TOTAL FUND BALANCES 27,867 734,630 34,296,944
TOTAL LIABILITIES, DEFERRED INFLOWS OF RESOURCES AND FUND BALANCES 223,507$ 1,290,700$ 35,158,178$

CITY OF EVERETT FINANCIAL SECTION
2019 COMPREHENSIVE ANNUAL FINANCIAL REPORT PAGE 119
COMBINING STATEMENT OF REVENUES, EXPENDITURES, AND CHANGES IN FUND BALANCES NONMAJOR CAPITAL PROJECTS FUNDS
FOR THE YEAR ENDED DECEMBER 31, 2019 (Page 1 of 2)
301
CAPITAL IMPROVEMENT
RESERVE FUND
303PUBLIC WORKSIMPROVEMENT
PROJECTFUND
308RIVERFRONT
DEVELOPMENTFUND
REVENUESTaxes 6,649,142$ -$ -$ Intergovernmental revenues - 5,203,101 - Charges for services - - - Other revenues 2,240,854 59,523 5,711 Total revenues 8,889,996 5,262,624 5,711
EXPENDITURESCurrent:General government services 88,335 - - Culture and recreation 500,000 - - Capital outlay 30,687 9,343,403 -
Debt service: Principal 134,732 - - Interest 34,610 - - Total expenditures 788,364 9,343,403 -
Excess (deficiency) of revenuesover (under) expenditures 8,101,632 (4,080,779) 5,711
OTHER FINANCING SOURCES (USES)Proceeds of LT Debt 35,038 - - Disposition of capital assets 905,000 - - Transfers in 3,274,219 6,667,087 14,925 Transfers out (17,902,895) (769,618) - Total other financing sources (uses) (13,688,638) 5,897,469 14,925
Net change in fund balances (5,587,006) 1,816,690 20,636
Fund balances - beginning 35,355,034 1,677,812 251,281
FUND BALANCES - ENDING 29,768,028$ 3,494,502$ 271,917$

CITY OF EVERETT FINANCIAL SECTION
PAGE 120 2019 COMPREHENSIVE ANNUAL FINANCIAL REPORT
COMBINING STATEMENT OF REVENUES, EXPENDITURES, AND CHANGES IN FUND BALANCES NONMAJOR CAPITAL PROJECTS FUNDS
FOR THE YEAR ENDED DECEMBER 31, 2019 (Page 2 of 2)
342CITY FACILITIESCONSTRUCTION
FUND
354PARKSCIP 3
CONSTRUCT.FUND
TOTAL
NONMAJORCAPITAL
PROJECTSFUNDS
REVENUESTaxes -$ -$ 6,649,142$ Intergovernmental revenues - 706,480 5,909,581 Charges for services - 11,854 11,854 Other revenues (423) 48,914 2,354,579 Total revenues (423) 767,248 14,925,156
EXPENDITURESCurrent:General government services 537,073 - 625,408 Culture and recreation - - 500,000 Capital outlay 5,962,166 4,141,860 19,478,116
Debt service: Principal - - 134,732 Interest - - 34,610 Total expenditures 6,499,239 4,141,860 20,772,866
Excess (deficiency) of revenuesover (under) expenditures (6,499,662) (3,374,612) (5,847,710)
OTHER FINANCING SOURCES (USES)Proceeds of LT Debt - - 35,038 Disposition of capital assets - - 905,000 Transfers in 6,441,283 3,954,835 20,352,349 Transfers out (45,299) (500) (18,718,312) Total other financing sources (uses) 6,395,984 3,954,335 2,574,075
Net change in fund balances (103,678) 579,723 (3,273,635)
Fund balances - beginning 131,545 154,907 37,570,579
FUND BALANCES - ENDING 27,867$ 734,630$ 34,296,944$

BUDGET AND ACTUAL

CITY OF EVERETT FINANCIAL SECTION
2019 COMPREHENSIVE ANNUAL FINANCIAL REPORT PAGE 121
SCHEDULE OF REVENUES, EXPENDITURES, AND CHANGES IN FUND BALANCES – BUDGET TO ACTUAL
FUND 101 – PARKS AND RECREATION FUND FOR THE YEAR ENDED DECEMBER 31, 2019
ORIGINAL BUDGET
FINAL BUDGET ACTUAL
VARIANCE WITH FINAL BUDGET
POSITIVE/(NEGATIVE)
REVENUESTaxes 7,105,660$ 6,955,359$ 6,955,359$ -$ Charges for services 1,335,100 1,335,100 1,305,040 (30,060) Other revenues 393,690 393,690 452,207 58,517
Total Revenues 8,834,450 8,684,149 8,712,606 28,457 EXPENDITURESCurrent:
Culture and recreation 9,334,450 9,286,637 8,238,208 1,048,429 Capital outlay - 126,188 42,097 84,091 Total Expenditures 9,334,450 9,412,825 8,280,305 1,132,520 Excess (deficiency) of revenues
over (under) expenditures (500,000) (728,676) 432,301 1,160,977 OTHER FINANCING SOURCES (USES)
Transfers in - 82,236 82,236 - Transfers out - - (16,807) (16,807) Insurance recoveries - - 1,800 1,800
Total other financing sources (uses) - 82,236 67,229 (15,007)
Net changes in fund balances (500,000) (646,440) 499,530 1,145,970
Fund balances - beginning 500,000 646,440 2,453,083 1,806,643 FUND BALANCES - ENDING -$ -$ 2,952,613$ 2,952,613$
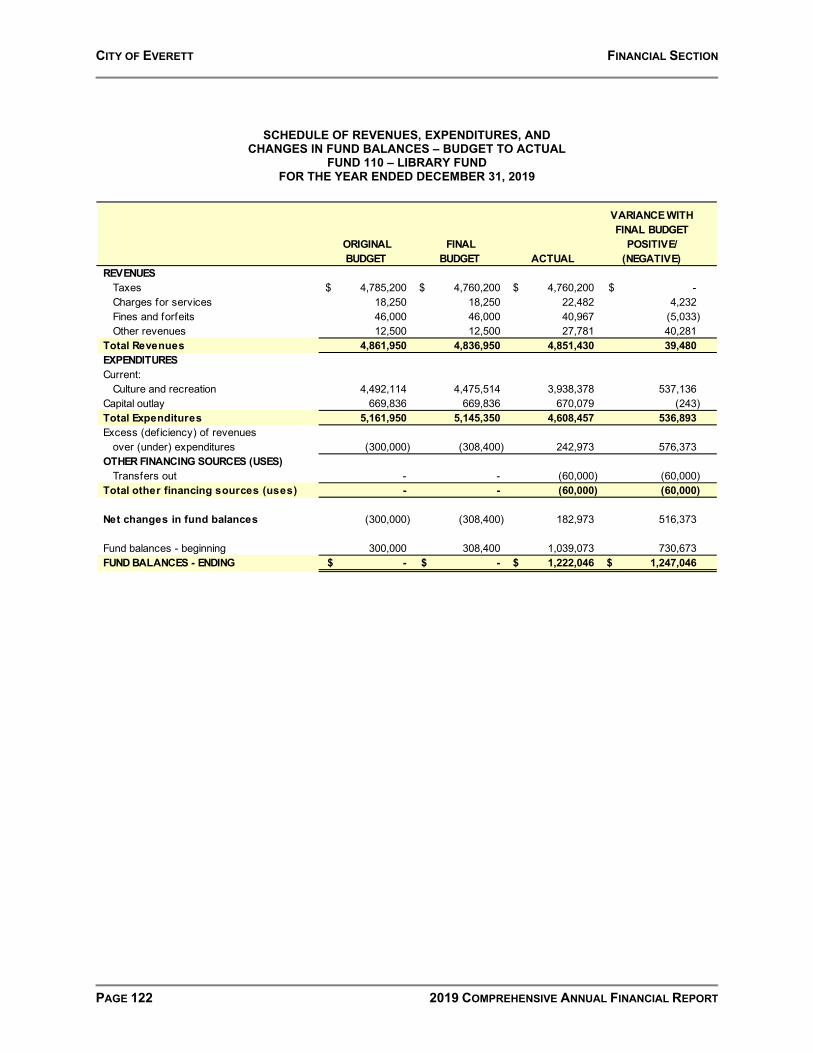
CITY OF EVERETT FINANCIAL SECTION
PAGE 122 2019 COMPREHENSIVE ANNUAL FINANCIAL REPORT
SCHEDULE OF REVENUES, EXPENDITURES, AND CHANGES IN FUND BALANCES – BUDGET TO ACTUAL
FUND 110 – LIBRARY FUND FOR THE YEAR ENDED DECEMBER 31, 2019
ORIGINAL BUDGET
FINAL BUDGET ACTUAL
VARIANCE WITH FINAL BUDGET
POSITIVE/(NEGATIVE)
REVENUESTaxes 4,785,200$ 4,760,200$ 4,760,200$ -$ Charges for services 18,250 18,250 22,482 4,232 Fines and forfeits 46,000 46,000 40,967 (5,033) Other revenues 12,500 12,500 27,781 40,281
Total Revenues 4,861,950 4,836,950 4,851,430 39,480 EXPENDITURESCurrent:
Culture and recreation 4,492,114 4,475,514 3,938,378 537,136 Capital outlay 669,836 669,836 670,079 (243) Total Expenditures 5,161,950 5,145,350 4,608,457 536,893 Excess (deficiency) of revenues
over (under) expenditures (300,000) (308,400) 242,973 576,373 OTHER FINANCING SOURCES (USES)
Transfers out - - (60,000) (60,000) Total other financing sources (uses) - - (60,000) (60,000)
Net changes in fund balances (300,000) (308,400) 182,973 516,373
Fund balances - beginning 300,000 308,400 1,039,073 730,673 FUND BALANCES - ENDING -$ -$ 1,222,046$ 1,247,046$
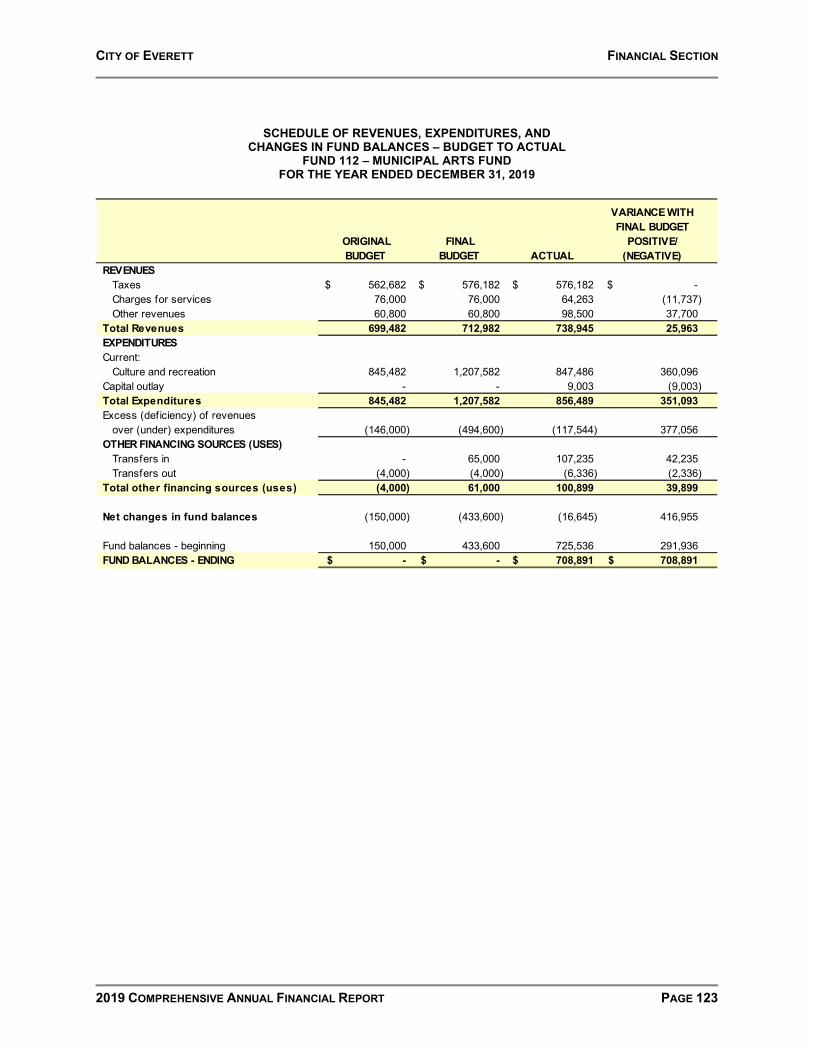
CITY OF EVERETT FINANCIAL SECTION
2019 COMPREHENSIVE ANNUAL FINANCIAL REPORT PAGE 123
SCHEDULE OF REVENUES, EXPENDITURES, AND CHANGES IN FUND BALANCES – BUDGET TO ACTUAL
FUND 112 – MUNICIPAL ARTS FUND FOR THE YEAR ENDED DECEMBER 31, 2019
ORIGINAL BUDGET
FINAL BUDGET ACTUAL
VARIANCE WITH FINAL BUDGET
POSITIVE/(NEGATIVE)
REVENUESTaxes 562,682$ 576,182$ 576,182$ -$ Charges for services 76,000 76,000 64,263 (11,737) Other revenues 60,800 60,800 98,500 37,700
Total Revenues 699,482 712,982 738,945 25,963 EXPENDITURESCurrent:
Culture and recreation 845,482 1,207,582 847,486 360,096 Capital outlay - - 9,003 (9,003) Total Expenditures 845,482 1,207,582 856,489 351,093 Excess (deficiency) of revenues
over (under) expenditures (146,000) (494,600) (117,544) 377,056 OTHER FINANCING SOURCES (USES)
Transfers in - 65,000 107,235 42,235 Transfers out (4,000) (4,000) (6,336) (2,336)
Total other financing sources (uses) (4,000) 61,000 100,899 39,899
Net changes in fund balances (150,000) (433,600) (16,645) 416,955
Fund balances - beginning 150,000 433,600 725,536 291,936 FUND BALANCES - ENDING -$ -$ 708,891$ 708,891$

CITY OF EVERETT FINANCIAL SECTION
PAGE 124 2019 COMPREHENSIVE ANNUAL FINANCIAL REPORT
SCHEDULE OF REVENUES, EXPENDITURES, AND CHANGES IN FUND BALANCES – BUDGET TO ACTUAL
FUND 114 – CONFERENCE CENTER FUND FOR THE YEAR ENDED DECEMBER 31, 2019
ORIGINAL BUDGET
FINAL BUDGET ACTUAL
VARIANCE WITH FINAL BUDGET
POSITIVE/(NEGATIVE)
REVENUESOther revenues 124,560$ 124,560$ 119,391$ (5,169)$
Total Revenues 124,560 124,560 119,391 (5,169) EXPENDITURESCurrent:
Culture and recreation 67,002 117,002 37,440 79,562 Total Expenditures 67,002 117,002 37,440 79,562 Excess (deficiency) of revenues
over (under) expenditures 57,558 7,558 81,951 74,393 OTHER FINANCING SOURCES (USES)
Transfers in 1,052,532 1,052,532 1,025,027 (27,505) Transfers out (1,110,090) (1,110,090) (1,110,090) -
Total other financing sources (uses) (57,558) (57,558) (85,063) (27,505)
Net changes in fund balances - (50,000) (3,112) 46,888
Fund balances - beginning - 50,000 65,452 15,452 FUND BALANCES - ENDING -$ -$ 62,340$ 62,340$
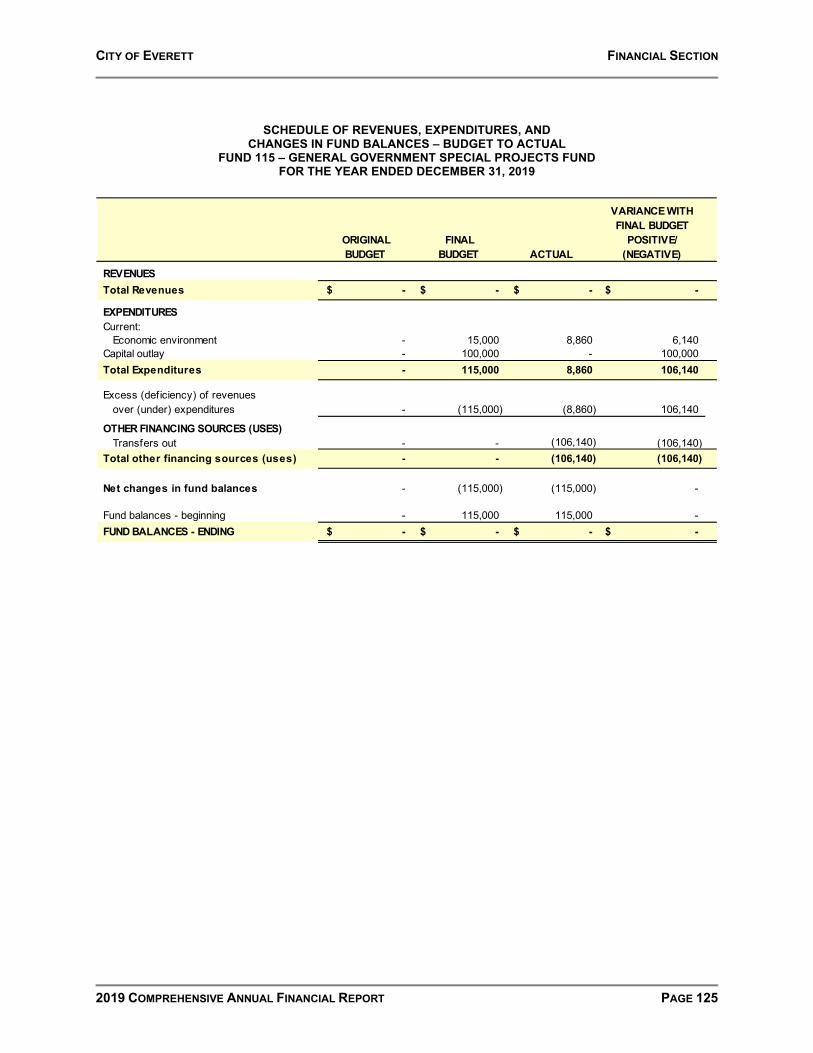
CITY OF EVERETT FINANCIAL SECTION
2019 COMPREHENSIVE ANNUAL FINANCIAL REPORT PAGE 125
SCHEDULE OF REVENUES, EXPENDITURES, AND CHANGES IN FUND BALANCES – BUDGET TO ACTUAL
FUND 115 – GENERAL GOVERNMENT SPECIAL PROJECTS FUND FOR THE YEAR ENDED DECEMBER 31, 2019
ORIGINAL BUDGET
FINAL BUDGET ACTUAL
VARIANCE WITH FINAL BUDGET
POSITIVE/(NEGATIVE)
REVENUESTotal Revenues -$ -$ -$ -$
EXPENDITURESCurrent:
Economic environment - 15,000 8,860 6,140 Capital outlay - 100,000 - 100,000 Total Expenditures - 115,000 8,860 106,140
Excess (deficiency) of revenuesover (under) expenditures - (115,000) (8,860) 106,140
OTHER FINANCING SOURCES (USES)Transfers out - - (106,140) (106,140)
Total other financing sources (uses) - - (106,140) (106,140)
Net changes in fund balances - (115,000) (115,000) -
Fund balances - beginning - 115,000 115,000 - FUND BALANCES - ENDING -$ -$ -$ -$

CITY OF EVERETT FINANCIAL SECTION
PAGE 126 2019 COMPREHENSIVE ANNUAL FINANCIAL REPORT
SCHEDULE OF REVENUES, EXPENDITURES, AND CHANGES IN FUND BALANCES – BUDGET TO ACTUAL
FUND 119 – STREET IMPROVEMENT FUND FOR THE YEAR ENDED DECEMBER 31, 2019
ORIGINAL
BUDGET FINAL
BUDGET ACTUAL
VARIANCE WITH FINAL BUDGET
POSITIVE/(NEGATIVE)
REVENUESIntergovernmental revenues 825,834$ 825,834$ 799,252$ (26,582)$ Other revenues 30,000 30,000 53,911 23,911
Total Revenues 855,834 855,834 853,163 (2,671) EXPENDITURESCurrent:Capital outlay 2,665,834 3,623,764 661,139 2,962,625 Total Expenditures 2,665,834 3,623,764 661,139 2,962,625
Excess (deficiency) of revenuesover (under) expenditures (1,810,000) (2,767,930) 192,024 2,959,954
OTHER FINANCING SOURCES (USES)Transfers in 1,800,000 1,800,000 1,897,915 97,915 Transfers out - - (1,091,769) (1,091,769) Insurance recoveries 10,000 10,000 - (10,000)
Total other financing sources (uses) 1,810,000 1,810,000 806,146 (1,003,854)
Net changes in fund balances - (957,930) 998,170 1,956,100
Fund balances - beginning - 957,930 1,493,737 535,807 FUND BALANCES - ENDING -$ -$ 2,491,907$ 2,491,907$

CITY OF EVERETT FINANCIAL SECTION
2019 COMPREHENSIVE ANNUAL FINANCIAL REPORT PAGE 127
SCHEDULE OF REVENUES, EXPENDITURES, AND CHANGES IN FUND BALANCES – BUDGET TO ACTUAL
FUND 120 – STREETS FUND FOR THE YEAR ENDED DECEMBER 31, 2019
ORIGINAL BUDGET
FINAL BUDGET ACTUAL
VARIANCE WITH FINAL BUDGET
POSITIVE/(NEGATIVE)
REVENUESTaxes 976,493$ 903,733$ 903,733$ -$ Intergovernmental revenues 1,766,238 1,766,238 1,709,557 (56,681) Other revenues 50,000 50,000 54,796 4,796
Total Revenues 2,792,731 2,719,971 2,668,086 (51,885)
EXPENDITURESCurrent:
Transportation 3,292,731 3,219,971 2,946,660 273,311 Total Expenditures 3,292,731 3,219,971 2,946,660 273,311
Excess (deficiency) of revenuesover (under) expenditures (500,000) (500,000) (278,574) 221,426
OTHER FINANCING SOURCES (USES)Insurance recoveries - - 308 308
Total other financing sources (uses) - - 308 308
Net changes in fund balances (500,000) (500,000) (278,266) 221,734
Fund balances - beginning 500,000 500,000 2,268,647 1,768,647 FUND BALANCES - ENDING -$ -$ 1,990,381$ 1,990,381$

CITY OF EVERETT FINANCIAL SECTION
PAGE 128 2019 COMPREHENSIVE ANNUAL FINANCIAL REPORT
SCHEDULE OF REVENUES, EXPENDITURES, AND CHANGES IN FUND BALANCES – BUDGET TO ACTUAL
FUND 126 – MOTOR VEHICLE EQUIPMENT REPLACEMENT FUND FOR THE YEAR ENDED DECEMBER 31, 2019
ORIGINAL
BUDGET FINAL
BUDGET ACTUAL
VARIANCE WITH FINAL BUDGET
POSITIVE/(NEGATIVE)
REVENUESIntergovernmental revenues -$ 2,663$ 958,432$ 955,769$ Other revenues 102,000 102,000 176,949 74,949
Total Revenues 102,000 104,663 1,135,381 1,030,718
EXPENDITURESCurrent:
General government services 150,000 150,000 - 150,000 Security of persons and property - - 51 (51) Transportation - - 5,011 (5,011) Culture and recreation - - 19 (19)
Capital outlay 3,230,000 5,192,409 4,640,265 552,144 Total Expenditures 3,380,000 5,342,409 4,645,346 697,063
Excess (deficiency) of revenuesover (under) expenditures (3,278,000) (5,237,746) (3,509,965) 1,727,781
OTHER FINANCING SOURCES (USES)Disposition of capital assets 50,000 50,000 81,078 31,078 Transfers in 1,638,258 1,638,258 1,638,264 6
Total other financing sources (uses) 1,688,258 1,688,258 1,719,342 31,084
Net changes in fund balances (1,589,742) (3,549,488) (1,790,623) 1,758,865
Fund balances - beginning 5,488,023 6,965,019 7,252,443 287,424 FUND BALANCES - ENDING 3,898,281$ 3,415,531$ 5,461,820$ 2,046,289$

CITY OF EVERETT FINANCIAL SECTION
2019 COMPREHENSIVE ANNUAL FINANCIAL REPORT PAGE 129
SCHEDULE OF REVENUES, EXPENDITURES, AND CHANGES IN FUND BALANCES – BUDGET TO ACTUAL
FUND 138 – HOTEL/MOTEL TAX FUND FOR THE YEAR ENDED DECEMBER 31, 2019
ORIGINAL
BUDGET FINAL
BUDGET ACTUAL
VARIANCE WITH FINAL BUDGET
POSITIVE/(NEGATIVE)
REVENUESTaxes 650,000$ 650,000$ 680,749$ 30,749$ Other revenues 8,000 8,000 18,033 10,033
Total Revenues 658,000 658,000 698,782 40,782
EXPENDITURESCurrent:
Culture and recreation 900,000 979,000 740,570 238,430 Total Expenditures 900,000 979,000 740,570 238,430 Excess (deficiency) of revenues
over (under) expenditures (242,000) (321,000) (41,788) 279,212
OTHER FINANCING SOURCES (USES)Transfers out - - (143,629) (143,629)
Total other financing sources (uses) - - (143,629) (143,629)
Net changes in fund balances (242,000) (321,000) (185,417) 135,583
Fund balances - beginning 485,753 564,753 637,542 72,789 FUND BALANCES - ENDING 243,753$ 243,753$ 452,125$ 208,372$
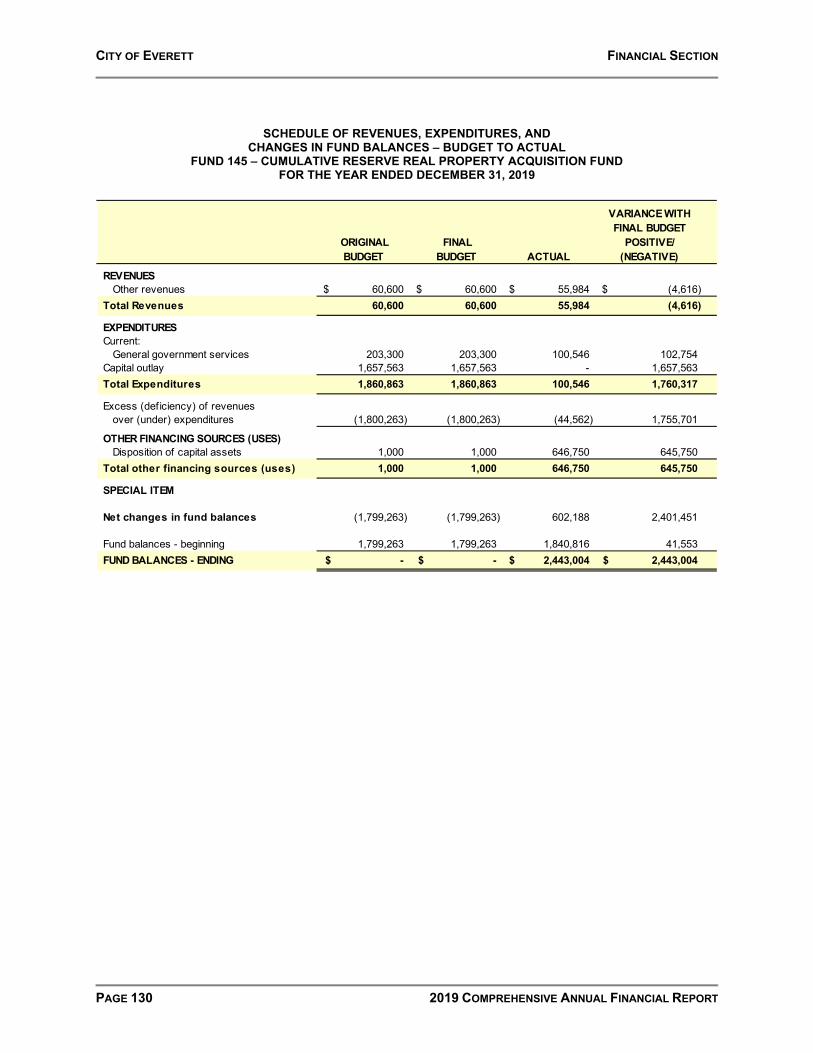
CITY OF EVERETT FINANCIAL SECTION
PAGE 130 2019 COMPREHENSIVE ANNUAL FINANCIAL REPORT
SCHEDULE OF REVENUES, EXPENDITURES, AND CHANGES IN FUND BALANCES – BUDGET TO ACTUAL
FUND 145 – CUMULATIVE RESERVE REAL PROPERTY ACQUISITION FUND FOR THE YEAR ENDED DECEMBER 31, 2019
ORIGINAL BUDGET
FINAL BUDGET ACTUAL
VARIANCE WITH FINAL BUDGET
POSITIVE/(NEGATIVE)
REVENUESOther revenues 60,600$ 60,600$ 55,984$ (4,616)$
Total Revenues 60,600 60,600 55,984 (4,616)
EXPENDITURESCurrent:
General government services 203,300 203,300 100,546 102,754 Capital outlay 1,657,563 1,657,563 - 1,657,563 Total Expenditures 1,860,863 1,860,863 100,546 1,760,317
Excess (deficiency) of revenuesover (under) expenditures (1,800,263) (1,800,263) (44,562) 1,755,701
OTHER FINANCING SOURCES (USES)Disposition of capital assets 1,000 1,000 646,750 645,750
Total other financing sources (uses) 1,000 1,000 646,750 645,750
SPECIAL ITEM
Net changes in fund balances (1,799,263) (1,799,263) 602,188 2,401,451
Fund balances - beginning 1,799,263 1,799,263 1,840,816 41,553 FUND BALANCES - ENDING -$ -$ 2,443,004$ 2,443,004$
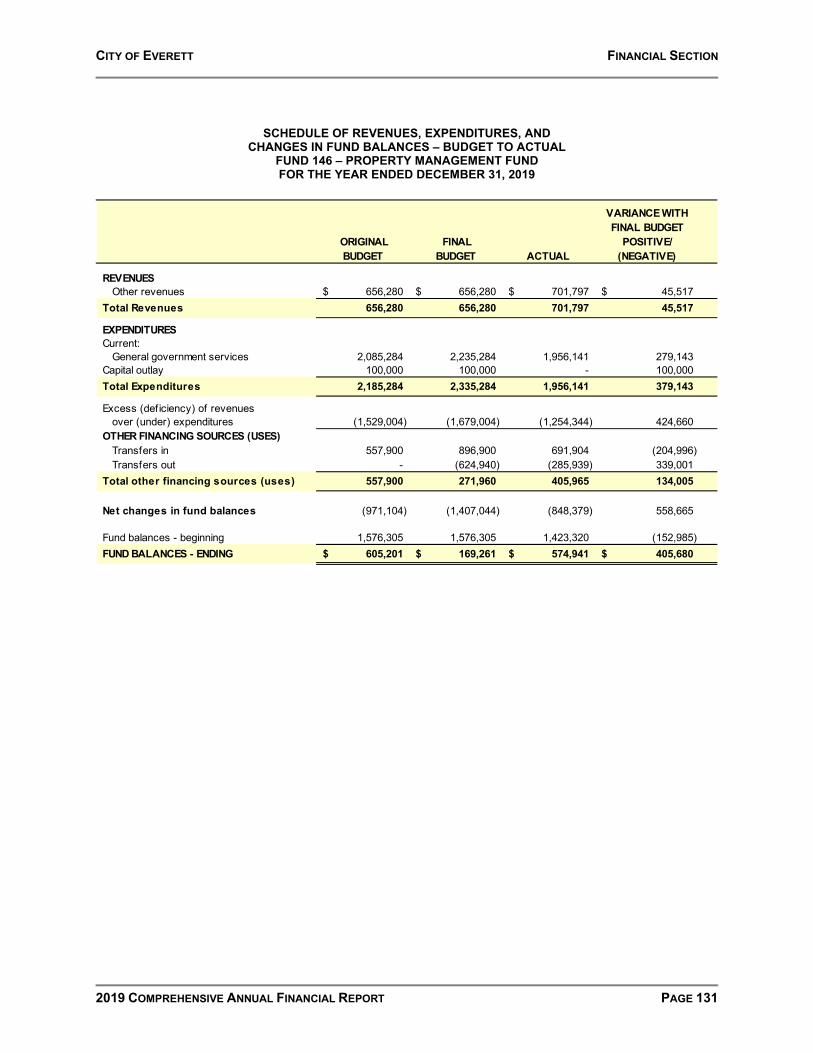
CITY OF EVERETT FINANCIAL SECTION
2019 COMPREHENSIVE ANNUAL FINANCIAL REPORT PAGE 131
SCHEDULE OF REVENUES, EXPENDITURES, AND CHANGES IN FUND BALANCES – BUDGET TO ACTUAL
FUND 146 – PROPERTY MANAGEMENT FUND FOR THE YEAR ENDED DECEMBER 31, 2019
ORIGINAL BUDGET
FINAL BUDGET ACTUAL
VARIANCE WITH FINAL BUDGET
POSITIVE/(NEGATIVE)
REVENUESOther revenues 656,280$ 656,280$ 701,797$ 45,517$
Total Revenues 656,280 656,280 701,797 45,517
EXPENDITURESCurrent:
General government services 2,085,284 2,235,284 1,956,141 279,143 Capital outlay 100,000 100,000 - 100,000 Total Expenditures 2,185,284 2,335,284 1,956,141 379,143
Excess (deficiency) of revenuesover (under) expenditures (1,529,004) (1,679,004) (1,254,344) 424,660
OTHER FINANCING SOURCES (USES)Transfers in 557,900 896,900 691,904 (204,996) Transfers out - (624,940) (285,939) 339,001
Total other financing sources (uses) 557,900 271,960 405,965 134,005
Net changes in fund balances (971,104) (1,407,044) (848,379) 558,665
Fund balances - beginning 1,576,305 1,576,305 1,423,320 (152,985) FUND BALANCES - ENDING 605,201$ 169,261$ 574,941$ 405,680$
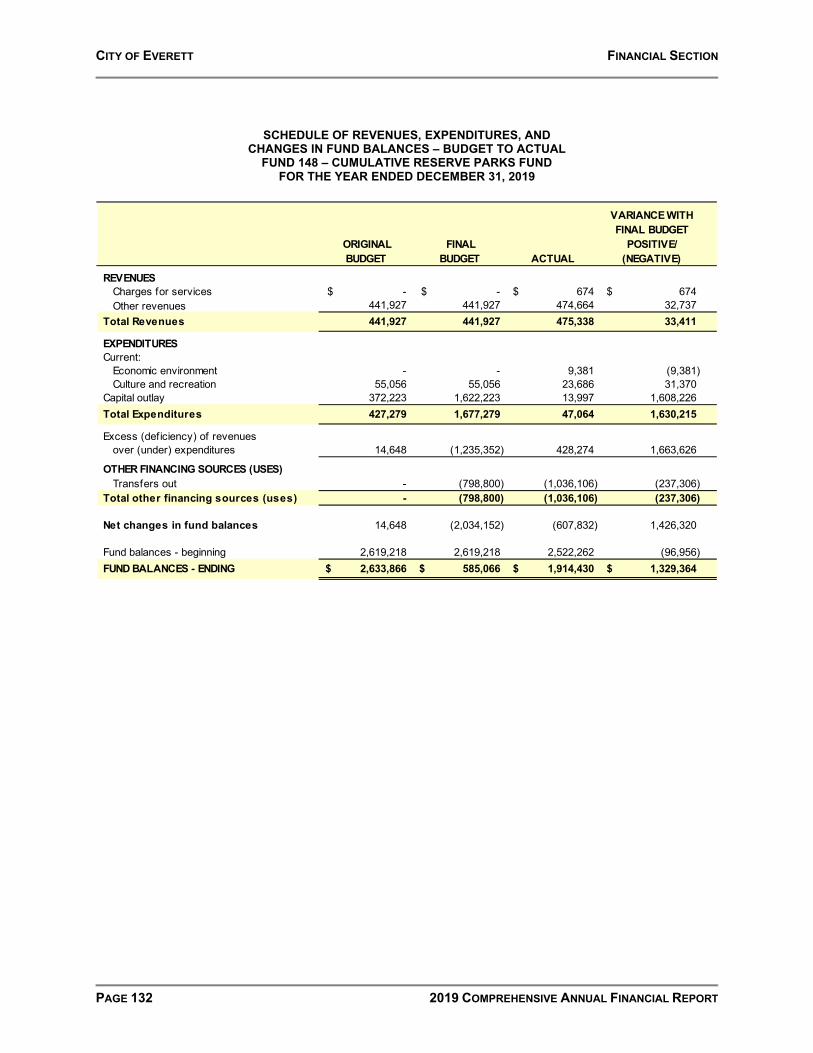
CITY OF EVERETT FINANCIAL SECTION
PAGE 132 2019 COMPREHENSIVE ANNUAL FINANCIAL REPORT
SCHEDULE OF REVENUES, EXPENDITURES, AND CHANGES IN FUND BALANCES – BUDGET TO ACTUAL
FUND 148 – CUMULATIVE RESERVE PARKS FUND FOR THE YEAR ENDED DECEMBER 31, 2019
ORIGINAL BUDGET
FINAL BUDGET ACTUAL
VARIANCE WITH FINAL BUDGET
POSITIVE/(NEGATIVE)
REVENUESCharges for services -$ -$ 674$ 674$ Other revenues 441,927 441,927 474,664 32,737
Total Revenues 441,927 441,927 475,338 33,411
EXPENDITURESCurrent:
Economic environment - - 9,381 (9,381) Culture and recreation 55,056 55,056 23,686 31,370
Capital outlay 372,223 1,622,223 13,997 1,608,226 Total Expenditures 427,279 1,677,279 47,064 1,630,215
Excess (deficiency) of revenuesover (under) expenditures 14,648 (1,235,352) 428,274 1,663,626
OTHER FINANCING SOURCES (USES)Transfers out - (798,800) (1,036,106) (237,306)
Total other financing sources (uses) - (798,800) (1,036,106) (237,306)
Net changes in fund balances 14,648 (2,034,152) (607,832) 1,426,320
Fund balances - beginning 2,619,218 2,619,218 2,522,262 (96,956) FUND BALANCES - ENDING 2,633,866$ 585,066$ 1,914,430$ 1,329,364$
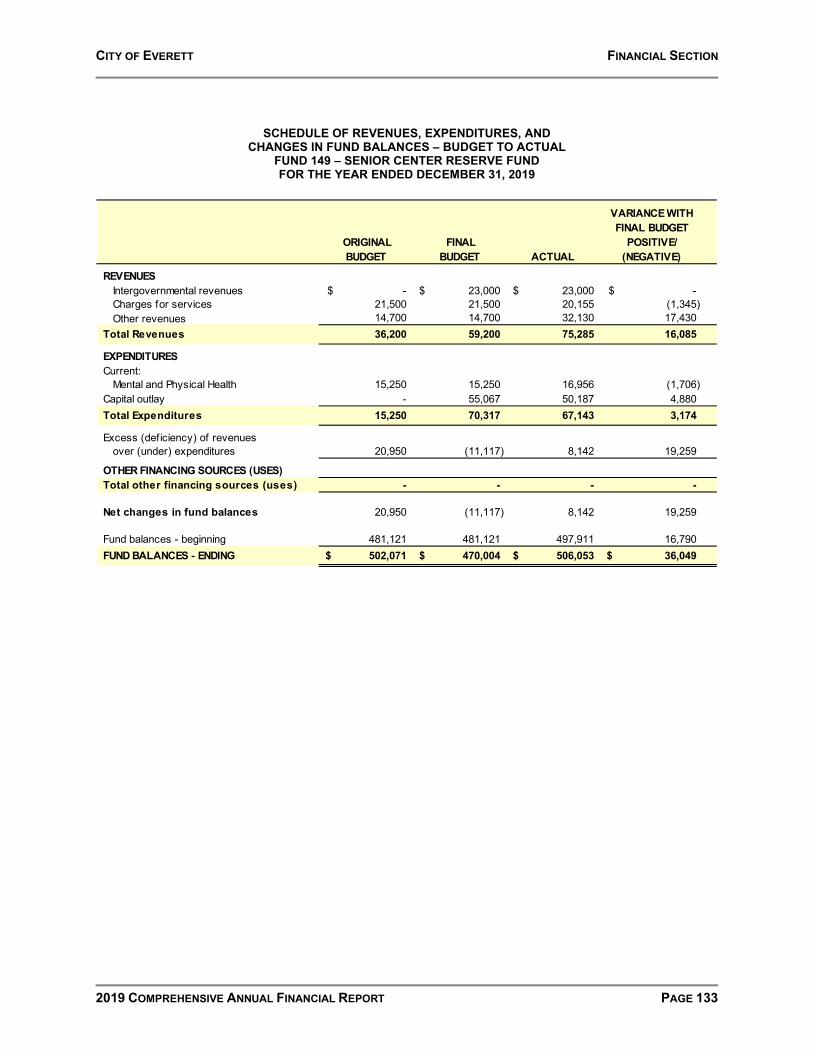
CITY OF EVERETT FINANCIAL SECTION
2019 COMPREHENSIVE ANNUAL FINANCIAL REPORT PAGE 133
SCHEDULE OF REVENUES, EXPENDITURES, AND CHANGES IN FUND BALANCES – BUDGET TO ACTUAL
FUND 149 – SENIOR CENTER RESERVE FUND FOR THE YEAR ENDED DECEMBER 31, 2019
ORIGINAL BUDGET
FINAL BUDGET ACTUAL
VARIANCE WITH FINAL BUDGET
POSITIVE/(NEGATIVE)
REVENUESIntergovernmental revenues -$ 23,000$ 23,000$ -$ Charges for services 21,500 21,500 20,155 (1,345) Other revenues 14,700 14,700 32,130 17,430
Total Revenues 36,200 59,200 75,285 16,085
EXPENDITURESCurrent:
Mental and Physical Health 15,250 15,250 16,956 (1,706) Capital outlay - 55,067 50,187 4,880 Total Expenditures 15,250 70,317 67,143 3,174
Excess (deficiency) of revenuesover (under) expenditures 20,950 (11,117) 8,142 19,259
OTHER FINANCING SOURCES (USES)Total other financing sources (uses) - - - -
Net changes in fund balances 20,950 (11,117) 8,142 19,259
Fund balances - beginning 481,121 481,121 497,911 16,790 FUND BALANCES - ENDING 502,071$ 470,004$ 506,053$ 36,049$

CITY OF EVERETT FINANCIAL SECTION
PAGE 134 2019 COMPREHENSIVE ANNUAL FINANCIAL REPORT
SCHEDULE OF REVENUES, EXPENDITURES, AND CHANGES IN FUND BALANCES – BUDGET TO ACTUAL
FUND 151 – ANIMALS FUND FOR THE YEAR ENDED DECEMBER 31, 2019
ORIGINAL
BUDGET FINAL
BUDGET ACTUAL
VARIANCE WITH FINAL BUDGET
POSITIVE/(NEGATIVE)
REVENUESCharges for services 7,000$ 7,000$ 8,071$ 1,071$ Other revenues 66,720 66,720 114,162 47,442
Total Revenues 73,720 73,720 122,233 48,513
EXPENDITURESCurrent:
Economic environment 156,560 156,560 135,016 21,544 Total Expenditures 156,560 156,560 135,016 21,544
Excess (deficiency) of revenuesover (under) expenditures (82,840) (82,840) (12,783) 70,057
OTHER FINANCING SOURCES (USES)Total other financing sources (uses) - - - -
Net changes in fund balances (82,840) (82,840) (12,783) 70,057
Fund balances - beginning 348,172 348,172 407,413 59,241 FUND BALANCES - ENDING 265,332$ 265,332$ 394,630$ 129,298$
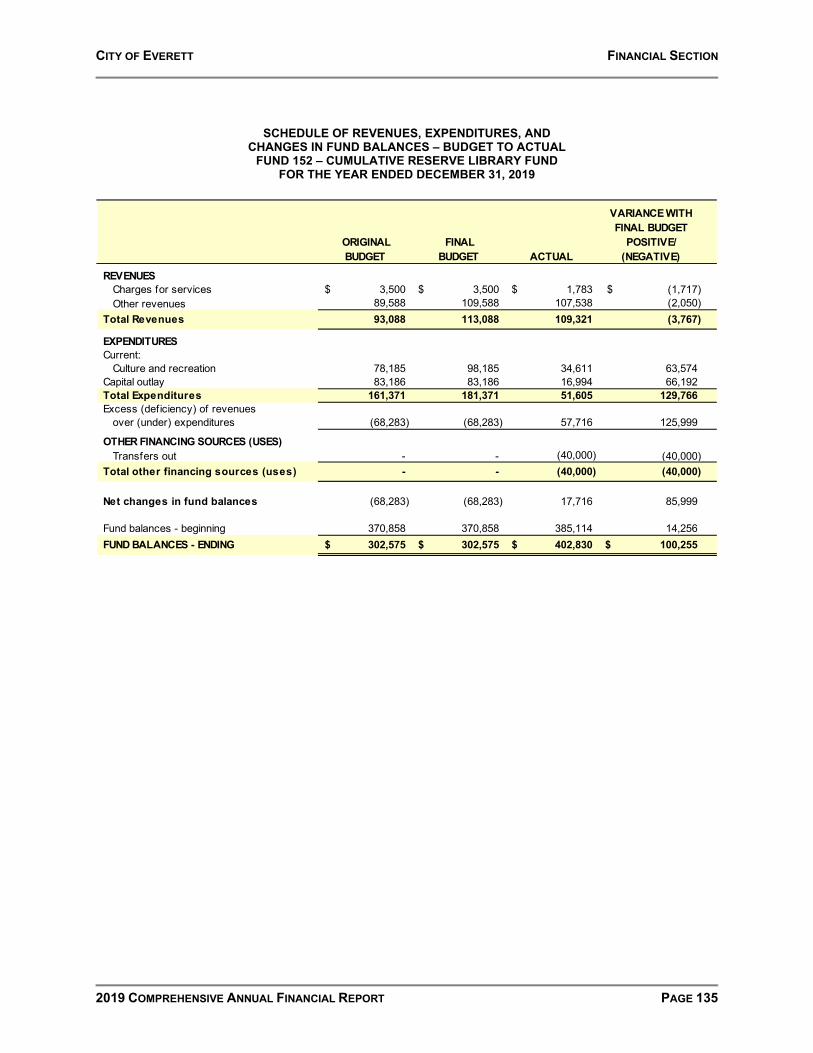
CITY OF EVERETT FINANCIAL SECTION
2019 COMPREHENSIVE ANNUAL FINANCIAL REPORT PAGE 135
SCHEDULE OF REVENUES, EXPENDITURES, AND CHANGES IN FUND BALANCES – BUDGET TO ACTUAL
FUND 152 – CUMULATIVE RESERVE LIBRARY FUND FOR THE YEAR ENDED DECEMBER 31, 2019
ORIGINAL BUDGET
FINAL BUDGET ACTUAL
VARIANCE WITH FINAL BUDGET
POSITIVE/(NEGATIVE)
REVENUESCharges for services 3,500$ 3,500$ 1,783$ (1,717)$ Other revenues 89,588 109,588 107,538 (2,050)
Total Revenues 93,088 113,088 109,321 (3,767)
EXPENDITURESCurrent:
Culture and recreation 78,185 98,185 34,611 63,574 Capital outlay 83,186 83,186 16,994 66,192 Total Expenditures 161,371 181,371 51,605 129,766 Excess (deficiency) of revenues
over (under) expenditures (68,283) (68,283) 57,716 125,999
OTHER FINANCING SOURCES (USES)Transfers out - - (40,000) (40,000)
Total other financing sources (uses) - - (40,000) (40,000)
Net changes in fund balances (68,283) (68,283) 17,716 85,999
Fund balances - beginning 370,858 370,858 385,114 14,256 FUND BALANCES - ENDING 302,575$ 302,575$ 402,830$ 100,255$

CITY OF EVERETT FINANCIAL SECTION
PAGE 136 2019 COMPREHENSIVE ANNUAL FINANCIAL REPORT
SCHEDULE OF REVENUES, EXPENDITURES, AND CHANGES IN FUND BALANCES – BUDGET TO ACTUAL
FUND 155 – GENERAL GOVERNMENT SPECIAL PROJECTS FUND FOR THE YEAR ENDED DECEMBER 31, 2018
ORIGINAL
BUDGET FINAL
BUDGET ACTUAL
VARIANCE WITH FINAL BUDGET
POSITIVE/(NEGATIVE)
REVENUESOther revenues -$ -$ 17,700$ 17,700$
Total Revenues - - 17,700 17,700
EXPENDITURESCurrent:
Economic environment - - 60,352 (60,352) Total Expenditures - - 60,352 (60,352)
Excess (deficiency) of revenuesover (under) expenditures - - (42,652) (42,652)
OTHER FINANCING SOURCES (USES)Transfers in - - 1,036,106 1,036,106 Transfers out -
Total other financing sources (uses) - - 1,036,106 1,036,106
Net changes in fund balances - - 993,454 993,454
Fund balances - beginning - - - - FUND BALANCES - ENDING -$ -$ 993,454$ 993,454$

CITY OF EVERETT FINANCIAL SECTION
2019 COMPREHENSIVE ANNUAL FINANCIAL REPORT PAGE 137
SCHEDULE OF REVENUES, EXPENDITURES, AND CHANGES IN FUND BALANCES – BUDGET TO ACTUAL
FUND 156 – CRIMINAL JUSTICE FUND FOR THE YEAR ENDED DECEMBER 31, 2019
ORIGINAL
BUDGET FINAL
BUDGET ACTUAL
VARIANCE WITH FINAL BUDGET
POSITIVE/(NEGATIVE)
REVENUESTaxes 1,988,400$ 1,988,400$ 2,179,416$ 191,016$ Intergovernmental revenues 681,706 709,706 764,840 55,134 Charges for services 207,400 207,400 215,045 7,645 Fines and forfeits 4,350 4,350 4,887 537 Other revenues 169,385 169,385 302,068 132,683
Total Revenues 3,051,241 3,079,241 3,466,256 387,015
EXPENDITURESCurrent:
General government services 106,354 106,354 86,902 19,452 Security of persons and property 575,850 646,930 318,192 328,738
Capital outlay 183,000 413,000 - 413,000 Total Expenditures 865,204 1,166,284 405,094 761,190
Excess (deficiency) of revenuesover (under) expenditures 2,186,037 1,912,957 3,061,162 1,148,205
OTHER FINANCING SOURCES (USES)Transfers in 53,600 153,600 - (153,600) Transfers out (2,364,418) (2,406,918) (2,395,508) 11,410
Total other financing sources (uses) (2,310,818) (2,253,318) (2,395,508) (142,190)
Net changes in fund balances (124,781) (340,361) 665,654 1,006,015
Fund balances - beginning 9,573,646 9,585,226 10,074,147 488,921 FUND BALANCES - ENDING 9,448,865$ 9,244,865$ 10,739,801$ 1,494,936$
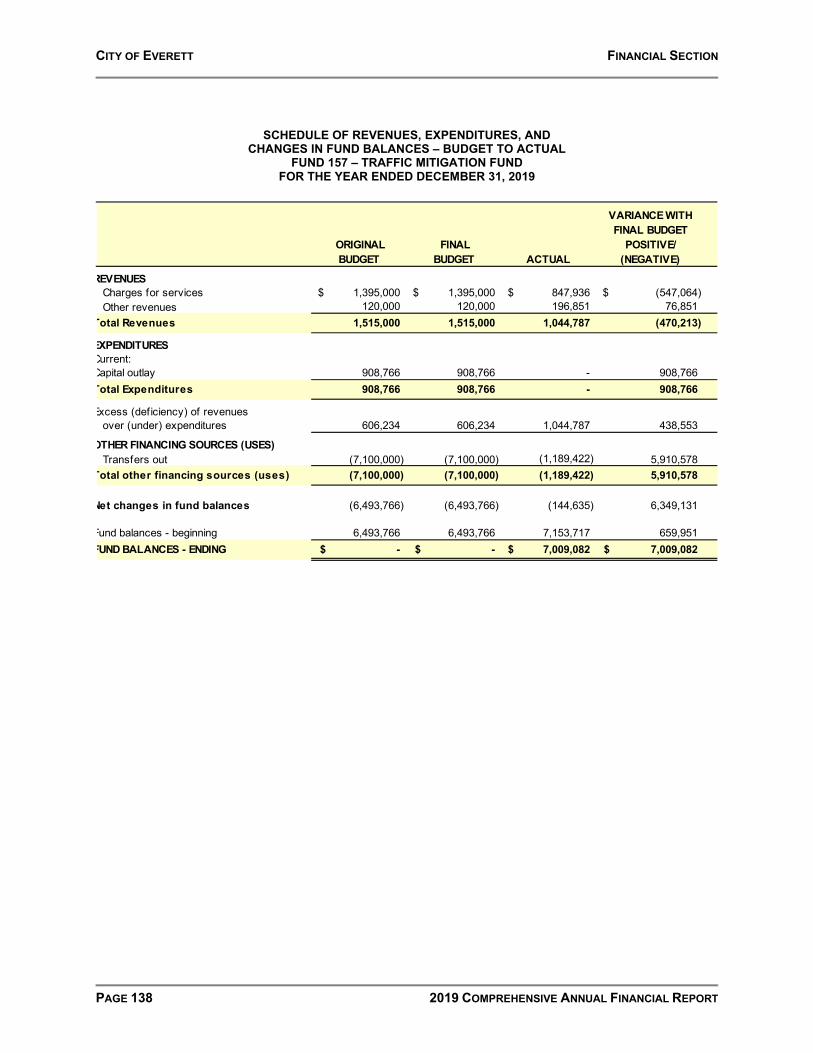
CITY OF EVERETT FINANCIAL SECTION
PAGE 138 2019 COMPREHENSIVE ANNUAL FINANCIAL REPORT
SCHEDULE OF REVENUES, EXPENDITURES, AND CHANGES IN FUND BALANCES – BUDGET TO ACTUAL
FUND 157 – TRAFFIC MITIGATION FUND FOR THE YEAR ENDED DECEMBER 31, 2019
ORIGINAL BUDGET
FINAL BUDGET ACTUAL
VARIANCE WITH FINAL BUDGET
POSITIVE/(NEGATIVE)
REVENUESCharges for services 1,395,000$ 1,395,000$ 847,936$ (547,064)$ Other revenues 120,000 120,000 196,851 76,851
Total Revenues 1,515,000 1,515,000 1,044,787 (470,213)
EXPENDITURESCurrent:Capital outlay 908,766 908,766 - 908,766 Total Expenditures 908,766 908,766 - 908,766
Excess (deficiency) of revenuesover (under) expenditures 606,234 606,234 1,044,787 438,553
OTHER FINANCING SOURCES (USES)Transfers out (7,100,000) (7,100,000) (1,189,422) 5,910,578
Total other financing sources (uses) (7,100,000) (7,100,000) (1,189,422) 5,910,578
Net changes in fund balances (6,493,766) (6,493,766) (144,635) 6,349,131
Fund balances - beginning 6,493,766 6,493,766 7,153,717 659,951 FUND BALANCES - ENDING -$ -$ 7,009,082$ 7,009,082$

CITY OF EVERETT FINANCIAL SECTION
2019 COMPREHENSIVE ANNUAL FINANCIAL REPORT PAGE 139
SCHEDULE OF REVENUES, EXPENDITURES, AND CHANGES IN FUND BALANCES – BUDGET TO ACTUAL FUND 159 – TRANSPORTION BENEFIT DISTRICT FUND
FOR THE YEAR ENDED DECEMBER 31, 2019
ORIGINAL BUDGET
FINAL BUDGET ACTUAL
VARIANCE WITH FINAL BUDGET
POSITIVE/(NEGATIVE)
REVENUESTaxes 1,500,000$ 1,500,000$ 1,547,177$ 47,177$ Other revenues 12,200 12,200 13,990 1,790
Total Revenues 1,512,200 1,512,200 1,561,167 48,967
EXPENDITURESCurrent:Capital outlay - - 70 (70) Total Expenditures - - 70 (70)
Excess (deficiency) of revenuesover (under) expenditures 1,512,200 1,512,200 1,561,097 48,897
OTHER FINANCING SOURCES (USES)Transfers out (1,500,000) (1,500,000) (1,499,930) 70
Total other financing sources (uses) (1,500,000) (1,500,000) (1,499,930) 70
Net changes in fund balances 12,200 12,200 61,167 48,967
Fund balances - beginning 545,548 545,548 808,553 263,005 FUND BALANCES - ENDING 557,748$ 557,748$ 869,720$ 311,972$
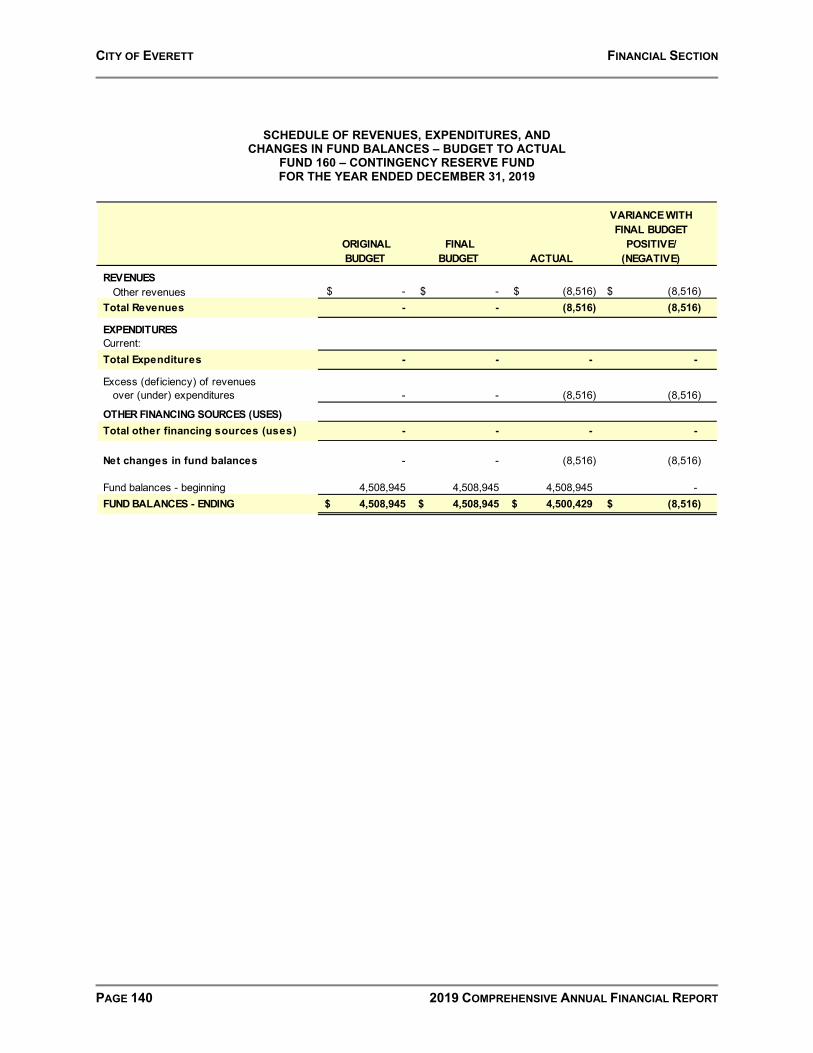
CITY OF EVERETT FINANCIAL SECTION
PAGE 140 2019 COMPREHENSIVE ANNUAL FINANCIAL REPORT
SCHEDULE OF REVENUES, EXPENDITURES, AND CHANGES IN FUND BALANCES – BUDGET TO ACTUAL
FUND 160 – CONTINGENCY RESERVE FUND FOR THE YEAR ENDED DECEMBER 31, 2019
ORIGINAL BUDGET
FINAL BUDGET ACTUAL
VARIANCE WITH FINAL BUDGET
POSITIVE/(NEGATIVE)
REVENUESOther revenues -$ -$ (8,516)$ (8,516)$
Total Revenues - - (8,516) (8,516)
EXPENDITURESCurrent:Total Expenditures - - - -
Excess (deficiency) of revenuesover (under) expenditures - - (8,516) (8,516)
OTHER FINANCING SOURCES (USES)Total other financing sources (uses) - - - -
Net changes in fund balances - - (8,516) (8,516)
Fund balances - beginning 4,508,945 4,508,945 4,508,945 - FUND BALANCES - ENDING 4,508,945$ 4,508,945$ 4,500,429$ (8,516)$

CITY OF EVERETT FINANCIAL SECTION
2019 COMPREHENSIVE ANNUAL FINANCIAL REPORT PAGE 141
SCHEDULE OF REVENUES, EXPENDITURES, AND CHANGES IN FUND BALANCES – BUDGET TO ACTUAL
FUND 170 – EVERETT CDE LLC FOR THE YEAR ENDED DECEMBER 31, 2019
ORIGINAL BUDGET
FINAL BUDGET ACTUAL
VARIANCE WITH FINAL BUDGET
POSITIVE/(NEGATIVE)
REVENUESOther revenues 57,101$ 57,101$
Total Revenues - - 57,101 57,101
EXPENDITURESCurrent:
General government services - - 11,795 (11,795) Total Expenditures - - 11,795 (11,795)
Excess (deficiency) of revenuesover (under) expenditures - - 45,306 45,306
Net changes in fund balances - - 45,306 45,306
Fund balances - beginning - - 144,123 144,123 FUND BALANCES - ENDING -$ -$ 189,429$ 189,429$

CITY OF EVERETT FINANCIAL SECTION
PAGE 142 2019 COMPREHENSIVE ANNUAL FINANCIAL REPORT
SCHEDULE OF REVENUES, EXPENDITURES, AND CHANGES IN FUND BALANCES – BUDGET TO ACTUAL
FUND 197 – CHIP LOAN PROGRAM FUND FOR THE YEAR ENDED DECEMBER 31, 2019
ORIGINAL BUDGET
FINAL BUDGET ACTUAL
VARIANCE WITH FINAL BUDGET
POSITIVE/(NEGATIVE)
REVENUESIntergovernmental revenues 1,293,182$ 1,293,182$ 172,383$ (1,120,799)$ Other revenues 96,110 96,110 145,426 49,316
Total Revenues 1,389,292 1,389,292 317,809 (1,071,483)
EXPENDITURESCurrent:
Economic environment 1,578,994 1,578,994 569,296 1,009,698 Total Expenditures 1,578,994 1,578,994 569,296 1,009,698
Excess (deficiency) of revenuesover (under) expenditures (189,702) (189,702) (251,487) (61,785)
OTHER FINANCING SOURCES (USES)Total other financing sources (uses) - - - -
Net changes in fund balances (189,702) (189,702) (251,487) (61,785)
Fund balances - beginning 13,695,705 13,695,705 14,352,514 656,809 FUND BALANCES - ENDING 13,506,003$ 13,506,003$ 14,101,027$ 595,024$

CITY OF EVERETT FINANCIAL SECTION
2019 COMPREHENSIVE ANNUAL FINANCIAL REPORT PAGE 143
SCHEDULE OF REVENUES, EXPENDITURES, AND CHANGES IN FUND BALANCES – BUDGET TO ACTUAL
FUND 198 – COMMUNITY DEVELOPMENT BLOCK GRANTS FUND FOR THE YEAR ENDED DECEMBER 31, 2019
ORIGINAL BUDGET
FINAL BUDGET ACTUAL
VARIANCE WITH FINAL BUDGET
POSITIVE/(NEGATIVE)
REVENUESIntergovernmental revenues 846,384$ 846,384$ 530,192$ (316,192)$ Other revenues - - 24,165 24,165
Total Revenues 846,384 846,384 554,357 (292,027)
EXPENDITURESCurrent:
Economic environment 955,086 955,086 473,564 481,522 Total Expenditures 955,086 955,086 473,564 481,522
Excess (deficiency) of revenuesover (under) expenditures (108,702) (108,702) 80,793 189,495
OTHER FINANCING SOURCES (USES)Total other financing sources (uses) - - - -
Net changes in fund balances (108,702) (108,702) 80,793 189,495
Fund balances - beginning 724,585 724,585 725,338 753 FUND BALANCES - ENDING 615,883$ 615,883$ 806,131$ 190,248$

CITY OF EVERETT FINANCIAL SECTION
PAGE 144 2019 COMPREHENSIVE ANNUAL FINANCIAL REPORT
SCHEDULE OF REVENUES, EXPENDITURES, AND CHANGES IN FUND BALANCES – BUDGET TO ACTUAL
FUND 210 – BOND REDEMPTION FUND FOR THE YEAR ENDED DECEMBER 31, 2019
ORIGINAL BUDGET
FINAL BUDGET ACTUAL
VARIANCE WITH FINAL BUDGET
POSITIVE/(NEGATIVE)
REVENUESTotal Revenues - - - -
EXPENDITURESDebt Service:
Principal retirement 2,430,000 28,060,000 26,430,000 1,630,000 Interest 834,787 1,019,417 937,985 81,432
Total Expenditures 3,264,787 29,079,417 27,367,985 1,711,432
Excess (deficiency) of revenuesover (under) expenditures (3,264,787) (29,079,417) (27,367,985) 1,711,432
OTHER FINANCING SOURCES (USES)Premium - 4,306,966 4,306,966 - Proceeds of Refunding LT Debt - 20,070,000 20,070,000 - Transfers in 3,264,787 4,702,451 2,991,019 (1,711,432)
Total other financing sources (uses) 3,264,787 29,079,417 27,367,985 (1,711,432)
Net change in fund balances - - - -
Fund Balances - beginning - - - - FUND BALANCES - ENDING -$ -$ -$ -$

CITY OF EVERETT FINANCIAL SECTION
2019 COMPREHENSIVE ANNUAL FINANCIAL REPORT PAGE 145
SCHEDULE OF REVENUES, EXPENDITURES, AND CHANGES IN FUND BALANCES – BUDGET TO ACTUAL
FUND 243 – L.I.D. GUARANTY FUND FOR THE YEAR ENDED DECEMBER 31, 2019
ORIGINAL BUDGET
FINAL BUDGET
ACTUAL
VARIANCE WITH FINAL BUDGET
POSITIVE/(NEGATIVE)
REVENUESOther Revenues 200$ 200$ 422$ 222$
Total Revenues 200 200 422 222
EXPENDITURESCurrent:Total Expenditures - - - -
Excess (deficiency) of revenuesover (under) expenditures 200 200 422 222
OTHER FINANCING SOURCES (USES)Transfers in 18,929 18,929 18,928 (1) Transfers out (21,821) (21,821) (21,821) -
Total other financing sources (uses) (2,892) (2,892) (2,893) (1)
Net change in fund balances (2,692) (2,692) (2,471) 221
Fund Balances - beginning 2,692 2,692 2,977 285 FUND BALANCES - ENDING -$ -$ 506$ 506$

CITY OF EVERETT FINANCIAL SECTION
PAGE 146 2019 COMPREHENSIVE ANNUAL FINANCIAL REPORT
SCHEDULE OF REVENUES, EXPENDITURES, AND CHANGES IN FUND BALANCES – BUDGET TO ACTUAL
FUND 299 – CONSOLIDATED L.I.D. BOND REDEMPTION FUND FOR THE YEAR ENDED DECEMBER 31, 2019
ORIGINAL BUDGET
FINAL BUDGET ACTUAL
VARIANCE WITH FINAL BUDGET
POSITIVE/(NEGATIVE)
REVENUESOther revenues 2,000$ 2,000$ 10,998$ 8,998$
TOTAL REVENUES 2,000 2,000 10,998 8,998 EXPENDITURESCurrent:Debt service: TOTAL EXPENDITURES - - - - Excess (deficiency) of revenues
over (under) expenditures 2,000 2,000 10,998 8,998 OTHER FINANCING SOURCES (USES)
Transfers out (18,929) (18,929) (18,928) 1 Total other financing sources (uses) (18,929) (18,929) (18,928) 1
Net change in fund balances (16,929) (16,929) (7,930) 8,999
Fund Balances - beginning 16,929 16,929 25,342 8,413 FUND BALANCES - ENDING -$ -$ 17,412$ 17,412$
PROPRIETARY FUNDS

ENTERPRISE FUNDS 402 The Solid Waste Utility Fund accounts for activities related to garbage and solid waste
management, including recycling and excluding direct engagement in routine collection. 430 The Parking Garage Fund accounts for off-street parking facilities to support the central
business district and the relief of traffic congestion. 440 The Golf Fund accounts for the operation and maintenance, and capital improvements of
two city-owned golf courses.
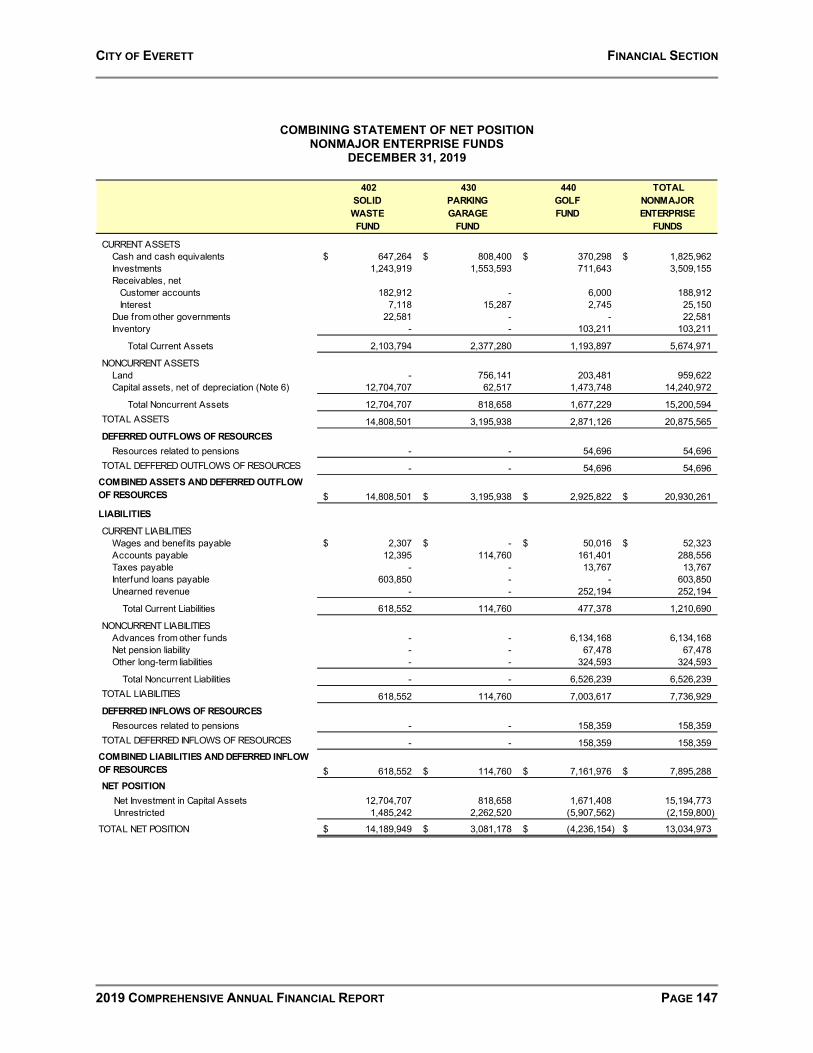
CITY OF EVERETT FINANCIAL SECTION
2019 COMPREHENSIVE ANNUAL FINANCIAL REPORT PAGE 147
COMBINING STATEMENT OF NET POSITION NONMAJOR ENTERPRISE FUNDS
DECEMBER 31, 2019
402SOLID WASTEFUND
430PARKINGGARAGE
FUND
440GOLFFUND
TOTALNONMAJOR ENTERPRISE
FUNDS
CURRENT ASSETSCash and cash equivalents 647,264$ 808,400$ 370,298$ 1,825,962$ Investments 1,243,919 1,553,593 711,643 3,509,155 Receivables, net Customer accounts 182,912 - 6,000 188,912 Interest 7,118 15,287 2,745 25,150 Due from other governments 22,581 - - 22,581 Inventory - - 103,211 103,211
Total Current Assets 2,103,794 2,377,280 1,193,897 5,674,971
NONCURRENT ASSETSLand - 756,141 203,481 959,622 Capital assets, net of depreciation (Note 6) 12,704,707 62,517 1,473,748 14,240,972
Total Noncurrent Assets 12,704,707 818,658 1,677,229 15,200,594 TOTAL ASSETS 14,808,501 3,195,938 2,871,126 20,875,565 DEFERRED OUTFLOWS OF RESOURCES Resources related to pensions - - 54,696 54,696 TOTAL DEFFERED OUTFLOWS OF RESOURCES - - 54,696 54,696
COMBINED ASSETS AND DEFERRED OUTFLOW OF RESOURCES 14,808,501$ 3,195,938$ 2,925,822$ 20,930,261$
LIABILITIES
CURRENT LIABILITIESWages and benefits payable 2,307$ -$ 50,016$ 52,323$ Accounts payable 12,395 114,760 161,401 288,556 Taxes payable - - 13,767 13,767 Interfund loans payable 603,850 - - 603,850 Unearned revenue - - 252,194 252,194
Total Current Liabilities 618,552 114,760 477,378 1,210,690
NONCURRENT LIABILITIESAdvances from other funds - - 6,134,168 6,134,168 Net pension liability - - 67,478 67,478 Other long-term liabilities - - 324,593 324,593
Total Noncurrent Liabilities - - 6,526,239 6,526,239 TOTAL LIABILITIES 618,552 114,760 7,003,617 7,736,929 DEFERRED INFLOWS OF RESOURCES
Resources related to pensions - - 158,359 158,359 TOTAL DEFERRED INFLOWS OF RESOURCES - - 158,359 158,359
COMBINED LIABILITIES AND DEFERRED INFLOW OF RESOURCES 618,552$ 114,760$ 7,161,976$ 7,895,288$ NET POSITION
Net Investment in Capital Assets 12,704,707 818,658 1,671,408 15,194,773 Unrestricted 1,485,242 2,262,520 (5,907,562) (2,159,800)
TOTAL NET POSITION 14,189,949$ 3,081,178$ (4,236,154)$ 13,034,973$

CITY OF EVERETT FINANCIAL SECTION
PAGE 148 2019 COMPREHENSIVE ANNUAL FINANCIAL REPORT
COMBINING STATEMENT OF REVENUES, EXPENSES, AND CHANGES IN FUND NET POSITION NONMAJOR ENTERPRISE FUNDS
FOR THE YEAR ENDED DECEMBER 31, 2019
402SOLIDWASTEFUND
430PARKINGGARAGE
FUND
440GOLFFUND
TOTALNONMAJOR ENTERPRISE
FUNDS
OPERATING REVENUES:Charges for services 2,391,739$ 430,066$ 4,517,626$ 7,339,431$
Total Operating Revenues 2,391,739 430,066 4,517,626 7,339,431
OPERATING EXPENSES:Personnel services 152,318 - 1,170,599 1,322,917 Supplies 49,618 3,048 597,626 650,292 Professional services 120,178 382,176 1,629,572 2,131,926 Depreciation and amortization 484,326 12,503 230,530 727,359 Taxes - - 1,649 1,649 Other operating expenses 120,251 1,233,525 520,982 1,874,758
Total Operating Expenses 926,691 1,631,252 4,150,958 6,708,901
Operating Income (Loss) 1,465,048 (1,201,186) 366,668 630,530
NON-OPERATING REVENUES (EXPENSES):Intergovernmental revenues 118,617 - - 118,617 Interest and investment revenue 47,953 84,439 31,363 163,755 Other non-operating revenues 499 175 3,605 4,279 Gain (loss) on sale/retirement of assets - - 610 610 Interest expense (67,856) - (134,961) (202,817)
Total Non-Operating Revenues (Expenses) 99,213 84,614 (99,383) 84,444
Income (Loss) Before Contributions and Transfers 1,564,261 (1,116,572) 267,285 714,974 Transfers in - 285,940 - 285,940 Transfers out - - (12,005) (12,005)
CHANGE IN NET POSITION 1,564,261 (830,632) 255,280 988,909
NET POSITION - BEGINNING 12,625,688 3,911,810 (4,491,434) 12,046,064 NET POSITION - ENDING 14,189,949$ 3,081,178$ (4,236,154)$ 13,034,973$

CITY OF EVERETT FINANCIAL SECTION
2019 COMPREHENSIVE ANNUAL FINANCIAL REPORT PAGE 149
COMBINING STATEMENT OF CASH FLOWS NONMAJOR ENTERPRISE FUNDS
FOR THE YEAR ENDED DECEMBER 31, 2019
402SOLID WASTE
FUND
430PARKING
GARAGE FUND
440 GOLF FUND
TOTALNONMAJOR ENTERPRISE
FUNDS
CASH FLOWS FROM OPERATING ACTIVITIES:Receipts from customers and users 2,397,256$ 430,066$ 4,529,363$ 7,356,685$ Payments to suppliers (271,772) (1,485,402) (2,580,839) (4,338,013) Payments to employees (152,500) - (1,216,869) (1,369,369) Payments for interfund services used (10,176) (36,358) (130,401) (176,935) Other reciepts 499 175 3,605 4,279 Net cash provided (used) by operating activities 1,963,307 (1,091,519) 604,859 1,476,647
CASH FLOWS FROM NONCAPITAL FINANCING ACTIVITIES:Receipts from non-capital grants 106,237 - - 106,237 Proceeds from interfund loans 15,150 - - 15,150 Principal paid on interfund loans (250,000) - (210,000) (460,000) Interest paid on interfund loans (31,749) - (134,961) (166,710) Transfers to other funds - - (12,005) (12,005) Transfers from other funds - 285,940 - 285,940 Net cash provided (used) by noncapital financing activities (160,362) 285,940 (356,966) (231,388)
CASH FLOWS FROM CAPITAL AND RELATED FINANCING ACTIVITIES:
Principal paid on capital debt (1,000,000) - - (1,000,000) Interest paid on capital debt (42,500) - - (42,500) Proceeds from sale of capital assets - - 610 610 Acquisition and construction of capital assets - - (156,739) (156,739) Net cash provided (used) by capital and related financing activi (1,042,500) - (156,129) (1,198,629)
CASH FLOWS FROM INVESTING ACTIVITIES:Proceeds from sale of investments - 1,451,243 26,880 1,478,123 Purchase of investments (284,456) - - (284,456) Investment income 38,080 55,163 23,507 116,750 Net cash provided (used) by investing activities (246,376) 1,506,406 50,387 1,310,417
Net Increase (Decrease) in Cash and Cash Equivalents 514,069 700,827 142,151 1,357,047 Cash and Cash Equivalents, January 1 133,195 107,573 228,147 468,915 CASH AND CASH EQUIVALENTS, DECEMBER 31 647,264$ 808,400$ 370,298$ 1,825,962$
Current Cash and Cash Equivalents 647,264$ 808,400$ 370,298$ 1,825,962$ CASH AND CASH EQUIVALENTS, DECEMBER 31 647,264$ 808,400$ 370,298$ 1,825,962$
RECONCILIATION OF OPERATING INCOME (LOSS) TO NET CASH PROVIDED (USED) BY OPERATING ACTIVITIES:Operating income (loss) 1,465,048$ (1,201,186)$ 366,668$ 630,530$ Adjustments to Reconcile Operating Income to Net Cash Provided (Used) by Operating Activities:
Depreciation and amortization 484,325 12,503 230,530 727,358 Other non-operating receipts 499 175 3,605 4,279 GASB 68 pension expense adjustments (191) - (36,328) (36,519)
Change in Assets and Liabilities:(Increase) decrease in inventories - - 32,737 32,737 (Increase) decrease in receivables 5,517 - - 5,517 Increase (decrease) in accounts and other payables 8,109 96,989 9,511 114,609 Increase (decrease) in compensated absences - - (13,601) (13,601) Increase (decrease) in other current liabilities - - 11,737 11,737
TOTAL ADJUSTMENTS 498,259 109,667 238,191 846,117
Net cash provided (used) by operating activities 1,963,307$ (1,091,519)$ 604,859$ 1,476,647$
SCHEDULE OF NON-CASH CAPITAL AND RELATED FINANCING ACTIVITIES:Non-Cash Financing, Capital and Investing Activities:
Increase (decrease) in fair value of investments 6,553$ 24,293$ 7,004$ 37,850$ Operating grants earned, not received 22,581 - - 22,581
TOTAL NON-CASH ACTIVITIES 29,134$ 24,293$ 7,004$ 60,431$

CITY OF EVERETT FINANCIAL SECTION
PAGE 150 2019 COMPREHENSIVE ANNUAL FINANCIAL REPORT
This page is intentionally left blank.
INTERNAL SERVICE FUNDS 501 The Equipment Rental Fund accounts for the costs of operating a maintenance facility
for automotive equipment and other machinery used by City departments. Such costs are billed to the other departments at actual cost.
503 The Self-Insurance Fund receives monies from various City funds to pay all costs of
self-insurance for workers' compensation, unemployment compensation, liabilities arising out of torts and the operation of the George Culmback Dam.
505 The Computer Reserve Fund receives monies from City departments to pay for
computer equipment and related maintenance. 507 The Telecommunications Fund accounts for the cost of operating a centralized
telecommunication service for all City departments. 508 The Health Benefits Reserve Fund accounts for the activity and reserve associated with
the provision of health benefits to employees of the City.
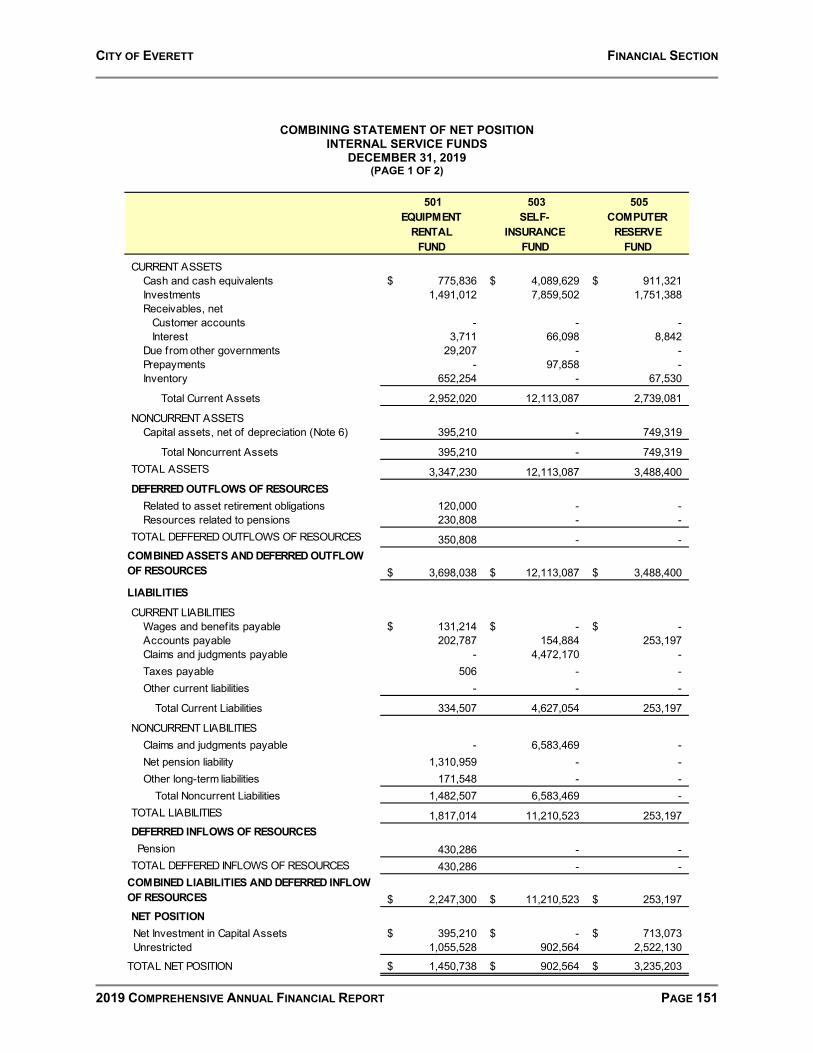
CITY OF EVERETT FINANCIAL SECTION
2019 COMPREHENSIVE ANNUAL FINANCIAL REPORT PAGE 151
COMBINING STATEMENT OF NET POSITION INTERNAL SERVICE FUNDS
DECEMBER 31, 2019 (PAGE 1 OF 2)
501
EQUIPMENTRENTAL
FUND
503SELF-
INSURANCEFUND
505COMPUTER
RESERVEFUND
CURRENT ASSETSCash and cash equivalents 775,836$ 4,089,629$ 911,321$ Investments 1,491,012 7,859,502 1,751,388 Receivables, net Customer accounts - - - Interest 3,711 66,098 8,842 Due from other governments 29,207 - - Prepayments - 97,858 - Inventory 652,254 - 67,530
Total Current Assets 2,952,020 12,113,087 2,739,081
NONCURRENT ASSETSCapital assets, net of depreciation (Note 6) 395,210 - 749,319
Total Noncurrent Assets 395,210 - 749,319 TOTAL ASSETS 3,347,230 12,113,087 3,488,400 DEFERRED OUTFLOWS OF RESOURCES
Related to asset retirement obligations 120,000 - - Resources related to pensions 230,808 - - TOTAL DEFFERED OUTFLOWS OF RESOURCES 350,808 - -
COMBINED ASSETS AND DEFERRED OUTFLOW OF RESOURCES 3,698,038$ 12,113,087$ 3,488,400$
LIABILITIES
CURRENT LIABILITIESWages and benefits payable 131,214$ -$ -$ Accounts payable 202,787 154,884 253,197 Claims and judgments payable - 4,472,170 - Taxes payable 506 - - Other current liabilities - - -
Total Current Liabilities 334,507 4,627,054 253,197
NONCURRENT LIABILITIESClaims and judgments payable - 6,583,469 - Net pension liability 1,310,959 - - Other long-term liabilities 171,548 - -
Total Noncurrent Liabilities 1,482,507 6,583,469 - TOTAL LIABILITIES 1,817,014 11,210,523 253,197 DEFERRED INFLOWS OF RESOURCES Pension 430,286 - - TOTAL DEFFERED INFLOWS OF RESOURCES 430,286 - -
COMBINED LIABILITIES AND DEFERRED INFLOW OF RESOURCES 2,247,300$ 11,210,523$ 253,197$ NET POSITION
Net Investment in Capital Assets 395,210$ -$ 713,073$ Unrestricted 1,055,528 902,564 2,522,130
TOTAL NET POSITION 1,450,738$ 902,564$ 3,235,203$

CITY OF EVERETT FINANCIAL SECTION
PAGE 152 2019 COMPREHENSIVE ANNUAL FINANCIAL REPORT
COMBINING STATEMENT OF NET POSITION INTERNAL SERVICE FUNDS
DECEMBER 31, 2019 (PAGE 2 OF 2)
507TELE-COMMFUND
508HEALTH BENEFIT
RESERVEFUND
TOTALINTERNALSERVICEFUNDS
CURRENT ASSETSCash and cash equivalents 239,120$ 3,144,651$ 9,160,557$ Investments 459,545 6,043,430 17,604,877 Receivables, net Customer accounts - 192,482 192,482 Interest 1,098 38,896 118,645 Due from other governments - - 29,207 Prepayments - - 97,858 Inventory - - 719,784
Total Current Assets 699,763 9,419,459 27,923,410
NONCURRENT ASSETSCapital assets, net of depreciation (Note 6) 162,710 - 1,307,239
Total Noncurrent Assets 162,710 - 1,307,239 TOTAL ASSETS 862,473 9,419,459 29,230,649 DEFERRED OUTFLOWS OF RESOURCES
Related to asset retirement obligations - - 120,000 Resources related to pensions 200,295 - 431,103 TOTAL DEFFERED OUTFLOWS OF RESOURCES 200,295 - 551,103
COMBINED ASSETS AND DEFERRED OUTFLOW OF RESOURCES 1,062,768$ 9,419,459$ 29,781,752$
LIABILITIES
CURRENT LIABILITIESWages and benefits payable 21,943$ -$ 153,157$ Accounts payable 8,213 - 619,081 Claims and judgments payable - 2,641,094 7,113,264 Taxes payable - - 506 Other current liabilities - 207,430 207,430
Total Current Liabilities 30,156 2,848,524 8,093,438
NONCURRENT LIABILITIESClaims and judgments payable - - 6,583,469 Net pension liability 1,966,564 - 3,277,523 Other long-term liabilities 11,582 - 183,130
Total Noncurrent Liabilities 1,978,146 - 10,044,122 TOTAL LIABILITIES 2,008,302 2,848,524 18,137,560 DEFERRED INFLOWS OF RESOURCES Pension 180,488 - 610,774 TOTAL DEFFERED INFLOWS OF RESOURCES 180,488 - 610,774
COMBINED LIABILITIES AND DEFERRED INFLOW OF RESOURCES 2,188,790$ 2,848,524$ 18,748,334$ NET POSITION
Net Investment in Capital Assets 162,710$ -$ 1,270,993$ Unrestricted (1,288,732) 6,570,935 9,762,425
TOTAL NET POSITION (1,126,022)$ 6,570,935$ 11,033,418$

CITY OF EVERETT FINANCIAL SECTION
2019 COMPREHENSIVE ANNUAL FINANCIAL REPORT PAGE 153
COMBINING STATEMENT OF REVENUES, EXPENSES, AND CHANGES IN FUND NET POSITION INTERNAL SERVICE FUNDS
FOR THE YEAR ENDED DECEMBER 31, 2019 (PAGE 1 OF 2)
501EQUIPMENT
RENTALFUND
503SELF-
INSURANCEFUND
505COMPUTER
RESERVEFUND
OPERATING REVENUES:Charges for services 7,436,428$ 5,516,839$ 2,826,367$
Total Operating Revenues 7,436,428 5,516,839 2,826,367
OPERATING EXPENSES:Personnel services 2,303,976 115,039 - Supplies 3,473,420 - 613,538 Professional services 268,997 1,577,050 173,682 Depreciation and amortization 57,159 - 338,835 Other operating expenses 705,053 7,088,835 1,856,520
Total Operating Expenses 6,808,605 8,780,924 2,982,575
Operating Income (Loss) 627,823 (3,264,085) (156,208)
NON-OPERATING REVENUES (EXPENSES):Interest and investment revenue 53,340 315,285 77,367 Other non-operating revenues 16,893 - 15,096 Sale of junk/salvage 775 - 12,053
Total Non-Operating Revenues (Expenses) 71,008 315,285 104,516
Income (Loss) Before Contributions and Transfers 698,831 (2,948,800) (51,692) Transfers in - - -
CHANGE IN NET POSITION 698,831 (2,948,800) (51,692)
NET POSITION - BEGINNING 751,907 3,851,364 3,286,895 NET POSITION - ENDING 1,450,738$ 902,564$ 3,235,203$
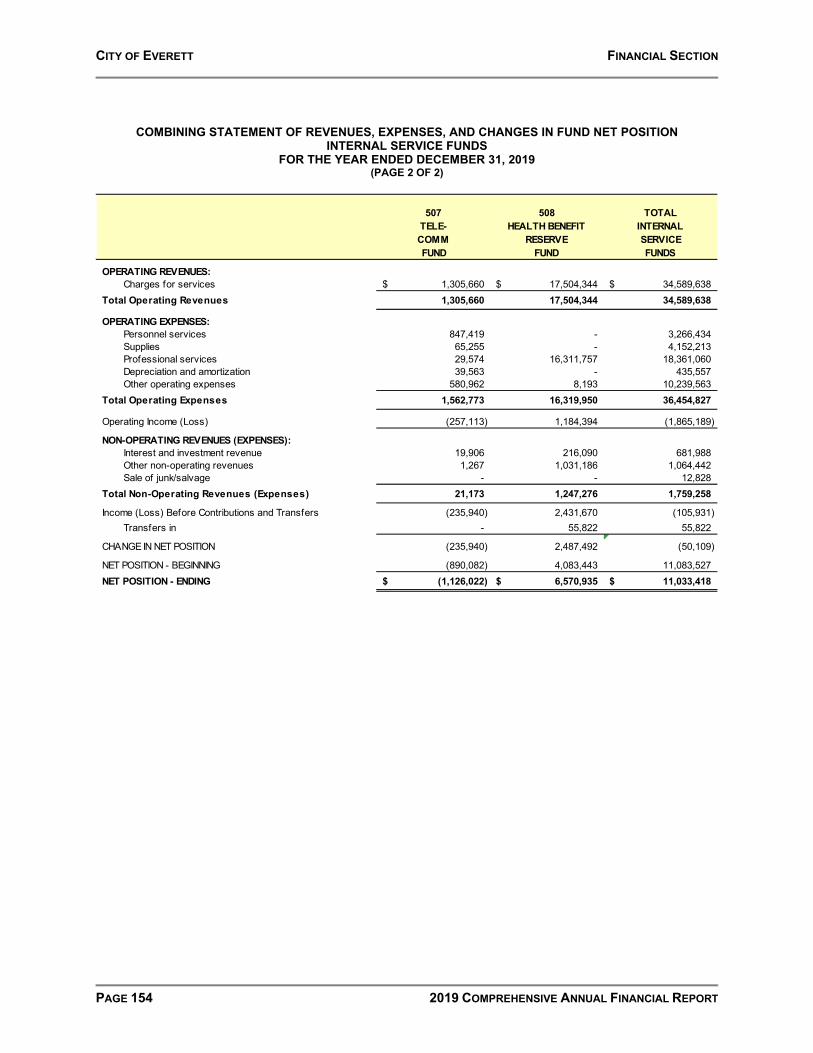
CITY OF EVERETT FINANCIAL SECTION
PAGE 154 2019 COMPREHENSIVE ANNUAL FINANCIAL REPORT
COMBINING STATEMENT OF REVENUES, EXPENSES, AND CHANGES IN FUND NET POSITION INTERNAL SERVICE FUNDS
FOR THE YEAR ENDED DECEMBER 31, 2019 (PAGE 2 OF 2)
507TELE-COMMFUND
508HEALTH BENEFIT
RESERVEFUND
TOTALINTERNALSERVICEFUNDS
OPERATING REVENUES:Charges for services 1,305,660$ 17,504,344$ 34,589,638$
Total Operating Revenues 1,305,660 17,504,344 34,589,638
OPERATING EXPENSES:Personnel services 847,419 - 3,266,434 Supplies 65,255 - 4,152,213 Professional services 29,574 16,311,757 18,361,060 Depreciation and amortization 39,563 - 435,557 Other operating expenses 580,962 8,193 10,239,563
Total Operating Expenses 1,562,773 16,319,950 36,454,827
Operating Income (Loss) (257,113) 1,184,394 (1,865,189)
NON-OPERATING REVENUES (EXPENSES):Interest and investment revenue 19,906 216,090 681,988 Other non-operating revenues 1,267 1,031,186 1,064,442 Sale of junk/salvage - - 12,828
Total Non-Operating Revenues (Expenses) 21,173 1,247,276 1,759,258
Income (Loss) Before Contributions and Transfers (235,940) 2,431,670 (105,931) Transfers in - 55,822 55,822
CHANGE IN NET POSITION (235,940) 2,487,492 (50,109)
NET POSITION - BEGINNING (890,082) 4,083,443 11,083,527 NET POSITION - ENDING (1,126,022)$ 6,570,935$ 11,033,418$

CITY OF EVERETT FINANCIAL SECTION
2019 COMPREHENSIVE ANNUAL FINANCIAL REPORT PAGE 155
COMBINING STATEMENT OF CASH FLOWS INTERNAL SERVICE FUNDS
FOR THE YEAR ENDED DECEMBER 31, 2019 (PAGE 1 OF 2)
501EQUIPMENT
RENTALFUND
503SELF-
INSURANCEFUND
505COMPUTER
RESERVEFUND
CASH FLOWS FROM OPERATING ACTIVITIES:Receipts from customers and users 463,207$ 6,463$ -$ Receipts from interfund services provided 6,944,321 5,510,376 2,826,367 Payments to suppliers (4,237,778) (1,673,173) (2,488,042) Payments to employees (2,516,671) (115,039) - Payments for interfund services used (516,672) - - Claims paid - (4,575,308) - Other receipts 17,668 - 27,149 Net cash provided (used) by operating activities 154,075 (846,681) 365,474
CASH FLOWS FROM NONCAPITAL FINANCING ACTIVITIES:Transfers from other funds - - - Net cash provided (used) by noncapital financing activities - - -
CASH FLOWS FROM CAPITAL AND RELATED FINANCING ACTIVITIES:
Acquisition and construction of capital assets (26,634) - (256,542) Net cash provided (used) by capital and related financing activitie (26,634) - (256,542)
CASH FLOWS FROM INVESTING ACTIVITIES:Proceeds from sale of investments 331,565 4,060,473 485,149 Investment income 34,704 200,445 54,682 Net cash provided (used) by investing activities 366,269 4,260,918 539,831
Net Increase (Decrease) in Cash and Cash Equivalents 493,710 3,414,237 648,763 Cash and Cash Equivalents, January 1 282,126 675,392 262,558 CASH AND CASH EQUIVALENTS, DECEMBER 31 775,836$ 4,089,629$ 911,321$
Current Cash and Cash Equivalents 775,836$ 4,089,629$ 911,321$ CASH AND CASH EQUIVALENTS, DECEMBER 31 775,836$ 4,089,629$ 911,321$
RECONCILIATION OF OPERATING INCOME (LOSS) TO NET CASH PROVIDED (USED) BY OPERATING ACTIVITIES:Operating income (loss) 627,823$ (3,264,085)$ (156,208)$ Adjustments to Reconcile Operating Income to Net Cash Provided (Used) by Operating Activities:
Depreciation and amortization 57,159 - 338,835 Other non-operating receipts 17,668 - 27,149 GASB 68 pension expense adjustments (129,159) - -
Change in Assets and Liabilities:(Increase) decrease in inventories (202,624) - 28,486 (Increase) decrease in receivables (28,900) - - (Increase) decrease in prepaid expenses - (2,142) - Increase (decrease) in accounts and other payables (102,819) 2,419,546 127,212 Increase (decrease) in compensated absences (85,073) - -
TOTAL ADJUSTMENTS (473,748) 2,417,404 521,682
Net cash provided (used) by operating activities 154,075$ (846,681)$ 365,474$
SCHEDULE OF NON-CASH CAPITAL AND RELATED FINANCING ACTIVITIES:
Increase (decrease) in fair value of investments 15,451$ 95,289$ 18,360$ TOTAL NON-CASH ACTIVITIES 15,451$ 95,289$ 18,360$

CITY OF EVERETT FINANCIAL SECTION
PAGE 156 2019 COMPREHENSIVE ANNUAL FINANCIAL REPORT
COMBINING STATEMENT OF CASH FLOWS INTERNAL SERVICE FUNDS
FOR THE YEAR ENDED DECEMBER 31, 2019 (PAGE 2 OF 2)
507TELE-COMMFUND
508HEALTH BENEFIT
RESERVEFUND
TOTALINTERNALSERVICEFUNDS
CASH FLOWS FROM OPERATING ACTIVITIES:Receipts from customers and users -$ 4,498$ 474,168$ Receipts from interfund services provided 1,305,660 17,499,846 34,086,570 Payments to suppliers (706,732) (16,854,487) (25,960,212) Payments to employees (573,621) - (3,205,331) Payments for interfund services used - - (516,672) Claims paid - - (4,575,308) Other receipts 1,267 1,362,475 1,408,559 Net cash provided (used) by operating activities 26,574 2,012,332 1,711,774
CASH FLOWS FROM NONCAPITAL FINANCING ACTIVITIES:Transfers from other funds - 55,822 55,822 Net cash provided (used) by noncapital financing activities - 55,822 55,822
CASH FLOWS FROM CAPITAL AND RELATED FINANCING ACTIVITIES:
Acquisition and construction of capital assets (95,155) - (378,331) Net cash provided (used) by capital and related financing activitie (95,155) - (378,331)
CASH FLOWS FROM INVESTING ACTIVITIES:Proceeds from sale of investments 268,556 683,560 5,829,303 Investment income 13,071 151,849 454,751 Net cash provided (used) by investing activities 281,627 835,409 6,284,054
Net Increase (Decrease) in Cash and Cash Equivalents 213,046 2,903,563 7,673,319 Cash and Cash Equivalents, January 1 26,074 241,088 1,487,238 CASH AND CASH EQUIVALENTS, DECEMBER 31 239,120$ 3,144,651$ 9,160,557$
Current Cash and Cash Equivalents 239,120$ 3,144,651 9,160,557$ CASH AND CASH EQUIVALENTS, DECEMBER 31 239,120$ 3,144,651$ 9,160,557$
RECONCILIATION OF OPERATING INCOME (LOSS) TO NET CASH PROVIDED (USED) BY OPERATING ACTIVITIES:Operating income (loss) (257,113)$ 1,184,394$ (1,865,189)$ Adjustments to Reconcile Operating Income to Net Cash Provided (Used) by Operating Activities:
Depreciation and amortization 39,563 - 435,557 Other non-operating receipts 1,267 1,031,186 1,077,270 GASB 68 pension expense adjustments 317,416 - 188,257
Change in Assets and Liabilities:(Increase) decrease in inventories - - (174,138) (Increase) decrease in receivables - 331,289 302,389 (Increase) decrease in prepaid expenses - - (2,142) Increase (decrease) in accounts and other payables (32,235) (534,537) 1,877,167 Increase (decrease) in compensated absences (42,324) - (127,397)
TOTAL ADJUSTMENTS 283,687 827,938 3,576,963
Net cash provided (used) by operating activities 26,574$ 2,012,332$ 1,711,774$
SCHEDULE OF NON-CASH CAPITAL AND RELATED FINANCING ACTIVITIES:
Increase (decrease) in fair value of investments 5,737$ 47,884$ 182,721$ TOTAL NON-CASH ACTIVITIES 5,737$ 47,884$ 182,721$

FIDUCIARY FUNDS

FIDUCIARY FUNDS PENSION TRUST FUNDS 637a The Police Pension Fund receives funding from the General Fund (property taxes) and
investment interest to pay for retirement benefits not covered by the State's Law Enforcement Officers' and Fire Fighters' Retirement System to active and retired police officers hired on or before March 1, 1970.
637b The Police Healthcare Fund receives funding from the General Fund (property taxes)
and investment interest to pay for medical expenses not covered by medical insurance programs for active and retired police officers hired before October 1, 1977.
638a The Fire Pension Fund receives funding from the General Fund (property taxes), a
portion of the State levied fire insurance premium tax and investment interest to pay for retirement benefits not covered by the State's Law Enforcement Officers' and Fire Fighters' Retirement System to active and retired fire fighters hired on or before March 1, 1970.
638b The Fire Healthcare Fund receives funding from the General Fund (property taxes) and
investment interest to pay for medical expenses not covered by medical insurance programs for active and retired police officers hired before October 1, 1977.
CUSTODIAL FUND 665 The Other Custodial Fund accounts for the following entities and processes: Downtown Business Improvement Area (BIA), District #1 – billing, receipt and
disbursement of funds according to the spending authorization provided by Ordinance 2842-05.
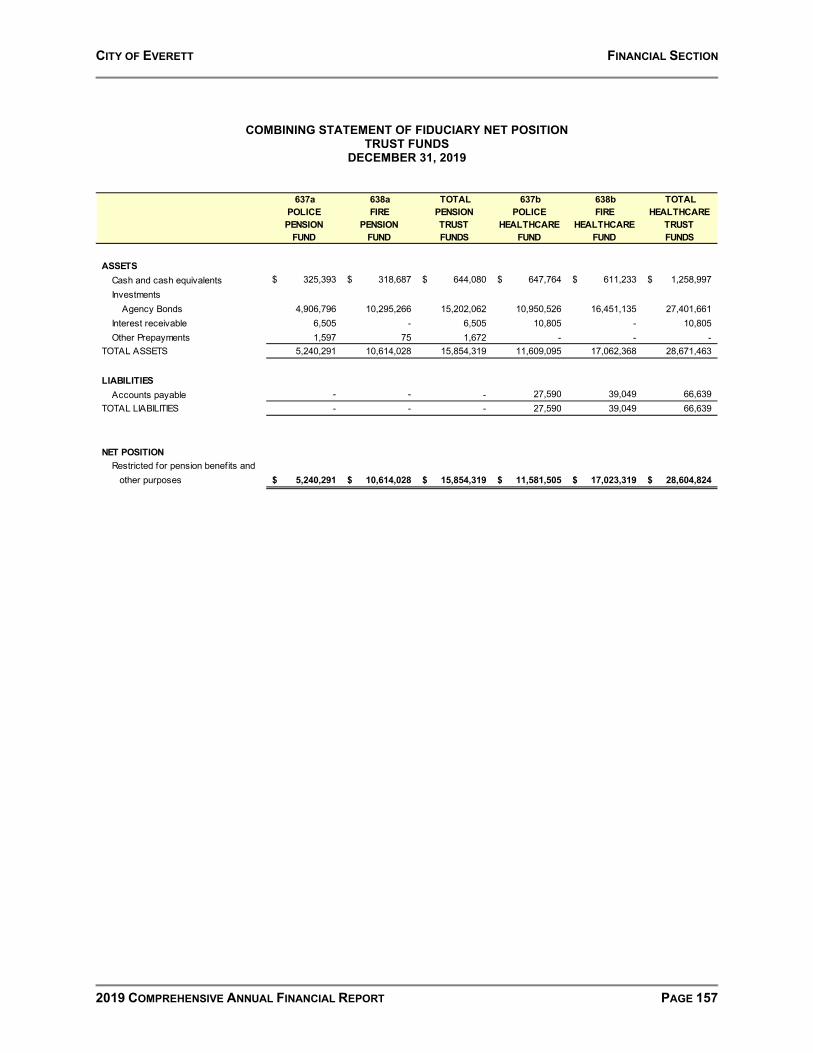
CITY OF EVERETT FINANCIAL SECTION
2019 COMPREHENSIVE ANNUAL FINANCIAL REPORT PAGE 157
COMBINING STATEMENT OF FIDUCIARY NET POSITION TRUST FUNDS
DECEMBER 31, 2019
637aPOLICEPENSION
FUND
638aFIRE
PENSIONFUND
TOTALPENSIONTRUSTFUNDS
637bPOLICE
HEALTHCAREFUND
638bFIRE
HEALTHCAREFUND
TOTAL HEALTHCARE
TRUSTFUNDS
ASSETSCash and cash equivalents 325,393$ 318,687$ 644,080$ 647,764$ 611,233$ 1,258,997$ Investments
Agency Bonds 4,906,796 10,295,266 15,202,062 10,950,526 16,451,135 27,401,661 Interest receivable 6,505 - 6,505 10,805 - 10,805 Other Prepayments 1,597 75 1,672 - - -
TOTAL ASSETS 5,240,291 10,614,028 15,854,319 11,609,095 17,062,368 28,671,463
LIABILITIESAccounts payable - - - 27,590 39,049 66,639
TOTAL LIABILITIES - - - 27,590 39,049 66,639
NET POSITIONRestricted for pension benefits and other purposes 5,240,291$ 10,614,028$ 15,854,319$ 11,581,505$ 17,023,319$ 28,604,824$

CITY OF EVERETT FINANCIAL SECTION
PAGE 158 2019 COMPREHENSIVE ANNUAL FINANCIAL REPORT
COMBINING STATEMENT OF CHANGES IN FIDUCIARY NET POSITION TRUST FUNDS
FOR THE YEAR ENDED DECEMBER 31, 2019
637aPOLICEPENSION
FUND
638aFIRE
PENSIONFUND
TOTALPENSIONTRUSTFUNDS
637bPOLICE
HEALTHCAREFUND
638bFIRE
HEALTHCAREFUND
TOTALHEALTHCARE
TRUSTFUNDS
ADDITIONS:Contributions Employer 200,002$ 415,502$ 615,504$ 703,706$ 509,090$ 1,212,796$ State - 180,065 180,065 - - - Other contributions - - - - 2,614 2,614 Total contributions 200,002 595,567 795,569 703,706 511,704 1,215,410 Investment income
Interest 116,469 242,984 359,453 252,702 382,194 634,896 Net appreciation (depreciation) in fair value 136,672 308,379 445,051 257,281 488,038 745,319
Net investment income 253,141 551,363 804,504 509,983 870,232 1,380,215 TOTAL ADDITIONS 453,143 1,146,930 1,600,073 1,213,689 1,381,936 2,595,625 DEDUCTIONS:
Benefits 475,876 689,822 1,165,698 964,371 1,607,116 2,571,487 Administrative expense - - - 38,507 48,143 86,650
TOTAL DEDUCTIONS 475,876 689,822 1,165,698 1,002,878 1,655,259 2,658,137 CHANGE IN NET POSITION
Pension benefits (22,733) 457,108 434,375 210,811 (273,323) (62,512) NET POSITION RESTRICTED FOR EMPLOYEES' PENSION BENEFITS
Employees' pension benefits, January 1 5,263,024 10,156,920 15,419,944 11,370,694 17,296,642 28,667,336
NET POSITION - ENDING 5,240,291$ 10,614,028$ 15,854,319$ 11,581,505$ 17,023,319$ 28,604,824$

CITY OF EVERETT STATISTICAL SECTION
2019 COMPREHENSIVE ANNUAL FINANCIAL REPORT PAGE 159
STATISTICAL SECTION OVERVIEW This part of the City of Everett’s comprehensive annual financial report presents detailed information as a context for understanding what the information in the financial statements, note disclosures, and required supplementary information say about the government’s overall financial health. This information is unaudited. CONTENTS STAT No. Financial Trends Stats 1 - 5
These schedules contain information to assist the reader in understanding how the city’s financial position has changed over time.
Revenue Capacity Stats 6 - 7
These schedules contain information to assist the reader in understanding and assessing the city’s most significant local revenue sources; water/sewer service fees and property taxes.
Debt Capacity Stats 8 - 12
These schedules present information to assist the reader in understanding and assessing the affordability of the city’s current levels of outstanding debt and the government’s ability to issue additional debt in the future.
Demographic and Economic Information Stats 13 - 15
These schedules offer demographic and economic indicators to assist the reader in understanding the environment within which the city’s financial activities take place.
Operating Information Stats 16 - 17
These schedules contain service and infrastructure data to help the reader understand how the information in the government’s financial report relates to the services the city provides and the activities it performs.
Sources: Unless otherwise noted, the information in the schedules is derived from the comprehensive annual financial reports for the relevant year. The city implemented GASB Statement 34 in 2002; schedules presenting government-wide information include information beginning in that year.
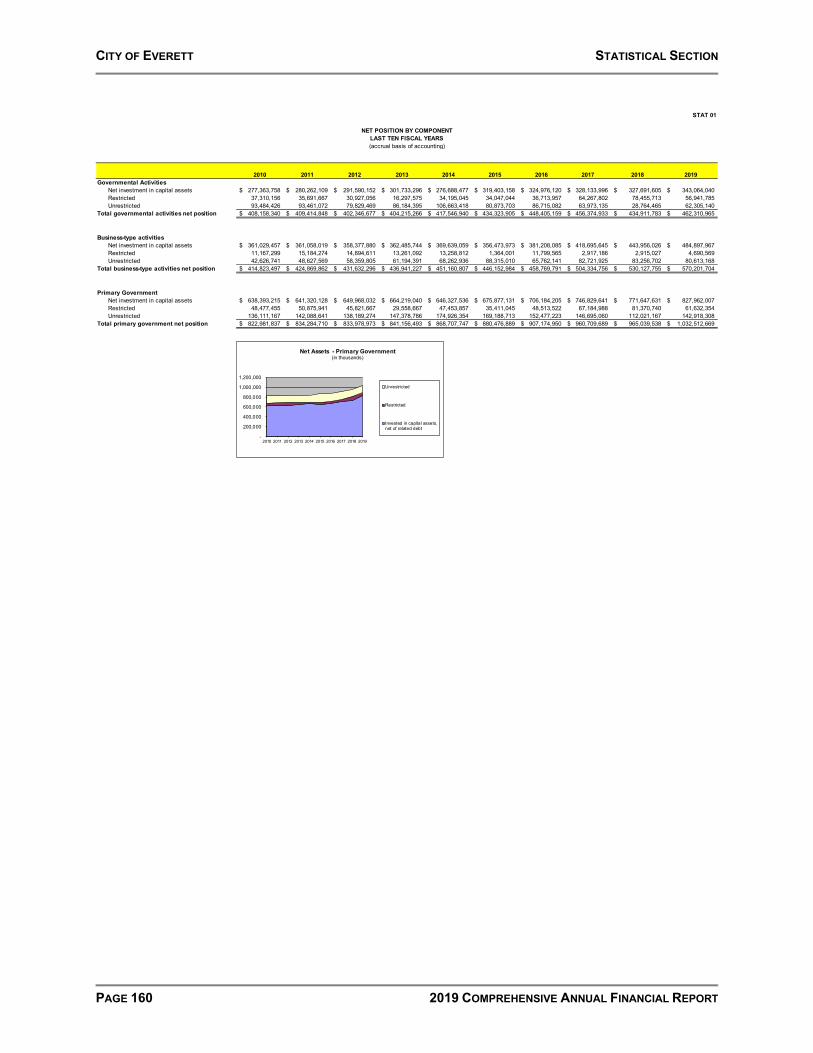
CITY OF EVERETT STATISTICAL SECTION
PAGE 160 2019 COMPREHENSIVE ANNUAL FINANCIAL REPORT
STAT 01
2010 2011 2012 2013 2014 2015 2016 2017 2018 2019Governmental Activities
Net investment in capital assets 277,363,758$ 280,262,109$ 291,590,152$ 301,733,296$ 276,688,477$ 319,403,158$ 324,976,120$ 328,133,996$ 327,691,605$ 343,064,040$ Restricted 37,310,156 35,691,667 30,927,056 16,297,575 34,195,045 34,047,044 36,713,957 64,267,802 78,455,713 56,941,785 Unrestricted 93,484,426 93,461,072 79,829,469 86,184,395 106,663,418 80,873,703 86,715,082 63,973,135 28,764,465 62,305,140
Total governmental activities net position 408,158,340$ 409,414,848$ 402,346,677$ 404,215,266$ 417,546,940$ 434,323,905$ 448,405,159$ 456,374,933$ 434,911,783$ 462,310,965$
Business-type activitiesNet investment in capital assets 361,029,457$ 361,058,019$ 358,377,880$ 362,485,744$ 369,639,059$ 356,473,973$ 381,208,085$ 418,695,645$ 443,956,026$ 484,897,967$ Restricted 11,167,299 15,184,274 14,894,611 13,261,092 13,258,812 1,364,001 11,799,565 2,917,186 2,915,027 4,690,569 Unrestricted 42,626,741 48,627,569 58,359,805 61,194,391 68,262,936 88,315,010 65,762,141 82,721,925 83,256,702 80,613,168
Total business-type activities net position 414,823,497$ 424,869,862$ 431,632,296$ 436,941,227$ 451,160,807$ 446,152,984$ 458,769,791$ 504,334,756$ 530,127,755$ 570,201,704$
Primary GovernmentNet investment in capital assets 638,393,215$ 641,320,128$ 649,968,032$ 664,219,040$ 646,327,536$ 675,877,131$ 706,184,205$ 746,829,641$ 771,647,631$ 827,962,007$ Restricted 48,477,455 50,875,941 45,821,667 29,558,667 47,453,857 35,411,045 48,513,522 67,184,988 81,370,740 61,632,354 Unrestricted 136,111,167 142,088,641 138,189,274 147,378,786 174,926,354 169,188,713 152,477,223 146,695,060 112,021,167 142,918,308
Total primary government net position 822,981,837$ 834,284,710$ 833,978,973$ 841,156,493$ 868,707,747$ 880,476,889$ 907,174,950$ 960,709,689$ 965,039,538$ 1,032,512,669$
NET POSITION BY COMPONENTLAST TEN FISCAL YEARS(accrual basis of accounting)
-
200,000
400,000
600,000
800,000
1,000,000
1,200,000
2010 2011 2012 2013 2014 2015 2016 2017 2018 2019
Net Assets - Primary Government(in thousands)
Unrestricted
Restricted
Invested in capital assets,net of related debt
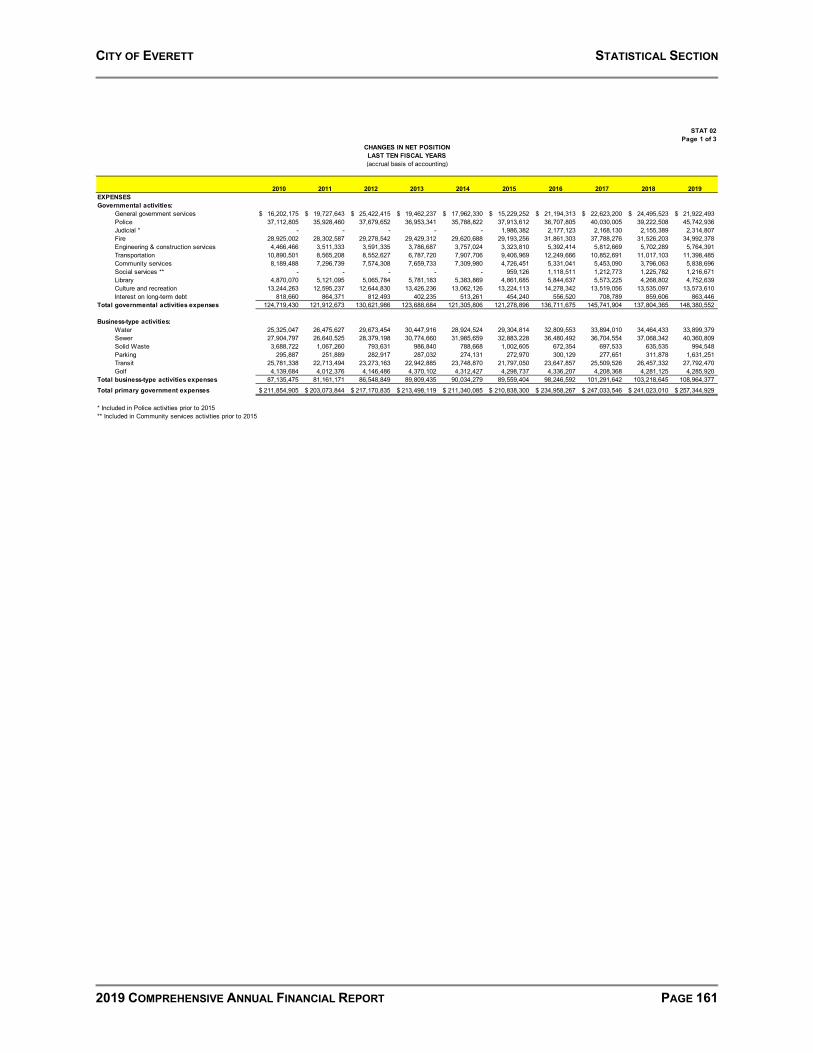
CITY OF EVERETT STATISTICAL SECTION
2019 COMPREHENSIVE ANNUAL FINANCIAL REPORT PAGE 161
STAT 02Page 1 of 3
2010 2011 2012 2013 2014 2015 2016 2017 2018 2019EXPENSESGovernmental activities:
General government services 16,202,175$ 19,727,643$ 25,422,415$ 19,462,237$ 17,962,330$ 15,229,252$ 21,194,313$ 22,623,200$ 24,495,523$ 21,922,493$ Police 37,112,805 35,928,460 37,679,652 36,953,341 35,788,822 37,913,612 36,707,805 40,030,005 39,222,508 45,742,936 Judicial * - - - - - 1,986,382 2,177,123 2,168,130 2,155,389 2,314,807 Fire 28,925,002 28,302,587 29,278,542 29,429,312 29,620,688 29,193,256 31,861,303 37,788,276 31,526,203 34,992,378 Engineering & construction services 4,466,466 3,511,333 3,591,335 3,786,687 3,757,024 3,323,810 5,392,414 5,812,669 5,702,289 5,764,391 Transportation 10,890,501 8,565,208 8,552,627 6,787,720 7,907,706 9,406,969 12,249,666 10,852,691 11,017,103 11,398,485 Community services 8,189,488 7,296,739 7,574,308 7,659,733 7,309,980 4,726,451 5,331,041 5,453,090 3,796,063 5,838,696 Social services ** - - - - - 959,126 1,118,511 1,212,773 1,225,782 1,216,671 Library 4,870,070 5,121,095 5,065,784 5,781,183 5,383,869 4,861,685 5,844,637 5,573,225 4,268,802 4,752,639 Culture and recreation 13,244,263 12,595,237 12,644,830 13,426,236 13,062,126 13,224,113 14,278,342 13,519,056 13,535,097 13,573,610 Interest on long-term debt 818,660 864,371 812,493 402,235 513,261 454,240 556,520 708,789 859,606 863,446
Total governmental activities expenses 124,719,430 121,912,673 130,621,986 123,688,684 121,305,806 121,278,896 136,711,675 145,741,904 137,804,365 148,380,552
Business-type activities:Water 25,325,047 26,475,627 29,673,454 30,447,916 28,924,524 29,304,814 32,809,553 33,894,010 34,464,433 33,899,379 Sewer 27,904,797 26,640,525 28,379,198 30,774,660 31,985,659 32,883,228 36,480,492 36,704,554 37,068,342 40,360,809 Solid Waste 3,688,722 1,067,260 793,631 986,840 788,668 1,002,605 672,354 697,533 635,535 994,548 Parking 295,887 251,889 282,917 287,032 274,131 272,970 300,129 277,651 311,878 1,631,251 Transit 25,781,338 22,713,494 23,273,163 22,942,885 23,748,870 21,797,050 23,647,857 25,509,526 26,457,332 27,792,470 Golf 4,139,684 4,012,376 4,146,486 4,370,102 4,312,427 4,298,737 4,336,207 4,208,368 4,281,125 4,285,920
Total business-type activities expenses 87,135,475 81,161,171 86,548,849 89,809,435 90,034,279 89,559,404 98,246,592 101,291,642 103,218,645 108,964,377 Total primary government expenses 211,854,905$ 203,073,844$ 217,170,835$ 213,498,119$ 211,340,085$ 210,838,300$ 234,958,267$ 247,033,546$ 241,023,010$ 257,344,929$
* Included in Police activities prior to 2015** Included in Community services activities prior to 2015
CHANGES IN NET POSITIONLAST TEN FISCAL YEARS(accrual basis of accounting)
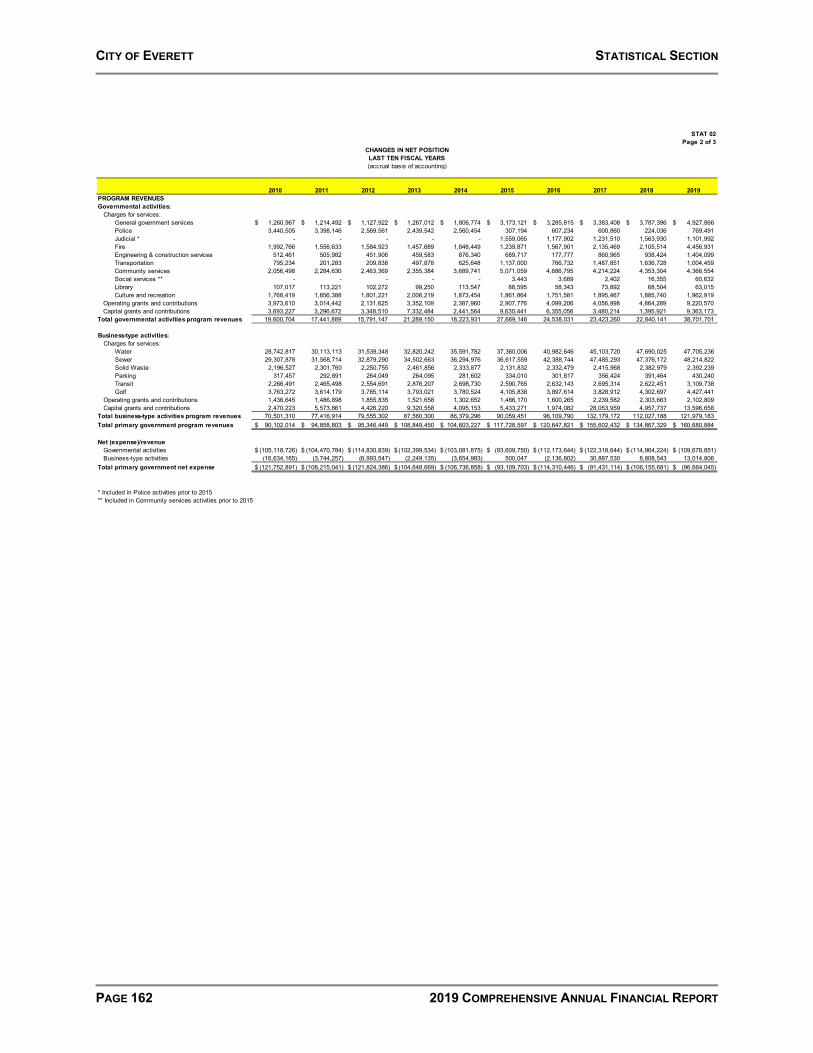
CITY OF EVERETT STATISTICAL SECTION
PAGE 162 2019 COMPREHENSIVE ANNUAL FINANCIAL REPORT
STAT 02Page 2 of 3
2010 2011 2012 2013 2014 2015 2016 2017 2018 2019PROGRAM REVENUESGovernmental activities:
Charges for services:General government services 1,260,967$ 1,214,492$ 1,127,922$ 1,287,012$ 1,806,774$ 3,173,121$ 3,285,815$ 3,383,408$ 3,787,396$ 4,927,866$ Police 3,440,505 3,398,146 2,569,561 2,439,542 2,560,454 307,194 607,234 600,860 224,036 769,491 Judicial * - - - - - 1,559,065 1,177,902 1,231,510 1,563,930 1,101,992 Fire 1,992,766 1,556,633 1,584,923 1,457,689 1,848,449 1,239,871 1,567,901 2,135,469 2,105,514 4,456,931 Engineering & construction services 512,461 505,982 451,906 459,583 876,340 689,717 177,777 860,965 938,424 1,404,099 Transportation 795,234 201,283 209,838 497,878 625,648 1,137,000 766,732 1,487,851 1,636,728 1,004,459 Community services 2,056,498 2,284,630 2,463,369 2,355,384 3,689,741 5,071,059 4,686,795 4,214,224 4,353,304 4,366,554 Social services ** - - - - - 3,443 3,689 2,402 16,355 60,632 Library 107,017 113,221 102,272 99,250 113,547 88,595 58,343 73,892 68,504 63,015 Culture and recreation 1,768,419 1,856,388 1,801,221 2,008,219 1,873,454 1,861,864 1,751,581 1,895,467 1,885,740 1,962,919
Operating grants and contributions 3,973,610 3,014,442 2,131,625 3,352,109 2,387,960 2,907,776 4,099,206 4,056,998 4,864,289 9,220,570 Capital grants and contributions 3,693,227 3,296,672 3,348,510 7,332,484 2,441,564 9,630,441 6,355,056 3,480,214 1,395,921 9,363,173
Total governmental activities program revenues 19,600,704 17,441,889 15,791,147 21,289,150 18,223,931 27,669,146 24,538,031 23,423,260 22,840,141 38,701,701
Business-type activities:Charges for services:
Water 28,742,817 30,113,113 31,539,348 32,820,242 35,591,782 37,360,006 40,982,646 45,103,720 47,690,025 47,705,236 Sewer 29,307,878 31,568,714 32,879,290 34,502,663 36,294,976 36,617,559 42,388,744 47,485,293 47,376,172 48,214,822 Solid Waste 2,196,527 2,301,760 2,250,755 2,461,856 2,333,877 2,131,832 2,332,479 2,415,968 2,382,979 2,392,239 Parking 317,457 292,891 264,049 264,095 281,602 334,010 301,817 356,424 391,464 430,240 Transit 2,266,491 2,465,498 2,554,691 2,876,207 2,698,730 2,590,765 2,632,143 2,695,314 2,622,451 3,109,738 Golf 3,763,272 3,614,179 3,785,114 3,793,021 3,780,524 4,105,838 3,897,614 3,828,912 4,302,697 4,427,441
Operating grants and contributions 1,436,645 1,486,898 1,855,835 1,521,658 1,302,652 1,486,170 1,600,265 2,239,582 2,303,663 2,102,809 Capital grants and contributions 2,470,223 5,573,861 4,426,220 9,320,558 4,095,153 5,433,271 1,974,082 28,053,959 4,957,737 13,596,658
Total business-type activities program revenues 70,501,310 77,416,914 79,555,302 87,560,300 86,379,296 90,059,451 96,109,790 132,179,172 112,027,188 121,979,183 Total primary government program revenues 90,102,014$ 94,858,803$ 95,346,449$ 108,849,450$ 104,603,227$ 117,728,597$ 120,647,821$ 155,602,432$ 134,867,329$ 160,680,884$
Net (expense)/revenueGovernmental activities (105,118,726)$ (104,470,784)$ (114,830,839)$ (102,399,534)$ (103,081,875)$ (93,609,750)$ (112,173,644)$ (122,318,644)$ (114,964,224)$ (109,678,851)$ Business-type activities (16,634,165) (3,744,257) (6,993,547) (2,249,135) (3,654,983) 500,047 (2,136,802) 30,887,530 8,808,543 13,014,806
Total primary government net expense (121,752,891)$ (108,215,041)$ (121,824,386)$ (104,648,669)$ (106,736,858)$ (93,109,703)$ (114,310,446)$ (91,431,114)$ (106,155,681)$ (96,664,045)$
* Included in Police activities prior to 2015** Included in Community services activities prior to 2015
CHANGES IN NET POSITIONLAST TEN FISCAL YEARS(accrual basis of accounting)

CITY OF EVERETT STATISTICAL SECTION
2019 COMPREHENSIVE ANNUAL FINANCIAL REPORT PAGE 163
STAT 02Page 3 of 3
2010 2011 2012 2013 2014 2015 2016 2017 2018 2019GENERAL REVENUES & OTHER CHANGES IN NET POSITIONGovernmental activities:
TaxesProperty 35,473,230$ 38,322,027$ 38,765,835$ 38,606,082$ 39,154,983$ 40,331,709$ 42,082,758$ 42,793,716$ 43,435,580$ 46,896,606$ Sales 24,818,451 23,696,637 24,605,177 25,596,982 27,025,637 28,725,134 29,683,604 30,849,860 32,501,497 33,227,298 Business 26,083,027 27,105,472 29,331,090 30,706,072 31,980,853 35,462,837 35,969,454 36,263,662 35,491,490 35,584,401 Other 2,909,484 3,566,778 4,019,849 4,070,079 5,554,740 6,787,004 9,561,525 9,212,000 9,333,783 9,566,933 Miscellaneous 4,861,570 4,542,695 4,660,972 4,086,888 3,567,586 4,243,131 4,774,218 4,976,842 5,702,446 6,478,827
Interest and investment earnings 4,112,868 4,664,927 2,405,516 (2,901,849) 4,772,730 2,183,432 2,669,025 1,288,995 3,047,974 4,234,752 Special items - - - - - - - - - (3,970,077) Transfers 4,016,688 3,828,756 3,974,229 4,281,872 4,357,020 4,543,176 4,944,066 5,204,561 5,697,817 5,059,293
Total governmental activities 102,275,318 105,727,292 107,762,668 104,446,126 116,413,549 122,276,423 129,684,650 130,589,636 135,210,587 137,078,033
Business-type activities:Taxes
Sales 15,650,951 14,923,050 15,738,801 16,380,028 17,315,413 18,327,232 18,960,466 19,552,780 20,169,893 20,802,068 Business 98,269 92,086 99,994 98,650 96,429 106,863 100,034 99,620 80,683 93,792 Miscellaneous 242,899 250,089 239,412 235,158 239,716 1,019,041 373,622 78,656 90,635 90,224
Interest and investment earnings 3,208,205 3,786,445 1,652,003 (3,129,771) 4,580,025 1,508,012 2,372,963 543,606 2,341,062 3,186,480 Transfers (4,016,688) (3,828,756) (3,974,229) (4,281,872) (4,357,020) (4,543,176) (4,944,066) (5,204,561) (5,697,817) (5,059,293)
Total business-type activities 15,183,636 15,222,914 13,755,981 9,302,193 17,874,563 16,417,972 16,863,019 15,070,101 16,984,456 19,113,271
Total primary government general revenues & other changes in net position 117,458,954$ 120,950,206$ 121,518,649$ 113,748,319$ 134,288,112$ 138,694,395$ 146,547,669$ 145,659,737$ 152,195,043$ 156,191,304$
CHANGE IN NET POSITIONGovernmental activities (2,843,408)$ 1,256,508$ (7,068,171)$ 2,046,592$ 13,331,674$ 28,666,673$ 17,511,006$ 8,270,992$ 20,246,363$ 27,399,182$ Business-type activities (1,450,529) 11,478,657 6,762,434 7,053,058 14,219,580 16,918,019 14,726,217 45,957,631 25,792,999 32,128,077
Total primary government (4,293,937)$ 12,735,165$ (305,737)$ 9,099,650$ 27,551,254$ 45,584,692$ 32,237,223$ 54,228,623$ 46,039,362$ 59,527,259$
(accrual basis of accounting)LAST TEN FISCAL YEARS
CHANGES IN NET POSITION
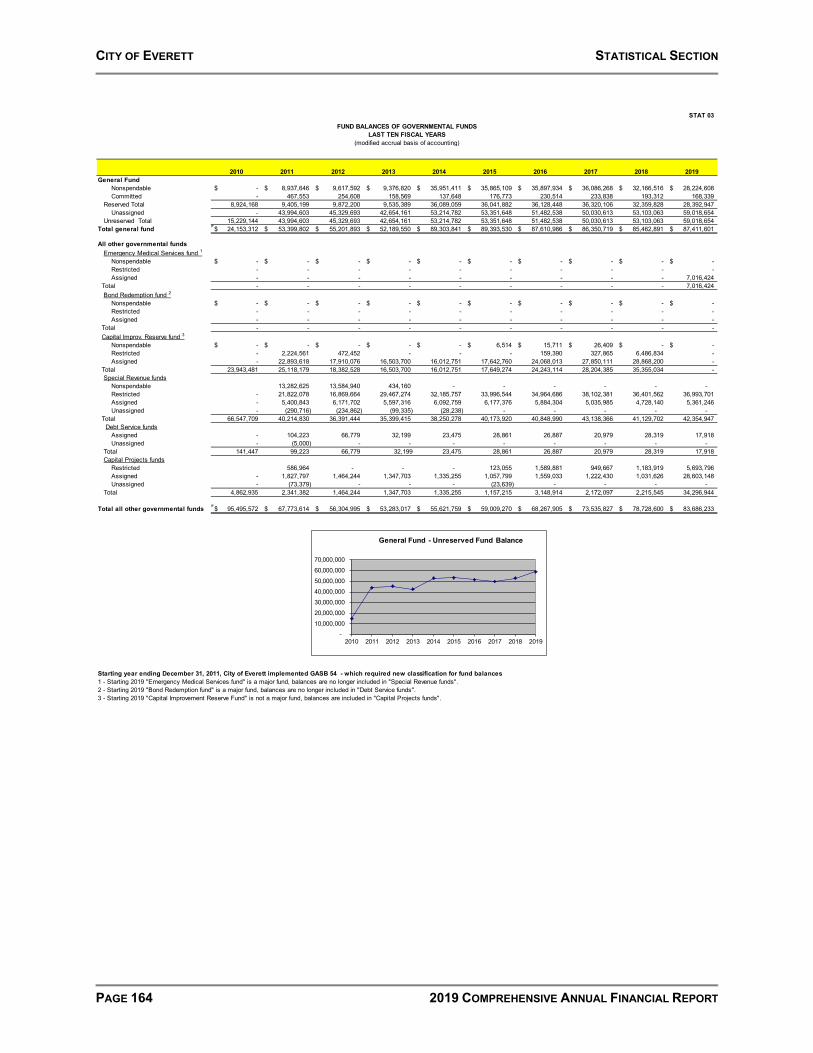
CITY OF EVERETT STATISTICAL SECTION
PAGE 164 2019 COMPREHENSIVE ANNUAL FINANCIAL REPORT
STAT 03
2010 2011 2012 2013 2014 2015 2016 2017 2018 2019General Fund
Nonspendable -$ 8,937,646$ 9,617,592$ 9,376,820$ 35,951,411$ 35,865,109$ 35,897,934$ 36,086,268$ 32,166,516$ 28,224,608$ Committed - 467,553 254,608 158,569 137,648 176,773 230,514 233,838 193,312 168,339 Reserved Total 8,924,168 9,405,199 9,872,200 9,535,389 36,089,059 36,041,882 36,128,448 36,320,106 32,359,828 28,392,947 Unassigned - 43,994,603 45,329,693 42,654,161 53,214,782 53,351,648 51,482,538 50,030,613 53,103,063 59,018,654 Unreserved Total 15,229,144 43,994,603 45,329,693 42,654,161 53,214,782 53,351,648 51,482,538 50,030,613 53,103,063 59,018,654
Total general fund 24,153,312$ 53,399,802$ 55,201,893$ 52,189,550$ 89,303,841$ 89,393,530$ 87,610,986$ 86,350,719$ 85,462,891$ 87,411,601$
All other governmental fundsEmergency Medical Services fund 1
Nonspendable -$ -$ -$ -$ -$ -$ -$ -$ -$ -$ Restricted - - - - - - - - - - Assigned - - - - - - - - - 7,016,424
Total - - - - - - - - - 7,016,424 Bond Redemption fund 2
Nonspendable -$ -$ -$ -$ -$ -$ -$ -$ -$ -$ Restricted - - - - - - - - - - Assigned - - - - - - - - - -
Total - - - - - - - - - - Capital Improv. Reserve fund 3
Nonspendable -$ -$ -$ -$ -$ 6,514$ 15,711$ 26,409$ -$ -$ Restricted - 2,224,561 472,452 - - - 159,390 327,865 6,486,834 - Assigned - 22,893,618 17,910,076 16,503,700 16,012,751 17,642,760 24,068,013 27,850,111 28,868,200 -
Total 23,943,481 25,118,179 18,382,528 16,503,700 16,012,751 17,649,274 24,243,114 28,204,385 35,355,034 - Special Revenue funds Nonspendable 13,282,625 13,584,940 434,160 - - - - - - Restricted - 21,822,078 16,869,664 29,467,274 32,185,757 33,996,544 34,964,686 38,102,381 36,401,562 36,993,701 Assigned - 5,400,843 6,171,702 5,597,316 6,092,759 6,177,376 5,884,304 5,035,985 4,728,140 5,361,246 Unassigned - (290,716) (234,862) (99,335) (28,238) - - - - -
Total 66,547,709 40,214,830 36,391,444 35,399,415 38,250,278 40,173,920 40,848,990 43,138,366 41,129,702 42,354,947 Debt Service funds
Assigned - 104,223 66,779 32,199 23,475 28,861 26,887 20,979 28,319 17,918 Unassigned - (5,000) - - - - - - - -
Total 141,447 99,223 66,779 32,199 23,475 28,861 26,887 20,979 28,319 17,918 Capital Projects funds Restricted 586,964 - - - 123,055 1,589,881 949,667 1,183,919 5,693,796 Assigned - 1,827,797 1,464,244 1,347,703 1,335,255 1,057,799 1,559,033 1,222,430 1,031,626 28,603,148 Unassigned - (73,379) - - - (23,639) - - - -
Total 4,862,935 2,341,382 1,464,244 1,347,703 1,335,255 1,157,215 3,148,914 2,172,097 2,215,545 34,296,944
Total all other governmental funds 95,495,572$ 67,773,614$ 56,304,995$ 53,283,017$ 55,621,759$ 59,009,270$ 68,267,905$ 73,535,827$ 78,728,600$ 83,686,233$
Starting year ending December 31, 2011, City of Everett implemented GASB 54 - which required new classification for fund balances 1 - Starting 2019 "Emergency Medical Services fund" is a major fund, balances are no longer included in "Special Revenue funds".2 - Starting 2019 "Bond Redemption fund" is a major fund, balances are no longer included in "Debt Service funds".3 - Starting 2019 "Capital Improvement Reserve Fund" is not a major fund, balances are included in "Capital Projects funds".
FUND BALANCES OF GOVERNMENTAL FUNDSLAST TEN FISCAL YEARS
(modified accrual basis of accounting)
- 10,000,000 20,000,000 30,000,000 40,000,000 50,000,000 60,000,000 70,000,000
2010 2011 2012 2013 2014 2015 2016 2017 2018 2019
General Fund - Unreserved Fund Balance

CITY OF EVERETT STATISTICAL SECTION
2019 COMPREHENSIVE ANNUAL FINANCIAL REPORT PAGE 165
STAT 04
2010 2011 2012 2013 2014 2015 2016 2017 2018 2019REVENUES
Taxes (see STAT 05) 88,226,650$ $91,758,492 $95,729,271 $98,384,239 $102,209,927 $110,499,789 $116,364,566 $118,235,320 $119,876,391 $124,302,838Licenses and permits 1,275,090 1,372,902 1,419,348 1,322,961 1,893,008 4,945,503 4,317,644 4,284,350 4,208,297 4,260,119 Intergovernmental revenues 12,943,555 11,583,732 11,178,806 14,252,148 9,322,322 16,244,736 13,182,337 12,124,497 12,044,899 21,179,347 Charges for services 11,366,835 10,300,666 10,713,543 10,887,103 13,015,660 12,355,713 11,910,976 11,268,052 11,590,767 14,427,429 Fines and forfeits 2,289,241 2,406,812 2,089,259 1,837,173 1,941,355 1,679,443 1,299,923 1,367,251 1,690,037 1,249,326 Other revenues 6,055,566 6,359,449 4,049,518 (325,034) 7,016,585 3,958,140 5,482,424 4,161,525 5,565,428 7,641,715
Total revenues 122,156,937 123,782,053 125,179,745 126,358,590 135,398,857 149,683,324 152,557,870 151,440,995 154,975,819 173,060,774
EXPENDITURESGeneral government services 19,560,359$ 22,224,183$ 25,222,175$ 23,997,404$ 23,281,469$ 28,207,021$ 28,940,479$ 28,367,559$ 25,880,097$ 29,318,963$ Security of persons and property 63,281,581 61,936,081 63,200,943 64,829,094 63,935,921 68,182,152 71,912,136 74,758,838 77,843,988 80,587,634 Physical environment 4,552,143 3,347,520 3,410,948 228,636 238 - - - - - Transportation 3,848,650 3,855,360 3,985,867 5,986,630 6,479,364 6,785,224 6,774,470 7,074,261 7,352,940 7,132,886 Economic environment 6,774,540 5,886,619 6,130,190 6,822,836 6,421,104 6,777,917 6,413,472 7,888,997 7,189,739 7,099,444 Mental and physical health 20,341 25,117 26,659 925,972 957,605 958,117 1,110,749 1,226,021 1,251,505 1,476,409 Culture and recreation 14,994,400 14,595,117 14,581,748 15,890,931 15,154,251 16,624,481 16,066,602 16,060,005 15,997,160 15,020,859 Capital outlay 11,543,600 13,139,960 19,276,636 16,578,457 8,708,162 21,881,242 15,894,395 14,596,524 12,844,794 26,478,238 Debt service:
Principal 1,819,316 419,316 2,064,316 874,315 10,659,316 1,777,005 2,399,226 2,329,385 6,951,615 26,564,732 Interest 819,205 806,751 1,079,100 526,252 489,641 550,529 641,976 783,024 933,498 980,619 Other debt service costs 45,267 91,968 39,648 12,118 59,538 - - 1,895 14,945 -
Total expenditures 127,259,402 126,327,992 139,018,230 136,672,645 136,146,609 151,743,688 150,153,505 153,086,509 156,260,281 194,659,784
EXCESS (DEFICIENCY) OF REVENUES OVER (UNDER) EXPENDITURES (5,102,465) (2,545,939) (13,838,485) (10,314,055) (747,752) (2,060,364) 2,404,365 (1,645,514) (1,284,462) (21,599,010)
OTHER FINANCING SOURCES (USES)Issuance of long-term debt - - - - 27,665,000 1,169,444 - - - 35,038 Premium - - - - - - - - - 4,306,966 Issuance of Refunding debt - - 14,990,718 - 8,200,000 - - - - 20,070,000 Payments to debt escrow agent - - (14,800,000) - - - - - - - Disposition of capital assets 81,031 161,718 7,853 18,678 42,865 40,938 146,039 861,830 127,675 1,634,505 Transfers in 24,106,469 12,212,052 35,041,669 13,022,464 39,613,074 19,787,919 23,519,925 20,929,018 23,708,312 36,642,252 Transfers out (20,155,854) (8,303,299) (31,068,283) (8,761,408) (35,320,154) (15,460,737) (18,594,238) (15,836,463) (18,258,580) (30,255,079) Other - - - - - - - 19 12,000 41,748
Total other financing sources (uses) 4,031,646 4,070,471 4,171,957 4,279,734 40,200,785 5,537,564 5,071,726 5,954,404 5,589,407 32,475,430
Special items - - - - - - - - (3,970,077)
NET CHANGE IN FUND BALANCES (1,070,819) 1,524,532 (9,666,528) (6,034,321) 39,453,033 3,477,200 7,476,091 4,308,890 4,304,945 6,906,343
Debt service as percentage of noncapital expenditures * 2.22% 1.07% 2.61% 1.17% 8.87% 1.80% 2.25% 2.24% 5.45% 16.19%
* Per GASB Statement 44, "noncapital expenditures are calculated by subtracting the following from total expenditures: a) capital outlay (to the extent capitalized for the government-wide statement of net assets) and b) expenditures for capitalized assets contained within the functional expenditure categories."
CHANGES IN FUND BALANCES OF GOVERNMENTAL FUNDSLAST TEN FISCAL YEARS
(modified accrual basis of accounting)

CITY OF EVERETT STATISTICAL SECTION
PAGE 166 2019 COMPREHENSIVE ANNUAL FINANCIAL REPORT
STAT 05
Fiscal Sales & Hotel/ Business & Cable Real EstateYear Property * Use ** Motel Occupation Admissions Utility Franchise Leasehold Excise Gambling Other Total
2010 35,395,579 24,535,121 283,331 14,560,759 355,862 9,945,590 1,220,816 367,540 1,200,059 339,755 22,238 88,226,650 2011 38,373,048 23,412,096 284,541 15,334,228 343,689 10,165,900 1,261,655 453,142 1,751,671 364,778 13,744 91,758,492 2012 38,767,683 24,283,111 322,065 18,337,828 340,820 9,309,502 1,342,939 398,617 2,299,679 320,265 6,762 95,729,271 2013 38,937,693 25,238,206 358,776 19,982,373 350,868 9,011,725 1,361,106 383,769 2,454,933 304,790 - 98,384,239 2014 39,114,443 26,691,791 333,845 21,232,363 351,989 8,984,618 1,403,311 361,968 3,444,007 291,592 - 102,209,927 2015 40,427,659 28,277,445 447,689 23,000,357 363,363 11,635,904 463,213 465,102 4,051,734 319,092 1,048,231 110,499,789 2016 42,063,105 29,205,241 475,529 22,758,995 371,525 11,841,929 997,005 459,206 6,311,852 339,353 1,540,826 116,364,566 2017 42,793,716 30,315,486 531,180 21,505,762 346,232 12,809,826 1,601,840 526,393 6,006,136 250,021 1,513,928 118,200,520 2018 43,506,525 31,814,961 680,906 21,141,209 350,285 12,459,805 1,540,191 707,155 5,627,654 280,157 1,767,543 119,876,391 2019 46,864,131 32,541,518 680,749 21,451,355 316,361 12,170,519 1,646,166 561,680 6,198,519 324,663 1,547,177 124,302,838
% Change 2010 - 2019 32.40% 32.63% 140.27% 47.32% -11.10% 22.37% 34.84% 52.82% 416.52% -4.44% 6857.36% 40.89%
* Includes property tax recorded in General Government funds, plus property tax recorded directly to the Police and Fire Pension Funds.
** Includes regular sales and use tax, natural gas use tax, and timber harvest tax.
The graphs above combine Hotel/Motel, Admissions, Cable Franchise, Leasehold, Gambling, and Other taxes into the "All Other" category.
GENERAL GOVERNMENTAL TAX REVENUES BY SOURCELAST TEN FISCAL YEARS
(modified accrual basis of accounting)
Property40.12%
Sales & Use27.81%
Business & Occupation
16.50%
Utility11.27%
Real Estate Excise1.36% All Other
2.94%
2010 Taxes by Source
Property37.70%
Sales & Use26.18%
Business & Occupation
17.26%
Utility9.79%
Real Estate Excise4.99%
All Other4.08%
2019 Taxes by Source

CITY OF EVERETT STATISTICAL SECTION
2019 COMPREHENSIVE ANNUAL FINANCIAL REPORT PAGE 167
STAT 6a
(units in millions)Gallons of Gallons of Gallons of Average Gallons of
Water Water Water Percent Wastewater Base Usage Base UsageYear Produced Consumed Unbilled Unbilled Treated Rate 1 Rate Rate Rate
2010 28,036 25,791 2,245 8.01% 7,056 14.10 2.35 42.40 4.712011 23,676 21,782 1,894 8.00% 7,145 15.06 2.51 44.50 4.942012 19,920 17,747 1,543 7.75% 7,609 16.02 2.67 46.70 5.192013 18,062 16,763 1,399 7.75% 6,455 15.13 3.02 48.00 5.332014 18,110 17,747 363 2.00% 7,310 16.92 3.38 49.50 5.52015 19,228 18,843 385 2.00% 6,533 18.95 3.79 81.10 5.682016 18,010 17,356 654 3.63% 7,180 21.24 4.25 59.87 6.652017 18,715 18,045 670 3.58% 7,088 21.34 4.27 65.70 7.32018 19,246 18,450 796 4.14% 6,892 22.02 4.40 69.65 7.742019 18,809 18,030 779 4.14% 6,005 23.12 4.56 73.58 8.18
1 Rate shown is for 3/4" meters (most common meter for single family households). See STAT 6d for other meter sizes and rates.
Source: City of Everett Water/Sewer Utility Department
Water
WATER PRODUCED AND CONSUMED
LAST TEN FISCAL YEARS
SewerTotal Direct Rates
and WASTEWATER TREATED
05,000
10,00015,00020,00025,00030,000
2010 2011 2012 2013 2014 2015 2016 2017 2018 2019
Water Produced and Consumed(in millions)
Produced Consumed

CITY OF EVERETT STATISTICAL SECTION
PAGE 168 2019 COMPREHENSIVE ANNUAL FINANCIAL REPORT
STAT 6b
Water SewerMeter Taps Taps
Year Sold * Sold Total Taps
2010 122 70 1922011 62 41 1032012 49 85 1342013 66 54 1202014 142 147 2892015 159 112 2712016 218 220 4382017 260 272 5322018 188 272 4602019 173 145 318
* Some of these taps may have been acquired through annexation.
Source: City of Everett Water/Sewer Utility Department
ANNUAL TAP SALESLAST TEN FISCAL YEARS
050
100150200250300
2010 2011 2012 2013 2014 2015 2016 2017 2018 2019
Annual Tap Sales
Water Meter Taps Sewer Taps

CITY OF EVERETT STATISTICAL SECTION
2019 COMPREHENSIVE ANNUAL FINANCIAL REPORT PAGE 169
STAT 6c
Year Residential Commercial Industrial Other Total Year Residential Commercial Industrial Other Total
2010 22,848 2,846 48 339 26,081 2010 21,178 1,840 34 133 23,1852011 24,026 2,883 48 346 27,303 2011 21,250 1,849 34 136 23,2692012 23,791 2,899 43 540 27,273 2012 21,274 1,848 34 147 23,3032013 23,902 2,916 40 540 27,398 2013 21,300 1,854 33 150 23,3372014 24,030 2,928 41 538 27,537 2014 21,429 1,852 33 150 23,4642015 24,260 2,931 41 538 27,770 2015 21,635 1,845 33 149 23,6622016 24,569 2,937 40 401 27,947 2016 21,795 1,846 31 138 23,8102017 24,883 2,950 39 411 28,283 2017 22,136 1,842 31 137 24,1462018 25,091 3,003 40 401 28,535 2018 22,331 1,874 31 138 24,3742019 25,206 3,004 40 405 28,655 2019 22,489 1,841 30 131 24,491
Source: City of Everett Water/Sewer Utility Department
WATER SEWER
NUMBER OF WATER AND SEWER CUSTOMERS BY TYPELAST TEN FISCAL YEARS
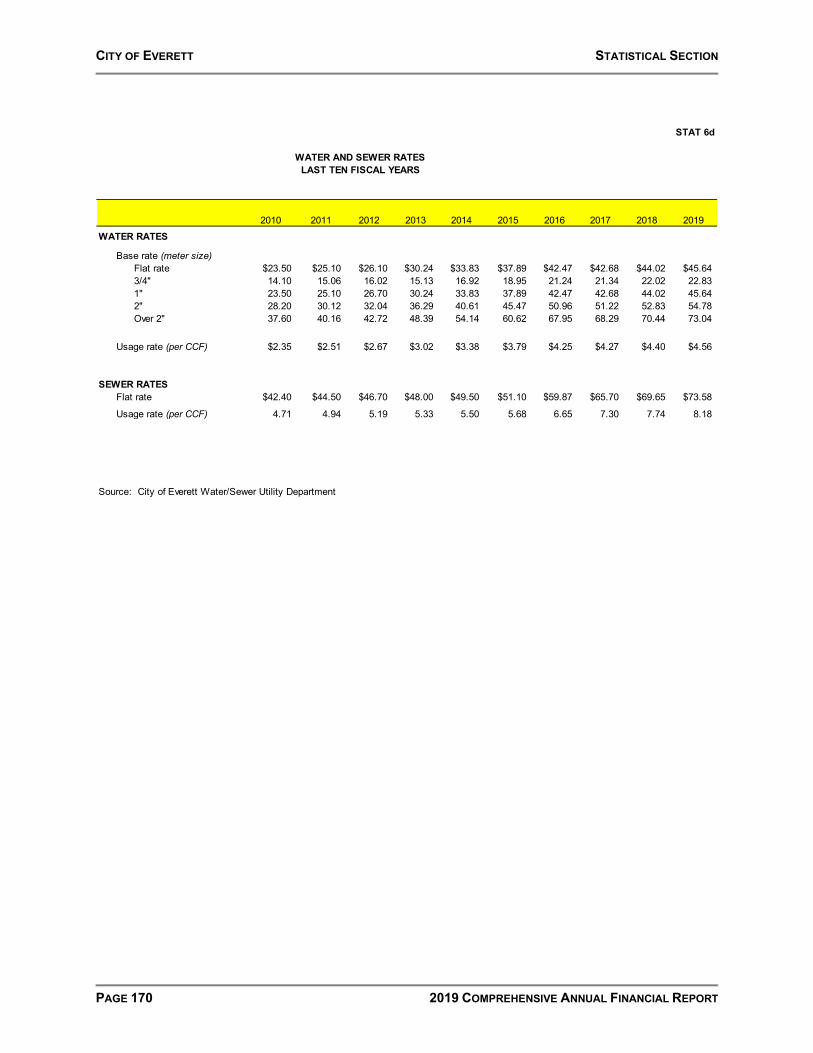
CITY OF EVERETT STATISTICAL SECTION
PAGE 170 2019 COMPREHENSIVE ANNUAL FINANCIAL REPORT
STAT 6d
2010 2011 2012 2013 2014 2015 2016 2017 2018 2019WATER RATES
Base rate (meter size)Flat rate $23.50 $25.10 $26.10 $30.24 $33.83 $37.89 $42.47 $42.68 $44.02 $45.643/4" 14.10 15.06 16.02 15.13 16.92 18.95 21.24 21.34 22.02 22.831" 23.50 25.10 26.70 30.24 33.83 37.89 42.47 42.68 44.02 45.642" 28.20 30.12 32.04 36.29 40.61 45.47 50.96 51.22 52.83 54.78Over 2" 37.60 40.16 42.72 48.39 54.14 60.62 67.95 68.29 70.44 73.04
Usage rate (per CCF) $2.35 $2.51 $2.67 $3.02 $3.38 $3.79 $4.25 $4.27 $4.40 $4.56
SEWER RATESFlat rate $42.40 $44.50 $46.70 $48.00 $49.50 $51.10 $59.87 $65.70 $69.65 $73.58
Usage rate (per CCF) 4.71 4.94 5.19 5.33 5.50 5.68 6.65 7.30 7.74 8.18
Source: City of Everett Water/Sewer Utility Department
WATER AND SEWER RATESLAST TEN FISCAL YEARS
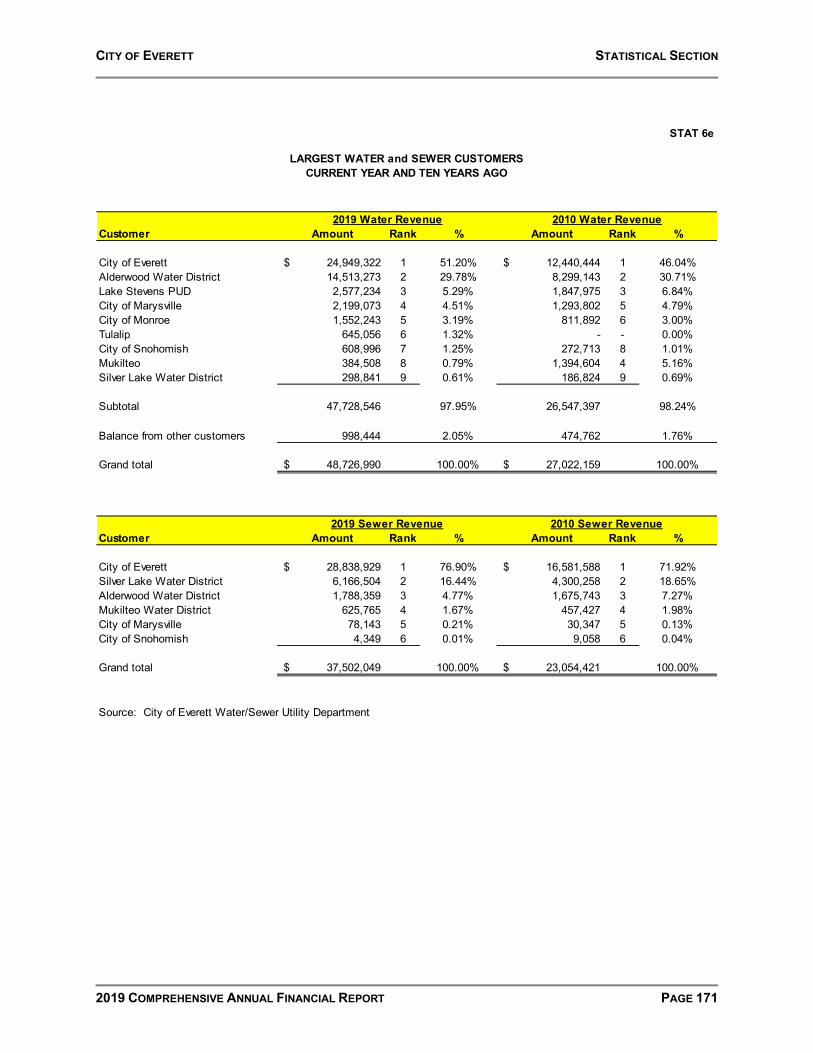
CITY OF EVERETT STATISTICAL SECTION
2019 COMPREHENSIVE ANNUAL FINANCIAL REPORT PAGE 171
STAT 6e
Customer Amount Rank % Amount Rank %
City of Everett 24,949,322$ 1 51.20% 12,440,444$ 1 46.04%Alderwood Water District 14,513,273 2 29.78% 8,299,143 2 30.71%Lake Stevens PUD 2,577,234 3 5.29% 1,847,975 3 6.84%City of Marysville 2,199,073 4 4.51% 1,293,802 5 4.79%City of Monroe 1,552,243 5 3.19% 811,892 6 3.00%Tulalip 645,056 6 1.32% - - 0.00%City of Snohomish 608,996 7 1.25% 272,713 8 1.01%Mukilteo 384,508 8 0.79% 1,394,604 4 5.16%Silver Lake Water District 298,841 9 0.61% 186,824 9 0.69%
Subtotal 47,728,546 97.95% 26,547,397 98.24%
Balance from other customers 998,444 2.05% 474,762 1.76%
Grand total 48,726,990$ 100.00% 27,022,159$ 100.00%
Customer Amount Rank % Amount Rank %
City of Everett 28,838,929$ 1 76.90% 16,581,588$ 1 71.92%Silver Lake Water District 6,166,504 2 16.44% 4,300,258 2 18.65%Alderwood Water District 1,788,359 3 4.77% 1,675,743 3 7.27%Mukilteo Water District 625,765 4 1.67% 457,427 4 1.98%City of Marysville 78,143 5 0.21% 30,347 5 0.13%City of Snohomish 4,349 6 0.01% 9,058 6 0.04%
Grand total 37,502,049$ 100.00% 23,054,421$ 100.00%
Source: City of Everett Water/Sewer Utility Department
LARGEST WATER and SEWER CUSTOMERSCURRENT YEAR AND TEN YEARS AGO
2019 Water Revenue 2010 Water Revenue
2019 Sewer Revenue 2010 Sewer Revenue
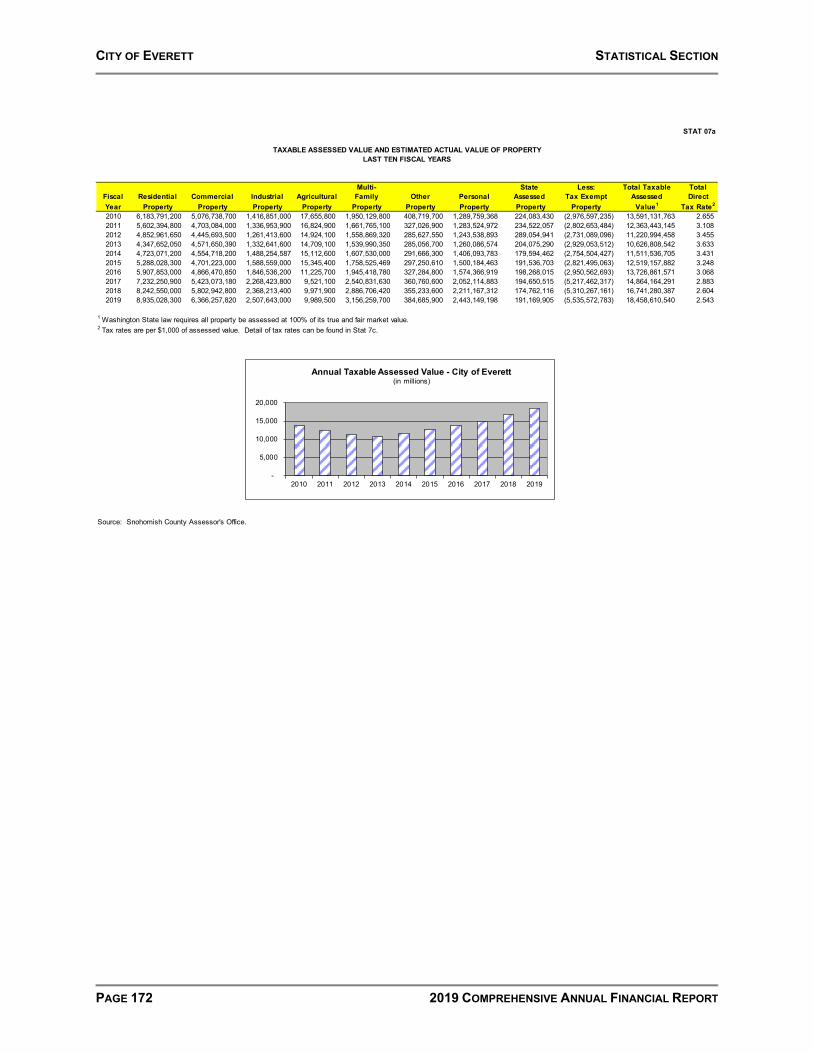
CITY OF EVERETT STATISTICAL SECTION
PAGE 172 2019 COMPREHENSIVE ANNUAL FINANCIAL REPORT
STAT 07a
Multi- State Less: Total Taxable TotalFiscal Residential Commercial Industrial Agricultural Family Other Personal Assessed Tax Exempt Assessed DirectYear Property Property Property Property Property Property Property Property Property Value1 Tax Rate2
2010 6,183,791,200 5,076,738,700 1,416,851,000 17,655,800 1,950,129,800 408,719,700 1,289,759,368 224,083,430 (2,976,597,235) 13,591,131,763 2.655 2011 5,602,394,800 4,703,084,000 1,336,953,900 16,824,900 1,661,765,100 327,026,900 1,283,524,972 234,522,057 (2,802,653,484) 12,363,443,145 3.108 2012 4,852,961,650 4,445,693,500 1,261,413,600 14,924,100 1,558,869,320 285,627,550 1,243,538,893 289,054,941 (2,731,089,096) 11,220,994,458 3.455 2013 4,347,652,050 4,571,650,390 1,332,641,600 14,709,100 1,539,990,350 285,056,700 1,260,086,574 204,075,290 (2,929,053,512) 10,626,808,542 3.633 2014 4,723,071,200 4,554,718,200 1,488,254,587 15,112,600 1,607,530,000 291,666,300 1,406,093,783 179,594,462 (2,754,504,427) 11,511,536,705 3.431 2015 5,288,028,300 4,701,223,000 1,588,559,000 15,345,400 1,758,525,469 297,250,610 1,500,184,463 191,536,703 (2,821,495,063) 12,519,157,882 3.248 2016 5,907,853,000 4,866,470,850 1,846,536,200 11,225,700 1,945,418,780 327,284,800 1,574,366,919 198,268,015 (2,950,562,693) 13,726,861,571 3.068 2017 7,232,250,900 5,423,073,180 2,268,423,800 9,521,100 2,540,831,630 360,760,600 2,052,114,883 194,650,515 (5,217,462,317) 14,864,164,291 2.883 2018 8,242,550,000 5,802,942,800 2,368,213,400 9,971,900 2,886,706,420 355,233,600 2,211,167,312 174,762,116 (5,310,267,161) 16,741,280,387 2.604 2019 8,935,028,300 6,366,257,820 2,507,643,000 9,989,500 3,156,259,700 384,685,900 2,443,149,198 191,169,905 (5,535,572,783) 18,458,610,540 2.543
1 Washington State law requires all property be assessed at 100% of its true and fair market value.2 Tax rates are per $1,000 of assessed value. Detail of tax rates can be found in Stat 7c.
Source: Snohomish County Assessor's Office.
TAXABLE ASSESSED VALUE AND ESTIMATED ACTUAL VALUE OF PROPERTYLAST TEN FISCAL YEARS
-
5,000
10,000
15,000
20,000
2010 2011 2012 2013 2014 2015 2016 2017 2018 2019
Annual Taxable Assessed Value - City of Everett(in millions)

CITY OF EVERETT STATISTICAL SECTION
2019 COMPREHENSIVE ANNUAL FINANCIAL REPORT PAGE 173
STAT 07b
Fiscal Year Total Tax Assessor's Adjusted TotalEnded Levy for Certification Tax Levy for Percentage of Collections in Percentage of
December 31 Fiscal Year Adjustments Fiscal Year Amount Adjusted Levy Subsequent Years Amount Adjusted Levy2010 36,088,548 (250,185) 35,838,363 35,170,678 98.1% 567,630 35,738,308 99.7%2011 38,420,299 (119,038) 38,301,262 37,596,649 98.2% 681,513 38,278,162 99.9%2012 38,612,025 (23,188) 38,588,836 38,084,348 98.7% 522,526 38,606,874 100.0%2013 39,497,033 (217,315) 39,279,717 38,046,225 96.9% 331,689 38,377,914 97.7%2014 40,662,855 (108,542) 40,554,314 38,705,330 95.4% 568,224 39,273,554 96.8%2015 42,111,176 (83,126) 42,028,050 39,930,797 95.0% 525,449 40,456,246 96.3%2016 42,854,301 (89,874) 42,764,427 41,522,111 97.1% 514,217 42,036,328 98.3%2017 43,595,841 (80,460) 43,515,380 42,190,879 97.0% 550,403 42,741,282 98.2%2018 46,945,140 (100,365) 46,844,775 42,936,684 91.7% 398,931 43,335,615 92.5%2019 47,600,138 - 47,600,138 46,348,655 97.4% - 46,348,655 97.4%
Source: Snohomish County Assessor's Office.
PROPERTY TAX LEVIES AND COLLECTIONSLAST TEN FISCAL YEARS
Total Collections to DateCollected within the
Fiscal year of the Levy
30,000,000
40,000,000
2010 2011 2012 2013 2014 2015 2016 2017 2018 2019
Adjusted Total Tax Levy Amount Collected within Fiscal Year
Comparison of Amount Levied to AmountCollected within Fiscal Year
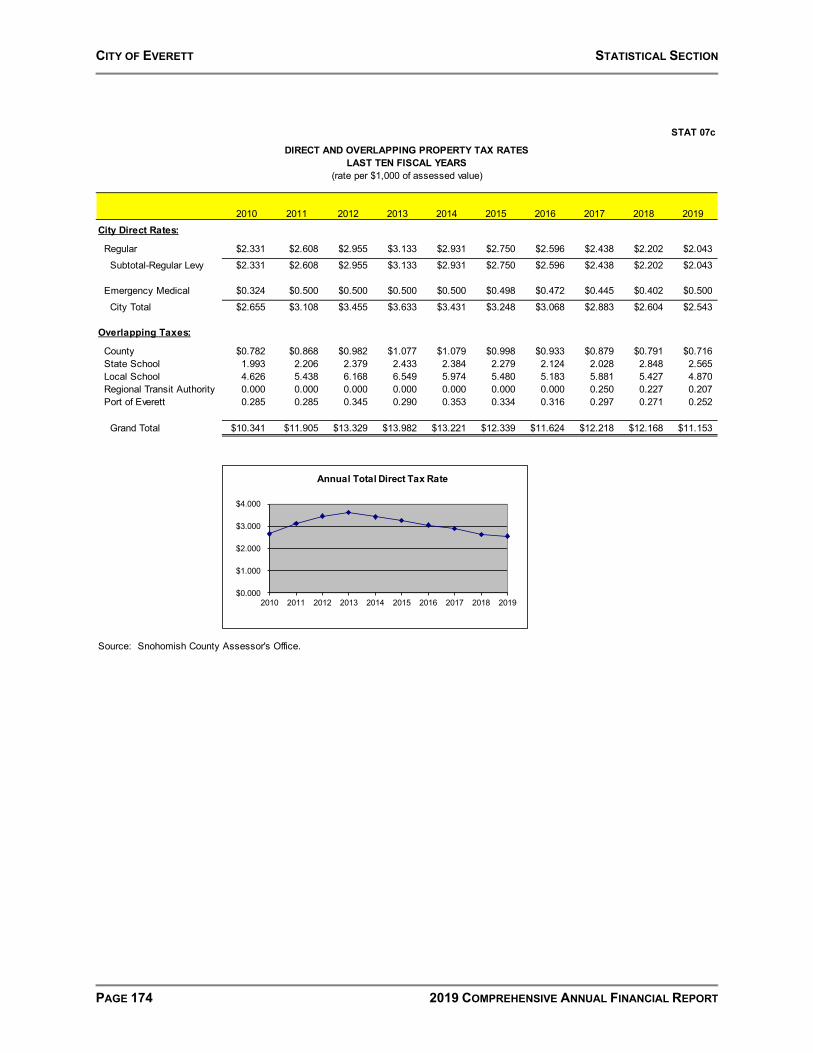
CITY OF EVERETT STATISTICAL SECTION
PAGE 174 2019 COMPREHENSIVE ANNUAL FINANCIAL REPORT
STAT 07c
2010 2011 2012 2013 2014 2015 2016 2017 2018 2019City Direct Rates:
Regular $2.331 $2.608 $2.955 $3.133 $2.931 $2.750 $2.596 $2.438 $2.202 $2.043 Subtotal-Regular Levy $2.331 $2.608 $2.955 $3.133 $2.931 $2.750 $2.596 $2.438 $2.202 $2.043
Emergency Medical $0.324 $0.500 $0.500 $0.500 $0.500 $0.498 $0.472 $0.445 $0.402 $0.500 City Total $2.655 $3.108 $3.455 $3.633 $3.431 $3.248 $3.068 $2.883 $2.604 $2.543
Overlapping Taxes:
County $0.782 $0.868 $0.982 $1.077 $1.079 $0.998 $0.933 $0.879 $0.791 $0.716 State School 1.993 2.206 2.379 2.433 2.384 2.279 2.124 2.028 2.848 2.565 Local School 4.626 5.438 6.168 6.549 5.974 5.480 5.183 5.881 5.427 4.870 Regional Transit Authority 0.000 0.000 0.000 0.000 0.000 0.000 0.000 0.250 0.227 0.207 Port of Everett 0.285 0.285 0.345 0.290 0.353 0.334 0.316 0.297 0.271 0.252
Grand Total $10.341 $11.905 $13.329 $13.982 $13.221 $12.339 $11.624 $12.218 $12.168 $11.153
Source: Snohomish County Assessor's Office.
DIRECT AND OVERLAPPING PROPERTY TAX RATESLAST TEN FISCAL YEARS
(rate per $1,000 of assessed value)
$0.000
$1.000
$2.000
$3.000
$4.000
2010 2011 2012 2013 2014 2015 2016 2017 2018 2019
Annual Total Direct Tax Rate

CITY OF EVERETT STATISTICAL SECTION
2019 COMPREHENSIVE ANNUAL FINANCIAL REPORT PAGE 175
STAT 07d
Taxable TaxableAssessed % of Total City Assessed % of Total City
Taxpayer Type of Business Valuation (AV)2 Rank Taxable AV Valuation (AV)1 Rank Taxable AV
The Boeing Co Aerospace 1,475,877,986$ 1 10.86% 3,351,322,004$ 1 18.16%Fluke Electronics Corp Electronics 92,864,587 4 0.68% 85,119,241 2 0.46%Prime Catalina Merrill Creek LLC Apartments 74,577,272 3 0.40%Strata Fulton LLC Apartments 74,424,100 4 0.40%Brixton Everett LLC Everett Mall/Property Invst 73,358,500 5 0.40%Providence Health & Services Healthcare 71,448,200 5 0.53% 72,500,581 6 0.39%Standard JSP Olin LLC Apartments 66,853,500 7 0.36%Breit Ta Mf Walden Pond LLC Apartments 62,997,000 8 0.34%Frontier Communications NW Telecommunications 62,060,490 9 0.34%Greystar Apartments 59,741,000 10 0.32%Kimberly-Clark Corporation Pulp & Paper 162,274,200 2 1.19%Verizon Telecommunications 159,035,794 3 1.17%Steadfast Properties & Dev Development 66,156,700 6 0.49%Stockpot Inc Food Manufacturing 58,010,102 7 0.43%Millington Apartments LLC Apartments 55,605,000 8 0.41%Stephanus Paul Development 43,420,000 9 0.32%GRE Fulton's Holdings LLC Development 43,218,200 10 0.32%
2,227,910,769$ 16.40% 3,982,953,688$ 21.57%
1 2018 assessed value for 2019 taxes- $18,458,610,5402 2009 assessed value for 2010 taxes - $13,591,131,763
Source: Snohomish County Assessor's Office
2010 2019
PRINCIPAL PROPERTY TAX PAYERSCURRENT YEAR AND NINE YEARS AGO
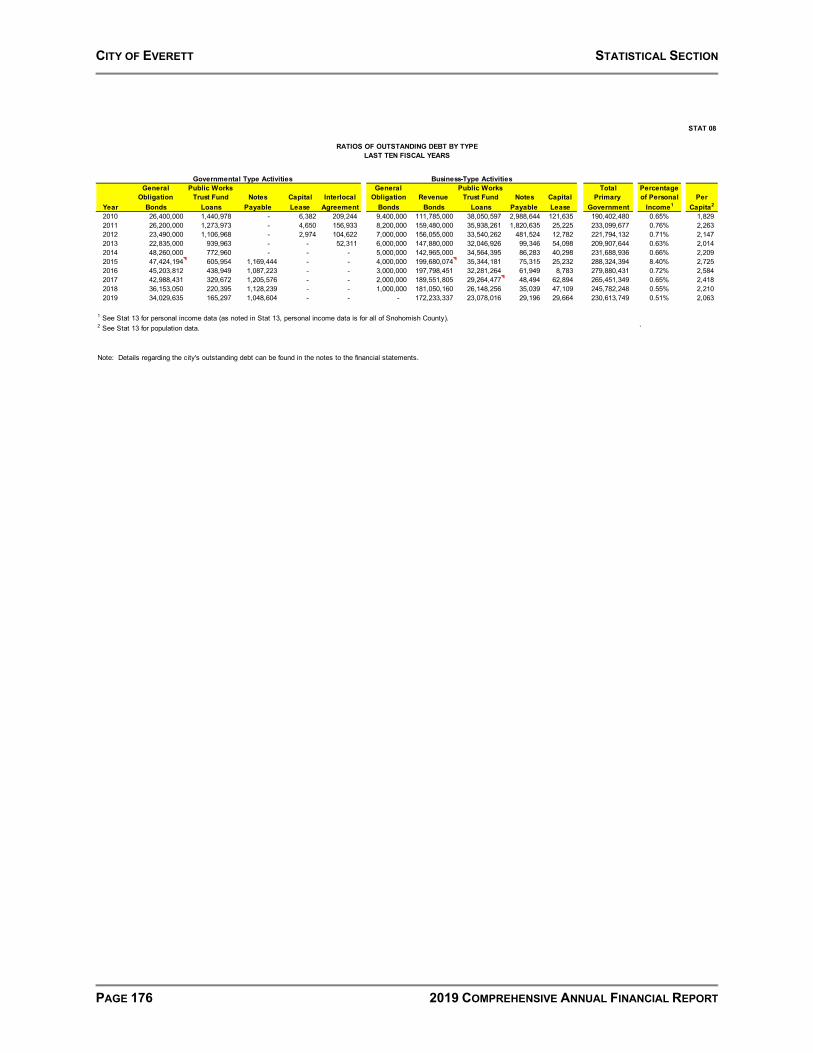
CITY OF EVERETT STATISTICAL SECTION
PAGE 176 2019 COMPREHENSIVE ANNUAL FINANCIAL REPORT
STAT 08
General Public Works General Public Works Total PercentageObligation Trust Fund Notes Capital Interlocal Obligation Revenue Trust Fund Notes Capital Primary of Personal Per
Year Bonds Loans Payable Lease Agreement Bonds Bonds Loans Payable Lease Government Income1 Capita2
2010 26,400,000 1,440,978 - 6,382 209,244 9,400,000 111,785,000 38,050,597 2,988,644 121,635 190,402,480 0.65% 1,829 2011 26,200,000 1,273,973 - 4,650 156,933 8,200,000 159,480,000 35,938,261 1,820,635 25,225 233,099,677 0.76% 2,263 2012 23,490,000 1,106,968 - 2,974 104,622 7,000,000 156,055,000 33,540,262 481,524 12,782 221,794,132 0.71% 2,147 2013 22,835,000 939,963 - - 52,311 6,000,000 147,880,000 32,046,926 99,346 54,098 209,907,644 0.63% 2,014 2014 48,260,000 772,960 - - - 5,000,000 142,965,000 34,564,395 86,283 40,298 231,688,936 0.66% 2,209 2015 47,424,194 605,954 1,169,444 - - 4,000,000 199,680,074 35,344,181 75,315 25,232 288,324,394 8.40% 2,725 2016 45,203,812 438,949 1,087,223 - - 3,000,000 197,798,451 32,281,264 61,949 8,783 279,880,431 0.72% 2,584 2017 42,988,431 329,672 1,205,576 - - 2,000,000 189,551,805 29,264,477 48,494 62,894 265,451,349 0.65% 2,418 2018 36,153,050 220,395 1,128,239 - - 1,000,000 181,050,160 26,148,256 35,039 47,109 245,782,248 0.55% 2,210 2019 34,029,635 165,297 1,048,604 - - - 172,233,337 23,078,016 29,196 29,664 230,613,749 0.51% 2,063
1 See Stat 13 for personal income data (as noted in Stat 13, personal income data is for all of Snohomish County).2 See Stat 13 for population data. `
Note: Details regarding the city's outstanding debt can be found in the notes to the financial statements.
RATIOS OF OUTSTANDING DEBT BY TYPELAST TEN FISCAL YEARS
Governmental Type Activities Business-Type Activities
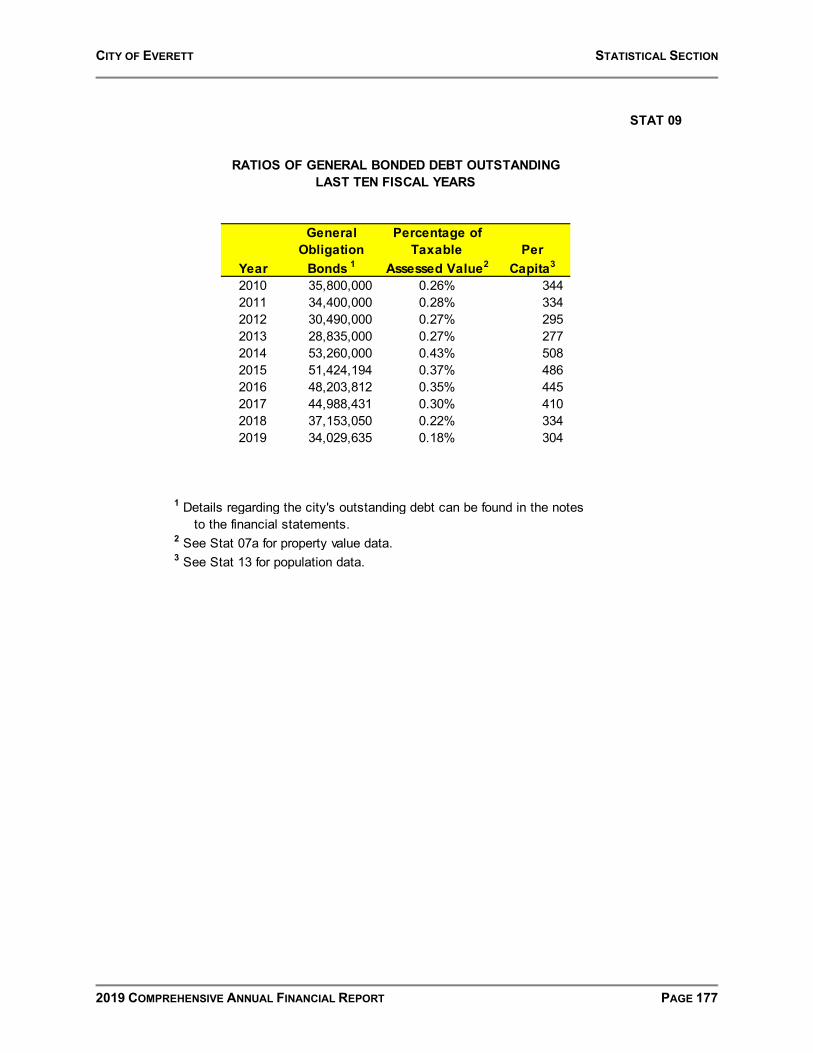
CITY OF EVERETT STATISTICAL SECTION
2019 COMPREHENSIVE ANNUAL FINANCIAL REPORT PAGE 177
STAT 09
General Percentage ofObligation Taxable Per
Year Bonds 1 Assessed Value2 Capita3
2010 35,800,000 0.26% 344 2011 34,400,000 0.28% 334 2012 30,490,000 0.27% 295 2013 28,835,000 0.27% 277 2014 53,260,000 0.43% 508 2015 51,424,194 0.37% 486 2016 48,203,812 0.35% 445 2017 44,988,431 0.30% 410 2018 37,153,050 0.22% 334 2019 34,029,635 0.18% 304
1 Details regarding the city's outstanding debt can be found in the notes to the financial statements.2 See Stat 07a for property value data.3 See Stat 13 for population data.
RATIOS OF GENERAL BONDED DEBT OUTSTANDINGLAST TEN FISCAL YEARS
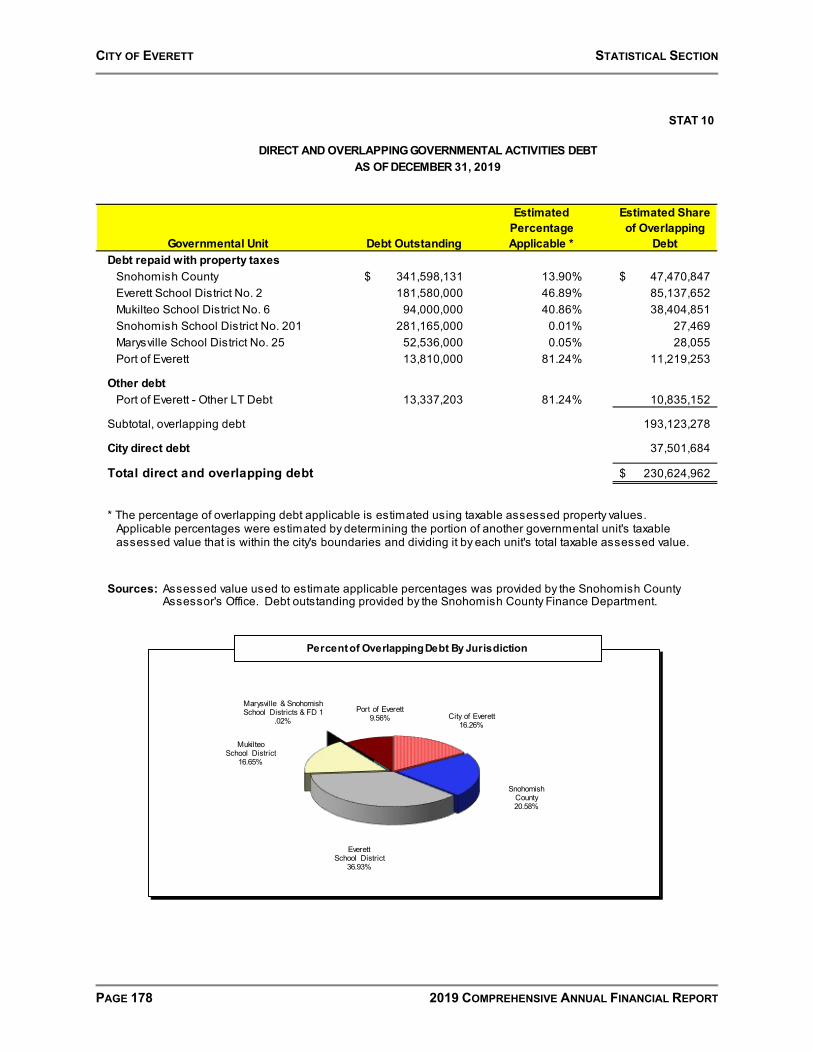
CITY OF EVERETT STATISTICAL SECTION
PAGE 178 2019 COMPREHENSIVE ANNUAL FINANCIAL REPORT
STAT 10
DIRECT AND OVERLAPPING GOVERNMENTAL ACTIVITIES DEBTAS OF DECEMBER 31, 2019
Governmental Unit Debt Outstanding
Estimated Percentage Applicable *
Estimated Share of Overlapping
DebtDebt repaid with property taxes Snohomish County 341,598,131$ 13.90% 47,470,847$ Everett School District No. 2 181,580,000 46.89% 85,137,652 Mukilteo School District No. 6 94,000,000 40.86% 38,404,851 Snohomish School District No. 201 281,165,000 0.01% 27,469 Marysville School District No. 25 52,536,000 0.05% 28,055 Port of Everett 13,810,000 81.24% 11,219,253
Other debt Port of Everett - Other LT Debt 13,337,203 81.24% 10,835,152
Subtotal, overlapping debt 193,123,278
City direct debt 37,501,684
Total direct and overlapping debt 230,624,962$
* The percentage of overlapping debt applicable is estimated using taxable assessed property values. Applicable percentages were estimated by determining the portion of another governmental unit's taxable assessed value that is within the city's boundaries and dividing it by each unit's total taxable assessed value.
Sources: Assessed value used to estimate applicable percentages was provided by the Snohomish County Assessor's Office. Debt outstanding provided by the Snohomish County Finance Department.
City of Everett16.26%
SnohomishCounty20.58%
EverettSchool District
36.93%
MukilteoSchool District
16.65%
Marysville & Snohomish School Districts & FD 1
.02%Port of Everett
9.56%
Percent of Overlapping Debt By Jurisdiction

CITY OF EVERETT STATISTICAL SECTION
2019 COMPREHENSIVE ANNUAL FINANCIAL REPORT PAGE 179
STAT 11
Non-voted debt limit (1.5% of assessed
value)
Voted debt limit (1.0% of assessed
value)Assessed Value 18,458,610,540$ 18,458,610,540$ Debt limit 276,879,158 184,586,105 Debt applicable to limit: Total general obligation debt 30,443,900 - Less: Amount set aside for - - repayment of GO debt Total net debt applicable to limit 30,443,900 - Legal debt margin 246,435,258$ 184,586,105$
2010 2011 2012 2013 2014 2015 2016 2017 2018 2019
Non-voted debt limit * 203,866,976 185,451,647 168,314,917 159,402,128 187,787,368 205,902,924 205,902,924 222,962,464 251,119,206 276,879,158Total net debt applicable to limit 37,456,604 35,835,556 31,704,563 40,140,901 54,032,960 53,199,592 49,026,172 45,890,248 37,938,634 30,443,900Legal debt margin 166,410,372 149,616,091 136,610,354 119,261,227 133,754,408 152,703,332 156,876,752 177,072,216 177,072,216 246,435,258
Total net debt applicable to the limit as a % of debt limit 18.37% 19.32% 18.84% 25.18% 28.77% 25.84% 23.81% 20.58% 15.11% 11.00%
Voted debt limit * 135,911,318 123,634,431 112,209,945 106,268,085 125,191,579 137,268,616 137,268,616 148,641,643 167,412,804 184,586,105 Total net debt applicable to limit - - - - - - - - - - Legal debt margin 135,911,318 123,634,431 112,209,945 106,268,085 125,191,579 137,268,616 137,268,616 148,641,643 167,412,804 184,586,105
Total net debt applicable to the limit as a % of debt limit 0.00% 0.00% 0.00% 0.00% 0.00% 0.00% 0.00% 0.00% 0.00% 0.00%
* The assessed values for the current tax year information is used for the debt limit calculation.
LEGAL DEBT MARGIN INFORMATIONLAST TEN FISCAL YEARS
Legal Debt Margin Calculation for Fiscal Year 2019
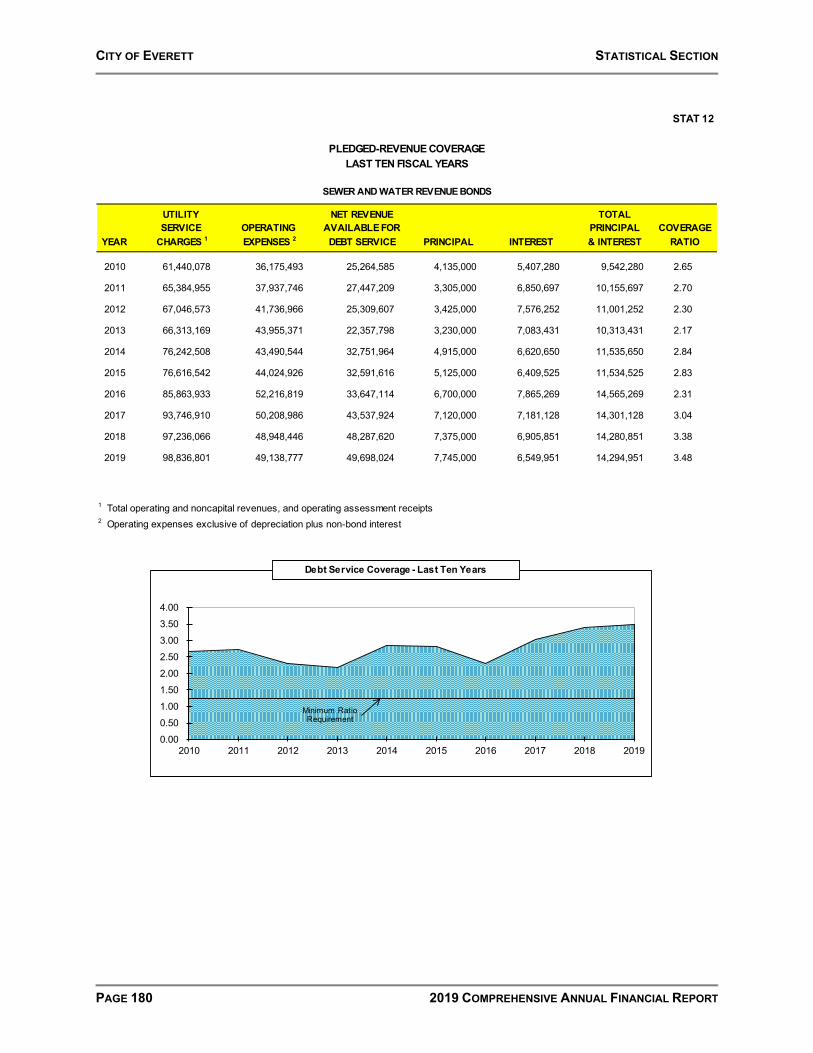
CITY OF EVERETT STATISTICAL SECTION
PAGE 180 2019 COMPREHENSIVE ANNUAL FINANCIAL REPORT
STAT 12
PLEDGED-REVENUE COVERAGELAST TEN FISCAL YEARS
SEWER AND WATER REVENUE BONDS
UTILITY NET REVENUE TOTALSERVICE OPERATING AVAILABLE FOR PRINCIPAL COVERAGE
YEAR CHARGES 1 EXPENSES 2 DEBT SERVICE PRINCIPAL INTEREST & INTEREST RATIO
2010 61,440,078 36,175,493 25,264,585 4,135,000 5,407,280 9,542,280 2.65
2011 65,384,955 37,937,746 27,447,209 3,305,000 6,850,697 10,155,697 2.70
2012 67,046,573 41,736,966 25,309,607 3,425,000 7,576,252 11,001,252 2.30
2013 66,313,169 43,955,371 22,357,798 3,230,000 7,083,431 10,313,431 2.17
2014 76,242,508 43,490,544 32,751,964 4,915,000 6,620,650 11,535,650 2.84
2015 76,616,542 44,024,926 32,591,616 5,125,000 6,409,525 11,534,525 2.83
2016 85,863,933 52,216,819 33,647,114 6,700,000 7,865,269 14,565,269 2.31
2017 93,746,910 50,208,986 43,537,924 7,120,000 7,181,128 14,301,128 3.04
2018 97,236,066 48,948,446 48,287,620 7,375,000 6,905,851 14,280,851 3.38
2019 98,836,801 49,138,777 49,698,024 7,745,000 6,549,951 14,294,951 3.48
1 Total operating and noncapital revenues, and operating assessment receipts2 Operating expenses exclusive of depreciation plus non-bond interest
0.000.501.001.502.002.503.003.504.00
2010 2011 2012 2013 2014 2015 2016 2017 2018 2019
Debt Service Coverage - Last Ten Years
Minimum Ratio Requirement

CITY OF EVERETT STATISTICAL SECTION
2019 COMPREHENSIVE ANNUAL FINANCIAL REPORT PAGE 181
STAT 13Page 1 of 2
Personal
City of Income (2) Per CapitaEverett (thousands Personal Unemployment Median School
Year Population (1) of dollars) Income (2) Rate (3) Age (4) Enrollment (5)
2010 104,100 29,448,610 * 42,972 * 9.8% 35.8 19,0492011 103,100 30,597,337 * 44,052 * 8.2% 37.3 18,8562012 103,300 31,266,357 43,281 6.3% 37.8 18,6142013 104,200 33,570,183 45,796 5.3% 38.0 18,7452014 104,900 34,858,553 46,733 4.8% 38.3 19,1572015 105,800 34,156,348 44,967 5.0% 38.6 19,6062016 108,300 38,615,423 49,226 4.6% 37.8 19,9862017 109,800 41,140,482 51,339 3.9% 38.0 20,2272018 111,200 44,540,523 54,576 3.8% 37.9 20,4192019 111,800 45,542,887 55,888 3.0% 37.8 20,948
Sources:
(1) Washington State Office of Financial Management, Forecasting Division(2) United States Bureau of Economic Analysis. Figures are for all of Snohomish County.(3) Washington State Employment Security Department. Figures are for all of Snohomish County.(4) Census Reporter(5) Everett School District* City calculated estimates
DEMOGRAPHIC AND ECONOMIC STATISTICSLAST TEN FISCAL YEARS

CITY OF EVERETT STATISTICAL SECTION
PAGE 182 2019 COMPREHENSIVE ANNUAL FINANCIAL REPORT
STAT 13Page 2 of 2
DEMOGRAPHIC AND ECONOMIC STATISTICSLAST TEN FISCAL YEARS
80,000
85,000
90,000
95,000
100,000
105,000
110,000
115,000
2010 2011 2012 2013 2014 2015 2016 2017 2018 2019
0.0%
2.0%
4.0%
6.0%
8.0%
10.0%
12.0%
2010 2011 2012 2013 2014 2015 2016 2017 2018 2019
Unemployment Rate
City of Everett Population

CITY OF EVERETT STATISTICAL SECTION
2019 COMPREHENSIVE ANNUAL FINANCIAL REPORT PAGE 183
STAT 14
Percentage Percentageof Total City of Total City
Employer Employees Rank Employment Employees Rank Employment
The Boeing Company 32,000 1 36.36% 35,000 1 31.46%Providence Regional Medical Center 3,200 3 3.64% 4,906 2 4.41%State of Washington 2,800 5 3.18% 3,000 3 2.70%Naval Station Everett 6,000 2 6.82% 2,900 4 2.61%The Everett Clinic 1,900 6 2.16% 2,871 5 2.58%Snohomish County Government 2,965 4 3.37% 2,759 6 2.48%Everett School District 1,700 7 1.93% 2,443 7 2.20%Fluke Corporation (Fortive) 1,200 8 1.08%City of Everett 1,198 9 1.08%Snohomish PUD 1,004 10 0.90%Verizon Northwest 1,500 8 1.70%Aviation Technical Services 1,400 9 1.59%Zumiez 1,400 10 1.59%
54,865 62.35% 57,281 51.50%
Source: Economic Alliance Snohomish County - Top 50 Snohomish County Employers* 2018 is the most current data available at time of printing.
PRINCIPAL EMPLOYERSCURRENT YEAR AND NINE YEARS AGO
2009 2018 *
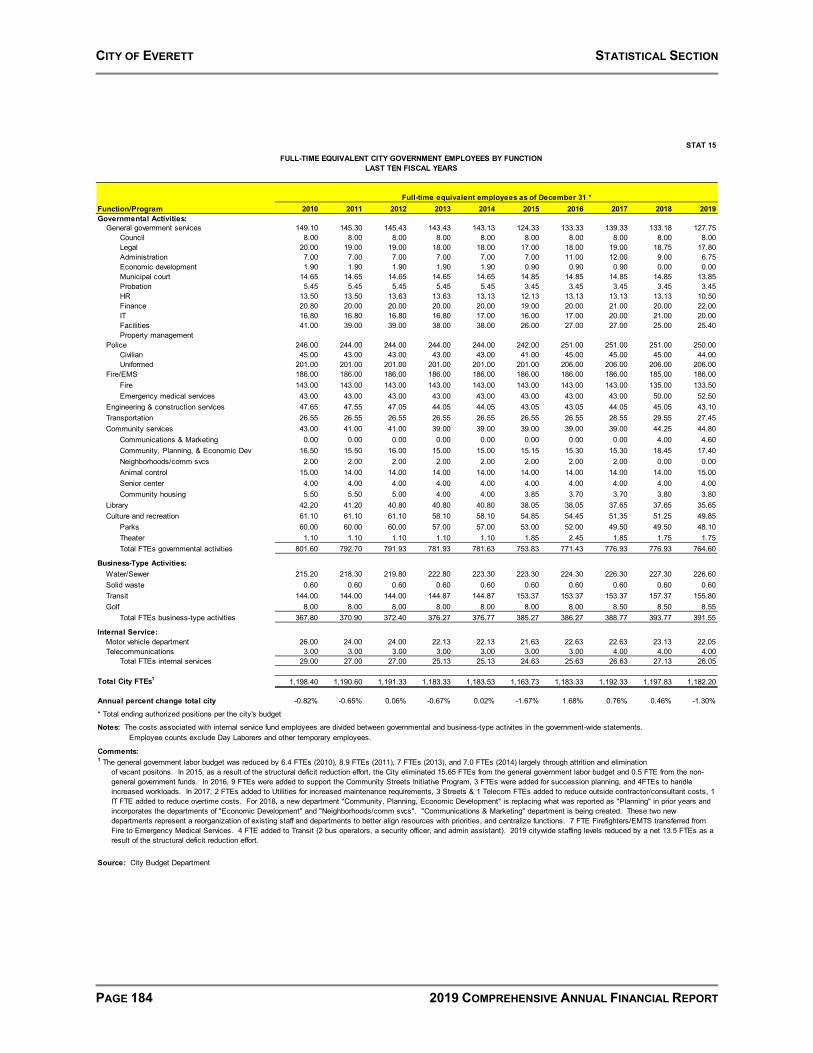
CITY OF EVERETT STATISTICAL SECTION
PAGE 184 2019 COMPREHENSIVE ANNUAL FINANCIAL REPORT
STAT 15
Function/Program 2010 2011 2012 2013 2014 2015 2016 2017 2018 2019Governmental Activities:
General government services 149.10 145.30 145.43 143.43 143.13 124.33 133.33 139.33 133.18 127.75Council 8.00 8.00 8.00 8.00 8.00 8.00 8.00 8.00 8.00 8.00Legal 20.00 19.00 19.00 18.00 18.00 17.00 18.00 19.00 18.75 17.80Administration 7.00 7.00 7.00 7.00 7.00 7.00 11.00 12.00 9.00 6.75Economic development 1.90 1.90 1.90 1.90 1.90 0.90 0.90 0.90 0.00 0.00Municipal court 14.65 14.65 14.65 14.65 14.65 14.85 14.85 14.85 14.85 13.85Probation 5.45 5.45 5.45 5.45 5.45 3.45 3.45 3.45 3.45 3.45HR 13.50 13.50 13.63 13.63 13.13 12.13 13.13 13.13 13.13 10.50Finance 20.80 20.00 20.00 20.00 20.00 19.00 20.00 21.00 20.00 22.00IT 16.80 16.80 16.80 16.80 17.00 16.00 17.00 20.00 21.00 20.00Facilities 41.00 39.00 39.00 38.00 38.00 26.00 27.00 27.00 25.00 25.40Property management
Police 246.00 244.00 244.00 244.00 244.00 242.00 251.00 251.00 251.00 250.00Civilian 45.00 43.00 43.00 43.00 43.00 41.00 45.00 45.00 45.00 44.00Uniformed 201.00 201.00 201.00 201.00 201.00 201.00 206.00 206.00 206.00 206.00
Fire/EMS 186.00 186.00 186.00 186.00 186.00 186.00 186.00 186.00 185.00 186.00Fire 143.00 143.00 143.00 143.00 143.00 143.00 143.00 143.00 135.00 133.50Emergency medical services 43.00 43.00 43.00 43.00 43.00 43.00 43.00 43.00 50.00 52.50
Engineering & construction services 47.65 47.55 47.05 44.05 44.05 43.05 43.05 44.05 45.05 43.10Transportation 26.55 26.55 26.55 26.55 26.55 26.55 26.55 28.55 29.55 27.45Community services 43.00 41.00 41.00 39.00 39.00 39.00 39.00 39.00 44.25 44.80
Communications & Marketing 0.00 0.00 0.00 0.00 0.00 0.00 0.00 0.00 4.00 4.60Community, Planning, & Economic Dev 16.50 15.50 16.00 15.00 15.00 15.15 15.30 15.30 18.45 17.40Neighborhoods/comm svcs 2.00 2.00 2.00 2.00 2.00 2.00 2.00 2.00 0.00 0.00Animal control 15.00 14.00 14.00 14.00 14.00 14.00 14.00 14.00 14.00 15.00Senior center 4.00 4.00 4.00 4.00 4.00 4.00 4.00 4.00 4.00 4.00Community housing 5.50 5.50 5.00 4.00 4.00 3.85 3.70 3.70 3.80 3.80
Library 42.20 41.20 40.80 40.80 40.80 38.05 38.05 37.65 37.65 35.65Culture and recreation 61.10 61.10 61.10 58.10 58.10 54.85 54.45 51.35 51.25 49.85
Parks 60.00 60.00 60.00 57.00 57.00 53.00 52.00 49.50 49.50 48.10Theater 1.10 1.10 1.10 1.10 1.10 1.85 2.45 1.85 1.75 1.75Total FTEs governmental activities 801.60 792.70 791.93 781.93 781.63 753.83 771.43 776.93 776.93 764.60
Business-Type Activities:Water/Sewer 215.20 218.30 219.80 222.80 223.30 223.30 224.30 226.30 227.30 226.60Solid waste 0.60 0.60 0.60 0.60 0.60 0.60 0.60 0.60 0.60 0.60Transit 144.00 144.00 144.00 144.87 144.87 153.37 153.37 153.37 157.37 155.80Golf 8.00 8.00 8.00 8.00 8.00 8.00 8.00 8.50 8.50 8.55
Total FTEs business-type activities 367.80 370.90 372.40 376.27 376.77 385.27 386.27 388.77 393.77 391.55
Internal Service:Motor vehicle department 26.00 24.00 24.00 22.13 22.13 21.63 22.63 22.63 23.13 22.05Telecommunications 3.00 3.00 3.00 3.00 3.00 3.00 3.00 4.00 4.00 4.00
Total FTEs internal services 29.00 27.00 27.00 25.13 25.13 24.63 25.63 26.63 27.13 26.05
Total City FTEs1 1,198.40 1,190.60 1,191.33 1,183.33 1,183.53 1,163.73 1,183.33 1,192.33 1,197.83 1,182.20
Annual percent change total city -0.82% -0.65% 0.06% -0.67% 0.02% -1.67% 1.68% 0.76% 0.46% -1.30%
* Total ending authorized positions per the city's budget
Notes: The costs associated with internal service fund employees are divided between governmental and business-type activites in the government-wide statements. Employee counts exclude Day Laborers and other temporary employees.
Comments:1 The general government labor budget was reduced by 6.4 FTEs (2010), 8.9 FTEs (2011), 7 FTEs (2013), and 7.0 FTEs (2014) largely through attrition and elimination
Source: City Budget Department
FULL-TIME EQUIVALENT CITY GOVERNMENT EMPLOYEES BY FUNCTIONLAST TEN FISCAL YEARS
Full-time equivalent employees as of December 31 *
of vacant positons. In 2015, as a result of the structural deficit reduction effort, the City eliminated 15.65 FTEs from the general government labor budget and 0.5 FTE from the non-general government funds. In 2016, 9 FTEs were added to support the Community Streets Initiative Program, 3 FTEs were added for succession planning, and 4FTEs to handle increased workloads. In 2017, 2 FTEs added to Utilities for increased maintenance requirements, 3 Streets & 1 Telecom FTEs added to reduce outside contractor/consultant costs, 1 IT FTE added to reduce overtime costs. For 2018, a new department "Community, Planning, Economic Development" is replacing what was reported as "Planning" in prior years and incorporates the departments of "Economic Development" and "Neighborhoods/comm svcs". "Communications & Marketing" department is being created. These two new departments represent a reorganization of existing staff and departments to better align resources with priorities, and centralize functions. 7 FTE Firefighters/EMTS transferred from Fire to Emergency Medical Services. 4 FTE added to Transit (2 bus operators, a security officer, and admin assistant). 2019 citywide staffing levels reduced by a net 13.5 FTEs as a result of the structural deficit reduction effort.
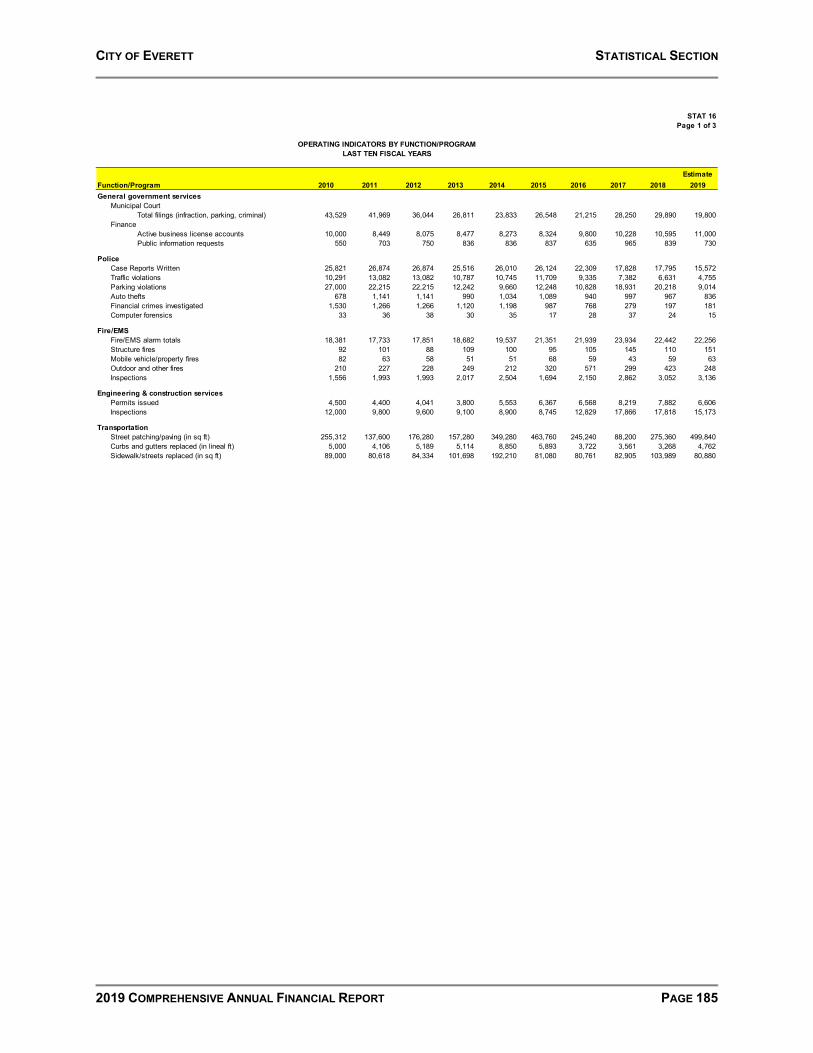
CITY OF EVERETT STATISTICAL SECTION
2019 COMPREHENSIVE ANNUAL FINANCIAL REPORT PAGE 185
STAT 16Page 1 of 3
EstimateFunction/Program 2010 2011 2012 2013 2014 2015 2016 2017 2018 2019General government services
Municipal CourtTotal filings (infraction, parking, criminal) 43,529 41,969 36,044 26,811 23,833 26,548 21,215 28,250 29,890 19,800
FinanceActive business license accounts 10,000 8,449 8,075 8,477 8,273 8,324 9,800 10,228 10,595 11,000Public information requests 550 703 750 836 836 837 635 965 839 730
PoliceCase Reports Written 25,821 26,874 26,874 25,516 26,010 26,124 22,309 17,828 17,795 15,572Traffic violations 10,291 13,082 13,082 10,787 10,745 11,709 9,335 7,382 6,631 4,755Parking violations 27,000 22,215 22,215 12,242 9,660 12,248 10,828 18,931 20,218 9,014Auto thefts 678 1,141 1,141 990 1,034 1,089 940 997 967 836Financial crimes investigated 1,530 1,266 1,266 1,120 1,198 987 768 279 197 181Computer forensics 33 36 38 30 35 17 28 37 24 15
Fire/EMSFire/EMS alarm totals 18,381 17,733 17,851 18,682 19,537 21,351 21,939 23,934 22,442 22,256Structure fires 92 101 88 109 100 95 105 145 110 151Mobile vehicle/property fires 82 63 58 51 51 68 59 43 59 63Outdoor and other fires 210 227 228 249 212 320 571 299 423 248Inspections 1,556 1,993 1,993 2,017 2,504 1,694 2,150 2,862 3,052 3,136
Engineering & construction servicesPermits issued 4,500 4,400 4,041 3,800 5,553 6,367 6,568 8,219 7,882 6,606Inspections 12,000 9,800 9,600 9,100 8,900 8,745 12,829 17,866 17,818 15,173
TransportationStreet patching/paving (in sq ft) 255,312 137,600 176,280 157,280 349,280 463,760 245,240 88,200 275,360 499,840Curbs and gutters replaced (in lineal ft) 5,000 4,106 5,189 5,114 8,850 5,893 3,722 3,561 3,268 4,762Sidewalk/streets replaced (in sq ft) 89,000 80,618 84,334 101,698 192,210 81,080 80,761 82,905 103,989 80,880
LAST TEN FISCAL YEARSOPERATING INDICATORS BY FUNCTION/PROGRAM
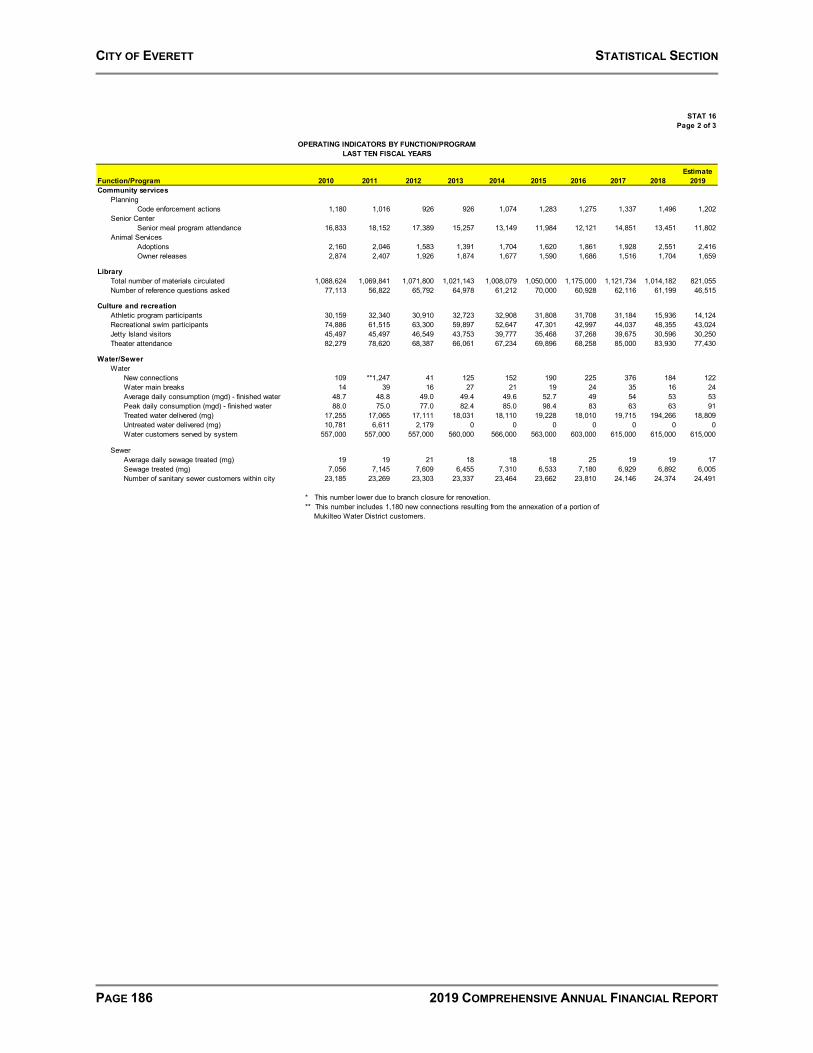
CITY OF EVERETT STATISTICAL SECTION
PAGE 186 2019 COMPREHENSIVE ANNUAL FINANCIAL REPORT
STAT 16Page 2 of 3
EstimateFunction/Program 2010 2011 2012 2013 2014 2015 2016 2017 2018 2019Community services
PlanningCode enforcement actions 1,180 1,016 926 926 1,074 1,283 1,275 1,337 1,496 1,202
Senior CenterSenior meal program attendance 16,833 18,152 17,389 15,257 13,149 11,984 12,121 14,851 13,451 11,802
Animal ServicesAdoptions 2,160 2,046 1,583 1,391 1,704 1,620 1,861 1,928 2,551 2,416Owner releases 2,874 2,407 1,926 1,874 1,677 1,590 1,686 1,516 1,704 1,659
LibraryTotal number of materials circulated 1,088,624 1,069,841 1,071,800 1,021,143 1,008,079 1,050,000 1,175,000 1,121,734 1,014,182 821,055Number of reference questions asked 77,113 56,822 65,792 64,978 61,212 70,000 60,928 62,116 61,199 46,515
Culture and recreationAthletic program participants 30,159 32,340 30,910 32,723 32,908 31,808 31,708 31,184 15,936 14,124Recreational swim participants 74,886 61,515 63,300 59,897 52,647 47,301 42,997 44,037 48,355 43,024Jetty Island visitors 45,497 45,497 46,549 43,753 39,777 35,468 37,268 39,675 30,596 30,250Theater attendance 82,279 78,620 68,387 66,061 67,234 69,896 68,258 85,000 83,930 77,430
Water/SewerWater
New connections 109 **1,247 41 125 152 190 225 376 184 122Water main breaks 14 39 16 27 21 19 24 35 16 24Average daily consumption (mgd) - finished water 48.7 48.8 49.0 49.4 49.6 52.7 49 54 53 53Peak daily consumption (mgd) - finished water 88.0 75.0 77.0 82.4 85.0 98.4 83 63 63 91Treated water delivered (mg) 17,255 17,065 17,111 18,031 18,110 19,228 18,010 19,715 194,266 18,809Untreated water delivered (mg) 10,781 6,611 2,179 0 0 0 0 0 0 0Water customers served by system 557,000 557,000 557,000 560,000 566,000 563,000 603,000 615,000 615,000 615,000
SewerAverage daily sewage treated (mg) 19 19 21 18 18 18 25 19 19 17Sewage treated (mg) 7,056 7,145 7,609 6,455 7,310 6,533 7,180 6,929 6,892 6,005Number of sanitary sewer customers within city 23,185 23,269 23,303 23,337 23,464 23,662 23,810 24,146 24,374 24,491
* This number lower due to branch closure for renovation.** This number includes 1,180 new connections resulting from the annexation of a portion of Mukilteo Water District customers.
LAST TEN FISCAL YEARSOPERATING INDICATORS BY FUNCTION/PROGRAM
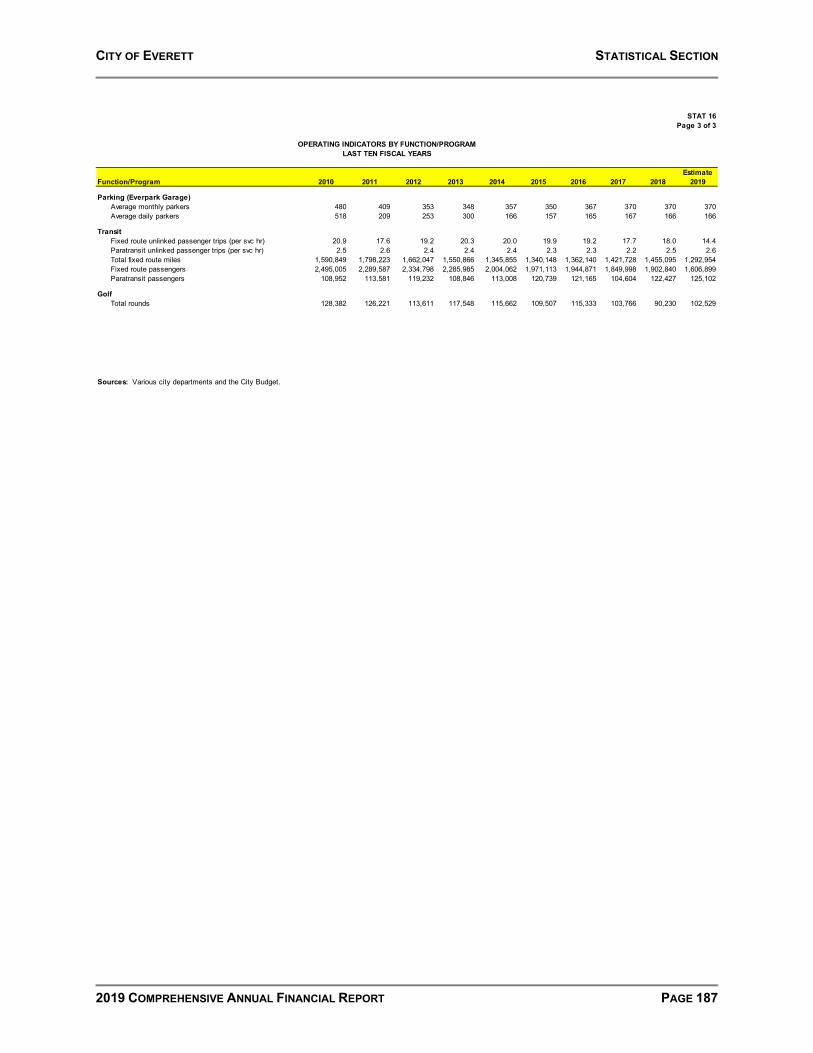
CITY OF EVERETT STATISTICAL SECTION
2019 COMPREHENSIVE ANNUAL FINANCIAL REPORT PAGE 187
STAT 16Page 3 of 3
EstimateFunction/Program 2010 2011 2012 2013 2014 2015 2016 2017 2018 2019
Parking (Everpark Garage)Average monthly parkers 480 409 353 348 357 350 367 370 370 370Average daily parkers 518 209 253 300 166 157 165 167 166 166
TransitFixed route unlinked passenger trips (per svc hr) 20.9 17.6 19.2 20.3 20.0 19.9 19.2 17.7 18.0 14.4Paratransit unlinked passenger trips (per svc hr) 2.5 2.6 2.4 2.4 2.4 2.3 2.3 2.2 2.5 2.6Total fixed route miles 1,590,849 1,798,223 1,662,047 1,550,866 1,345,855 1,340,148 1,362,140 1,421,728 1,455,095 1,292,954Fixed route passengers 2,495,005 2,289,587 2,334,798 2,285,985 2,004,062 1,971,113 1,944,871 1,849,998 1,902,840 1,606,899Paratransit passengers 108,952 113,581 119,232 108,846 113,008 120,739 121,165 104,604 122,427 125,102
GolfTotal rounds 128,382 126,221 113,611 117,548 115,662 109,507 115,333 103,766 90,230 102,529
Sources: Various city departments and the City Budget.
LAST TEN FISCAL YEARSOPERATING INDICATORS BY FUNCTION/PROGRAM
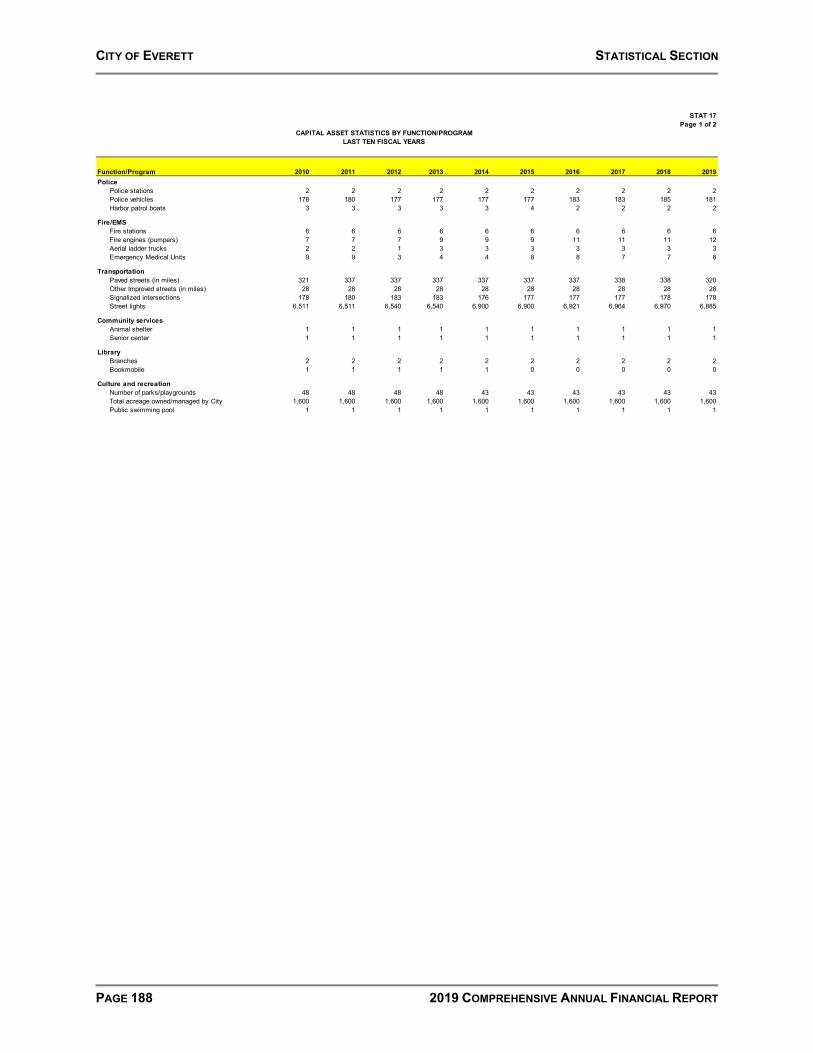
CITY OF EVERETT STATISTICAL SECTION
PAGE 188 2019 COMPREHENSIVE ANNUAL FINANCIAL REPORT
STAT 17Page 1 of 2
Function/Program 2010 2011 2012 2013 2014 2015 2016 2017 2018 2019Police
Police stations 2 2 2 2 2 2 2 2 2 2Police vehicles 178 180 177 177 177 177 183 183 185 181Harbor patrol boats 3 3 3 3 3 4 2 2 2 2
Fire/EMSFire stations 6 6 6 6 6 6 6 6 6 6Fire engines (pumpers) 7 7 7 9 9 9 11 11 11 12Aerial ladder trucks 2 2 1 3 3 3 3 3 3 3Emergency Medical Units 9 9 3 4 4 8 8 7 7 8
TransportationPaved streets (in miles) 321 337 337 337 337 337 337 338 338 320Other Improved streets (in miles) 28 28 28 28 28 28 28 28 28 28Signalized intersections 178 180 183 183 176 177 177 177 178 178Street lights 6,511 6,511 6,540 6,540 6,900 6,900 6,921 6,964 6,970 6,885
Community servicesAnimal shelter 1 1 1 1 1 1 1 1 1 1Senior center 1 1 1 1 1 1 1 1 1 1
LibraryBranches 2 2 2 2 2 2 2 2 2 2Bookmobile 1 1 1 1 1 0 0 0 0 0
Culture and recreationNumber of parks/playgrounds 48 48 48 48 43 43 43 43 43 43Total acreage owned/managed by City 1,600 1,600 1,600 1,600 1,600 1,600 1,600 1,600 1,600 1,600Public swimming pool 1 1 1 1 1 1 1 1 1 1
CAPITAL ASSET STATISTICS BY FUNCTION/PROGRAMLAST TEN FISCAL YEARS

CITY OF EVERETT STATISTICAL SECTION
2019 COMPREHENSIVE ANNUAL FINANCIAL REPORT PAGE 189
STAT 17Page 2 of 2
Function/Program 2010 2011 2012 2013 2014 2015 2016 2017 2018 2019Water/Sewer
WaterWater mains (miles) 494 496 496 496 496 496 491 507 507 507Fire hydrants 3,278 3,279 3,279 3,279 3,328 3,328 3,458 3,458 3,458 3,458Water storage capacity (within city)(in mg) 78 78 78 78 54 53 53 54 50 66
SewerSanitary sewers (miles) 334 334 334 334 336 339 342 343 344 344Storm sewers (miles) 259 290 290 290 292 334 305 265 265 266Treatment capacity (mgd) 35 35 35 35 36 40 40 40 40 40
ParkingEverpark parking garage 1 1 1 1 1 1 1 1 1 1
TransitNumber of Buses 49 49 49 49 47 47 42 42 44 40Number of Paratransit vehicles 22 22 26 28 28 28 28 27 26 24Transit stations 3 3 3 3 3 3 3 3 3 3
GolfMunicipal golf courses 2 2 2 2 2 2 2 2 2 2
Sources: Various city departments and the City Budget.
LAST TEN FISCAL YEARSCAPITAL ASSET STATISTICS BY FUNCTION/PROGRAM

CITY OF EVERETT STATISTICAL SECTION
PAGE 190 2019 COMPREHENSIVE ANNUAL FINANCIAL REPORT
This page is intentionally left blank.