city of corona benefit plan analysis presentation
TRANSCRIPT

1
City of Corona, CAAnalysis of the City’s Pension, OPEB and employee healthcare obligations and budget considerations
Presentation to City Council
December 14, 2016

2
Table of Contents● Project Background
● Scope and Assumptions
● Benefit Plan Provisions and Observations
● Benefit Plan Cost
● Sensitivity Analysis
● City Alternatives
● Budget Projections
● Questions & Answers

3
Project Background● City of Corona has engaged KPMG to perform a review and analysis of its pension, Other
Postemployment benefits (OPEB, or retiree healthcare) and employee healthcare benefit plans. The project included the following activities:
– Discuss current employee benefit plan provisions and observations– Understand current employee benefit cost for all plans and employee groups– Develop projections of employee benefit cost over 10 years– Perform “what-if” analysis of employee benefit cost projections under alternative
sets of discount rate, asset return and other actuarial assumptions– Discuss range of options available to the City to mitigate projected future budget
shortfalls– Review budget projections for employee benefit costs under alternative scenarios
● Presenting today from KPMG:– Denis Roy, FSA, EA, MAAA. KPMG Managing Director and Retirement practice
national leader.– Yuri Nisenzon, ASA, EA, MAAA. KPMG Director and Retirement practice Northeast
region leader.

4
Scope and Assumptions● Disclaimers
– KPMG was engaged by the City as an independent consultant. KPMG is not performing, or intending to perform, any services that could be construed as public policy advocacy or lobbying on behalf of the City.
– Unless mentioned otherwise, all projections and calculations presented in this document are based on factual employee and plan information provided by the City, as well as assumptions used by the City or their actuaries.
– Amounts shown in baseline cash flow projections are not guarantees or predictions of future outcomes. They are representations of estimated outcomes under a set of reasonable assumptions for the future. The use of other assumptions may lead to different results.
– Assumptions used in sensitivity scenarios are meant to represent the impact of adverse outcomes on the City’s budget and cash flows.
– Any alternatives available to the City discussed or illustrated in this document are illustrations of actions that could be taken by the City to improve its projected budget position, within a broader range of possible options, and are not recommendations.

5
Scope and Assumptions● Scope of Benefits Considered
– The following plans were considered in-scope for this analysis:
■ Defined Benefit Pension administered by CalPERS – 4 employee groups
• Miscellaneous employees (Classic and PEPRA1)
• Police employees (Classic and PEPRA1)
• Fire Classic employees
• Fire PEPRA1 employees
■ Active Medical Insurance Plan Allowance
• Premium payment
• Medical difference cash payment
• Opt-out allowance
■ OPEB2: Postretirement Benefits for City retirees
– The following plans were out-of-scope for this analysis:
■ PST3 Deferred Compensation Plan (retirement plan for part-time and seasonal employees)
■ Replacement Benefit Fund
■ Other benefits: Active Health Savings Account (HSA) contributions, Flexible Spending Plan, Deferred Compensation Match, Uniform Allowance, Medicare (Part B and Part D), Workers’ Compensation and other miscellaneous benefits.
1 California Public Employees’ Pension Reform Act of 20132 Other Post-Employment Benefits3 Part-time / Seasonal / Temporary

6
Scope and Assumptions● The following information was used to develop cash flow projections
– Memorandum of Understanding (MOUs) describing benefits payable to employees and retirees for each employee group
– City of Corona 10-year Budget Forecast, including projections of Pension, OPEB and active healthcare benefit costs
– Census information including pay, unit, Tier, pension and OPEB coverage, benefit election, and other information for each current employee and retiree
– Historical actuarial valuation reports through June 30, 2015 for all CalPERS pension plans, as well as for OPEB plan
– Health Care premium rate sheets for 2015, 2016 and 2017

7
Benefit Plan Provisions and Observations Pension benefit provisions (CalPERS)
Group Benefit FormulaYears Pay1
Averaging
Employee Contribution (% of
pay) 2,3
MISC – Classic 4 2.7% at 55 1 year 8%
MISC – PEPRA 5 2.0% at 62 3 years 5.75%
Police – Classic 4 3.0% at 50 1 year 9% plus 1.5%
Police – PEPRA 5 2.7% at 57 3 years 11.75%
Fire – Classic 4 3.0% at 50 1 year 9% plus 1.5%
Fire – PEPRA 5 2.7% at 57 3 years 12.25% plus 1.5%
1. CalPERS pensionable compensation includes base pay and excludes bonuses and most overtime payments.2. The employee contribution for PEPRA plans is the greater of 50% of the total normal cost or the current
contribution rate (as shown in the table above). 3. Police (Classic) and Fire (Classic and PEPRA) employees contribute an additional 1.5% of compensation towards
employer cost, beyond the CalPERS required employee contribution.4. “Classic” employees are defined as employees hired before 1/1/2013, or employees hired on or after 1/1/2013
subject to reciprocity; or were members prior to the effective date and had a break in service less than six months.5. “PEPRA” employees are defined as hired on or after 1/1/2013, who have never been a member of any public
retirement system prior to 1/1/2013, or who were members of any other public retirement system prior to 1/1/2013, that were not subject to reciprocity; or were members prior to the effective date and had a break in service in excess of six months unless previously employed by the City if they remained CalPERS members.

8
Benefit Plan Provisions and Observations● Observations on Pension benefit plan provisions
■ City of Corona Classic employees receive generous benefits. For example, a 25-year safety employee would receive 75% of final salary for life, beginning at age 50.
■ PEPRA employees have generally lower benefits (lower multiplier, higher retirement age, longer pay averaging) and higher employee contributions than Classic employees. Growth in PEPRA employee population is expected to reduce ongoing pension costs for the City, but will only have a minimal impact on the City’s legacy costs (unfunded liability).
■ Pension earnings for Classic employees are determined by the Highest Single Year of Service. This could lead to “pension spiking”, or artificial inflation of salary in final year of service leading to enhanced pension benefits. This is somewhat mitigated by PERS audits of retirement benefits for highly compensated employees.
● City’s current funding policy for pension plans is to contribute the minimum amount required by CalPERS actuarial valuations.

9
Benefit Plan Provisions and ObservationsActive healthcare benefit provisions
Group Benefit FormulaTier I Premium subsidy at 2nd highest Family rate.Tier II Premium subsidy at 2nd highest Family rate + Excess of
medical allowance over the premium payable as taxableincome or allocated to purchase additional benefits.
Tier III ― Misc & Supervisors
Premium subsidy at lowest Family rate.
Tier III Fire and Tier III & IV Police (< 5 YOS)
Premium subsidy at lowest Family rate. Tier III Fire is eligible to receive medical allowance as taxable income.
Tier III Fire and Tier III & IV Police (> 5 YOS)
Premium subsidy at 2nd highest Family rate. Tier III Fire is eligible to receive medical allowance as taxable income.
1. Tier I participants are General Employees and Supervisors hired prior to January 1, 1999, Police Employees and Police Supervisors hired prior to 1/1/2000. Fire Employees hired prior to 7/1/2000.
2. Tier II participants are General Employees and Supervisors hired 1/1/1999 – 12/31/2012. Police Employees and Police Supervisors hired 1/1/2000 – 10/13/2007. Fire Employees hired 7/1/2000 – 12/31/2012 and hired after 1/1/2013 who qualified for Classic employee designation. Excess medical allowance is capped to $950 annually for Tier II Police.
3. Tier III participants are General Employees and Supervisors hired after 1/1/2013. Police Employees and Police Supervisors hired 10/13/2007 – 12/31/2012 and hired after 1/1/2013 who qualified for Classic employee designation. Fire Employees hired after 1/1/2013 who do not qualify for Classic employee designation.
4. Tier IV are Police Employees and Police Supervisors hired after 1/1/2013 who do not qualify for Classic employee designation.
10
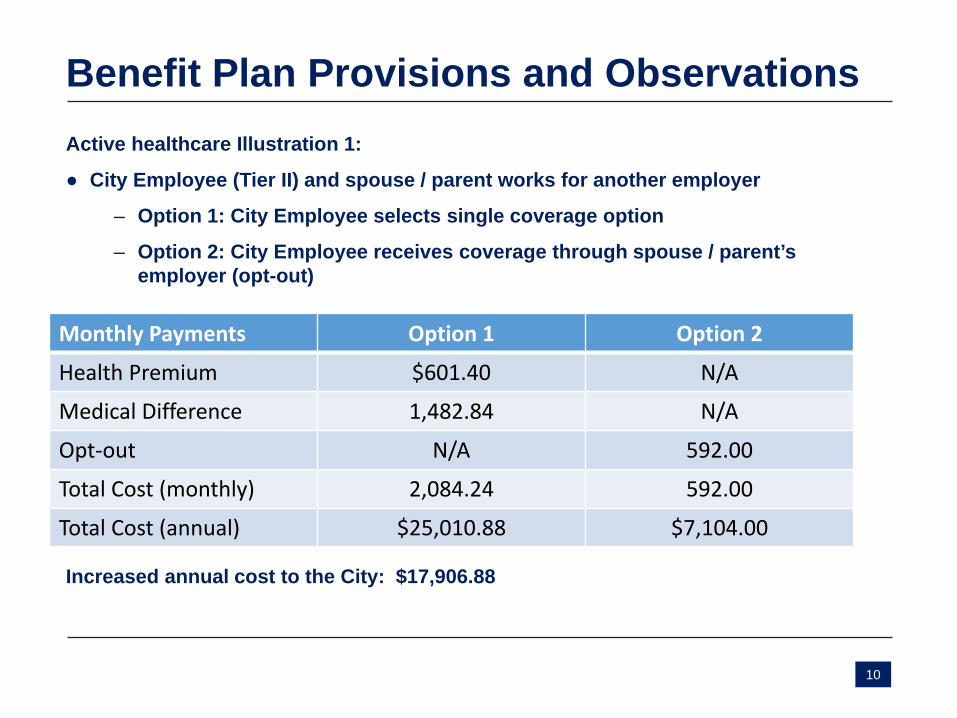
Benefit Plan Provisions and ObservationsActive healthcare Illustration 1:
● City Employee (Tier II) and spouse / parent works for another employer
– Option 1: City Employee selects single coverage option
– Option 2: City Employee receives coverage through spouse / parent’s employer (opt-out)
Increased annual cost to the City: $17,906.88
Monthly Payments Option 1 Option 2
Health Premium $601.40 N/A
Medical Difference 1,482.84 N/A
Opt-out N/A 592.00
Total Cost (monthly) 2,084.24 592.00
Total Cost (annual) $25,010.88 $7,104.00

11
Benefit Plan Provisions and ObservationsActive healthcare Illustration 2:
● Employee and Spouse are both Tier II employees
– Option 1: Employee and Spouse both select single coverage option
– Option 2: Employee selects Employee + 1 coverage
Increased annual cost to the City: $25,010.88
Monthly Payments Option 1 Option 2
E’e Spouse Total E’e Spouse Total
Health Premium $601.40 $601.40 $1,202.80 $1,202.80 N/A $1,202.80
Medical Difference 1,482.84 1,482.84 2,965.68 $881.44 N/A 881.44
Opt-out N/A N/A N/A N/A N/A N/A
Total Cost (monthly) 2,084.24 2,084.24 4,168.48 $2,084.24 N/A 2,084.24
Total Cost (annual) $25,010.88 $25,010.88 $50,021.76 $25,010.88 $0 $25,010.88

12
Benefit Plan Provisions and Observations● Observations on Active medical benefit plan provisions
■ City does not require contributions from employees to offset cost (unless they exceed the maximum allowance)
■ Medical excess benefit for eligible employees is not capped. Having this benefit uncapped creates an incentive to select a benefit that is more expensive to the City (e.g. select lowest cost single benefit and obtain medical difference vs. opt-out and get coverage with spouse or parent)
■ 2nd Highest Family Medical Rate increased average of 10.3% over past 2 years; Lowest Family rate increased average of 2.7% over past 2 years
■ The annual premium increase for Kaiser plan (the most prevalent election by the City’s workers) was 1.7% over the last 2 years
■ The premiums for a few plans with low subscription increased significantly over the past two years (PERS Care, PERS Choice)
■ About 11% of eligible employees opt-out of health benefits and received a cash payment as taxable income; opt-out amount is not increased with inflation and smaller than premium charged for the same type of coverage offered by PERS
■ Beginning from January 1, 2017 OptumRx will take over as Pharmacy Benefit Manager for CalPERS members affecting all plans offered by the City except Kaiser, may be affecting some drugs coverage and cost sharing

13
Benefit Plan Provisions and ObservationsRetiree healthcare (OPEB) benefit provisions
Group Benefit Formula
Employee / Retiree
ContributionTier IA 100% of medical premium / no cap
If management / confidential or elected official, receive an additional $1,500 If coverage waived, receive a $6,000 HSA contribution
N/A
Tier IB Capped at the second highest CalPERS family rateIf management / confidential or elected official, receive an additional $1,500
If coverage waived, receive a $6,000 HSA contribution annually
N/A
Tier II-IV CalPERS minimum employer contribution ($125/mo. for 2016) N/A
1. Tier I participants are Misc. Employees, Elected Officials hired prior to January 1, 1999, Fire Employees hired prior to July 1, 2000, Police Employees hired prior to January 1, 2000
a) Tier IA: Misc, Police, Elected Officials, retired prior to January 1, 2006, Fire Employees retired prior to January 1, 2005
b) Tier IB: Misc, Police, Elected Officials, retired on or after January 1, 2006, Fire Employees retired on or after January 1, 2005
2. Tier II-IV participants are Misc. Employees and elected officials hired on or after January 1, 1999, Fire Employees hired on or after July 1, 2000, Police Employees hired on or after January 1, 2000.

14
Benefit Plan Provisions and Observations● Observations on OPEB benefit plan provisions
■ Tier IA health insurance cost is not capped. In addition, Tier I retirees do not contribute to the cost of the Plan. Tier I OPEB healthcare reimbursements consist of approximately 97% of total OPEB costs for the City.
■ Tiers II - IV only eligible for Base Contribution Rate ($125 per month for FY 2016).
■ The same monthly premiums are charged for active employees and pre-Medicare retirees, which leads to cross-subsidies (part of active premium used to pay for retiree claims).
■ The increasing cost of specialty drugs may materially affect future costs.
● City’s current funding policy for OPEB is to contribute 100% of the Annual Required Contribution (ARC) from the actuarial valuations. The contribution is comprised from pay-as-you-go benefit payments and contribution made to designated OPEB trust.

15
Benefit Plan CostFYE17 estimated benefit plan cost per employee – Miscellaneous
FYE 2017 (estimated) MISC Classic MISC PEPRA$ % of pay $ % of pay
Average PERS Pay per employee 67,251 67,251 Ongoing Benefit Cost
Pension – Normal Cost (Total) 12,708 18.9% 7,529 11.2%OPEB – Normal Cost 2,360 3.5% 583 0.9%Active Healthcare Cost 18,569 27.6% 11,969 17.8%Total – Ongoing Cost 33,637 50.0% 20,080 29.9%
Legacy Cost per employeePension – Unfunded Liability 28,579 42.5% 0 0.0%OPEB – Unfunded Liability 11,476 17.1% 0 0.0%Total – Legacy Cost 40,055 59.6% 0 0.0%
Total Benefit Cost 73,692 109.6% 20,080 29.9%Employee Contribution - CalPERS (5,380) -8.0% (3,867) -5.8%Employee Contributions - additional 0 0.0% 0 0.0%Net Employer Benefit Cost 68,312 101.6% 16,213 24.1%

16
Benefit Plan CostFYE17 estimated benefit plan cost per employee – Police
FYE 2017 (estimated) Police Classic Police PEPRA
$ % of pay $ % of payAverage PERS Pay per employee 116,982 116,982 Ongoing Benefit Cost
Pension – Normal Cost (Total) 34,535 29.5% 27,320 23.4%OPEB – Normal Cost 2,360 2.0% 583 0.5%Active Healthcare Cost 18,569 15.9% 11,969 10.2%Total – Ongoing Cost 55,464 47.4% 39,871 34.1%
Legacy Cost per employeePension – Unfunded Liability 28,434 24.3% 0 0.0%OPEB – Unfunded Liability 17,547 15.0% 0 0.0%Total – Legacy Cost 45,982 39.3% 0 0.0%
Total Benefit Cost 101,445 86.7% 39,871 34.1%Employee Contribution - CalPERS (10,528) -9.0% (13,745) -11.8%Employee Contributions - additional (1,755) -1.5% 0 0.0%Net Employer Benefit Cost 89,162 76.2% 26,126 22.3%

17
Benefit Plan CostFYE17 estimated benefit plan cost per employee – Fire
FYE 2017 (estimated) Fire Classic Fire PEPRA
$ % of pay $ % of payAverage PERS Pay per employee 93,424 93,424 Ongoing Benefit Cost
Pension – Normal Cost (Total) 28,242 30.2% 23,422 25.1%OPEB – Normal Cost 2,360 2.5% 583 0.6%Active Healthcare Cost 18,569 19.9% 11,969 12.8%Total – Ongoing Cost 49,171 52.6% 35,974 38.5%
Legacy Cost per employeePension – Unfunded Liability 16,146 17.3% 0 0.0%OPEB – Unfunded Liability 14,565 15.6% 0 0.0%Total – Legacy Cost 30,711 32.9% 0 0.0%
Total Benefit Cost 79,882 85.5% 35,974 38.5%Employee Contribution - CalPERS (8,408) -9.0% (11,444) -12.3%Employee Contributions - additional (1,401) -1.5% (1,401) -1.5%Net Employer Benefit Cost 70,072 75.0% 23,128 24.8%

18
Benefit Plan Cost● Assumptions used in cost projections:Assumption Adjusted Baseline SensitivityValuation Interest Rate
Set equal to actuarial valuation assumption Minus 1% in all years
Expected Asset Returns
Updated for returns through FYE16. Set equal to interest rate for future years.
5% return in all years from FYE17Negative 20% return in FYE18
Health Care Trend Rate
OPEB – equal to actuarial valuationActive – 4% per City budget
OPEB valuation – plus 1% in all yearsOPEB and Active experience – 8% trend in all years
Payroll Growth CalPERS assumes 3% in actuarial valuations. Model was updated to reflect 0.5% year-over-year salary increases per City budget.
1% COLA in FYE18
Turnover 5% turnover assumed (combination of termination and retirement), consistent with City experience.
N/A
Population Growth After filling in current vacancies, 0% headcount growth N/A
Affordable Care Act (ACA) Excise Tax
Assumes Excise Tax does not apply through FYE26 N/A
Medical Coverage Assumes same elections as current population N/A
Other assumptions Same as actuarial valuation assumptions N/A

19
Benefit Plan Cost● The following four slides present 10-year forecasts of pension, OPEB and active healthcare
benefit costs under baseline assumptions
● Baseline assumptions were adjusted from original Corona budget and actuarial assumptions as follows:
– Match to CalPERS / actuarial valuation: updated projections to reflect best estimate from the June 30, 2015 actuarial valuations. Note that CalPERS model assumed 3% payroll growth.
– Adjust payroll to Corona census and fill vacancies: updated models to tie into Corona budget payroll for FYE17. This includes the filling of currently open vacancies.
– Lower payroll growth (0.5%) in FYE18. This reflects a reduction from CalPERS expected payroll growth of 3% to the City’s expectation of 0.5% year-over-year salary increases.
– 5% turnover starting FYE18. CalPERS and actuarial projections assume no turnover. Turnover has the effect of lowering payroll and benefit cost over time, as higher-cost Tier I/II employees are being replaced by lower-cost Tier III/IV employees.
– Actual asset return FYE16. Actuarial projections assume 7.5% / 7.28% asset return for Pension / OPEB in all years. These were updated for actual return through FYE16.
– Remove Excise tax FYE17. In original projections, treatment was inconsistent between active healthcare (no excise tax) and OPEB (excise tax included) projections. Given the likely direction of new administration, our baseline model removes the effect of excise tax from the OPEB valuations.

20
Benefit Plan Cost● 10-year cost projection – Pension ($ thousands)
Total Adjustments include:Update 1 - Adjust payroll to Corona census and fill vacancies (FYE17)Update 2 – Lower payroll growth (0.5% in FYE18)Update 3 – 5% Turnover starting FYE18Update 4 – 0% asset return FYE16
Expected PERS PayrollScenario FYE16 FYE17 FYE18 FYE19 FYE20 FYE21 FYE22 FYE23 FYE24 FYE25 FYE26Corona Financial Forecast n/a 56,259$ 56,534$ 56,813$ 57,093$ 57,375$ 57,648$ 57,932$ 58,218$ 58,506$ 58,794$ Baseline: Match to CalPERS 53,101 54,694 56,335 58,025 59,766 61,559 63,405 65,307 67,267 69,285 71,363 Total Adjustments 0 1,565 (407) (2,433) (4,457) (6,536) (8,646) (10,784) (12,983) (15,210) (17,474)Adjusted Baseline Projection 53,101 56,259 55,928 55,592 55,309 55,023 54,759 54,523 54,284 54,075 53,889 Misc. Payroll 25,968 27,102 26,886 26,668 26,478 26,286 26,092 25,928 25,761 25,625 25,488 Police Payroll 17,277 18,600 18,536 18,470 18,404 18,336 18,294 18,251 18,208 18,163 18,145 Classic Fire Payroll 9,466 8,960 8,609 8,254 7,996 7,734 7,470 7,203 6,933 6,661 6,385 PEPRA Fire Payroll 390 1,597 1,897 2,199 2,431 2,666 2,902 3,141 3,382 3,626 3,872

21
Benefit Plan Cost● 10-year cost projection – Pension ($ thousands)
Total Adjustments include:Update 1 - Adjust payroll to Corona census and fill vacancies (FYE17)Update 2 – Lower payroll growth (0.5% in FYE18)Update 3 – 5% Turnover starting FYE18Update 4 – 0% asset return FYE16
Expected Employer Contribution (Total)Scenario FYE16 FYE17 FYE18 FYE19 FYE20 FYE21 FYE22 FYE23 FYE24 FYE25 FYE26Corona Financial Forecast n/a 21,619$ 23,440$ 25,789$ 28,249$ 29,923$ 31,598$ 32,951$ 33,731$ 34,534$ 35,360$ Baseline: Match to CalPERS 20,329 21,067 23,419 25,415 27,511 28,795 30,054 30,960 31,890 31,063 31,173 Total Adjustments 0 457 (127) (82) 113 333 580 855 546 235 (82)Adjusted Baseline Projection 20,329 21,524 23,292 25,333 27,624 29,128 30,634 31,815 32,436 31,298 31,091 Misc. Employer Contribution 9,129 10,400 11,468 12,368 13,448 14,150 14,899 15,503 15,863 14,455 13,966 Police Employer Contribution 6,695 7,706 8,071 8,735 9,429 9,922 10,345 10,684 10,856 11,034 11,221 Classic Fire E'r Contribution 4,505 3,237 3,539 3,982 4,473 4,753 5,061 5,270 5,332 5,396 5,463 PEPRA Fire E'r Contribution -$ 181 213 248 275 302 330 358 385 413 441
Expected Employer Contribution (% of Payroll)Scenario FYE16 FYE17 FYE18 FYE19 FYE20 FYE21 FYE22 FYE23 FYE24 FYE25 FYE26Corona Financial Forecast n/a 38.43% 41.46% 45.39% 49.48% 52.15% 54.81% 56.88% 57.94% 59.03% 60.14%Baseline 38.28% 38.52% 41.57% 43.80% 46.03% 46.78% 47.40% 47.41% 47.41% 44.83% 43.68%Total Adjustments 0.00% -0.26% 0.08% 1.77% 3.91% 6.16% 8.54% 10.94% 12.34% 13.05% 14.01%Adjusted Baseline Projection 38.28% 38.26% 41.65% 45.57% 49.94% 52.94% 55.94% 58.35% 59.75% 57.88% 57.69%Misc. Employer Contribution % 35.15% 38.37% 42.65% 46.38% 50.79% 53.83% 57.10% 59.79% 61.58% 56.41% 54.79%Police Employer Contribution % 38.75% 41.43% 43.54% 47.29% 51.23% 54.11% 56.55% 58.54% 59.62% 60.75% 61.84%Classic Fire E'r Contribution % 47.59% 36.13% 41.11% 48.24% 55.94% 61.46% 67.75% 73.16% 76.91% 81.01% 85.56%PEPRA Fire E'r Contribution % 0.00% 11.33% 11.23% 11.28% 11.31% 11.33% 11.37% 11.40% 11.38% 11.39% 11.39%

22
Benefit Plan Cost● 10-year cost projection – OPEB ($ thousands)
Total Expected ARCScenario FYE16 FYE17 FYE18 FYE19 FYE20 FYE21 FYE22 FYE23 FYE24 FYE25 FYE26Corona Financial Forecast n/a 8,929 9,214 9,491 9,775 10,069 10,371 10,682 11,002 11,332 11,672Baseline 8,665 8,929 9,200 9,480 9,768 10,065 10,371 10,686 11,011 11,346 11,691Total Adjustments 0 70 (25) (63) (104) (140) (180) (222) (260) (301) (344)Adjusted Baseline Projection 8,665 8,999 9,175 9,417 9,664 9,925 10,191 10,464 10,751 11,045 11,347
Total Expected ARC (% of Payroll)Scenario FYE16 FYE17 FYE18 FYE19 FYE20 FYE21 FYE22 FYE23 FYE24 FYE25 FYE26Corona Financial Forecast n/a n/a n/a n/a n/a n/a n/a n/a n/a n/a n/aBaseline 16.32% 16.33% 16.33% 16.34% 16.34% 16.35% 16.36% 16.36% 16.37% 16.38% 16.38%Total Adjustments 0.00% -0.33% 0.07% 0.60% 1.13% 1.69% 2.25% 2.83% 3.43% 4.05% 4.67%Adjusted Baseline Projection 16.32% 16.00% 16.41% 16.94% 17.47% 18.04% 18.61% 19.19% 19.80% 20.43% 21.06%
Total Adjustments include:Update 1 - Adjust payroll growth (0.5% in FYE18) and fill vacancies in FYE17Update 2 – 5% Turnover starting FYE18Update 3 – Actual asset return for FYE16Update 4 – Remove excise tax at FYE17

23
Benefit Plan Cost● 10-year cost projection – Active employee healthcare ($ thousands)
Total Adjustments include:Update 1 - Fill vacancies in FYE17Update 2 – 5% Turnover starting FYE18
Baseline Projections ($ thousands) FYE17 FYE18 FYE19 FYE20 FYE21 FYE22 FYE23 FYE24 FYE25 FYE26City of Corona Financial Forecast 11,638 12,103 12,587 13,091 13,614 14,159 14,725 15,314 15,927 16,564Baseline To Match Financial Forecast 11,594 12,058 12,540 13,042 13,564 14,106 14,670 15,257 15,867 16,502
Adjusted Baseline Projection FYE17 FYE18 FYE19 FYE20 FYE21 FYE22 FYE23 FYE24 FYE25 FYE26Active Employee Health Care Cost 8,050 8,372 8,707 9,055 9,418 9,794 10,186 10,594 11,017 11,458ACA Employee Health Care Cost 34 35 37 38 40 41 43 45 47 49Medical Difference/Excess Cost 2,212 2,185 2,159 2,133 2,107 2,082 2,057 2,032 2,008 1,984Employee Health Plan Opt-Out Cost 566 566 566 566 566 566 566 566 566 566Employee Contributions 0 0 0 0 0 0 0 0 0 0Vacant Positions Cost 706 734 764 794 826 859 894 929 966 1,005Total Adjusted Baseline Projection 11,569 11,894 12,233 12,588 12,958 13,344 13,746 14,167 14,605 15,062∆ From Baseline ($) (26) (164) (307) (454) (606) (763) (924) (1,091) (1,263) (1,440)Adjusted Baseline Projection ∆ -0.2% -1.4% -2.4% -3.5% -4.5% -5.4% -6.3% -7.1% -8.0% -8.7%

24
Benefit Plan Cost● Accounting Valuation for Pension Plans is performed under GASB 68 promulgations. Under GASB 68 all
state and local entities are required to record the net pension liability in the financial statement.
● Accounting Valuation for OPEB Plans is currently performed under GASB 45 promulgations. GASB 45 does not require recording the OPEB liability on financial statements, it only requires disclosure of unfunded liability in footnotes.
● GASB 75 will introduce a requirement to record OPEB liability in City financial statements effective FYE 2018.
● The table below shows excerpts from June 30, 2015 GASB actuarial valuations for the City pension (using discount rate 7.5%) and OPEB plans (using discount rate 7.28%), and our estimate of an impact to GASB liabilities due to changes in discount rates, assets and health care trend rates:
June 30, 2015Pensions (GASB 68)
OPEB (GASB 45 / 75)
Actuarial Liability $651,287,522 $126,756,944
Market Value of Assets $448,481,828 $26,019,812
Unfunded liability $202,805,694 $100,737,132
Increase in unfunded liability due to:
1% decrease in discount rate $91,707,809 $12,992,587
1% loss on assets $4,484,818 $260,198
1% increase in health care trend rate N/A $9,874,994

25
Sensitivity Analysis● The following three slides present sensitivity of 10-year cash flow forecasts of pension, OPEB and
active healthcare benefit costs under a variety of economic scenarios reflecting a range of adverse outcomes. These are unique possibilities within a wide range of possible scenarios:
– 5% asset return beginning FYE17. Baseline projections assume 7.5% / 7.28% annual asset return for pension / OPEB plans starting FYE17. This scenario illustrates the impact of lower annual asset returns.
– -20% asset return in FYE18. This scenario illustrates the impact of one year with large negative returns, which has occurred at least once every decade (usually associated with the beginning of a recession). 7.5% / 7.28% annual asset return is assumed in all other years.
– 1% decrease in discount rate and asset return beginning FYE17. CalPERS has instituted a “risk mitigation policy” which has a goal of reducing the discount rate to 6.5% in the long-term. This scenario illustrates the impact of a 1% lower asset return and discount rate for both pension and OPEB plans.
– +1% COLA increase in FYE18. This scenario examines the impact of a 1% Cost of Living Adjustment (COLA) pay increase in FYE18 on PERS payroll and pension costs. The impact of different COLA increases (example, 2%) could be determined from this impact by multiplying the impact of a 1% COLA (in our example, times 2).
– +1% Healthcare trend assumption in FYE17. This scenario examines the impact of a 1% increase in healthcare trend assumption in OPEB actuarial valuations. The City and their actuaries would only change this assumption if it expected higher trend rates in the future.
– 8% actual healthcare trend beginning FYE17. This scenario examines the impact of a 8% actual increase in healthcare premiums paid by the City, higher than baseline projections. This scenario assumes no change in OPEB healthcare trend actuarial valuation assumption.
26
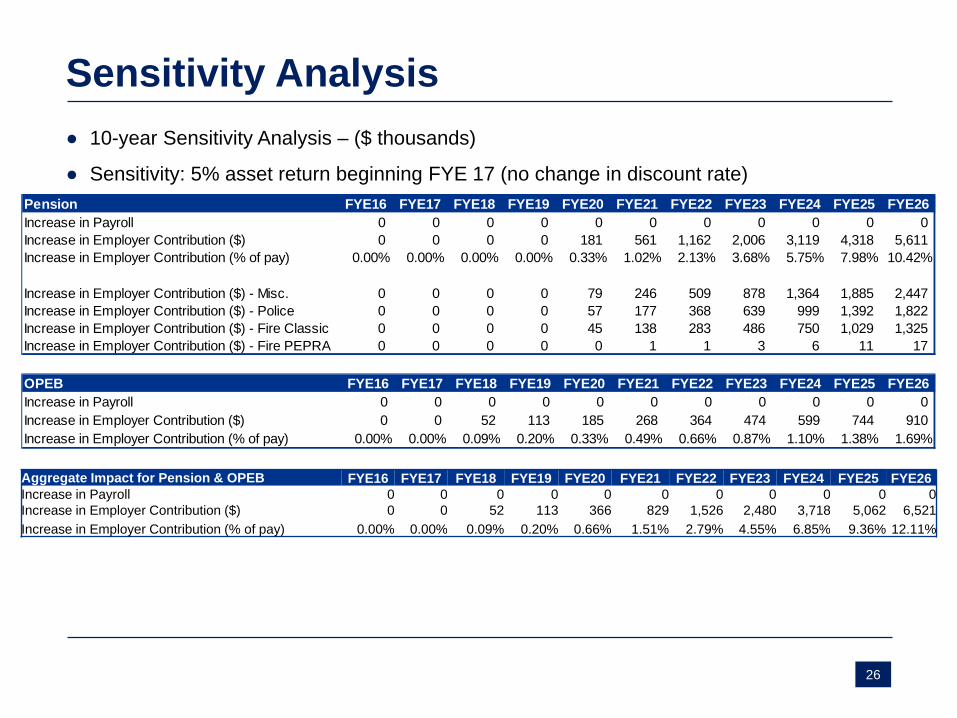
Sensitivity Analysis● 10-year Sensitivity Analysis – ($ thousands)
● Sensitivity: 5% asset return beginning FYE 17 (no change in discount rate)
OPEB FYE16 FYE17 FYE18 FYE19 FYE20 FYE21 FYE22 FYE23 FYE24 FYE25 FYE26Increase in Payroll 0 0 0 0 0 0 0 0 0 0 0Increase in Employer Contribution ($) 0 0 52 113 185 268 364 474 599 744 910Increase in Employer Contribution (% of pay) 0.00% 0.00% 0.09% 0.20% 0.33% 0.49% 0.66% 0.87% 1.10% 1.38% 1.69%
Aggregate Impact for Pension & OPEB FYE16 FYE17 FYE18 FYE19 FYE20 FYE21 FYE22 FYE23 FYE24 FYE25 FYE26Increase in Payroll 0 0 0 0 0 0 0 0 0 0 0 Increase in Employer Contribution ($) 0 0 52 113 366 829 1,526 2,480 3,718 5,062 6,521Increase in Employer Contribution (% of pay) 0.00% 0.00% 0.09% 0.20% 0.66% 1.51% 2.79% 4.55% 6.85% 9.36% 12.11%
Pension FYE16 FYE17 FYE18 FYE19 FYE20 FYE21 FYE22 FYE23 FYE24 FYE25 FYE26Increase in Payroll 0 0 0 0 0 0 0 0 0 0 0Increase in Employer Contribution ($) 0 0 0 0 181 561 1,162 2,006 3,119 4,318 5,611Increase in Employer Contribution (% of pay) 0.00% 0.00% 0.00% 0.00% 0.33% 1.02% 2.13% 3.68% 5.75% 7.98% 10.42%
Increase in Employer Contribution ($) - Misc. 0 0 0 0 79 246 509 878 1,364 1,885 2,447Increase in Employer Contribution ($) - Police 0 0 0 0 57 177 368 639 999 1,392 1,822Increase in Employer Contribution ($) - Fire Classic 0 0 0 0 45 138 283 486 750 1,029 1,325Increase in Employer Contribution ($) - Fire PEPRA 0 0 0 0 0 1 1 3 6 11 17

27
Sensitivity Analysis● 10-year Sensitivity Analysis – ($ thousands)
● Sensitivity: -20% asset return in FYE18, 7.5% other years for pension and 7.28% other years for OPEB (no change in discount rate)
OPEB FYE16 FYE17 FYE18 FYE19 FYE20 FYE21 FYE22 FYE23 FYE24 FYE25 FYE26Increase in Payroll 0 0 0 0 0 0 0 0 0 0 0Increase in Employer Contribution ($) 0 0 0 731 753 775 799 823 847 873 899Increase in Employer Contribution (% of pay) 0.00% 0.00% 0.00% 1.31% 1.36% 1.41% 1.46% 1.51% 1.56% 1.61% 1.67%
Aggregate Impact for Pension & OPEB FYE16 FYE17 FYE18 FYE19 FYE20 FYE21 FYE22 FYE23 FYE24 FYE25 FYE26Increase in Payroll 0 0 0 0 0 0 0 0 0 0 0 Increase in Employer Contribution ($) 0 0 0 731 753 2,902 5,180 7,592 10,144 12,842 13,227Increase in Employer Contribution (% of pay) 0.00% 0.00% 0.09% 1.31% 1.36% 5.27% 9.46% 13.93% 18.69% 23.74% 24.55%
Pension FYE16 FYE17 FYE18 FYE19 FYE20 FYE21 FYE22 FYE23 FYE24 FYE25 FYE26Increase in Payroll 0 0 0 0 0 0 0 0 0 0 0Increase in Employer Contribution ($) 0 0 0 0 0 2,127 4,381 6,769 9,297 11,969 12,328Increase in Employer Contribution (% of pay) 0.00% 0.00% 0.00% 0.00% 0.00% 3.86% 8.00% 12.42% 17.13% 22.13% 22.88%
Increase in Employer Contribution ($) - Misc. 0 0 0 0 0 931 1,917 2,962 4,068 5,237 5,394Increase in Employer Contribution ($) - Police 0 0 0 0 0 678 1,397 2,158 2,963 3,815 3,930Increase in Employer Contribution ($) - Fire Classic 0 0 0 0 0 515 1,061 1,639 2,251 2,898 2,985Increase in Employer Contribution ($) - Fire PEPRA 0 0 0 0 0 3 7 11 14 19 19

28
Sensitivity Analysis● 10-year Sensitivity Analysis – ($ thousands)
● Sensitivity: 1% decrease in discount rate and asset return beginning FYE17 (6.5% Pension, 6.28% OPEB)
OPEB FYE16 FYE17 FYE18 FYE19 FYE20 FYE21 FYE22 FYE23 FYE24 FYE25 FYE26Increase in Payroll 0 0 0 0 0 0 0 0 0 0 0Increase in Employer Contribution ($) 0 0 478 489 501 513 525 538 551 565 579Increase in Employer Contribution (% of pay) 0.00% 0.00% 0.85% 0.88% 0.90% 0.93% 0.96% 0.99% 1.02% 1.04% 1.07%
Aggregate Impact for Pension & OPEB FYE16 FYE17 FYE18 FYE19 FYE20 FYE21 FYE22 FYE23 FYE24 FYE25 FYE26Increase in Payroll 0 0 0 0 0 0 0 0 0 0 0 Increase in Employer Contribution ($) 0 0 478 489 2,447 4,629 6,927 9,411 12,118 12,489 12,831Increase in Employer Contribution (% of pay) 0.00% 0.00% 0.85% 0.88% 4.42% 8.41% 12.65% 17.27% 22.33% 23.09% 23.81%
Pension FYE16 FYE17 FYE18 FYE19 FYE20 FYE21 FYE22 FYE23 FYE24 FYE25 FYE26Increase in Payroll 0 0 0 0 0 0 0 0 0 0 0Increase in Employer Contribution ($) 0 0 0 0 1,946 4,115 6,402 8,873 11,567 11,924 12,252Increase in Employer Contribution (% of pay) 0.00% 0.00% 0.00% 0.00% 3.52% 7.48% 11.69% 16.28% 21.31% 22.05% 22.74%
Increase in Employer Contribution ($) - Misc. 0 0 0 0 673 1,663 2,702 3,825 5,047 5,249 5,419Increase in Employer Contribution ($) - Police 0 0 0 0 727 1,442 2,198 3,012 3,898 3,983 4,076Increase in Employer Contribution ($) - Fire Classic 0 0 0 0 543 1,004 1,492 2,023 2,605 2,674 2,739Increase in Employer Contribution ($) - Fire PEPRA 0 0 0 0 3 6 10 13 17 18 18

29
Sensitivity Analysis● 10-year Sensitivity Analysis – ($ thousands)
● Sensitivity: +1% COLA increase in FYE18Pension FYE16 FYE17 FYE18 FYE19 FYE20 FYE21 FYE22 FYE23 FYE24 FYE25 FYE26Increase in Payroll 0 0 556 553 550 547 545 543 540 538 536Increase in Employer Contribution ($) 0 0 79 76 75 126 180 238 299 363 371
Increase in Employer Contribution ($) - Misc. 0 0 25 23 23 42 62 84 106 131 133Increase in Employer Contribution ($) - Police 0 0 35 34 34 53 73 94 116 140 143Increase in Employer Contribution ($) - Fire Classic 0 0 17 16 16 29 42 56 71 87 89Increase in Employer Contribution ($) - Fire PEPRA 0 0 2 2 3 3 4 4 4 5 5

30
Sensitivity Analysis● 10-year Sensitivity Analysis – ($ thousands)
● Sensitivity: +1% healthcare trend actuarial assumption beginning in FYE17
OPEB FYE16 FYE17 FYE18 FYE19 FYE20 FYE21 FYE22 FYE23 FYE24 FYE25 FYE26Increase in Employer Contribution ($) 0 0 925 950 975 1,002 1,030 1,058 1,087 1,118 1,149Increase in Employer Contribution (% of pay) 0.00% 0.00% 1.65% 1.71% 1.76% 1.82% 1.88% 1.94% 2.00% 2.07% 2.13%

31
Sensitivity Analysis● 10-year Sensitivity Analysis – ($ thousands)
● Sensitivity: 8% actual healthcare trend beginning in FYE17 (no change in actuarial assumption)
OPEB FYE16 FYE17 FYE18 FYE19 FYE20 FYE21 FYE22 FYE23 FYE24 FYE25 FYE26Increase in Employer Contribution ($) 0 0 505 634 837 1,128 1,524 2,044 2,717 3,477 4,309Increase in Employer Contribution (% of pay) 0.00% 0.00% 0.90% 1.14% 1.51% 2.05% 2.78% 3.75% 5.01% 6.43% 8.00%
Sensitivity 1 - 8% Trend FYE17 FYE18 FYE19 FYE20 FYE21 FYE22 FYE23 FYE24 FYE25 FYE26Active Employee Health Care Cost 8,360 9,029 9,751 10,531 11,374 12,283 13,266 14,327 15,474 16,711ACA Employee Health Care Cost 34 37 40 43 46 50 54 58 63 68Medical Difference/Excess Cost 2,297 2,356 2,418 2,481 2,545 2,611 2,679 2,749 2,820 2,894Employee Health Plan Opt-Out Cost 566 566 566 566 566 566 566 566 566 566Employee Contributions 0 0 0 0 0 0 0 0 0 0Vacant Positions Cost 733 792 855 924 998 1,077 1,164 1,257 1,357 1,466Total Sensitivity 1 To Adj. Baseline Proj. 11,990 12,780 13,630 14,545 15,529 16,589 17,729 18,958 20,281 21,706∆ From Adjusted Baseline - Sensitivity 1 ($) 422 887 1,397 1,957 2,572 3,245 3,983 4,791 5,676 6,644∆ From Adjusted Baseline - Sensitivity 1 (%) 3.6% 7.5% 11.4% 15.5% 19.8% 24.3% 29.0% 33.8% 38.9% 44.1%

32
City Alternatives – Pension Plans● Due to a generally aging population, improved post-retirement longevity, and conservative
investment policies adopted by CalPERS the pension costs are likely to continue increasing as a percentage of pay, with increased annual volatility going forward
● Participation in CalPERS limits the available options to mitigate future cost increases in the short-term. The process of termination from CalPERS participation would require an immediate significant cash cost based on liability at termination (see next slide)
● The following table discusses some alternatives available to the City to mitigate pension cost increases and volatility:
Alternative Impact on City Benefit Cost
Introduction of a new benefit Tier for new hires – either to participate in a less expensive defined benefit (outside CalPERS) or in a defined contribution plan
May result in no immediate impact or even short-term cost increase, but will provide gradually increased long-
term cost savings
Increase employee contribution to pay a portion of the City’s employer cost
Will have immediate but limited impact on the cost of the plan
Prefunding CalPERS unfunded liabilityPrefunding will help reduce the level of contributions in the future, but may increase the risk of asset losses and
low CalPERS asset returns.
Contingency side fundA side fund could be set up to mitigate some of the year
over year fluctuation in contribution requirements, however would not reduce overall pension costs

33
City Alternatives – Pension Plans● The liability associated with termination of CalPERS participation is calculated using
much more conservative interest rate and mortality assumptions than the ongoing actuarial liability calculations, causing a significant one-time charge for most terminating employers.
– Ongoing actuarial liability is calculated assuming a 7.5% discount rate and mortality rates that vary by age and gender.
– Termination liability is calculated using the interest rate on risk-free securities (significantly lower than 7.5% - currently ranging between 2% and 3.25%) and has a 7% mortality contingency load to account for unforeseen mortality improvements.
6/30/2015UAL – valuation
AssumptionUAL – Termination
Assumption (at 3.25%)CalPERS Termination
Charge
MISC $113,765,363 $343,735,861 $229,970,498
Police $67,952,480 $230,916,396 $162,963,916
Fire – Classic $33,516,570 $144,083,650 $110,567,080
Fire – PEPRA $2,994 $(864) $(3,858)
Total – all plans $215,237,407 $718,735,043 $503,497,636

34
City Alternatives – Active Medical Benefits● While the annual average medical premium increase was modest for Kaiser plans
(most popular choice) over the last two years, there were double-digit annual premium increase rates for some other plans. The significant cost escalation for specialty drugs, impact of ACA on healthcare cost increases, as well as general uncertainty about future cost increases under our current political landscape are a few of the factors that can impact the future projected medical program cost and make it more volatile than it has been in recent years.
● To mitigate the risk and extent of potential cost increases, a few options may be considered:
Alternative Impact on City Benefit Cost
Introduction of active employee monthly contribution Immediate impact on the cost of the plan, but limited relief long-term
Hard dollar cap on amount of premium payment for all Tiers Immediate impact on the cost of the plan, willincrease long-term
Limit or eliminate spousal benefit subsidies by setting premium payment as the cost of single coverage
Immediate impact on the cost of the plan that remains long-term
Limit the City’s payment by eliminating or capping the Medical Difference benefit for eligible employees
Immediate but limited impact on the cost of the plan
Consider medical benefit delivery using private healthcare exchangeOpportunity for long-term savings, pending selection of the right exchange operator. Limited (if any) impact short-term

35
City Alternatives – OPEB plan ● The bulk of the OPEB cost is associated with Tier I retirees – a closed group.
However, due to potential escalation of specialty drug costs, impacts of ACA on healthcare trend rate and increasing longevity, the cost of the OPEB program could continue to increase going forward.
● To mitigate the potential increases and fluctuations in OPEB program costs, the following options could be considered:
Alternative Impact on city benefit costIntroduction of retiree contributions Immediate Impact on the total cost of OPEB
program, but limited relief over the long-term
Hard cap on amount of Tier I premium reimbursements, either individual or in aggregate
Immediate impact on the total cost of OPEB program, will be more substantial long-term, gradual increase in Tier I retiree cost-sharing
Decrease or eliminate spousal subsidies by limiting the premium reimbursement to the highest cost of single-employer coverage under the plan
Immediate impact on the plan cost, short and long-term
Separating current retirees into a separate plan, providing benefit coverage through private healthcare exchange, with additional contributions to HRA account to subsidize the premium amounts
Likely opportunity for long-term cost saving

36
Budget Projections● The following table shows the City of Corona original 10-year budget projection for the
General Fund
● Change in Fund Balance equals the difference between General Fund revenues and expenses, and represents the decrease in General Fund reserves from one year to the next
● All numbers in thousandsDescription FYE17 FYE18 FYE19 FYE20 FYE21 FYE22 FYE23 FYE24 FYE25 FYE26Total Revenues 135,502$ 137,482$ 138,637$ 138,493$ 138,980$ 141,322$ 143,709$ 146,143$ 148,625$ 151,155$
Expenditure CategoriesPERSable Pay (45,446) (45,670) (45,895) (46,121) (46,348) (46,566) (46,796) (47,026) (47,258) (47,491) Non PERSable Pay - variable (11,862) (11,920) (11,978) (12,036) (12,095) (12,153) (12,212) (12,271) (12,331) (12,391) Non PERSable Pay - flat (480) (480) (480) (480) (480) (480) (480) (480) (480) (480)
Subtotal Current Employees - Salaries (57,788) (58,069) (58,352) (58,636) (58,922) (59,199) (59,487) (59,777) (60,069) (60,362)
Current Employees-Retirement Costs (17,440) (18,905) (20,828) (22,842) (24,218) (25,578) (26,671) (27,290) (27,927) (28,582) Current Employees - Active Health (8,829) (9,183) (9,550) (9,932) (10,329) (10,742) (11,172) (11,619) (12,084) (12,567) Retiree / OPEB (6,932) (7,157) (7,372) (7,592) (7,821) (8,055) (8,297) (8,545) (8,802) (9,066) Other Employee Benefits (6,256) (6,532) (6,950) (7,369) (7,489) (7,605) (7,732) (7,862) (7,996) (8,133)
Subtotal Employee Benefits (39,457) (41,776) (44,700) (47,735) (49,857) (51,980) (53,872) (55,316) (56,808) (58,348)
Other Expenditures (42,394) (42,313) (43,010) (42,711) (43,428) (44,170) (44,927) (45,699) (46,487) (47,290)
Total Expenditures (139,639) (142,158) (146,062) (149,082) (152,207) (155,349) (158,286) (160,793) (163,364) (166,000)
Change in Fund Balance (4,136)$ (4,677)$ (7,425)$ (10,590)$ (13,227)$ (14,027)$ (14,577)$ (14,650)$ (14,739)$ (14,845)$

37
Budget Projections● The following table shows the adjusted budget projection for the General Fund
● Adjustments are described in Slide 19 and include introduction of turnover, updates to actuarial valuations for actual asset returns, and removal of ACA excise tax for OPEB
● All numbers in thousandsDescription FYE17 FYE18 FYE19 FYE20 FYE21 FYE22 FYE23 FYE24 FYE25 FYE26Total Revenues 135,502$ 137,482$ 138,637$ 138,493$ 138,980$ 141,322$ 143,709$ 146,143$ 148,625$ 151,155$
Expenditure CategoriesPERSable Pay (45,446) (45,180) (44,908) (44,679) (44,448) (44,233) (44,042) (43,848) (43,679) (43,529) Non PERSable Pay - variable (11,862) (11,920) (11,978) (12,036) (12,095) (12,153) (12,212) (12,271) (12,331) (12,391) Non PERSable Pay - flat (480) (480) (480) (480) (480) (480) (480) (480) (480) (480)
Subtotal Current Employees - Salaries (57,788) (57,580) (57,366) (57,195) (57,022) (56,865) (56,733) (56,599) (56,490) (56,399)
Current Employees-Retirement Costs (17,364) (18,786) (20,460) (22,337) (23,575) (24,797) (25,752) (26,242) (25,310) (25,131) Current Employees - Active Health (8,777) (9,024) (9,281) (9,550) (9,831) (10,124) (10,429) (10,748) (11,081) (11,427) Retiree / OPEB (6,986) (7,126) (7,314) (7,506) (7,709) (7,916) (8,128) (8,350) (8,579) (8,813) Other Employee Benefits (6,256) (6,532) (6,950) (7,369) (7,489) (7,605) (7,732) (7,862) (7,996) (8,133)
Subtotal Employee Benefits (39,383) (41,468) (44,005) (46,762) (48,603) (50,441) (52,040) (53,203) (52,965) (53,505)
Other Expenditures (42,394) (42,313) (43,010) (42,711) (43,428) (44,170) (44,927) (45,699) (46,487) (47,290)
Total Expenditures (139,564) (141,360) (144,381) (146,668) (149,054) (151,477) (153,701) (155,502) (155,942) (157,195)
Change in Fund Balance (4,062)$ (3,879)$ (5,744)$ (8,175)$ (10,074)$ (10,155)$ (9,992)$ (9,359)$ (7,317)$ (6,040)$

38
Budget Projections● The following table shows the change in fund balance under various sensitivity
scenarios described in Slide 25FYE17 FYE18 FYE19 FYE20 FYE21 FYE22 FYE23 FYE24 FYE25 FYE26
Adjusted Baseline - Change in Fund Balance (4,062)$ (3,879)$ (5,744)$ (8,175)$ (10,074)$ (10,155)$ (9,992)$ (9,359)$ (7,317)$ (6,040)$
Sensitivity 1: 5% asset returnIncrease in payroll expenditures - - - - - - - - - - Increase in pension expenditures - - - 146 454 941 1,624 2,523 3,492 4,535 Increase in OPEB and healthcare expenditures - 40 88 144 208 283 368 465 578 707 Increase in expenditures - total - 40 88 290 662 1,223 1,992 2,989 4,070 5,242 Change in Fund Balance (4,062)$ (3,919)$ (5,832)$ (8,465)$ (10,736)$ (11,378)$ (11,984)$ (12,347)$ (11,387)$ (11,282)$
Sensitivity 2: -20% asset return in 2018Increase in payroll expenditures - - - - - - - - - - Increase in pension expenditures - - - - 1,721 3,546 5,479 7,522 9,679 9,965 Increase in OPEB and healthcare expenditures - - 568 585 602 621 639 658 678 698 Increase in expenditures - total - - 568 585 2,323 4,167 6,118 8,180 10,357 10,663 Change in Fund Balance (4,062)$ (3,879)$ (6,312)$ (8,760)$ (12,397)$ (14,322)$ (16,110)$ (17,538)$ (17,675)$ (16,703)$
Sensitivity 3: 8% annual healthcare trendIncrease in payroll expenditures - - - - - - - - - - Increase in pension expenditures - - - - - - - - - - Increase in OPEB and healthcare expenditures 320 1,065 1,552 2,135 2,827 3,646 4,610 5,745 7,007 8,387 Increase in expenditures - total 320 1,065 1,552 2,135 2,827 3,646 4,610 5,745 7,007 8,387 Change in Fund Balance (4,382)$ (4,944)$ (7,296)$ (10,310)$ (12,901)$ (13,801)$ (14,602)$ (15,104)$ (14,324)$ (14,427)$

39
Budget Projections● The following table shows the change in fund balance under various sensitivity
scenarios described in Slide 25
FYE17 FYE18 FYE19 FYE20 FYE21 FYE22 FYE23 FYE24 FYE25 FYE26
Adjusted Baseline - Change in Fund Balance (4,062)$ (3,879)$ (5,744)$ (8,175)$ (10,074)$ (10,155)$ (9,992)$ (9,359)$ (7,317)$ (6,040)$
Sensitivity 4: 1% COLA in 2018Increase in payroll expenditures - 568 567 565 563 562 561 559 558 557 Increase in pension expenditures - 64 61 61 102 146 193 242 294 300 Increase in OPEB and healthcare expenditures - - - - - - - - - - Increase in expenditures - total - 632 628 625 665 707 753 801 851 857 Change in Fund Balance (4,062)$ (4,511)$ (6,372)$ (8,800)$ (10,739)$ (10,863)$ (10,746)$ (10,159)$ (8,169)$ (6,897)$
Sensitivity 5: Combination of Sensitivities 1, 3 and 4Increase in payroll expenditures - 568 567 565 563 562 561 559 558 557 Increase in pension expenditures - 64 61 207 556 1,086 1,816 2,765 3,785 4,835 Increase in OPEB and healthcare expenditures 320 1,105 1,640 2,279 3,035 3,928 4,978 6,211 7,585 9,094 Increase in expenditures - total 320 1,737 2,268 3,050 4,154 5,577 7,355 9,535 11,928 14,486 Change in Fund Balance (4,382)$ (5,616)$ (8,012)$ (11,225)$ (14,228)$ (15,732)$ (17,347)$ (18,894)$ (19,245)$ (20,526)$

40
Budget Projections● One cost control option is to increase employee contributions toward Pension and/or Healthcare
cost.
– A 1% increase in employee contribution for pension programs and monthly employee contributions of $100/$200/$300 for Single/Couple/Family medical coverage under the adjusted baseline scenario will result in an additional $451,000 and $1,532,000 contribution for the Pension and Healthcare plans respectively for FYE18.
● The following table shows the impact of employee contributions on City budget for both the adjusted baseline and combination of sensitivity scenarios described in the previous slide.
FYE17 FYE18 FYE19 FYE20 FYE21 FYE22 FYE23 FYE24 FYE25 FYE26
Adjusted BaselineChange in Fund Balance - adjusted baseline (4,062)$ (3,879)$ (5,744)$ (8,175)$ (10,074)$ (10,155)$ (9,992)$ (9,359)$ (7,317)$ (6,040)$ 1% Increase in employee contribution - Pension - 451 449 447 445 443 441 439 437 436 Increase in employee contribution - Healthcare - 1,532 1,532 1,532 1,532 1,532 1,532 1,532 1,532 1,532 Increase in employee contribution - total - 1,983 1,981 1,979 1,977 1,975 1,973 1,971 1,969 1,967 Change in Fund Balance - additional contributions (4,062) (1,896) (3,763) (6,196) (8,097) (8,180) (8,019) (7,388) (5,348) (4,073)
Combination of Sensitivities 1, 3 and 4Change in Fund Balance - combination of sensitivities (4,382)$ (5,616)$ (8,012)$ (11,225)$ (14,228)$ (15,732)$ (17,347)$ (18,894)$ (19,245)$ (20,526)$ 1% Increase in employee contribution - Pension - 456 454 451 449 447 445 443 441 440 Increase in employee contribution - Healthcare - 1,532 1,532 1,532 1,532 1,532 1,532 1,532 1,532 1,532 Increase in employee contribution - total - 1,988 1,985 1,983 1,981 1,978 1,976 1,975 1,973 1,971 Change in Fund Balance - additional contributions (4,382) (3,628) (6,027) (9,242) (12,247) (13,753) (15,370) (16,919) (17,273) (18,555)

41
Questions and Answers
Thank you for your time !