city of cape may water system master plan review
TRANSCRIPT
City of Cape May
Water System Master Plan Review
Presentation to Mayor & CouncilCouncil Work Session
March 3, 2020
Thomas R. Thornton, PE, CMEMark A. Tompeck, PE, DBIA, ENV SP
Brian T. Dougherty, PE

Mott MacDonald March 3, 2020
Water System Master Plan Scope• City’s goal is to continue to provide water supply that is:
• Safe – meets all current/proposed drinking water quality standards & regulations
• Adequate – satisfactory capacity and pressure for public consumption and fire protection
• Reliable – minimizing the potential for service interruptions
• Economical - cost-effective system operation and improvements
• Objectives of Master Plan:• Assess current system condition
• Review regulatory compliance for system operation & water quality
• Evaluate production capabilities & distribution system
• Master Plan Result:• Comprehensive assessment system assets and operations
• Recommendations for future improvements

Mott MacDonald March 3, 2020
Water System Master Plan Contents• Overview & History • Water Demand Analysis• Water Allocation Evaluation• Review of Source Water Quality• Review of Operations and Maintenance • Assessment of Water Distribution & Storage• Assessment of Water Production & Treatment • Recommended Capital Improvement Program

Mott MacDonald March 3, 2020
Water System History• Water Supply Timeline
• 1910 – 1940 – City supplied by shallow, unconfined wells
• 1940 – 1950 – City supplied by Cohansey Aquifer Well Nos. 1 and 2• Well Nos. 1 & 2 were located in the City; eventually abandoned due to high chloride levels
• 1940’s – Coast Guard base added to service area when their also had to be abandoned.
• 1950 – 1998 – City supplied by Cohansey Aquifer Well Nos. 3, 4 & 5• Wells were located further inland – Well No. 3 at WTP and Well Nos. 4&5 along railroad in Lower Twp.
• 1972 – Cape May Point and West Cape May added to service area after their wells failed
• 1994 – Well No. 3 taken off line due to water quality
• 1997 – Well No. 4 taken off line due to water quality
• 1998 – City supplied by Desalination Facility
• 2017 – City constructs Well No. 8
Mott MacDonald March 3, 2020
Water System Overview• Cape May City Municipal Water System
• Consists of source, treatment, transmission, distribution and storage infrastructure.
• Serves approx. 5,000 permanent customers in Cape May City and wholesale customers:• Cape May Point
• West Cape May
• US Coast Guard Base
• System Demands • Average Day Demand = 1.1 million gallons per day (MGD)
• Maximum Day Demand = 2.91 MGD
• Summer Demands = 4 times normal ‘off-season’ demand
• Non-revenue (unaccounted-for) water is approx. 16%
• Future Demand projections show a minor increase (5%) in demands over 10 years

Mott MacDonald March 3, 2020
Water Allocation Evaluation• Water Allocation Process
• Regulated by NJDEP Bureau of Water Allocation
• Details operating limits and criteria for monitoring & reporting
• City’s Permit in effect to Sept. 2026• Allocation Permit Conditions & Surplus/Deficit Analysis
Parameter Historical Maximum Demand
Allocation Permit Limits
Surplus (+) / Deficit (-)
Annual Allocation - All Wells (MGY) 574.20 838.00 +263.80
Monthly Allocation - All Wells (MGM) 91.23 115.00 +23.77Annual Allocation Cohansey Aquifer (MGY) 112.63 160.00 +47.37
Annual Allocation Atlantic City 800-Ft Sand Aquifer (MGY) 462.95 678.00 +215.05

Mott MacDonald March 3, 2020
Assessment of Distribution & Storage Facilities• Distribution System:
• 190,000 ft (36 miles) of 1” to 16” water main piping
• Two water storage tanks • Canning House Lane Standpipe – 1,000,000 gallons total capacity (450,000 gallons effective capacity)
• Madison & Columbia Ave Elevated Tank – 700,000 gallons capacity
• Transmission Mains• Stimpson Lane Transmission (10” & 12”) – supply W. Cape May & Cape May Point
• Broadway Transmission Main (12”) – supply to downtown & W. Cape May
• Cape Island Creek Transmission Main (16”) – crosses Cape Island Creek and marsh areas
• System Evaluation • Developed WaterGEMS hydraulic model to analyze system performance
• Analyzed both summer and winter conditions
• Water storage assessment to confirm compliance with Water Supply Management Act

Mott MacDonald March 3, 2020
Assessment of Distribution & Storage Facilities

Mott MacDonald March 3, 2020
Assessment of Distribution & Storage Facilities• Findings
• Wholesale metering improvements • Current W. Cape May metering is calculated using 6 different meters
• Connections from Broadway Transmission Main
• Storage Analysis• Existing 1.15 MG effective storage in 2 tanks is adequate
• Modeling analysis to review system performance (flow & pressure) & fire protection capability• Identified 4 primary distribution improvements
• Approx. 12,000 LF of improvements to upsize mains and complete loops to improve flows
• Identified transmission improvements
• Cape Island Creek 16” ACP Transmission Main rehabilitation
• Transfer ownership of Broadway Transmission Main & construct paralled main on Park Boulevard
Mott MacDonald March 3, 2020
Review of Operations and Maintenance• Water Quality Accountability Act (N.J.S.A. 58:31-1):
• Enacted July 21, 2017 & Effective October 19, 2017; Administrative code still under development
• Applies to water purveyors with more than 500 service connections
• Intent is to improve safety, reliability, and administrative oversight of water infrastructure
• Requirements:• Maintenance requirements for valves & hydrants
• Locate & GPS all valves / Exercise <12” every 4 years / Exercise 12”> every 2 years
• Locate & GPS all hydrants / test all hydrants annually
• Record keeping for maintenance activities
• Mitigation plans for NJDEP violations
• Asset Management Plan
• Annual Certification
Mott MacDonald March 3, 2020
Review of Operations and Maintenance• WQAA Compliance
• Valves & hydrants – GPS located as part of GIS development
• Record Keeping – capabilities in GIS and MM-Fit
• Asset Management Plan – completed (Water Master Plan)
• Recommendations • Implement computerized maintenance management system (CMMS)
• Develop formal valve inspection and maintenance program• Utilize GIS to record maintenance information for valve and hydrants
Mott MacDonald March 3, 2020
Review of Source Water Quality• Atlantic City 800-Foot Sand Aquifer
• Elevated sodium & chloride (above NJDEP Recommended Upper Limit (RUL))
• Water quality has been and is expected to remain relatively stable
• Operation of Well No. 8 will impact aquifer and current monitoring program should continue
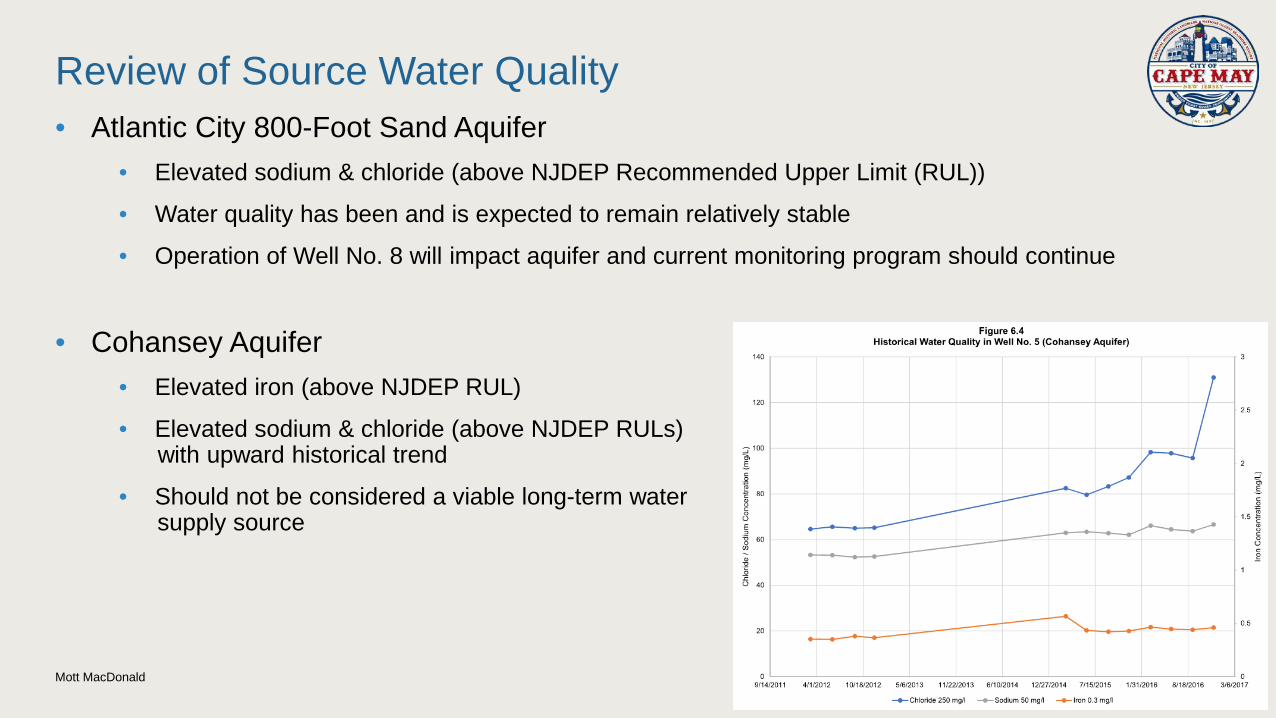
• Cohansey Aquifer• Elevated iron (above NJDEP RUL)
• Elevated sodium & chloride (above NJDEP RULs) with upward historical trend
• Should not be considered a viable long-term water supply source
Mott MacDonald March 3, 2020
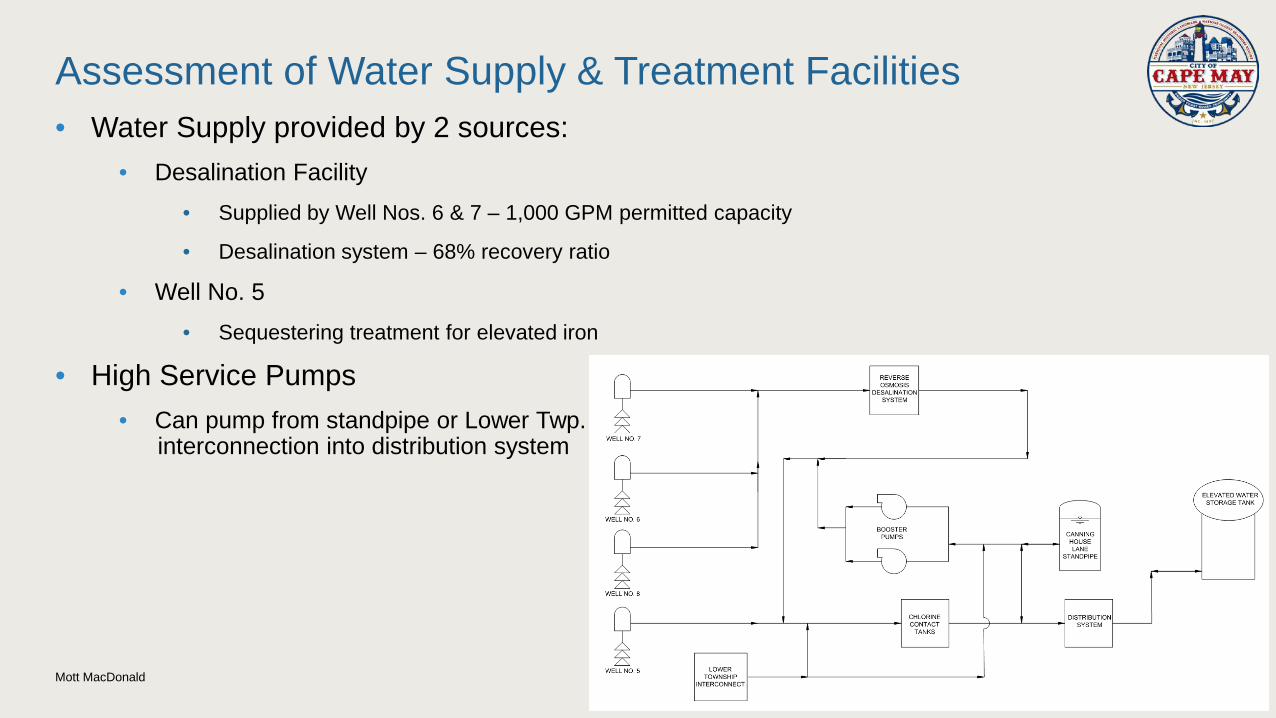
Assessment of Water Supply & Treatment Facilities• Water Supply provided by 2 sources:
• Desalination Facility • Supplied by Well Nos. 6 & 7 – 1,000 GPM permitted capacity
• Desalination system – 68% recovery ratio
• Well No. 5 • Sequestering treatment for elevated iron
• High Service Pumps• Can pump from standpipe or Lower Twp.
interconnection into distribution system
Mott MacDonald March 3, 2020
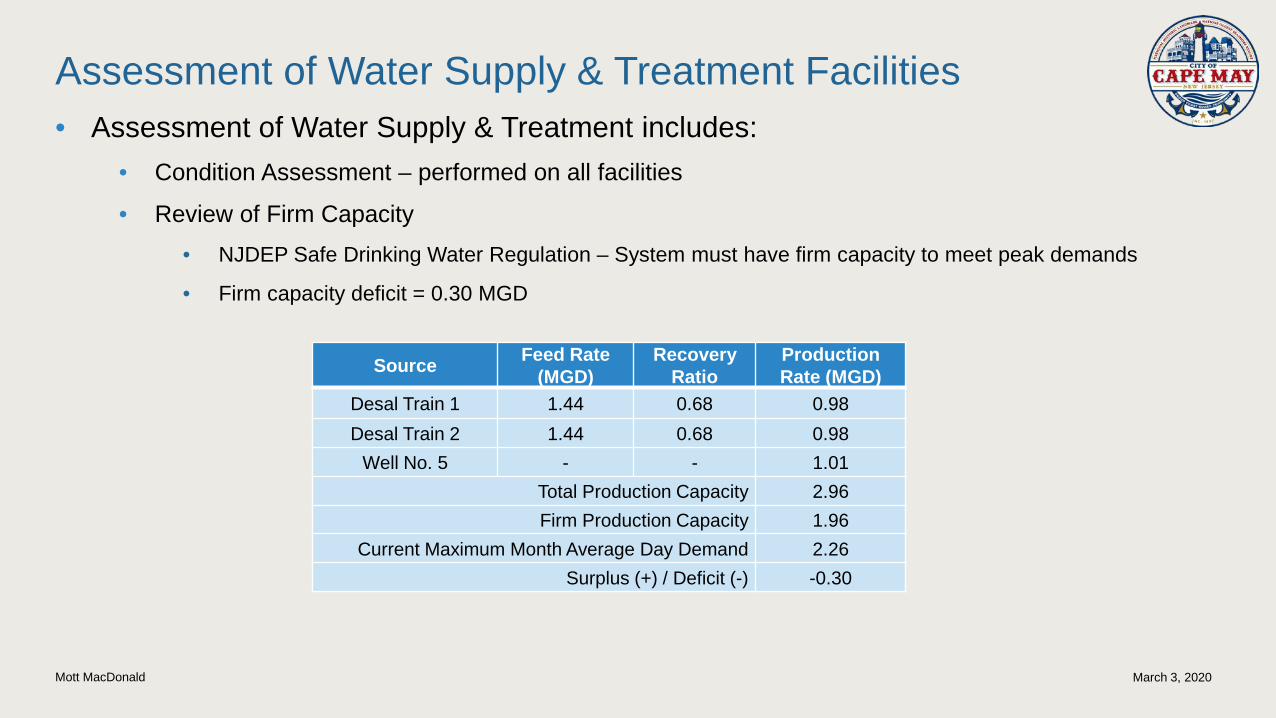
Assessment of Water Supply & Treatment Facilities• Assessment of Water Supply & Treatment includes:
• Condition Assessment – performed on all facilities
• Review of Firm Capacity• NJDEP Safe Drinking Water Regulation – System must have firm capacity to meet peak demands
• Firm capacity deficit = 0.30 MGD
Source Feed Rate (MGD)
Recovery Ratio
Production Rate (MGD)
Desal Train 1 1.44 0.68 0.98Desal Train 2 1.44 0.68 0.98
Well No. 5 - - 1.01Total Production Capacity 2.96Firm Production Capacity 1.96
Current Maximum Month Average Day Demand 2.26Surplus (+) / Deficit (-) -0.30

Mott MacDonald March 3, 2020
Assessment of Water Supply & Treatment Facilities• Desalination Facility
• Rated for 2 MGD
• Supplied by Well Nos. 6 & 7 (Well No. 8 is backup)
• Utilizes Reverse Osmosis (RO) technology
• Consists of two RO membrane trains
• Desalination System Equipment • Anti-scalant chemical feed system
• Cartridge Filters – 4 filters, rated for 500 GPM each
• Feed pumps – 3 vertical pumps, 1,000 GPM & 200 Hp each
• Membranes – 2 skids, 26 pressure vessels per skid
• Clean-in-Place System – chemical feed to clean membrane 2x per yr.
• Post-Treatment chemical feed – lime feed and calcium hypochlorite

Mott MacDonald March 3, 2020
Assessment of Water Supply & Treatment Facilities
Mott MacDonald March 3, 2020
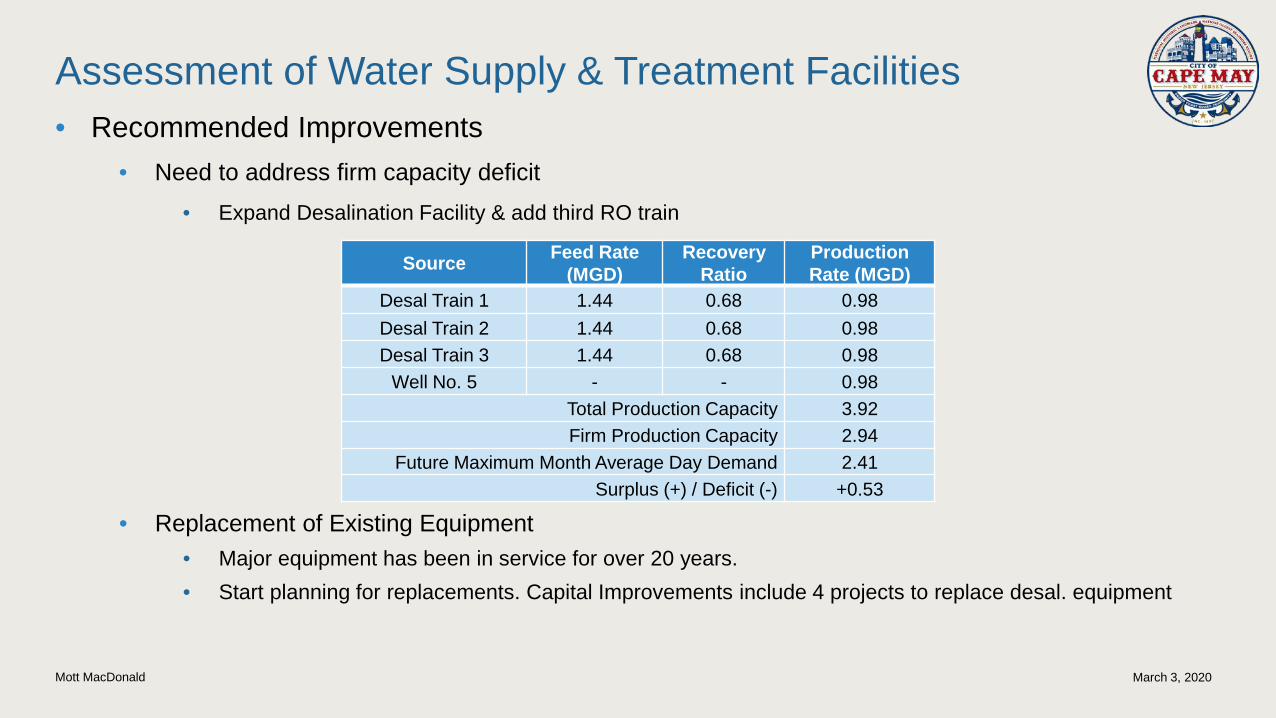
Assessment of Water Supply & Treatment Facilities• Recommended Improvements
• Need to address firm capacity deficit • Expand Desalination Facility & add third RO train
• Replacement of Existing Equipment • Major equipment has been in service for over 20 years. • Start planning for replacements. Capital Improvements include 4 projects to replace desal. equipment
Source Feed Rate (MGD)
Recovery Ratio
Production Rate (MGD)
Desal Train 1 1.44 0.68 0.98Desal Train 2 1.44 0.68 0.98Desal Train 3 1.44 0.68 0.98
Well No. 5 - - 0.98Total Production Capacity 3.92Firm Production Capacity 2.94
Future Maximum Month Average Day Demand 2.41Surplus (+) / Deficit (-) +0.53

Mott MacDonald March 3, 2020
Assessment of Water Supply & Treatment Facilities
Mott MacDonald March 3, 2020
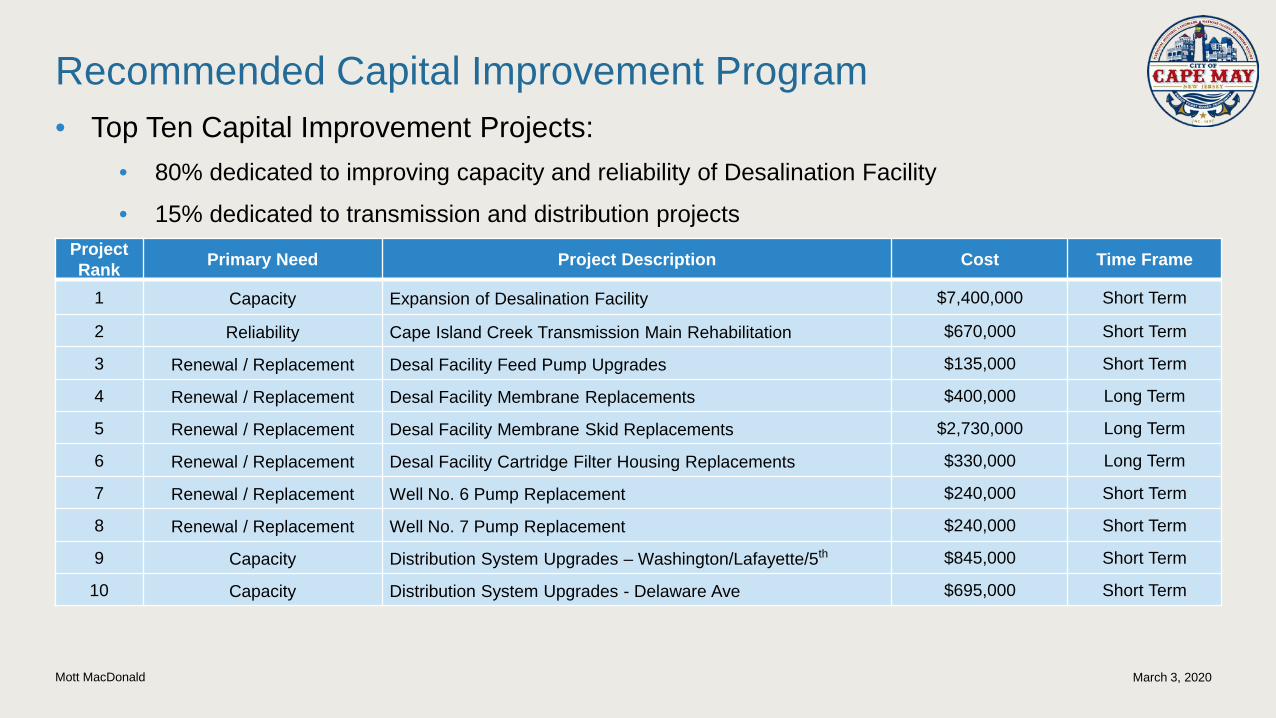
Recommended Capital Improvement Program• Top Ten Capital Improvement Projects:
• 80% dedicated to improving capacity and reliability of Desalination Facility
• 15% dedicated to transmission and distribution projectsProject Rank Primary Need Project Description Cost Time Frame
1 Capacity Expansion of Desalination Facility $7,400,000 Short Term
2 Reliability Cape Island Creek Transmission Main Rehabilitation $670,000 Short Term
3 Renewal / Replacement Desal Facility Feed Pump Upgrades $135,000 Short Term
4 Renewal / Replacement Desal Facility Membrane Replacements $400,000 Long Term
5 Renewal / Replacement Desal Facility Membrane Skid Replacements $2,730,000 Long Term
6 Renewal / Replacement Desal Facility Cartridge Filter Housing Replacements $330,000 Long Term
7 Renewal / Replacement Well No. 6 Pump Replacement $240,000 Short Term
8 Renewal / Replacement Well No. 7 Pump Replacement $240,000 Short Term
9 Capacity Distribution System Upgrades – Washington/Lafayette/5th $845,000 Short Term
10 Capacity Distribution System Upgrades - Delaware Ave $695,000 Short Term
Mott MacDonald March 3, 2020
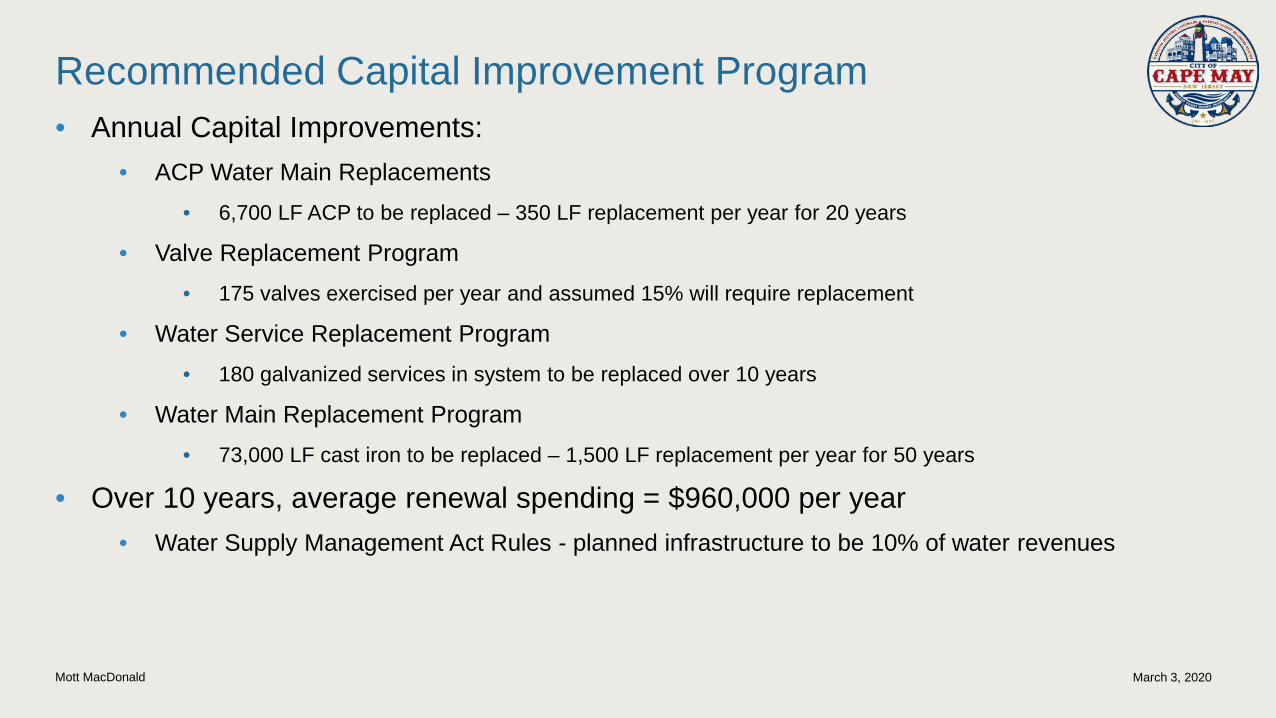
Recommended Capital Improvement Program• Annual Capital Improvements:
• ACP Water Main Replacements• 6,700 LF ACP to be replaced – 350 LF replacement per year for 20 years
• Valve Replacement Program• 175 valves exercised per year and assumed 15% will require replacement
• Water Service Replacement Program• 180 galvanized services in system to be replaced over 10 years
• Water Main Replacement Program • 73,000 LF cast iron to be replaced – 1,500 LF replacement per year for 50 years
• Over 10 years, average renewal spending = $960,000 per year• Water Supply Management Act Rules - planned infrastructure to be 10% of water revenues

Mott MacDonald March 3, 2020
Recommended Capital Improvement Program• Report includes detailed project sheets for each recommendation with:
• Project justification;
• implementation schedules;
• regulatory considerations; and
• estimated construction costs as well as legal, engineering & administrative costs
• Capital Program Summary:
Project Time Frame Time Frame Budget Estimated
Annual Every year(2019 – 2028)
$960,000 (Annual)$9,600,000 (Total)
Short-Term With 1 – 4 years (2019 – 2022) $10,780,000
Long-Term 5 – 10 years (2023 – 2028) $8,805,000
Total $29,185,000

Mott MacDonald March 3, 2020
Recommended Capital Improvement Program
Annual Renewal, 32.9%
Renewal / Replacement, 14.0%
Capacity, 32.0%
Reliability, 8.3%
Operational Efficiency, 0.6% Regulatory, 12.3%
Capital Improvement Plan – Area of Need

Mott MacDonald March 3, 2020
Recommended Capital Improvement Program• Other Recommendations (Programs/Studies/Operational):
• Implement computerized maintenance management system (CMMS)
• Develop Valve Inspection and Maintenance Program
• Perform AWWA Water Audit – review of non-revenue (unaccounted-for) water
• Conduct Leak Detection and Mitigation Program
• Annual Interconnection Testing Program
• Continue quarterly source water quality monitoring

Thank you