city council update - escribe meetings
TRANSCRIPT

City Council UpdateRenewable Energy
February 10, 2020
John StephensonPresident & CEO
Peterborough Utilities Group
Nancy Brown AndisonChair
City of Peterborough Holdings Inc.
John WynsmaChief Operating Officer
Peterborough Utilities Inc.
David BignellVice‐Chair
City of Peterborough Holdings Inc.
Introductions

Presentation Agenda
1. Climate Change and Renewable Energy2. About Peterborough Utilities Inc. (PUI)3. The Ontario Market4. Our Historical Performance and Future Potential 5. Concluding Remarks6. Questions
3
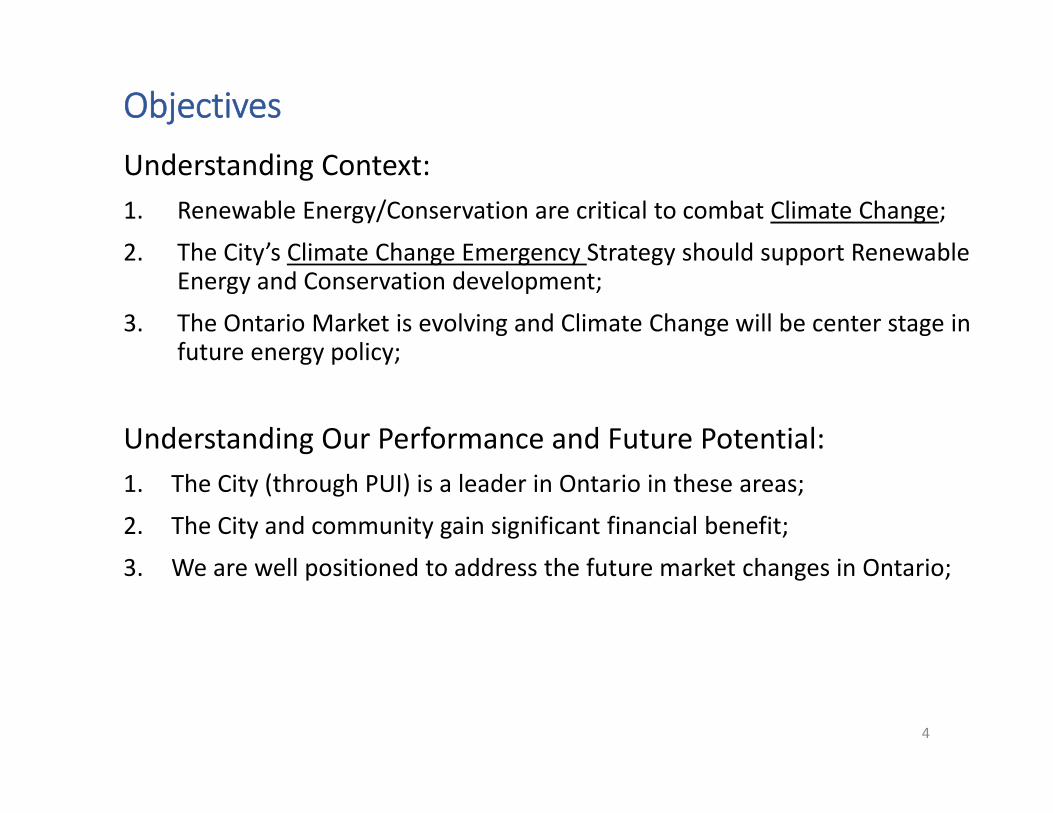
ObjectivesUnderstanding Context:1. Renewable Energy/Conservation are critical to combat Climate Change;
2. The City’s Climate Change Emergency Strategy should support Renewable Energy and Conservation development;
3. The Ontario Market is evolving and Climate Change will be center stage in future energy policy;
Understanding Our Performance and Future Potential:1. The City (through PUI) is a leader in Ontario in these areas;
2. The City and community gain significant financial benefit;
3. We are well positioned to address the future market changes in Ontario;
4

Climate Change and Renewable Energy
5
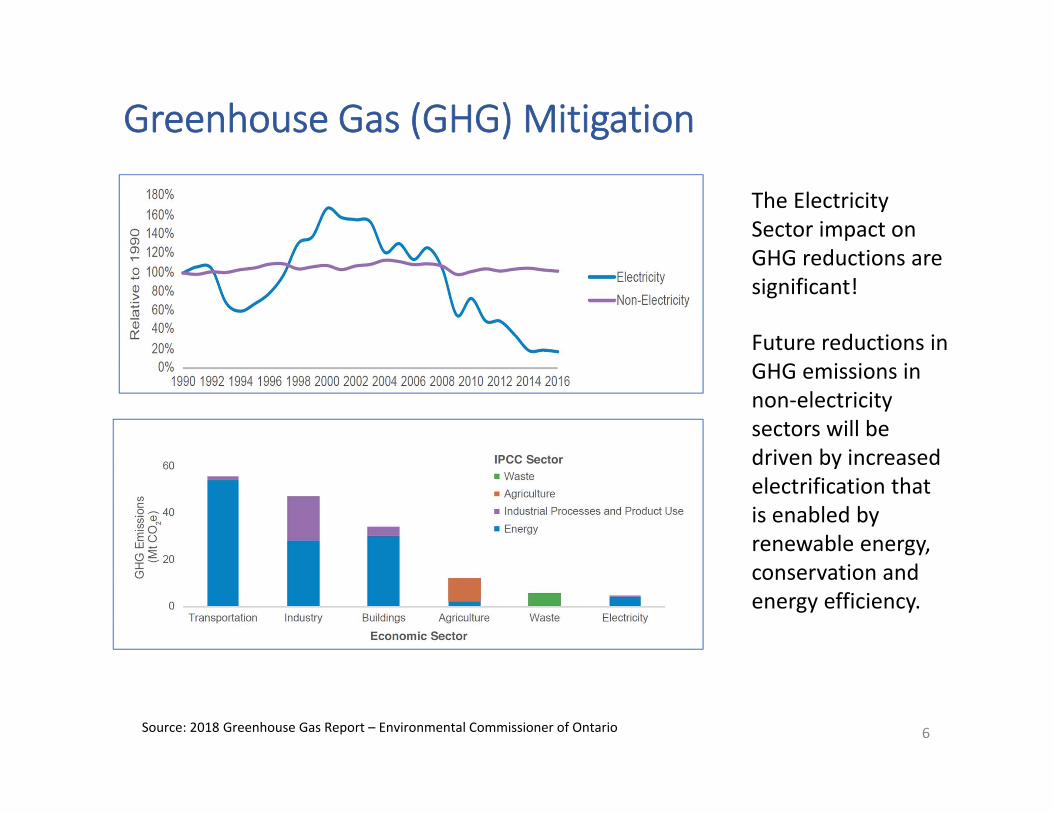
Greenhouse Gas (GHG) Mitigation
The Electricity Sector impact on GHG reductions are significant!
Source: 2018 Greenhouse Gas Report – Environmental Commissioner of Ontario 6
Future reductions in GHG emissions in non‐electricity sectors will be driven by increased electrification that is enabled by renewable energy, conservation and energy efficiency.
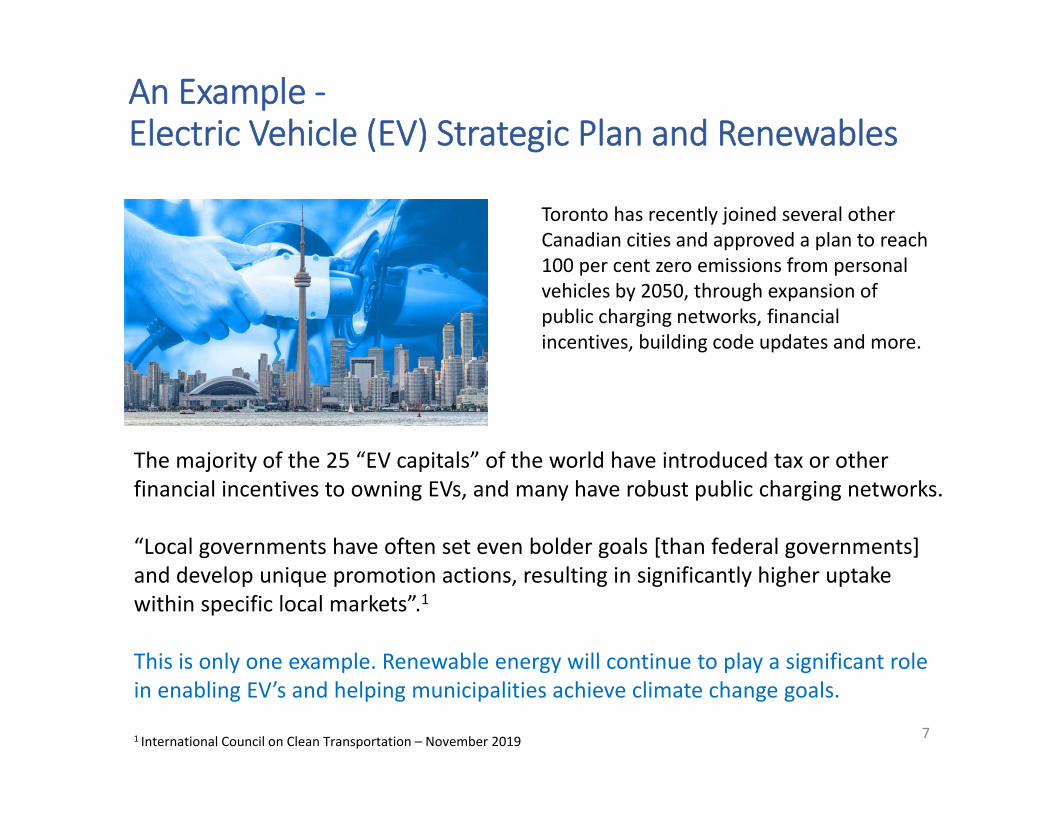
An Example ‐Electric Vehicle (EV) Strategic Plan and Renewables
7
Toronto has recently joined several other Canadian cities and approved a plan to reach 100 per cent zero emissions from personal vehicles by 2050, through expansion of public charging networks, financial incentives, building code updates and more.
The majority of the 25 “EV capitals” of the world have introduced tax or other financial incentives to owning EVs, and many have robust public charging networks.
“Local governments have often set even bolder goals [than federal governments] and develop unique promotion actions, resulting in significantly higher uptake within specific local markets”.1
This is only one example. Renewable energy will continue to play a significant role in enabling EV’s and helping municipalities achieve climate change goals.
1 International Council on Clean Transportation – November 2019
About Peterborough Utilities Inc. (PUI)• Our principal purpose is to develop, acquire, build and operate clean renewable energy generation;
• We provide meter and other services to the renewable energy industry;
• We have taken a leadership position in the renewable sector in Ontario;
• We have created local economic gains and positive community impact;
• The City of Peterborough is the sole beneficial owner;
8

Our Renewable Generation Growth
7.3
15.3 15.3 15.3 19.2 19.2 19.2 19.2
25.1 29.1 29.1
10.0 10.0 10.0 10.0 10.0 10.9
10.9 10.9
18.4
1.6 1.6 1.6 2.0
2.0 2.0
2.0
‐
10.0
20.0
30.0
40.0
50.0
60.0
2009 2010 2011 2012 2013 2014 2015 2016 2017 2018 2019
Installed Generation Capacity (MW)Hydro Solar Biogas
The growth of our renewable generation business is occurring concurrently with electricity sector evolution and GHG reductions.
We have capitalized on past electricity sector changes and opportunities.
9
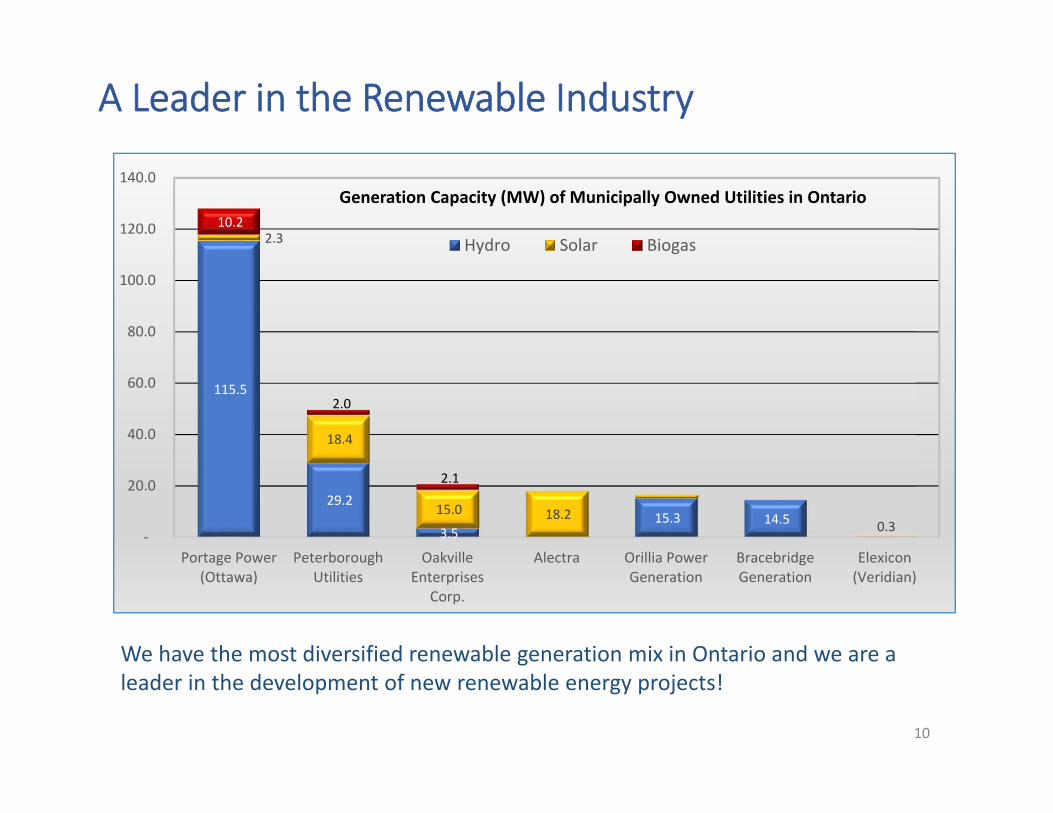
A Leader in the Renewable Industry
We have the most diversified renewable generation mix in Ontario and we are a leader in the development of new renewable energy projects!
10
115.5
29.2
3.5 15.3 14.5
2.3
18.4
15.0 18.2 0.3
10.2
2.0
2.1
‐
20.0
40.0
60.0
80.0
100.0
120.0
140.0
Portage Power(Ottawa)
PeterboroughUtilities
OakvilleEnterprises
Corp.
Alectra Orillia PowerGeneration
BracebridgeGeneration
Elexicon(Veridian)
Generation Capacity (MW) of Municipally Owned Utilities in Ontario
Hydro Solar Biogas
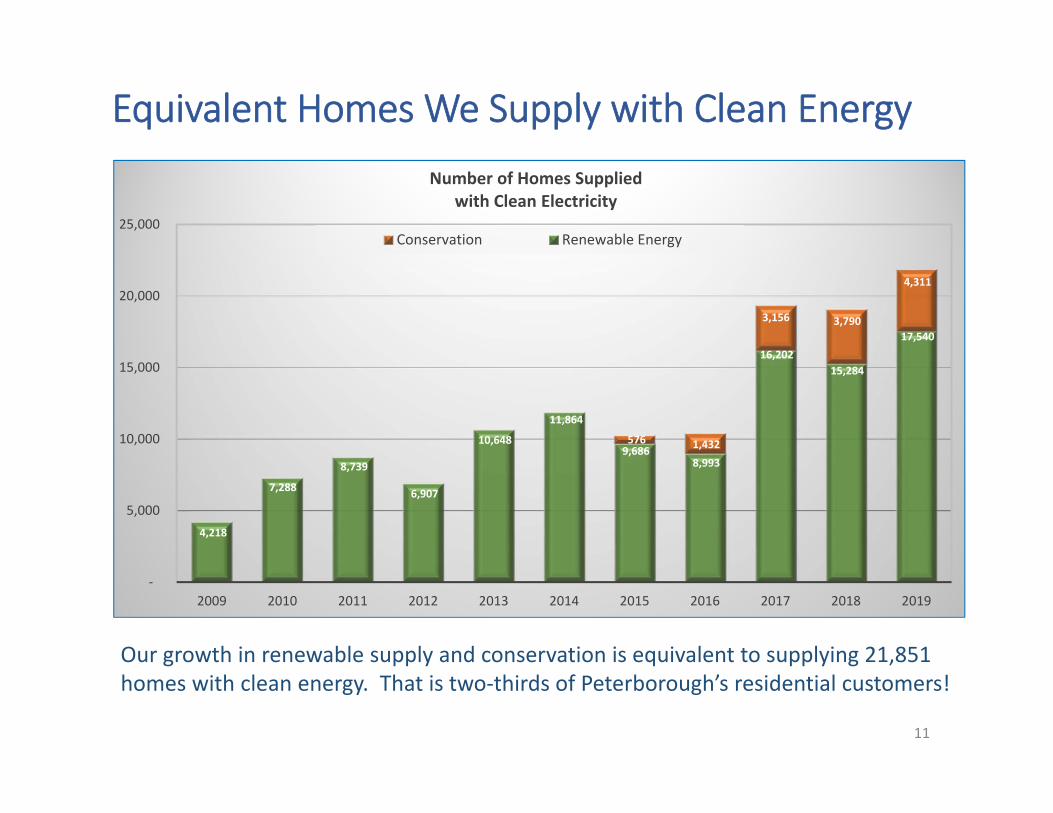
Equivalent Homes We Supply with Clean Energy
Our growth in renewable supply and conservation is equivalent to supplying 21,851 homes with clean energy. That is two‐thirds of Peterborough’s residential customers!
11
4,218
7,288
8,739
6,907
10,648
11,864
9,686 8,993
16,202 15,284
17,540
576 1,432
3,156 3,790
4,311
‐
5,000
10,000
15,000
20,000
25,000
2009 2010 2011 2012 2013 2014 2015 2016 2017 2018 2019
Number of Homes Suppliedwith Clean Electricity
Conservation Renewable Energy

Economic Impact of Infrastructure InvestmentThe Ontario Chamber of Commerce has published an independent, non‐partisan study on the economic impacts of investment in infrastructure projects:
• Research demonstrates that the impact of infrastructure spending on job creation is significant. For every $1 billion in infrastructure spending, it is estimated that 16,700 jobs are supported for one year.
• Investment in infrastructure also spreads throughout the economy via a series of multiplier effects. For every $1 billion in infrastructure spending, studies have consistently shown an economic multiplier ranging from 1.14 to 1.78 (i.e. $1.14 billion to $1.78 billion increase in GDP).
• Analysis has found that only about one‐fifth of the economic benefits of infrastructure investment comes from the capital spent; approximately 80% comes from long‐term economic spin‐off activities.
• Furthermore, infrastructure investment results in lowered business costs and increased labour productivity.
12
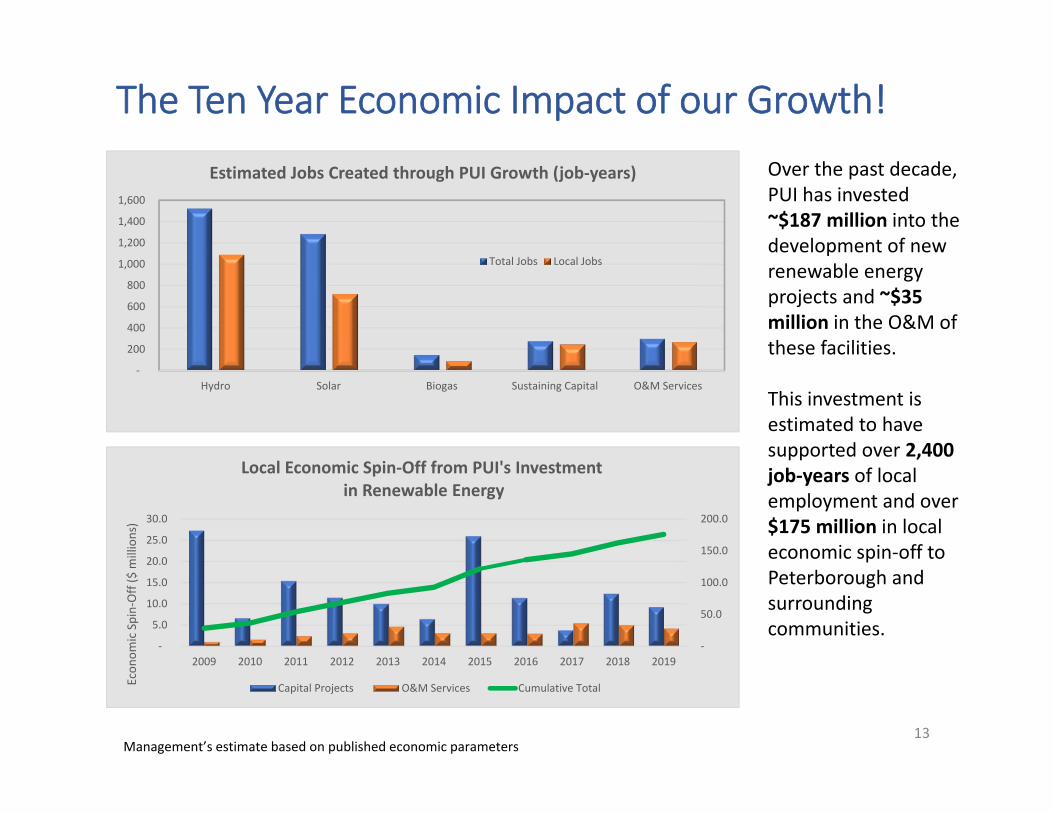
The Ten Year Economic Impact of our Growth!
13Management’s estimate based on published economic parameters
‐
200
400
600
800
1,000
1,200
1,400
1,600
Hydro Solar Biogas Sustaining Capital O&M Services
Estimated Jobs Created through PUI Growth (job‐years)
Total Jobs Local Jobs
Over the past decade, PUI has invested ~$187 million into the development of new renewable energy projects and ~$35 million in the O&M of these facilities.
This investment is estimated to have supported over 2,400 job‐years of local employment and over $175 million in local economic spin‐off to Peterborough and surrounding communities.
‐
50.0
100.0
150.0
200.0
‐
5.0
10.0
15.0
20.0
25.0
30.0
2009 2010 2011 2012 2013 2014 2015 2016 2017 2018 2019
Econ
omic Spin‐Off ($ millions)
Local Economic Spin‐Off from PUI's Investmentin Renewable Energy
Capital Projects O&M Services Cumulative Total

Community Partners, Safety and Sustainability
14
We are a community partner. We have developed projects in partnership with Trent University, the Trent‐Severn Waterway, the Curve Lake First Nation, several neighbouring municipalities and the City of Peterborough.
Safety and Sustainability are two of our primary goals in the development, operation and maintenance of our renewable generating stations. We are recognized for our safety leadership in the electricity sector!

The Ontario Market
15

Opportunities ‐Forecast Energy Demand Increasing and Evolving
Energy Demand is forecast to grow at 0.9% per annum, primarily from growth and electrification of the commercial and residential sectors and an uptake in EV’s.
16
Further emphasis on Climate Change will accelerate electrification of the commercial and residential sectors (geothermal, electric heat pumps, energy storage) and EV usage for both transportation and energy storage ‐ creating opportunity!

Opportunities ‐Forecast Energy Supply Mix Changing
Energy demand is forecast to be met through nuclear refurbishment and increased use of our existing Natural Gas plants.
17
The predicted increased usage of Natural Gas plants to supply energy will come under greater scrutiny as Climate Change emphasis continues – creating opportunity!
Future Opportunities in the Ontario Market
• Climate Change objectives will continue to drive greater integration of renewables and energy storage, and other opportunities such as the integration of geothermal heating/cooling systems and EV’s.
• Hydroelectric power has broad support amongst all political parties and the public creating potential opportunities for future expansion or redevelopment (i.e. Water Street Pumphouse).
• Energy storage (battery and pump storage) is emerging as a new opportunity to meet capacity needs for industrial/commercial customers, LDC’s and the grid.
• Opportunities are emerging to acquire existing generation assets as some developers leave Ontario to pursue opportunities in other jurisdictions.
• The IESO recognizes that a capacity auction may not be best suited for all resources and is currently reviewing alternative programs to enable future development of these resources (i.e. renewables).
18

Our Historical Performance and Future Potential
19

Renewable Investment Growth
Investment in renewable generation has produced the majority of growth over the past decade.
20
$0
$50
$100
$150
$200
$250
$300
$350
2010 2011 2012 2013 2014 2015 2016 2017 2018 2019
Total Assets (in millions of $)
Services PDI PUI

Renewable Investment Drives City Dividends
1. Distributions to the City have grown with renewable investment.
2. Created ~$40 million in shareholder value > the amount invested.
3. Dividends are driven by renewable investment.
4. Dividends are high and continue to grow, unlike other Municipal owned utilities.
21
‐ 1.000 2.000 3.000 4.000 5.000 6.000 7.000
2008 2009 2010 2011 2012 2013 2014 2015 2016 2017 2018 2019
City Dividend Contribution(in millions of $)
Services PDI PUI
‐
20
40
60
80
100
01234567
Accumulated
Annu
al
Payments to the City of Peterborough(in millions of $)
Accumulated Payments Annual Total
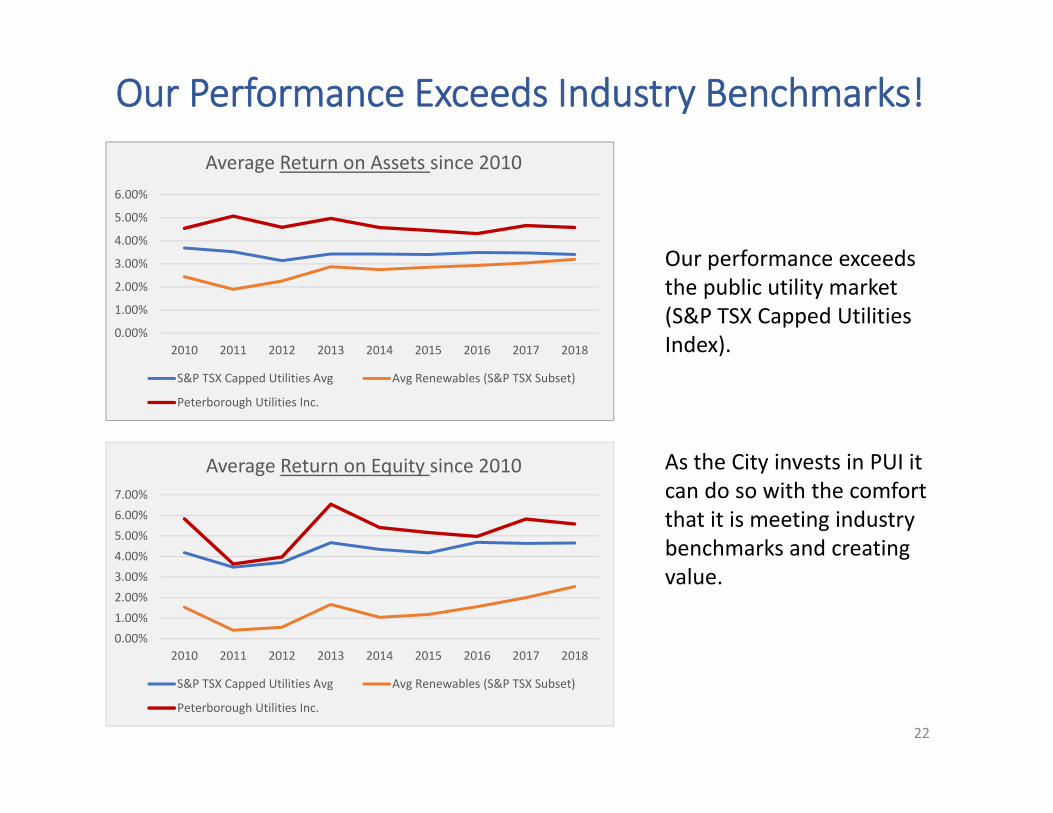
Our Performance Exceeds Industry Benchmarks!
Our performance exceeds the public utility market (S&P TSX Capped Utilities Index).
As the City invests in PUI it can do so with the comfort that it is meeting industry benchmarks and creating value.
22
0.00%
1.00%
2.00%
3.00%
4.00%
5.00%
6.00%
2010 2011 2012 2013 2014 2015 2016 2017 2018
Average Return on Assets since 2010
S&P TSX Capped Utilities Avg Avg Renewables (S&P TSX Subset)
Peterborough Utilities Inc.
0.00%1.00%2.00%3.00%4.00%5.00%6.00%7.00%
2010 2011 2012 2013 2014 2015 2016 2017 2018
Average Return on Equity since 2010
S&P TSX Capped Utilities Avg Avg Renewables (S&P TSX Subset)
Peterborough Utilities Inc.
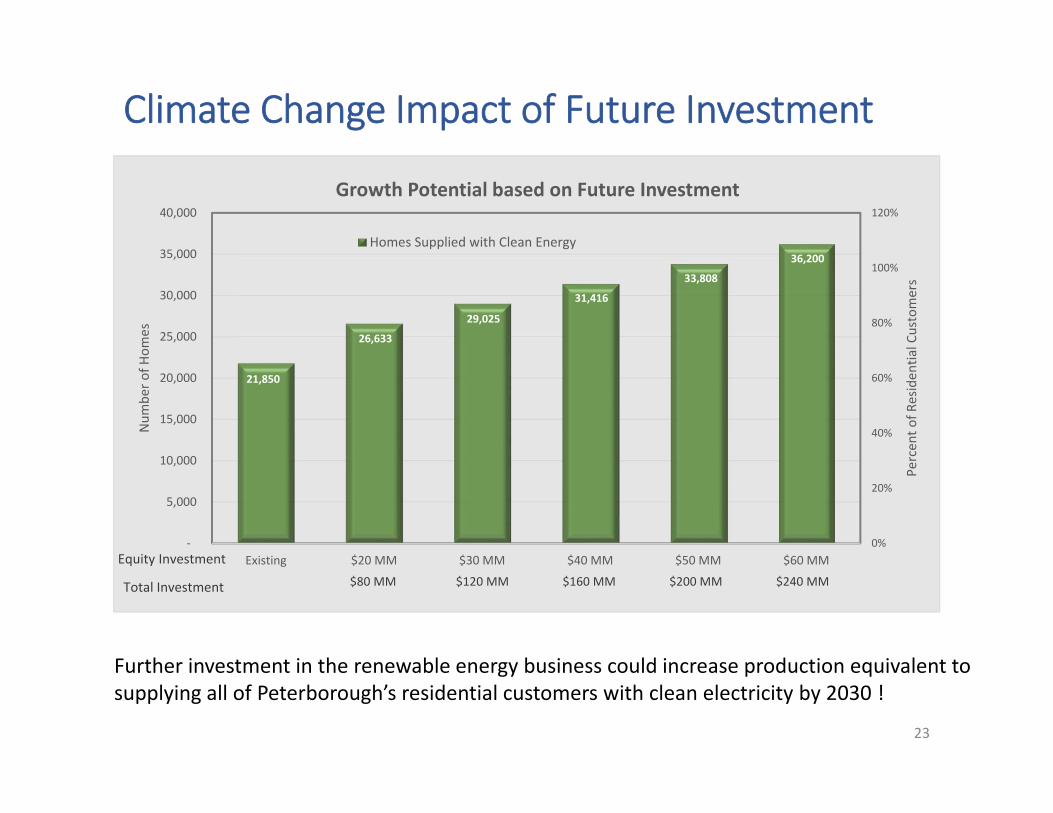
Climate Change Impact of Future Investment
23
21,850
26,633
29,025
31,416
33,808
36,200
0%
20%
40%
60%
80%
100%
120%
‐
5,000
10,000
15,000
20,000
25,000
30,000
35,000
40,000
Existing $20 MM $30 MM $40 MM $50 MM $60 MM
Percen
t of R
esiden
tial Customers
Num
ber o
f Hom
es
Equity Investment
Growth Potential based on Future Investment
Homes Supplied with Clean Energy
Total Investment $80 MM $120 MM $160 MM $200 MM $240 MM
Further investment in the renewable energy business could increase production equivalent to supplying all of Peterborough’s residential customers with clean electricity by 2030 !

Economic Impact of Future Investment
24
Further investment has the opportunity to support up to 6,000 local job‐years of employment and to create economic spin‐off valued at over $230 million over the life* of the projects! (* Assumes 40 years for hydro and 20 years for solar.)
‐
50.0
100.0
150.0
200.0
250.0
300.0
350.0
400.0
450.0
‐
1,000
2,000
3,000
4,000
5,000
6,000
7,000
Existing $20 MM $30 MM $40 MM $50 MM $60 MM
Econ
omic Spin‐Off ($ millions)
# Local Job
s Sup
ported
Equity Investment
Estimated Local Jobs & Economic Spin‐Off From Future Investment in Renewables
Local Jobs
Economic Spin‐Off
Total Investment $80 MM $120 MM $160 MM $200 MM $240 MM

Concluding Remarks
25
Concluding Remarks1. We are an industry leader in renewable development and conservation;
2. Renewable development and conservation are key past and future components to Climate Change improvement;
3. We will continue to be a key player in Climate Change Strategy;
4. Our impact extends well beyond profitability:1. Local employment;2. Positive economic impact from investment and operations;3. Community partnership and community contribution;4. A proven and sustainable climate improvement engine;5. Positioning to support future energy market evolution.
5. In addition, we provide:1. Strong cash returns to the City;2. Financial performance that is strong, compared to the industry;3. Increase in long‐term value for the City of Peterborough.
26

Questions
27