cities kamstrup meetingsmart-cities-centre.org/wp-content/uploads/kamstrup_foredrag2.pdf · 44 1 no
TRANSCRIPT

CITIES Kamstrup MeetingHidden Markov models for indirect classi�cation of occupancy behaviour
Jon A. R. Liisberg
DTU Compute
18. August 2015
Jon A. R. Liisberg (DTU Compute) CITIES Kamstrup Meeting 18. August 2015 1 / 29

Overview
1 Introduction
2 Data
3 Results
4 Outlook
Jon A. R. Liisberg (DTU Compute) CITIES Kamstrup Meeting 18. August 2015 2 / 29

Introduction
Problem description
By applying Hidden Markov models (HMMs) on electricity consumptionfrom smart meter data the hypothesis, is that we can:
1 Classify the states of the HMM in accordance to occupancy behaviour.
2 Identify possible covariates/explanatory variables.
3 forecasting and simulation of the future energy consumption.
1), 2) and 3) can be solved by both homogeneous and time inhomogeneousmodels. It is suggested that to improve the forecasting and simulation,covariates/explanatory variables and time inhomogeneous Markov chains,are needed.
Jon A. R. Liisberg (DTU Compute) CITIES Kamstrup Meeting 18. August 2015 3 / 29

Data
Data
The data is collected in and nearby an apartment building inCatalonia, Spain.
The data consist of hourly weather data from a nearby weather stationand smart metering data of the apartments.
The data was measured from mid July 2012 till the end of December2013.
Jon A. R. Liisberg (DTU Compute) CITIES Kamstrup Meeting 18. August 2015 4 / 29
Data
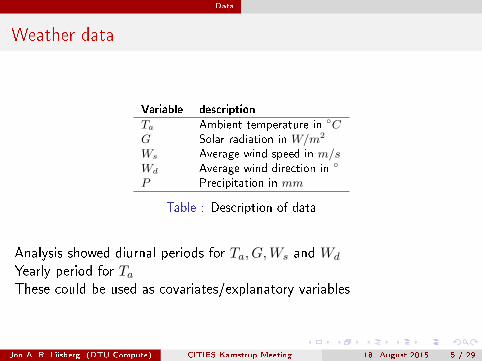
Weather data
Variable description
Ta Ambient temperature in ◦CG Solar radiation in W/m2
Ws Average wind speed in m/sWd Average wind direction in ◦
P Precipitation in mm
Table : Description of data
Analysis showed diurnal periods for Ta, G,Ws and Wd
Yearly period for Ta
These could be used as covariates/explanatory variables
Jon A. R. Liisberg (DTU Compute) CITIES Kamstrup Meeting 18. August 2015 5 / 29

Data
Smart metering data
Variable description
xe Electricity consumption in kWhxsh Space heating in kWhxhw Hot water consumption in kWhxw Water consumption in litters
xit Interior temperature in ◦C
Table : Description of data
Due to a large number of zero observations the smart metering data isaggregated from 10 minute intervals to hourly intervals.
The space heating, hot water and water measurements are integer.
The electricity measurements are discrete with increments of 0.01.
The complete data set consist of 44 apartments
Electricity consumption is chosen to apply HMMs on
Jon A. R. Liisberg (DTU Compute) CITIES Kamstrup Meeting 18. August 2015 6 / 29

Results Homogeneous HMM
Homogeneous HMM for apartment 2
Using gamma distributions for the state dependent distributions a 3 statemodel was found suiable.
Table : Estimated parameters for the three state HMM for apartment 2 andcalculated stationary distribution, mean and variance
State k θ γi1 γi2 γi3 δ Mean Variance
1 7.74 0.012 0.85 0.14 0.01 0.52 0.09 0.001
2 7.30 0.040 0.21 0.73 0.06 0.38 0.29 0.012
3 5.14 0.205 0.00 0.30 0.70 0.10 1.05 0.216
1 Low consumption
2 Medium consumption
3 High consumption
Jon A. R. Liisberg (DTU Compute) CITIES Kamstrup Meeting 18. August 2015 7 / 29

Results Homogeneous HMM
Global decoding
Figure : Average probability pro�les of being in given state, dependent on time ofday, time of year and ambient temperature. The blue squares denote the relativeamount of observations for each month or temperature interval
Jon A. R. Liisberg (DTU Compute) CITIES Kamstrup Meeting 18. August 2015 8 / 29
Results Homogeneous HMM
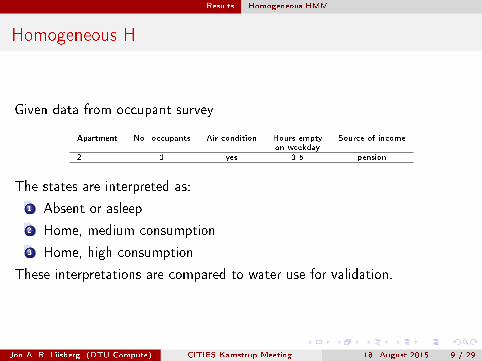
Homogeneous H
Given data from occupant survey
Apartment No. occupants Air-condition Hours empty Source of incomeon weekday
2 1 yes 3-5 pension
The states are interpreted as:
1 Absent or asleep
2 Home, medium consumption
3 Home, high consumption
These interpretations are compared to water use for validation.
Jon A. R. Liisberg (DTU Compute) CITIES Kamstrup Meeting 18. August 2015 9 / 29

Results Homogeneous HMM
Comparison with water use
Figure : Counts of water and hot water use given state and time of day
Jon A. R. Liisberg (DTU Compute) CITIES Kamstrup Meeting 18. August 2015 10 / 29

Results Homogeneous HMM
Summary of homogeneous HMMs
Homogeneous HMMs �tted on 14 apartments(several more but with localmaximum)
10 apartments 3 states found suitable
4 apartments 4 states found suitable
Jon A. R. Liisberg (DTU Compute) CITIES Kamstrup Meeting 18. August 2015 11 / 29

Results Homogeneous HMM
Temperature dependence
Observation of temperature dependence
State 1 2 3 4Apartment
1 - - -
2 - - yes
3 yes yes -
5 - - - -
7 yes yes -
12 - yes -
15 - - -
18 - - -
25 yes yes -
26 - - - -
29 - - -
30 - - -
35 yes yes yes -
44 - - - -
Jon A. R. Liisberg (DTU Compute) CITIES Kamstrup Meeting 18. August 2015 12 / 29

Results Homogeneous HMM
Classi�cation of pro�les
Table : Apartments classi�ed based on the average probability pro�le
Class Apartments
afternoon/evening absence 2
equal probability for being home or away 1, 5, 7, 26 and 35
mostly at home 3, 18, 29 and 44
mostly away 12, 15, 25 and 30
Jon A. R. Liisberg (DTU Compute) CITIES Kamstrup Meeting 18. August 2015 13 / 29
Results Homogeneous HMM
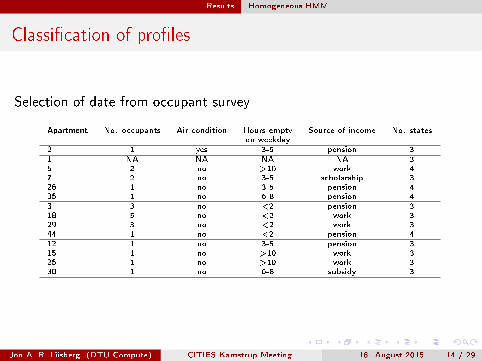
Classi�cation of pro�les
Selection of date from occupant survey
Apartment No. occupants Air-condition Hours empty Source of income No. stateson weekday
2 1 yes 3-5 pension 3
1 NA NA NA NA 35 2 no >10 work 47 2 no 3-5 scholarship 326 1 no 3-5 pension 435 1 no 6-8 pension 4
3 3 no <2 pension 318 5 no <2 work 329 3 no <2 work 344 1 no <2 pension 4
12 1 no 3-5 pension 315 1 no >10 work 325 1 no >10 work 330 1 no 6-8 subsidy 3
Jon A. R. Liisberg (DTU Compute) CITIES Kamstrup Meeting 18. August 2015 14 / 29

Results Homogeneous HMM
Common parameters
Figure : Box-plots of the parameters estimates for the state dependentdistributions and the stationary distribution
Jon A. R. Liisberg (DTU Compute) CITIES Kamstrup Meeting 18. August 2015 15 / 29
Results Homogeneous HMM
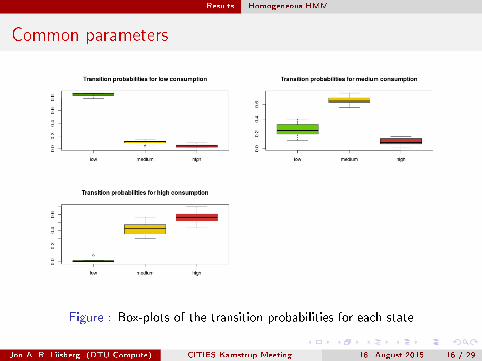
Common parameters
Figure : Box-plots of the transition probabilities for each state
Jon A. R. Liisberg (DTU Compute) CITIES Kamstrup Meeting 18. August 2015 16 / 29

Results Inhomogeneous HMM
Inhomogeneous HMM
The inhomogeneous HMMs are time dependentThe time dependence is modelled in the transition probability matrix by aFourier series with a number of sin- cosine pairs to describe the diurnalvariation
Jon A. R. Liisberg (DTU Compute) CITIES Kamstrup Meeting 18. August 2015 17 / 29

Results Inhomogeneous HMM
Inhomogeneous HMM, Apartment 18
Using the number of states found suitable for the homogeneous HMM forapartment 18, 2 sin- cosine pairs was found suitable.The �gure shows the model generated probability pro�les given no. sin-cosine pairs.
Figure : Model generated daily probability pro�les, with increasing no. sin- cosinepairs in the transition probabilities
Jon A. R. Liisberg (DTU Compute) CITIES Kamstrup Meeting 18. August 2015 18 / 29
Results Inhomogeneous HMM
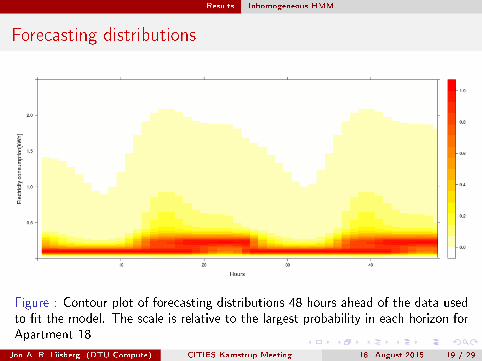
Forecasting distributions
Figure : Contour plot of forecasting distributions 48 hours ahead of the data usedto �t the model. The scale is relative to the largest probability in each horizon forApartment 18
Jon A. R. Liisberg (DTU Compute) CITIES Kamstrup Meeting 18. August 2015 19 / 29

Results Inhomogeneous HMM
CRPS
Figure : Comparison of the CRPS between homogeneous and timeinhomogeneous model for Apartment 18
Jon A. R. Liisberg (DTU Compute) CITIES Kamstrup Meeting 18. August 2015 20 / 29

Results Inhomogeneous HMM
Summary of inhomogeneous HMMs
High consumption not captured for some apartments
Forecast similar observations as for Apartment 18
CRPS similar observations as for Apartment 18
Jon A. R. Liisberg (DTU Compute) CITIES Kamstrup Meeting 18. August 2015 21 / 29

Results Inhomogeneous HMM
Common parameters
Figure : Box-plots of state dependent parameters for the inhomogeneous 3 statemodels
Jon A. R. Liisberg (DTU Compute) CITIES Kamstrup Meeting 18. August 2015 22 / 29

Results Inhomogeneous HMM
Common parameters
Figure : Box-plots of transition probability parameters for the inhomogeneous 3state modelsJon A. R. Liisberg (DTU Compute) CITIES Kamstrup Meeting 18. August 2015 23 / 29

Results Temperature dependent inhomogeneous HMMs
Temperature dependent inhomogeneous HMM, Apartment 2
The temperature dependence is modelled in the mean value of the stateswhere the dependence was observed.
Figure : Mean values in high consumption state over one year
Jon A. R. Liisberg (DTU Compute) CITIES Kamstrup Meeting 18. August 2015 24 / 29

Results Temperature dependent inhomogeneous HMMs
Forecasting distributions
Forecasting distributions for inhomogeneous and temperature dependentmodel.
Jon A. R. Liisberg (DTU Compute) CITIES Kamstrup Meeting 18. August 2015 25 / 29

Results Temperature dependent inhomogeneous HMMs
CRPS
Figure : CRPS comparison between the homogeneous model, timeinhomogeneous and the time inhomogeneous temperature dependent models
Jon A. R. Liisberg (DTU Compute) CITIES Kamstrup Meeting 18. August 2015 26 / 29

Results Temperature dependent inhomogeneous HMMs
Summary temperature dependent inhomogeneous HMMs
Did not yield good results due to varying mean values in the lowerconsumption states
Smoothing of mean values is needed
Jon A. R. Liisberg (DTU Compute) CITIES Kamstrup Meeting 18. August 2015 27 / 29

Results Temperature dependent inhomogeneous HMMs
Discussion/Conclusion
With HMMs we have
Classi�ed states in accordance to occupancy behaviour
�low consumption� and �absent or asleep��medium consumption� and �home��high consumption� and �home, high consumption�
Identi�ed dependency on temperature for several apartments
Improved forecasting by inhomogeneous HMMs
Observed distinct occupancy patterns
Found it plausible to model population models, both for homogeneousand inhomogeneous HMMs
Found model de�ciencies
High consumption (varying coe�cients)Changing behaviour (adaptive methods)Temperature dependent mean values (Smoothing)
Jon A. R. Liisberg (DTU Compute) CITIES Kamstrup Meeting 18. August 2015 28 / 29

Outlook
Outlook
Classify occupancy patterns
Examine other data given a state (heat consumption with lowprobability of occupant in�uence)
Forecasting of electricity consumption (apartment building/road/citywith population models)
Simulation of electricity consumption (apartment building/road/citywith population models)
Consumer apps
Jon A. R. Liisberg (DTU Compute) CITIES Kamstrup Meeting 18. August 2015 29 / 29