cima business challenge case study (2017) locations... · natural gas reserves are estimated to...
TRANSCRIPT
CIMA Business Challenge Case
Study general material
YJ - Oil and gas industry
1
YJ - Oil and gas industry case
Industry background Oil is a naturally formed liquid found in the Earth’s crust and preserved there for many millions of years. Oil is being extracted in increasing volumes and is vital to many industries for maintaining industrial growth and for nearly all forms of transportation. Natural gas is used in a wide variety of industrial processes, for electricity generation, as well as for domestic heating. Natural gas is described as the “cleanest” of all fossil fuels, as it generates the lowest levels of carbon emissions of all of the fossil fuels. The Middle East remains the region of the world which has the largest proven oil reserves, with Saudi Arabia alone possessing over 20% of the known global oil reserves. Additionally, the UK’s North Sea and areas in USA, Canada and Russia still have substantial reserves. Also there is an increase in oil and gas exploration being undertaken in, and around the coasts of, Asian and African countries.
It is not known how long the world's oil reserves will last. The oil industry has stated that there are only 40 years of proven reserves. However, with improved technology, there is expected to be the ability to extract more oil from known reserves. Therefore, the length of time that oil reserves will last is expected to exceed 40 years. However, another factor affecting the life of oil reserves is the speed of consumption. This had been forecast to grow at a higher rate than has actually occurred in recent years. Cutting oil consumption further will prolong the life of global oil reserves.
Natural gas reserves are estimated to last for over 60 years at the current global rate of consumption. However, this forecast may be understated as new gas reserves are identified and come into production. These natural gas reserves are based on geological and engineering information on the volumes that can be extracted using existing economic and operating conditions. New natural gas fields are being discovered and with the use of new technology gas reserves are able to enter production in some of the climatically harsher areas of the world, including in the sub- Arctic area. Hydraulic fracturing is a technique used to extract natural gas, including shale gas, from rock layers below ground using pressurised fluids and is widely used in the USA. The rising demand for natural gas, particularly from Asia, may push up natural gas prices.
Almost all off-shore oil fields also contain reserves of natural gas. Therefore, drilling and production of oil also provides the opportunity to produce and sell natural gas from these reserves.
A glossary of terms and definitions is shown on page 15.
There are three major sectors in the oil and gas industry. These are:
1. Upstream – this involves the exploration, drilling of exploratory wells, subsequent
drilling and production of crude oil and natural gas. This is referred to as the “exploration and production” (E&P) business sector.
2. Midstream – this involves the transportation of oil by tankers around the world and
the refining of crude oil. Gas is transported in two ways, either by gas pipeline or by freezing the gas to transform it into a liquid and transporting it in specialised tanker ships. Gas in this form is called Liquefied Natural Gas (LNG).

3
3. Downstream – this involves distributing the by-products of the refined oil and gas down to the retail level. The by-products include gasoline, diesel and a variety of other products.
Most large international oil and gas companies are known as being "integrated" because they combine upstream activities (oil and gas exploration and extraction), midstream (transportation and the refining process) and downstream operations (distribution and retailing of oil and gas products).
This case study is concerned only with upstream operations and some basic transportation of oil and gas by tankers to port within the oil and gas industry.
The oil and gas industry comprises a variety of company types including the following:
Operating companies - these hold the exploration and production licences and
operate production facilities. Most of these are the large multi-national companies which are household names. Many of these companies, although retaining the production licence, outsource the entire production operation.
Drilling companies - these are contracted to undertake specialist drilling work. They own and maintain their own mobile drilling rigs and usually operate globally.
Major contractors - these are companies which provide outsourced operational and maintenance services to the large operating companies.
Floating production, storage and offloading vessels (FPSO’s) – these companies operate and maintain floating production, storage and offloading facilities. These look like ships but are positioned at oil and gas production sites for years at a time.
Service companies – these outsourcers provide a range of specialist support services including test drilling, divers and even catering services for off-shore drilling facilities.
Licences All companies operating in the exploration and production (E&P) sector need to have a licence to operate each oil and gas field. Each country around the world owns the mineral rights to all gas and oil below ground or under the sea within its territorial waters. The country which owns the mineral rights will wish to take a share in the profits derived from any oil or gas produced. This generates enormous revenues for these mineral rich countries.
The government of the country which owns the onshore or off-shore land will issue a licence based on a set of criteria. Any company wishing to operate in the E&P sector needs to prove its credentials to the respective government in terms of:
its technical ability to bring the potential oil and gas fields into production
its awareness and track record in respect of environmental issues
the company’s financial capacity in respect of the investment required to bring the oil and gas field into production.
As such the above items are known as critical success factors in the industry.
After an E&P company has identified a potential site through surveys (but before any drilling has commenced) it needs to apply for a licence. Licensing is conducted in differing ways in different areas of the world and there are a variety of alternative types of licence that can be applied for. An E&P company could simply apply for a licence to test drill. Test drilling identifies whether an oil and gas field exists and establishes the
4
size of it. Once test drilling establishes the existence of commercial levels of oil and gas an E&P company could then apply for a production licence. A production licence allows it to drill and take the oil and gas fields into production. Licences can be sold on once acquired to other companies, subject to approval by the government that issued the licence in the first place.
The governments of the countries which have the natural resources of oil and gas raise large amounts of revenue from licensing the right to test drill and to bring the oil and gas fields into production. There are several ways in which the government raises funds from licensing, including entering into a joint venture agreement with the oil and gas company to share profits.
The most commonly used form of licensing is through a “Production-Sharing Agreement” (PSA) licence. A PSA licence is where the government will take an agreed negotiated percentage share in the profits generated by the production of oil and gas, i.e. potential revenues from the production of oil and gas less the amortised cost of production drilling, any royalty taxes (see below) and all of the production costs. However, the entire cost and risk of test drilling rests with each E&P company. If no oil or gas is produced, then the entire test drilling loss rests with the oil and gas company. The government will only share in the profits when oil and gas are actually produced. The split of profits usually allows the oil and gas company to have the largest share, but this will vary from government to government and on negotiation skills. Additionally, most governments also impose a “royalty” tax, based on a percentage of the market value of the oil and gas production. This emphasis on taxes being based on production rather than sale encourages E&P companies not to hold large inventories of extracted reserves (perhaps waiting for prices increases).
Depending on negotiations and the number of E&P companies applying for a licence, the government which owns the oil and gas field is sometimes able to take a large percentage of the profits, often making production of oil and gas uneconomic for the oil and gas company. This is clearly self-defeating!
Success in being awarded a licence will depend on negotiations concerning the split of profits, and also in some countries the relationship between the oil and gas company and government officials. Companies bidding for potentially lucrative licences have sometimes made illegal payments to government officials or their representatives to gain favour. It is often difficult to determine whether a particular oil and gas company has been selected due to its competitive bid, its competence, or whether it was due to the relationship with a government official.
Some of the smaller E&P companies apply initially for a licence to drill to identify the size of the reserves at the oil and gas field and subsequently sell the proven oil and gas reserves to a larger oil and gas production company. This larger company then applies for a production licence. However, some E&P companies proceed to apply for a production licence and commence producing oil and gas which they sell on the open market, and share the resultant profits with the licensing government in accordance with its licence.
In this industry knowledge carries value. An area that only has the potential for oil and gas reserves is not as valuable as one that has proven reserves. In this way if an E&P company can merely demonstrate it has found oil it needn’t actually produce the oil to make a return.

4
Once an oil and gas field has been test drilled to determine the proven size of oil and gas reserves, production drilling can commence. The time taken from identification of a potential oil and gas field to the start of oil being produced normally varies between one and three years, depending on the technical difficulties being faced. Deepwater fields are much more difficult and expensive, and delays here are common.
The total capital investment for drilling undertaken in each licensed gas and oil field that goes into production can reach, or even exceed, US$ 100 million and depends on a number of factors. For example, the cost could exceed US$ 500 million if the oil and gas fields are in deep water locations and many production wells are required. A field (if large enough) could warrant many individual wells.
The market determines the price of oil and gas by the interaction between demand and supply. It is one of the few markets in the world where this is true. As a result E&P companies cannot “set” their own prices as the price is determined by the market.
To research how demand and supply based pricing works follow this link http://en.wikipedia.org/wiki/Supply_and_demand
5
Independent oil and gas exploration and production (E&P) companies Independent oil and gas E&P companies are an important feature in the liberalised global energy market. The UK and some other European countries have a substantial and growing oil and gas exploration and production business sector which comprises a range of small listed companies. Some are listed on Alternative Investment Markets (AIMs) whereas others have a full stock exchange listing. The investors are typically large institutional investors. They look for long term growth in the share price as an E&P company becomes successful in identifying and bringing new oil and gas fields into production.
These small European oil and gas exploration and production companies have almost 200 offshore drilling licences spread across over 50 countries worldwide. These companies play a vital role in the oil and gas exploration and production industry. They have a wide knowledge of the industry and their employees have the expertise and skill base to research and identify possible oil and gas fields, and to bring those with the most potential into production.
YJ Ltd
YJ Ltd (YJ) is a UK company which was listed on AIM in January 2010 with an initial public offering (IPO) of US$ 60 million. Its main shareholders are 12 large institutional shareholders which together own 96% of the shares. YJ had been formed two years earlier with the purpose of identifying potential oil and gas fields that could be brought into production.
The principal activity of YJ is the exploration of, and production from oil and gas fields. The company’s strategy is to explore, appraise and develop into production its licensed oil and gas fields both safely and responsibly. Value is created as YJ proceeds through the initial stages of exploration through to production.
A summary of YJ’s current operations is shown on pages 8-9.
To date, YJ has been successful in identifying and bringing into production three oil and gas fields. This involved obtaining the required licences, test drilling and then proceeding through to production drilling at these three locations. It has therefore been successful in achieving its investors’ expectations. However, the oil and gas exploration industry is hugely capital intensive before any oil or gas can be brought into production and sold. Therefore, equity funding alone was inadequate to fund YJ’s plans. Following the identification of YJ’s first two oil and gas fields in 2011, it secured loans totalling US$ 140 million to help to finance production drilling. These loans are repayable in 2021 and are at an interest rate of 11% per year. It was able to secure this funding after successful test drilling and obtaining licences, and obtaining an independent report on the proven oil and gas reserves at these two locations.
YJ’s bank also provides an overdraft facility of a maximum of US$ 5 million to help meet the peak demands in working capital. The overdraft interest rate is 12% per year.
It is clear from the interest rates above that the lender of the loan funds and the bank providing the overdraft saw similar levels of risk (as the interest rates charged on the loans were similar). Overdrafts, being unsecured, are traditionally viewed as risky but here the loans were also viewed as carrying higher levels of risk. This is because of the lack of traditional assets upon which to secure the loans. The loan financier could be
6
said to be accepting higher than usual levels of risk in return for higher than usual returns in the form of interest. This is normal in this industry.
YJ’s board
YJ’s board consists of a non-executive Chairman and five non-executive directors as well as six executive directors.
A summary of YJ’s board is shown in Appendix 1 on page 16.
Oliver Penn is the founding Chief Executive Officer (CEO). He had always wanted to form an E&P company and to recruit a team of experts in their specialised areas who he could trust to share his vision of success. He was very pleased with YJ’s success since YJ’s formation in 2008. However, he suffered serious ill health and chose to retire in April 2016.
Ullan Shah is the newly appointed CEO and started in June 2016. He has spent his first month since starting visiting all of YJ’s operational oil and gas fields, and speaking to the geologists and survey teams on current potential oil and gas fields. At the first board meeting after Ullan Shah had been appointed, he informed his colleagues that he wants YJ to identify and bring new oil and gas fields into operation at a faster rate than currently achieved. Orit Mynde (Chief Financial Officer) was concerned that YJ did not currently have adequate funding in place for test and production drilling at new locations. This is because almost all of YJ’s cash generated from operations was already being spent on current operational oil and gas fields as well as on surveying potential new oil and gas fields. Further new funding would be required for test and production drilling at any newly licensed oil and gas fields, depending on if, and when, YJ was to be granted further licences.
YJ’s shares and financials
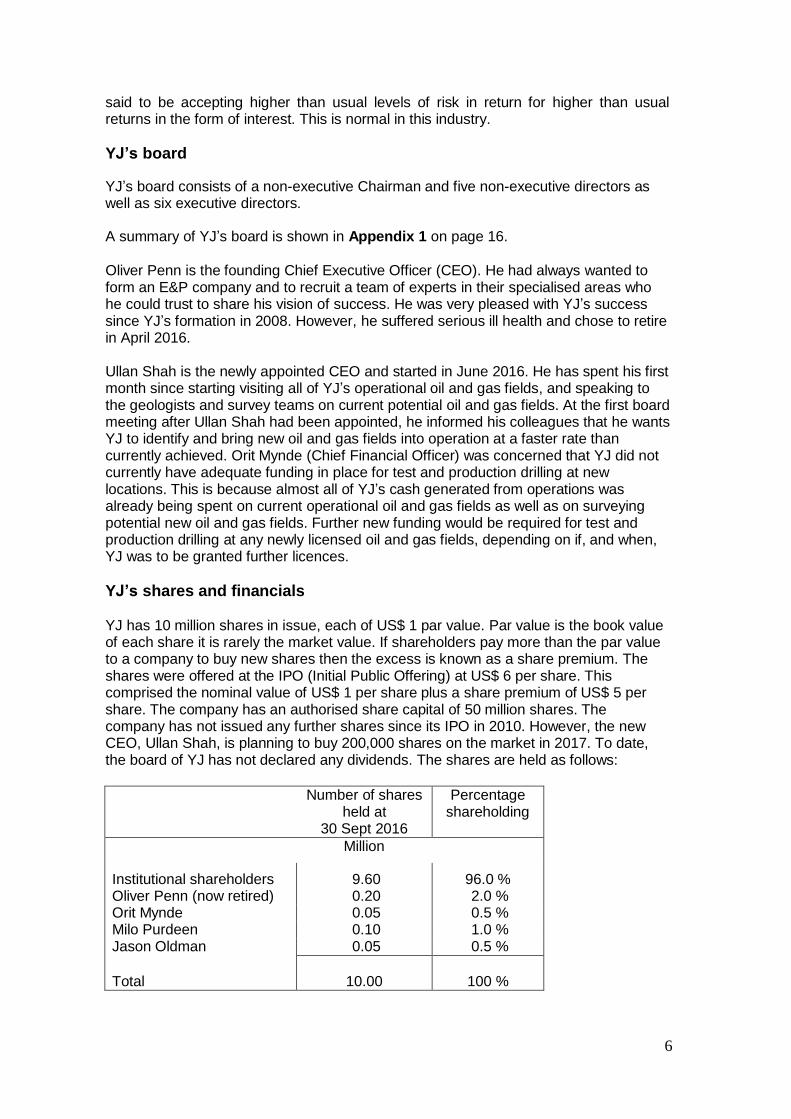
YJ has 10 million shares in issue, each of US$ 1 par value. Par value is the book value of each share it is rarely the market value. If shareholders pay more than the par value to a company to buy new shares then the excess is known as a share premium. The shares were offered at the IPO (Initial Public Offering) at US$ 6 per share. This comprised the nominal value of US$ 1 per share plus a share premium of US$ 5 per share. The company has an authorised share capital of 50 million shares. The company has not issued any further shares since its IPO in 2010. However, the new CEO, Ullan Shah, is planning to buy 200,000 shares on the market in 2017. To date, the board of YJ has not declared any dividends. The shares are held as follows:
Number of shares
held at 30 Sept 2016
Percentage shareholding
Million
Institutional shareholders
9.60
96.0 % Oliver Penn (now retired) 0.20 2.0 % Orit Mynde 0.05 0.5 % Milo Purdeen 0.10 1.0 % Jason Oldman 0.05 0.5 %
Total
10.00
100 %
7
Even though YJ is listed in the UK, it prepares its accounts in US Dollars, as is usual in the oil and gas industry. All revenues from the sale of oil and gas are priced in US Dollars. Its operating expenses are incurred in a range of European, African and Asian currencies, and therefore it is exposed to the impact of currency fluctuations. Where possible, YJ uses a range of hedging techniques to minimise its currency exposure. No advice is sought on currency hedging as YJ is happy with its operations in this area.
YJ’s revenues grew by 47% to US$ 174 million in 2015/16 (US$ 118.4 million in 2014/15) and the company reported record post-tax profits of US$ 41 million (2014/15 was US$ 20 million). The company has made operating losses in each year through to and including 2013/14 due to the high exploration costs that precede the revenue streams.
Its first profitable year was the year ended 30 September 2015 and all of its previous tax losses resulted in no tax being payable for the 2014/15 financial year. The level of profits in the year ended 30 September 2016 were sufficiently high for the remaining tax losses to be used up, resulting in a small tax liability in the last financial year. Consequently any further profits will be fully taxable at 24%.
An extract from YJ’s accounts for the year ended 30 September 2016 is shown in Appendix 2 on page 18.
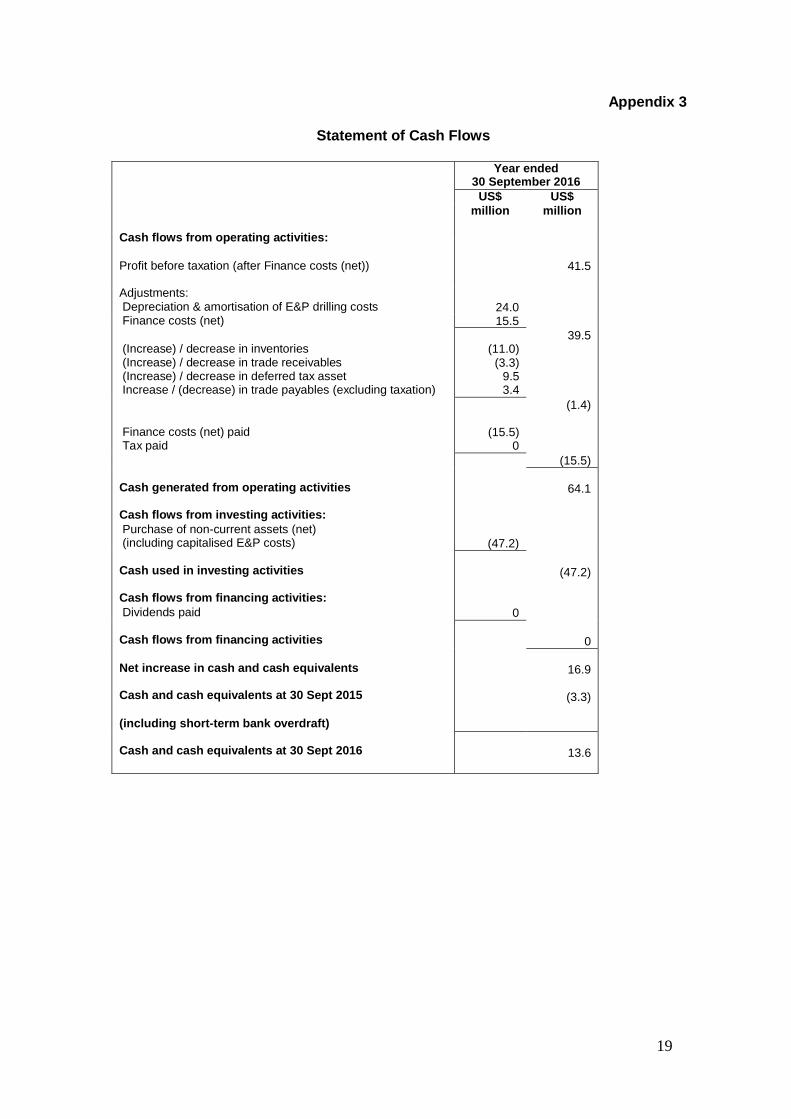
YJ’s cash flow statement for the year ended 30 September 2016 is shown in Appendix 3 on page 19.
8
Drilling for oil and gas All of the drilling operations that YJ undertakes are off-shore and in shallow water. YJ’s geologists and survey teams are experts at studying and scanning potential areas for oil and gas reserves. YJ’s team undertakes extensive survey work over potential oil and gas fields including 2D and 3D seismic surveys and controlled source electromagnetic mapping to try to establish the size and depth of possible oil and gas reserves, before licence applications and test drilling commences. The team has been extremely successful to date with only one failure (see below).
Once a location has been identified and licences obtained, then an off-shore installation is set up. Oil and gas off-shore installations are industrial “towns” at sea, carrying the people and equipment required to access the oil and gas reserves hundreds or even thousands of metres below the seabed. YJ uses outsourced drilling teams and outsourced service personnel for these off-shore installations. YJ hires mobile drilling platforms and FPSOs as the cost of owning drilling platforms is too prohibitive. As such YJ only supervises the technical operations. Its expertise rests with its geology knowledge and its ability to control the outsourcers.
The cost of drilling each production shallow-water well can be in excess of US$ 30 million. Therefore, before oil and gas production can commence, it is necessary to undertake preliminary test drilling to confirm exactly where the oil or gas reserves are and the size of the reserves. After test drilling has been undertaken, the most effective way to extract the oil and gas and bring them to the surface is established.
Oil and gas fields are classified according to the reasons for drilling and the type of well that is established. The classifications are:
“Test” or “Exploration wells”. Defined as wells which are drilled purely for information
gathering purposes in a new area. Their function is to establish whether survey information has accurately identified a potential new oil and gas reserve. Test wells are also used to assess the characteristics of a proven oil or gas reserve, in order to establish how best to bring the oil and gas into production.
“Production wells”. Defined as wells which are drilled primarily for the production of
oil or gas. These are drilled after the oil or gas reserve has been assessed, the size of the oil or gas reserve has been proved, and the safest and most effective method for getting the oil or gas to the surface has been determined.
YJ’s current operations
YJ currently has three oil and gas fields in production. These three oil and gas fields are relatively small compared to some of the larger oil and gas fields operated by the multi-national oil companies. All three oil and gas fields are located off-shore with shallow-water drilling wells. One of YJ’s oil and gas fields is located off-shore around Africa, field AAA. Two are located off-shore around Asia, fields BBB and CCC. These three oil and gas fields were identified and surveyed in the company’s first few years of operation. AAA and BBB have been in production since 2014. CCC was brought into production in early October 2015.
YJ has PSA licences from each of the respective governments for these three oil and gas fields whereby the governments receive a share of the profits after royalties and production costs. The royalty and licence costs are included in the cost of sales in the Profit or Loss Statement.

9
YJ’s three current oil and gas fields have been independently checked to verify their proven commercial reserves. These proven commercial oil and gas reserves total:
Oil: 18.4 mmbbl (mmbbl is defined as “millions of barrels of oil”).
Gas: 25.6 mmbble (mmbble is defined as “millions of barrels of oil
equivalent”). These reserves exclude “contingent resources” of oil and gas. Contingent resources are defined as oil and gas reserves which are not commercially feasible to extract using current technology.
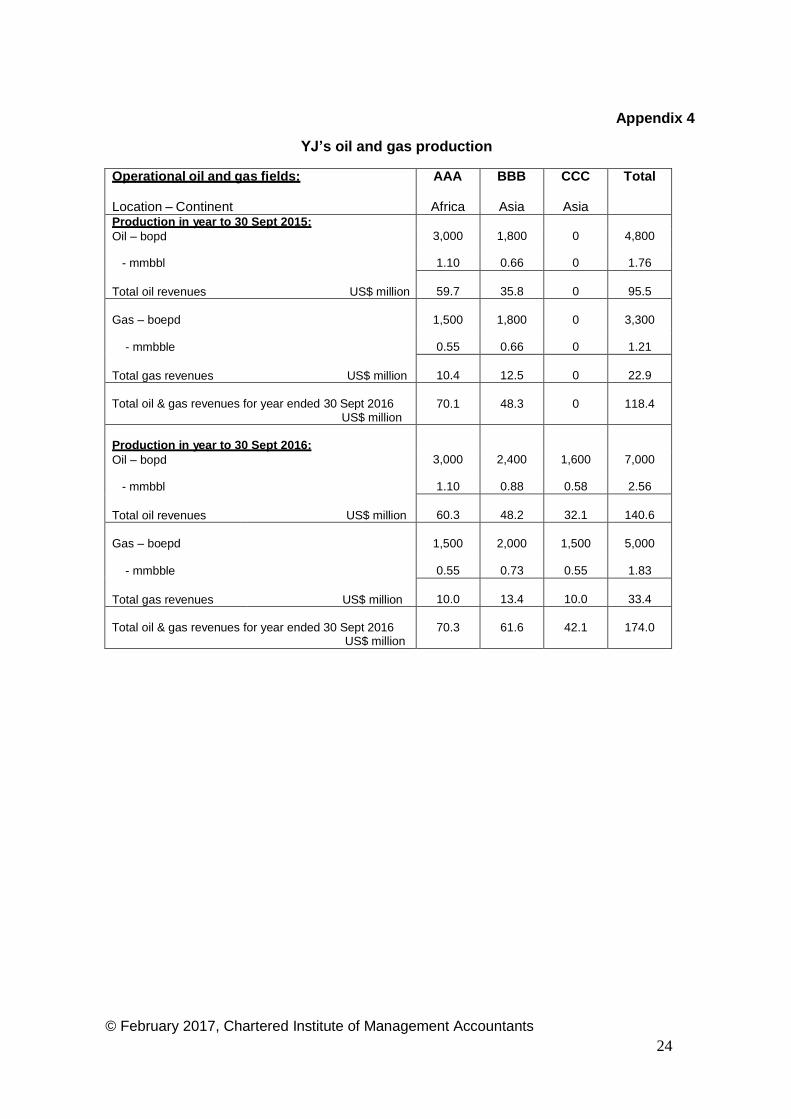
Details of the production of oil and gas from these three oil and gas fields for the last two financial years are shown in Appendix 4 on page 20.
YJ’s geologists and survey teams are currently investigating 12 further potential oil and gas fields. This includes four oil and gas fields in Asia and Africa for which YJ has applied for licences to test drill. The outcome of the application for these four licences should be known over the next six months. Milo Purdeen (Director of Exploration) and Jason Oldman (Director of Legal Affairs) have worked closely to meet all of the requirements of the licence applications for the four identified potential oil and gas fields. However, they both find dealing with some members of the government of the African and Asian countries, which own the on-shore and off-shore land, difficult and at times ethically challenging. Some of these Asian and African government officials have requested payment of fees, which Jason Oldman considers to be bribes. He has clearly stated that this is not how YJ conducts business and took a clear ethical stance with the support of Oliver Penn.
The remaining eight potential oil and gas fields, in Asia and Africa, are at earlier stages of survey work and exploration.
Since YJ was listed on AIM in 2010, it has applied for a total of eight licences for test drilling, including the four it is awaiting to hear whether it will be given a licence for. Only one potential oil and gas field, DDD, was established to be far smaller than had been originally estimated and was not considered economic to take into production.
The total cost of test drilling for the oil and gas field, DDD, which was not taken into production, was written off in the Profit or Loss Statement in 2014/15. This write-off cost was US$ 15 million. YJ’s geologists and survey team have since become even more careful when identifying potential new oil and gas fields following this write-off. However, the fact that only one of YJ’s potential oil and gas fields did not go into production is considered to be an acceptable risk, as some competitors incur a higher proportion of write-offs to the number of oil and gas fields that enter production.
YJ outsources all of its drilling work to specialised companies. At the end of September 2016, it employed fewer than 200 employees. Of these employees, around half of them work on the exploration of potential new oil and gas fields. Of the remaining employees of YJ, there is a small specialised team which works on licence applications and the rest are involved with the management and supervision of operations at YJ’s three current operational oil and gas fields.

10
Investors’ expectations Overall YJ’s institutional investors are pleased with YJ’s ability in bringing the three oil and gas fields into production and to see that revenues are now being generated, after experiencing over five years of losses. This was to be expected for a start-up E&P company. The market was unhappy at the write-off of drilling costs for the oil and gas field DDD, but one failed oil and gas field is deemed to be an acceptable risk in this sector. Therefore, YJ’s geologists and survey teams are considered to be doing their research work extremely well.
YJ’s share price was US$ 6 per share when it was listed in 2010, and rose shortly after listing to around US$ 7 per share. The share price did not move materially until YJ announced finding its first two potential oil and gas fields in 2011. YJ’s share price has fluctuated during part of 2015/16, due to Oliver Penn’s much publicised illness and concerns over the company’s future, but rallied after the appointment of Ullan Shah.
YJ’s current share price at the end of January 2017 was US$ 26.80 per share.
YJ’s institutional investors are hoping for an announcement on whether it will be successful in being granted the four test drilling licences it has applied for. Other E&P companies have also applied for licences for these four oil and gas fields.
Accounting for revenues and costs
The financial accounting principles in the oil and gas industry are complex and the basic principles are outlined below. No investigation into financial accounting principles is required.
Revenues are accounted for at the point of sale which is at the same time as the legal transfer of ownership. This typically occurs when the contracted volumes of oil and gas are delivered to the port in the country agreed in the contract of sale. YJ is generally responsible for the transportation of the oil and gas from the oil or gas fields to the entry port in the agreed country. This is usually a port close to the respective oil and gas fields. YJ’s customers are then responsible for the onward transportation, or storage of the gas or oil, from the agreed port. LNG is often stored in huge LNG storage tanks that are located near to several ports before onwards transportation.
YJ sells its oil and gas:
at the spot price on the open market to a range of buyers or
on a commodity exchange, where oil and gas is sold in the form of a derivative, which is a promise to deliver a certain amount of oil or gas on a certain date at a specified place for a certain price.
YJ can always sell its oil and gas, and it is usually sold before the oil and gas is shipped ashore. The cost of oil and gas production is charged to the Profit or Loss Statement to match the volumes sold. Cost of sales includes the operating costs associated with operating wells from which oil and gas are being extracted (after drilling has been completed). These oil and gas production costs include royalties, PSA licence costs, the costs of delivering oil and gas to the ports at which the customers take delivery, as well as the amortisation of test and production drilling costs.

11
Administrative expenses include health, safety and environmental management costs, and are charged to the Profit or Loss Statement on an accruals basis relating to the time period to which they relate.
Accounting for oil and gas exploration costs
The accounting method used by YJ to account for oil and gas exploration costs is to capitalise all costs of exploration that lead to the successful generation of oil and gas fields. The GAAP accounting concept is that the oil and gas exploration costs are assets that are to be charged against revenues in the Profit or Loss Statement as the assets, i.e. the oil and gas fields are used. The oil and gas fields are treated in the Statement of Financial Position as long-term assets. This is because, like other capital equipment, the oil and gas reserves are considered to be long-term productive assets.
All of the drilling and exploration costs associated with oil and gas fields that are unsuccessful and will not go into production are written off in their entirety. This includes any costs previously capitalised at the point that the oil and gas field is determined not to be productive.
YJ has capitalised the costs of the drilling of all its wells within its three operational oil and gas fields and this is written off against revenues each year. The net book value of capitalised drilling and explorations costs, together with a small amount of other non- current assets, was US$ 189 million at the end of September 2016.
IT systems
When YJ was established in 2008 it implemented a range of IT systems using licensed off-the-shelf IT packages. Where possible the industry leading software package was selected. The IT systems are fully integrated and enable the production of executive summary reports as well as the ability to drill down to gain specific data on each entry or event. The IT systems that YJ operates are:
A multi-currency nominal ledger, with integrated sales and purchase ledgers. Each
entry identifies the project and the designated areas within each of the oil and gas fields. Therefore, costs can be identified by cost type, and also by each area within a survey area, test drilling location or an operational oil and gas field. A fixed assets register.
Survey and scanning software packages, enabling the geologists to share data and build up 3D images for each area within a potential oil and gas field.
Health, safety and environmental (HSE) IT systems to monitor and report on all HSE preventative actions taken and all actual incidents that occur. These systems enable all of YJ’s managers to extract reports on risk management and preventative actions that have been taken, or are planned for the future.
Production of Environmental Impact Statements for each location that YJ is operating in, including potential oil and gas fields, as well as all test drilling locations and the three oil and gas fields that are currently in production.

12
Health, Safety and Environmental issues Health, Safety and Environmental (HSE) issues are firmly placed at the top of YJ’s objectives. YJ wishes to ensure that it actively prepares for and manages the risks it faces in the hostile and difficult environments in which it operates. Lee Wang, Director of Health, Safety and Environment, considers that accident prevention is a key factor in the oil and gas industry, as the results of even a minor accident can be significant or even catastrophic. Undertaking survey and test drilling in unknown areas, particularly off-shore drilling, carries risks. All of YJ’s survey and drilling work undertaken in the last seven years has been completed without any major HSE incidents. Lee Wang endeavours to maintain high standards of HSE in YJ and this has been achieved in the following ways:
Strong leadership and clearly defined responsibilities and accountabilities for HSE
throughout YJ and its outsourced suppliers.
Appointment of competent employees to manage activities.
Developing specific HSE plans for each potential oil and gas field depending on the local and environmental conditions.
Selecting, appointing and effectively managing competent outsourced contractors. Preparing and testing response plans to ensure that any incident can be quickly
and efficiently controlled, reported on and actions taken to ensure that it does not re-occur.
Continuous improvement of HSE performance by monitoring, reporting and on-site audits.
Regular management reviews of YJ’s HSE IT systems to ensure that its IT systems meet or exceed international standards.
Following some international terrorist incidents in early 2016, Lee Wang persuaded the board to appoint an international security company. This security company provides trained personnel to improve the security at all of YJ’s test drilling and production drilling locations and has done so since April 2016. This security company also escorts all of YJ’s employees and outsourced personnel whilst they are travelling to, and from, all of YJ’s drilling sites.

13
Corporate social responsibility Corporate social responsibility (CSR) is central to the way in which YJ operates. In order to satisfy all of its shareholders and other stakeholders, YJ always considers the implications of its actions and CSR is incorporated into its management systems and procedures.
YJ defines its CSR policies and procedures against international best practice and it covers five key areas. This is shown in the diagram below:
Health and safety:
To achieve high standards of
performance to ensure safety of our workforce.
Social & communities:
To foster good
relationships with all stakeholders & local communities.
YJ – Summary of CSR policy
Environment:
To strive to protect the environments
in which we operate.
Business ethics:
To conduct all business dealings with integrity and
to the highest standards.
Human resources:
To reward performance.
Discrimination is not tolerated.
Business challenges facing YJ Like other companies in the oil and gas industry, whether large or small, YJ faces a range of challenges which are summarised as follows:
1. Considering sustainability issues – oil and gas are finite resources. 2. Complying with increasingly complex regulatory and reporting requirements. 3. Improving operational performance – once an existing oil field is operational the
only way to actively manage a better performance is to improve operational efficiency.
4. Recruiting and retaining a motivated workforce with the required skill set. 5. Managing the risk of oil and gas exploration which results in an unsuccessful oil or
gas field that cannot be taken into production. 6. Managing the risk of accidents. 7. Managing the threat posed by terrorist activities.
14
8. Managing other risks including financial, political and operational risks – all E&P companies carry out extensive risk assessments.
The world was horrified by the extent of the oil disaster following the explosion and sinking of the Deepwater Horizon oil and gas drilling rig in April 2010. The explosion was caused by a leakage of high-pressure natural gas which ignited. It resulted in 11 deaths and many injuries to workers on the oil and gas drilling rig. It also caused a massive oil spill. Approximately 4.9 million barrels of oil leaked into the sea, resulting in a major natural disaster that took months to contain.
Farm-in and farm-out possibilities Within the oil and gas industry, companies can buy into an existing licence for E&P or sell their share in an existing licence to another company. The acquiring company has to satisfy the government of the country which issued the licence that it meets all of its specified credentials.
These licence possibilities are defined as follows:
Farm-in is defined as acquiring an interest in a licence from another E&P company.
Farm-out is defined as assigning or selling an interest in a licence to another oil and gas production company. This is a commonly used arrangement with many smaller E&P companies like YJ.
To date, YJ has not participated in either of the farm-in or farm-out possibilities. All three of the oil and gas fields that are currently in operation were identified and discovered and brought into production solely by YJ with no other company involved.
YJ was able to secure adequate financing to enable it to bring the three current oil and gas fields into production. However, YJ has licence applications pending for four new oil and gas fields and is currently surveying eight further potential oil and gas fields. It does not yet have adequate funding in place to satisfy the financing required in order to bring all of these potential oil and gas producing fields into production, assuming that it is granted the licence for them and the test drilling proves that there are sufficient reserves to go into production.
YJ will need to either secure additional equity or loan finance if it is granted any other licences, or it may be able to use some of its cash generated from operations. Alternatively, YJ may need to consider a farm-out arrangement for part of one or more licences that it may be granted in the future.
15
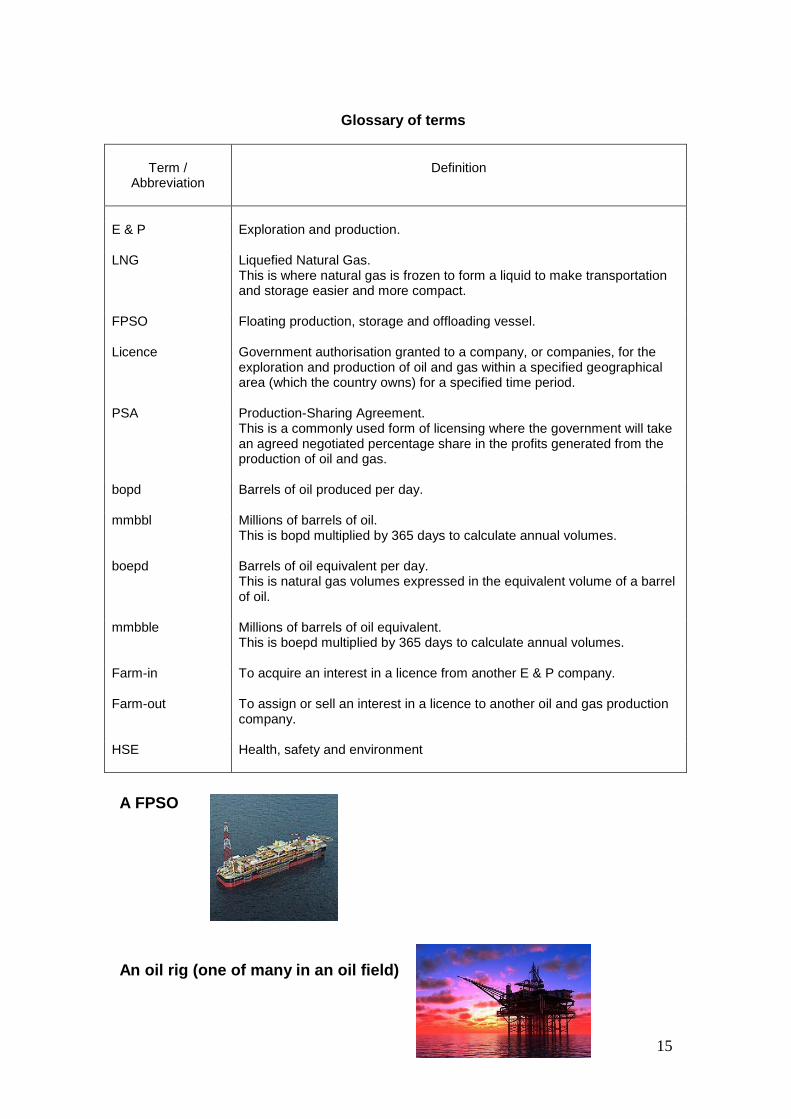
Glossary of terms
Term /
Abbreviation
Definition
E & P Exploration and production.
LNG Liquefied Natural Gas.
This is where natural gas is frozen to form a liquid to make transportation and storage easier and more compact.
FPSO Floating production, storage and offloading vessel.
Licence Government authorisation granted to a company, or companies, for the exploration and production of oil and gas within a specified geographical area (which the country owns) for a specified time period.
PSA Production-Sharing Agreement. This is a commonly used form of licensing where the government will take an agreed negotiated percentage share in the profits generated from the production of oil and gas.
bopd Barrels of oil produced per day.
mmbbl Millions of barrels of oil. This is bopd multiplied by 365 days to calculate annual volumes.
boepd Barrels of oil equivalent per day. This is natural gas volumes expressed in the equivalent volume of a barrel of oil.
mmbble Millions of barrels of oil equivalent. This is boepd multiplied by 365 days to calculate annual volumes.
Farm-in To acquire an interest in a licence from another E & P company.
Farm-out To assign or sell an interest in a licence to another oil and gas production company.
HSE Health, safety and environment
A FPSO
An oil rig (one of many in an oil field)
16
YJ’s board Appendix 1
Jeremy Lion - Non-executive Chairman Jeremy Lion, aged 50, has been the non-executive Chairman since YJ was formed in 2008. He has held a range of senior roles in the oil and gas exploration industry. He is well respected for his experience, especially in the E&P sector. He began his career as an engineer in oil production and knows and appreciates the risks of the industry.
Chief Executive Officer (CEO): Oliver Penn - recently retired
Ullan Shah - newly appointed Dr Oliver Penn, aged 52, had been the CEO of YJ from its formation in 2008. He has worked in the oil and gas industry for over 30 years. He was an inspirational leader and YJ’s success to date was due to the team he recruited into YJ. However, he suffered very serious ill health in December 2015 and decided to retire in April 2016. He still holds the 200,000 shares in YJ that he purchased when the company was listed in 2010.
Ullan Shah, aged 55, was appointed CEO on 1 June 2016, after being head-hunted from another successful, but larger, E&P oil and gas company. He is also known for his ability to bring potential oil and gas fields from survey stage to operation and production in a short time period, and he has many important connections in the industry.
Orit Mynde – Chief Financial Officer (CFO) Orit Mynde, aged 46, has been the CFO since YJ was formed in 2008. He has worked in a range of industries but prior to joining YJ he was working in a senior finance role for a multi-national oil company. He wanted the challenge of being involved in a start-up E&P business. The speed of YJ’s expansion and bringing three oil and gas fields into production within a few years of the company’s formation has more than exceeded his expectations for the company’s success. He owns 50,000 shares in YJ which he purchased in 2010.
Milo Purdeen – Director of Exploration Milo Purdeen, aged 45, is a geologist who spent 18 years working for one of the large global oil and gas companies in exploration. He has been a keen advocate of the range of new scanning techniques which helps to identify possible oil fields. He joined YJ in 2008 and has been instrumental in the location of oil and gas fields, and the successful bidding and licensing of YJ’s three current oil and gas fields. He owns 100,000 shares in YJ which he purchased in 2010.
Adebe Ayrinde – Director of Drilling Operations Adebe Ayrinde, aged 58, has worked for some large, international energy companies for over 30 years. He became frustrated by these companies’ lack of commitment to environmental and safety aspects of drilling operations. He joined YJ four years ago when its first oil field was licensed and ready to be drilled. Adebe Ayrinde is responsible for the selection, appointment and management of all outsourced specialist drilling teams. He does not hold any shares in YJ.
Jason Oldman – Director of Legal Affairs Jason Oldman, aged 39, is a qualified lawyer with 12 years experience in the energy sector. He is experienced in negotiating PSA agreements as part of the licensing procedure for potential new oil and gas fields. He has experience in farm-out arrangements in the oil and gas industry. He joined YJ in 2008. He owns 50,000 shares in YJ which he purchased in 2010.
17
Lee Wang – Director of Health, Safety and Environment Lee Wang, aged 48, has worked in the gas and oil industry for over 25 years. He fully understands the enormous risks facing employees, sub-contractors and the environment during the oil exploration phase and the additional risks faced during oil production. He does not hold any shares in YJ.
5 Non-executive directors All five non-executive directors have a wealth of experience in the oil and gas exploration and production business and are able to help advise the board about a wide variety of business challenges.
18
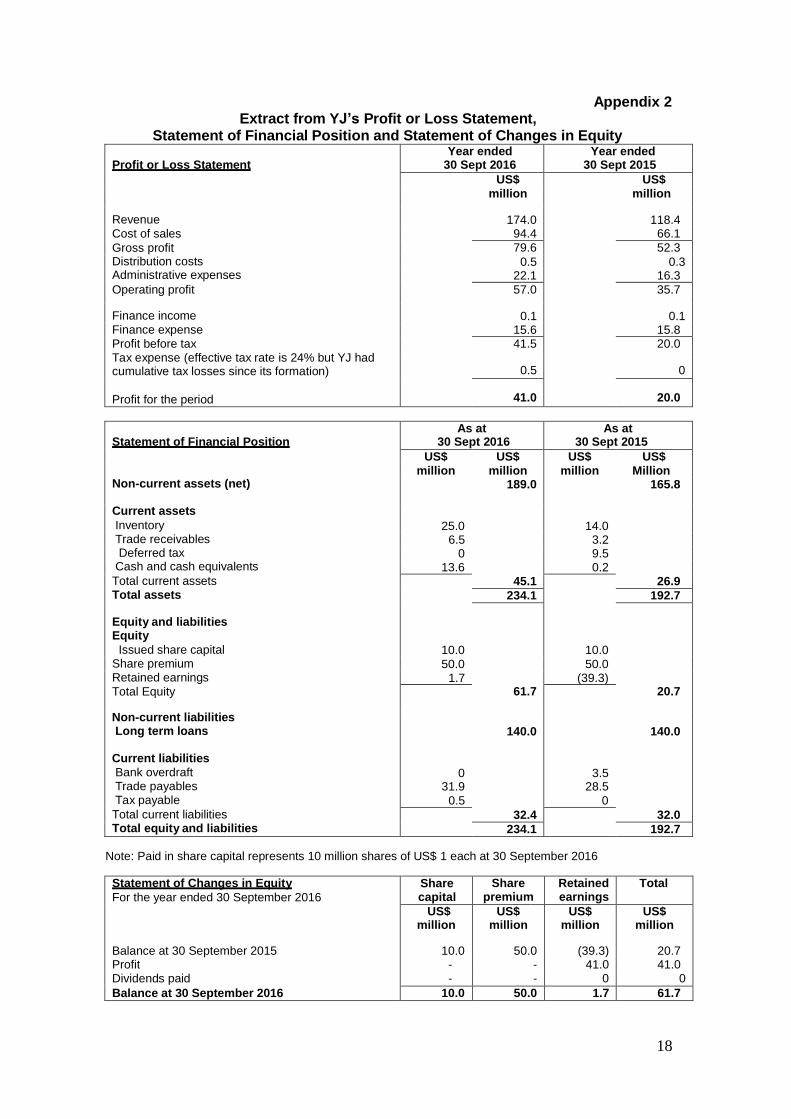
Extract from YJ’s Profit or Loss Statement, Appendix 2
Statement of Financial Position and Statement of Changes in Equity
Profit or Loss Statement
Revenue
Cost of sales
Gross profit Distribution costs Administrative expenses
Operating profit
Finance income
Finance expense
Profit before tax Tax expense (effective tax rate is 24% but YJ had cumulative tax losses since its formation)
Profit for the period
Year ended 30 Sept 2016
Year ended 30 Sept 2015
US$ US$ million million
174.0 118.4 94.4 66.1 79.6 52.3
0.5 0.3 22.1 16.3 57.0 35.7
0.1 0.1 15.6 15.8 41.5 20.0
0.5 0
41.0
20.0
Statement of Financial Position
Non-current assets (net)
Current assets
Inventory Trade receivables Deferred tax
Cash and cash equivalents
Total current assets Total assets
Equity and liabilities Equity
Issued share capital Share premium Retained earnings
Total Equity
Non-current liabilities Long term loans
Current liabilities
Bank overdraft Trade payables Tax payable
Total current liabilities Total equity and liabilities
As at 30 Sept 2016
As at 30 Sept 2015
US$ US$ US$ US$ million million million Million
189.0 165.8
25.0
14.0
6.5 3.2 0 9.5
13.6 0.2
10.0
45.1
10.0
26.9 234.1 192.7
61.7
20.7
50.0 50.0 1.7 (39.3)
0 31.9
0.5
3.5 28.5
0
140.0
140.0
32.4 32.0 234.1 192.7
Note: Paid in share capital represents 10 million shares of US$ 1 each at 30 September 2016
Statement of Changes in Equity
For the year ended 30 September 2016 Share capital
Share capital
Share premium
Retained earnings
Total
US$ million
US$ million
US$ million
US$ million
Balance at 30 September 2015 10.0 50.0 (39.3) 20.7 Profit - - 41.0 41.0 Dividends paid - - 0 0 Balance at 30 September 2016 10.0 50.0 1.7 61.7
19
Appendix 3
Statement of Cash Flows
Cash flows from operating activities:
Profit before taxation (after Finance costs (net))
Adjustments: Depreciation & amortisation of E&P drilling costs Finance costs (net)
(Increase) / decrease in inventories (Increase) / decrease in trade receivables (Increase) / decrease in deferred tax asset Increase / (decrease) in trade payables (excluding taxation)
Finance costs (net) paid Tax paid
Cash generated from operating activities
Cash flows from investing activities:
Purchase of non-current assets (net) (including capitalised E&P costs)
Cash used in investing activities
Cash flows from financing activities:
Dividends paid
Cash flows from financing activities
Net increase in cash and cash equivalents
Cash and cash equivalents at 30 Sept 2015
(including short-term bank overdraft)
Cash and cash equivalents at 30 Sept 2016
Year ended 30 September 2016
US$ US$ million million
41.5
24.0
15.5
(11.0) (3.3)
9.5 3.4
39.5
(15.5) 0
(1.4)
(47.2)
(15.5)
64.1
0
(47.2)
0
16.9
(3.3)
13.6
24
Appendix 4
YJ’s oil and gas production
Operational oil and gas fields: Location – Continent
AAA
Africa
BBB
Asia
CCC
Asia
Total
Production in year to 30 Sept 2015: 3,000
1,800
0
4,800 Oil – bopd
- mmbbl 1.10 0.66 0 1.76
Total oil revenues US$ million
59.7
35.8
0
95.5
Gas – boepd
1,500
1,800
0
3,300
- mmbble 0.55 0.66 0 1.21
Total gas revenues US$ million
10.4
12.5
0
22.9
Total oil & gas revenues for year ended 30 Sept 2016 US$ million
70.1
48.3
0
118.4
Production in year to 30 Sept 2016:
3,000
2,400
1,600
7,000 Oil – bopd
- mmbbl 1.10 0.88 0.58 2.56
Total oil revenues US$ million
60.3
48.2
32.1
140.6
Gas – boepd
1,500
2,000
1,500
5,000
- mmbble 0.55 0.73 0.55 1.83
Total gas revenues
US$ million
10.0
13.4
10.0
33.4
Total oil & gas revenues for year ended 30 Sept 2016 US$ million
70.3
61.6
42.1
174.0
© February 2017, Chartered Institute of Management Accountants