cim tv - methodologie · cim tv: calculation and reporting rules – january 2016 3 introduction...
TRANSCRIPT

CIM Television
Calculation and Reporting Rules
January 2016

CIM TV: Calculation and Reporting Rules – January 2016 2
These exploitation rules were created with the much appreciated assistance of:
- SKO from the Netherlands who gave their permission to use elements and formulas from the document ‘Calculation and Reporting Rules’,
- Philippe Delhaise (Mediaxim) who compiled the basic copy regarding formulas and who corrected various revisions with the patience of angels.
CIM TV: Calculation and Reporting Rules – January 2016 3
Introduction
The CIM has entrusted the CIM TV study for the period 2016-2017 to GfK Belgium for the
audience study.
The contract for the time logging has been entrusted to Nielsen for the period of 2013-2016.
The aim of this document is to indicate how data should be calculated and how it can be
used.
As part of the introduction of time shifted viewing, CIM has certified all TV software
applications of the so-called TV software houses.
A list of certified companies is provided at www.cim.be.
CIM TV: Calculation and Reporting Rules – January 2016 4
Table of Contents
Introduction ............................................................................................................... 3 1. Usage of the data ................................................................................................... 5
1.1 Rules concerning the use of CIM TV data .............................................................. 6 2. Calculation rules ..................................................................................................... 8
2.1 Calculation rules “live” ........................................................................................ 8 2.2 Calculation rules “live+7” .................................................................................. 18 2.3 Algorithm for the evaluation of advertising campaigns (“Live+7”) ........................... 25 2.4 Calculation rules for “Live+Playback” .................................................................. 32
3. Reporting rules ..................................................................................................... 35 3.1 Live, Live+7 and Live+Playback rating/reach .......................................................... 35
3.2 Live, Live+7 and Live+Playback ......................................................................... 36 3.3 Source citation ................................................................................................. 39 3.4 Rounding ........................................................................................................ 39
4. Available files ....................................................................................................... 40 4.3 Top 20 and Top 100 ......................................................................................... 40
CIM TV: Calculation and Reporting Rules – January 2016 5
1. Usage of the data
The CIM TV data are available to all subscribers of the CIM TV study. A list of entitled
subscribers is posted at http://www.cim.be/fr/television/liste-des-souscripteurs
The subscribers must respect the rules regarding the communication of data. These rules
are available at www.cim.be and in paragraph 3.
Only CIM-certified software houses may warrant use of CIM TV data. They are held to strict
confidentiality and may under no circumstances use the CIM TV data in any other form.
Every situation that is cause for the slightest doubt should be submitted to the CIM.
The issue of these calculation and reporting rules is prompted by the availability of data
regarding time shifted viewing in the Belgian market.
Until then, the currency in TV land is the familiar ‘live’ viewing on the day of
broadcast.
After the introduction of time shifted viewing, this has changed: the currency was all
of ‘live’ television watching + all time shifted viewing (the definition follows in 2.2.1).
In 2013 a new currency was introduced into the study: Live+6+Guests: all of ‘live’
television watching + all time shifted viewing + viewing behaviour of guests.
In 2016 a new currency was introduced into the study: Live+7+Guests. The time
shifted viewing was extended until the 7th day after broadcasting.
Analysis and reporting on the basis of other viewing definitions remain possible, but they
should be clearly specified and can no longer serve as currency.
CIM TV: Calculation and Reporting Rules – January 2016 6
1.1 Rules concerning the use of CIM TV data
1.1.1 Data for Subscribers
Two files are generated on a daily basis for subscribers of the CIM TV study:
ATA file: data per second, complete list of all TV channels.
These files are made available to TV channels and their national advertising producers,
rank 1 subscribers, who have subscribed for this.
ATB file: data per second for national subscribed TV channels in addition to aggregated
data per quarter for all other TV channels who earn at least 1% market share in the
complete universe (4 years and older) (only ratings and share).
This file thus contains 2 different levels of detail depending on the channel, and the
number of reported channels is limited. These files are made available to intermediaries.
The following regroupings are included:
Other channels – Dutch-speaking
Other channels – French-speaking
Other channels – neither Dutch nor French nor satellite, VCR + DVD+Perif., Pay TV +
DVR, Play console + other screen usage
1.1.2 Data for other CIM members
CIM members who are not subscribed to the CIM TV study can request monthly channel
reports (MZR). A report can be provided by a choice of target group and hour slot with the
average day reach, week reach, month reach and market share of a TV channel.
1.1.3 Which data can be included in external communication?
The data that every subscriber of the CIM TV study can use in its external communications
are only the data for channels that are found in the ATB file, the pre-calculated channels or
channels with a monthly broadcasting reports (MZR). In other words, communicating the
data found in the ATA file externally that are not found in the mentioned files above is
prohibited.
It is also precluded for the CIM that a TV channel is compared on the basis of figures per
second with a TV channel on the basis of quarterly figures. If one of the TV channels is
reported per quarter in the AUB file, in a comparison with other TV channels, the latter must
also be indicated on the basis of data per quarter, even if data per second is available.
In the published figures, one must draw a distinction between CIM TV figures and estimates
based on CIM TV figures. In the latter case, one must state ‘estimate of ... based on CIM TV
figures’.
The terminology and calculation rules as indicated in the annual report of 2000-2001* must
be respected by the users of the CIM TV data. * Can be downloaded from http://cim.be/media/Televisie
CIM TV: Calculation and Reporting Rules – January 2016 7
From 1 January 2006, the variable of Total TV was redefined and is now in line with the
European standard as used by most countries.
Total TV contains in its new definition of the following elements:
All individual broadcasters (registered via EAM, Picture Matching and/or CNI code)
‘Other TV’ broadcasters
Satellite Receiver
In addition, there is the variable Total screen usage.
As the term suggests, this regards the total number of all screen use. It is mainly the sum of
Total TV plus the following ancillary equipment:
Video recorder
Other hardware device (camera, PC, etc.)
Game console (Sony PlayStation, Microsoft X-Box, etc.)
Set-top box (Telenet Digibox, Proximus TV, etc.)
Pay-TV decoder (Prime, Canal+, BE TV, etc.)
DVD (reader, writer, reader + VCR, etc.)
Connected TV (Smart TV’s, Chromecast, Apple TV,…)
Minimum number of individuals in the choice of target groups
The following guideline also applies: a minimum of 300 individuals must be represented
in the random sample size of a selected target group.
If the number of 300 individuals is not achieved, the CIM requests that this be mentioned in
the reporting.
For more information, please contact CIM:
02 661 31 53 ([email protected])
CIM TV: Calculation and Reporting Rules – January 2016 8
2. Calculation rules
2.1 Calculation rules “live”
2.1.1 Reference universes
The following definitions of reference universes have already been in use since 1997
(Methodological report CIM TV – version of March 2007) and do not change. They are
included here for the sake of completeness.
The reference universe is the population for which the study wants to establish a
representative measure of television viewing behaviour. The definition of the reference
universe remains constant but numbers vary according to the calendar year, depending on
how the population evolves.
The Total Reference Universe is the Dutch-speaking and French-speaking population aged
4 and over, residing on Belgian territory (including foreign nationals), and who belong to a
household that has at least 1 television set at its disposal.
Because of the regional division of Belgium, in practice two sub-universes have been
delineated.
North Universe: all people who meet the above definition and that live in the region of
Flanders or Brussels (defined as the Nielsen 3 region) and who are Dutch-speaking.
South Universe: all people who meet the above definition and that live in the region of
Wallonia or Brussels (defined as the Nielsen 3 region) and who are French-speaking.
The composition of the television panel may vary slightly per day: sometimes new people
are added, other people leave the panel, sometimes the information for a family is missing
for technical reasons... To obtain representative viewing figures every day, all members of
the panel are thus weighted every day to obtain a perfect match with the reference
universe. This ‘daily weight’ is a basic parameter for the correct calculation of viewing
figures.
CIM TV: Calculation and Reporting Rules – January 2016 9
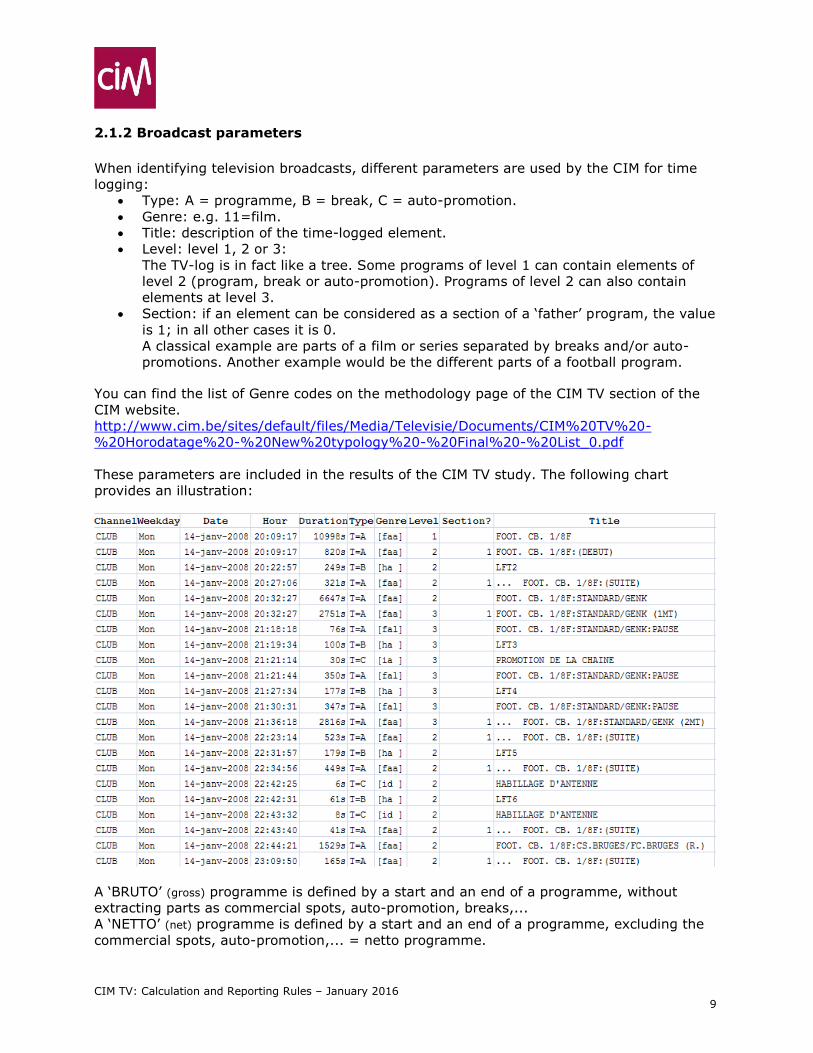
2.1.2 Broadcast parameters
When identifying television broadcasts, different parameters are used by the CIM for time
logging:
Type: A = programme, B = break, C = auto-promotion.
Genre: e.g. 11=film.
Title: description of the time-logged element.
Level: level 1, 2 or 3:
The TV-log is in fact like a tree. Some programs of level 1 can contain elements of
level 2 (program, break or auto-promotion). Programs of level 2 can also contain
elements at level 3.
Section: if an element can be considered as a section of a ‘father’ program, the value
is 1; in all other cases it is 0.
A classical example are parts of a film or series separated by breaks and/or auto-
promotions. Another example would be the different parts of a football program.
You can find the list of Genre codes on the methodology page of the CIM TV section of the
CIM website.
http://www.cim.be/sites/default/files/Media/Televisie/Documents/CIM%20TV%20-
%20Horodatage%20-%20New%20typology%20-%20Final%20-%20List_0.pdf
These parameters are included in the results of the CIM TV study. The following chart
provides an illustration:
A ‘BRUTO’ (gross) programme is defined by a start and an end of a programme, without
extracting parts as commercial spots, auto-promotion, breaks,...
A ‘NETTO’ (net) programme is defined by a start and an end of a programme, excluding the
commercial spots, auto-promotion,... = netto programme.
CIM TV: Calculation and Reporting Rules – January 2016 10
2.1.3 The CIM audience Threshold
a. Viewing duration
The sample data is available per second. For some metrics, the CIM has set a minimum of
viewing time.
For example viewing for at least 1 min / 10 min =
Anyone who watched a programme, a time band or a channel at least 60/600
seconds.
This needs regrouping of different STATS-lines per viewing type (live, TSV):
HOME-ID
MEMB-ID or GUESTID
TV-NUMBER
CHANNEL or VIRTUAL CHANNEL
ACTVITY CODE = TV and Overlay
This regrouping is sufficient for non-consecutive viewing.
If the viewing needs to be consecutive the regrouping is more stringent. The conditions are
enlarged to identify consecutive viewing of a person in case of different statements (e.g.
different statements due to arrival of other panel members or guests):
The regrouping of different STATS-lines per viewing type:
HOME-ID
MEMB-ID or GUESTID
TV-NUMBER
CHANNEL or VIRTUAL CHANNEL
ACTVITY CODE = TV and Overlay
END TIME STATSx-1 = STARTING TIME STATSx
As the lower threshold of a programme reach, the CIM has set a minimum of 60 consecutive
seconds viewing a programme.
In addition, the user is free to determine or set a higher minimum viewing duration and
whether this must be consecutive or not, and to choose whether someone must have
watched one or more programmes to count as part of the programme reach.
How long someone must have watched one or more programmes can either be stated in
minutes or as a percentage.
Frequently occurring values include: a minimum of 1 consecutive minute, a minimum of 10
minutes and a minimum of 10 consecutive minutes.
b. % of viewing
The CIM defines viewing a spot as having contact with a spot during at least half of its
duration in its time slice. See 2.1.4 e.
CIM TV: Calculation and Reporting Rules – January 2016 11
2.1.4 Rating calculation rules
a. Programmes
The rating of a programme is defined as the average percentage of viewers per second
within the reference universe that watched this programme. The respondents in the random
sample are weighted with a weight determined by the extent to which they occur in the total
population of viewers in the reference universe.
%100
1
1
,
R
r
r
R
r
irr
i
w
pw
rating
ratingi :rating for programme i
R: number of respondents in the sample
wr: weight of respondent r
p r,i: proportion of the programme i viewed by respondent r
Where the proportion is equivalent to:
i
ir,
ir,duration
p
V
V r,i: Viewing duration of respondent r for programme i
Duration i: duration of programme i
b. Time bands
The rating of a time band is defined as the average percentage of viewers per second within
the reference universe that watched this/these channel(s) during this time band.
%100
1
1
,
R
r
r
R
r
trr
t
w
pw
rating
ratingt : rating for time band t
R: number of respondents in the sample
wr: weight of respondent r
p r,t: proportion of time band t viewed by respondent r
Averages per time band, over multiple days, should be calculated as follows: a data file is
calculated on a daily basis for the relevant target group including the rating per channel, per
second, rounded up to a minimum precision of six decimals. These data are then used to
calculate averages over multiple days, rounded off to the desired number of decimals.
CIM TV: Calculation and Reporting Rules – January 2016 12
c. Total TV
The Total TV rating is defined as the average percentage of viewers within the reference
universe who watched one channel or another during a programme or time band.
Z
z
t,zt,Z ratingrating1
ratingZ,t: Total TV rating for time band t
rating,z,t : rating for channel z in time band t
Z: total number of channels
Total TV comprises the following elements:
All individual channels (registered via EAM and/or Picture Matching and/or CNI
code)
‘Other TV’ channels
Satellite Receiver
d. Total Screen Usage
As the term suggests, this regards the total number of all screen use. It is mainly the sum of
Total TV plus the following ancillary equipment:
Video recorder
Other hardware device (camera, PC, etc.)
Game console (Sony PlayStation, Microsoft X-Box, etc.)
Set-top box (Telenet Digibox, Belgacom TV, etc.)
Pay-TV decoder (Prime, Canal+, BE TV, etc.)
DVD (reader, writer, reader + VCR, etc.)
BEWARE: both Total TV and Total Screen Usage should be based on the Station code (never
the Source code).1
e. Spots
Viewing a spot is a Boolean variable: it is true (1) or false (0). The CIM defines viewing a
spot as having contact with a spot during at least half of its duration in its time slice.
Timings and durations are expressed in integer numbers and can be even or odd
Let us define:
l(s) = the length of a spot s in seconds
nS(r,s) = the number of seconds of spots viewed by respondent r, consecutive or
not.
1 The Station code (field 2) indicates which channel or station has been watched. This might be an individual channel (registered via EAM and/or Picture Matching and/or CNI code) or any other peripheral equipment (DVD, DVB, VCR,..). This value is different from the Source code (field 9). The Source code indicates which device generates the signal: 0=TV, 1=VCR, 2=SATELLITE, 3=PAY, 4=DVD, 5=DVB, 6=PLAY, 7=OTHER DEVICE, 8=Connected TV (see 5.3 Description of ATA-ATB and TSV files).
CIM TV: Calculation and Reporting Rules – January 2016 13
The contact value of spot s for respondent r is then a variable with two states:
c(r,s)=1 (true), if nS(r,s) >= ceiling(l(s)/2)
c(r,s)=0 (false), if nS(r,s) <= ceiling(l(s)/2)
Since time is an odd or even integer, the ceiling function is used to transform the result of
the division in the nearest integer.
Example for a spot of 21 seconds:
c(r,s) =1 if nS(r,s) >= 11
c(r,s) =0 if nS(r,s) < 11
The rating of a spot is defined as the percentage of viewers within the reference universe
who have seen at least half of the spot.
%100
(
1
1
),
R
r
r
R
r
srr
s
w
cw
rating
ratingt: rating for spot s
R: number of respondents in the sample
wr: weight of respondent r
pr,s: =1 if respondent r saw nS(r,s) or more seconds of this spot with NsecondsMin=
ceiling(lengths/2), else = 0.
f. Blocks of advertising
A block of advertising usually starts and ends with a jingle. The rating of the block is not
calculated on the basis of the individual ratings of the spots, but on the basis of the starting
and ending time of the block. The jingles are included in the calculation of the rating of the
blocks of advertising.
The calculation is identical to that of programmes and time bands (see a. and b. above).
2.1.5 Market share calculation rules
Until the introduction of Time Shifted Viewing, the market share was defined as the
percentage of viewers of a broadcast or time band, based on the total viewing audience.
Market share is calculated by dividing the rating of a programme or time band by the rating
of total channels in the relevant programme or time band.
t,Z
tz,
tz
rating
ratingemarketshar ,
Both Total TV and Total Screen Usage can be used as a reference within the software
application.
CIM TV: Calculation and Reporting Rules – January 2016 14
2.1.6 Reach calculation rules
a. Programme
The programme reach is defined as the percentage of viewers who watch one programme at
least once for a certain time.
%
w
dw
reachR
r
r
R
r
I,rr
I 100
1
1
Jj
Jjd
Ir
IrIr
,
,,
0
1
I : series of programmes
dr,i: ‘dummy’ that indicates whether respondent falls within the programme rating according
to specific definition
J: criterion for the specific programme rating (e.g. 60 consecutive seconds)
R: number of respondents in the sample
wr: weight of respondent r
jr,I: calculated according to the specific conditions, personal criterion of respondent for the
programme series I
b. Reach of a channel
The reach of a channel is defined as the percentage of viewers who have watched a certain
channel at least once for a certain time (duration).
2.1.7 Viewing Time calculation rules
The viewing time is defined as the average time that viewers watched a programme or a
channel during a time band, expressed in seconds.
R
r
r
R
r
trr
t
w
Vw
time viewing
1
1
,
viewing time t: viewing time in time band t
R: number of respondents in the random sample
wr: weight of respondent r
Vr,t: viewing time of respondent r in time band t
CIM TV: Calculation and Reporting Rules – January 2016 15
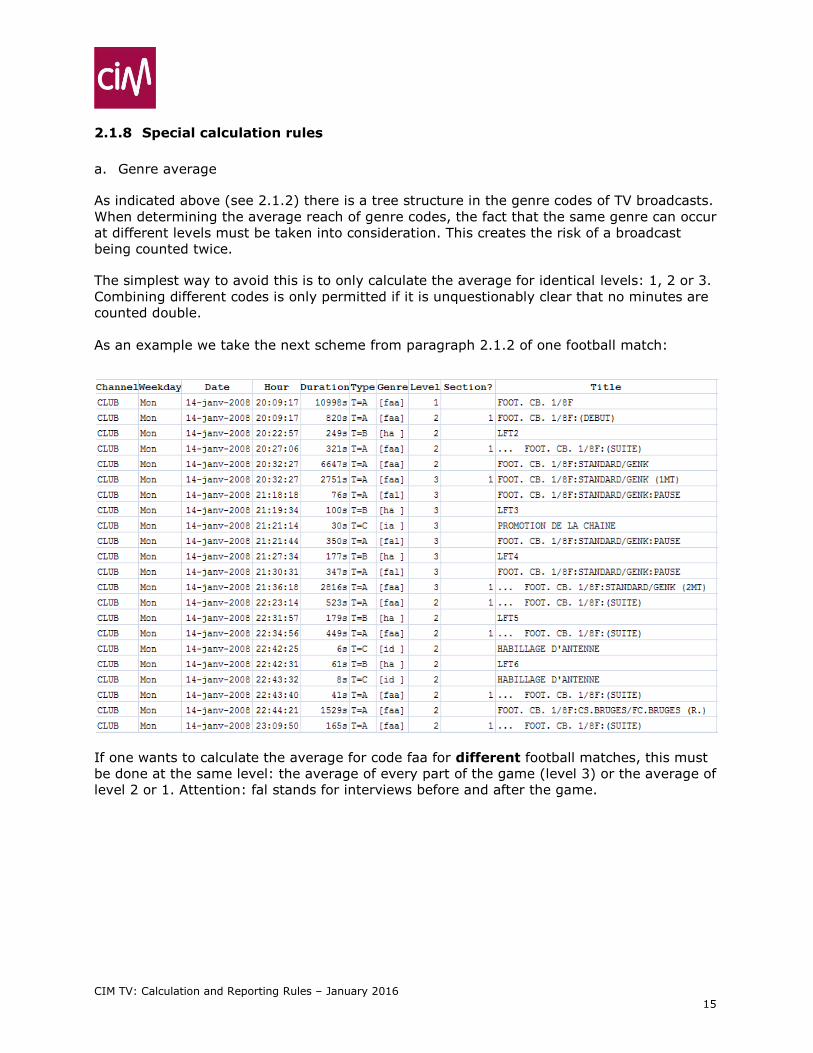
2.1.8 Special calculation rules
a. Genre average
As indicated above (see 2.1.2) there is a tree structure in the genre codes of TV broadcasts.
When determining the average reach of genre codes, the fact that the same genre can occur
at different levels must be taken into consideration. This creates the risk of a broadcast
being counted twice.
The simplest way to avoid this is to only calculate the average for identical levels: 1, 2 or 3.
Combining different codes is only permitted if it is unquestionably clear that no minutes are
counted double.
As an example we take the next scheme from paragraph 2.1.2 of one football match:
If one wants to calculate the average for code faa for different football matches, this must
be done at the same level: the average of every part of the game (level 3) or the average of
level 2 or 1. Attention: fal stands for interviews before and after the game.
CIM TV: Calculation and Reporting Rules – January 2016 16
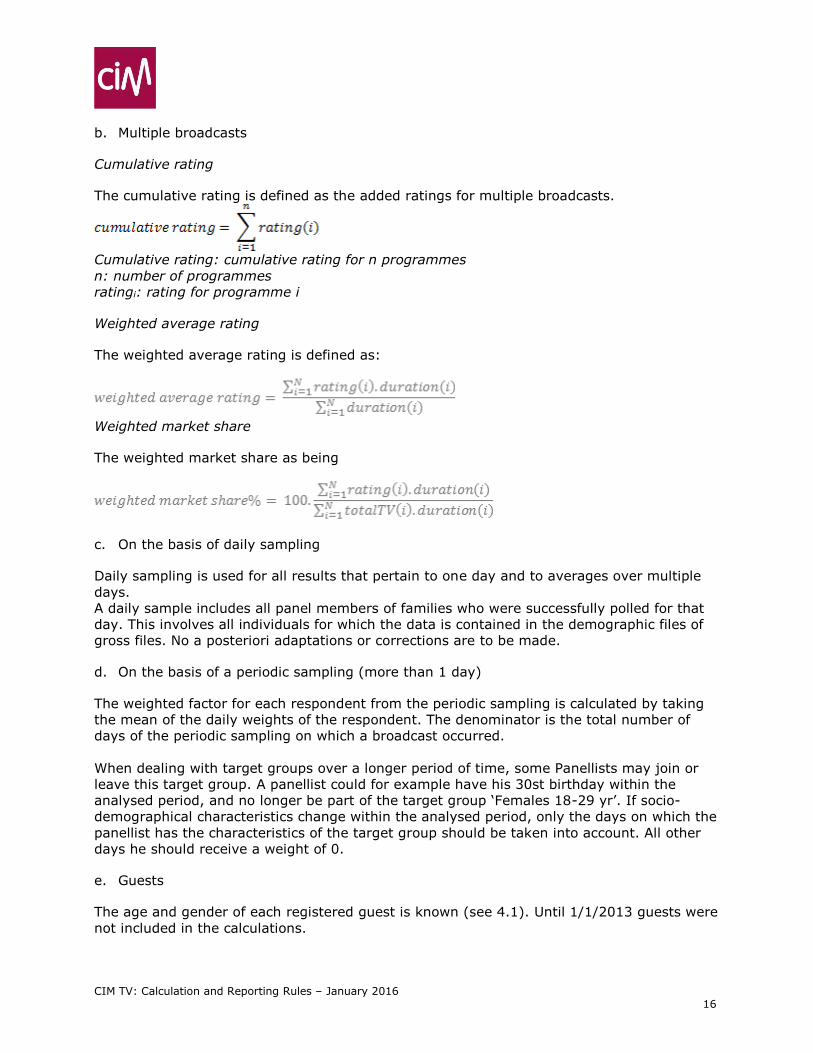
b. Multiple broadcasts
Cumulative rating
The cumulative rating is defined as the added ratings for multiple broadcasts.
Cumulative rating: cumulative rating for n programmes
n: number of programmes
ratingi: rating for programme i
Weighted average rating
The weighted average rating is defined as:
Weighted market share
The weighted market share as being
c. On the basis of daily sampling
Daily sampling is used for all results that pertain to one day and to averages over multiple
days.
A daily sample includes all panel members of families who were successfully polled for that
day. This involves all individuals for which the data is contained in the demographic files of
gross files. No a posteriori adaptations or corrections are to be made.
d. On the basis of a periodic sampling (more than 1 day)
The weighted factor for each respondent from the periodic sampling is calculated by taking
the mean of the daily weights of the respondent. The denominator is the total number of
days of the periodic sampling on which a broadcast occurred.
When dealing with target groups over a longer period of time, some Panellists may join or
leave this target group. A panellist could for example have his 30st birthday within the
analysed period, and no longer be part of the target group ‘Females 18-29 yr’. If socio-
demographical characteristics change within the analysed period, only the days on which the
panellist has the characteristics of the target group should be taken into account. All other
days he should receive a weight of 0.
e. Guests
The age and gender of each registered guest is known (see 4.1). Until 1/1/2013 guests were
not included in the calculations.
CIM TV: Calculation and Reporting Rules – January 2016 17
Guests were only taken into consideration for the weekly top 20 and annual top 100 of the
CIM TV figures.
From 1/1/2013 guests are profiled in the CIM TV study and guest viewing is part of the
official currency of the CIM TV study. The viewing behaviour of the guest is linked to a panel
member that isn’t watching at that time. The link based on 4 parameters: region (North –
South), gender, age category (4-11, 12-14, 15-24, 25-34, 35-44, 45-54, 55-64, 65+) and
type of set top box.
The documentation on guest viewing is available on the CIM website:
http://www.cim.be/sites/default/files/Media/Televisie/Documents/CIM%20TV%20-
%20Info%20guest%20viewing_FR.pdf.
http://www.cim.be/sites/default/files/Media/Televisie/Documents/CIM%20TV%20-
%20Info%20guest%20viewing_FR.pdf
f. Rounding
All calculations take place without rounding.
If the result types are determined in the meantime, they are rounded to a minimum of 6
decimal places. The number of possible deviations in respect of the reference is thus
negligible.
CIM TV: Calculation and Reporting Rules – January 2016 18
2.2 Calculation rules “live+7”
2.2.1 Basic Principle
Time Shifted Viewing (TSV) is the term used for watching recorded programmes via VCR,
DVD or DVB:
Time shifted viewing on the actual day of broadcast (Day 0) is also called Vosdal
(‘Viewing on the same day as live’).
In the CIM TV study, time shifted viewing is identified as TSV up until 7 days after
broadcast (Day 0 to Day 7 inclusive). The total of this TSV is called “+7”
If a programme is viewed longer than seven days after broadcast, the viewing
process remains identified as VCR, DVD or DVB.
In order to determine whether the viewer is watching live or time-shifted, the content of the
broadcast on the viewed channel is compared with the broadcasts of the channel as it was
registered live on the so-called ‘Reference site’. This occurs in steps:
The viewing process is first compared to the so-called ‘Reference process’: the live
broadcast and all broadcasting to a maximum of 1.5 hours before that;
If no match is found, then a search is performed in the period up to seven days
before that for the first broadcast that does match;
If no match is found, the viewing process remains VCR, DVD or DVB.
Viewing processes cannot be ascribed to reference processes that are in the
future.
Time shifted viewing behaviour is only calculated for persons in the random sample of the
day of broadcast. Time shifted viewing behaviour of persons who do not belong to the panel
on the day of broadcast is reported as ‘Video’, ‘DVD’ or ‘HD’.
TSV will be available for the channels from the B-files, the channels reported per quarter (of
an hour) and the channels with Monthly Broadcasting Reports:
You can download the list of participating channels in the CIM TV study on the CIM website:
http://www.cim.be/sites/default/files/Media/Televisie/Documents/cimtv-stationlist.xlsx
As of 1 January 2016, CIM considers all ‘live’ television viewing + all time shifted viewing from Day 0 to Day 7 + Guest viewing as currency. From 01/01/2010 through 31/12/2015 the currency was ‘live+6+Guests’
CIM TV: Calculation and Reporting Rules – January 2016 19
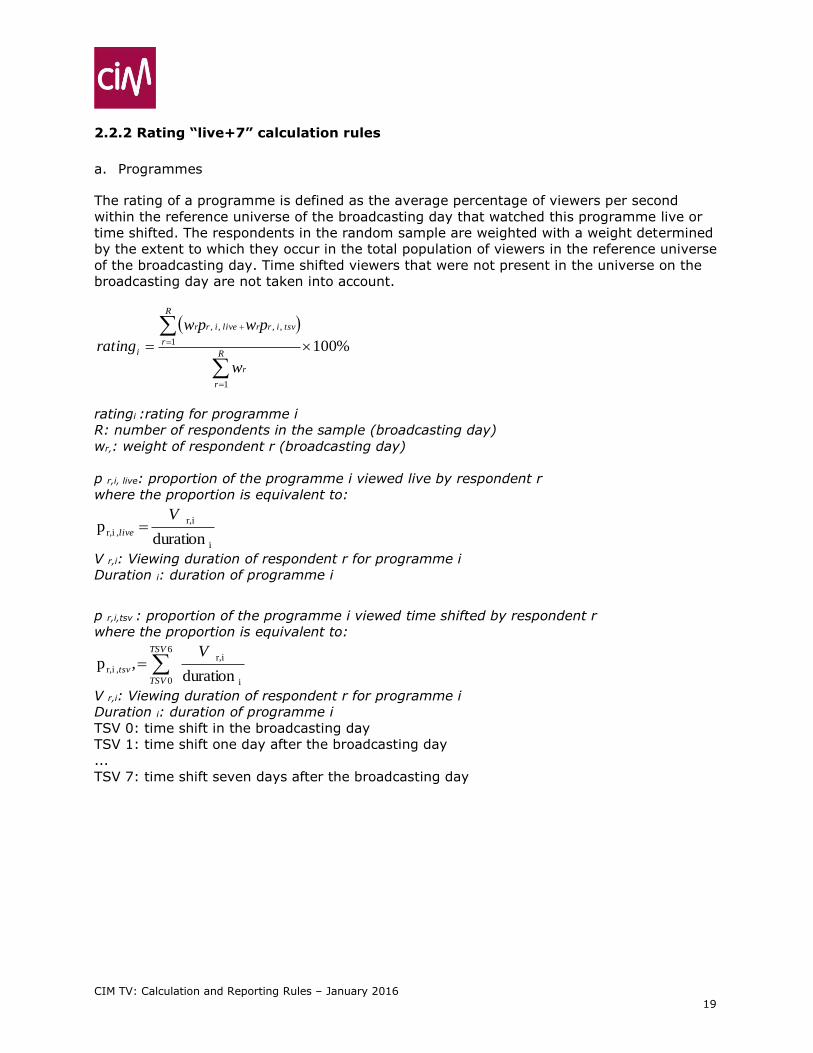
2.2.2 Rating “live+7” calculation rules
a. Programmes
The rating of a programme is defined as the average percentage of viewers per second
within the reference universe of the broadcasting day that watched this programme live or
time shifted. The respondents in the random sample are weighted with a weight determined
by the extent to which they occur in the total population of viewers in the reference universe
of the broadcasting day. Time shifted viewers that were not present in the universe on the
broadcasting day are not taken into account.
%100
1
1
,,,,
R
r
r
R
r
tsvirrliveirr
i
w
pwpw
rating
ratingi :rating for programme i
R: number of respondents in the sample (broadcasting day)
wr,: weight of respondent r (broadcasting day)
p r,i, live: proportion of the programme i viewed live by respondent r
where the proportion is equivalent to:
i
ir,
, ir,duration
p
Vlive
V r,i: Viewing duration of respondent r for programme i
Duration i: duration of programme i
p r,i,tsv : proportion of the programme i viewed time shifted by respondent r
where the proportion is equivalent to:
i
ir,6
0
, ir,duration
,p
VTSV
TSV
tsv
V r,i: Viewing duration of respondent r for programme i
Duration i: duration of programme i
TSV 0: time shift in the broadcasting day
TSV 1: time shift one day after the broadcasting day
...
TSV 7: time shift seven days after the broadcasting day
CIM TV: Calculation and Reporting Rules – January 2016 20
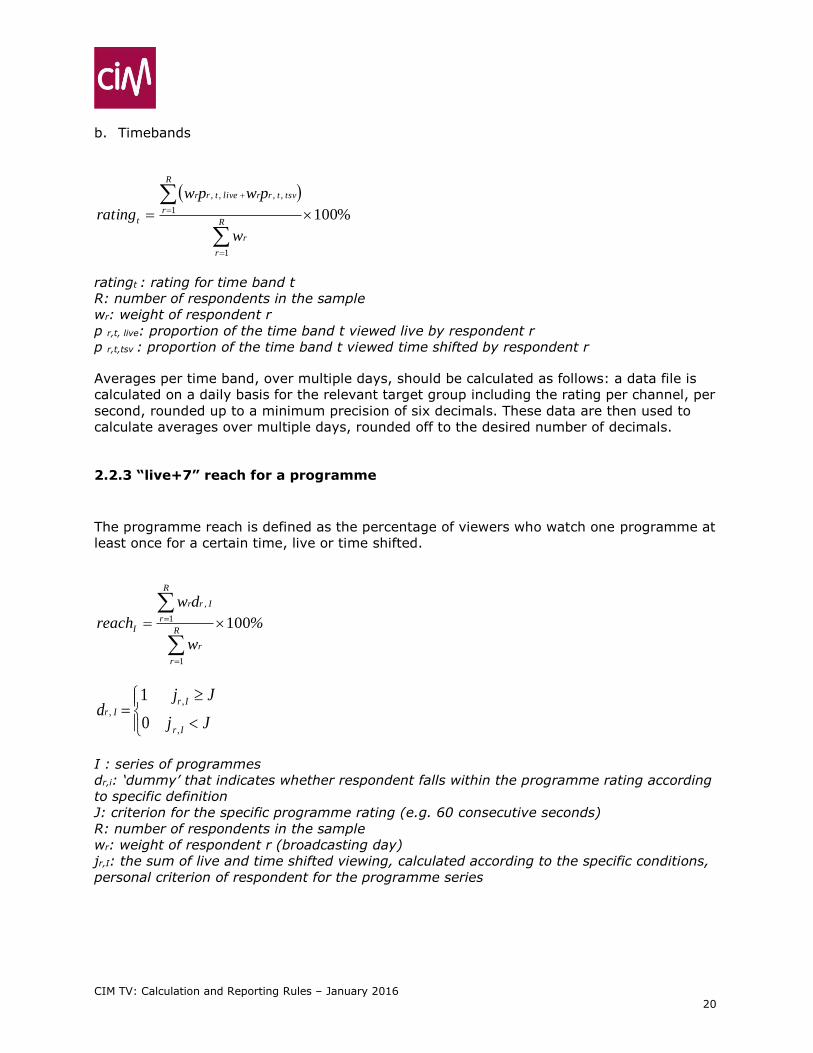
b. Timebands
%100
1
1
,,,,
R
r
r
R
r
tsvtrrlivetrr
t
w
pwpw
rating
ratingt : rating for time band t
R: number of respondents in the sample
wr: weight of respondent r
p r,t, live: proportion of the time band t viewed live by respondent r
p r,t,tsv : proportion of the time band t viewed time shifted by respondent r
Averages per time band, over multiple days, should be calculated as follows: a data file is
calculated on a daily basis for the relevant target group including the rating per channel, per
second, rounded up to a minimum precision of six decimals. These data are then used to
calculate averages over multiple days, rounded off to the desired number of decimals.
2.2.3 “live+7” reach for a programme
The programme reach is defined as the percentage of viewers who watch one programme at
least once for a certain time, live or time shifted.
%
w
dw
reachR
r
r
R
r
I,rr
I 100
1
1
Jj
Jjd
Ir
IrIr
,
,,
0
1
I : series of programmes
dr,i: ‘dummy’ that indicates whether respondent falls within the programme rating according
to specific definition
J: criterion for the specific programme rating (e.g. 60 consecutive seconds)
R: number of respondents in the sample
wr: weight of respondent r (broadcasting day)
jr,I: the sum of live and time shifted viewing, calculated according to the specific conditions,
personal criterion of respondent for the programme series
CIM TV: Calculation and Reporting Rules – January 2016 21
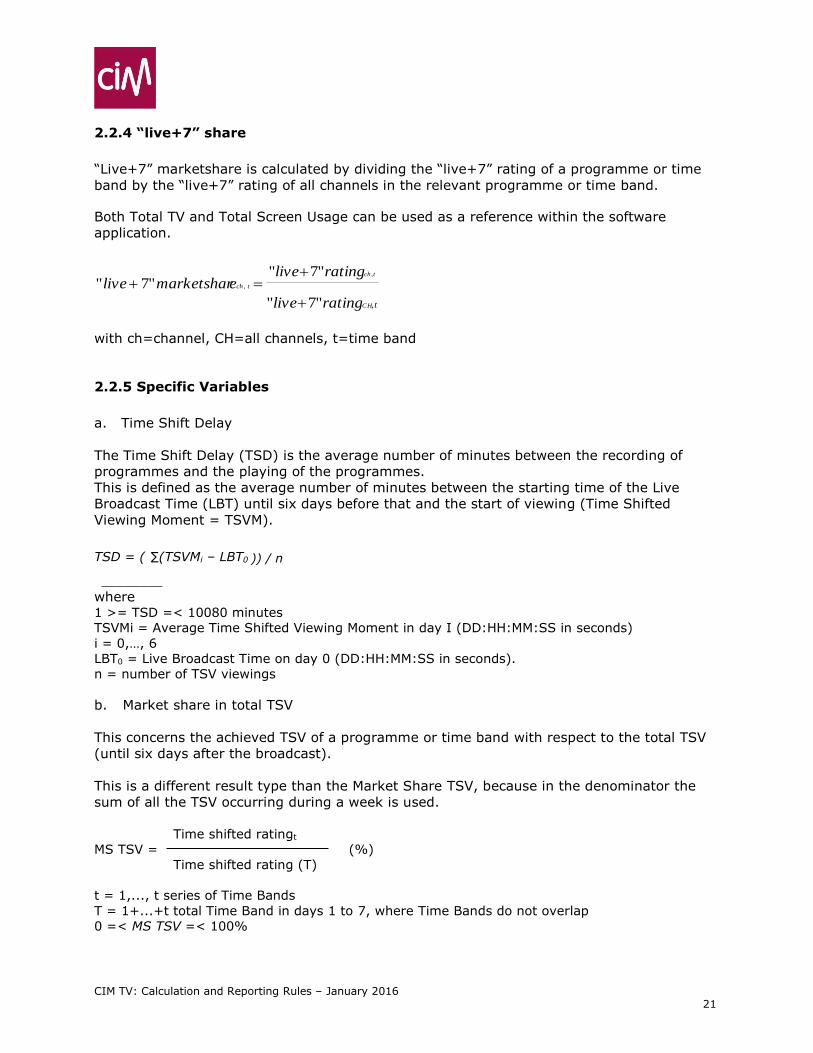
2.2.4 “live+7” share
“Live+7” marketshare is calculated by dividing the “live+7” rating of a programme or time
band by the “live+7” rating of all channels in the relevant programme or time band.
Both Total TV and Total Screen Usage can be used as a reference within the software
application.
t,CH
tch,
tch
ratinglive
ratingliveemarketsharlive
"7"
"7""7" ,
with ch=channel, CH=all channels, t=time band
2.2.5 Specific Variables
a. Time Shift Delay
The Time Shift Delay (TSD) is the average number of minutes between the recording of
programmes and the playing of the programmes.
This is defined as the average number of minutes between the starting time of the Live
Broadcast Time (LBT) until six days before that and the start of viewing (Time Shifted
Viewing Moment = TSVM).
TSD = ( ∑(TSVMi – LBT0 )) / n
________
where 1 >= TSD =< 10080 minutes
TSVMi = Average Time Shifted Viewing Moment in day I (DD:HH:MM:SS in seconds)
i = 0,…, 6
LBT0 = Live Broadcast Time on day 0 (DD:HH:MM:SS in seconds).
n = number of TSV viewings
b. Market share in total TSV
This concerns the achieved TSV of a programme or time band with respect to the total TSV
(until six days after the broadcast).
This is a different result type than the Market Share TSV, because in the denominator the
sum of all the TSV occurring during a week is used.
Time shifted ratingt
MS TSV = (%) Time shifted rating (T)
t = 1,..., t series of Time Bands
T = 1+...+t total Time Band in days 1 to 7, where Time Bands do not overlap 0 =< MS TSV =< 100%

CIM TV: Calculation and Reporting Rules – January 2016 22
c. Share of TSV in rating
This is the share of TSV in the total rating of the programme or time band (Live plus TSV).
Rating TSV Programme/Time Band
TSV Share = (%) Total rating of Programme/Time Band
0 =< TSV Share =< 100%
d. ‘day share’ in TSV
This concerns the relative share of TSV according to programme or time band per day, as compared
to the total TSV for a programme or time band.
Time shifted rating programme or time band on day x
Day share in TSV = (%) Total Time shifted rating programme or time band
0 =< Day share in TSV =< 100%
2.2.6 Special calculation rules
a. Guests and Live+7
Only guests present on the actual day of broadcast (Day0) can be included in Live+7
analyses. Guest should therefore not be included in TSV other than Vosdal (‘Viewing on the
same day as live’).
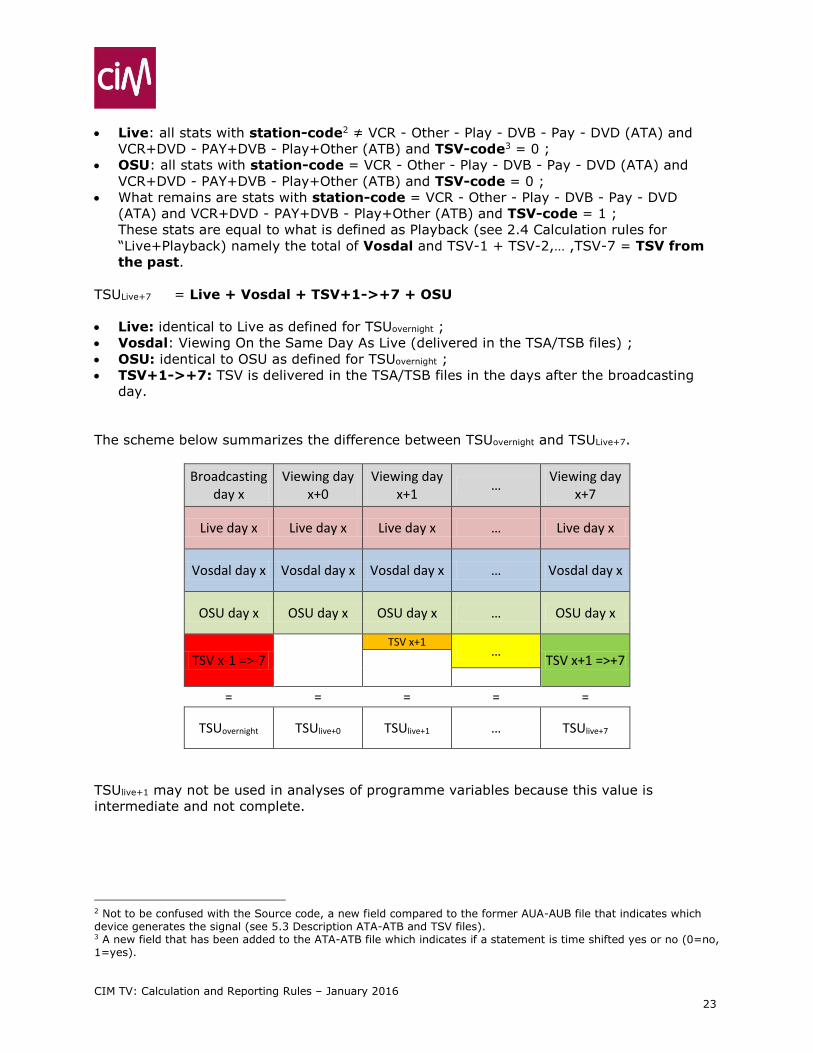
b. Total Screen Usage and Live+7
With the introduction of TSV, the interpretation of Total Screen Usage (TSU) changed. Two
different approaches are possible: one based on the TSU for a particular broadcasting day
(TSULive+7) and one based on the TSU for a particular viewing day (TSUovernight).
TSUovernight = total amount of seconds on the ATA/ATB file
= Live + Vosdal + TSV from the past + OSU
CIM TV: Calculation and Reporting Rules – January 2016 23
Live: all stats with station-code2 ≠ VCR - Other - Play - DVB - Pay - DVD (ATA) and
VCR+DVD - PAY+DVB - Play+Other (ATB) and TSV-code3 = 0 ;
OSU: all stats with station-code = VCR - Other - Play - DVB - Pay - DVD (ATA) and
VCR+DVD - PAY+DVB - Play+Other (ATB) and TSV-code = 0 ;
What remains are stats with station-code = VCR - Other - Play - DVB - Pay - DVD
(ATA) and VCR+DVD - PAY+DVB - Play+Other (ATB) and TSV-code = 1 ;
These stats are equal to what is defined as Playback (see 2.4 Calculation rules for
“Live+Playback) namely the total of Vosdal and TSV-1 + TSV-2,… ,TSV-7 = TSV from
the past.
TSULive+7 = Live + Vosdal + TSV+1->+7 + OSU
Live: identical to Live as defined for TSUovernight ;
Vosdal: Viewing On the Same Day As Live (delivered in the TSA/TSB files) ;
OSU: identical to OSU as defined for TSUovernight ;
TSV+1->+7: TSV is delivered in the TSA/TSB files in the days after the broadcasting
day.
The scheme below summarizes the difference between TSUovernight and TSULive+7.
Broadcasting day x
Viewing day x+0
Viewing day x+1
… Viewing day
x+7
Live day x Live day x Live day x … Live day x
Vosdal day x Vosdal day x Vosdal day x … Vosdal day x
OSU day x OSU day x OSU day x … OSU day x
TSV x-1 =>-7
TSV x+1 …
TSV x+1 =>+7
= = = = =
TSUovernight TSUlive+0 TSUlive+1 … TSUlive+7
TSUlive+1 may not be used in analyses of programme variables because this value is
intermediate and not complete.
2 Not to be confused with the Source code, a new field compared to the former AUA-AUB file that indicates which device generates the signal (see 5.3 Description ATA-ATB and TSV files). 3 A new field that has been added to the ATA-ATB file which indicates if a statement is time shifted yes or no (0=no, 1=yes).
CIM TV: Calculation and Reporting Rules – January 2016 24
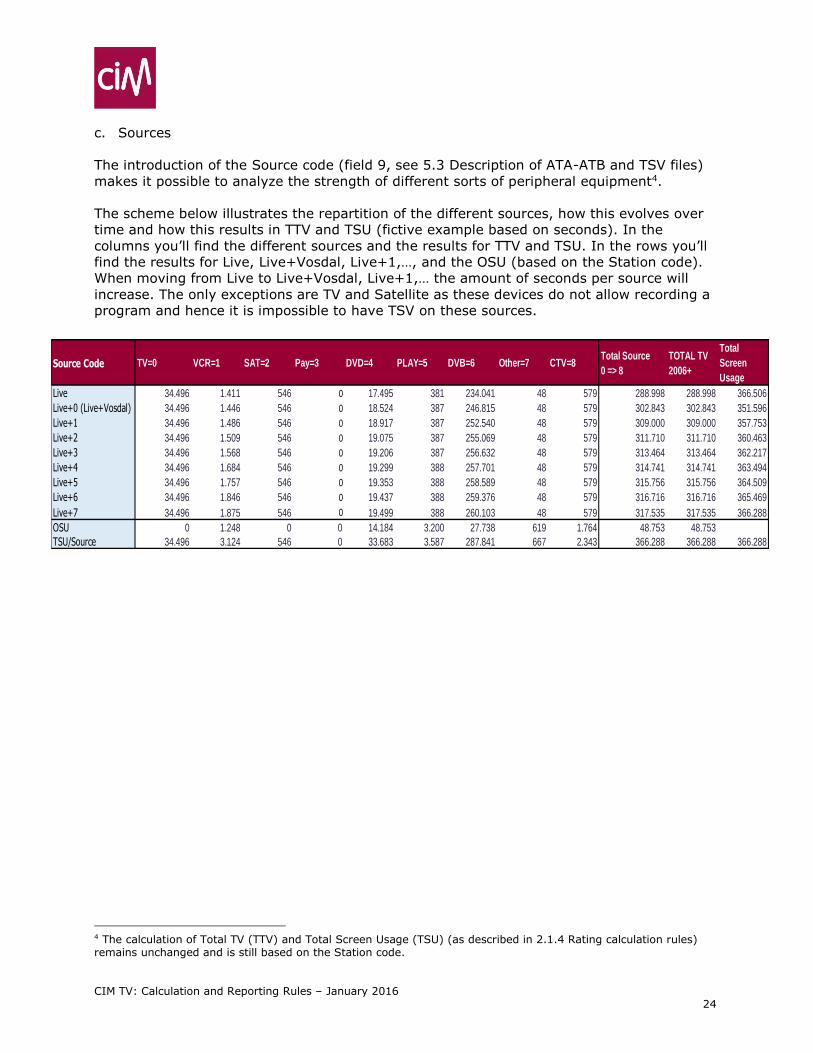
c. Sources
The introduction of the Source code (field 9, see 5.3 Description of ATA-ATB and TSV files)
makes it possible to analyze the strength of different sorts of peripheral equipment4.
The scheme below illustrates the repartition of the different sources, how this evolves over
time and how this results in TTV and TSU (fictive example based on seconds). In the
columns you’ll find the different sources and the results for TTV and TSU. In the rows you’ll
find the results for Live, Live+Vosdal, Live+1,…, and the OSU (based on the Station code).
When moving from Live to Live+Vosdal, Live+1,… the amount of seconds per source will
increase. The only exceptions are TV and Satellite as these devices do not allow recording a
program and hence it is impossible to have TSV on these sources.
4 The calculation of Total TV (TTV) and Total Screen Usage (TSU) (as described in 2.1.4 Rating calculation rules) remains unchanged and is still based on the Station code.
Source Code TV=0 VCR=1 SAT=2 Pay=3 DVD=4 PLAY=5 DVB=6 Other=7 CTV=8Total Source
0 => 8
TOTAL TV
2006+
Total
Screen
Usage
Live 34.496 1.411 546 0 17.495 381 234.041 48 579 288.998 288.998 366.506
Live+0 (Live+Vosdal) 34.496 1.446 546 0 18.524 387 246.815 48 579 302.843 302.843 351.596
Live+1 34.496 1.486 546 0 18.917 387 252.540 48 579 309.000 309.000 357.753
Live+2 34.496 1.509 546 0 19.075 387 255.069 48 579 311.710 311.710 360.463
Live+3 34.496 1.568 546 0 19.206 387 256.632 48 579 313.464 313.464 362.217
Live+4 34.496 1.684 546 0 19.299 388 257.701 48 579 314.741 314.741 363.494
Live+5 34.496 1.757 546 0 19.353 388 258.589 48 579 315.756 315.756 364.509
Live+6 34.496 1.846 546 0 19.437 388 259.376 48 579 316.716 316.716 365.469
Live+7 34.496 1.875 546 0 19.499 388 260.103 48 579 317.535 317.535 366.288
OSU 0 1.248 0 0 14.184 3.200 27.738 619 1.764 48.753 48.753
TSU/Source 34.496 3.124 546 0 33.683 3.587 287.841 667 2.343 366.288 366.288 366.288
CIM TV: Calculation and Reporting Rules – January 2016 25
2.3 Algorithm for the evaluation of advertising campaigns (“Live+7”)
2.3.1 General calculation rules for campaign evaluations
The general calculation rules for the CIM TV study have been used since 1997.
a. Main variables
The main variables in the post-evaluation of an advertising campaign are:
Total coverage in %: percentage of target universe having seen a minimum of one
spot
OTS: Opportunity To See. This is the average number of contacts each person has
with the spot.
Contact distribution: cov%(k): percentage persons in the target universe who had k
contacts with the spot.
Daily GRP of each spot
Total GRP of the campaign
Like all TV variables, all computations described in this chapter can be computed for a
particular target. The only difference between computation for one target and for the
Universe is that the sample is restricted to the persons belonging to the specified target
group. We will therefore explain the algorithm for the Universe only.
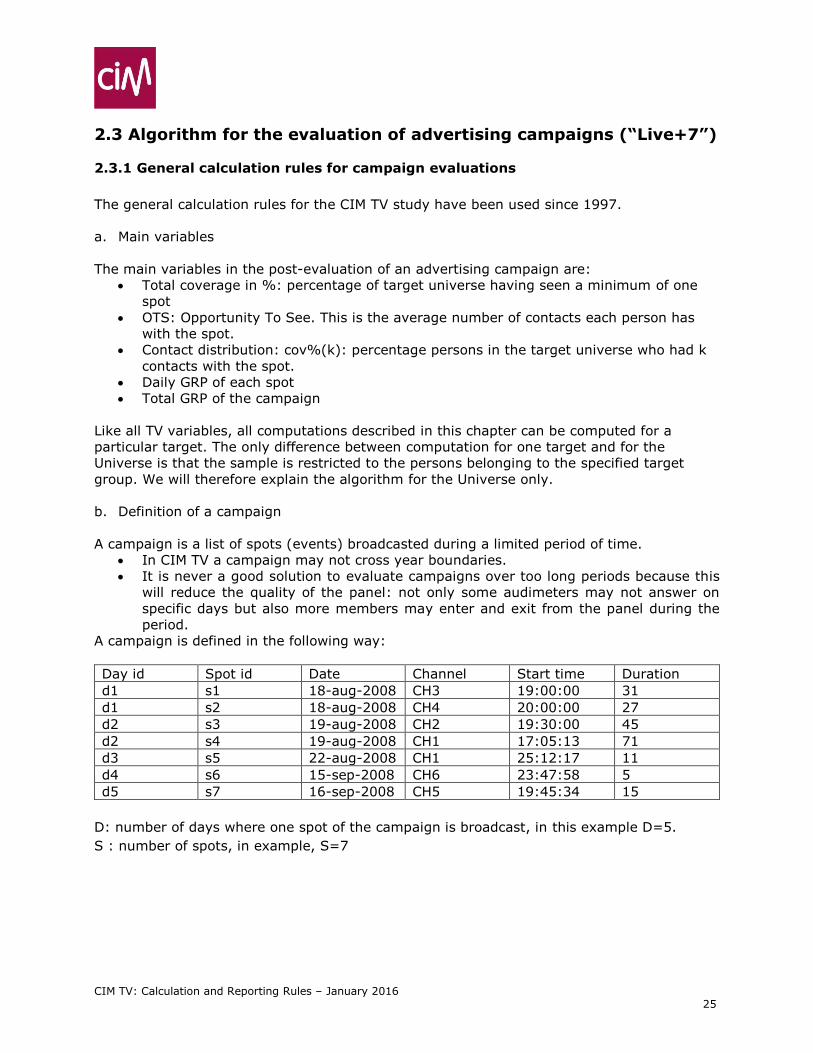
b. Definition of a campaign
A campaign is a list of spots (events) broadcasted during a limited period of time.
In CIM TV a campaign may not cross year boundaries.
It is never a good solution to evaluate campaigns over too long periods because this
will reduce the quality of the panel: not only some audimeters may not answer on
specific days but also more members may enter and exit from the panel during the
period.
A campaign is defined in the following way:
Day id Spot id Date Channel Start time Duration
d1 s1 18-aug-2008 CH3 19:00:00 31
d1 s2 18-aug-2008 CH4 20:00:00 27
d2 s3 19-aug-2008 CH2 19:30:00 45
d2 s4 19-aug-2008 CH1 17:05:13 71
d3 s5 22-aug-2008 CH1 25:12:17 11
d4 s6 15-sep-2008 CH6 23:47:58 5
d5 s7 16-sep-2008 CH5 19:45:34 15
D: number of days where one spot of the campaign is broadcast, in this example D=5.
S : number of spots, in example, S=7
CIM TV: Calculation and Reporting Rules – January 2016 26
c. Panel constitution for a specific campaign
To compute the post-evaluation, the algorithm will first define a campaign panel.
In the CIM TV study the panel used is a Union panel: all participants of the Audimetrie panel
on one or more of the campaign days are a member of the panel.
In the example above, all members of the Audimetrie panel present on the 18th or 19th or
22nd of August or the 15th or 17th of September will be included in the campaign panel.
Earlier (see 2.1.1) the use of the daily weights for each individual panel member was
described. However, at the campaign level, independent of the daily weights, a person
present all days of a campaign will have a higher importance than a person present only a
small number of days. In order to reflect this difference, each person in the campaign panel
receives his own “campaign weight”.
Let’s define:
dW(d,m): “daily weight” of member m for day d (d is the day of broadcast)
cW(m): “campaign weight” of the member (a constant for the campaign)
with
m: one member
M: the number of members
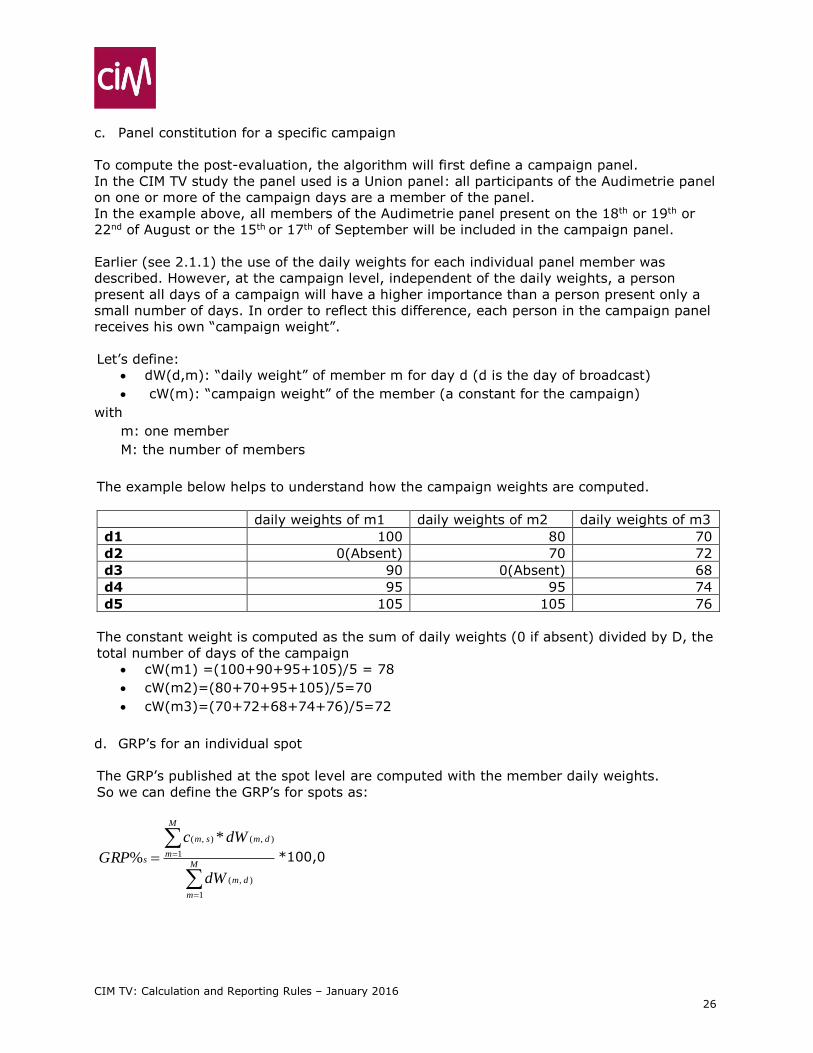
The example below helps to understand how the campaign weights are computed.
daily weights of m1 daily weights of m2 daily weights of m3
d1 100 80 70
d2 0(Absent) 70 72
d3 90 0(Absent) 68
d4 95 95 74
d5 105 105 76
The constant weight is computed as the sum of daily weights (0 if absent) divided by D, the
total number of days of the campaign
cW(m1) =(100+90+95+105)/5 = 78
cW(m2)=(80+70+95+105)/5=70
cW(m3)=(70+72+68+74+76)/5=72
d. GRP’s for an individual spot
The GRP’s published at the spot level are computed with the member daily weights.
So we can define the GRP’s for spots as:
M
m
dm
M
m
dmsm
s
dW
dWc
GRP
1
),(
1
),(),( *
% *100,0
CIM TV: Calculation and Reporting Rules – January 2016 27
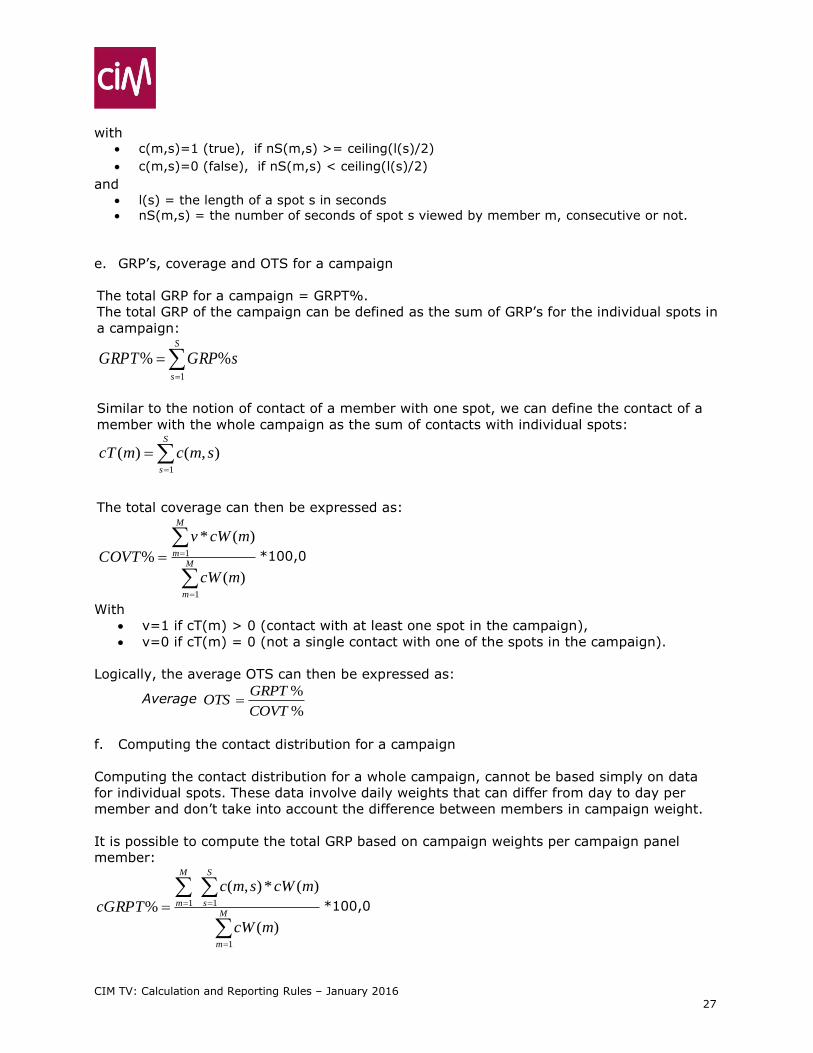
with c(m,s)=1 (true), if nS(m,s) >= ceiling(l(s)/2)
c(m,s)=0 (false), if nS(m,s) < ceiling(l(s)/2)
and l(s) = the length of a spot s in seconds
nS(m,s) = the number of seconds of spot s viewed by member m, consecutive or not.
e. GRP’s, coverage and OTS for a campaign
The total GRP for a campaign = GRPT%.
The total GRP of the campaign can be defined as the sum of GRP’s for the individual spots in
a campaign:
S
s
sGRPGRPT1
%%
Similar to the notion of contact of a member with one spot, we can define the contact of a
member with the whole campaign as the sum of contacts with individual spots:
S
s
smcmcT1
),()(
The total coverage can then be expressed as:
M
m
M
m
mcW
mcWv
COVT
1
1
)(
)(*
% *100,0
With
v=1 if cT(m) > 0 (contact with at least one spot in the campaign),
v=0 if cT(m) = 0 (not a single contact with one of the spots in the campaign).
Logically, the average OTS can then be expressed as:
Average %
%
COVT
GRPTOTS
f. Computing the contact distribution for a campaign
Computing the contact distribution for a whole campaign, cannot be based simply on data
for individual spots. These data involve daily weights that can differ from day to day per
member and don’t take into account the difference between members in campaign weight.
It is possible to compute the total GRP based on campaign weights per campaign panel
member:
M
m
S
s
M
m
mcW
mcWsmc
cGRPT
1
11
)(
)(*),(
% *100,0
CIM TV: Calculation and Reporting Rules – January 2016 28
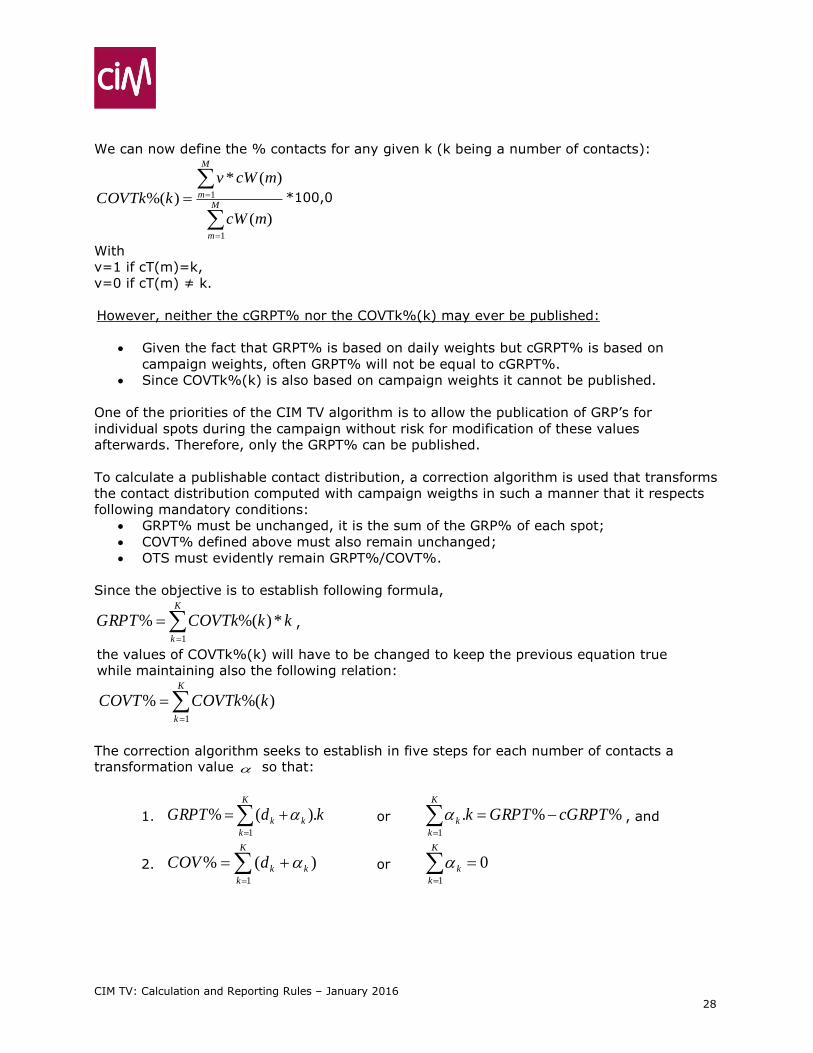
We can now define the % contacts for any given k (k being a number of contacts):
M
m
M
m
mcW
mcWv
kCOVTk
1
1
)(
)(*
)%( *100,0
With
v=1 if cT(m)=k,
v=0 if cT(m) ≠ k.
However, neither the cGRPT% nor the COVTk%(k) may ever be published:
Given the fact that GRPT% is based on daily weights but cGRPT% is based on
campaign weights, often GRPT% will not be equal to cGRPT%.
Since COVTk%(k) is also based on campaign weights it cannot be published.
One of the priorities of the CIM TV algorithm is to allow the publication of GRP’s for
individual spots during the campaign without risk for modification of these values
afterwards. Therefore, only the GRPT% can be published.
To calculate a publishable contact distribution, a correction algorithm is used that transforms
the contact distribution computed with campaign weigths in such a manner that it respects
following mandatory conditions:
GRPT% must be unchanged, it is the sum of the GRP% of each spot;
COVT% defined above must also remain unchanged;
OTS must evidently remain GRPT%/COVT%.
Since the objective is to establish following formula,
K
k
kkCOVTkGRPT1
*)%(% ,
the values of COVTk%(k) will have to be changed to keep the previous equation true
while maintaining also the following relation:
K
k
kCOVTkCOVT1
)%(%
The correction algorithm seeks to establish in five steps for each number of contacts a transformation value so that:
1.
K
k
kk kdGRPT1
).(% or
K
k
k cGRPTGRPTk1
%%. , and
2. )(%1
k
K
k
kdCOV
or
K
k
k
1
0
CIM TV: Calculation and Reporting Rules – January 2016 29
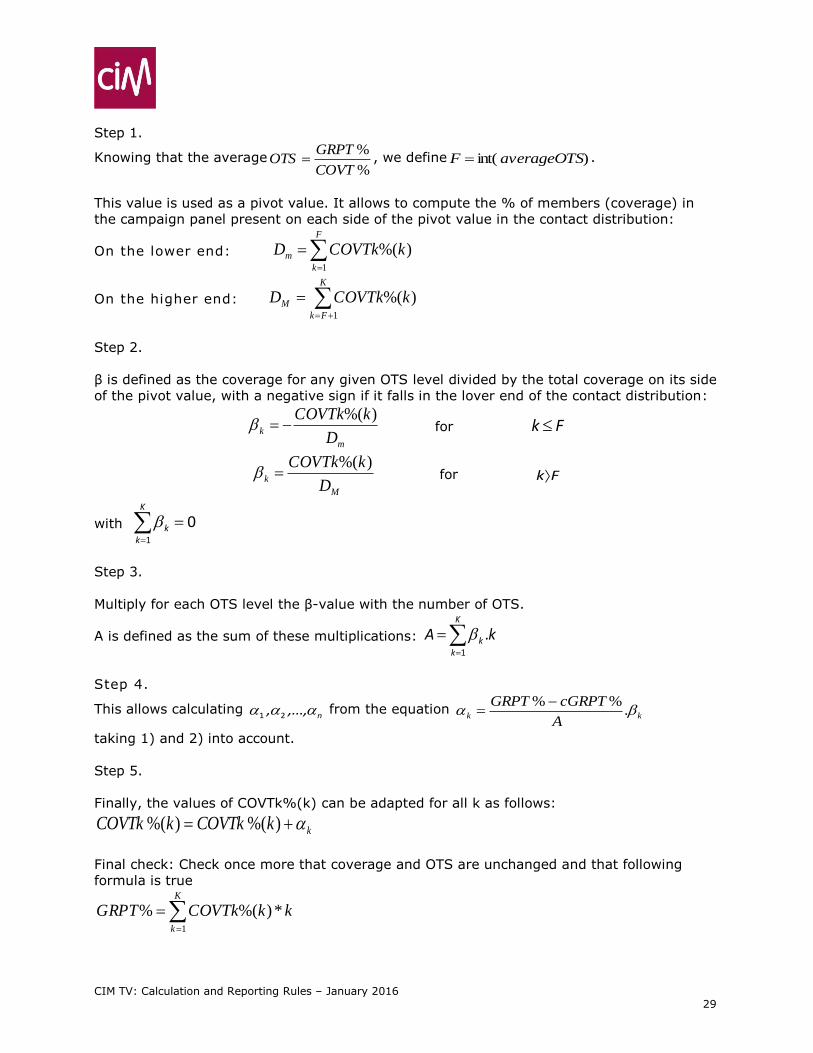
Step 1.
Knowing that the average%
%
COVT
GRPTOTS , we define )int( averageOTSF .
This value is used as a pivot value. It allows to compute the % of members (coverage) in
the campaign panel present on each side of the pivot value in the contact distribution:
On the lower end:
F
k
m kCOVTkD1
)%(
On the higher end:
K
Fk
M kCOVTkD1
)%(
Step 2.
β is defined as the coverage for any given OTS level divided by the total coverage on its side
of the pivot value, with a negative sign if it falls in the lover end of the contact distribution:
m
kD
kCOVTk )%( for Fk
M
kD
kCOVTk )%( for Fk
with
K
kk
1
0
Step 3.
Multiply for each OTS level the β-value with the number of OTS.
A is defined as the sum of these multiplications: k.AK
kk
1
Step 4.
This allows calculating n,...,, 21 from the equation
kkA
cGRPTGRPT .
%%
taking 1) and 2) into account.
Step 5.
Finally, the values of COVTk%(k) can be adapted for all k as follows:
kkCOVTkkCOVTk )%()%(
Final check: Check once more that coverage and OTS are unchanged and that following
formula is true
K
k
kkCOVTkGRPT1
*)%(%
CIM TV: Calculation and Reporting Rules – January 2016 30
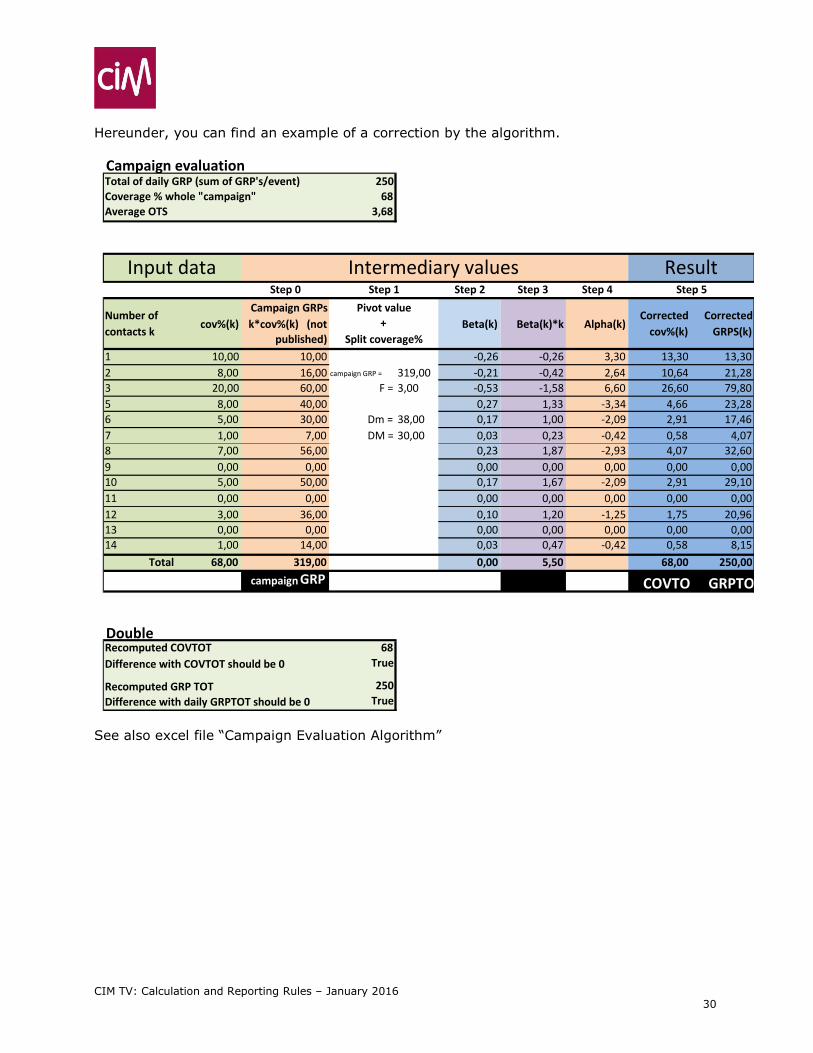
Hereunder, you can find an example of a correction by the algorithm.
Campaign evaluation results Total of daily GRP (sum of GRP's/event) 250 Coverage % whole "campaign" 68 Average OTS 3,68
Step 0 Step 2 Step 3 Step 4
Number of contacts k
cov%(k) Campaign GRPs k*cov%(k) (not
published) Beta(k) Beta(k)*k Alpha(k)
Corrected cov%(k)
Corrected GRPS(k)
1 10,00 10,00 -0,26 -0,26 3,30 13,30 13,30 2 8,00 16,00 campaign GRP = 319,00 -0,21 -0,42 2,64 10,64 21,28 3 20,00 60,00 F = 3,00 -0,53 -1,58 6,60 26,60 79,80 5 8,00 40,00 0,27 1,33 -3,34 4,66 23,28 6 5,00 30,00 Dm = 38,00 0,17 1,00 -2,09 2,91 17,46 7 1,00 7,00 DM = 30,00 0,03 0,23 -0,42 0,58 4,07 8 7,00 56,00 0,23 1,87 -2,93 4,07 32,60 9 0,00 0,00 0,00 0,00 0,00 0,00 0,00 10 5,00 50,00 0,17 1,67 -2,09 2,91 29,10 11 0,00 0,00 0,00 0,00 0,00 0,00 0,00 12 3,00 36,00 0,10 1,20 -1,25 1,75 20,96 13 0,00 0,00 0,00 0,00 0,00 0,00 0,00 14 1,00 14,00 0,03 0,47 -0,42 0,58 8,15
Total 68,00 319,00 0,00 5,50 68,00 250,00
campaign GRP A
COVTOT
GRPTOT
Double check Recomputed COVTOT 68 Difference with COVTOT should be 0 True
Recomputed GRP TOT 250 Difference with daily GRPTOT should be 0 True
Input data
Pivot value +
Split coverage%
Step 1
Intermediary values Result
Step 5
See also excel file “Campaign Evaluation Algorithm”
CIM TV: Calculation and Reporting Rules – January 2016 31
2.3.2 Adaptations to handle time shift viewing in the post-evaluation algorithm
Time Shifted Viewing can create a slightly different situation:
c(m,s) was always 0 or 1.
It now becomes the total number of Live and Time Shifted contacts of member m with
spot s.
Its value can be 0, 1 or higher.
If we define
LENGTH: the number of seconds of spot s
LIMIT : ceiling (l(s)/2,0)
NS: total number of seconds of this spot seen by member,
eventually partly live, partly in TSV
the value of c(m,s) is defined in the following way
0 if NS < LIMIT
1 if NS between LIMIT and (LENGTH + LIMIT -1)
2 if NS between (LENGTH + LIMIT) and (2* LENGTH + LIMIT -1)
N if NS between ((N-1) * LENGTH + LIMIT) and (N* LENGTH + LIMIT -1)
Another modification is the number of values in the distribution contacts.
With TSV, the distribution contacts can contain more values than the actual number of
spots.
CIM TV: Calculation and Reporting Rules – January 2016 32
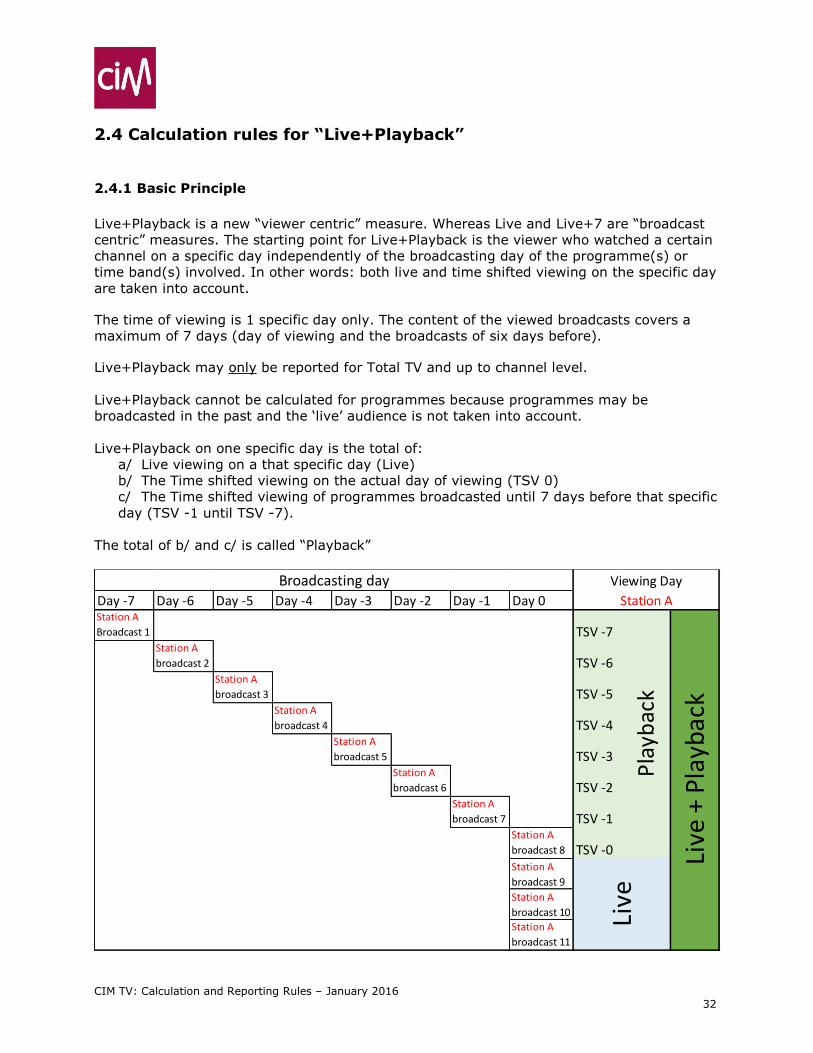
2.4 Calculation rules for “Live+Playback”
2.4.1 Basic Principle
Live+Playback is a new “viewer centric” measure. Whereas Live and Live+7 are “broadcast
centric” measures. The starting point for Live+Playback is the viewer who watched a certain
channel on a specific day independently of the broadcasting day of the programme(s) or
time band(s) involved. In other words: both live and time shifted viewing on the specific day
are taken into account.
The time of viewing is 1 specific day only. The content of the viewed broadcasts covers a
maximum of 7 days (day of viewing and the broadcasts of six days before).
Live+Playback may only be reported for Total TV and up to channel level.
Live+Playback cannot be calculated for programmes because programmes may be
broadcasted in the past and the ‘live’ audience is not taken into account.
Live+Playback on one specific day is the total of:
a/ Live viewing on a that specific day (Live)
b/ The Time shifted viewing on the actual day of viewing (TSV 0)
c/ The Time shifted viewing of programmes broadcasted until 7 days before that specific
day (TSV -1 until TSV -7).
The total of b/ and c/ is called “Playback”
Day -7 Day -6 Day -5 Day -4 Day -3 Day -2 Day -1 Day 0Station A
Broadcast 1 TSV -7Station A
broadcast 2 TSV -6Station A
broadcast 3 TSV -5Station A
broadcast 4 TSV -4Station A
broadcast 5 TSV -3Station A
broadcast 6 TSV -2Station A
broadcast 7 TSV -1Station A
broadcast 8 TSV -0Station A
broadcast 9
Station A
broadcast 10
Station A
broadcast 11
Station A
Viewing DayBroadcasting day
Pla
ybac
kLi
ve
Live
+ P
layb
ack
CIM TV: Calculation and Reporting Rules – January 2016 33
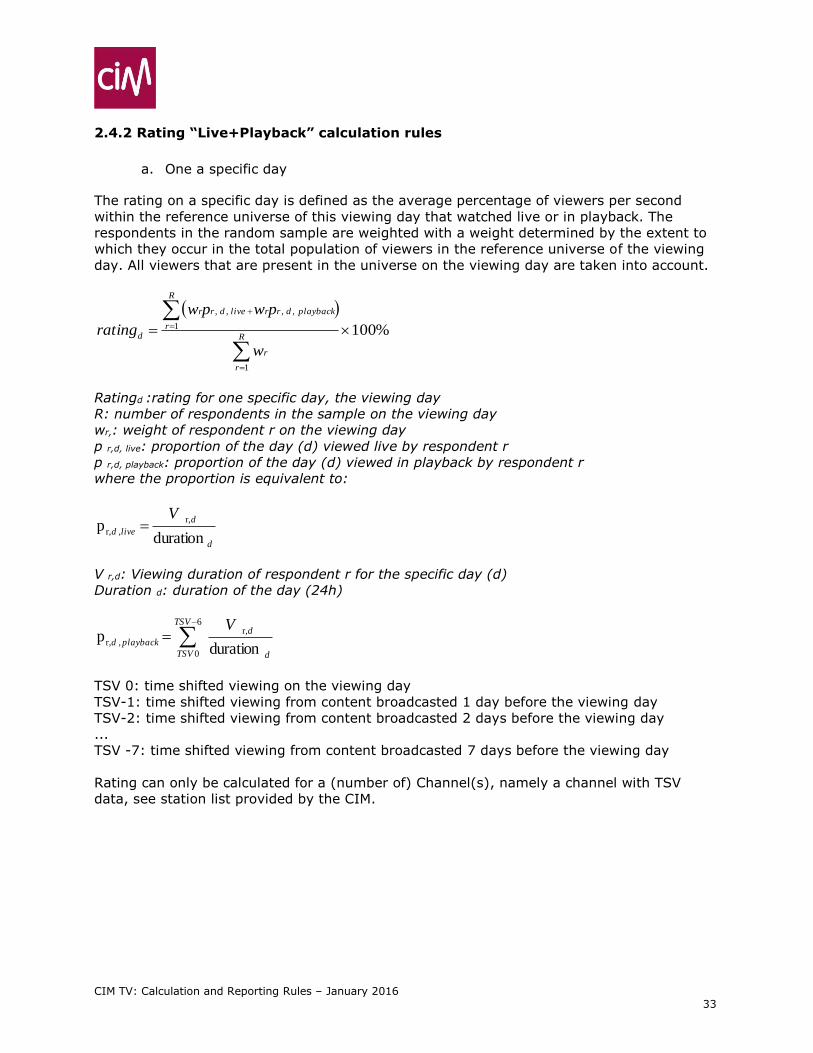
2.4.2 Rating “Live+Playback” calculation rules
a. One a specific day
The rating on a specific day is defined as the average percentage of viewers per second
within the reference universe of this viewing day that watched live or in playback. The
respondents in the random sample are weighted with a weight determined by the extent to
which they occur in the total population of viewers in the reference universe of the viewing
day. All viewers that are present in the universe on the viewing day are taken into account.
%100
1
1
,,,,
R
r
r
R
r
playbackdrrlivedrr
d
w
pwpw
rating
Ratingd :rating for one specific day, the viewing day
R: number of respondents in the sample on the viewing day
wr,: weight of respondent r on the viewing day
p r,d, live: proportion of the day (d) viewed live by respondent r
p r,d, playback: proportion of the day (d) viewed in playback by respondent r
where the proportion is equivalent to:
d
d
lived
V
duration
p
r,
, r,
V r,d: Viewing duration of respondent r for the specific day (d)
Duration d: duration of the day (24h)
d
dTSV
TSV
playbackd
V
duration
p
r,6
0
, r,
TSV 0: time shifted viewing on the viewing day
TSV-1: time shifted viewing from content broadcasted 1 day before the viewing day
TSV-2: time shifted viewing from content broadcasted 2 days before the viewing day
...
TSV -7: time shifted viewing from content broadcasted 7 days before the viewing day
Rating can only be calculated for a (number of) Channel(s), namely a channel with TSV
data, see station list provided by the CIM.
CIM TV: Calculation and Reporting Rules – January 2016 34
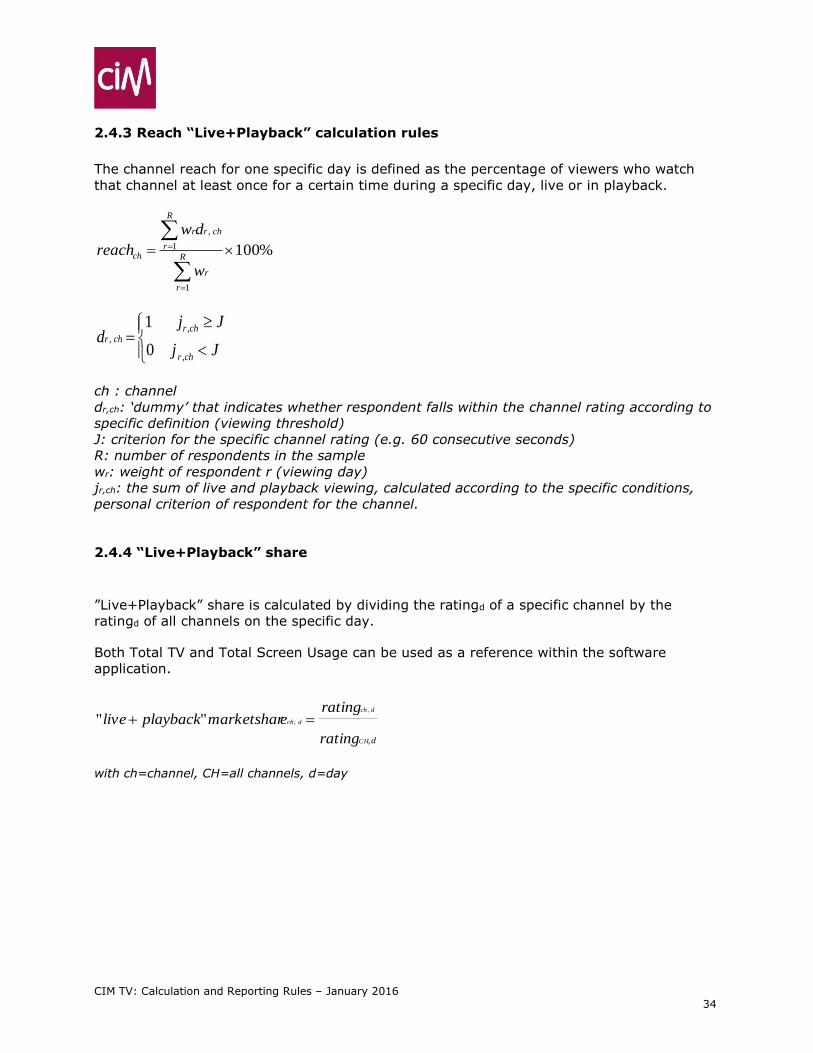
2.4.3 Reach “Live+Playback” calculation rules
The channel reach for one specific day is defined as the percentage of viewers who watch
that channel at least once for a certain time during a specific day, live or in playback.
%100
1
1
,
R
r
r
R
r
chrr
ch
w
dw
reach
Jj
Jjd
chr
chrchr
,
,,
0
1
ch : channel
dr,ch: ‘dummy’ that indicates whether respondent falls within the channel rating according to
specific definition (viewing threshold)
J: criterion for the specific channel rating (e.g. 60 consecutive seconds)
R: number of respondents in the sample
wr: weight of respondent r (viewing day)
jr,ch: the sum of live and playback viewing, calculated according to the specific conditions,
personal criterion of respondent for the channel.
2.4.4 “Live+Playback” share
”Live+Playback” share is calculated by dividing the ratingd of a specific channel by the
ratingd of all channels on the specific day.
Both Total TV and Total Screen Usage can be used as a reference within the software
application.
d,CH
dch
dch
rating
ratingemarketsharplaybacklive
,
,""
with ch=channel, CH=all channels, d=day

CIM TV: Calculation and Reporting Rules – January 2016 35
3. Reporting rules
3.1 Live, Live+7 and Live+Playback rating/reach
Given the introduction of Time Shifted Viewing, it has become possible to make different
calculations for rating and reach:
Live rating/reach : viewing during the live broadcast,
Live+7 rating/reach : viewed during the live broadcast or until 7 days later;
Live+Playback rating/reach : viewed live and playback (broadcasted until 7 days
before the viewing day).
Live and Live+7 rating and reach emit from 1 broadcast and when it is viewed, live or later:
Live + Playback rating and reach proceed from the viewers who, on 1 day, view one channel
live or broadcasts from the near past of one channel in playback.
Schematically, the distinction between Live, Live+7 and Live+Playback looks like this.
Day -7 Day -6 Day -5 Day -4 Day -3 Day -2 Day -1 Day 0 Day 0 Day 1 Day 2 Day 3 Day 4 Day 5 Day 6 Day 7
Station A
Broadcast 1 TSV -7Station A
broadcast 2 TSV -6
Station A
broadcast 3 TSV -5
Station A
broadcast 4 TSV -4Station A
broadcast 5 TSV -3Station A
broadcast 6 TSV -2Station A
broadcast 7 TSV -1Station A
broadcast 8 TSV -0
LiveStation A
broadcast 9
Station A
broadcast 12
Station A
TSV of 12
Station A
TSV of 9
LiveStation A
broadcast 10
Station A
broadcast 13
Station A
TSV of 3
Station A
TSV of 8
LiveStation A
broadcast 11
Station A
broadcast 14
Station A
TSV of 7
Station A
TSV of 10
Station A
TSV of 5
Live Live TSV 0 TSV 1 TSV 2 TSV 3 TSV 4 TSV 5 TSV 6 TSV 7
Viewing day
6
Broadcasting day One Specific Day
Station A
Playback
CIM TV: Calculation and Reporting Rules – January 2016 36
3.2 Live, Live+7 and Live+Playback
The calculation of the share of a broadcast or time band in total viewing becomes more
difficult, due to the introduction of Time Shifted Viewing. Depending on the jumping-off
point, both the viewing volume of a broadcast and the total viewing volume can be defined
differently.
The software applications must enable two different bases for analysis of the data:
The broadcast: the content as it is broadcast live on day X.
The viewer: the period when a viewer watches content, live on day 0 or time shifted.
The term ‘content’ broadly encompasses all types of broadcasts here: programmes,
programme components, spots, etc.
The CIM has decided that for ‘content’ only 3 results may be published:
Live share (based on a broadcast)
Live+6 share (based on a broadcast between 01/01/2010 and 31/12/2015)
Live+7 share (based on a broadcast since 01/01/2016).
And for only time combined with channel:
Live+Playback share (based on the viewer).
Any other analysis may only be used for internal purposes.
3.2.1 Live share
Until the introduction of data regarding Time Shifted Viewing, the market share was
calculated as the percentage of viewers who watched a broadcast (live by definition) or time
band, divided by the total viewing audience (see 2.1.4 above).
This notion remains in existence by the name ‘Live share’.
3.2.2 Live+6 share
By measuring Time Shifted Viewing, it became obviously interesting to add up the sum of
live and time shifted viewing (on the day itself until six days later) for a broadcast and to
compare it with the broadcasts on other channels with the same start and end time.
This variable is called ‘Live+6 share’ and may only be reported for the period 01/01/2010 -
31/12/2015
CIM TV: Calculation and Reporting Rules – January 2016 37
3.2.3 Live+7 share
The variable, ‘Live+7 share’ has the same characteristics as Live+6 share but include one
additional day of time shifted viewing. All reporting of programmes, broadcast schedules, as
well as spots, blocks of advertising and time bands that were broadcasted since 1st of
January 2016, should be done using this variable.
Example:
The programme ‘Thuis’ was broadcast on 01/02/2016 and was viewed on that day as well as
later. This programme was then (re)watched later and distributed up to 7 days after broadcast.
Until 08/02/2016, time shifted viewing of ‘Thuis’ was allocated to 01/02/2016.
The ‘Live share’ of Thuis corresponds with the market share as was used until the
introduction of TSV: the percentage of viewers of ‘Thuis’ in relation to the total ‘live’ viewing
audience.
The ‘Live+7 share’ is the percentage of viewers of ‘Thuis’ in relation to the total viewing
audience. The total viewing audience are the viewers of Thuis and all time slots of
broadcasts that were programmed parallel on 1/9/2008 (from 9:15 pm – 10:05 pm) and
that were viewed both live (on 01/02/2016) and time-shifted (01/02/2016 (VOSDAL)-
08/02/2016).
This type of reporting can also be applied to a channel's broadcast schedule.
For example: RTL-TVI between 8 pm and 10:30 pm on 01/02/2016.
All viewers (both live and time shifted until and including 08/02/2016) of the programmes
within this time span on Canvas and the programmes on the channels that are programmed
parallel belong to the total Live+7 viewing audience.
This idea applies to programmes, broadcast schedules, as well as spots, blocks of
advertising and time bands.
3.2.4 Live+Playback share
The starting point here is the viewer who watched a certain channel on a specific day, separate
from the fact of whether the broadcast was followed live or dated from an earlier time (until
six days ago).
The time of viewing is thus one specific day only. The content of the viewed broadcasts covers
a maximum of 8 days (day of viewing until and including seven days before).
The share of a channel is defined here as the ‘Live+Playback share’.
To keep the user from becoming lost in all possible combinations of viewing times and
programmes, time bands, spots and so on, reach, rating and share may only be reported for
Total TV and up to channel level.
3.2.5 “+7” and “Playback”
In the CIM TV study, time shifted viewing is identified as TSV up until 7 days after broadcast
(Day 0 to Day 7 inclusive). The total of this TSV is called “+7”
CIM TV: Calculation and Reporting Rules – January 2016 38
The total of the time shifted viewing on the actual day of viewing (TSV 0) and the time shifted
viewing of programmes broadcasted until 7 days before that specific day (TSV -1 until TSV -
7) is called “Playback”.
3.2.6 Monthly figures including Time Shifted Viewing
Calculations of reach and rating for a month may only be reported on the basis of a channel.
In a month of 30 days, the figures must be calculated based on what was watched from day
1 to 30, inclusive.
So this is not about the programming of those days that can also be viewed seven days after
the month has ended.
3.2.7 Campaign evaluation
Since the currency is ‘Live+7+guests’, the balance of advertising campaigns may only be
published on the basis of Live+7+guests.
In practical terms, this means:
Day 1 is the day of the broadcast of spot 1,
The last campaign day is the day of broadcast of the last spot + 7 days.
CIM TV: Calculation and Reporting Rules – January 2016 39
3.3 Source citation
Every report without exception must state the conditions or parameters that resulted in the
specific reported channel reach.
As indicated above, CIM TV considers ‘Live+7+guests’ as the currency.
Every document and presentation must state the source of the data: ‘Source: CIM TV’ as
well as the target group, hour slot and all additional parameters that determined the
universe of the analysis. Also the company who generated the data needs to be mentioned.
The fact that a channel has a detailed listing in AUB, has a monthly broadcasting report or
just per quarter must be considered.
If it does not involve complete data, this must be clearly indicated:
If Live only: ‘Source: CIM TV – Incomplete figures, only live viewing’
If Time Shifted only: ‘Source: CIM TV – Incomplete figures, only time shifted viewing’
3.4 Rounding
The CIM recommends rounding to one (1) digit after the decimal point for final reporting.
An exception is the export of data, in databases or in other software, where new calculations
can be made. Greater precision remains necessary there (at least 4 digits after the decimal
point).
CIM TV: Calculation and Reporting Rules – January 2016 40
4. Available files An Excel file with a detailed description of ATA-ATB and TSV files is available upon request at
CIM: 02/661 31 53 or [email protected]. http://www.cim.be/nl/televisie/methodologie
http://www.cim.be/fr/television/methodologie
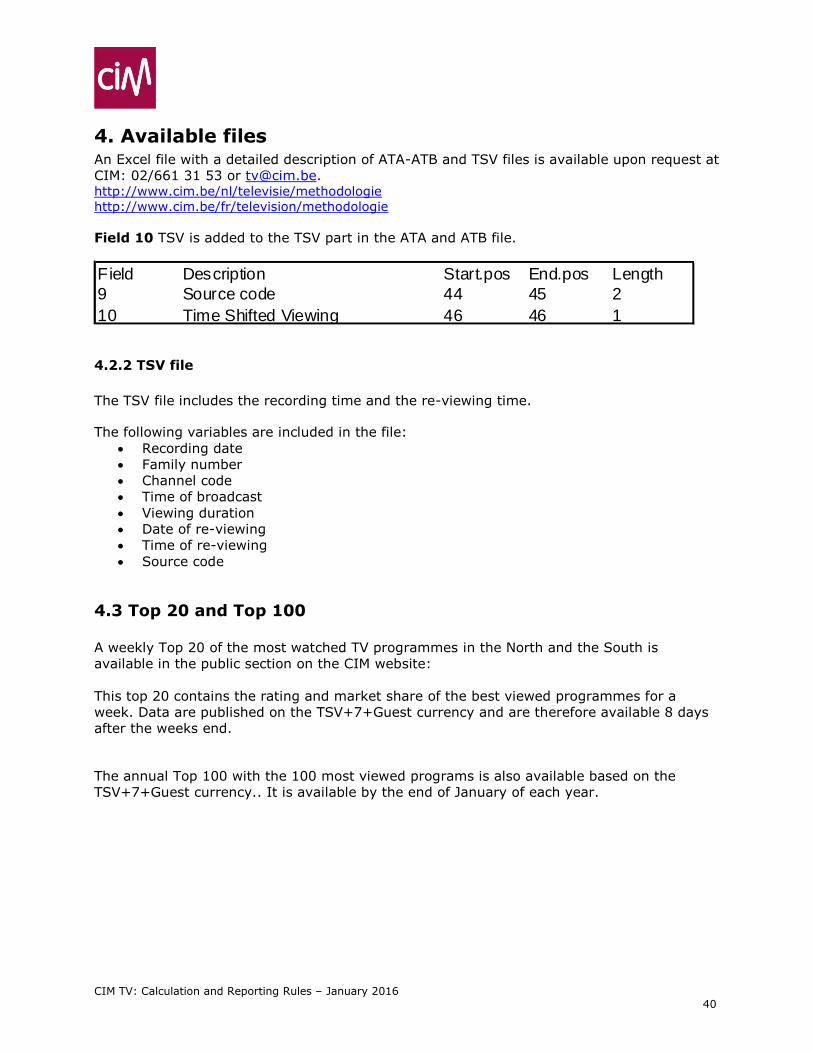
Field 10 TSV is added to the TSV part in the ATA and ATB file.
4.2.2 TSV file
The TSV file includes the recording time and the re-viewing time.
The following variables are included in the file:
Recording date
Family number
Channel code
Time of broadcast
Viewing duration
Date of re-viewing
Time of re-viewing
Source code
4.3 Top 20 and Top 100
A weekly Top 20 of the most watched TV programmes in the North and the South is
available in the public section on the CIM website:
This top 20 contains the rating and market share of the best viewed programmes for a
week. Data are published on the TSV+7+Guest currency and are therefore available 8 days
after the weeks end.
The annual Top 100 with the 100 most viewed programs is also available based on the
TSV+7+Guest currency.. It is available by the end of January of each year.
Field Description Start.pos End.pos Length
9 Source code 44 45 2
10 Time Shifted Viewing 46 46 1