chris lynch - rio tinto - rio tinto · the bauxite production target which appears on slide 10 was...
TRANSCRIPT

Chris Lynch Chief financial officer
BoAML Global Metals, Mining & Steel Conference 2016 10 May 2016

©2016, Rio Tinto, All Rights Reserved
Cautionary statement
This presentation has been prepared by Rio Tinto plc and Rio Tinto Limited (“Rio Tinto”). By accessing/attending this presentation you acknowledge that you have read
and understood the following statement. In this presentation all figures are US dollars unless stated otherwise.
Forward-looking statements
This document contains certain forward-looking statements with respect to the financial condition, results of operations and business of the Rio Tinto Group. These
statements are forward-looking statements within the meaning of Section 27A of the US Securities Act of 1933, and Section 21E of the US Securities Exchange Act of
1934. The words “intend”, “aim”, “project”, “anticipate”, “estimate”, “plan”, “believes”, “expects”, “may”, “should”, “will”, “target”, “set to” or similar expressions, commonly
identify such forward-looking statements.
Examples of forward-looking statements include those regarding estimated ore reserves, anticipated production or construction dates, costs, outputs and productive lives
of assets or similar factors. Forward-looking statements involve known and unknown risks, uncertainties, assumptions and other factors set forth in this presentation.
For example, future ore reserves will be based in part on market prices that may vary significantly from current levels. These may materially affect the timing and
feasibility of particular developments. Other factors include the ability to produce and transport products profitably, demand for our products, changes to the assumptions
regarding the recoverable value of our tangible and intangible assets, the effect of foreign currency exchange rates on market prices and operating costs, and activities by
governmental authorities, such as changes in taxation or regulation, and political uncertainty.
In light of these risks, uncertainties and assumptions, actual results could be materially different from projected future results expressed or implied by these forward-
looking statements which speak only as to the date of this presentation. Except as required by applicable regulations or by law, the Rio Tinto Group does not undertake
any obligation to publicly update or revise any forward-looking statements, whether as a result of new information or future events. The Group cannot guarantee that its
forward-looking statements will not differ materially from actual results.
Disclaimer
Neither this presentation, nor the question and answer session, nor any part thereof, may be recorded, transcribed, distributed, published or reproduced in any form,
except as permitted by Rio Tinto. By accessing/ attending this presentation, you agree with the foregoing and, upon request, you will promptly return any records or
transcripts at the presentation without retaining any copies.
This presentation contains a number of non-IFRS financial measures. Rio Tinto management considers these to be key financial performance indicators of the business
and they are defined and/or reconciled in Rio Tinto’s annual results press release and/or Annual report.
Production Targets
The bauxite production target which appears on slide 10 was disclosed in a media release dated 27 November 2015 (“Rio Tinto approves US$1.9 billion Amrun (South of
Embley) bauxite project”). All the material assumptions underpinning that production target continue to apply and have not materially changed since the date of that
release.
The copper production target for Oyu Tolgoi underground and open pit is underpinned 3 per cent by proven ore reserves and 97 per cent by probable ore reserves, which
have been scheduled from current mine designs by Competent Persons in accordance with the requirements of the Australasian Code for Reporting of Exploration
Results, Minerals Resources and Ore Reserves, 2012 Edition.
The Silvergrass production target on pages 9 and 13 is based on a staged production ramp up commencing in 2015 and ramping up to ~20 mtpa by 2018. The 20Mtpa
2018 production rate is underpinned 34% by proven ore reserves and 66% by probable ore reserves, which have been scheduled by Competent Persons in accordance
with the requirements of the Australasian Code for Reporting of Exploration Results, Minerals Resources and Ore Reserves, 2012 Edition.
2

©2016, Rio Tinto, All Rights Reserved
3
Safety comes first
A history of continual improvement in safety AIFR per 200,000 hours worked
• Lowest ever injury rates in 2015
• Focused on further reducing
injury rates and eliminating
fatalities
− Leadership and culture
− Critical risks and controls
− Systems and technology
− Learning and communication
• Introduction of new Critical Risk
Management (CRM) Program
which supports the identification
and control of fatality risks
0.0
0.2
0.4
0.6
0.8
1.0
1.2
1.4
’06 ’07 ’08 ’09 ’10 ’11 ’12 ’13 '14 '15

©2016, Rio Tinto, All Rights Reserved
… lifting commodity prices
from start of year lows…
40
50
60
70
80
90
100
110
120
Jan-15 Jul-15 Jan-16
4
Improved Chinese construction activity but macro environment still challenging
...but broader indicators still
point to caution
-20
-15
-10
-5
0
5
10
Jan-15 Jul-15 Jan-16
Iron ore Aluminium Copper
Oil
0
Electricity production
Industrial value added
Rail freight Chart: Bloomberg data indexed to 4 Jan 2015. Chart: Year on year growth, 3 month moving average.
Data source: CEIC database.
Increased credit has fuelled
China’s construction activity
-30
-20
-10
0
10
20
30
40
Jan-15 Jul-15 Jan-16
Housing starts
Floor space sold
Chart: Year on year growth, 3 month moving average. Data source: CEIC database.
Cement production

©2016, Rio Tinto, All Rights Reserved
Iron Ore Aluminium Copper
Key
businesses Pilbara
Bauxite
First quartile smelters
Oyu Tolgoi,
Escondida & Grasberg
Industry
attractiveness Robust long-term demand Strong demand Constrained supply
Competitive
advantages
Lowest cost major
producer to China
Integrated infrastructure
Benchmark product
Technical marketing
Large, low-cost
bauxite assets
Low-cost renewable
power
Technical leadership and
marketing
Tier 1 assets
Attractive growth options
Technology and
innovation
2015 margins >60%
FOB EBITDA margin
>30%
Integrated operating
EBITDA margin
>30%
Operating EBITDA margin
5
Stability comes from Tier 1 assets…

©2016, Rio Tinto, All Rights Reserved
Reduced costs
Decreased capex
Operating, exploration & evaluation cost reductions vs 2012 base in US$ billion. Total capital expenditure in US$ billion each year
Recycling capital
via divestments
Released working capital
Divestments announced or completed
since January 2013
Working capital cash release achieved on 31 December
2015 vs 2012 base in US$ billion.
2013 2014 2015 Total savings
0.6
1.5
1.5 3.6
6
…and a culture of cash generation and efficiency
US$4.7bn
Savings 2013to 2015
2016 target 2017 target Total savingstarget
6.2 1.0
1.0
6.2
2.1 2.0 2.0 2.0
0
2
4
6
8
2015A 2016F 2017F 2018F
2.6 ~2.0
~3.0 ~3.5
8.2
growth
sustaining

©2016, Rio Tinto, All Rights Reserved
7
...which provides a strong balance sheet and cash returns to shareholders
1 Gearing ratio = net debt/ (net debt + book equity). * Post 2015 $2 billion share buy-back.
22.1
18.1
12.5
14.5 13.7 13.8
SBB
28%
25%
19%
21% 21%
24%
Jun-13 Dec-13 Dec-14 Pro formaDec-14*
Jun-15 Dec-15
Net debt and gearing ratio1
US$ billion
Gearing ratio Net debt
8.3
Balanced allocation to growth and returns US$ billion
27% 70%
3.0 3.3 3.7
4.1 1.5
2.0
12.3
10.0
5.5 2.6
2012 2013 2014 2015
Dividend Share buy-back Growth capital

©2016, Rio Tinto, All Rights Reserved
8
New dividend policy – returning cash to shareholders…
Culture of cash generation
• Operating expenditure control
and productivity improvement
• Commercial excellence
• Working capital discipline
• Recycling capital through
divestments
Balanced capital allocation
Maintain an appropriate balance
between:
• Investment in compelling growth
projects with IRR > 15%; and
• Total shareholder cash returns of
40-60% of underlying earnings
through the cycle

©2016, Rio Tinto, All Rights Reserved
Amrun
OT Underground
Silvergrass
Approved in November 2015 Approved in May 2016 Decision expected in 2016
22.8 Mt/a of bauxite1 560ktpa2 of copper ~20 Mt/a of mine and
plant capacity3
>20%4
>20%5
TBC
2019
2020
Staged 2015 to 2018
9
Al Cu Fe
…while investing in compelling growth
Expected IRRs:
First production:
1 Refer to the statements supporting Rio Tinto’s resources, reserves and production targets on slide 2 of this presentation. 2 Average production 2025-2030. Refer to the
statements supporting Rio Tinto’s resources, reserves and production targets on slide 2 of this presentation. 3 The Nammuldi Incremental Tonnes project added 5 Mt/a of mine and
plant capacity in 2015 and will add a further 5 Mt/a in 2016, taking total capacity to 10 Mt/a. Full Silvergrass approval will add a further ~10 Mt/a of mine and plant capacity, taking
total capacity to ~20 Mt/a. Refer to statements supporting Rio Tinto’s production targets on slide 2 of this presentation. 4 IRR based on CRU price assumptions as at 8 December
2015. 5 IRR based on Wood Mackenzie Q1 2016 price forecasts.

©2016, Rio Tinto, All Rights Reserved
Amrun is a Tier 1 investment offering high-quality growth into China’s import bauxite market
10
• Attractive Chinese import bauxite
demand growth outlook
• First quartile delivered mining costs
• Over 40 year mine life
• Low capital intensity of ~$83/t
• Compelling project return in excess
of 20%2
• 22.8Mtpa1 to replace East Weipa and
increase exports by ~10Mt/a
• Attractive expansion options
• Solidifying Cape York as product of
choice for seaborne market
1 Refer to the statements supporting Rio Tinto’s resources, reserves and production targets on slide 2 of this presentation. 2 IRR based on CRU price assumptions as at 8 December 2015.
2020 seaborne bauxite cost curve CFR north China, not value in use adjusted
0 25 50 75 100
Other
Rio Tinto, Australia

©2016, Rio Tinto, All Rights Reserved
1.66%
0.96%
0.77%
0.39%
0
200
400
600
800
1000
1200
1400
1600
1800
2000
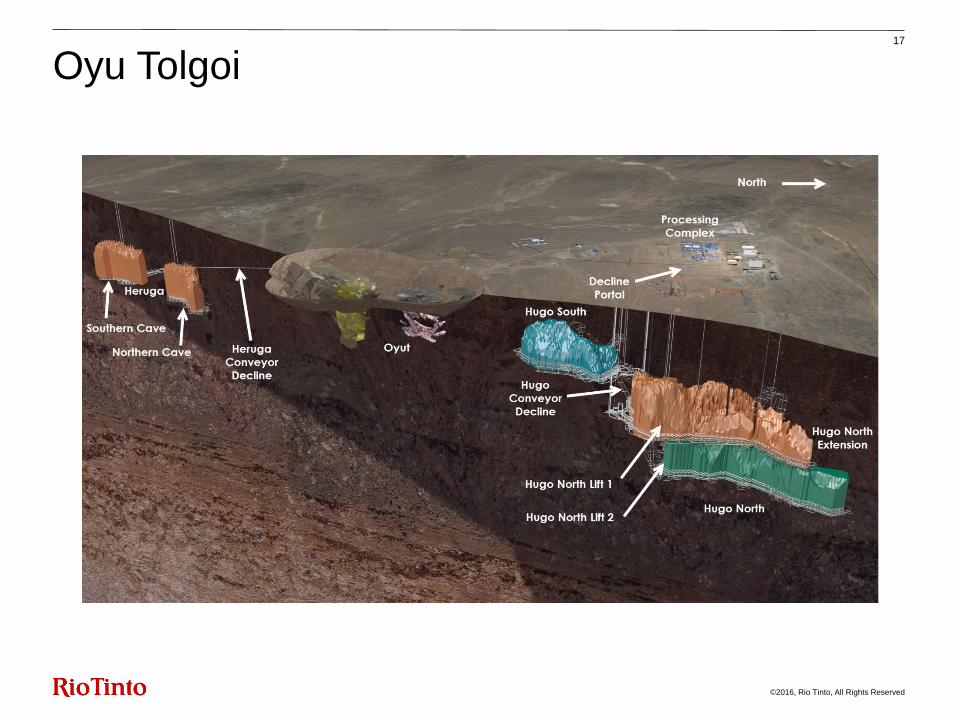
Hugo Northreserves
Hugo Northresources
Hugo South Heruga
Probable ore reserves Measured resources
Indicated resources Inferred resources
Cu grade
• Hugo North Lift 1 approval is the first
step in unlocking underground value
• Probable Underground Ore
Reserves of 499Mt at 1.66% Cu and
0.35 g/t Au
• 200kms of underground lateral
development
• Life of mine could be extended
further with the future development
of Hugo North Lift 2, Hugo South and
Heruga deposits
Oyu Tolgoi is a Tier 1 asset and a world-class copper and gold deposit
11
1 JORC compliant resource taken from Rio Tinto 2015 Annual Report dated 3 March 2016 and released to the market on 3 March 2016. OT underground reserves include Hugo
Dummett North and Hugo Dummett North Extension. The Competent Person responsible for that previous reporting was J Dudley (AusIMM Reserves), R Singh (AusIMM
Reserves) and O Togtokhbayar (AusIMM Resources). Rio Tinto is not aware of any new information or data that materially affects these resource estimates, and confirms that all
material assumptions and technical parameters underpinning the estimates continue to apply and have not materially changed. The form and context in which the competent
persons’ findings are presented have not been materially modified.
Oyu Tolgoi deposits and copper grades1
Million tonnes Percentage

©2016, Rio Tinto, All Rights Reserved
Compelling returns expected from Oyu Tolgoi underground project
12
2025 cost curve Copper equivalent unit cost1
Source: Wood Mackenzie cost curve data Q1 2016. Oyu Tolgoi forecasts 2025-30 average from 2016 Feasibility Study. 1 Unit costs include sustaining capex, deferred stripping and royalties.2 IRR based on Wood Mackenzie Q1 2016 price forecasts. 3 Average production 2025-2030. Refer to the
statements supporting Rio Tinto’s resources, reserves and production targets on slide 2 of this presentation.
• First quartile operating costs
• Compelling project IRR of >20%2
• $5.3 billion development capex:
− Spread over 7 years
− Funded from project finance ($4.4
billion already committed with
headroom for supplemental $1.6
billion of debt)
• First production from the
underground expected in 2020
• Average production of ~560
thousand tonnes of copper 2025-303
• Existing infrastructure and supply
chain/route to market
300
200
18,000 16,000 14,000 12,000 10,000 8,000 6,000 4,000 2,000 0
100
0
400
kt
Oyu Tolgoi
2025-30
Q1 Q2 Q3 Q4

©2016, Rio Tinto, All Rights Reserved
• Early access to Silvergrass ore
(Nammuldi Incremental Tonnes):
− 5 Mt/a commenced Q4 2015
− Additional 5 Mt/a expected Q4 2016
• Full Silvergrass infrastructure
development:
− Subject to approval in 2016
− Haul road replaced with conveyor
− Additional ~10 Mt/a mine and
infrastructure capacity1
− Expected capex <$500 million
13
Silvergrass provides mine and infrastructure capacity to feed high-grade material into the Pilbara Blend
1 Refer to statements supporting Rio Tinto’s production targets on slide 2 of this presentation.

©2016, Rio Tinto, All Rights Reserved
14
Our capital allocation framework
1. Essential
sustaining capex
2. Dividends to
shareholders 3. Iterative cycle of
Compelling
growth
Further cash
returns to
shareholders
Debt
management

©2016, Rio Tinto, All Rights Reserved
15
The Rio Tinto value proposition
World-class portfolio
Sustainable
shareholder
returns Capital
allocation discipline
Balance sheet
strength
Quality growth
Free
cash flow
generation
Operating and
commercial excellence

Appendix
BoAML Global Metals, Mining & Steel Conference 2016 10 May 2016
©2016, Rio Tinto, All Rights Reserved
17
Oyu Tolgoi