choice of seafood: an analysis of the north central …
TRANSCRIPT
ATTACHMENT A
CHOICE OF SEAFOOD: AN ANALYSIS OF THE
NORTH CENTRAL REGION MARKET FOR FARM-
RAISED SEAFOOD PROJECT
DETAILED PROJECT OUTLINE FOR THE AMENDMENT TO THE
PLAN OF WORK FOR GRANT #2016-38500-25753

[A2]
Chairperson: Dr. Simone Valle de Souza
Co-Investigators: Dr. Bill Knudson and Dr. Kwamena Quagrainie
Industry Advisory Council Liaison (s): Dan Vogler and Ernie Birchmeier
Extension Liaison (s): Dr. Ron Kinnunen and Dr. Paul Hitchens
Funding Request: $198,608.00
Duration: July 1st 2019 to June 30th 2021 - 2 years
Objectives:
This research will be designed to obtain information relevant to listed NCRAC research priority topics including:
1. To design survey questions to identify, through seafood marketing channels’ choice:
i. consumer’s preferred species,
ii. consumer’s perception and willingness to pay for alternative forms of seafood: fresh,
refrigerated, frozen, processed (fillet, smoked and canned),
iii. consumer’s quality expectations,
iv. factors influencing consumer purchase of aquaculture products,
v. other possible benefits and attributes NCR aquaculture products can offer to consumers,
and
vi. niche market location and potential for specific/unique aquaculture species.
2. To compare consumer perception and preference for locally originated versus out-of-the-NCR-region
and out-of-country;
3. To identify consumer willingness to pay a premium price for a local/regional brand;
4. To identify preferred forms of seafood: fresh, refrigerated, frozen, processed (fillet, smoked and
canned);
5. To identify consumer quality expectation;
6. To identify factors influencing consumer purchase of farm-raised seafood versus wild catch;
7. To identify other possible benefits and attributes NCR aquaculture products can offer to consumers;
8. To identify niche market location and potential for specific/unique aquaculture species;
9. To disseminate research results in a multi-regional format using tangible technique-centered bulletins
for conversion of farm structure or production methods, if our research identifies production systems,
species or best practice certification labels required by market players.
Deliverables:
1. Reporting of consumers’ preferences identified by statistical analysis of survey data, using restaurants,
retail, processors/packing sheds and wholesalers purchase choices.
CHOICE OF SEAFOOD: AN ANALYSIS OF THE NORTH
CENTRAL REGION MARKET FOR FARM-RAISED SEAFOOD

[A3]
2. Reporting of restaurants, retail, processors/packing sheds and wholesale market preferences and willingness
to pay defined by species and alternative forms of seafood: fresh, refrigerated, frozen, processed (fillet,
smoked and canned).
3. Identification of other factors influencing restaurants, retail, processors/packing sheds and wholesale
market purchase of aquaculture products, which may suggest best marketing strategies and other benefits or
attributes NCR aquaculture products can offer to consumers.
4. Reporting of niche market location and respective demographics, including current players in the supply
chain, for specific aquaculture species, and suggesting marketing strategies and value-adding product
modifications.
5. Results will be disseminated through extension and outreach programs including a range of educational fact
sheets and data bulletins to be published in the NCRAC Fact Sheet Series. Researchers will also be
available for presentations in interested states’ aquaculture associations, and will publish refereed journal
articles.
Proposed Budgets:
Institution Principal Investigators Objective(s) Year 1 Year 2 Total
Michigan State University Dr. Simone Valle de Souza 1 to 9 62,982 62,587 125,569
Purdue University Dr. Kwamena Quagrainie 1 to 9 26,921 27,844 54,765
Southern Illinois University Mr. Paul Hitchens 1 and 9 9,002 9,272 18,274
TOTAL 98,905 99,703 $198,608
Non-funded Collaborators:
Facility Collaborator(s)
Harrietta Hills Trout Farm/President Michigan Aquaculture Association Dan Vogler
Center for Commodity Farm and Industry Relations, Michigan Farm Bureau Ernie Birchmeier

[A4]
Table of Contents
Project Summary ................................................................................................................................................ A5
Justification ......................................................................................................................................................... A5
Related Current and Previous Work ................................................................................................................... A6
Anticipated Benefits ........................................................................................................................................... A8
Objectives ........................................................................................................................................................... A8
Deliverables ........................................................................................................................................................ A8
Procedures .......................................................................................................................................................... A9
Outreach and Evaluation Plan ........................................................................................................................... A11
Logic Model ..................................................................................................................................................... A12
Facilities ........................................................................................................................................................... A13
References ........................................................................................................................................................ A15
Project Leaders ................................................................................................................................................. A16
Budget and Justification ................................................................................................................................... A17
Budget Summary .............................................................................................................................................. A30
Schedule for Completion of Objectives ............................................................................................................ A31
List of Principle Investigators ........................................................................................................................... A31
Curriculum Vitae for Principle Investigators .................................................................................................... A32

[A5]
Project Summary
This project proposes a survey within the North Central Region (NCR) to identify marketing channels’ choices of
seafood according to their constraints and demand perception. Assuming that marketing channels define the pool of
options from which consumers choose seafood species and product form, this survey will be designed to identify
their preferences and willingness to pay for farm-raised seafood, by species, quantity required, quality perception
and preferred form of product. Research results will provide vital information for the NCR aquaculture industry
defining species with high market potential and species-specific niche markets, and identifying new benefits and
attributes sought by these marketing channels and their final consumers, which NCR farms can offer. This research
addresses a significant information gap in the NCR. To our knowledge, the last seafood marketing channel-specific
survey was published in 1999, using data from 1996-1997 (Riepe 1999a; Riepe 1999b). Since then NCR
demographics changed significantly directly affecting current demand for seafood. A comparison between the 2000
and 2010 census datasets (MarketMaker™ 2018) shows acute changes in population cultural background,
significant increase in income and changes in household characteristics, all drivers of consumer choices. Further
information will be drawn from this project pertaining retail market size and distribution.
Justification
The US aquaculture industry, which produced 313,000 metric tons (690 million pounds) with a total value of $724
million in 1992 (CEAH-USDA 1995), produced similar output, approximately 285,000 metric tons (628 million
pounds), in 2013, valued at $1.4 billion (NOAA 2014). Although production value folded in the period, the most
significant increase in production value occurred between 1990 and 2000. Since 2004 US data for aquaculture
production value shows a stagnated scenario varying from $1.3 in 2005 to $1.4 billion dollars in 2013 (Weeks et al.
2014; Love et al. 2017). In 2017, the U.S. imported 2.69 million metric tons of seafood with a value of $21.5 billion
(NOAA 2017). An expanded domestic aquaculture sector could reduce the reliance on imported seafood and has the
potential to reduce price volatility (Asche et al. 2015). Due to constraints on wild caught production, aquaculture
will be the primary source of increased supply of the global seafood market (Natale et al. 2015; Engle et al. 2017).
One possible reason for the industry stagnation in the U.S. could be the difficulty in defining consumer preferences
given recent changes in the region’s population characteristics. This is unfortunate given that aquaculture production
has the potential to develop products that appeal to different consumer segments due to the controlled environment
in which the species is raised (Engle et al.2017). The project we propose here will identify whether production
management and seafood sales can be improved leading to industry growth by considering consumers’ revealed
preferences through their actual purchases. Based on the initial assumption that restaurants, retailers,
processors/packing sheds and wholesalers define the pool of options from which consumers choose seafood species
and product form, this research will identify seafood retail preferences and constraints, as well as their
understanding of their consumers’ preferences and willingness to pay for farm-raised seafood.
The last survey of seafood marketing channels in the NCR dates from 1996-97, published in 1999 by J. Rosscup
Riepe. Riepe’s research reported the best-selling seafood species to be shrimp, cod and salmon, with different results
per state, and the preferred form of seafood amongst restaurants to be frozen. However, that information, specific for
the NCR, is, to our understanding, no longer representative of current market conditions. By then, supermarkets
accounted for one third of consumer seafood sales while about two thirds of consumers’ seafood dollars was spent in
foodservice outlets, primarily restaurants (Riepe et al. 1993; Riepe 1998a; Riepe 1998b; Riepe 1999a; 1999b). This
project aims to identify whether supermarkets’ and restaurants’ choice of purchase remains an important
representation of the end consumer demand for seafood.
It is expected that consumer preferences would have changed with the significant change observed in the North
Central Region demographics from 2000 to 2010. For example, Mintel (2017) reports that millennials value
sustainable fishing practices and indicated to have interest in snacking on fish products, highlighting the shortage in
the market to meet their lifestyle requirements. Furthermore, the 2010 Census shows a 50% reduction, since the
2000 census report, in total number of households, including one-person household, married couple or family
household. In this group, the amount of family households, which alone represents 79% of the total number of
households, shows a 4% increase. Another interesting change observed in these 10 years has been the 82% decrease
in the number of foreign born population in the North Central Region (NCR) States, against a 5% increase in total

[A6]
population. The current population also shows an increase by 13% and 19% in the number of individuals with a
bachelor or higher degree, respectively, and a reduction by 24% in the number of individuals with less than high
school education. Total income also changed significantly with a 17% reduction in the number of individuals
earning less than $50,000, against a 38% increase in the number of individuals earning $50,000 or more. Most of the
latter applies to the number of individuals earning $100,000 or more, which shows an increase of 64% between 2000
and 2010. Therefore, we observe now a population with higher economic power and significantly different culture
background and family composition, all drivers of consumer preferences. Another ensuing benefit of this survey will
be to identify and define seafood point of sales in the North Central Region, with estimates of retail market size and
distribution.
Specifically, this project addresses two of the enlisted Targeted Research, Industry Development and Extension
Areas for Full Proposals to NCRAC for FY2019:
- Theme B: Industry Development: Targeted Industry Development Area (TIDA) B-1: Marketing /
Promotion / Merchandizing, addressing issues such as branding suggestions, value-added products and
market identification including local foods.
- Theme C: Extension / Education, including workshops and conferences presentations, and the
production of electronic education fact sheets and bulletins of research results and logical inferences.
This group also expects to identify emerging opportunities in the aquaculture market, which addresses Theme D.
Related Current and Previous Work
Previous research identified in the development of this proposal include a survey reporting on the supermarket
segment of the NCR seafood market (Riepe 1999a; Riepe 1999b), using data from 1996-1997 and other similar
reports (Chopak 1992; Hushak et al. 1993; Kinnunen 2000; Quagrainie et al. 2011). These will serve as basis for
comparison of our results.
A more recent paper, by Quagrainie et al. (2011), presents a modelling of consumer preferences, specific for live
seafood, in the NCR. Their results will serve as an interesting comparison since their data is from 2008. They also
collected data directly from shoppers at Asian food stores in selected cities in the North Central Region. Interesting
remarks from Quagrainie et al. (2011) are that firstly, high income is a factor that would increase the probability of
higher expenditures on live fish/shellfish and also that food preferences are associated with individuals’ ethnic
cultural heritage and traditions (Quagrainie et al. 2011).
There has been a fair amount of research carried out on consumer preferences for seafood outside the NCR. The fact
that seafood encompasses a wide range of species each representing a unique market complicates the analysis.
Myers et al analyzed consumer attitudes for ethnic live seafood products in the Northeast and determined that
consumers put a higher value on physical appearance and price, and had no preference between imported and
domestically produced fish and between farm raised and wild caught fish (Myers et al. 2010).
Murray Wolff and Patterson conducted a study of consumer preferences in British Columbia. They determined that
taste and health benefits were the most important attributes and also found that while there was no consensus about
farmed seafood, those that prefer not to consume it feel strongly about it (Murray et al. 2017).
Fonner and Sylvia (2014) conducted a willingness to pay study on different product characteristics for niche markets
in Portland Oregon. Labels promoting safety, quality, local and sustainable attributes all had an impact on
willingness to pay. Local labels and ecolabels had the greatest impact although ecolabels had the highest variance.
The species with usable results were salmon and Dungeness crab (Fonner and Sylvia 2014).
Davidson et al analyzed Hawaiian consumers’ willingness to pay for wild caught versus farm raised and fresh versus
previously frozen fish. The species studied were tuna, salmon, tilapia, and moi pacific threadfin. Results showed that
consumers were willing to pay more for wild caught and fresh seafood (Davidson et al. 2012).
Bronnmann and Asche assessed the value of market attributes of frozen seafood in Germany. Their results indicated
that private label brands are discounted by approximately 20 %, while some brands sell at a premium. Breaded

[A7]
products also are discounted. Unlike most other studies the authors found that aquaculture products sold at premium
compared to wild caught products. This study also included a wide variety of species although frozen was the only
form considered (Bronnmann and Asche 2016).
Roheim, Sudhakaran and Durham studied consumer preferences for salmon and shrimp in Rhode Island. They found
that consumers preferred wild caught even when the farm raised products were certified as being produced using
sustainable practices (Roheim et al. 2012).
These studies address two issues that this project attempts to address. The first is that these studies tend to focus on
regions near oceans; these consumers may have access to fresh seafood that residents of the NCR do not have. The
tastes and preferences of these consumers may be different that those of the NCR, especially since access to fresh
seafood may be limited in some parts of the NCR. The second is that the species generally analyzed may or may not
be well suited to aquaculture production in the NCR. There is a need to past work in the NCR and make it applicable
to supply chain participants in this part of the country.
Riepe (1999a; Riepe 1999b) are the latest detailed reporting on NCR seafood marketing channels’ preferences
encountered at this stage. Information was provided on particulars of the supermarket sector and types of services
provided in the NCR as well as on consumer seafood purchases identified by supermarkets’ sales managers and their
preferences at a time when NCR aquaculture was a new developing industry (Riepe 1999a). Results included, for
example, evidence that 45% of supermarket managers listed salmon as one of their best-selling species (Riepe
1999a) while 14% of supermarket managers listed trout as one of their best-selling species (Riepe 1999a). Also,
15% of those not selling cultured salmon indicated that they would like to sell the product; 45% of supermarket
managers, responding to a NCR seafood marketing survey, listed salmon as one of their best-selling species (Riepe
1999a) while 14% of supermarket managers listed trout as one of their best-selling species (Riepe 1999a). Catfish
and shrimp shared the first place in the supermarkets’ best-selling list, each named by 55% of supermarkets in the
NCR, followed by orange roughy with 48% of the respondents’ preference (Riepe 1999a). Between restaurants, on
the other hand, shrimp, cod and salmon were the most popular species while catfish and pollock were popular in
more rural areas and more casual restaurants (Riepe 1999b). However, these preferences have already changed with
the introduction of other species in the US seafood market since 1990s. Dey et al. (2014) published a supermarket
trend analysis indicating 50% decrease in orange roughy sales and a decrease by 27% in pollock sales between 2005
and 2010. That study also indicated a growth by 201% in tilapia sales and also a further increase in total catfish sales
by 178% (Dey et al. 2014).
Riepe’s reports came to expand and complemented the work by Chopak (1992), which presented an overview of the
brokers’, wholesalers’, processors/packing sheds’, retailers’ and restaurants’ preferences on seafood in strategically
positioned sites of Michigan. Preferences of each stage of the state supply chain were identified. According to
Chopak the most important attributes perceived by these parts were product consistency, pricing, delivery
consistency, variety of fish products, and excellent communication with marketing businesses (Chopak 1992).
Also preceding Riepe (1999a; Riepe 1999b), Hushak et al. (1993) reveals details about the supply chain such as
Chopak (1992) but with emphasis on the ‘multiple function/outlet nature’ of aquaculture industry at that time and
the difficulty in mapping such seafood movement through distribution channels (Hushak et al. 1993). They found
that trout was one of the four freshwater species that were most frequently sold in the NCR as trout was handled by
67% of wholesalers, specialty retailers, and grocery retailers in the region. Product forms sold include fresh, frozen,
and live. All grocery retailers, along with most of the other respondents, mainly sold fresh fish, with respondents
showing clear preference for farm-raised fish as compared to wild-caught, by specific attributes. In the overall
ranking 72% of respondents considered farm-raised somewhat better or superior than wild-caught fish.
Kinnunen (2000) provides a through overview of salmonids’ production and sales from 1990-2000. That report
focused on salmonids supported by North Central Regional Aquaculture Center (NCRAC) Industry Advisory
Council (IAC) designation of salmonids as high priority culture potential (Garling 1992; Kinnunen 2000). By 1990
salmonids accounted for 44% of gross sales by species in the NCR at $6.2 million (Hushak 1993 in Kinnunen 2000).
From another perspective, Riepe (1999b) also qualified restaurants by levels of formality and concluded that 82% of
restaurants serving fish were mid-scale and casual restaurants. These restaurants were sourcing from fish products
from food services distributors in rural areas (72% of these restaurants) and from seafood wholesalers in urban areas

[A8]
(51%). In that period most fresh fish was sourced from commercial fishermen while frozen fish was sourced from
food service distributors and grocery wholesalers (Riepe 1999b).
Anticipated Benefits
Survey questions will be designed to identify factors influencing marketing channels’ choice of purchase of
aquaculture products and other possible benefits and attributes NCR aquaculture products can offer. This survey will
also identify, through seafood marketing channels’ choice, their consumers’ revealed preferences for species and
their perception and willingness to pay for alternative forms of seafood, such as fresh, refrigerated, frozen, processed
(fillet, smoked and canned), as well as their consumers quality expectations. Results will also indicate niche markets
and market potential and ethnic preferences for specific/unique aquaculture species.
Survey question will identify also reasons for elected preferences. For example, low sales of trout at supermarkets
could be related to inferior product quality (Kinnunen 2000). The extended benefit from the results of this survey
will be to (i) provide advice on best marketing strategies, such as educating sales managers on the qualities of
purchasing locally farmed seafood, (ii) to identify preferences for value added products such as smoked seafood,
(iii) compare and contrast the needs of customers for fresh and processed seafood, (iv) identify current players in the
supply chain, their location and size, and by that, identify niche market location and potential for specific/unique
aquaculture species, (v) Comparative analysis of consumer perception and preference for locally originated versus
out of-the-NCR-region and out-of-country. The latter will indicate consumer perception and willingness to pay a
premium price for a local/regional brand.
The information provided will serve to direct industry priorities and decision making towards production of more
marketable species, possibly refocusing and redirecting marketing and value-adding efforts.
These results will be disseminated through outreach programs such as educational fact sheets and data bulletins,
presented in workshops, and published in refereed journals. Papers will also be produced for the NCRAC Fact Sheet
Series.
Objectives
This research will be designed to obtain information relevant to listed NCRAC research priority topics including:
1. To design and validate survey questions to identify, through seafood marketing channels’ choice:
i. consumer’s preferred species,
ii. consumer’s perception and willingness to pay for alternative forms of seafood: fresh, refrigerated,
frozen, processed (fillet, smoked and canned),
iii. consumer’s quality expectations,
iv. factors influencing consumer purchase of aquaculture products,
v. other possible benefits and attributes NCR aquaculture products can offer to consumers and
vi. niche market location and potential for specific/unique aquaculture species.
2. To compare consumer perception and preference for locally originated versus out-of-the-NCR-region and
out-of-country;
3. To identify consumer willingness to pay a premium price for a local/regional brand;
4. To identify preferred forms of product: fresh, refrigerated, frozen, processed (fillet, smoked and canned);
5. To identify consumer quality expectation;
6. To identify factors influencing consumer purchase of farm-raised seafood versus wild catch;
7. To identify other possible benefits and attributes NCR aquaculture products can offer to consumers;
[A9]
8. To identify niche market location and potential for specific/unique aquaculture species;
9. To disseminate research results in a multi-regional format using tangible technique-centered bulletins for
conversion of farm structure or production methods, if our research identifies production systems, species
or best practice certification labels required by market players.
Deliverables
1. Reporting of consumers’ preferences identified by statistical analysis of survey data, using restaurants,
retail, processors/packing sheds and wholesalers purchase choices.
2. Reporting of restaurants and retail and wholesale market preferences and willingness to pay defined by
species and alternative forms of seafood: fresh, refrigerated, frozen, processed (fillet, smoked and canned).
3. Identification of other factors influencing restaurants and retail and wholesale market purchase of
aquaculture products, which may suggest best marketing strategies and other benefits or attributes NCR
aquaculture products can offer to consumers.
4. Reporting of niche market location and respective demographics, including current players in the supply
chain, for specific aquaculture species, and suggesting marketing strategies and value-adding product
modifications.
5. Results will be disseminated through extension and outreach programs including a range of educational fact
sheets and data bulletins to be published in the NCRAC Fact Sheet Series. Researchers will also be
available for presentations in interested states’ aquaculture associations, and will publish refereed journal
articles.
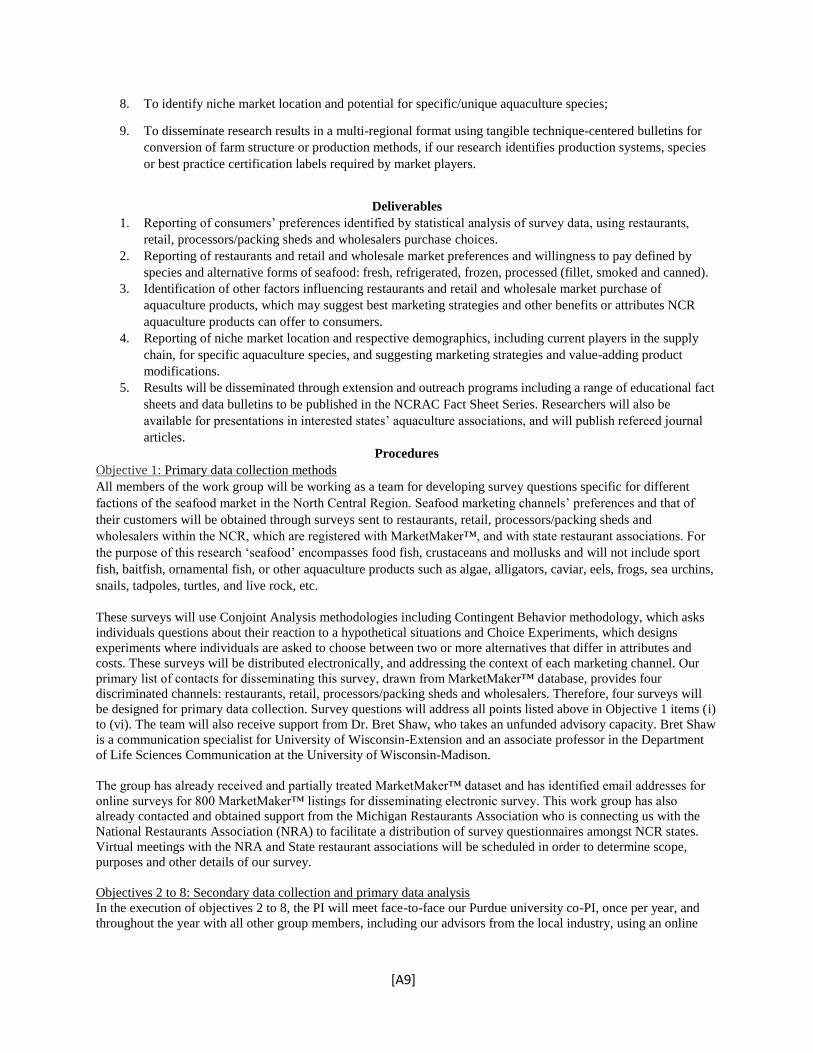
Procedures
Objective 1: Primary data collection methods
All members of the work group will be working as a team for developing survey questions specific for different
factions of the seafood market in the North Central Region. Seafood marketing channels’ preferences and that of
their customers will be obtained through surveys sent to restaurants, retail, processors/packing sheds and
wholesalers within the NCR, which are registered with MarketMaker™, and with state restaurant associations. For
the purpose of this research ‘seafood’ encompasses food fish, crustaceans and mollusks and will not include sport
fish, baitfish, ornamental fish, or other aquaculture products such as algae, alligators, caviar, eels, frogs, sea urchins,
snails, tadpoles, turtles, and live rock, etc.
These surveys will use Conjoint Analysis methodologies including Contingent Behavior methodology, which asks
individuals questions about their reaction to a hypothetical situations and Choice Experiments, which designs
experiments where individuals are asked to choose between two or more alternatives that differ in attributes and
costs. These surveys will be distributed electronically, and addressing the context of each marketing channel. Our
primary list of contacts for disseminating this survey, drawn from MarketMaker™ database, provides four
discriminated channels: restaurants, retail, processors/packing sheds and wholesalers. Therefore, four surveys will
be designed for primary data collection. Survey questions will address all points listed above in Objective 1 items (i)
to (vi). The team will also receive support from Dr. Bret Shaw, who takes an unfunded advisory capacity. Bret Shaw
is a communication specialist for University of Wisconsin-Extension and an associate professor in the Department
of Life Sciences Communication at the University of Wisconsin-Madison.
The group has already received and partially treated MarketMaker™ dataset and has identified email addresses for
online surveys for 800 MarketMaker™ listings for disseminating electronic survey. This work group has also
already contacted and obtained support from the Michigan Restaurants Association who is connecting us with the
National Restaurants Association (NRA) to facilitate a distribution of survey questionnaires amongst NCR states.
Virtual meetings with the NRA and State restaurant associations will be scheduled in order to determine scope,
purposes and other details of our survey.
Objectives 2 to 8: Secondary data collection and primary data analysis
In the execution of objectives 2 to 8, the PI will meet face-to-face our Purdue university co-PI, once per year, and
throughout the year with all other group members, including our advisors from the local industry, using an online

[A10]
meeting environment, to discuss survey results, statistically significant indicators of seafood marketing channels’
preferences and their perception of demand preferences for farm-raised seafood.
Further research collecting secondary data from market researcher firms, such as Mintel, as well as Market Maker,
Census and USDA National Agriculture Statistic Services and other relevant literature will be developed by the PI
and co-PIs. Market research firms provide reports to identify seafood
market trends and consumers’ preference for attributes and other
possible benefits that can constitute an opportunity for NCR
aquaculture industry. Location of specific niche markets and the
current size of specific markets will be drawn from MarketMaker™,
which consists of more than 200,000 establishments of relevance for
this research distributed through all NCR states (Figure 1). Results
from primary data collection requires weighting the data to known
national statistics, to correct for under- and overrepresentation among
different demographic groups in our sample. To that end, we will use
Census data. It is expected that the full dataset, combined with
demographic statistics, will allow for defining choice between ethnic
groups as well. USDA National Agriculture Statistic Services’ 2018
Census of Aquaculture provides estimates of market size, per state, in
number of farms, water coverage and dollar value of seafood sales.
Figure 1. MarketMaker™ dataset distribution.
Objective 9:
Both extension liaisons will develop outreach programs in collaboration with two advisors from the local industry,
drawing from their extensive experience with the region’s aquaculture industry. Outreach programs will include a
range of educational fact sheets and data bulletins describing survey results and logical inferences from research
evidence defining market place criteria in the choice of seafood, by region. These fact sheets will be widely
distributed via MSU extension website, and NCRAC website. Research findings will also be disseminated in the
format of journal articles and reports to Fish Producers Associations and the NCRAC website.
Outreach and Evaluation Plan
Outreach programs will be developed in collaboration with extension liaisons Dr. Kinnunen from Michigan State
University, and Mr. Hitchens from Southern Illinois University, and with industry advisors. These outreach
programs will include a range of educational fact sheets and data bulletins describing survey results and logical
inferences from research evidence defining market place criteria in the choice of seafood to offer their customers, by
region. It is also expected that the full dataset will allow for defining choice between ethnic groups as well. These
fact sheets will be widely distributed via MSU extension website, and NCRAC website.
The extensive experience of the two extension liaisons in our team will contribute in disseminating research results
in a multi-regional format using tangible technique-centered bulletins for conversion of farm structure or production
methods if our research identifies production systems, species or best practice certification labels required by market
players.
Our evaluation plan consists in running interactive presentations with open discussions at state association meetings
and interviewing aquaculture practitioners. Understanding of research results and their implications to the industry
management and strategic planning will be tested through these open discussions.
NCRAC website and other social media will allows for timely publication of fact sheets and technical bulletins,
which will be produced at as early as possible stages of the project ensuring the earliest possible accruing of
benefits.
Statement of Search and Review of Previously Funded Research to Avoid Duplicative Work
The USDA Current Research Information System (CRIS or REEport) was accessed to review any related or relevant
research and this work group can certify the proposed work is original research and does not duplicate, but rather
compliment, previously funded projects in CRIS. This work group conducted a throughout search for current

[A11]
ongoing projects being developed on this topic in all recommended funding agencies. Several projects current in
development address technological improvements in aquaculture, and only a few focus on identifying market current
trends however not specifically on seafood marketing channels preferences. For example, current work listed at
CRIS.NIFA shows some similar projects but focused in one species and not necessarily focused on the North
Central Region states, such as, for example, “Economics, marketing, and policy impacts on catfish production”, by
Bosworth, Collart, Petrola and Tucker at the Mississippi State University. Semmens, Jaczynski, West, Davalos,
Viadero, and Turton, from the West Virginia University, are working on a project for “Aquaculture product and
market development” but searching for production improvement using treated mine water.
One project which could be somewhat related to our proposed research, analyzing new marketing themes, market
niches, and alternative seafood products is being developed in a consortium between researchers from Louisiana,
Oregon, Guam, Mississippi, Connecticut and Florida. However, their main focus is to develop seafood markets
through an increase in the organizational and institutional efficiency of the aquaculture and fishery sectors in their
region.
Projects on NCR states include an outreach program in Illinois and Indiana, comparing hydroponics and aquaponics
costs, and a program for technological changes to improve yellow perch production, both with the National Sea
Grant Office. Similarly, no other projects matching our objectives were found with the Sea Grant Program or NOAA
Office of Aquaculture Funding Opportunities pages.
This project is complementing work previously funded by NCRAC, conducted by Purdue University. Between 1998
and 1999 Rosscup Riepe published survey results, reporting on the supermarket and restaurant segments of the NCR
seafood market. The actual data was from 1997. To date, this work group has not identified any reports on seafood
market channels in the NCR since then.
One particularly interesting project has been recently funded by NCRAC and Sea Grant, through Purdue University,
working with NCR aquaculture in identifying consumer preferences and providing tools for developing demand
further, supported by extension mechanisms. We foresee a great opportunity for synergy between our work research
groups. While our project identifies marketing channels’ preferences and constraints, and those of their consumers,
through interviews with seafood retail, processors and restaurants, that project will be conducting a rapid needs
assessment of the aquaculture in the region and providing outreach mechanisms to inform consumers. In this case,
our project is asking marketing channels what species, and product form they prefer to buy, while Dr. Hook’s
project works in augmenting end consumer demand. Our project also aims to research on market trends and
opportunities, so it is our understanding that both results, from our project and from the above mentioned funded
project, will provide complementing results to the industry.
[A12]
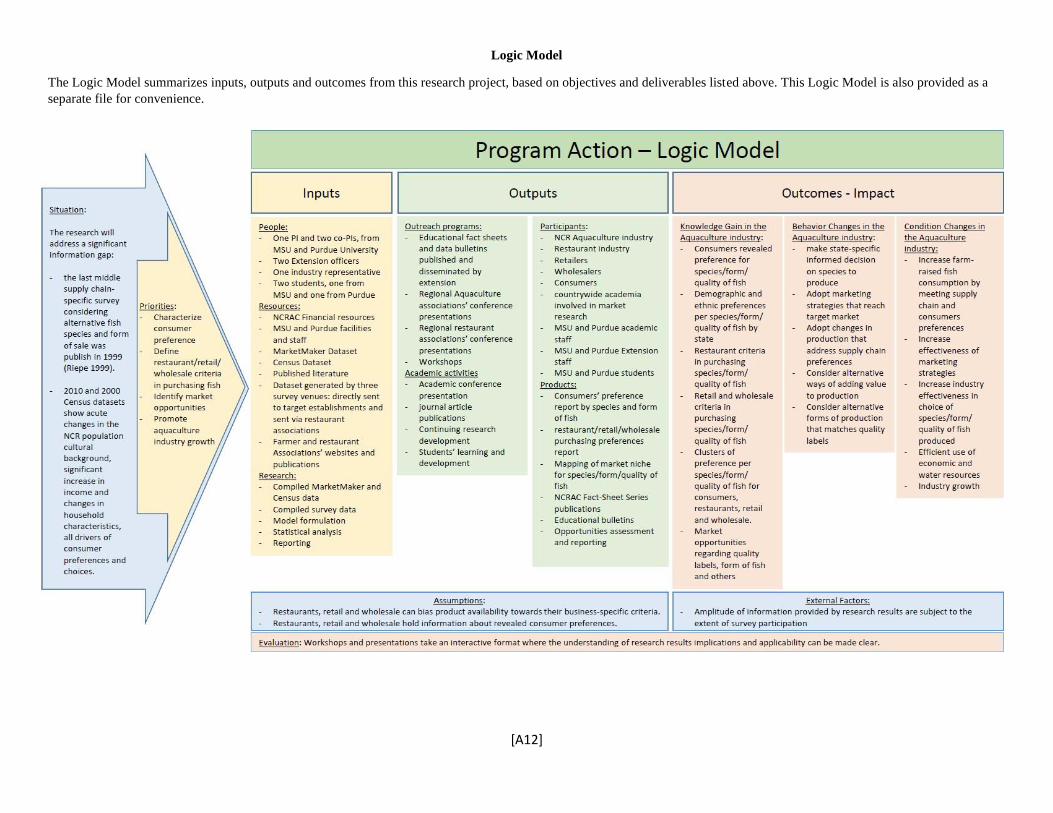
Logic Model
The Logic Model summarizes inputs, outputs and outcomes from this research project, based on objectives and deliverables listed above. This Logic Model is also provided as a
separate file for convenience.
[A13]
Facilities and Other Resources
A group of researchers from Michigan State University, Purdue University, University of Wisconsin-Madison and
Southern Illinois University will work collaboratively combining expertise in extension work, regional aquaculture
industry infrastructure, fisheries economics, market development and social marketing. These researchers have
previously and are currently involved in other projects surveying aquaculture producers and the end-consumer,
which will augment the pool of knowledge in interpreting results. The work group research development and results
will be also discussed with industry representatives who kindly accept to be industry liaisons to this project.
Michigan State University
The three participants from MSU, the PI, one co-PI and one extension liaison will be developing the work at the
Michigan State University (MSU) facilities in East Lansing and in Marquette. The MSU provides high quality
research environment including access to technology, a track-record of excellence in research and access to all
relevant journals required for this research. MSU also maintains a reputable relationship with the industry. MSU Sea
Grant office located in Marquette, Michigan is equipped with computers and needed software, phone/fax, and
secretarial support to help with this project.
Dr. Simone Valle de Souza has a Ph.D. in fisheries economics. She is an economist working with the Product Center
for Agriculture and Natural Resources at Michigan State University and also the Deputy Director of the UNE Center
for Local Government. She specializes in resource and fisheries management and economics, developing economic
modeling, statistical analysis and parameter optimization, and has 5 years’ experience in managing research projects.
While working in Australia, she developed a bioeconomic model for optimization of profits, to be used as a
management tool for the prawn fishery industry with the use of genetic algorithms (designed to interpolate data in
model parameterization), and economic and statistical analysis. She is currently developing a profit optimization
model for agri-food businesses, a salmon valuation project with Michigan DNR and an international program for
developing the tilapia aquaculture industry in Tanzania.
Dr. Bill Knudson is the product marketing economist with the Product Center for Agriculture and Natural Resources
at Michigan State University, and has been at the Product Center since 2003. Conducting marketing research on
topics that affect Michigan’s agri food and natural resource industries, Professor Knudson has extensive experience
in agri-food marketing at all stages in the supply chain, with a particular emphasis on traditional agricultural
commodities and livestock. Author of a book chapter on the changing nature of the seafood market and a co-author
of Michigan Aquaculture's strategic plan in 2014, Professor Knudson also analyzes market trends and the impact of
macroeconomic forces on the agri food system and produces economic impact studies and feasibility assessments.
He is also the director of the Michigan Cooperative Development Center. Prior to his position at MSU, Bill was the
agriculture, higher education and appropriations policy advisor for the Michigan Senate Majority Policy Office. He
has a Ph.D. in Agricultural Economics from Michigan State University, and has a BA in Economics from Fresno
State.
Dr. Ron Kinnunen is a Fisheries Biologist and Pathologist and worked for the U.S. Fish and Wildlife Service and
Rangen Research Laboratory, and has a Ph.D. from Michigan Technological University and M.S. and B.S. from
Michigan State University. Dr. Kinnunen is currently a Michigan Sea Grant Extension Agent, holding this position
since 1982. Dr. Kinnunen has also the experience of having developed research work with Dr. J. Rosscup Riepe in
the 1990s. He was specifically involved in the research which motivated this project.
Purdue University
Dr. Kwamena K. Quagrainie is a Professor in the Department of Agricultural Economics at Purdue, which is his
primary department. This allows him access to a wide array of applied economics expertise in applied economic
analysis, agribusiness, production, farm management, consumption, international development, trade,
macroeconomics policy implications, as well as environmental and resource issues. He is also affiliated with Purdue
Cooperative Extension Service and Illinois-Indiana Sea Grant program as an Aquaculture Specialist. He has a
personal office space and computers with access to relevant economic analysis software as well as internet access.

[A14]
His research has been closely related to NCR aquaculture research and also involves mentorship and support of
graduate students at both the MS and PhD levels. Graduate students have unrestricted access to multiple computers
and laser printers in the Department; and all machines are connected to local departmental, college-wide as well as
campus-wide IT networks with full internet service.
Dr. Quagrainie leads the aquaculture economics program at Purdue University, which entails quality research,
teaching and committed outreach activities. Purdue University has a dedicated Aquaculture team with nationally and
internationally recognized faculty and extension professionals in the College of Agriculture.
Southern Illinois University
Southern Illinois University is equipped with all required computer and software and provides support for extension
activities throughout the state. Mr. Paul Hitchens who will be one of the extension officers in this project, has
Bachelor of Science-Environmental Biology, from Eastern Illinois University, and is currently employed as
Aquaculture Specialist/Researcher II, Illinois Aquaculture Techsters; Center for Fisheries, Aquaculture, and Aquatic
Sciences-Southern Illinois University; Carbondale, IL. Hitchens is known for assisting aquaculture producers with
everything from start-up to final sales. He currently works with about 300 people statewide, providing them with an
information packet and species and marketing recommendations based on their location.
Industry Liaisons
Mr. Dan Vogler is the owner of Harrietta Hills Trout Farm, a family business which started in the 1950s specialized
in the production of Rainbow Trout, with Brook Trout and Brown Trout. He is also the President of the Michigan
Aquaculture Association.
Mr. Ernie Birchmeier, is the manager of Michigan Farm Bureau’s Center for Commodity, Farm and Industry
Relations. His responsibilities include working to protect the rights of Farm Bureau members and their families
involved in the animal industry, enhance Michigan’s agricultural economy and advocate for the agriculture industry.
He began his career with Michigan Farm Bureau in 1989 following graduation from Michigan State University. He
managed leadership development efforts for the Young Farmer Department for over eight years. Ernie has been in
his current role since 1999.

[A15]
References
Asche, F, R.E. Dahl, and M. Steen. 2015. Price volatility in seafood markets: Farmed vs. wild fish. Aquaculture
Economics &Management 19(3):316-335.
Bronnmann, J., and F. Asche. 2016. The value of product attributes, brands and private labels: An analysis of frozen
seafood in Germany. Journal of Agricultural Economics 67(1):231-244.
Centers for Epidemiology & Animal Health USDA (CEAH-USDA). 1995. Overview of aquaculture in the United
States. Available:
https://www.aphis.usda.gov/animal_health/nahms/aquaculture/downloads/AquacultureOverview95.pdf. (July
2018).
Chopak, C.J. 1992. What brokers, wholesalers, retailers and restaurants want: Advice for food fish growers.
Michigan State University Extension Bulletin E-2411, East Lansing.
Davidson, K., M. Pan, W. Hu, and D. Poerwanto. 2012. Consumers’ willingness to pay for aquaculture fish products
vs. wild-caught seafood – a case study in Hawaii. Aquaculture Economics & Management 16:136-154.
Dey, M. M., A. G. Rabbani, K. Singh, and C. R. Engle. 2014. Determinants of retail price and sales volume of
catfish products in the United States: application of retail scanner data. Aquaculture Economics &
Management 18(2):120-148.
Engle, C.R., K.K. Quagrainie, and M.M. Dey. 2017. Seafood and aquaculture marketing handbook, second edition.
Wiley Blackwell Publishing, West Sussex, UK.
Fonner, R., and G. Sylvia. 2014. Willingness to pay for multiple seafood labels in a niche market. Marine Resource
Economics 30(1):51-70.
Garling D.L. 1992. Making plans for commercial aquaculture in the North Central Region. . NCRAC Technical
Bulletin Series #101. NCRAC Publications Office, Iowa State University, Ames.
Hushak, L.J., C. Cole, and D. Gleckler. 1993. Survey of wholesale and retail buyers in the six southern states of the
North Central Region. NCRAC Technical Bulletin Series #104. NCRAC Publications Office, Iowa State
University, Ames.
Kinnunen, R.E. 2000. A white paper on the status and needs of salmonid aquaculture in the North Central Region.
NCRAC Technical Bulletin Series. NCRAC Publications Office, Iowa State University, Ames.
Love, D. C., I. Gorski, and J.P. Fry. 2017. An Analysis of nearly one billion dollars of aquaculture grants made by
the US federal government from 1990 to 2015. Journal of the World Aquaculture Society 48: 689-710.
MarketMaker™ 2018. Census Data, States: States: Illinois, Indiana, Iowa, Kansas, Michigan, Minnesota, Missouri,
Nebraska, North Dakota, Ohio, South Dakota, Wisconsin. Available: https://foodMarketMaker.com/
(May 2018).
Mintel Group Ltd. (Mintel) 2017. Fish and shellfish – US - November 2017. Available:https://store.mintel.com/fish-
and-shellfish-us-november-2017 (July 2018).
Murray, G., K. Wolff, and M. Patterson. 2017. Why eat fish? Factors influencing seafood consumer choices in
British Columbia Canada. Ocean & Coastal Management 144:16-22.
Myers, J.J., R. Govindasamy, J.W. Ewart, B. Liu, Y. You, and Y.S. Puduri. 2010. Consumer analysis in ethnic live
seafood markets in the Northeast Region of the United States. Journal of Food Products and Marketing
16(2):147-165.
Natale, F., A. Borrello, and A. Motova. 2015. Analysis of the determinants of international seafood trade using a
gravity model. Marine Policy 60:98-106.
NOAA. 2014. Fisheries of the United States 2013. National Marine Fisheries Service Office of Science and
Technology, Silver Spring, Maryland, USA.
NOAA. 2018. Imports and Exports of Fishery Products Annual Summary, 2017. Current Fishery Statistics No.
2017-2. National Marine Fisheries Service Office of Science and Technology, Silver Spring, Maryland, USA.
Quagrainie, K. K., A. Xing and K. G. Hughes. 2011. Factors influencing the purchase of live seafood in the North
Central Region of the United States. Marine Resource Economics 26(1):59-74.
Riepe, J. R., M. A. Martin, and L. F. Schrader. 1993. Indiana restaurants as a market for farm-raised fish: results
from a 1991 survey. SB-665, Department of Agricultural Economics, Department of Agricultural Research
Programs, Purdue University, West Lafayette, Indiana.

[A16]
Riepe, J. R. 1998a. Yellow perch markets in the North Central Region: results of a 1996/97 survey. B-756,
Department of Agricultural Economics, Office of Agricultural Research Programs, Purdue University, West
Lafayette, Indiana.
Riepe, J. R. 1998b. Walleye markets in the North Central Region: results of a 1996/97 survey. NCRAC Technical
Bulletin Series #113. NCRAC Publications Office, Iowa State University, Ames.
Riepe, J. R. 1999a. Supermarkets and seafood in the North Central Region. NCRAC Technical Bulletin Series #112.
NCRAC Publications Office, Iowa State University, Ames, IA.
Riepe, J. R. 1999b. Marketing seafood to restaurants in the North Central Region. NCRAC Technical Bulletin Series
#110. NCRAC Publications Office, Iowa State University, Ames, IA.
Rohein, C.A., P.O. Sudhakaran, and C.A. Durham. 2012. Certification of shrimp and salmon for best aquaculture
practices: assessing consumer preferences in Rhode Island. Aquaculture Economics and Management 16:266-
286.
Weeks, C., J. Colyn, G. Boersen, and W. Knudson. 2014. A strategic plan for a thriving & sustainable Michigan
aquaculture. Michigan Sea Grant Integrated Assessment – Project Report. Available:
http://michiganaquaculture.org/wp-content/uploads/2015/01/2014-MAA-Strategic-Plan_Final_141215.pdf
Project Leaders
State Name Institution Area of Specialization
MI Dr. Simone Valle de Souza- PI Michigan State University Fisheries Economics
MI Dr. Bill Knudson – co-PI Michigan State University Product Marketing Economist IN Dr. Kwamena Quagrainie – co-PI Purdue University Aquaculture Marketing Specialist

[A17]
Michigan State University Budget
ORGANIZATION AND ADDRESS
Michigan State University
Address: Justin S. Morril Hall of Agriculture
446 W.Circle Dr
East Lansing, MI, 48824
USDA AWARD NO. Year: 1 Objective:
Duration Proposed
Months: _24_
Funds Requested by Proposer
Duration Proposed Months: _
Funds Approved by CSREES (If different)
Non-Federal Proposed Cost-
Sharing/ Matching Funds
(If required)
Non-federal Cost-Sharing/
Matching Funds Approved by
CSREES (If Different) PROJECT DIRECTOR(S)
Simone Valle de Souza
A. Salaries and Wages 1. No. of Senior Personnel
a. (Co)-PD(s) .Simone V. de Souza. . .. . . .
b. Senior Associates. Bill Knudson . . . . . . . .
CSREES FUNDED WORK MONTHS
17,860
Calendar
Academic
Summer
2
1.1 9,304
2. No. of Other Personnel (Non- Faculty) a. Research Associates-Postdoctorates . . . b. Other Professionals . . . . . . . . . . . . . . . .
c. Paraprofessionals ....................................................................................
d. Graduate Students...................................................................................
e. Prebaccalaureate Students...................................................................... 4,800
f. Secretarial-Clerical ...................................................................................
g. Technical, Shop and Other ...................................................................... 14,192
Total Salaries and Wages........................................................................ 45,156
B. Fringe Benefits (If charged as Direct Costs) 10,125
C. Total Salaries, Wages, and Fringe Benefits (A plus B) .................................. 56,281
D. Nonexpendable Equipment (Attach supporting data. List items and dollar amounts for each item.)
E. Materials and Supplies
F. Travel 6,701
G. Publication Costs/Page Charges
H. Computer (ADPE) Costs
I. Student Assistance/Support (Scholarships/fellowships, stipends/tuition, cost of education, etc. Attach list of items and dollar amounts for each item.)
J. All Other Direct Costs (In budget narrative, list items and dollar amounts and provide supporting data for each item.)
K. Total Direct Costs (C through I) ...................................................................... 62,982
L. F&A/Indirect Costs. (If applicable, specify rate(s) and base(s) for on/off campus activity. Where both are involved, identify itemized costs in on/off campus bases.)
M. Total Direct and F&A/Indirect Costs (J plus K) ...............................................
N. Other ................................................................................................................
O. Total Amount of This Request ........................................................................ 62,982
P. Carryover -- (If Applicable) . . . . . . . . . . . Federal Funds: $ Non-Federal funds: $ Total $
Q. Cost Sharing/Matching (Breakdown of total amounts shown in line O)
Cash (both Applicant and Third Party) ................................................................................................................
Non-Cash Contributions (both Applicant and Third Party) ...................................................................................
Leave Blank
NAME AND TITLE (Type or print) SIGNATURE (required for revised budget only) DATE
Project Director
Authorized Organizational Representative

[A18]
Michigan State University Budget
ORGANIZATION AND ADDRESS
Michigan State University
Address: Justin S. Morril Hall of Agriculture
446 W.Circle Dr
East Lansing, MI, 48824
USDA AWARD NO. Year: 2 Objective:
Duration Proposed
Months: _24_
Funds Requested by Proposer
Duration Proposed Months: _
Funds Approved by CSREES (If different)
Non-Federal Proposed Cost-
Sharing/ Matching Funds
(If required)
Non-federal Cost-Sharing/
Matching Funds Approved by
CSREES (If Different) PROJECT DIRECTOR(S)
Simone Valle de Souza
A. Salaries and Wages 1. No. of Senior Personnel
a. (Co)-PD(s) .Simone V. de Souza. . .. . . .
b. Senior Associates. Bill Knudson . . . . . . . .
CSREES FUNDED WORK MONTHS
18,396
Calendar
Academic
Summer
2
1.1 9,583
2. . No. of Other Personnel (Non- Faculty) a. Research Associates-Postdoctorates . . . b. Other Professionals . . . . . . . . . . . . . . . .
c. Paraprofessionals ....................................................................................
d. Graduate Students...................................................................................
e. Prebaccalaureate Students......................................................................
f. Secretarial-Clerical ...................................................................................
g. Technical, Shop and Other ...................................................................... 14,648
Total Salaries and Wages........................................................................ 42,627
B. Fringe Benefits (If charged as Direct Costs) 10,140
C. Total Salaries, Wages, and Fringe Benefits (A plus B) .................................. 52,767
D. Nonexpendable Equipment (Attach supporting data. List items and dollar amounts for each item.)
E. Materials and Supplies
F. Travel 9,820
G. Publication Costs/Page Charges
H. Computer (ADPE) Costs
I. Student Assistance/Support (Scholarships/fellowships, stipends/tuition, cost of education, etc. Attach list of items and dollar amounts for each item.)
J. All Other Direct Costs (In budget narrative, list items and dollar amounts and provide supporting data for each item.)
K. Total Direct Costs (C through I) ...................................................................... 62,587
L. F&A/Indirect Costs. (If applicable, specify rate(s) and base(s) for on/off campus activity. Where both are involved, identify itemized costs in on/off campus bases.)
M. Total Direct and F&A/Indirect Costs (J plus K) ...............................................
N. Other ................................................................................................................
O. Total Amount of This Request ........................................................................ 62,587
P. Carryover -- (If Applicable) . . . . . . . . . . . Federal Funds: $ Non-Federal funds: $ Total $
Q. Cost Sharing/Matching (Breakdown of total amounts shown in line O)
Cash (both Applicant and Third Party) ................................................................................................................
Non-Cash Contributions (both Applicant and Third Party) ...................................................................................
Leave Blank
NAME AND TITLE (Type or print) SIGNATURE (required for revised budget only) DATE
Project Director
Authorized Organizational Representative

[A19]
Budget Explanation for Michigan State Univ.
(de Souza, Knudson and Kinnunen)
Objectives: 1 to 9
MSU maintains documentation to support time expended on sponsored projects based on percentages of effort
worked. This documentation is maintained in accordance with OMB 2 CFR Part 200 - Uniform Administrative
Requirements, Cost Principles, and Audit Requirements for Federal Awards. Over time, the budget provides for 3%
annual salary increments.
Year 1:
C. Salary, Wages, and Fringe Benefits: MSU personnel will develop collaborative work in each stage of the
research work along with other work group members from the two partner institutions, each focusing in their area of
expertise. For example, Dr. de Souza, with an expertise in fisheries economics and quantitative analysis, will lead
discussions in developing questions and analyzing survey results, while following the work group members’
knowledgeable advice and vast experience in working within the industry in the North Central Region. She will
work closely with the entire team throughout the project, with emphasis on objectives 1 to 6, along with Dr.
Quagrainie. Two summer salaries have been included in the budget accounting for release time from her current
responsibilities.
Dr. Bill Knudson brings to this group more than 15 years of experience and expertise in market analysis and policy
development, having also worked closely with the aquaculture industry. During the first year he will work closely
with all team members advising and contributing with survey development and analysis of results.
The work group estimated percentages of MSU personnel time expended in the project per year, equivalent fringe
benefits and total salaries planned are as follows:
Personnel time spent Salary Savings Fringe Benefits Total
PI Dr. Valle de Souza 20% $17,860 $6,458 $24,318
Co-PI Dr. Knudson 10% $9,304 $3,300 $12,604
Other Personnel: MarketMaker™ dataset requires further cleaning and assembling. The project also requires
further datamining and survey results require digitalization. To that end we included 400 hours ($12/hr) of an
undergrad student’s assistance. Salary is estimated at $4,800 and fringe benefits at $367, totaling: $5,167
Dr. Ron Kinnunen has a 36 years’ experience and expertise in extension programs and industry practices and
policies. During the first year Dr. Kinnunen will participate, along with Mr. Hitchens, in the development of survey
questions, addressing objective 1, contributing with his vast experience in the aquaculture market and the experience
in developing similar research with the author that motivated this research project. Dr. Kinnunen participation takes
the role of a consultant given his retirement from MSU: $14,192
F. Travel: We have scheduled 4 to 5 trips on the first year, of 2 days each, for each extension liaisons, to interview
seafood marketing channel representatives in order to validate our survey, pertaining objective 1. Both extension
officers, Dr. Kinunnen from MSU and Mr. Hitchens from SIU, will be involved in these trips but funds will be
coordinated by PI at MSU. Trip costs were estimated including $100 per diem, $130 per night in accommodation
and $150 per trip in transportation, amounting to: $6,080
Another trip is scheduled for the PI to meet with Dr. Quagrainie, co-PI from Purdue University, during the starting
of the project, to discuss trajectories and initiate discussions. It is estimated a per diem of $54, $103/night
accommodation and $75 for transportation, for a 3-days visit: $621
J. Other Direct Costs, Material and facilities: There are no other direct costs. Materials and facilities will be
provided by MSU and will not incur a cost to this project.
Total in Year 1: $62,982

[A20]
Year 2:
C. Salary, Wages, and Fringe Benefits: MSU personnel will continue working collaboratively during the second
year of the project, each focusing in their area of expertise. In year 2, Dr. Simone Valle de Souza will continue
analyzing survey results now in conjunction with market analysis results, as well as writing reports, while following
the work group members’ advice with their vast experience in working with the industry. She will work closely with
the entire team throughout the project, now with emphasis on objectives 7, 8 and 9, along with Dr. Quagrainie. Two
summer salaries have been included in the budget accounting for release time from her current responsibilities.
Dr. Bill Knudson’s experience and expertise in market analysis and development places him as the leader in
discussions related to objectives 7 and 8, again working closely with all team members in all other objectives listed
in this proposal.
Personnel % of own time Salary Savings Fringe Benefits Total
PI Dr. Valle de Souza 20% $18,396 $6,711 $25,107
Co-PI Dr. Knudson 10% $9,583 $3,429 $13,012
Other Personnel: Dr. Ron Kinnunen will lead discussions in matters pertaining objective 9 during year 2, along with
Mr. Hitchens, from SIU. They will design materials and organize and deliver workshops and training sessions. Dr.
Kinnunen participation takes the role of a consultant given his retirement from MSU: $14,648
F. Travel: We have scheduled 6 to 7 trips on the second year, of 2 days each, for each extension liaisons to deliver
workshops pertaining objective 9. Both extension officers, Dr. Kinunnen from MSU and Mr. Hitchens from SIU,
will be involved in these trips but funds will be coordinated by PI at MSU. Trip costs were estimated including $100
per diem, $130 per night in accommodation and $150 per trip in transportation, amounting to: $9,199
One final trip is included for the PI to meet Dr. Quagrainie at Purdue University, to discuss final conclusions and
reporting. It is estimated a per diem of $54, $103/night accommodation and $75 for transportation, for a 3-days visit:
$621
J. Other Direct Costs, Material and facilities: There are no other direct costs. Materials and facilities will be
provided by MSU and will not incur costs.
Total in Year 2: $62,587
Total MSU: $125,569
[A21]

[A22]
Purdue University Budget
ORGANIZATION AND ADDRESS
Purdue University
Address: 155 S Grand Street
West Lafayette, IN, 47907-2114
USDA AWARD NO. Year: 1 Objective:
Duration Proposed
Months: _24_
Funds Requested by Proposer
Duration Proposed Months: _
Funds Approved by CSREES (If different)
Non-Federal Proposed Cost-
Sharing/ Matching Funds
(If required)
Non-federal Cost-Sharing/
Matching Funds Approved by
CSREES (If Different)
PROJECT DIRECTOR(S) Kwamena Quagrainie
A. Salaries and Wages 1. No. of Senior Personnel
a. (Co)-PD(s) . . . . . . . . . . . . . . . . . . . . . .
b. Senior Associates . . . . . . . . . . . . . . . .
CSREES FUNDED WORK MONTHS
Calendar
Academic
Summer
2. . No. of Other Personnel (Non- Faculty) a. Research Associates-Postdoctorates . . . b. Other Professionals . . . . . . . . . . . . . . . .
c. Paraprofessionals ....................................................................................
d. Graduate Students................................................................................... 21,996
e. Prebaccalaureate Students......................................................................
f. Secretarial-Clerical ...................................................................................
g. Technical, Shop and Other ......................................................................
Total Salaries and Wages........................................................................
B. Fringe Benefits (If charged as Direct Costs) 1,650
C. Total Salaries, Wages, and Fringe Benefits (A plus B) .................................. 23,646
D. Nonexpendable Equipment (Attach supporting data. List items and dollar amounts for each item.)
E. Materials and Supplies
F. Travel 3,275
G. Publication Costs/Page Charges
H. Computer (ADPE) Costs
I. Student Assistance/Support (Scholarships/fellowships, stipends/tuition, cost of education, etc. Attach list of items and dollar amounts for each item.)
J. All Other Direct Costs (In budget narrative, list items and dollar amounts and provide supporting data for each item.)
K. Total Direct Costs (C through I) ...................................................................... 26,921
L. F&A/Indirect Costs. (If applicable, specify rate(s) and base(s) for on/off campus activity. Where both are involved, identify itemized costs in on/off campus bases.)
M. Total Direct and F&A/Indirect Costs (J plus K) ...............................................
N. Other ................................................................................................................
O. Total Amount of This Request ........................................................................ 26,921
P. Carryover -- (If Applicable) . . . . . . . . . . . Federal Funds: $ Non-Federal funds: $ Total $
Q. Cost Sharing/Matching (Breakdown of total amounts shown in line O)
Cash (both Applicant and Third Party) ................................................................................................................
Non-Cash Contributions (both Applicant and Third Party) ...................................................................................
Leave Blank
NAME AND TITLE (Type or print) SIGNATURE (required for revised budget only) DATE
Project Director
Authorized Organizational Representative
Signature (for optional use)

[A23]
Purdue University Budget
ORGANIZATION AND ADDRESS
Purdue University
Address: 155 S Grand Street
West Lafayette, IN, 47907-2114
USDA AWARD NO. Year: 2 Objective:
Duration Proposed
Months: _24_
Funds Requested by Proposer
Duration Proposed Months: _
Funds Approved by CSREES (If different)
Non-Federal Proposed Cost-
Sharing/ Matching Funds
(If required)
Non-federal Cost-Sharing/
Matching Funds Approved by
CSREES (If Different)
PROJECT DIRECTOR(S) Kwamena Quagrainie
A. Salaries and Wages 1. No. of Senior Personnel
a. (Co)-PD(s) . . . . . . . . . . . . . . . . . . . . . .
b. Senior Associates . . . . . . . . . . . . . . . .
CSREES FUNDED WORK MONTHS
Calendar
Academic
Summer
2. . No. of Other Personnel (Non- Faculty) a. Research Associates-Postdoctorates . . . b. Other Professionals . . . . . . . . . . . . . . . .
c. Paraprofessionals ....................................................................................
d. Graduate Students................................................................................... 22,436
e. Prebaccalaureate Students......................................................................
f. Secretarial-Clerical ...................................................................................
g. Technical, Shop and Other ......................................................................
Total Salaries and Wages........................................................................
B. Fringe Benefits (If charged as Direct Costs) 1,683
C. Total Salaries, Wages, and Fringe Benefits (A plus B) .................................. 24,119
D. Nonexpendable Equipment (Attach supporting data. List items and dollar amounts for each item.)
E. Materials and Supplies
F. Travel 3,725
G. Publication Costs/Page Charges
H. Computer (ADPE) Costs
I. Student Assistance/Support (Scholarships/fellowships, stipends/tuition, cost of education, etc. Attach list of items and dollar amounts for each item.)
J. All Other Direct Costs (In budget narrative, list items and dollar amounts and provide supporting data for each item.)
K. Total Direct Costs (C through I) ...................................................................... 27,844
L. F&A/Indirect Costs. (If applicable, specify rate(s) and base(s) for on/off campus activity. Where both are involved, identify itemized costs in on/off campus bases.)
M. Total Direct and F&A/Indirect Costs (J plus K) ...............................................
N. Other ................................................................................................................
O. Total Amount of This Request ........................................................................ 27,844
P. Carryover -- (If Applicable) . . . . . . . . . . . Federal Funds: $ Non-Federal funds: $ Total $
Q. Cost Sharing/Matching (Breakdown of total amounts shown in line O)
Cash (both Applicant and Third Party) ................................................................................................................
Non-Cash Contributions (both Applicant and Third Party) ...................................................................................
Leave Blank
NAME AND TITLE (Type or print) SIGNATURE (required for revised budget only) DATE
Project Director
Authorized Organizational Representative
Signature (for optional use)

[A24]
Budget Explation for Purdue University
(Quagrainie)
Objectives: 1 to 9
In accordance with 2 CFR 220 (OMB Circular A-21), Cost Principles for Educational Institutions, Purdue
University tracks and reports its professional personnel on a percent of effort and not on an hourly basis. Salaries
are adjusted by standard University inflation rates each fiscal year (July 1): 3% for faculty, 2.5% for
professional/technical assistants, and 2% for post docs, graduate/undergraduate students and service staff.
Year 1:
C. Salary, Wages, and Fringe Benefits:
Personnel: Dr. Quagrainie, co-PI, will participate in all stages of the project, during both years, providing his
expertise in matters which relate to the NCR aquaculture industry and marketing, and his expertise in economic
analysis. He will work closely with all members of the team throughout the research project, with emphasis on
objectives 1 to 9. He decided not to include his own salary savings funds in this grant proposal but requested funding
for mentoring a graduate student who will participate in data collection and data analysis.
TBD Graduate Student: A TBD Graduate student will assist in online programming of the survey instrument,
administering the survey instrument, data collection, data collation, as well as analyzing the data and information
collected. This will form part of his/her thesis dissertation. He/She is budgeted at 50% effort to the project. $21,996
Fringe Benefits: Fringe benefits are budgeted in accordance with university policy Graduate Student 7.5%. $1,650
F. Travel: Travel is domestic for data collection and participation in state, regional, and national meetings and
conference. Year 1 budget of $3,275: Includes a cumulative mileage of 500 miles @ $0.55 ($275), and 10 days stay
@ $150 for 2 project personnel ($3,000). $3,275
Total in Year 1: $26,921
Year 2:
C. Salary, Wages, and Fringe Benefits:
TBD Graduate Student
A TBD Graduate student will assist in online programming of the survey instrument, administering the survey
instrument, data collection, data collation, as well as analyzing the data and information collected. This will form
part of his/her thesis dissertation. He/She is budgeted at 50% effort to the project. $22,436
Fringe Benefits - Fringe benefits are budgeted in accordance with university policy Graduate Student 7.5% $1,683
F. Travel: Year 2 budget of $3,725: Includes participation in national meetings (e.g., Aquaculture America,
Agricultural and Applied Economics Association annual meeting) - air ticket ($600); conference registration ($332)
and lodging/M&I for 6 days @ $150 ($900) and ground transportation ($30.5) for 2 project personnel. $3,725
Total in Year 2: $27,844
Total Purdue: $54,765

[A25]

[A26]
Southern Illinois University Budget
ORGANIZATION AND ADDRESS
Southern Illinois University
Address: 1263 Lincoln Dr. Carbondale, IL 62901
USDA AWARD NO. Year: 1 Objective:
Duration Proposed
Months: _24_
Funds Requested by Proposer
Duration Proposed Months: _
Funds Approved by CSREES (If different)
Non-Federal Proposed Cost-
Sharing/ Matching Funds
(If required)
Non-federal Cost-Sharing/
Matching Funds Approved by
CSREES (If Different)
PROJECT DIRECTOR(S)
Paul Hitchens
A. Salaries and Wages 1. No. of Senior Personnel
a. (Co)-PD(s) . . . . . . . . . . . . . . . . . . . . . .
b. Senior Associates . . . . . . . . . . . . . . . .
CSREES FUNDED WORK MONTHS
Calendar
Academic
Summer
2. . No. of Other Personnel (Non- Faculty) a. Research Associates-Postdoctorates . . . b. Other Professionals . . . . . . . . . . . . . . . .
c. Paraprofessionals ....................................................................................
d. Graduate Students...................................................................................
e. Prebaccalaureate Students......................................................................
f. Secretarial-Clerical ...................................................................................
g. Technical, Shop and Other ...................................................................... 5,687
Total Salaries and Wages........................................................................ 5,687
B. Fringe Benefits (If charged as Direct Costs) 3.315
C. Total Salaries, Wages, and Fringe Benefits (A plus B) .................................. 9,002
D. Nonexpendable Equipment (Attach supporting data. List items and dollar amounts for each item.)
E. Materials and Supplies
F. Travel
G. Publication Costs/Page Charges
H. Computer (ADPE) Costs
I. Student Assistance/Support (Scholarships/fellowships, stipends/tuition, cost of education, etc. Attach list of items and dollar amounts for each item.)
J. All Other Direct Costs (In budget narrative, list items and dollar amounts and provide supporting data for each item.)
K. Total Direct Costs (C through I) ......................................................................
L. F&A/Indirect Costs. (If applicable, specify rate(s) and base(s) for on/off campus activity. Where both are involved, identify itemized costs in on/off campus bases.)
M. Total Direct and F&A/Indirect Costs (J plus K) ...............................................
N. Other ................................................................................................................
O. Total Amount of This Request ........................................................................ 9,002
P. Carryover -- (If Applicable) . . . . . . . . . . . Federal Funds: $ Non-Federal funds: $ Total $
Q. Cost Sharing/Matching (Breakdown of total amounts shown in line O)
Cash (both Applicant and Third Party) ................................................................................................................
Non-Cash Contributions (both Applicant and Third Party) ...................................................................................
Leave Blank
NAME AND TITLE (Type or print) SIGNATURE (required for revised budget only) DATE
Project Director
Authorized Organizational Representative
Signature (for optional use)

[A27]
Southern Illinois University Budget
ORGANIZATION AND ADDRESS
Southern Illinois University
Address: 1263 Lincoln Dr. Carbondale, IL 62901
USDA AWARD NO. Year: 2 Objective:
Duration Proposed
Months: _24_
Funds Requested by Proposer
Duration Proposed Months: _
Funds Approved by CSREES (If different)
Non-Federal Proposed Cost-
Sharing/ Matching Funds
(If required)
Non-federal Cost-Sharing/
Matching Funds Approved by
CSREES (If Different)
PROJECT DIRECTOR(S)
Paul Hitchens
A. Salaries and Wages 1. No. of Senior Personnel
a. (Co)-PD(s) . . . . . . . . . . . . . . . . . . . . . .
b. Senior Associates . . . . . . . . . . . . . . . .
CSREES FUNDED WORK MONTHS
Calendar
Academic
Summer
2. . No. of Other Personnel (Non- Faculty) a. Research Associates-Postdoctorates . . . b. Other Professionals . . . . . . . . . . . . . . . .
c. Paraprofessionals ....................................................................................
d. Graduate Students...................................................................................
e. Prebaccalaureate Students......................................................................
f. Secretarial-Clerical ...................................................................................
g. Technical, Shop and Other ...................................................................... 5,857
Total Salaries and Wages........................................................................ 5,857
B. Fringe Benefits (If charged as Direct Costs) 3,415
C. Total Salaries, Wages, and Fringe Benefits (A plus B) .................................. 9,272
D. Nonexpendable Equipment (Attach supporting data. List items and dollar amounts for each item.)
E. Materials and Supplies
F. Travel
G. Publication Costs/Page Charges
H. Computer (ADPE) Costs
I. Student Assistance/Support (Scholarships/fellowships, stipends/tuition, cost of education, etc. Attach list of items and dollar amounts for each item.)
J. All Other Direct Costs (In budget narrative, list items and dollar amounts and provide supporting data for each item.)
K. Total Direct Costs (C through I) ......................................................................
L. F&A/Indirect Costs. (If applicable, specify rate(s) and base(s) for on/off campus activity. Where both are involved, identify itemized costs in on/off campus bases.)
M. Total Direct and F&A/Indirect Costs (J plus K) ...............................................
N. Other ................................................................................................................
O. Total Amount of This Request ........................................................................ 9,272
P. Carryover -- (If Applicable) . . . . . . . . . . . Federal Funds: $ Non-Federal funds: $ Total $
Q. Cost Sharing/Matching (Breakdown of total amounts shown in line O)
Cash (both Applicant and Third Party) ................................................................................................................
Non-Cash Contributions (both Applicant and Third Party) ...................................................................................
Leave Blank
NAME AND TITLE (Type or print) SIGNATURE (required for revised budget only) DATE
Project Director
Authorized Organizational Representative
Signature (for optional use)

[A28]
Objectives 1 and 9
Year 1:
C. Salary, Wages, and Fringe Benefits:
Budget Explanation for SIU
(Hitchens)
Personnel - Southern Illinois University is represented in this project by one Extension Officer, Mr. Paul Hitchens.
Mr. Hitchens will provide input during the development of survey questions, defined in objective 1, and throughout
analysis of results during the first year of this research project. His annual salary is $56,868. With a 10%
participation in this project, the amount estimated for his salary in year 1 is $5,687. Fringe benefit at SIU is
estimated at 58.3%, therefore $3,315 in the first year, totaling: $9,002
E. Material and facilities: Materials and facilities will be provided by SIU and will not incur a cost to this project
F. Travel: We have scheduled 4 to 5 trips on the first year, of 2 days each, for each extension liaisons, to interview
seafood marketing channel representatives in order to validate our survey, pertaining objective 1. Both extension
officers, Dr. Kinunnen from MSU and Mr. Hitchens from SIU, will be involved in these trips but funds will be
coordinated by PI at MSU. Please refer to MSU Budget Justification.
Total in Year 1: $9,002
Year 2:
C. Salary, Wages, and Fringe Benefits:
Personnel - At a later stage of the project, during the second year, Mr. Hitchens will prepare, organize and deliver
extension workshops and presentations of results and research inferences, pertaining to objective 9 of this proposal,
along with Dr. Kinnunen. His annual salary is $56,868. With a 10% participation in this project, the amount
estimated for his salary is $5,857 in the second year. Over time, the budget provides for 3% annual salary
increments. Fringe benefits at SIU is estimated at 58.3%, therefore $3,415 in the second year, totaling:
$ 9,272
E. Material and facilities: Materials and facilities will be provided by SIU and will not incur a cost to this project
F. Travel: We have scheduled 6 to 7 trips on the second year, of 2 days each, for each extension liaisons to deliver
workshops pertaining objective 9. Both extension officers, Dr. Kinnunen from MSU and Mr. Hitchens from SIU,
will be involved in these trips but funds will be coordinated by PI at MSU. Please refer to MSU Budget Justification.
Total in Year 2: $9,272
Total SIU: $18,274
[A29]

[A30]
Budget Summary
Year 1
Year #1 MSU SIU Purdue Total
Salaries and Wages 46,156 5,687 21,996 73,839
Fringe Benefits 10,125 3,315 1,650 15,090
Total Salaries, Wages, and Fringe Benefits 56,281 9,002 23,646 88,929
Nonexpendable Equipment 0 0 0 0
Materials and Supplies 0 0 0 0
Travel 6,701 0 3,275 9,976
All Other Direct Costs 6,701 0 3,275 9,976
Totals 62,982 9,002 26,921 98,905
Year 2
Year #2 MSU SIU Purdue Total
Salaries and Wages 42,627 5,857 22,436 70,920
Fringe Benefits 10,140 3,415 1,683 15,238
Total Salaries, Wages, and Fringe Benefits 52,767 9,272 24,119 86,158
Nonexpendable Equipment 0 0 0 0
Materials and Supplies 0 0 0 0
Travel 9,820 0 3,725 13,545
All Other Direct Costs 9,820 0 3,725 13,545
Totals 62,587 9,272 27,844 99,703

[A31]
Schedule for Completion of Objectives
Objectives Q1 Q2 Q3 Q4 Q5 Q6 Q7 Q8 Activities
1 Literature review and survey design, validation and distribution
2,3,4,5, and 6 Primary data analysis, secondary data research and report
development. Reporting of consumers’ preferences identified by
statistical analysis of survey data, using restaurants and retail and
wholesalers purchase choices. Reporting of restaurants and retail
and wholesale market preferences and willingness to pay defined by
species and alternative forms of seafood
7 Research development on marketing and value adding capacity
identifying opportunities for the aquaculture industry based on
identified factors influencing restaurants and retail and wholesale
market purchase of aquaculture products.
8 Research on regional demographics analysis in what refers to survey
results and potential markets. Reporting of niche market location,
including current players in the supply chain, for specific
aquaculture species, and suggesting marketing strategies and value-
adding product modifications
9 Disseminating results through extension and outreach programs
including educational fact sheets and data bulletins to be published
in the NCRAC Fact Sheet Series. Writing journal articles.
Participating Institutions and Co-Principal Investigators
Michigan State University
Dr. Simone Valle de Souza
Michigan State University
Dr. Bill Knudson
Purdue University
Dr. Kwamena Quagrainie
Michigan State University
Dr. Ron Kinnunen
Southern Illinois University
Dr. Paul Hitchens

[A32]
VITA
Simone Valle de Souza Phone: (517) 353 – 4380
Michigan State University E-mail: [email protected]
AFRE, 446 W. Circle Drive, Room 85
East Lansing, MI 48824
EDUCATION
Ph.D. - Fisheries Economics, University of New England, 2014
M.S., Economic - Agricultural and Resource Economics, University of New England, 2005
Grad. Dip, MBA - Accountancy and Finances III, Federal University of Parana, 1997
B.A. - Business Administration, Federal University of Parana, 1996
RESEARCH AND PROFESSIONAL EXPERIENCE
2017 - Present Academic Specialist – MSU – MI
2008 – 2017 Researcher and Lecturer in Local Government – UNE
2003 – 2007 Operations Manager, IELTS English Test Coordinator and Marker – UNE
1997 – 2002 General Manager
SCIENTIFIC AND PROFESSIONAL ORGANIZATIONS
UNE Centre for Local Government, Deputy Director
IIFET - International Institute of Fisheries Economics & Trade
AARES - Australasian Agricultural and Resource Economics
ANZSEE - Australia New Zealand Society for Ecological Economics
RECENT PUBLICATIONS
Valle de Souza, S., B. E. Dollery, and B. Blackwell. 2018. An empirical analysis of mining costs and mining
royalties in Queensland local government. Energy Economics 74:656-662.
Valle de Souza, S., M. Kortt, and B. E. Dollery. 2016. Counting the cost: a critical evaluation of the Australian national
broadband network roll-out under the Rudd/Gillard governments. International Journal of Public
Administration 41(2):129-136.
Adapa, S., N. Bhullar, and S. Valle de Souza. 2016. A systematic review and agenda for using alternative water sources
for consumer markets in Australia. Journal of Cleaner Production 124:14-20.
Valle de Souza, S., B. E. Dollery, and M. Kortt. 2016. A critical evaluation of Australian mineral resources rent tax.
International Journal of Public Administration 40(6):472-480.
Valle de Souza, S., B. E. Dollery, and M. Kortt. 2015. De-amalgamation in action: The Queensland experience. Public
Management Review 17(1):1403-1424.
Valle de Souza, S., Y. Kinoshita, and B. Dollery. 2015. Post-disaster local infrastructure reconstruction finance: a
comparative analysis of policy intervention in the Japanese earthquake and Queensland flood disasters. Public
Finance and Management 15(1):65-87.
Dollery, B. E., M. Kortt, and S. Valle de Souza. 2015. Policy analysis capacity and Australian Local government.
Policy Analysis in Australia 105-119.
Valle de Souza, S. 2014. A bioeconomic model for Banana Prawns in the northern prawn fishery, in Australia.
Doctoral dissertation. University of New England, Australia.
Dollery, B.E., M. Kortt, and S. Valle de Souza, 2014. Enduring financial sustainability through “bottom-up” local
authority ingenuity and rational “top-down” state regulation: The case of Lake Macquarie City Council.
International Journal of Public Administration 37(4):215-223.
Valle de Souza, S., and B. E. Dollery. 2011. Shared services in Australian local government: The Brighton common
service model. Journal of Economic and Social Policy 14(2).
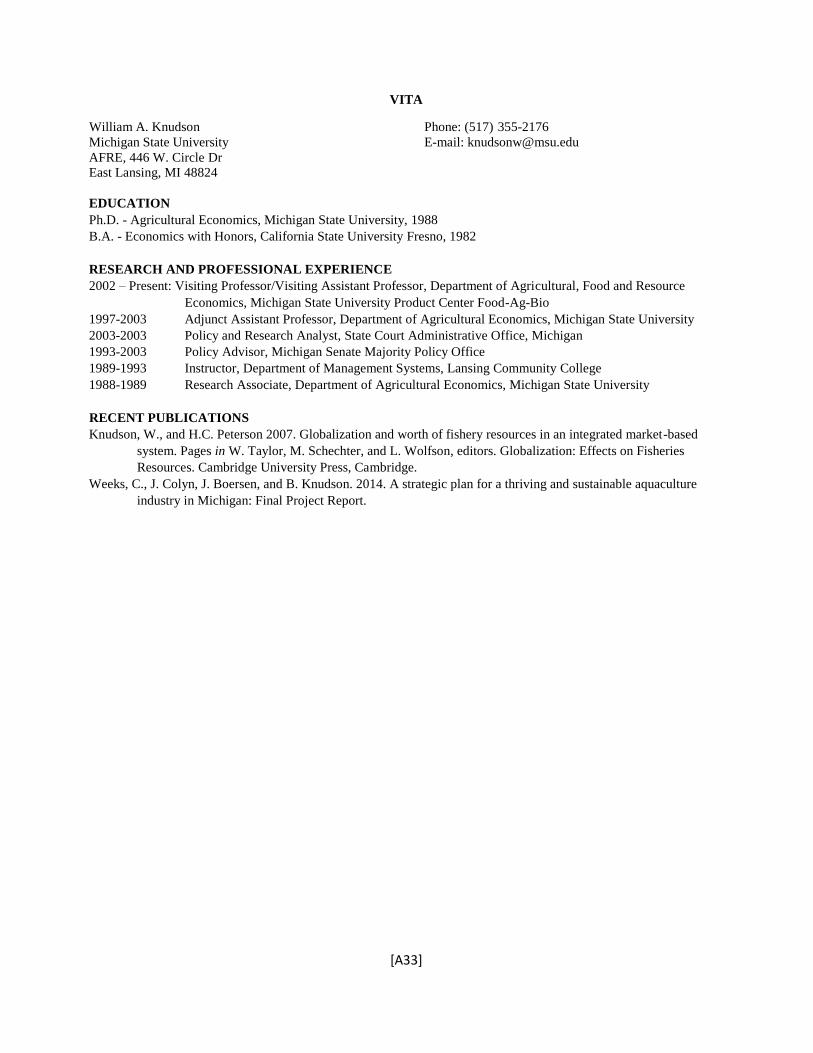
[A33]
VITA
William A. Knudson Phone: (517) 355-2176
Michigan State University E-mail: [email protected]
AFRE, 446 W. Circle Dr East Lansing, MI 48824
EDUCATION
Ph.D. - Agricultural Economics, Michigan State University, 1988
B.A. - Economics with Honors, California State University Fresno, 1982
RESEARCH AND PROFESSIONAL EXPERIENCE
2002 – Present: Visiting Professor/Visiting Assistant Professor, Department of Agricultural, Food and Resource
Economics, Michigan State University Product Center Food-Ag-Bio
1997-2003 Adjunct Assistant Professor, Department of Agricultural Economics, Michigan State University
2003-2003 Policy and Research Analyst, State Court Administrative Office, Michigan
1993-2003 Policy Advisor, Michigan Senate Majority Policy Office
1989-1993 Instructor, Department of Management Systems, Lansing Community College
1988-1989 Research Associate, Department of Agricultural Economics, Michigan State University
RECENT PUBLICATIONS
Knudson, W., and H.C. Peterson 2007. Globalization and worth of fishery resources in an integrated market-based
system. Pages in W. Taylor, M. Schechter, and L. Wolfson, editors. Globalization: Effects on Fisheries
Resources. Cambridge University Press, Cambridge.
Weeks, C., J. Colyn, J. Boersen, and B. Knudson. 2014. A strategic plan for a thriving and sustainable aquaculture
industry in Michigan: Final Project Report.
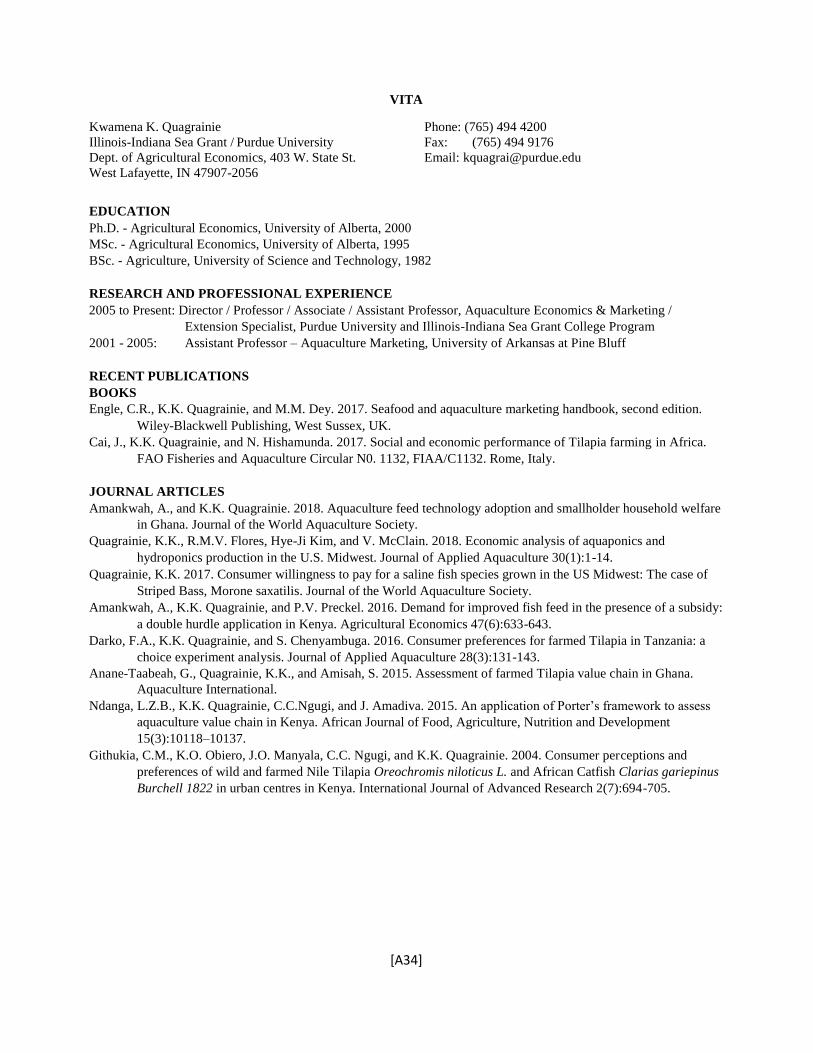
[A34]
VITA
Kwamena K. Quagrainie Phone: (765) 494 4200
Illinois-Indiana Sea Grant / Purdue University Fax: (765) 494 9176
Dept. of Agricultural Economics, 403 W. State St. Email: [email protected]
West Lafayette, IN 47907-2056
EDUCATION
Ph.D. - Agricultural Economics, University of Alberta, 2000
MSc. - Agricultural Economics, University of Alberta, 1995
BSc. - Agriculture, University of Science and Technology, 1982
RESEARCH AND PROFESSIONAL EXPERIENCE
2005 to Present: Director / Professor / Associate / Assistant Professor, Aquaculture Economics & Marketing /
Extension Specialist, Purdue University and Illinois-Indiana Sea Grant College Program
2001 - 2005: Assistant Professor – Aquaculture Marketing, University of Arkansas at Pine Bluff
RECENT PUBLICATIONS
BOOKS
Engle, C.R., K.K. Quagrainie, and M.M. Dey. 2017. Seafood and aquaculture marketing handbook, second edition.
Wiley-Blackwell Publishing, West Sussex, UK.
Cai, J., K.K. Quagrainie, and N. Hishamunda. 2017. Social and economic performance of Tilapia farming in Africa.
FAO Fisheries and Aquaculture Circular N0. 1132, FIAA/C1132. Rome, Italy.
JOURNAL ARTICLES
Amankwah, A., and K.K. Quagrainie. 2018. Aquaculture feed technology adoption and smallholder household welfare
in Ghana. Journal of the World Aquaculture Society.
Quagrainie, K.K., R.M.V. Flores, Hye-Ji Kim, and V. McClain. 2018. Economic analysis of aquaponics and
hydroponics production in the U.S. Midwest. Journal of Applied Aquaculture 30(1):1-14.
Quagrainie, K.K. 2017. Consumer willingness to pay for a saline fish species grown in the US Midwest: The case of
Striped Bass, Morone saxatilis. Journal of the World Aquaculture Society.
Amankwah, A., K.K. Quagrainie, and P.V. Preckel. 2016. Demand for improved fish feed in the presence of a subsidy:
a double hurdle application in Kenya. Agricultural Economics 47(6):633-643.
Darko, F.A., K.K. Quagrainie, and S. Chenyambuga. 2016. Consumer preferences for farmed Tilapia in Tanzania: a
choice experiment analysis. Journal of Applied Aquaculture 28(3):131-143.
Anane-Taabeah, G., Quagrainie, K.K., and Amisah, S. 2015. Assessment of farmed Tilapia value chain in Ghana.
Aquaculture International.
Ndanga, L.Z.B., K.K. Quagrainie, C.C.Ngugi, and J. Amadiva. 2015. An application of Porter’s framework to assess
aquaculture value chain in Kenya. African Journal of Food, Agriculture, Nutrition and Development
15(3):10118–10137.
Githukia, C.M., K.O. Obiero, J.O. Manyala, C.C. Ngugi, and K.K. Quagrainie. 2004. Consumer perceptions and
preferences of wild and farmed Nile Tilapia Oreochromis niloticus L. and African Catfish Clarias gariepinus
Burchell 1822 in urban centres in Kenya. International Journal of Advanced Research 2(7):694-705.

[A35]
VITA
Ronald E. Kinnunen Phone: (906) 226-3687
Michigan State University - Upper Peninsula Fax: (906) 226-3687
710 Chippewa Square, Ste. 202 E-mail: [email protected]
Marquette, MI 49855-4823
EDUCATION
Ph.D. - Michigan Technological University, 1997
M.S. - Michigan State University, 1979
B.S. - Michigan State University, 1976
RESEARCH AND PROFESSIONAL EXPERIENCE
1982-present Michigan Sea Grant Extension Agent (), Upper Peninsula, Michigan State University
1981 Fisheries Pathologist, Rangen Research Laboratory, Hagerman, Idaho
1979-1980 Fisheries Biologist, U.S. Fish and Wildlife Service, Leetown, West Virginia
SCIENTIFIC AND PROFESSIONAL ORGANIZATIONS
American Fisheries Society, Salmonid Section
International Association for Great Lakes Research
RECENT PUBLICATIONS
Fagan, K.-A., M.A. Koops, M.T. Arts, T.M. Sutton, R.E. Kinnunen, A.M. Muir, M. Power. 2017. Lake whitefish
(Coregonus clupeaformis) energy and nutrient partitioning in lakes Michigan, Erie and Superior. Journal of
Great Lakes Research. 43:144-154.
Summerfelt, R.C., R.D. Clayton, J.A. Johnson, R.E. Kinnunen. 2010. Production of walleye as potential food fish.
North Central Regional Aquaculture Center Fact Sheet #116. NCRAC Publications Office, Iowa State
University, Ames.
Kinnunen, R.E., M.C. Gould, and P. Cambier. 2005. Composting commercial fish processing waste from fish caught
in the Michigan waters of the Great Lakes. Michigan State University Technical Bulletin. 40 pgs.
Hinshaw, J.M., G. Fornshell, R.E. Kinnunen. 2004. A profile of the aquaculture of trout in the United States. Report
for USDA Risk Management Agency, Federal Crop Insurance Corporation, through Mississippi State
University. 46 pgs.
Kinnunen, R.E., editor. 2002. Environmental Strategies for Aquaculture Symposium Proceedings (December 2000).
62nd Midwest Fish and Wildlife Conference, Minneapolis, MN. NCRAC CD Series #101, NCRAC
Publications Office, Iowa State University, Ames, IA.
Gunderson, J.L. and R.E. Kinnunen. 2001. Aquatic nuisance species-Hazard analysis and critical control point training
curriculum. Michigan Sea Grant Publication No. MSG-00-400.
Kinnunen, R.E. 2000. A white paper on the status and needs of salmonid aquaculture in the North Central Region.
North Central Regional Aquaculture Center. Michigan State University.
Kinnunen, R.E. 1996. Walleye fingerling culture in undrainable ponds. Pages 135-145 in R.C. Summerfelt, editor.
Walleye culture manual. NCRAC Culture Series #101, NCRAC Publications Office, Iowa State University,
Ames.

[A36]
VITA
Paul Hitchens Phone: 618-453-5590
Southern Illinois University, E-mail: [email protected] Center for
Fisheries, Aquaculture, and Aquatic Sciences
EDUCATION
B.S. - Environmental Biology, Eastern Illinois University, 1981
RESEARCH AND PROFESSIONAL EXPERIENCE
2005-Present Aquaculture Specialist/Researcher II, Illinois Aquaculture
TechSERV; Center for Fisheries, Aquaculture, and Aquatic
Sciences-Southern Illinois University; Carbondale, IL
2003-2005 Technical Service Agent, Illinois Fish Farmers Co-op; Pinckneyville, IL
2003 Independent Private Consultant, Inter Sea Farms De
Venezuela C. A.; Maracaibo, Venezuela 1990-2003 Technical Manager,
Larfico S.A., Penaeid Shrimp Laboratory, Ayangue, Ecuador
1984-1990 Technical Manager, Langomorro Cia., Ltd.; Penaeid Shrimp
Farm, affiliate of Larfico S.A., Guayaquil, Ecuador
1982-1984 Pond/Hatchery Biologist, Inducam S.A., Penaeid Shrimp Farm; Guayaquil, Ecuador
1982 Technical Assistant II, Texas A&M University / National
Marine Fisheries, Galveston, TX 1982 Independent Private Consultant,
Market Facts, Inc., Chicago, IL
1981 Staff Biologist, King James Shrimp, Inc., Park Forest South, IL
RECENT PUBLICATION:
R. Laramore, S. Allen, P. Hitchens, A. Romero, and A. Schuur. 2000. Artificial
induction of active accommodation for White Spot Syndrome Virus (WSSV) in
Penaeid vannamei with tolerine products. Proceedings of the World
Aquaculture Society, Latin American Conference. Panama City, Panama.
Blogoslawski, W.J., C. Perez, and P. Hitchens. 1992. Ozone treatment of seawater to control vibriosis in
mariculture of penaeid shrimp, Penaeus vannamei. Pages 131-141. Proceedings of the Third International
Symposium on the use of Ozone in Aquatic Systems. International Ozone Association, Pan American
Group. Stamford, Connecticut, USA.