china's banking reform: an assessment of its evolution and
TRANSCRIPT

China’s Banking Reform: An Assessment
of its Evolution and Possible Impact
Alicia Garcıa-Herrero*, Sergio Gavilay and Daniel Santabarbaraz
Abstract
The Chinese banking system, characterized by massive government intervention, poor
asset quality and low capitalization, has started a reform process based on the three main
pillars: (i) bank restructuring, through the cleaning-up of non-performing loans (NPLs) and
public capital injections, particularly in the four largest state-owned banks; (ii) financial
liberalization, with the gradual flexibilization of quantity and price controls, the opening-up
to foreign competition and cautious steps towards capital account liberalization and
(iii) strengthened financial regulation and supervision, coupled with efforts to improve
corporate governance and transparency. Although the reform is still ongoing, our
preliminary assessment indicates that there has been an improvement in the soundness
of the Chinese banking system. However, changes in the reform strategy are needed for it
to be fully successful. Asset quality has improved, particularly in the recapitalized banks,
but there is a high risk of a new build-up of NPLs. Capitalization has increased in the
largest banks, as a consequence of the government capital injections, which generally
remains low, as well as profitability. China’s huge financing needs, to maintain high
economic growth, and its commitment to fully open up its banking system to foreign
competition urgently require a more comprehensive and time-bound strategy, with a long-
term vision of the desired structure of the Chinese banking system. Bank recapitalization
should be completed immediately, not only to ensure bank soundness, but also
to increase profitability, which could be further hampered as the competition
increases with full financial liberalization. Bank recapitalization, however, needs to be
accompanied by a radical improvement in corporate governance, which would clearly be
facilitated by a change in the property structure. (JEL classification: E44, E66, G2, G21)
Keywords: Chinese financial system, financial reform, bank restructuring, financial
liberalization, bank regulation and supervision
1 Introduction
China’s very high and stable growth in the last few years would seemto indicate that the country is a success in all regards, including finance.This optimistic picture, however, may change if we consider the extremely
* Bank of Spain, e-mail: [email protected] authors are affiliated with the Bank of Spain. The opinions expressed are those of theauthors and not necessarily those of the Bank of Spain. The article has benefited frominputs from the staff of the Chinese Banking Regulatory Commission and the AsianDevelopment Bank as well as information from Sayuri Shirai. We also thank theparticipants of the CESifo Conference on understanding the Chinese economy, inparticular Christa Hainz and Tamara Trinh, and participants of an IMF Seminar wherethe article was presented. Finally, we thank an anonymous referee for useful comments.
y e-mail: [email protected] e-mail: [email protected]
� The Author 2006. Published by Oxford University Presson behalf of Ifo Institute for Economic Research, Munich. All rights reserved.For permissions, please email: [email protected] 304
CESifo Economic Studies, Vol. 52, 2/2006, 304–363, doi:10.1093/cesifo/ifl006
high domestic saving and investment ratios. In fact, for an average40 percent domestic investment to GDP (fully financed by domesticsavings), an 8–10 percent growth is not such a high return to investment.This is a very rough indicator of potential misallocation of resources,namely domestic savings, which has been a common feature of the finally-closed economies, and even more so of the centrally-planned ones.The Chinese authorities are in the process of transforming a planned
economy into a market-based one. There are several reasons to believethat this process may have consequences not only for China but also forthe rest of the world. First, China has one-fourth of the world’s populationand 15 percent of its GDP measured in terms of purchasing power parity(PPP). Second, its economy is expected to become even larger; for some,even the biggest, worldwide by 2050 (Wilson and Purushothaman 2003).Third, it is one of the main exporters of capital, which is now mainlydirected to financing the US current account deficit.In this study, we concentrate on the banking sector for three reasons. First,
it is the most important player of the Chinese financial system, althoughcapital markets are also growing fast. In 2004, bank loans represented 83percent of the funds raised by the non-financial sector, while stocks wereonly 5 percent and bonds 12 percent (11 percent for government bonds and1 percent corporate ones). Second, the banking system is the main financierof non-profitable state-owned enterprises (SOEs) so that bank reform willhave a direct impact on SOEs. Third, the Chinese banking system is so largethat the way in which the reform is resolved could have systemic con-sequences. One can think of several—albeit unlikely—scenarios for suchconsequences. One is a banking crisis, particularly in the aftermath of capitalaccount liberalization, which could affect capital flows elsewhere in theworld. Another one would be that a number of foreign banks gain control ofChina’s largest banks, which rank among the largest in the world. This mightinduce a reshaping of the international banks’ position worldwide and,perhaps, even a change in their interest towards other emerging economies.This article describes and assesses China’s ongoing banking reform as
well as the potential impact of remaining measures, so as to draw con-clusions and recommendations, which may be of interest for policy makers.The article is organized as follows: In Section 2, the structure and
evolution of the Chinese banking system is briefly described as well asthe main reasons for its poor performance. Section 3 summarizes themain steps taken towards financial reform, distinguishing between bankrestructuring, financial liberalization and bank regulation and supervision.Section 4 evaluates the impact of the reform on bank performanceso far as well as the potential consequences of remaining steps. Finally,in Section 5, we draw conclusions and policy recommendations based onour evaluation of the reform.
CESifo Economic Studies, 52, 2/2006 305
China’s Banking Reform

2 The Chinese banking system
In this section, we review the main features characterizing China’s banking
system so as to better understand and assess the steps taken for its reform.The first striking feature is the large size of the banking system not only
in relative terms but also in absolute ones. China ranked seventh,
worldwide, in terms of bank credit to the private sector as a percentageof GDP (Figure A1 in Appendix 1) and sixth in terms of bank credit in
United States Dollar (USD) (Figure A2 in Appendix 1). Furthermore,bank credit continues to grow at a brisk rate, pushed by buoyant economic
growth. However, this does not imply a very developed bankingsystem since penetration of banking products is low and bank credit
for small-and medium-size enterprises (SMEs) and households is scarce,15 and 11 percent of the total loans, respectively, in 2004.The Second feature, as many transition economies, the Chinese banking
system has been dominated by four very large State-Owned CommercialBanks (SOCBs), which were created in the 1980s to grant credit to key
sectors and are now commercial banks concentrating in corporate lending(Appendix 2 offers an overview of the institutional setting of the Chinese
banking system and the different types of banks). The remaining banks arerelatively small, which explains why the degree of concentration is
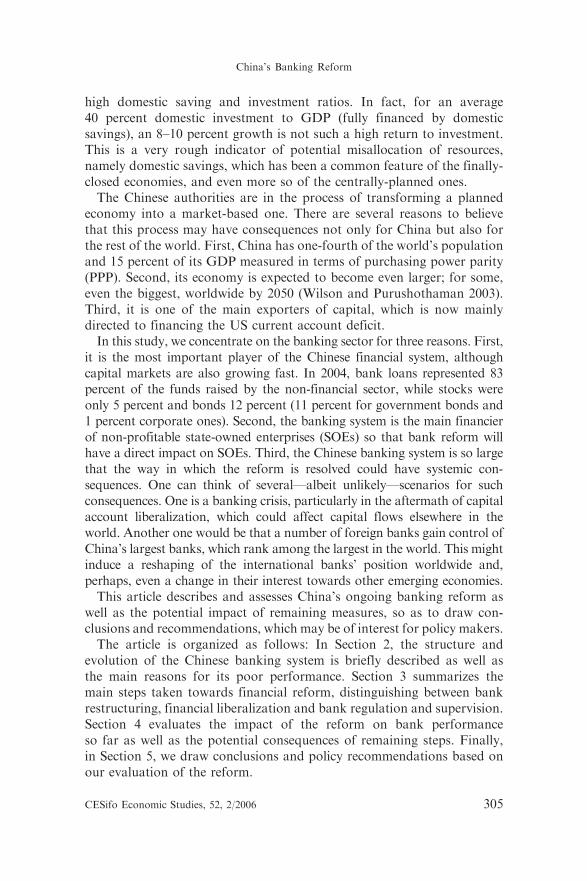
relatively high when measured in terms of the share of assets of the four
largest banks (see m4 in Figure 1), but much lower when measured by theHerfindahl Index. The relatively low Herfindahl Index, however, does
not imply strong competition in the banking system, given the oligopolisticbehaviour of the SOCBs, the still massive government intervention and the
ample room for growth that the strong demand for credit has offered to allbanks. A proof of the scarce competition is the relatively high interest
margin, at least when compared with industrial countries (1.79 percentin 2003 as opposed to 1.38 percent for EU banks).1 Things seem to be
starting to change with the decreasing weight of SOCBs in the bankingsystem (with 73.9 percent of the total assets in 1993 and 54.6 percent in
2004) and the rising importance of other commercial banks, such as theJoint-Stock Commercial Banks (JSCBs) and the City Commercial Banks
(CCBs). The former, partially owned by local governments and SOEs, andwith a growing share of private ownership (sometimes foreign), now hold
15 percent of the total bank assets, as compared with 4.4 percent in 1993.
The CCBs, created by restructuring and merging urban credit cooperatives(UCCs), are much smaller, with a 5.4 percent share in 2004
1 The net interest margin is even higher in Eastern Europe (3.39 percent), which may pointto the lack of competition notwithstanding the systemic restructuring their bankingsystems went through in the 1990s.
306 CESifo Economic Studies, 52, 2/2006
A. Garcıa-Herrero et al.
(Table A1 in Appendix 1 shows the evolution of asset share for each typeof institution). This rapid change in asset share is mainly driven by a30 percent yearly growth in JSCBs’ assets, as opposed to 10 percent forSOCBs.The third feature is the rather peculiar structure of the balance sheet,
compared with international standards. First, loans are a large part of theassets (60.8 percent in 2003 as shown in Figure 2), the majority of which isgranted to the corporate sector (over 85 percent of the total loans and over85 percent of the profits) and to a large—although decreasing—extentshort-term. In fact, still nearly 50 percent of the total loans go to financeindustrial projects in a revolving manner (Table A4 in Appendix 1). This isparticularly the case of policy banks, created in 1994 as state-owneddevelopment banks, with 92 percent of assets in loans. The recent boom inthe housing sector has not changed this picture yet; mortgage lending isstill <15 percent of the total loans, but also of new loans (as shownin Figure 3). Second, almost all liabilities are deposits, with an averageshare of 89 percent in 2003. This is even higher in SOCBs (92 percent)but much less so for JSCBs (79 percent), which have used non-interest-bearing funding. Retail depositors are the main financiers of the bankingsystem since corporate deposits only represented one-third of the total.(Tables A2, A3 and A4 in Appendix 1). Again, large differences existamong types of banks since retail depositors represent 60 percent of thetotal deposits for SOCBs and corporate deposits 65 percent for JSCBs.
0
500
1000
1500
2000
2500
3000
1995 1996 1997 1998 1999 2000 2001 2002 2003 20040%
20%
40%
60%
80%
m4SOCBs share(right axis)
Herfindahl Index(Left axis)
Notes: m4 is the share of total assets of the four largest banks (in %). Herfindahl Index is measured from 0 to 10000Source: CEIC and Bankscope
JSCBs share(right axis)
Figure 1 Concentration of the chinese banking sector
CESifo Economic Studies, 52, 2/2006 307
China’s Banking Reform

The fourth feature of Chinese banks, also rather common in transition
economies, has been their very poor asset quality. The ratio of non-
performing loans (NPLs) to total loans was 20 percent in 2003 (Table 1),
well above the other emerging economies standards (9.1 percent for
Eastern Europe banks in the same year). The situation was even worse
before the Chinese authorities started their restructuring [above 30 percent
in 1997 according to the China Banking Regulatory Commission
(CBRC)]. Also provisioning, as a percentage of NPLs, was well below
the international standards, namely <22 percent,2 as compared with
Source: Bankscope
Deposits and short-term funding over assets in 2003
89.1 92.1
79.983.7
78.12
50
75
100
Total SOCBs JSCBs Policybanks
EasternEurope
Perc
enta
ge (%
)
Loans over assets in 2003
60.8 60.3 60.5
92.1
49.60
0
25
50
75
100
Total SOCBs JSCBs Policybanks
EasternEurope
Perc
enta
ge (%
)
Figure 2 Assets and short term liabilities
0
10
20
30
40
50
Infra
stru
ctur
e
Shor
t-ter
min
dust
rial
loan
s
Hou
sing
Com
mer
cial
bills
Agric
ultu
ral
Auto
mob
ile*
Oth
erco
nsum
er
Oth
er
Perc
enta
ge (%
)
2001 2002 2003
Source: Standard and Poors (2004)
Figure 3 Composition of new loans
2 Due to data limitations, this ratio has been calculated for three of the four SOCBs(i.e. excluding the Agricultural Bank of China), and ten of the twelve JSCBs.
308 CESifo Economic Studies, 52, 2/2006
A. Garcıa-Herrero et al.

46.4 percent in Eastern Europe in 2003. The underlying reasons for such
poor asset quality are not only the soft-budget constraints for lending to
SOEs but also a weak credit culture. The former is a well-known problem
of transition countries, all the more so, the longer does the transition lasts
towards a market economy.3 The latter explains why NPLs from SMEs
and household lending are also high for international standards. Finally,
capitalization is low. The solvency ratio, calculated according to Basel I,
was only 6.73 percent4 in 2003 (as shown in Figure 4) and the ratio of
equity to assets was 4.3 percent, virtually the same as before the reform
started, and very low compared with Eastern Europe in 2003 (10.3
percent). Table A5 in Appendix 1 shows the evolution of basic indicators
of bank performance for each bank group.The fifth feature is a very poor profitability. In 2003, the return on
equity (ROE) of the banking system was 3.05 percent (Figure 5), and the
return on average assets (ROA) was 0.14 percent, well below the
international standards. As an example, Eastern Europe banks had
13.57 percent ROE and 1.43 percent ROA in the same year.There are several reasons for the low profitability, but the main
one seems to be asset quality. Operating income, as a percentage of
Table 1 Reported NPLs in Chinese financial system
NPL ratio
as ofUSDbillion
(% of totalloans)
% ofGDPa
State-owned commercial banks Dec-03 232 20 17Joint-Stock Commercial Banks Mar-04 23 7 2Policy Banks Jun-03 19 18 1Credit cooperatives Mar-04 60 30 4
Banking system total Dec-03 373 19 28Asset management companies Dec-03 107 – 8Financial system total Mar-04 480 – 36
Source: Authors’ own estimations based on official figures reported by Bofit (2004), Ernst
and Young (2004), Ping (2003) and Pei and Shirai (2004).aJune 2003 annual GDP.
3 A wealth of literature exists on the relation between political interference and theperformance of the banking system. For example, see Brandt and Li (2003), Chang(2003), Cull and Xu (2000), Moreno (2002), Park and Sehrt (2001), Wei and Wang (1997)and Zhou (2004).
4 The solvency ratio has also been calculated for three of the four SOCBs and ten of thetwelve JSCBs.
CESifo Economic Studies, 52, 2/2006 309
China’s Banking Reform

total assets, is lower for Chinese banks than for Eastern European ones(2.22 percent compared with 5.93 percent in 2003, as shown in Figure 6),but much more so for non-interest income (Figure 7). The efficiencyof Chinese banks, measured by the cost to income, is actually better,(51.68 percent compared with 62.27 percent in the same year), althoughit is basically explained by lower wages. In fact, other measuresof efficiency, such as pre-provision profit over employees generallyranks EU banks better than Chinese. Besides the lower operating income,the difference in profitability is mainly explained by the much largeramounts of provisions and write-offs, stemming from the very low assetquality. In fact, provisions and write-offs, apart from taxes, reduceChinese banks’ net income to only 11.7 percent of the pre-provisionprofits in 2003, compared with 56.6 percent for Eastern Europeanbanks. Tables A2, A3 and A6 in Appendix 1 depict the evolutionof assets, liabilities and income and expenditure for different types ofChinese banks.The Sixth feature is that the state-ownership is pervasive and corporate
governance is very weak. The root of this problem is governmentintervention, which inhibits banks allocating their assets according to
Equity/Assets 2003
4.34 4.383.55
10.5
0123456789
101112
Total SOCBs JSCBs EasternEurope
Perc
enta
ge (%
)
Solvency ratio in 2003a
6.73 6.467.74
12.35
0
2
4
6
8
10
12
14
Total SOCBs JSCBs EasternEurope
Perc
enta
ge (%
)
aAccording to Basel I. Total and SOCBs figures are assesed excluding ABC due to data limitations. Figures from Eastern Europe from ECB (2004).Source: Bankscope
Figure 4 Capitalization indicators
Source: Bankscope
ROE in 2003
3.051.73
8.07
1
13.57
0
4
8
12
16
Total SOCBs JSCBs Policybanks
EasternEurope
Perc
enta
ge (%
)ROA in 2003
0.14 0.080.29
0.03
1.43
0.0
0.5
1.0
1.5
Total SOCBs JSCBs Policybanks
EasternEurope
Perc
enta
ge (%
)
Figure 5 Profitability indicators
310 CESifo Economic Studies, 52, 2/2006
A. Garcıa-Herrero et al.

market criteria.5 This is particularly true for the SOCBs. The SOCBs lack
the basic attributes of a profit-making bank. In fact, they do not have
clearly identifiable owners, or, until very recently, the board of directors
or specialized organs for monitoring management. They only have an
external board of supervisors—as all Chinese companies—which monitors
conformity with banking law and regulations, but has no role in the
governance or oversight of bank management. Banks are accountable only
to the government (usually the Ministry of Finance) and disclosure
requirements are minimal. Finally, the management has traditionally been
selected from the ministerial system and has remained subject to the close
control of the party. The JSCBs do not have the same legacy as SOCBs
so that their management has a higher commitment to shareholder value
although they are still very much influenced by local governments and
government-controlled enterprises given their large participation in the
capital of most of these institutions. The JSCBs have also introduced
5 The problem of government intervention has been well-documented in La Porta, Lopez-De-Silanes and Shleifer (2002) and Sapienza (2004).
Source: Bankscope
Operating income/assets in 2003
2.22 2.15 2.071.19
5.93
0.01.02.03.04.05.06.07.0
Total SOCBs JSCBs Policybanks
EasternEurope
Perc
enta
ge (%
)Cost to income
51.68 47.87 44.71
67.22 62.27
0
20
40
60
80
100
Total SOCBs JSCBs Policybanks
EasternEurope
Perc
enta
ge (%
)
Figure 6 Efficiency indicators
Source: Bankscope
Net non-interest income/operating income in 2003
19.1812.52
7.290.35
42.87
05
101520253035404550
Total SOCBs JSCBs Policybanks
EasternEurope
Perc
enta
ge (%
)Net interest income/operating income in 2003
80.82 87.48 92.71 99.65
57.13
0
25
50
75
100
125
Total SOCBs JSCBs Policybanks
EasternEurope
Perc
enta
ge (%
)
Figure 7 Source of income
CESifo Economic Studies, 52, 2/2006 311
China’s Banking Reform

improvements in the procedures for granting credit and risk management.Some of the largest CCBs are in a similar position to JSCBs, but notthe small ones which still resemble the UCCs. Credit cooperatives arecharacterized by an even weaker governance than SOCBs, since they aresubject to direct control from local governments.The last feature is the poor institutional framework of the banking
system. This is featured by a rather loose regulation and supervision,particularly as regards enforcement. Furthermore, the regulatory bodies,as well as the central bank, are dependent on the party’s decisions. The
lack of enforcement power from the supervisory part helps explain thevery limited improvement in corporate governance. Additional weaknessesare the lack of a bankruptcy law, a national credit bureau and a smoothfunctioning of the payment systems.
3 Steps taken in banking reform
The reform of the Chinese banking system started with an institutionalshake-up, as was generally the case in transition economies. The first andthe foremost important step was the substitution in 1984, of a monobank
system with a multi-tiered one, in which central banking functions wereseparated from the rest. The second step was the separation of commercialbanking activities from those specially geared towards economic develop-ment. To this end, policy lending banks were established in 1994 in orderto take over from SOCBs projects for development purposes and a newCommercial Banking Law was approved in 1995 to regulate commercialbanks. Third, the institutional design of the People’s Bank of China (PBC)was strengthened through a new charter in 1995, where its three mainresponsibilities were: monetary stability, banking supervision and over-sight of the payments system. The new charter, however, did not grantthe PBC independence from the State Council. Finally, responsibilitiesfor monetary policy and banking supervision were separated with the
creation of the CBRC in 2003.In addition to the institutional shake-up, China’s bank reform has been
based upon three main pillars: (i) bank restructuring, through the cleaning
up of NPLs and recapitalization; (ii) the reduction of governmentinterference in the system, through quantity and price liberalization aswell as opening up to the foreign competition and (iii) improved regulationand supervision.
3.1 Restructuring
Bank restructuring has probably been the most important pillar of bankreform since poor asset quality, coupled with very low capitalization,
312 CESifo Economic Studies, 52, 2/2006
A. Garcıa-Herrero et al.

was a very pressing problem. Bank restructuring has, until now, mainly
focused on SOCBs but there have also been some measures for credit
cooperatives. This section concentrates on SOCBs, given their systemic
natures. The SOCBs’ restructuring process has not been linear but
in waves. Three can be clearly identified, each of which with two
clearly differentiated steps: first a capital injection and, second, the
clean-up of NPLs.
The three restructuring waves for SOCBs
The first wave started in 1998, with an injection of the equivalent of
USD 33 billion in Renminbi (RMB) into the four SOCBs. The operation
started with a reduction in the reserve requirement which freed liquidity
for the banks to acquire government paper. The government transferred
again the receipts of this purchase to these banks in the form of fresh
capital. This operation was followed, in 1999–2000, by the transfer—at
book value—of NPLs from the four SOCBs6 to the four newly created
Asset Management Companies (AMCs) for the equivalent of USD 170
billion (more details on the functioning of these AMCs are given in the
next section).The second wave started in December 2003 with USD 22.5 billion
capital injections in the two best-performing SOCBs, namely the China
Construction Bank (CCB) and the Bank of China (BoC).7 These injections
came directly from the country’s official international reserves, through
the transfer of rights of ownership of US government bonds. These have
not been converted into RMB yet because of imposed restrictions. Since
each bank’s existing capital was mainly used to provision or write-off,
the equivalent of USD 23.4 billion in NPLs, this operation led to a very
marginal increase in capitalization while asset quality did improve
substantially. In June 2004, the equivalent of USD 15.6 billion and
18.1 billion in NPLs was auctioned from CCB and BoC, respectively, to
AMCs at 50 percent of the face value. The provisions accumulated with
the capital injections were used to write-off the other 50 percent of the
value. Cinda, the most active AMC won the auction by promising a 30
percent recovery rate. In addition, CCB and BoC increased their Tier II
capital by issuing subordinated debt for the equivalent of USD 4.8 billion
and 7.3 billion, respectively. Finally, CCB listed part of its shares in
Hong Kong in October 2005 and the listing of the BoC has been
6 NPLs were also transferred from one policy bank (China Development Bank).7 Table A7 in Appendix 1 gives details of NPLs at each SOCB.
CESifo Economic Studies, 52, 2/2006 313
China’s Banking Reform

announced for 2006 and a state-owned investment company has beencreated to organize the listing. Chinese authorities have expressed interest
in strategic investors entering these banks’ capital in order to diversifyownership and improve management quality. This has been shown bythe Bank of America’s recent acquisition of a 9 percent stake of CCB
(amounting to USD 2.5 billion), before the actual listing. This has beenfollowed by an additional USD 1 billion stake in CCB by Singapore’sstate-owned financial holding, Temasek.The third restructuring wave started in April 2005 with the injection
of USD 15 billion into the Industrial Commercial Bank (ICB). As for thesecond wave, these funds came from the official international reservesand have not been converted into RMB. Although the share of NPLs
in this bank is much larger than in the previously restructured ones,only USD 9 billion of the previous capital was used to provision NPLswhile the remaining USD 15 billion was retained in equity (i.e. total equity
is now USD 30 billion). The restructuring continued in June 2005 withthe approval of an NPL disposal of USD 85.5 billion to AMCs and theissuance of USD 12.1 billion in subordinated debt. In the same way as
CCB and BoC did, ICB plans to be listed in 2006 or 2007.8
In these three waves, an estimated 20–24 percent of the 2004 GDP hasbeen injected in the banking system,9 either as capital or as a substituteof NPLs. This amounts to over 110 percent of the SOCBs’ capital in
injections.
The NPLs’ disposal
As previously mentioned, the Chinese authorities established a number
of AMCs where NPLs from SOCBs have been transferred and their staffseconded. AMCs are legally independent agencies with a very broadmandate, namely collecting NPLs, restructuring them or converting them
into equity. They are also responsible for issuing bonds and borrowingfrom financial institutions to pay for the NPLs they receive. Finally, theyare also in charge of restructuring SOEs and recommending companies
for listing (Pei and Shirai 2004).The original idea was to assign one AMC for each SOCB. The
separation of NPL recoveries depending on the bank of origin was
8 The transfer of NPLs to an AMC and the issuance of subordinated debt are still pending.9 If we assume that the purchase of NPLs in the third wave (i.e. from ICB) is carried
out at face value as in the first restructuring wave, the estimated cost is 23.5 percent of2004 GDP. If it is done at 50 percent value as in the second wave, the cost goes down to20.7 percent of GDP.
314 CESifo Economic Studies, 52, 2/2006
A. Garcıa-Herrero et al.

preferred by the Chinese authorities for several reasons. First, the averagesize of loans seemed to be small and the clients widely dispersed, makingthe recovery of NPLs more cumbersome. Second, the specialization ofSOCBs, at least in their origin, meant that economies of scale could berather limited.10 In reality, banks are no longer as specialized as they usedto be and loans are sometimes very large, which might explain why thisseparate model has evolved into an auction, where AMCs bid to receiveadditional NPLs.In the first restructuring wave, each AMC received NPLs from its
respective SOCB at face value for a total amount equivalent to 8 percentof GDP (Table 2) and issued a 10 year bond with an annual 2.25 percentcoupon for 83 percent of that amount and paid the remaining 17 percentin cash. In the second restructuring wave, auctions had been used totransfer NPLs. The action implied that the highest bidding AMCs,in terms of recovery value, namely Cinda, received the NPLs. In the thirdwave, a part of the NPLs were transferred to the Ministry of Finance,11
(USD 30 billion) and another was bought by the PBC at face value (USD55 billion). The PBC, then, auctioned them at 26 percent of that value tothe AMCs.Excluding the third wave, which is still ongoing, the amount of NPLs
which has been restructured or disposed of hovers around 50 percent ofthe total loans transferred. From the restructured (resolved) loans, only20 percent of their nominal value has been cashed, which implies thatonly 10 percent of the nominal value of the NPLs transferred has beenrecovered. Only a marginal part of these NPLs has been securitized orpurchased by foreign investors. Finally, the government has set the end of2006 as deadline for the AMCs to work out all NPLs.
Other restructuring efforts
The other restructuring steps taken by the Chinese authorities concernthe small financial institutions. Credit cooperatives, as well as Trustand Investment Corporations (TICs), underwent a consolidation from2000 to 2002 through closures and mergers at the provincial level.In August 2003, given the undercapitalization of rural cooperatives andtheir incapability to rejuvenate the rural economy, additional measureswere introduced with pilot projects and extended nationwide in June 2004.
10 For this reason, the main staff members of each AMC are generally seconded from therelevant SOCB.
11 The Ministry of Finance seems to have taken the responsibility of covering the possibleshortfall of revenues by the AMCs with the income taxes and dividends of ICB.
CESifo Economic Studies, 52, 2/2006 315
China’s Banking Reform

Table 2 AMCs disposal of NPLs at March 2005
AMC SOCBAssets transferred(USD billions)
Share of banksloans outstanding(% at end-1998)
NPLresolved
NPLresolved(%)
Cashrecovery
Cashrecovery(%)
Orient asset management BoC 32.3 20.4 12.9 39.9 2.9 22.8Great Wall asset management ABC 41.8 24.6 25.8 61.8 2.7 10.4
Cinda asset management CCB 45.0 21.7 18.56 41.2 6.2 33.6Huarong asset management ICBC 49.2 17.9 25.9 52.6 5.1 19.9Total 168.3 20.7 83.2 49.4 16.9 20.5
Note: in USD billions at March 2005.
Source: PBC, CRBC, annual reports, BIS working paper No. 115.
316
CESifo
Economic
Studies,
52,2/2006
A.Garcıa
-Herrero
etal.

In particular, credit cooperatives were given specific milestone objectives
which, if complied with, would allow them to receive new capital
injections, as well as tax-breaks and subsidies, from the PBC or the local
government. Otherwise loss-making institutions will need to be closed.
The total number of rural credit cooperatives (RCCs) is targeted to be
reduced from 30 000 in 2004 to around 10 000 by the end of 2007. Until
now, the amount of government funds injected into credit cooperatives
hovers around USD 40 billion.Notwithstanding the restructuring, the government control on the credit
allowances to farmers remains tight, given the importance attached to
raising rural income. The second programmed step in the restructuring of
credit cooperatives is clarifying their ownership structure and improving
their management capacity. The longer-term objective is the consolidation
of credit cooperatives to no more than 2000 (from over 32000 at the end
of 2004) reaching the necessary capitalization level and providing enough
credit to the rural sector.In parallel to the credit cooperatives, the CBRC announced it would
move ahead with the reforms of other types of financial institutions,
including policy banks and AMCs. As for AMCs, foreign firms will be
allowed to compete with, and ultimately buy stakes in China’s AMCs.
3.2 Financial liberalization
Financial liberalization is another important pillar of bank reform in
China. Having been a planned economy for so long, government
intervention in the Chinese banking system was massive and still is, in
certain aspects. Liberalization efforts have gone in several directions: first,
introducing market practices in the functioning of the banking system;
second, freeing interest rates; third, opening up to foreign competition
and, finally, liberalizing exchange rate controls, which affect banks’
transactions with the rest of the world.
Introducing market practices
Reducing the government intervention in the banking system started
in the 1990s with a number of different actions. An important one
was the reduction of reserve requirements from 20 to 8 percent in 1998 and
again to 6 percent in 1999.12 In addition, the remuneration of excess
reserves was lowered to discourage banks from hoarding liquid assets
and encourage them to manage their assets. The last reduction took
place in March 2005 (from 1.62 to 0.99 percent). This has implied a steady
12 More recently, there was an increase to 7 percent in September 2003 and to 7.5 percent inApril 2004.
CESifo Economic Studies, 52, 2/2006 317
China’s Banking Reform

reduction in liquid assets although they still remain at relatively high levels(Table A2 in Appendix 1).In parallel, SOCBs were given more responsibility for their lending
decisions and some of their credit quotas were removed. Anotherimportant step was taken in 1999, when government interference incommercial lending was forbidden, at least in formal terms, and privatecapital was allowed to enter JSCBs and CCBs.
Interest rate liberalization
Interest rate liberalization is an important element of China’s effortsto enhance the role of market forces in resource allocation. It is alsoa prerequisite for increasing the competitiveness of financial institutions,introducing market-based monetary instruments and improving themonetary transmission mechanism.The approach towards interest rate liberalization has been gradual
and is not yet completed. As for the sequencing, interest rates in moneymarkets and bond markets were liberalized first, followed by the gradualliberalization of the interest rates of loans and, only later, deposits. Thevery first measure was taken in 1996, when the interest rates in the inter-bank market were liberalized. In 1997, the interest rate in the bond repomarket was also freed from controls and the issuing rate of governmentbonds started to be determined by market forces in 1998. Controls onforeign currency lending rates and large-value foreign currency depositrates started to be removed in 2000. As for domestic currency transactions,a corridor was established in 1996 for RMB loans, which was graduallywidened until the upper limit was lifted in October 2004, except for creditcooperatives. In 1999, interest rates on long-term large-value RMBdeposits started to be liberalized on a gradual basis. In October 2004, thelower limit on the interest rate of all RMB deposits was lifted but not theupper limit (Table A8 in Appendix 1 offers additional details on interestrate liberalization). The PBC has announced additional measures, such aseliminating the upper limit on RMB loans for credit cooperatives andabolishing the existing lower limit on lending rates for all institutions;it also intends to eliminate the upper limit for all RMB deposits andliberalize interest rates on remaining foreign currency deposits (small-value with maturity less than 1 year) at some point in time. In this context,the PBC has also announced the introduction of market-based monetarypolicy instruments.In the current setting, the liberalization of the ceiling on the lending
rate and of the floor on the deposit rate implies no limit as to how largethe spread between the lending and deposit rate, but a clear one on howsmall it can be, i.e. the difference between the reference lending anddeposit rates. This difference hovered at 330 basis points (Figure 8) until
318 CESifo Economic Studies, 52, 2/2006
A. Garcıa-Herrero et al.

April 2006, when was widened in 27 basic points, and offers a safe margin
for banks to maintain a relatively high net interest margin.At the same time, nominal lending and deposit rates have fallen
substantially in the last few years together with real lending rates, which
had reached relatively high levels in the first compasses of the reform,
as double-digit inflation was being controlled. In late 2004, real
lending rates have started to increase again, as a consequence of a more
restrictive monetary policy stance, but still remain relatively low, well
below 4 percent (Figure 9).
Opening up to foreign competition
A crucial milestone in the financial liberalization process was the
conclusion of the negotiations for China’s accession to the World Trade
Organization (WTO) in late 2001. The commitments agreed under WTO
imply the full opening up of the Chinese banking system to foreign
affiliates by the end of 2006, but the approach followed has been very
gradual and cautious. At the beginning, foreign banks were only allowed
to carry out foreign-currency transactions. As a second step, foreign banks
were authorized to offer local currency services to foreign enterprises
and individuals, albeit with geographical restrictions (starting with
the richest regions13), high minimum capital requirements and tight
13 In Shanghai and Shenzhen, as special economic areas, interest rates were liberalized forforeign companies and individuals even before becoming a WTO member, in 1996.
0
2
4
6
8
10
12
14
16
1995 1996 1997 1998 1999 2000 2001 2002 2003 2004 2005
Perc
enta
ge (%
)
Reference rate on deposits (1 year) Reference rate on loans (1 year)Ceiling rate on loans (1 year) Lowest rate on loans (1 year)Lowest rate on deposits (1 year)
Source: CEIC
330 bp
Figure 8 Lending and deposit rates
CESifo Economic Studies, 52, 2/2006 319
China’s Banking Reform

prudential norms, compared with international standards (Table 3). Third,in 2003, the wholesale market in domestic currency (i.e. to Chineseenterprises) was opened to foreign competition for a relatively largenumber of provinces. Finally, from the end of 2006 onwards, foreignbanks will be able to offer all banking services in local currency in allprovinces and even to Chinese households. In addition, the Chineseauthorities have recently announced measures to facilitate the entry offoreign affiliates, such as lifting the ban to open more than one branch peryear and reducing minimum set-up capital requirements for the establish-ment of new branch. Since the signing of WTO in 2001, foreign bankbranches have increased from 157 to 192 in 2004, most of which from theAsian origin (mostly Taiwan, South Korea and Hong Kong). The numberof representative offices also rose from 184 in 2001 to 223 in 2004.Although WTO commitments do not deal directly with a foreign
acquisition of a stake from a Chinese bank, Chinese authorities haveincreased the limit on the bank’s foreign ownership from 15 to 20 percentof the total capital for one single investor, and to 25 percent for the jointparticipation of all foreign investors, although this latter ceiling does not
−15%
−10%
−5%
0%
Perc
enta
ge (%
)
5%
10%
15%
1995 1996 1997 1998 1999 2000 2001 2002 2003 2004 2005
6 months 1 year 1–3 years
3–5 years 5–10 years
Source: CEIC
Figure 9 Real interest rates on loans (reference)
320 CESifo Economic Studies, 52, 2/2006
A. Garcıa-Herrero et al.

Table 3 Timetable for opening the financial sector under WTO commitments
Foreign banks can begin to offer services in domestic currency to
By geographyForeign companies andforeign individuals Chinese domestic companies Chinese individuals
Open Shanghai, Shenzen 1996 2003 2006
Open Tianjing, Dalian 2001 2003 2006Open Guangzho, Qingdao, Nanjing, Wuhan 2002 2003 2006Open Jinan, Fuzhou, Chengdu, Chongqing 2003 2003 2006
Open Kunming, Zhuhai, Beijing, Amoy 2004 2004 2006Open Swatow, Ningbo, Shenyang, Xian 2005 2005 2006Lift all geographical restrictions 2006 2006 2006
Source: WTO and Deutsche Bank Reasearch (2004).
Banking services in foreign currency were liberalized in all regions immediately after WTO accession.
CESifo
Economic
Studies,
52,2/2006
321
China’s
BankingRefo
rm

seem to be applied in listed banks. This reflects the general perception thatthe system needs fresh capital and highly qualified bank management. Asof October 2005, seventeen foreign banks have already entered the capitalof Chinese banks and their share in the banks’ capital—albeit low—is
increasing (CBRC, 2005). Finally, in October 2005, one of the four SOCBs,the CCB made an initial public offering for USD 9.2 billion. According toMa (2006), by late 2005 the total declared foreign direct investment (FDI) inChinese banks reached USD 16.5 billion, representing some 15 percent ofthe banking sector’s core capital. Table A9 in Appendix 1 offers a list of thepurchases by foreigners and their capital share.
Capital account liberalization
Capital account liberalization has been even more gradual and remainsmore incomplete than the rest of the liberalization process. Although moredetails are offered in Tables A10 and A11 in Appendix 1, the situation, in
a nutshell, is that capital inflows are much more liberalized than outflows.FDI abroad, portfolio outflows and even the repayment of creditoperations need to be authorized by the State Administration ofForeign Exchange (SAFE). This, together with the fact that residenttransactions in foreign currency are strongly regulated, explains whyChinese institutions, including banks, have limited foreign exchangepositions although they appear to have increased very fast in the last fewyears, above 50 percent on average (Table 4). Nonetheless, in May 2006,
Chinese residents have been allowed to invest in foreign financial marketsthrough Chinese banks. Banks are long in foreign currency, with netforeign assets equivalent to 6.1 percent of GDP in 2003, while corporatesare short, with net foreign liabilities equivalent to 10.8 percent in 2003.14
3.3 Regulation and supervision
The liberalization and restructuring measures have been accompaniedby improvements in regulation. In 1995, together with the assignmentto the PBC of its main objectives, capital adequacy requirements wereintroduced in all commercial banks, as well as prudential ratios, namely
loan to deposit ones and assets to liquid liabilities. These prudential ratios,however, were a formality. In 2002, the PBC, still the Chinese regulatoruntil 2003, established the international five-tier loan classificationalthough it was not made fully compulsory. The reasons for this weak
14 Households can only be long since they can deposit money in foreign currency but notborrow. There is a global limit for the households’ deposits in foreign currency, namely 5percent of the total deposits.
322 CESifo Economic Studies, 52, 2/2006
A. Garcıa-Herrero et al.

situation were the PBC’s lack of sanctioning power and the decentralizednature of its regulatory and supervisory functions. In fact, the bulk of thework was conducted by the local offices, which themselves had to reportto the local government.With the establishment of the CBRC in 2003, there were several
improvements. These can be divided into asset quality, capital adequacyand general supervisory matters.On asset quality, the five-tier loan classification system was enhanced
and made fully compulsory for all the banks by the end of 2005. In thesame vein, full provisioning of the NPLs will need to be introduced bythe end of 2008. In 2005, the CBRC adopted three new tools to strengthenthe monitoring of the banks’ NPLs, namely making peer groupcomparison, assessing the deviation of the accuracy of loan classificationsand tracking the migration of loans of different categories. Finally, sincethe early 2006, related party lending has been limited, which is quiteimportant given the concentration of lending in the corporate sector and,in many cases, large SOEs.On capital adequacy, after an evaluation of the compliance with the
Basel Core Principles for Effective Banking Supervision, the 8 percent
Table 4 China: Foreign currency exposures of financial and corporate sectors
(USD billions)
2001 2002 2003
Net foreign exchange-denominated assetsof the banking systema
31 60 57
Of which, net foreign assets 85 108 85
(in percent of GDP) 7.3 8.5 6.1Net domestic foreign currency assets �54 �48 �19Banks’ foreign currency loans to domestic residents 81 103 130
(in percent of GDP) 6.9 8.1 9.2Net foreign currency exposure of corporate sector �103 �121 �150Corporates’ foreign currency assetsb 45 52 52
Corporates’ foreign currency liabilitiesc 149 172 202Total external debt 170 171 194Of which: short-term 44 48 73
Of which: Corporate 68 70 82
aSum of net foreign assets (net claims against foreign residents) and net foreign currency-
denominated assets against domestic residents.bThe estimates are based on corporate foreign currency deposits in domestic banks.cSum of corporate external debt and domestic foreign currency loans.
Source: Prasad et al. (2005).
CESifo Economic Studies, 52, 2/2006 323
China’s Banking Reform

minimum capital adequacy ratio, defined in Basel I terms, was introducedand a 4 percent minimum total capital. These ratios will need to befully complied with by 2007. Moreover, bank regulation has adopteda risk-based framework, with guidelines for credit risk, market risk andoperational risk. In addition, a CAMEL15-type risk assessment system hasbeen introduced with quantitative and qualitative criteria for capital, assetquality, management competence, liquidity and profitability. For the timebeing, however, this system is being applied only to JSCBs.Finally, enforcement has begun to be taken into consideration since
some sanctions have been imposed. The latter has been facilitated by theintroduction of legal protection for supervisors, which they previouslylacked. In addition, the CBRC has embarked on a large-scope programmeof capacity building, necessary to conduct on-site and off-site inspections.Efforts have also been made to improve bank corporate governance,
through the creation of shareholder boards with outside directors butthis is only a very small step, as shall be explained later. Finally,there is now some disclosure of information, particularly for listed banks,which must go through an auditing process as well as the publicationof more comprehensive balance sheets and income statements. The CBRC,itself, is enhancing its transparency through the publication of individualbank data, including NPLs.
4 An assessment of the banking reform
so far and potential impact
From the aforementioned information, there is no doubt about thecommitment of the Chinese authorities to bank reform and the measurestaken seem to go in the right direction. However, these measures do notseem to be comprehensive enough and several important ones are missing,particularly as regards the incentive structure. The results in terms of bankperformance are relatively good in some aspects, such as asset quality forthe restructured SOCBs, but not in others, as we shall explain.
4.1 Bank restructuring
So far, the restructuring process has managed to improve asset quality butthe results seem to be weaker in terms of capitalization. The solvencyratio, calculated according to Basel I, was only 6.73 percent16 in 2003 andthe ratio of equity to assets remained at similar levels than before the
15 CAMEl is the acronym Capital adequacy, Asset quality, Mangement, Earnings,Liquidity and Sensitivity to market risks.
16 Due to data limitations, this ratio has been calculated for the four SOCBs, except for theABC, and ten of the twelve JSCBs.
324 CESifo Economic Studies, 52, 2/2006
A. Garcıa-Herrero et al.

reform started (namely 4.3 percent in 2003). The capital injections carriedout by the government in 1998 (USD 33 million) had an immediatepositive impact on the ratio equity to assets of the banking system (from4.54 percent in 1997 to 6.03 percent in 1998), but this ratio fell again evenbelow the 1997 levels. This is because, in the second restructuring wave,most of the capital injection was directed to improving asset qualityand the third wave has involved relatively few funds. In addition, therehas been very little private or public capital raised otherwise. In 2004,however, the situation has improved for the restructured SOCBs (data notavailable yet for the whole banking system).The CCB and the BoC have received enough public funds to maintain
adequate solvency levels; measured in Basel I terms (Figure 10). Instead,the ICB and, much more so, The Agricultural Bank of China (ABC) stillsuffer from much poorer solvency, higher NPLs and very low provisioningratios, both in ratios and levels. We have estimated the capitalizationneeds of these two SOCBs, so as to reach the solvency and asset qualitytargeted by the Chinese authorities for 2005. These amount to USD150 billion (or the equivalent of 9.7 percent of 2004 GDP), if we assumethe same recovery rate for the NPLs as that obtained by AMCs for theother two restructured SOCBs (Tables A12 and A13 in Appendix 1).17
Another point to take into account is that the capital injected into SOCBsin the second and third wave is in USD, which implies an exchange raterisk, particularly considering the larger probability of an RMB apprecia-tion. In fact, the recent 2.1 percent revaluation led to a loss of RMB9.8 billion.As for the asset quality, the three waves of restructuring have reduced
NPLs in three of the four SOCBs (Table 1 and A7 in Appendix 1). Thiswelcome development, though, needs to be seen in the context of avery rapid loan growth. In fact, apart from the government injections,the improvement in asset quality is mainly explained by the increase in thedenominator (bank loans), as shown in Figure 11.The problem is that there are reasons to think that these new loans may
end up into NPLs. First, the criteria for granting loans have not changedsubstantially, as banks’ ownership structure is virtually the same and thereform of SOEs still has a long way to go. Second, the reported NPL ratiofor loans extended after 2000 is only 2.5 percent, dramatically lower thanthe NPL ratio for older loans. Third, the slow-down of the economy—particularly if abrupt—would convert many loans in bad ones. Fourth,the total amount of NPLs in the financial system (i.e. counting what
17 This is within the estimates provided by Standard and Poors (2004) of USD 110–190billion.
CESifo Economic Studies, 52, 2/2006 325
China’s Banking Reform

has been transferred to the AMCs and not yet recovered) has not fallenmuch since AMCs have disposed of only half of the NPLs transferred.The latter is due to several factors: first, the incentive structure of AMCs,which are evaluated in terms of the recovery value and not so muchthe speed at which assets are disposed of or recovered; second, the poorlegal framework under which they operate; third, the lack of marketinstruments to dispose of NPLs. An additional concern is that only thebest assets have been sold, which raises doubts about the recovery capacityof AMCs in the medium term and the costs for the Chinese authorities.Finally, the way in which the asset disposal has been designed raisesconcerns for SOCBs profitability and, eventually, even solvency. This isbecause AMCs—which are formally independent institutions—havepurchased NPLs either at face value or at a 50 percent while they areobtaining a much lower recovery rate. If government support to AMCs
(a) BoC and CCB figures as of June 2004; (b) ABC figures as of end-2003; (c) ICB figures as of end-2003.
Source: Bankscope, CBRC and Fitch.
NPL/loans end-2004 (a)
26,82
5,46 3,08
19,47
0
25
50
ABC BoC CCB ICB ABC BoC CCB ICB
ABC BoC CCB ICB ABC BoC CCB ICB
ABC BoC CCB ICB ABC BoC CCB ICB
Perc
enta
ge (%
)NPL as of June 2004 (b)
83
148
87
0
25
50
75
100
USD
billi
ons
Loan loss reserves/NPLs as of June 2004 (b)
4,13
76,31
40,84
3,26
0
25
50
75
100
Perc
enta
ge (%
)
Loan loss reserves end-2003
3
32
10
2
0
15
30
45
USD
billi
ons
Equity to assets end-2003
3,95
5,48 5,24
3,25
0
1
2
3
4
5
6
Perc
enta
ge (%
)
Solvency ratio end-2004 (c)
9,70
11,95
5,50
-0
2
4
6
8
10
12
14
Perc
enta
ge (%
)
Figure 10 Assets quality, provisions and solvency on SOCBs
326 CESifo Economic Studies, 52, 2/2006
A. Garcıa-Herrero et al.

were not to materialize, these agencies will find it virtually impossible
to pay for the principal of the bonds now at SOCBs’ balance sheets.
Even the payments of the interest coupon—which are anyhow low—are
doubtful.18 This support, however, should eventually exist, since the whole
reform process would be derailed otherwise.
4.2 Liberalization process
Although government interference has been reduced with the liberali-
zation process, it is still very large compared with the international
standards. The share of SOCBs has fallen and that of JSCBs has risen,
but even the latter are only partially privatized.19 Furthermore, foreign
participation is still very limited in most JSCBs.Competition is still weak, particularly among the largest banks. This is
due to several factors. First the price and quantity controls have not been
fully lifted and the opening up to foreign competition has proceeded very
cautiously. Foreign competition is limited to the wholesale business
and in few areas. The full opening up, following WTO commitments,
at the end of 2006 will change the picture only slightly; the country’s
huge size will make it difficult for banks to compete through Greenfield
18 Reportedly, not all interests on these AMC bonds have been paid to SOCBs.19 According to the CBRC, the largest private share is 80 per cent for the case of China
Minsheng.
0
200
400
600
800
1000
1200
1400
1999 2000 2001 2002 2003 2004 mar-2005
USD
in b
illio
ns
0
5
10
15
20
25
30
Perc
enta
ge (%
)
NPL ratio
Source: CEIC
Total loans
Non-performing loans
Figure 11 Non-performing loans on SOCBs
CESifo Economic Studies, 52, 2/2006 327
China’s Banking Reform

investment and direct participation in Chinese banks, although it has beenfostered, remains limited. In fact, the announcement that SOCBs will belisted does not mean that foreign investors will be offered control. Second,the fast economic growth and, in particular the high investment rate,implies that there is an enormous amount of projects which need to befinanced. Thus, there is room for all the banks to make business. Third,the current upper limit on the deposit rate limits competition for deposits,particularly those highly sensitive to the return obtained. Finally, theexcessive liquidity of the banking system inhibits competition, so even theprogrammed full liberalization of the deposit rate might not increasecompetition in this setting.Regarding capital account liberalization, the relatively small percentage
of the banks’ foreign exchange transaction limits, for the time being,the risks related to sharp exchange rate swings. However, the fast increasein exposure in the last few years clearly hints at growing risks as economicopenness and capital account liberalization proceed. This is even more thecase if we consider that hedging instruments are limited; Chinese banksare not used to managing foreign exchange risk; and the regulator hasstill not developed strict prudential tools for foreign exchange risk.Furthermore, the fixed exchange regime may be understood as an implicitguarantee, inducing moral hazard and thus, a further build-up of risks,as has happened in other countries.
4.3 Regulation and supervision
Efforts have been huge given the starting conditions of Chinese regulatoryauthorities. However, it is not completely clear how China is going toensure a level playing field to all the banks. For example, there arequestions as to how the regulation imposing a minimum capital adequacyratio of 8 percent for all commercial banks will be enforced by the endof 2007, as programmed. We cannot expect ABC, credit cooperatives andeven some JSCBs to comply with it by that date unless they receive verylarge capital injections. As previously mentioned, for the remaining twoSOCBs, our estimate is USD 150 billion and that of credit cooperativesand CCBs could hover around USD 12 billion (around 9 billion for theformer and 3 billion for the latter). As for JSCBs, we estimate at least USD19 billion to reach a capital to assets ratio similar to that of the BoC andthe CCB, namely 6 percent (details on this estimate can be found inTable A12 in Appendix 1).One of the main objectives of strengthening regulation and supervision
was the introduction of a more cautious approach towards risk. Althoughit is difficult to draw conclusions from the available evidence, there aretwo facts which can hardly be reconciled with an improvement in risk
328 CESifo Economic Studies, 52, 2/2006
A. Garcıa-Herrero et al.

management. First, loan pricing by SOCBs does not seem to have changed(Podpiera 2006), despite the additional space provided by the liberali-zation of interest rates. Most loans are still contracted at, or even below,the PBC’s benchmark rate. Second, bank lending has continued to growrapidly (even if it has decelerated somewhat) and there has not been asubstantial change in the sector composition: as previously shown inFigure 3, lending for infrastructure projects has continued to grow atmuch faster rates than consumer lending or mortgages. Moreover,the attempts to improve corporate governance have not shown clearresults yet. The recently created shareholder boards are still a formalityand the practically full state-ownership biases the decisions taken by bankmanagers. Finally, Chinese banks are ill-equipped to adopt Basel II—eventhe second and third pillar as announced by the Chinese authorities—asthey are still struggling to adopt Basel I. The large share of low-ratedcorporate bonds in their balance sheets will increase their need foradditional capital under Basel II. In addition, operational risk willprobably be large because of poor internal controls.
4.4 General assessment of bank performance
In the years in which the reform has been ongoing, overall bankperformance has not clearly improved. This is also the case of JSCBs,considered some kind of laboratory of the reform because of their partialprivate ownership and market orientation, relative to SOCBs.As already mentioned, the most promising developments come from
asset quality but credit growth explains a good part of it.20 Another goodsignal is growing provisioning, although a large part comes from thegovernment recapitalization programmes and is still insufficient to coverNPLs (Figure 12). Developments in solvency have been less encouraging:the capital to asset ratio for the banking system as a whole has remainedpractically unchanged since the beginning of the reform (Figure 13).The JSCBs have reduced their capital to asset ratios, which is evenmore worrisome if we consider that they have relatively little Tier IIcapital.21 The reason behind this worrisome trend is the fast asset growth(nearly three times faster than the average) without recourse to additionalcapital.Finally, from the already low levels, profitability, measured in terms of
ROE, has generally declined. This is also the case for JSCBs (Figure 14).
20 In an empirical exercise with bank panel data, Garcıa-Herrero, Gavila and Santabarbara(2006) find that bank size, measured in terms of assets, tends to increase the NPL ratio.
21 The issuance of subordinated debt has been stepped up in 2004–2005.
CESifo Economic Studies, 52, 2/2006 329
China’s Banking Reform

There are some welcome reasons to explain the fall in profitability,
namely declining inflation and real interest rates as well as provisioning,
which have been found important determinants of profitability in an
empirical analysis for Chinese banks (Garcıa-Herrero, Gavila and
0
1
2
3
4
5
1997 1998 1999 2000 2001 2002 2003
Perc
enta
ge (%
)
Total
CCBs+other
JSCBs
Policy banks
SOCBs
Source: Bankscope
Figure 12 Percent change in loan loss reserve to gross loans by type ofinstitution
0
2
4
6
8
10
12
1997 1998 1999 2000 2001 2002 2003
Perc
enta
ge (%
)
Total
CCBs+other
JSCBs
Policy banksSOCBs
Source: Bankscope
Figure 13 Equity to assets
330 CESifo Economic Studies, 52, 2/2006
A. Garcıa-Herrero et al.

Santabarbara 2006). In the case of JSCBs, ROE has fallen, notwithstand-
ing their low capital to asset ratio and their relatively low cost to income
ratio,22 because they have experienced a reduction in interest income to
achieve a higher market share. Figure A3 in Appendix 1 show which are
the main factors behind the declining trend of ROA.In sum, the reform on the Chinese banking system has not brought
sizeable benefits so far except for asset quality, and doubts remain about
a possible build-up of new NPLs given the fast credit growth. This poor
assessment is valid not only for SOCBs, but also for JSCBs, and for the
banking system as a whole. In the case of JSCBs, the poor performance
might be due to the very limited private control of these banks or,
on a more optimistic tone, because it is too early to feel the benefits.
However, it could also be the case that the steps taken have not been bold
enough and more aggressive measures are needed to change the course
of events.
22 Garcıa-Herrero, Gavila and Santabarbara (2006) also find that capitalization andefficiency are significant determinants of the ROA.
−5
0
5
10
15
20
1997 1998 1999 2000 2001 2002 2003
Perc
enta
ge (%
)
Total
CCBs+other
JSCBs
Policy banks
SOCBs
Source: Bankscope
Figure 14 Return on equity (ROE)
CESifo Economic Studies, 52, 2/2006 331
China’s Banking Reform

5 Suggestions for future steps
5.1 An accelerated and more comprehensive reform strategy
Although the Chinese reform is going in the right direction, we argue thatit should be accelerated and made more comprehensive. We offer threemain reasons for this. First, the challenges that the Chinese economy facesare pressing, in terms of huge financing needs for such a dynamic economyand the commitment to open up to foreign competition by the end of 2006.Second, opportunities are also large, since China is considered to havea very attractive economy and foreign investors’ interest is enormous.Third, the costs of restructuring are bound to increase as time goes by.This is because SOEs—which are at the core of the NPL problem—willgenerally continue to accumulate losses unless restructured or closed andtherefore the flow of NPLs will continue. Finally, the reform, so far,has not managed to improve banks’ performance to an extent that we canbe sure that the process will not be derailed. The main risk in this regardis the huge pile-up of new loans, some of which could become non-performing in the future, particularly if the economy decelerates.The main objectives of this comprehensive reform should be: (i) raising
asset quality and solvency to international levels, as soon as possible,and maintaining them, notwithstanding the very fast growth of credit;(ii) transforming existing banks into viable, financially sound andindependent commercial institutions. The former requires a completerestructuring, coupled with improved corporate culture, risk management,supervision and, possibly a change in the ownership structure. For thelatter, apart from better corporate governance, complete financialliberalization is needed so that banks learn to take decisions on theirown and to manage risk. Finally, this second objective should also implychoosing a model for the Chinese banking system, in terms of institutionalfunctioning, size, structure and ownership.
5.2 On bank restructuring
The authorities seem to have embarked in the restructuring processwithout a clear diagnosis of the underlying causes of the problem. Or, ifsuch diagnosis exists, it has not been considered with the highest priority.It seems undeniable that government interference is behind the hugeaccumulation of NPLs. To solve the problem, two things seem crucial:first the completion of the restructuring of SOEs is needed at the fastestspeed possible; second, bold decisions are needed to improve corporategovernance and to reduce government control in the banking system.Good corporate governance requires strong in-house capability to priceand monitor credit risk, which is a challenge given the scarcity of humancapital in Chinese banks and finally, assessing interest and exchange risk
332 CESifo Economic Studies, 52, 2/2006
A. Garcıa-Herrero et al.

will become more relevant as financial liberalization moves on. In thisregard, the introduction of internal audit and external audit needs to beaccelerated and strengthened.As for the cleaning up of NPLs and the recapitalization of the banking
system, the current strategy is too piecemeal and is not time-bound.Chinese authorities should announce a precise timetable with specificdeadlines for NPL disposal and recapitalization up to Basel I solvencylevels for those banks deemed viable. The sooner the financial system isfreed from NPLs, the easier it will be to introduce good corporategovernance and risk management. The two, however, should go hand inhand, to avoid using the newly injected capital to grant loans under thesame criteria as before. In this regard, the currently very high interest offoreign investors in China should be profited from, since a larger share offoreign competition in the Chinese banking system would be of greatbenefit to change the incentive structure. The example of Central andEastern Europe is interesting in this regard since foreign banks were a keyrestructuring instrument.Independently, from a change in the ownership structure, the Chinese
authorities should take action to solve both the stock and the flowproblem. Removing inherited NPLs is important, but even more so freeingbanks from inherited bad clients; by nature, banking is a relationalbusiness and bad relations are hard to break. A key measure to tackle theflow problem is accelerating SOEs’ restructuring. Otherwise, the tightlinks between SOCBs and SOEs are bound to bring new NPLs. In thisregard, the government announcement that SOEs will not be bailed outfrom 2008 onwards is welcome. Besides, financial liberalization will obligethe banks to evaluate risk and price it properly, instead of taking theofficial lending rate as given. In this regard, risk management procedures,still at their infancy in China, need to be improved as fast as possible.This obviously requires capacity building at banks, which can be speededup through the participation of foreign investors in banks’ ownership.A new bankruptcy law—whose approval has been delayed in severalinstances—is also needed, to help restore debt-payment capacity amongviable firms and recover NPLs from banks and AMCs.As for the stock problem, the Chinese model, based on one AMC per
SOCB, is probably delaying the resolution of the NPL problem. In fact,in the absence of a monopolistic position, AMCs are obliged to competeoffering high recovery values. The fact that their position with largeborrowers is not strong probably delays recovery too. Another problem isthat the governmental nature of AMCs is not explicit so that they should,at least formally, care for profitability, probably delaying disposal.For the latter, an explicit government guarantee to AMCs would behighly welcome. Finally, fiscal cost considerations should not delay the
CESifo Economic Studies, 52, 2/2006 333
China’s Banking Reform

process: the longer it takes to solve the problem, the higher the cost will be.
Finally, the transfer of NPLs to solve the stock problem, should be
accompanied by enough capital injections to comply with the capitaladequacy ratio. This is not only necessary for the soundness of Chinese
banks but also probably to improve its profitability (as Garcıa-Herrero,
Gavila and Santabarbara 2006 show in an empirical study on thedeterminants of ROA for Chinese banks). The current approach based on
different restructuring waves, and starting with capital injections, does not
induce bank managers to strengthen the assessment of risks when granting
credit. The easiest way to improve this situation is to link recapitalizationto a change in ownership (i.e. privatization). Another, more difficult,
possibility is to set stringent rules for provisioning and improving asset
quality while forcing a change in corporate governance. Finally, the
substitution of NPLs with bonds issued by AMC appears as a goodrestructuring technique as long as AMCs are solvent or have a clear
government guarantee. Otherwise, banks may be facing new problems
when these bonds are due, or even before, if AMCs cannot recover enough
assets to pay for the annual interests of these bonds.Regarding privatization, only solvent and viable institutions should
be privatized. Otherwise, there is a risk that these banks can never be
profitable and that shareholder problems are bounced back to the public
sector. Not all privatization methods are equally effective in improvingcorporate governance. While initial public offerings (IPOs) may be
politically attractive, widely held ownership is unlikely to produce the
desired improvements in operations, management and controls that
a strategic investment by a strong financial institution would deliver.Options to ensure participation by a desirable strategic investor include
a sale by tender or an IPO, where a significant percentage is reserved for
a pre-qualified investor. The Chinese authorities seem to have followed
this path with the CCB, which is welcome but more might be needed inthe most difficult cases. This would imply the transfer of the control from
the State to the acquirer.In the Chinese case, it is important to note that controlling interest does
not necessarily imply majority ownership. The voting rights on the
investors’ shares vs. those retained by the government, can be structured in
such a way as to convey controlling influence to a minority stakeholder,
or explicit agreements can be made as part of the contract that the
investor will make appointments to key management and board positions.
Finally, even if the State retains control of banks, the same level-playing
field needs to be ensured between private (also foreign) and public banks.
This will be tackled later in the suggestions for improved regulation and
supervision.
334 CESifo Economic Studies, 52, 2/2006
A. Garcıa-Herrero et al.

5.3 On financial liberalization
China has taken a very cautious approach to liberalization but itfaces pressures to accelerate it from several fronts. First, the internationalcommunity is calling for exchange rate flexibility, which eventuallyneeds to be accompanied by deeper capital account liberalization.23
This might bring new opportunities, but also new risks, for the financialsystem. The major risk that the Chinese authorities perceive is ofcapital flight, which would imply a sharp drop in the deposits heldat Chinese commercial banks. Second, China has committed under theWTO to finalize the opening up of the banking system to foreigncompetition by 2006. Although this basically refers to greenfieldinvestment (which may take long to acquire a large dimension inChina’s huge market), it is still an important challenge for China’srelatively inefficient banks.As for the sequencing of liberalization, China has basically gone
by the handbook, starting with macroeconomic stabilization, followed bydomestic financial liberalization and leaving capital account liberalizationas the last step (McKinnon 1982). However, in China’s case, thecompletion of bank restructuring is needed to profit fully from financialliberalization. We see two reasons for this. First, the banks will probablynot use correctly the room offered by financial liberalization unless banks’incentive structure changes. In fact, the banks are not using the spacethey now have to increase the lending rate. In addition, the currently‘‘guaranteed’’ minimum interest rate spread—because of the floor on thelending rate and the ceiling on the deposit rate—contributes to a ratherlarge interest rate margin which could be reduced with full interest rateliberalization, particularly if competition increases. The potential addi-tional fall in profitability would call for an increase in the currently verylow capitalization of the Chinese banking system so as to counteractthis trend.24
As for the opening up, there is no doubt that foreign capital canhelp modernize the Chinese banking system, through better corporategovernance and risk management, in addition to fresh capital. To achievethis goal, however, its presence cannot be limited to representativeoffices or branches focused on niche businesses. They should becomea real competitive force in the intermediation of domestic savings.
23 Prasad, Rumbaugh and Wang (2005) argue that exchange rate flexibilization may comefirst, but they acknowledge that it needs to be followed up by capital accountliberalization.
24 Garcıa-Herrero, Gavila and Santabarbara (2006) find the equity to asset ratio to be a keydeterminant of profitability.
CESifo Economic Studies, 52, 2/2006 335
China’s Banking Reform
Given the country’s huge size, this can only be achieved, in a reasonablyshort time, by allowing foreign banks to obtain the control of some
Chinese financial institutions, as previously proposed.Finally, a successful opening of the capital account requires a change in
the way monetary and exchange rate policies are conducted. Monetaryinstruments that impose a high cost or administrative constraint on thebanks—as is the case with credit or interest rate ceilings or high non-remunerated reserve requirements—need to be substituted by market
instruments.
5.4 On regulation and supervision
Although the authorities have moved forward on this front, bolder steps
are needed. The main objectives should be: (i) to improve—or at leastmaintain—asset quality but also solvency and (ii) to ensure a level playingfield across different institutions.For the former, the current regulation on asset quality and solvency
should be enforced to all commercial banks and sanctions appliedwhen necessary. The recent major scandals in some SOCBs are a sign
of the need for coercion and sanctioning power, so that the experiencewill not be repeated. In addition, the regulator should encourage a radicalchange in the banks’ incentive structure, through better corporategovernance and reducing government intervention. This is clearly thekey since, in the current setting, regulators and owners are generally the
same. Apart from a change in the ownership structure, the regulatorhas a role to play by requesting to strengthen the functions of the boardof independent directors so that they are clearly charged with fiduciaryresponsibility for the public funds invested in the bank. Finally, better
bank management techniques need to be encouraged as well as a tightergrip on risk management. This should include exchange rate risk, given thecountry’s move towards more exchange rate flexibility and the graduallifting of foreign exchange controls.To ensure a level-playing field, banks should have a clear mandate
as to what their duties are when operating on a commercial basis.
This should include full insulation from political influence and be
subject to the same regulatory and supervisory regime. Such a mandate
should not only include SOCBs but also possibly, credit cooperatives.
Policy banks, as development banks, should also have clear rules
that they should abide by. In addition, accounting rules in line with
international standards are crucial to ensure a level playing field
as well as external and internal auditing. Finally, more disclosure,
starting with the regular publication of banks’ balance sheets and income
statements.
336 CESifo Economic Studies, 52, 2/2006
A. Garcıa-Herrero et al.

Other steps towards improving the institutional setting of the banking
system need to be taken swiftly, such as a better functioning of the
payment system, the creation of a credit register and a limited and explicit
deposit insurance system. The recent announcement of a government
compensation for individual deposits is welcome, but it could be defined
better. Finally, a bankruptcy law, which also deals with financial
institutions, needs to be established as soon as possible.All in all, it seems clear that the announcement of a comprehensive,
fast and time-bound reform strategy is urgently needed, where the
authorities should clarify their long-term view of the Chinese financial
sector and the steps they will take to achieve it, with precise deadlines.
For the reform to be comprehensive, a clear definition of responsibilities
for each Chinese agency involved would be highly welcome, as well as the
nomination of a single coordinator. As for the speed, the current reform
process seems too slow for the immediate challenges that China faces, so
that it risks being derailed. The strategy should not be that of ‘‘growing
out of the problem’’, as could be interpreted from the rapid growth in
bank lending. Finally, foreign players should be offered an important
role in the process since government intervention is at the origin of the
problem and there are not enough private investors in the country having
banking experience.
References
Brandt, L. and H. Li (2003), ‘‘Bank discrimination in transition
economies: ideology, information, or incentives?’’, Journal of
Comparative Economics 31, 387–413.
Bofit (2004), BOFIT Weekly, January–July, Bank of Finland. (2004).
China Review, Vols 1 and 2, May, Bank of Finland.
CBRC (2005), ‘‘Latest Developments in China’s Banking Reform,
Opening-up and Supervision’’, December.
Chang, C. (2003), ‘‘Progress and peril in China’s modern economy’’,
Federal Reserve Bank Of Minneapolis, The Region 17, 26–30.
Cull, R and L.C. Xu (2000), ‘‘Bureaucrats, state banks, and the efficiency
of credit allocation: the experience of Chinese state-owned enterprises’’,
Journal of Comparative Economics 28, 1–31.
Demirgurc-Kunt, A. and E. Detragiache (1998), ‘‘Financial liberalization
and financial fragility’’, IMF Working Papers 98/83, International
Monetary Fund.
Deutsche Bank Research (2004), China’s Financial Sector: Institutional
Framework and Main Challenges, January.
CESifo Economic Studies, 52, 2/2006 337
China’s Banking Reform

ECB (2004), ‘‘EU Banking Sector Stability’’.
Ernst and Young (2004), ‘‘Global NPL Report 2004’’.
Fitch’s Bankscope International Bank Database.
Garcıa-Herrero A., and D. Santabarbara (2004), Where is the Chinese
Banking System Going with the Ongoing Reform, Documento
Ocasional No. 0406, Banco de Espana.
Garcıa-Herero, A., S. Gavila and D. Santabarbara (2006), What explains
the low profitability of Chinese banks? Mimeo.
He, L. and F. Xiaohang (2004), ‘‘Foreign banks in post-WTO China: an
intermediate assessment’’, China & World Economy 12, 3–16.
Karacadag, C. (2003), China: Financial System Soundness and Reform,
chapter of the book, China, Competing in the global economy,
Washington: IMF.
La Porta, R., F. Lopez-De-Silanes and A. Shleifer (2002), ‘‘Government
Ownership of Banks’’, Journal of Finance 57, 265–301.
Ma, G. (2006), Who pays China’s bank restructuring bill?, CEPII Working
Paper No. 2006–04. February 2006.
Ma, G. and B.S.C. Fung (2002), China’s asset management corporations,
BIS Working Papers No.115, August.
McKinnon, R. (1982), ‘‘The order of economic liberalization: lessons from
Chile and Argentina’’, Carnegie-Rochester Conference Series on Public
Policy 17, 159–186.
Moreno, R. (2002), Reforming China’s Banking System, FRBSF
Economic Letter No. 2002–17, May 31.
OECD (2002). ‘‘China in the world economy. The domestic policy
challenges.’’ OECD, Paris.
Park, A. and K. Sehrt (2001), ‘‘Tests of financial intermediation and
banking reform in China’’, Journal of Comparative Economics 29, 608–644.
Pei, G., and S. Shirai (2004), The Main Problems of China’s Financial
Industry and Asset Management Companies, February.
People’s Bank of China (2005), China Monetary Report.
Ping, L. (2003), Challenges for China’s banking sector and policy responses,
Speech in New Delhi, November.
Podpiera, R. (2006), Progress in China’s banking sector reform: has bank
bevaviour changed ?, IMF Working Paper No. 06/71.
Prasad, E., T. Rumbaugh and Q. Wang (2005), Putting the Cart Before the
Horse? Capital Account Liberalization and Exchange Rate Flexibility in
China, IMF Policy Discussion Paper.
338 CESifo Economic Studies, 52, 2/2006
A. Garcıa-Herrero et al.

Roubini N. and B. Setser (2005), ‘‘China Trip Report’’, April.
Sapienza, P. (2004), ‘‘The effects of government ownership on bank
lending’’, Journal of Financial Economics 72.
Standard & Poor’s (2004), ‘‘China’s Banks Face Potential Stress in Loan
Books’’.
Wei, S.J. and T. Wang (1997), ‘‘The Siamese twins: do state-owned
banks favor state-owned enterprises in China?’’, China Economic Review
8, 19–29.
Wilson, D. and R. Purushothaman (2003), Dreaming with the BRICS,
Goldman Sachs, p. 2.
Zhou, X. (2004), Some issues concerning the reform of the state-owned
commercial banks, Speech by the Governor of the People’s Bank of
China, at the IIF Spring Membership Conference, Shanghai, 16 April.
CESifo Economic Studies, 52, 2/2006 339
China’s Banking Reform

Appendix 1: Figures and Tables
Suriname
Source: IFS (IMF)0 20 40 60 80 100 120 140 160 180
Congo, Dem. Rep.MozambiqueCongo, Rep.
Guinea-BissauSierra Leone
LiberiaGuinea
Equatorial GuineaChad
MalawiKyrgyz Republic
El SalvadorAngola
NigerSudan
Central African RepublicAzerbaijan
UgandaZambia
Yemen, Rep.Tanzania
AlgeriaAlbania
ArmeniaCambodiaComorosLao PDR
MadagascarGeorgia
RomaniaBelarus
Venezuela, RBSao Tome and Principe
RwandaSolomon Islands
CameroonBhutan
BeninGhanaGabon
Burkina FasoTogo
Papua New GuineaTajikistan
TurkeyLithuania
SwazilandLesothoJamaica
Cote d'IvoireArgentina
LibyaGambia, The
HaitiMali
Russian FederationMacedonia, FYR
MoldovaNigeriaMexicoUkraine
GuatemalaMongolia
KazakhstanBotswana
BulgariaNicaragua
SenegalSeychelles
ColombiaBurundi
ParaguayKenya
IndonesiaMicronesia, Fed. Sts.
PeruEthiopiaEcuadorDjibouti
MaldivesNepal
FijiPakistan
Iran, Islamic Rep.Bangladesh
Sri LankaPolandEstonia
LatviaBrazil
Costa RicaSaudi Arabia
Dominican RepublicQatar
Trinidad and TobagoEritrea
MauritaniaCzech Republic
PhilippinesIndia
SamoaCape Verde
HondurasHungary
Syrian Arab RepublicBosnia and Herzegovina
OmanNamibiaSloveniaVanuatuSweden
Slovak RepublicVietnam
BoliviaGuyana
United StatesTonga
BarbadosCroatia
Egypt, Arab Rep.Belize
MoroccoAruba
BahrainUnited Arab Emirates
Macao, ChinaFinlandTunisia
MauritiusZimbabweDominica
St. Vincent and the GrenadinesKuwait
ChileUruguayGreece
St. Kitts and NevisCanada
Antigua and BarbudaNorwayJordan
South AfricaBelgium
GrenadaThailand
ItalyAustralia
FranceLebanonPanamaSt. Lucia
IsraelMalaysia
IcelandJapan
European Monetary UnionKorea, Rep.
AustriaSingapore
IrelandSpain
LuxembourgNew Zealand
GermanyMalta
CyprusChina
United KingdomDenmarkPortugal
NetherlandsHong Kong, China
Switzerland
Figure A1 International comparison of bank credit to the private sector, as apercentage of GDP
340 CESifo Economic Studies, 52, 2/2006
A. Garcıa-Herrero et al.

1.E+00
Logarithmic scaleSource: IFS (IMF)
1.E+01 1.E+02 1.E+03 1.E+04 1.E+05 1.E+06 1.E+07 1.E+08 1.E+09 1.E+10 1.E+11 1.E+12 1.E+13
SurinameSao Tome andGuinea-Bissau
LiberiaComoros
Sierra LeoneSolomon Islands
Congo, Dem.Rep.Micronesia, Fed.Sts.
Central AfricanGambia, The
BhutanTonga
Kyrgyz RepublicMozambique
EquatorialGuineaMalawi
ChadSamoa
Congo, Rep.VanuatuLesotho
NigerGuinea
LaoPDRSeychelles
DjiboutiBurundi
DominicaArmeniaMaldives
TajikistanSwaziland
RwandaTogo
EritreaCape Verde
MongoliaZambia
St. Vincent and theSt. Kitts and Nevis
GeorgiaCambodia
MoldovaMauritania
GuyanaBenin
AlbaniaGrenadaUganda
AzerbaijanMadagascar
Papua New GuineaBurkina Faso
BelizeFiji
Antigua and BarbudaAngola
HaitiMali
TanzaniaSt. Lucia
GabonYemen, Rep.
ElSalvadorMacedonia, FYR
SudanGhana
NicaraguaCameroon
SenegalBotswana
ArubaNamibiaJamaica
ParaguayBelarus
BarbadosEthiopia
NepalCote d'Ivoire
EstoniaLithuania
Bosnia andHonduras
LatviaKenya
MauritiusTrinidad and Tobago
BulgariaLibya
BoliviaAlgeria
RomaniaMacao, China
GuatemalaBahrain
KazakhstanMalta
Sri LankaCosta Rica
QatarZimbabwe
EcuadorDominican Republic
JordanSyrian Arab Republic
UkraineNigeriaOman
UruguayIceland
Venezuela, RBSlovenia
Slovak RepublicPanamaCroatiaCyprusTunisia
PeruBangladesh
VietnamLebanon
ArgentinaColombiaPakistanMorocco
Czech RepublicKuwait
HungaryLuxembourg
PhilippinesTurkey
Iran, Islamic Rep.Indonesia
United ArabChile
Egypt, Arab Rep.Poland
Saudi ArabiaRussian Federation
New ZealandSouth Africa
FinlandGreece
MalaysiaSingapore
SwedenIsrael
ThailandMexico
BrazilIreland
NorwayIndia
PortugalBelgiumAustria
Hong Kong, ChinaDenmarkAustralia
SwitzerlandKorea,Rep.
CanadaNetherlands
SpainItaly
FranceChina
United KingdomGermany
JapanUnited States
European Monetary
Figure A2 International comparison of bank credit to the private sector, in USD
CESifo Economic Studies, 52, 2/2006 341
China’s Banking Reform

Table A1 Share on assets by type of institution
SOCBs JSCBsCredit
cooperatives CCBs
Foreignfundedbanks
Policybanks
Otherinstitutions
Total
assets(USDbillion)
1993 73.9 4.4 11.4 0.0 0.0 9.9 0.4 6951994 72.1 5.4 12.9 0.0 0.0 9.2 0.5 5961995 69.7 6.6 14.3 0.0 0.0 8.8 0.7 770
1996 65.3 7.3 14.1 0.0 0.0 12.4 0.9 9441997 65.8 7.1 14.2 0.0 0.0 12.0 0.9 11541998 65.1 7.5 13.5 0.0 0.0 13.0 1.0 1333
1999 64.9 8.1 13.3 0.0 0.0 12.8 1.0 14892000 63.9 9.6 13.1 0.0 0.0 12.3 1.0 16802001 60.5 11.3 14.1 0.0 0.0 12.8 1.3 1797
2002 57.9 12.8 9.9 4.9 1.2 11.4 1.7 25982003 56.1 14.0 10.1 5.3 1.2 11.5 1.8 30702004 54.6 15.0 10.4 5.4 1.6 11.4 1.5 3619
Source: CEIC.
342 CESifo Economic Studies, 52, 2/2006
A. Garcıa-Herrero et al.

Table A2 Asset structure of the banking sector
(As a percentage of total assets)
1997 1998 1999 2000 2001 2002 2003
Loans 62.7 62.3 59.9 57.6 57.3 58.8 60.8State-owned commercial banks 60.7 61.1 57.6 55.9 56.8 57.9 60.3Other commercial banks 48.8 48.2 47.0 47.6 53.0 55.0 58.5
Joint-stock commercial banks 48.4 50.5 49.9 50.3 53.7 57.0 60.5Other 49.5 44.6 41.5 42.0 49.5 47.5 50.5
Policy banks 93.2 89.7 92.2 89.2 81.7 93.5 92.1
EU-15 49.2 49.4 48.3 47.9 47.0 46.7 45.2
Other risky assetsa 11.1 14.7 18.1 22.1 24.6 24.7 23.7
State-owned commercial banks 11.4 15.2 20.3 24.3 25.2 25.9 24.9Other commercial banks 12.9 16.3 17.7 19.6 23.8 25.0 22.8Joint-stock commercial banks 15.9 19.2 19.1 20.9 21.9 22.1 20.6
Other 8.0 11.7 15.0 17.0 32.7 36.5 31.6Policy banks 3.0 6.8 4.9 8.5 16.6 1.7 1.3EU-15 17.5 18.3 21.2 22.4 23.4 24.1 24.8
Liquid assets 24.2 21.1 20.0 18.3 16.0 14.6 13.7State-owned commercial banks 25.7 21.6 19.9 17.7 15.9 14.2 13.1
Other commercial banks 37.1 34.3 33.8 31.3 21.6 18.5 17.4Joint-stock commercial banks 34.4 29.0 29.3 27.3 22.8 19.6 17.6Other 41.6 42.7 42.4 39.9 15.9 14.5 16.5
Policy banks 3.6 3.2 2.6 1.8 1.5 3.8 5.4EU-15 32.1 31.1 29.4 28.7 28.6 28.2 29.0
Fixed assets 1.9 1.8 2.0 2.0 2.0 1.9 1.7State-owned commercial banks 2.2 2.0 2.1 2.1 2.1 2.0 1.7Other commercial banks 1.1 1.2 1.5 1.4 1.6 1.4 1.3
Joint-stock commercial banks 1.2 1.3 1.7 1.6 1.5 1.4 1.3Other 1.0 1.0 1.1 1.2 1.9 1.4 1.4
Policy banks 0.2 0.3 0.3 0.5 0.3 1.0 1.2EU-15 1.2 1.2 1.1 1.1 1.0 1.0 0.9
Source: Bankscope.aIt includes AMC bonds.
CESifo Economic Studies, 52, 2/2006 343
China’s Banking Reform

Table A3 Liability structure of the banking sector
(As a percentage of total assets)
1997 1998 1999 2000 2001 2002 2003
Deposits & short-term funding 83.6 82.3 81.0 83.7 83.8 89.0 89.1State-owned commercial banks 89.1 88.8 89.4 90.3 90.9 91.8 92.1Other commercial banks 85.6 86.3 78.0 79.2 80.9 81.8 81.7
Joint-stock commercial Banks 84.6 86.1 73.7 75.6 79.0 79.7 79.9Other 87.4 86.6 86.0 86.8 89.7 89.9 88.7
Policy banks 64.8 50.4 47.9 45.3 5.1 82.6 83.7
EU-15 73.0 73.0 70.9 69.3 69.2 69.5 68.2
Other funding 5.7 6.3 6.9 5.3 5.7 1.1 1.1
State-owned commercial banks 1.2 0.8 0.7 0.6 0.6 0.4 0.4Other commercial banks 1.0 0.3 0.7 0.5 0.7 0.4 0.6Joint-stock commercial banks 1.6 0.5 1.1 0.6 0.6 0.3 0.5
Other 0.1 0.0 0.1 0.2 1.0 0.9 1.2Policy banks 27.2 38.3 43.1 46.7 84.8 11.7 12.2EU-15 13.1 12.3 13.0 13.2 13.4 12.2 13.0
Other (Non-interest bearing) 6.1 5.4 6.4 5.4 5.4 5.4 5.5State-owned commercial banks 6.5 4.8 4.6 3.8 3.5 3.2 3.1
Other commercial banks 6.1 6.4 14.7 14.3 14.2 14.0 13.9Joint-stock commercial banks 8.1 8.1 20.2 19.2 16.5 16.4 16.1Other 2.9 3.7 4.2 3.9 3.5 4.5 5.5
Policy banks 3.4 6.6 4.4 3.2 4.1 2.9 1.1EU-15 9.4 10.0 10.4 11.4 11.4 12.1 12.6
Equity 4.5 6.0 5.7 5.6 5.2 4.5 4.3State-owned commercial banks 3.2 5.6 5.3 5.3 5.0 4.6 4.4Other commercial banks 7.2 7.0 6.6 6.0 4.2 3.8 3.8
Joint-stock commercial banks 5.7 5.4 4.9 4.5 3.9 3.6 3.5Other 9.7 9.6 9.7 9.1 5.9 4.8 4.6
Policy Banks 4.6 4.7 4.6 4.7 6.0 2.8 3.0EU-15 4.2 4.4 4.4 4.6 4.5 4.6 4.5
Source: Bankscope.
344 CESifo Economic Studies, 52, 2/2006
A. Garcıa-Herrero et al.

Table A4 Sources and uses of bank financing
Source of deposits (percentage)
Deposits(USD billion) Enterprise
Fiscaldeposits Govt. agency
Householdsavings deposits Rural deposits Trust deposits Other
1993 518 29 2 2 51 4 0 121994 466 33 2 2 53 3 0 71995 649 32 2 2 55 2 0 7
1996 823 33 2 1 56 2 0 61997 990 35 2 1 56 2 3 11998 1156 34 2 1 56 2 3 2
1999 1314 34 2 2 55 2 3 32000 1495 36 3 2 52 2 2 32001 1735 36 2 2 51 2 2 4
2002 2063 35 2 3 51 2 1 52003 2511 35 2 3 50 2 1 62004 2905 35 3 3 50 2 1 6
(Continued.)
CESifo
Economic
Studies,
52,2/2006
345
China’s
BankingRefo
rm

Table A4 Continued
Use of loans (percentage)
Total loans(USD billion)
Short-term(ST)
ST:Industrial
ST:Commercial
ST:Construction
ST:Agricultural
Medium tolong-term Other
1993 576 74 22 28 3 15 16 111994 470 67 21 25 3 11 20 131995 609 59 20 25 2 6 20 21
1996 734 66 20 24 3 12 20 141997 900 74 22 25 2 4 21 21998 1045 70 21 23 2 5 24 31999 1132 68 19 21 2 5 26 4
2000 1200 66 17 18 2 5 28 32001 1357 60 17 17 2 5 35 32002 1584 57 15 14 2 5 37 5
2003 1919 53 14 11 2 5 41 62004 2142 49 13 10 2 6 43 7
Source: CEIC.
346
CESifo
Economic
Studies,
52,2/2006
A.Garcıa
-Herrero
etal.

Table A5 Selected indicators for the performance
1997 1998 1999 2000 2001 2002 2003
Return on average assets (ROA) (%) 0.43 0.22 0.20 0.26 0.23 0.22 0.14State-owned commercial banks 0.19 0.09 0.13 0.22 0.16 0.18 0.08Other commercial banks 1.05 0.75 0.49 0.41 0.41 0.37 0.32
Joint-stock commercial banks 0.78 0.58 0.45 0.40 0.39 0.34 0.29Other 1.50 1.03 0.57 0.43 0.46 0.51 0.47
Policy banks �0.12 0.07 0.06 0.14 0.26 0.01 0.03
Return on average equity (ROE) (%) 9.39 4.19 3.48 4.59 4.21 4.48 3.05
State-owned commercial banks 5.94 2.08 2.35 4.07 3.16 3.78 1.73Other commercial banks 14.61 10.55 7.22 6.49 8.10 9.33 8.56
Joint-stock commercial banks 13.76 10.47 8.69 8.42 9.50 9.17 8.07
Other 15.42 10.62 5.86 4.54 5.86 9.81 10.00Policy banks �2.68 1.40 1.21 2.97 4.99 0.23 1.00
Net interest margin (%) 2.03 2.07 1.90 2.22 1.93 1.95 2.03State-owned commercial banks 2.40 2.47 2.07 2.35 1.98 2.02 2.11
Other commercial banks 2.49 2.50 2.25 2.24 2.10 2.18 2.19Joint-stock commercial banks 2.38 2.57 2.20 2.30 2.32 2.21 2.27Other 2.68 2.40 2.32 2.14 1.43 2.04 1.89
Policy banks �0.06 0.02 0.81 1.63 1.47 1.01 1.21
Cost to Income Ratio (%) 54.51 65.40 62.22 56.61 54.51 55.52 51.68
State-owned commercial banks 49.31 66.33 59.16 56.18 55.52 51.76 47.87Other commercial banks 49.56 59.96 64.07 59.80 51.17 50.92 45.67
Joint-stock commercial banks 56.05 63.13 55.33 52.24 50.48 50.64 44.71
Other 38.61 54.47 77.17 75.20 54.47 52.04 49.52Policy banks 65.94 34.25 48.49 23.47 6.23 64.93 67.22
(Continued.)
CESifo
Economic
Studies,
52,2/2006
347
China’s
BankingRefo
rm

Table A5 Continued
1997 1998 1999 2000 2001 2002 2003
Equity/Total Assets (%) 4.54 6.03 5.72 5.56 5.16 4.54 4.34
State-owned commercial banks 3.15 5.61 5.28 5.32 5.04 4.59 4.38Other commercial banks 7.20 7.01 6.60 5.99 4.22 3.81 3.76
Joint-stock commercial banks 5.68 5.36 4.95 4.53 3.86 3.56 3.55
Other 9.72 9.63 9.70 9.07 5.91 4.78 4.57Policy banks 4.60 4.73 4.59 4.72 5.98 2.81 2.95
Capital funds/Liabilities (%) 4.76 6.41 6.07 5.89 5.44 4.76 4.55State-owned commercial banks 3.26 5.94 5.57 5.62 5.31 4.81 4.58Other commercial banks 7.76 7.54 7.07 6.37 4.41 3.96 3.97
Joint-stock commercial banks 6.02 5.66 5.20 4.75 4.01 3.69 3.77Other 10.76 10.66 10.75 9.97 6.28 5.02 4.79
Policy banks 4.82 4.97 4.81 4.96 6.36 2.90 3.04
Loan loss reserve/gross loans (%) 1.03 1.26 1.55 1.46 1.81 1.81 3.30
State-owned commercial banks 1.00 1.12 1.52 1.24 1.66 1.82 3.91Other commercial banks 1.83 2.43 2.99 3.82 2.93 2.32 2.08
Joint-stock commercial banks 1.05 1.63 2.23 3.94 3.35 2.60 2.24
Other 3.06 3.84 4.69 3.52 0.80 1.01 1.32Policy banks 0.73 1.06 0.79 0.73 1.64 1.02 1.01
Loan loss provisions(USD millions)
2.197 2.957 3.662 6.971 10.277 10.379 14.061
State-owned commercial banks 2.109 2.409 3.203 5.565 7.989 8.798 11.025Other commercial banks 74 113 371 756 1.008 1.582 3.036
Joint-stock commercial banks 74 113 355 715 906 1.229 2.603Other 0 0 15 41 102 353 433
Policy banks 0 436 89 650 1.281 0 0
Source: Bankscope.
348
CESifo
Economic
Studies,
52,2/2006
A.Garcıa
-Herrero
etal.

Table A6 Income and expenditure structure of the banking sector
(As a percentage of total income and expenditure, respectively)
1997 1998 1999 2000 2001 2002 2003
Interest income 90.2 91.2 90.4 91.9 90.7 87.0 87.0State-owned commercial banks 96.4 96.7 95.1 95.3 93.9 91.3 91.2Other commercial banks 85.4 89.4 88.8 90.6 91.6 93.0 93.0
Joint-stock commercial banks 81.9 86.8 89.0 90.4 91.7 94.5 94.7Other 90.1 92.4 88.4 90.8 90.9 87.6 87.1
Policy banks 88.2 85.8 95.4 98.4 97.7 97.5 97.5
Commission income 2.4 2.5 4.2 4.2 4.3 5.0 5.2
State-owned commercial banks 2.5 2.8 3.6 4.2 4.7 5.8 6.1Other commercial banks 4.5 3.6 3.9 4.2 3.7 3.9 4.1Joint-stock commercial banks 2.5 1.9 2.5 3.1 4.1 4.3 4.5
Other 7.2 5.5 5.7 5.7 2.4 2.5 2.6Policy banks 0.3 0.7 4.5 1.3 1.7 2.4 2.4
Other income 7.4 6.3 5.4 3.9 5.1 8.0 7.8State-owned commercial banks 1.1 0.5 1.3 0.6 1.4 2.9 2.7
Other commercial banks 10.2 6.9 7.3 5.2 4.7 3.1 2.9Joint-stock commercial banks 15.7 11.2 8.4 6.4 4.2 1.3 0.8Other 2.6 2.1 5.9 3.5 6.8 9.9 10.3
Policy banks 11.5 13.4 0.1 0.2 0.6 0.0 0.1
Interest expenditure 75.9 70.8 65.7 63.4 54.3 45.4 42.0State-owned commercial banks 76.4 68.6 64.9 64.4 54.5 46.0 41.9Other commercial banks 70.7 68.5 61.8 59.4 54.3 48.5 47.5Joint-stock commercial banks 64.4 59.2 59.8 55.0 53.3 47.8 45.3
Other 79.8 78.8 64.0 65.3 58.6 51.2 55.3Policy banks 92.2 91.2 89.3 81.1 70.0 78.2 73.9
Personnel expenditure 0.9 1.1 1.7 3.0 4.1 8.2 8.6State-owned commercial banks 1.5 1.6 2.5 3.9 4.8 10.4 11.1
Other commercial banks 0.1 0.2 0.7 0.9 3.8 4.0 4.6Joint stock commercial banks 0.2 0.4 0.7 1.6 4.7 5.2 5.9Other – – – – – – –
Policy banks – – – – – – –
Other Expenditurea 23.2 28.2 32.6 33.6 41.5 46.3 49.4State-owned commercial banks 22.1 29.8 32.6 31.7 40.6 43.6 46.9Other commercial banks 29.1 31.3 37.5 39.7 41.9 47.4 47.9
Joint-stock commercial banks 35.4 40.4 39.4 43.4 42.0 47.1 48.8Other 20.2 21.2 36.0 34.7 41.4 48.8 44.7
Policy banks 7.8 8.8 10.6 18.7 29.7 21.8 26.1
aInclude personnel expenditures if it is not reported before.
Source: Bankscope.
CESifo Economic Studies, 52, 2/2006 349
China’s Banking Reform

Table A7 NPL ratio in each SOCB
(Based on the Five-Category Classification)
2000 2001 2002 2003 2004
Agricultural Bank of China – 42.1 36.6 30.8 26.8Bank of China 26.5 26.7 23.6 16.3 5.5China Construction Bank 19.9 19.0 15.1 8.3 3.1
Industrial and CommercialBank of China
34.4 29.8 25.7 21.5 19.5
aSource: Bankscope.
Table A8 Interest rate liberalization process
1. Liberalization of inter-bank lending rates1990 Pilot liberalization of inter-bank lending market and rates1996 Creation of unified inter-bank market
1996 Abolish the upper limit of inter-bank lending rates
2. Liberalization of bond market interest rates1996 Market-based issuance of government bonds on pilot markets
(stock markets)
1997 Utilization of the inter-bank market to deal in inter-bank bondrepo transactionsLiberalization of the bond repo interest rates
1998 Market-based issuance of financial bonds by the policy banks1999 Market-based issuance of government bonds
3. Market-based reform of lending and deposit rates3.1. Foreign currency rates
3.1.1. Loans1996 Introduction of foreign currency business in the commercial
banks2000 Liberalization of lending rates
3.1.2. Deposits2000 Liberalization of over USD 3 million deposit rates2002 Liberalization of small deposit rates of residents in foreign
financial institutions2003 Liberalization of deposit rates in Pound, Franc, Swiss franc and
Canadian dollar
2003 Lower limit of deposit rates removed2004 Liberalization of small deposits rates with maturity above
1 year.
(Continued.)
350 CESifo Economic Studies, 52, 2/2006
A. Garcıa-Herrero et al.

Table A8 Continued
3. 2. RMB rates
3. 2. 1. Loans1987 Surcharge until 20% on reference rates on loans (working
capital)
1996 The band changes to� 10% around reference rates1998 Increase of upper limit to 20% (RCCs 50%)1999 Increase of upper limit to 30% (RCCs and large enterprises
10%)2003 Increase of upper limit to pilot RCCs to 100%2004 Increase of upper limit to 70% and RCCs to 100%. Lower limit
remain at 90%2004 Liberalization of upper limit of RMB lending rates (excluding
UCCs and RCCs, that increase until 130% above referencerates)
3. 2. 2. Deposits1999 Negotiation on rates on over RMB 30 million deposits with
maturity above 5 years for insurance companies
2002 Same scheme for Social Security Fund2003 Same scheme for China Postal Saving and Remittance Bureau2004 All kind deposit rates can adjust downward
Source: PBC (2005).
CESifo Economic Studies, 52, 2/2006 351
China’s Banking Reform

Table A9 Foreign bank acquisitions
Chinese bank
Assets in2003 (USD
in million)
Share on assetsin 2003(% of bank
system assets) Foreign bank
Date of theagreement
(or publication)
Stakeacquired
(%) Observations
China Everbright Bank 47.63 1.4 Asian Development
Bank (ADB)
Oct 96 3.0
Nanjing Commercial Bank 3.6 0.1 International FinanceCorporation (IFC)
Nov 01 15.0 Acquisition of 15%for USD 27 billion
Bank of Shangai 23.4 0.7 Hong Kong and
Shanghai BankingCorp (HSBC)
Dec 01 8.0 Acquisition of 8%,
HSBC, IFC andother foreigninvestors maintain
a share of 18%Shangai PudongDevelopment Bank
44.8 1.3 Citigroup Aug 02 4.6 Acquisition of 4.6%for USD 67 billion.
Increase itsshare to 5% inNovember 2003
Xi’an Commercial Bank 3.1 0.1 IFC and Royal Bank
of Canada (RBC)
Sep 02 24.9 IFC acquires 12.5%
and RBC buy a12.4% stake. Firstoperation in the
north-east part ofChina
352
CESifo
Economic
Studies,
52,2/2006
A.Garcıa
-Herrero
etal.

Nanchong Commercial Bank 1.5 0.4 DEG, una filial
de KFW
Jan 03 NA First acquisition in
thesouth-east of China
Qingdao International Bank 0.0 0.0 Hana Bank Oct 03 50.0 Acquisition of 50%
stake in exchangeof USD 16.1million. Foreign
bank as the majorshareholder
China Minsheng Banking
Corporation
43.6 1.3 IFC Nov 03 1.6
Fujian Industrial BankCo. Ltd
1.5 0.0 Hang Seng Bank, IFC,The Government ofSingapore Investment
Corporation
Dec 03 25.0
Ping An Bank 0.1 NA HSBC, Ping Anof China
Mar 04 NA HSBC y Ping Anbought Fujian
Asian Bank andfounded Ping AnBank. It is planned
to convert it into aUrban CommercialBank by 2007
Shenzen Development Bank 22.9 0.7 Newbridge Asia
AIV III, LP
May 04
May 04
18.0
(Continued.)
CESifo
Economic
Studies,
52,2/2006
353
China’s
BankingRefo
rm

Table A9 Continued
Chinese bank
Assets in2003 (USDin million)
Share on assets
in 2003(% of banksystem assets) Foreign bank
Date of theagreement(or publication)
Stakeacquired(%) Observations
Bank of Communications 114.8 3.4 HSBC Aug 04 20.0 Strategic investor.HSBC will pay
USD 1.7 billionfor a stake of 20%
Industrial Bank 31.4 0.9 Hang Seng Bank(HSBC), Government
of Singapore and IFC
Mar 04 25.0 Hang Seng Bankacquires 15.98%,
Government ofSingapore 5% andIFC through
Tetrad InvestmentPte Ltd. andIFC 4%.
Jinan City Commercial Bank 2.4 0.1 Commonwealth Bankof Australia
Nov 04 11.0
Bohai Bank NA NA Standard Chartered Nov 04 20.0China Construction Bank 429.3 13.4 Bank of America Jun 05 9.0 Acquisition of 9%
for USD 2.5billion. The newowner will get a
seat on the CCBBoard
NA: not available.
Source: own calculations from Financial Times, Bankscope, He and Fan (2004) and CBRC.
354
CESifo
Economic
Studies,
52,2/2006
A.Garcıa
-Herrero
etal.

Table A10 Current situation on Financial Openness
Area Type Description
Direct Investment and realstate transactions
Inflows No restrictions for non-residents (and also for profits repatriation and investmentliquidation) beyond the regional and sectoral limits
Outflows Requires the authorization of the SAFE, except some kind projects pre-authorized by
the State CouncilStocks and bonds Inflows Non-residents can purchase B shares (nominated in RMB) but the QFII can buy
A shares (for residents) with limitations
Outflows Only authorized resident financial institutions by the SAFE can purchase sharesabroad
Issuance abroad or in foreign currency requires an administrative approbation
Money market instruments Inflows Not allowed, neither purchases or issuancesOutflows Only resident financial institutions authorized by the SAFE can purchase money
market instruments abroadIssuance abroad or in foreign currency requires an administrative approbation
Credit operations Inflows In general, only for financial institutions, authorized enterprises and foreign-fundedenterprises can borrow. Nonetheless, financing under 3 months of maturity is notsubject to limitations
Outflows Only financial institutions with the SAFE approval. The advance repaymentof the loans in foreign currency is allowed, albeit wih limitations
Other financial instruments Inflows Not allowed or allowed with strong requirements
Outflows Either purchases or issuance are subject to prior approbationDeposits operations Inflows No restrictions
Outflows Requires the approbation of the SAFE
CESifo
Economic
Studies,
52,2/2006
355
China’s
BankingRefo
rm

Table A11 Steps in financial account liberalization
Date Objective Area of reform Description
2004 Limit RMB convertibility Capital inflows Limited convertibility of RMB for foreign banks FDI can only
be converted to RMB upon proof of domestic payment2004 Portfolio Investment Capital outflows The national Security Fund and domestic insurance firms were
approved to invest part of this portfolios
2004 QFII Capital inflows Soften the remaining restrictions2002 QFII Capital inflows Qualified foreign institutional investors may invest in A shares
(for residents, in RMB) with some restrictions (maximum ofinvestment, maximum share in a single company, size of the
investor among others)2001 FDI Capital outflows Pre-authorized investment overseas in strategic projects that
entail importing materials of China or foreign aid projects
2001 Credit operations Capital outflows Lifting restriction on advance repayments of loans in foreigncurrency
2001 Stock market Capital outflows Domestic investors are allowed to invest in B shares
(for non-residents) with foreign deposits1998 Bond market Capital outflows Partial authorization to issue bond in foreign currency1997 Announcement of financial
account liberalization by 2000
Capital inflows
and outflows
356
CESifo
Economic
Studies,
52,2/2006
A.Garcıa
-Herrero
etal.

Table A12 Estimated government cost of recapitalization of ICB and ABC
SOCB
Actual
figures
Recapitalization
needsa
Industrial and Commercial Bank of China
NPL 86.05b 63.45c
NPL/loans 19.47%Provisions 12 0.38d
Provisions/NPL 13.95%
Equity 29.95e 10.89Equity/assets 4.40%Total 74.72
Agricultural Bank of China
NPL 79.81b 63.02c
NPL/loans 26.82%
Provisions 4 4.33d
Provisions/NPL 4.80%Equity 16.66 8.27
Equity/Assets 4.01%Total 75.62
Author’s own calculationsaRecapitalization needs are calculated as the difference between the actual levels of NPLs,
provisions and equity and the necessary levels to achieve the objective values for the three
ratios (NPL/loans, provisions/NPL and equity/assets) established by the CBRC for BoC
and CCB at 2005 (4, 70 and 6%, respectively).bNPLs are obtained from the bank’s ratio NPL/loans published by CBRC at 2004 and
bank’s total loans at end-2003 considering a loans’ estimated growth rate of 10% in 2004.cWe assume that the AMCs recover the same amount of NPLs as now (7.2% in cash
value). In this setting, the amount recovered by AMCs reduces the cost of recapitalization
for the Chinese government.dWe assume that the banks modify their NPLs before their provisions, so the necessary
level of provisions is calculated over the objective NPLs.eIt includes the government’s capital injection of USD 15 billion in 2005.
CESifo Economic Studies, 52, 2/2006 357
China’s Banking Reform

Table A13 Estimated recapitalization needs for JSCBs
JSCB NPLa Provisonsb Equityc Total
Bank of Communicationsd 5.71 0.47 1.97 8.15 (2.15)CITIC Industrial Bank 1.27 0.53 1.01 2.81
China Everbright Bank 1.60 �0.72 1.25 2.14China Merchants Bank �0.32 �0.10 1.55 1.14China Minsheng Bank �0.66 0.26 1.44 1.05Hua Xia Bank 0.04 0.00 1.70 1.74
Shanghai Pudong DevelopmentBank
�0.46 �0.18 1.23 0.59
Shenzhen Development Bank 0.76 �0.11 0.77 1.42
Industrial Bank �0.29 0.26 1.04 1.01Guangdong Development Bank 3.54 0.28 1.48 5.30Total 25.33 (19.33)
Author’s own calculationsaRecapitalization needs are calculated as the difference between the actual level of NPLs
and the necessary level to achieve the objective value of 4% for the ratio NPL/loans
established by the CBRC for BoC and CCB at 2005.bRecapitalization needs are calculated as the difference between the actual level of
provisions and the necessary level to achieve the objective value of 70% for the ratio
provisions/NPL established by the CBRC for BoC and CCB at 2005. We assume that the
banks modify their NPLs before their provisions so the necessary level of provisions is
calculated over the objective NPLs.cRecapitalization needs are calculated as the difference between the actual level of equity
and the necessary level to achieve the objective value of 6% for the ratio equity/assets
established by the CBRC for BoC and CCB at 2005.dThis bank has sold USD 6 billion to an AMC in 2004. The calculations have been done
without taking into account this fact, so if we substract the USD 6 billion, recapitalization
needs for Bank of Communications and total JSCBs are the values in brackets (2.15 and
19.33 USD billion, respectively).
358 CESifo Economic Studies, 52, 2/2006
A. Garcıa-Herrero et al.

SOCBs
−1.2
−0.9
−0.6
−0.3
0.0
0.3
0.6
1997 1998 1999 2000 2001 2002 2003
Perc
enta
ge (%
)
Net income/PPProfit PPProfit/operating incomeOperating income/assets Assets/equityROE growth rate
JSCBs
−0.9
−0.6
−0.3
0.0
0.3
0.6
1997 1998 1999 2000 2001 2002 2003
Perc
enta
ge (%
)
Net income/PPProfit PPProfit/operating incomeOperating income/assets Assets/equityROE growth rate
Listed banks
−0.9
−0.6
−0.3
0.0
0.3
0.6
1997 1998 1999 2000 2001 2002 2003
Perc
enta
ge (%
)
Net income/PPProfit PPProfit/operating incomeOperating income/assets Assets/equityROE growth rate
Figure A3 Contribution to the ROE growth rate
CESifo Economic Studies, 52, 2/2006 359
China’s Banking Reform

Appendix 2. Institutional setting of the
Chinese banking system25
Until 1979, China had a monobank financial system, as other centrally
planned economies. The PBC was the only bank and, therefore, in charge
of a large number of issues, such as the conduct of monetary policy,
exchange policy, foreign reserve management, deposit-taking, commercial
lending activities and the financing of development projects. The
introduction of a two-tier banking system in 1979 was the first milestone
in the modernization of the Chinese financial system.Today, China’s banking sector counts with two regulatory institutions,
the central bank (PBC) and the CBRC, both ultimately overseen by
the State Council (the cabinet) and the rest of the financial system
(Figure A2-1).The PBC is currently in charge of the monetary policy and the liquidity
of the financial system. It aims at promoting economic growth and price
stability. The PBC manages the interest rate bands for loans and deposits,
since the interest rates are not fully liberalized yet, the reserve
requirements and other instruments affecting banks’ liquidity. The PBC
also monitors and regulates the credit expansion of a large share of the
banking system.The CBRC was established in April 2003 to take over the regulatory
and supervisory functions of the banking sector so that the PBC could
concentrate on monetary policy matters. Its objectives include protecting
consumers and depositors, maintaining the stability in the banking system,
enhancing banks’ competitiveness, encouraging competition, educating
the public on the role of finance and eradicating financial crime. To this
end, it focuses on the strength of financial institutions, capital adequacy
issues, and the restructuring of the banking sector.There is also a number of non-bank financial institutions in the Chinese
banking system. The main ones are the TICs, created in the 1980s to
support the development of the private sector and to provide financing
outside the credit quotas imposed to commercial banks. Some TICs act
as the investment instrument of local or provincial governments. Some
others are intermediaries of international funds (through bond issues
or syndicated medium and long-term loans) to finance local companies
and infrastructure and construction projects. Other important non-bank
financial institutions are AMCs, established in 1999 to receive the NPLs
from the SOCBs and recover them through different asset resolution
techniques. Securities companies have played an important role in the
25 Drawn from Garcıa Herrero and Santabarbara (2004).
360 CESifo Economic Studies, 52, 2/2006
A. Garcıa-Herrero et al.

development of the stock exchanges since the 1990s. Their ownership has
become more diversified with an increasing participation of the private
sector. Insurance companies, in turn, are basically in State hands although
most of the newly created companies are joint-stock ones and have shifted
their focus from market share to economic return. Since China’s WTO
entry, foreign companies have expressed great interest in the Chinese
insurance sector.
Policy lendingbanks (3)
Other commercialbanks(123)
State-ownedcommercial banks
(SOCBs) (4)
Foreign banks (191)
Agriculture Development Bank of ChinaExport-Import Bank of ChinaChina Development Bank
Joint-stock commercial banks (JSCBs) (11)City commercial banks (CCBs) (112)
Agricultural Bank of China (ABC)Bank of China (BoC)China Construction Bank (CCB)Industrial and Commercial Bank (ICB)
Trust andInvestment
Corporations(TICs)
Credit cooperatives(around 36,000)
Rural credit cooperatives (RCCs) (around 35000)Urban credit cooperatives (UCCs) (around 1000)
Branches (157)subbranchessubsidiaries
Banking institutions
AssetManagementCompanies
(AMCs)
Securitiescompanies
Insurancecompanies
Non-bank financial institutions
The People’sBank of China
(PBC)
China BankingRegulatory
Commission(CBRC)
Regulatory institutions
Figure A2-1 Structure of the Chinese financial system
CESifo Economic Studies, 52, 2/2006 361
China’s Banking Reform

The core of the Chinese financial system, the banking system, includesfour large SOCBs, three policy lending banks and a large number ofother commercial banks, credit cooperatives and financial institutions.Among the commercial banks, there are eleven JSCBs, which were initiallycreated to provide specialized product niches but now offer a full rangeof financial services. At the local level, there are more than 110 CCBs,1000 UCCs, and 35 000 RCCs providing basic banking services.The four SOCBs,26 the ABC, the BoC, the CCB and the ICB, were
established in the 1980s. They were assigned sector policy objectives,previously in the hands of the PBC with the monobank system. In 1994,with the creation of the policy-lending banks, their responsibilities wererestricted to commercial purposes (Karacadag 2003). Although their assetshave fallen in the last two decades (from 72 percent of the total assets inthe banking system in 1994 to 55 percent at the end of 2004), they are stillvery large. In fact, they are among the biggest banks in the world, withtotal assets in above USD 2000 billion and an extensive branch network(with a total of 42000 offices) and over 700000 employees at the end of 2002.Three policy-lending banks were created in 1994 to carry out the
development policies previously assigned to the SOCBs and hold about10 percent of the total bank assets. These are the AgriculturalDevelopment Bank, the China Development Bank and the Export-Import Bank of China. Their main objectives are agricultural develop-ment, national infrastructure and foreign trade, respectively, with specialattention to the poorer, western and central regions. Policy-lending banksfund themselves through central bank loans, government deposits and theissuance of government-guaranteed deposits held by commercial banks.They also lend extensively to the government. Even more than in the caseof SOCBs, profitability is only a residual objective for their managers.There are a number of other commercial banks in the Chinese banking
system, with a diverse ownership structure and geographical scope. Partof them has been used as an experiment for the liberalization processof the financial system and others are specialized in some market niches.There are two main groups: JSCBs and CCBs:JSBCs are partially owned by local governments and SOEs, and
sometimes by the private sector. There are currently eleven banks—five of
26 In the process of establishing a two-tier banking system, the government in 1979 firstremoved the monopolistic position of the PBC by establishing the ABC, the BoC and theCCB. The ABC objective was to foster rural banking business and to take thesupervisory authority of a network of rural credit cooperatives that had been providingsmall-scale rural banking. The BoC was assigned foreign currency transactions, while theCCB focused on the construction sector. The government completed a two-tier bankingsystem by removing commercial banking activities from the PBC and transferring themto the ICB, the fourth specialized bank, established in 1984.
362 CESifo Economic Studies, 52, 2/2006
A. Garcıa-Herrero et al.

which are listed on local stock markets—and account for 15 percent ofthe total bank assets. The biggest ones are Bank of Communications,China Minsheng Bank,27 China Everbright Bank, China Merchants Bank,Shanghai Pudong Development Bank and Shenzen Development Bank.The JSCBs finance small SOEs and firms with partial private ownership,including SMEs. They maintain much smaller branch networks thanSOCBs, typically confined to the region of origin or to the fast-growingcoastal area, although they are generally allowed to operate at the nationallevel. These banks are the most market-oriented, with better governanceand management and have experienced the fastest expansion in the lastfew years.Since the mid-1990s, CCBs have been created by restructuring and
consolidating UCCs. There are currently 112, accounting for about5 percent of the total assets in 2004. Their capital is in the hands ofurban enterprises and local governments. They are not allowed to operateat the national or regional scale unlike the JSCBs, which is their majorcompetitive disadvantage. Finally, CCBs lend to SMEs, collective andlocal residents in their municipalities.RCCs and UCCs were established in the 1980s as a mechanism to
diversify the financial system and to finance projects in areas whereresources were scarce. They typically attract deposits from rural areas orsmall towns and provide credit to SMEs or peasants, a good part of whichis subsidized. In fact, their lending policies are subject to the control of thelocal public authorities As of June 2003, there were about 35 000 RCCs,providing 80 percent of the rural finance, and 1 000 UCCs. Their share ofassets was 10.4 percent as of the end of 2004, marking a steady reductionsince 1995 (with 14.3 percent of the total bank assets). This is mainlydue to their inability to expand lending even if their deposits continueto expand. Nowadays, RCCs are more important and numerous thanurban ones, after the consolidation of the latter into CCBs. Finally, RCCsare the worst performing financial institutions in China, with very poorgovernance and the highest NPL ratios.Foreign banks play a very limited role in the Chinese banking system.
As of September 2003, there were 191 licensed foreign bankinginstitutions, among which 157 are branches, 11 subbranches and 15subsidiaries incorporated locally with eight branches.28 They hold0.3 percent of the local currency lending market and around 13 percentin the foreign currency lending market; all in all about 1.5 percent of thetotal bank assets.
27 China Minsheng Bank is the only one fully privately owned. It focuses on lending to theprivate sector, including joint ventures with foreign partners.
28 Ping (2003).
CESifo Economic Studies, 52, 2/2006 363
China’s Banking Reform