china telecom industry - guosen › hd › upload › attachments › 201110 › 4ea… · fixed...
TRANSCRIPT

25 June 2008
China Telecom industry

1
2nd Lowest in the Meaningful Areas; Barely Higher Than Global Average
RussiaWireless penetration: 83.6%
% of global sub: 5.5%
Wireline penetration: 28.0%
% of global sub: 3.2%
JapanWireless penetration: 79.3%
% of global sub: 4.7%
Wireline penetration: 43.1%
% of global sub: :4.4%
ChinaWireless penetration: 34.8%
% of global sub: 21.1%
Wireline penetration: 28.1%
% of global sub: 29.2%
IndiaWireless penetration: 14.8%
% of global sub: 7.9%
Wireline penetration: 4.3%
% of global sub: 3.9%
Euro Area(incl. UK)
Wireless penetration: 116.5%
% of global sub: 18.3%
Wireline penetration: 53.4%
% of global sub: 15.6%
USAWireless penetration: 77.4%
% of global sub: 10.7%
Wireline penetration: 57.4%
% of global sub: 13.6%
BrazilWireless penetration: 52.9%
% of global sub: 4.6%
Wireline penetration: 20.5%
% of global sub: 3.1%
Global AverageWireless penetration: 33.6%
Wireline penetration: 19.6%
Source:ITU, World Bank, CIA Factbook CICC researchData in year 2006

2
Wireless Penetration basically In Line With GDP per Capita
Wireless penetration is 35.3% in 2006 in China; Wireline penetration is 28.1% in 2006 in China
Wireless penetration is 41.6% in 2007 in China; Wireline penetration is 27.8% in 2007 in China
To be consistent with global data, we choose China’s data in 2006 to compare. Actually, only two privinces including Anhui and Guizhou’swireless penetration were below 25% till 2007.
He
bei
Tian jin
Shan
dongJiangsu
Anhui
Zhejiang
Shanghai
Fujian
Guang
dongHK
Tai wan
Heilong
jiang
Jilin
LiaoningInner
Mongolia
Xinjiang
Tibet
Qinghai
Sichuan
Yunan
Guizhou
Guangxi
Hainan
HunanJiangxi
Hubei
HenanGansu
Shanxi
Ning
xiaShanxi
Beijing
Chong
qing
Wireless penetration > country average
Wireless penetration > 25%
Wireless penetration < 25%
Source: MII,CICC researchData in year 2006
3
456
171 207 235 247 250 259 272
390330272247206173
1.68
1.51
1.051.011.00
1.32
1.10
0
150
300
450
600
750
2001 2002 2003 2004 2005 2006 20070.9
1.1
1.3
1.5
1.7
移动收入 固网收入 移动对固网收入比例
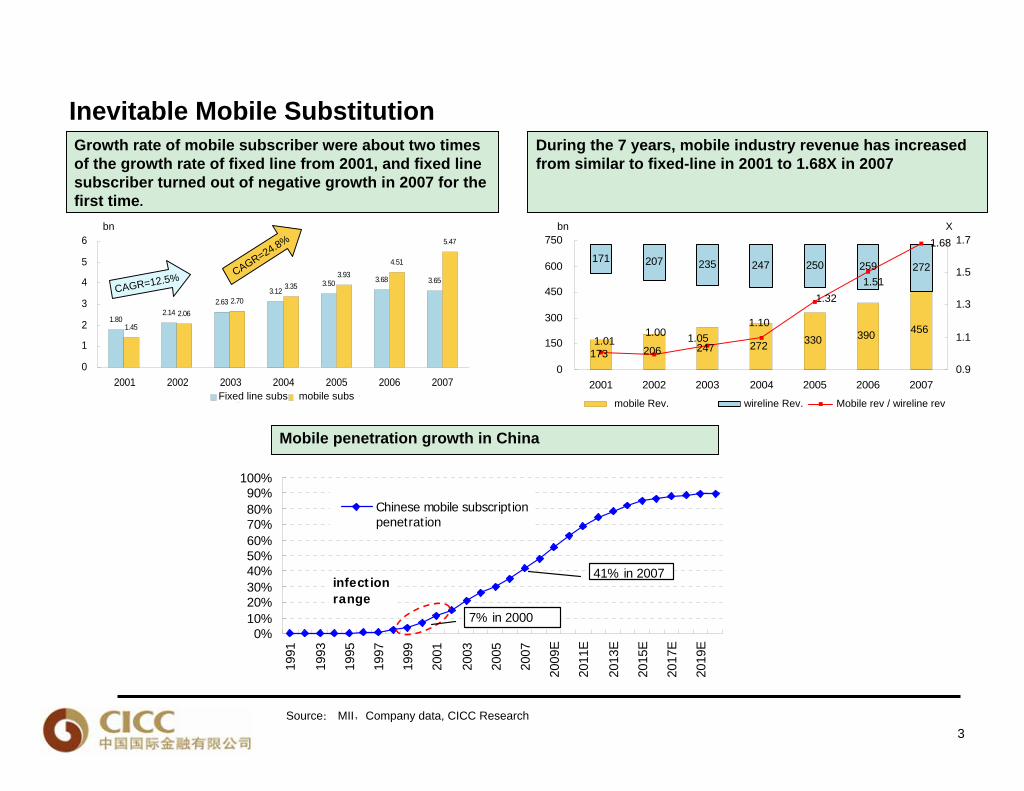
Inevitable Mobile Substitution
1.802.14
2.633.12
3.50 3.68 3.65
1.45
2.062.70
3.353.93
4.51
5.47
0
1
2
3
4
5
6
2001 2002 2003 2004 2005 2006 2007固定电话用户 移动电话用户
Growth rate of mobile subscriber were about two times of the growth rate of fixed line from 2001, and fixed line subscriber turned out of negative growth in 2007 for the first time.
bn
CAGR=24.8%
CAGR=12.5%
During the 7 years, mobile industry revenue has increased from similar to fixed-line in 2001 to 1.68X in 2007
bn X
Source: MII,Company data, CICC Research
Mobile penetration growth in China
0%10%20%30%40%50%60%70%80%90%
100%
1991
1993
1995
1997
1999
2001
2003
2005
2007
2009
E
2011
E
2013
E
2015
E
2017
E
2019
E
Chinese mobile subscriptionpenetration
41% in 2007infectionrange
7% in 2000
Fixed line subs mobile subsmobile Rev. wireline Rev. Mobile rev / wireline rev

4
Industry Estimate: Subscriber Enlarged, Revenue Increased steadily
0%
25%
50%
75%
100%
125%
150%
0 20,000 40,000 60,000 80,000 100,000 120,000 140,000
2001年各省渗透率 2006年各省渗透率 2020年各省渗透率
线性 (2001年各省渗透率) 线性 (2006年各省渗透率) 线性 (2020年各省渗透率)
Penetration%
GDP/capita
Source:MII,National Bureau of Statistics of China,CEIC,CICC research
0%
25%
50%
75%
0 50,000 100,000 150,000 200,000
2001年各省渗透率 2006年各省渗透率 2020年各省渗透率
线性 (2001年各省渗透率) 线性 (2006年各省渗透率) 线性 (2020年各省渗透率)
Penetration%
GDP/capita
Wireless penetration expected to be 80% in 2020
Mobile subscriber increased further, fixed-line subscribers would not decrease significantly
Fixed-line penetration expected to be stable at around 20-25% in 2020
Industry revenue increased steadily
-200400600800
1,0001,2001,4001,6001,800
1998 1999 2000 2001 2002 2003 2004 2005 2006 2007 2008E 2009E 2010E 2011E 2012E 2013E 2014E 2015E 2016E 2017E 2018E 2019E 2020E
Rmb bn
0%
1%
2%
3%
4%
Telecom industry revenue Telco rev as a % of GDP
Telecom industry revenue growth in line with the growthrate of nominal GDP
Penetration 2001 Penetration 2006 Penetration 2020Linear penetration 2001 Linear penetration 2006 Linear penetration 2020
Penetration 2001 Penetration 2006 Penetration 2020Linear penetration 2001 Linear penetration 2006 Linear penetration 2020

5
Broadband: Chinese addressable broadband market
Broadband and Data business is a promising resort for fixed-line operators
inflection point
0%
5%
10%
15%
20%
25%
30%
35%
40%
45%
50%
2003
2004
2005
2006
2007
2008
E
2009
E
2010
E
2011
E
2012
E
2013
E
2014
E
2015
E
2016
E
2017
E
2018
E
2019
E
2020
E
Chinese internet users penetrationChinese broadband users penetrationChinese broadband subscription penetration
210.2mn
163.4mn
693mn
679mn
245mn
About 3 users translateinto 1 broadbandsubscription
Still likely to be too conservative;as we made the same mistakes inforecasting mobile users years ago
inflection range
66.5mn
Source: CICC Research
We expect China’s total number of internet users & broadband subscriptions to double in 3 years and triple in 9.
Still low compared to many countries’ current levels of internet penetration (80%) or broadband subscription penetration (30%).
Please refer to our recent report: “China Broadband Addressable Market Analysis”

6
Still large industry upsides; provide room for “win-win”
Source: CICC Research
0%
10%
20%
30%
40%
50%
60%
70%
80%
90%
100%
- 10,000 20,000 30,000 40,000 50,000 60,0000%
10%
20%
30%
40%
50%
60%
70%
80%
90%
100%
- 10,000 20,000 30,000 40,000 50,000 60,0000%
10%
20%
30%
40%
50%
60%
70%
80%
90%
100%
- 10,000 20,000 30,000 40,000 50,000 60,0000%
10%
20%
30%
40%
50%
60%
70%
80%
90%
100%
- 10,000 20,000 30,000 40,000 50,000 60,000
trend-line of year 2000
trend-line since 2007
33 provinces/cities in 2000
33 provinces/cities in 2007
33 provinces/cities in 2020
33 provinces/cities in 2010
Penetration rate moves up not onlyalong the trend line with GDP/capgrowth; but the trend line itself canactually move up over time (e.g.from 2000 to 2007)
mobilepenetration
GDP/cap (RMB)
Year 2002 2003 2004 2005 2006 2007 2008 2009 2010 2011 2012 2013 2014 2015 2016 2017 2018 2019 2020 Nominal GDP (Rmb 100mn) 119,096 135,174 159,587 184,739 211,808 246,545 284,759 321,920 362,627 403,533 447,730 490,968 537,077 580,861 626,965 669,244 713,207 755,372 798,964Nominal GDP YoY (%) 10.2 13.5 18.1 15.8 14.7 16.4 15.5 13.1 12.6 11.3 11.0 9.7 9.4 8.2 7.9 6.7 6.6 5.9 5.8Real GDP (Rmb 100mn) base yr=1978 32,728 36,001 39,637 43,760 48,617 54,159 60,117 65,527 71,425 77,139 83,310 89,142 95,382 101,105 107,171 112,529 118,156 123,473 129,029Real GDP YoY (%) 9.1 10.0 10.1 10.4 11.1 11.4 11 9 9 8 8 7 7 6 6 5 5 4.5 4.5Inflation Rate (%) 1.1 3.5 8.0 5.4 3.6 5.0 4.5 4.1 3.6 3.3 3.0 2.7 2.4 2.2 1.9 1.7 1.6 1.4 1.3 Population (mn) 1,285 1,292 1,300 1,308 1,314 1,294 1,300 1,308 1,316 1,324 1,331 1,337 1,342 1,346 1,351 1,355 1,360 1,366 1,371 Nominal GDP per Capita (Rmb) 9,272 10,460 12,277 14,129 16,113 19,049 21,899 24,615 27,547 30,488 33,647 36,729 40,020 43,149 46,419 49,376 52,424 55,307 58,259Total Telecom Revenue (Rmb 100mn) 3,341 4,377 5,017 5,723 6,400 7,111 7,935 8,667 9,381 10,010 10,501 11,103 11,715 12,308 12,862 13,378 13,892 14,422 14,986 -- % of nominal GDP (%) 2.81 3.24 3.14 3.10 3.02 2.88 2.79 2.69 2.59 2.48 2.35 2.26 2.18 2.12 2.05 2.00 1.95 1.91 1.88Potential Revenue Accretion from FMC/Bundling services (theanother 30% upside we assigned to CT) (Rmb 100mn)
823 819 837 855 893 941 991 1,048 1,121 1,198 1,279 1,366 1,460
-- % of nominal GDP w/ FMC synergy (%) 2.81 3.24 3.14 3.10 3.02 2.88 3.08 2.95 2.82 2.69 2.54 2.45 2.37 2.30 2.23 2.18 2.13 2.09 2.06
Telecom ARPU (Rmb per month) 22 28 32 36 41 46 51 55 59 63 66 69 73 76 79 82 85 88 91
We expect mobile penetration to grow from 40% today to over 90% in 2020 ------ terminal year with GDP/cap forecast of US$7,800.
Still 1/3 of provinces with penetration rate below 30% and GDP/cap around US$1500.
Value-added service at primary level----- Data, FMC & bundling “start from zero”.

7
“Win-win” in the industry’s 2 battlefields:Low-end fully competitive market and high-end still monopoly market
Source: CICC Research
Still large industry potential + Rational competition tactics
Hig
h-e
nd M
arke
tLo
w-e
nd M
arke
t
• Cut-throat competition
• Abnormal pre-restructuring morale/incentive & regulation
• Still monopoly market: higher tariff, ARPU & MOU, Major contributor of revenue & profit
• High entry barrier: high-end users are pickier; preparation and implementation competence needed to cut in
One industry, two battlefields
• Leader retaliates fast and fierce,whose per minute tariff is 20-40% lower; sales forces are 3-5x stronger
• Harsher competition will lead to harsher/asymmetric regulation
• Followers maintain rather low market share and grow along with the market
• Leader leaves certain mkt share for the followers to avoid asymmetric regulation
• Leader can’t afford to cut tariff across the board, where it dominates and generates most of its profit
• Followers limited by capacity and ability – unable to gain much by too-aggressive price warring, but may lose profitability and force leader to fight back
• Leader still reaps most profit by keep the tariff stable instead of initiating price war
• Followers nibble small pieces from the leader – makes leader worse off by forcing it to fight back; small pieces each time is good enough for the follower
Price wars No price wars
• Leader retaliates fast and fierce,per minute tariff is 20-40% lower; sales forces are 3-5x stronger; and gains subsidies from high-end mkt
• Harsher competition will lead to harsher/asymmetric regulation
Still large industry potential + Rational competition tactics
Hig
h-e
nd M
arke
tLo
w-e
nd M
arke
t
• Cut-throat competition
• Abnormal pre-restructuring morale/incentive & regulation
• Still monopoly market: higher tariff, ARPU & MOU, Major contributor of revenue & profit
• High entry barrier: high-end users are pickier; preparation and implementation competence needed to cut in
One industry, two battlefields
• Leader retaliates fast and fierce,whose per minute tariff is 20-40% lower; sales forces are 3-5x stronger
• Harsher competition will lead to harsher/asymmetric regulation
• Followers maintain rather low market share and grow along with the market
• Leader leaves certain mkt share for the followers to avoid asymmetric regulation
• Leader can’t afford to cut tariff across the board, where it dominates and generates most of its profit
• Followers limited by capacity and ability – unable to gain much by too-aggressive price warring, but may lose profitability and force leader to fight back
• Leader still reaps most profit by keep the tariff stable instead of initiating price war
• Followers nibble small pieces from the leader – makes leader worse off by forcing it to fight back; small pieces each time is good enough for the follower
Price wars No price wars
• Leader retaliates fast and fierce,per minute tariff is 20-40% lower; sales forces are 3-5x stronger; and gains subsidies from high-end mkt
• Harsher competition will lead to harsher/asymmetric regulation
Low-end mkt is already over competitive:
• Followers avoid price war as CM can cut into their cost.
• CM can’t fight further before triggering asymmetric regulation.
• Current competition is overdue as regulation is abnormally loose in “waiting for restructuring”.
High-end mkt is still monopolized by CM:
• CT’s ability and preparation make it able to slice small pieces (and only small pieces) gradually.
• CM is unfavorable to fight back in its dominantly controlled mkt for small mkt share loss.

8
New China UnicomFixed line + GSM + WCDMA
New China TelecomFixed line + CDMA + CDMA2000
China MobileGSM+TD-SCDMA
VendorsWeak
supply-side
power
SP/CPsUse to be weak,
may have higher
bargaining power
going forward
Very High Entry Barrier due to strict regulation
Large country; hard for network build-up and sales…
Mobile
substitution
Mobile substitution
Data
substitution
Post-Restructuring Industry Landscape
9
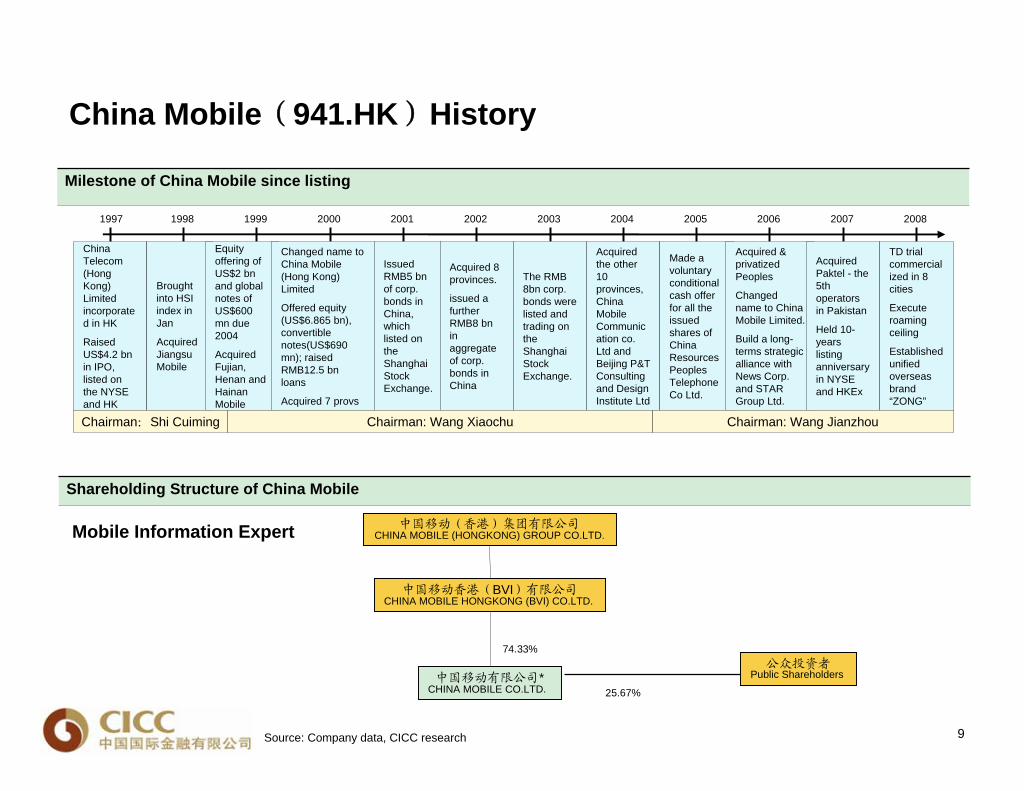
China Mobile(941.HK)History
中国移动(香港)集团有限公司CHINA MOBILE (HONGKONG) GROUP CO.LTD.
中国移动有限公司*CHINA MOBILE CO.LTD.
中国移动香港(BVI)有限公司CHINA MOBILE HONGKONG (BVI) CO.LTD.
1997 1998 1999 2000 2001 2002 2003 2004 2005 2006 2007 2008
China Telecom (Hong Kong) Limited incorporate d in HK
Raised US$4.2 bn in IPO, listed on the NYSE and HK
Brought into HSI index in Jan
Acquired Jiangsu Mobile
Equity offering of US$2 bn and global notes of US$600 mn due 2004
Acquired Fujian, Henan and Hainan Mobile
Changed name to China Mobile (Hong Kong) Limited
Offered equity (US$6.865 bn), convertible notes(US$690 mn); raised RMB12.5 bn loans
Acquired 7 provs
Issued RMB5 bn of corp. bonds in China, which listed on the Shanghai Stock Exchange.
Acquired 8 provinces.
issued a further RMB8 bn in aggregate of corp. bonds in China
The RMB 8bn corp. bonds were listed and trading on the Shanghai Stock Exchange.
Acquired the other 10 provinces, China Mobile Communic ation co. Ltd and Beijing P&T Consulting and Design Institute Ltd
Made a voluntary conditional cash offer for all the issued shares of China Resources Peoples Telephone Co Ltd.
Acquired & privatized Peoples
Changed name to China Mobile Limited.
Build a long- terms strategic alliance with News Corp. and STAR Group Ltd.
Acquired Paktel - the 5th operators in Pakistan
Held 10- years listing anniversary in NYSE and HKEx
TD trial commercial ized in 8 cities
Execute roaming ceiling
Established unified overseas brand “ZONG”
Chairman:Shi Cuiming Chairman: Wang Xiaochu Chairman: Wang Jianzhou
Milestone of China Mobile since listing
Shareholding Structure of China Mobile
Source: Company data, CICC research
Mobile Information Expert
74.33%公众投资者
Public Shareholders
25.67%

10
New business expanded
Source: Company data, CICC research
23%26%
2% 3%6%
10%
16%
21%
0%
5%
10%
15%
20%
25%
30%
2000 2001 2002 2003 2004 2005 2006 2007
New business as a % of total revenue
As a % of total revenue
Revenue distribution in 2007 of China Mobile
China Mobile Revenue Distribution
Usage
Monthly
VAS
Inter-connection
6%
26%
5%
63%
SKT Revenue Distribution
Usage
Monthly
VAS
Inter-connection30%
27%
10%
33%
NTT DoCoMo Revenue Distribution
Voice rev
VAS
PHS &Other
29%
3%
68%
China Mobile VAS ARPU
16.6
19.4
23.024.2 24.6
-
5
10
15
20
25
2003 2004 2005 2006 2007
VAS ARPU

11
Optimize and Improve Revenue-drivingProducts
Revenue Scale
Positioning ServiceMobile TV
Mobile Payment
Mobile Gaming
Mobile Mailbox
MMSColor Ring
WAP
SMS
Caller ID
Mobile Paper
FetionCentral Music
Download
Wireless Music ClubGrowth Products to Surpass Important
Threshold
Wireless Advertising
Development Focus on PotentialProducts
Mobile Search
Subscriber Scale
Express News
12580
•In 40 billions: SMS•In 10 billions: Caller ID, Mobile Music, WAP•In billions: MMS, Mobile Gaming, Weather Forecast…
More than 100 provincial-level products with good marginal benefits, e.g. mobile secretary, over-the-air recharging, etc.
Abundant Applications to Meet Different Demands
Value-added Business A Stratified Product Reserve for Sustainable Development

12
Value-added Business Non-SMS Data Business Shows Vibrant Development
* As of August 2007
** As of September 2007
Wireless music club members: 53mn*, monthly growth rate 16.2%
Paid subscribers: 21mn*, grew strongly at nearly 2.5mn per month
Subscribers grew rapidly at 6mn per month, exceeding 50mn*
Mobile Music
“Mobile Paper”
“Fetion”Co-operate with banks, railway, chain stores, etc.
Mobile Securities Trading
Mobile Payment
Mobile TV
Revenue: RMB 5bn in 1H2007, up 90.3% YoY
Color Ring
WAP
MMS
Revenue: RMB 4.4bn in 1H2007, up 45.8% YoY
Revenue: RMB 0.7bn in 1H2007, up 76.0% YoY
Subscribers around 590K**
Work with CCTV, SMG, CNR, CRI & other well-known media
Revenue-driving products
GrowthproductsPotential
products

13
Rural Market Effective Strategy Delivers Significant Contribution
2007.3 2007.6
17.8220.10
24.82
2006.12
12.8%23.5%
Rural market contributed
significantly to our overall
performance
Well received by the market, driving subscriber growthEffectively enhanced customer loyalty and lowered churn rate Propelled revenue, further boosting the proportion of data business to total revenuePromoted rural informationalization
"Agricultural Information Access" provides rural customers with practical and updated information, via SMS, voice and the Internet
(Million)
Agricultural Information Access Subscribers
Relatively low penetration rate in rural areasPer capita income of rural residents continued to growStrong support from new rural policy Users’ entry barrier further loweredAppropriate marketing strategy

14
Rural Market Promoting Rural Informationalization
Agricultural Information
Access
Policy &Regulation
News Express
Pre-warningInformation
AgriculturalScience &Technology
PriceInformation
HealthCare
EmploymentInformation
Supply &Demand
AgriculturalWeather
Driving Forces Business Platform
Market Trends
Government Initiative
Farmers Initiative

15
Equity Value of China Mobile
DCF model of China Mobile
Source: Company data, CICC Research
(Rmb mn)December yearend 2005 2006 2007 2008E 2009E 2010E 2011E 2012E 2013E 2014E 2015E 2016E 2017E 2018E 2019E 2020E Subscriber growth 20.7% 22.1% 22.6% 23.5% 14.5% 9.7% 7.6% 6.5% 5.0% 3.8% 3.3% 2.8% 2.4% 2.0% 1.7% 1.4%ARPU 90.0 90.0 89.0 87.0 83.7 82.2 82.0 82.4 83.2 84.0 84.9 85.9 86.8 87.8 88.9 90.0 Revenue growth 19.1% 21.5% 20.9% 20.7% 14.0% 10.0% 8.4% 7.6% 6.6% 5.4% 4.6% 4.1% 3.7% 3.4% 3.1% 2.8%EBITDA margin 54.9% 54.0% 54.3% 54.2% 53.1% 52.6% 52.1% 51.8% 51.5% 51.2% 51.0% 50.8% 50.5% 50.3% 50.1% 49.9%Capex/reported sales 29.4% 29.5% 29.4% 29.5% 28.0% 26.0% 24.0% 22.0% 20.0% 19.0% 19.0% 18.5% 17.5% 17.0% 16.5% 16.0%Debt/total capital 11.8% 10.3% 8.3% 7.1% 6.2% 5.5% 4.2% 3.8% 3.5% 3.2% 3.0% 2.8% 0.0% 0.0% 0.0% 0.0%EBIT * (1-tax rate) 52,703 64,674 85,259 116,332 133,627 145,816 158,389 170,713 182,267 192,821 200,981 209,220 216,460 222,395 228,561 234,369 Growth (%) 21.9% 22.7% 31.8% 36.4% 14.9% 9.1% 8.6% 7.8% 6.8% 5.8% 4.2% 4.1% 3.5% 2.7% 2.8% 2.5%Depreciation and amortization 56,368 64,777 67,354 74,269 82,528 89,510 93,749 98,584 103,142 105,886 109,706 112,757 115,947 119,881 122,410 125,044Write-off of PPE 5,645 2,857 2,788 3,781 4,007 3,908 4,022 3,950 3,846 3,723 3,748 3,752 3,877 3,929 4,080 4,146Other non-cash items 2,968 3,852 3,872 3,949 4,028 4,109 4,191 4,275 4,361 4,448 4,537 4,627 4,720 4,814 4,911 5,009Change in working capital 11,128 10,380 1,856 4,101 650 1,612 -1,580 560 -2,223 -262 -3,270 -928 -3,944 -1,566 -4,534 -2,096Capital expediture -71,500 -87,000 -105,100 -127,148 -137,544 -140,457 -140,542 -138,592 -134,364 -134,583 -140,777 -142,755 -140,088 -140,675 -140,705 -140,231 Growth (%) 10.6% 21.7% 20.8% 21.0% 8.2% 2.1% 0.1% -1.4% -3.1% 0.2% 4.6% 1.4% -1.9% 0.4% 0.0% -0.3%Free cash flows 57,312 59,540 56,029 75,283 87,297 104,497 118,230 139,490 157,028 172,032 174,924 186,674 196,972 208,778 214,723 226,241 Growth (%) 36.6% 3.9% -5.9% 34.4% 16.0% 19.7% 13.1% 18.0% 12.6% 9.6% 1.7% 6.7% 5.5% 6.0% 2.8% 5.4%FCF margin 23.6% 20.2% 15.7% 17.5% 17.8% 19.3% 20.2% 22.1% 23.4% 24.3% 23.6% 24.2% 24.6% 25.2% 25.2% 25.8%WACC 10.3%Discount factor at WACC 0.79 0.87 0.96 1.06 1.17 1.29 1.42 1.57 1.73 1.91 2.11 2.33 2.57 2.83 3.12 3.45Discounted FCF-now 58,397 71,115 74,740 81,086 83,148 88,911 90,714 90,073 83,009 80,287 76,780 73,759 68,754 65,657Discounted FCF-1yrs forward 78,465 82,464 89,466 91,742 98,100 100,090 99,382 91,588 88,585 84,716 81,382 75,860 72,442Discounted FCF-2yrs forward 90,987 98,712 101,223 108,239 110,434 109,653 101,053 97,740 93,471 89,793 83,700 79,929
Now WACC calculation2008-17
NPV of cash flows 904,597 Ke = 11.1%PV of terminal value 1,109,509 Kd = 4.60%Enterprise value 2,014,106 t = 25.0%Terminal value as % of EV 55% Rf = 4.50%Net cash (year end 2006, 2007,2008) 154,894 Equity risk premium= 6.0%Dividends Paid before the Net Cashcalculation 34,088Equity value 2,203,088 B = 1.10Shares at year end (mn) 20,032 E(Rm) = 10.5%Equity value/share (Rmb) 109.98 WACC = 10.3%Exchange rate 0.87 Debt/capital 10%Equity value/share (HK$) 126.01 Equity/capital 90%Equity value/Subscriber (Rmb) 4,828 Debt/capital (10 yr avera 5%Perpetual growth 3.0%Implied terminal value exit multiple (x) 13.6

16
2005 20062004 2007Payout Ratio Final DividendInterim Dividend Special Interim Dividend Special Final Dividend
2003
42%
33%
21%
39%43%
Dividend and Payout Ratio
0.360.200.160.16
0.46
0.200.20
0.66
0.450.45
1.02
0.57
0.620.62
1.383
0.763
0.090.090.069
0.8370.837
0.0850.085
(HK$)
0.159
Favorable and Continued Dividend Growth

17
Valuation Is About Historical Average
PE Band of China Mobile
Source: Company data, CICC research
China Mobile Foward PE Band
020406080
100120140160180200220240
Jan-
03
Jul-0
3
Jan-
04
Jul-0
4
Jan-
05
Jul-0
5
Jan-
06
Jul-0
6
Jan-
07
Jul-0
7
Jan-
08
Jul-0
8
Jan-
09
Jul-0
9Stock Price 6.0 x 12.0 x 18.0 x 24.0 x
Share price
(HK$)Report date Price Comments on 2002 2003 2004 2005 2006 2007 2008 2009 2002 2003 2004 2005 2006 2007 2008 2009
2002 15-Aug-02 21.80 1H02 results 1.68 1.80 1.89 X X X X X 13.90 13.00 12.40 X X X X X2003 21-Oct-03 23.15 3Q03 results X 1.82 1.73 1.64 X X X X 14.10 13.50 14.20 15.00 X X X X
17-Dec-03 23.05 10P acquisition plan X 1.82 1.85 1.83 X X X X 14.10 13.40 13.20 13.30 X X X X2004 21-Apr-04 21.85 1Q04 results X X X X X X X X X X X X X X X X
3-May-04 20.60 10P acquisition deal X X 2.00 2.04 1.85 X X X X 11.60 10.85 10.67 11.80 X X X19-Aug-04 21.65 1H04 results X X 2.00 2.16 X X X X 13.20 12.70 11.50 10.60 X X X X
2005 14-Mar-05 25.60 FY04 results X X 2.20 2.34 2.47 X X X X X 12.40 11.60 11.00 X X X21-Apr-05 25.45 1Q05 results X X X 2.37 2.51 X X X X X 12.30 11.40 10.70 X X X
4-Jul-05 29.10 Revise valuation X X X 2.41 2.57 X X X X X 14.06 12.82 12.02 X X X11-Aug-05 34.45 1H05 results X X X 2.56 2.83 X X X X 20.70 16.30 14.00 12.70 X X X21-Oct-05 34.55 3Q05 results X X X 2.59 2.96 X X X X 20.80 16.40 13.90 12.10 X X X5-Dec-05 39.80 Downgrade to Accu X X X 2.59 2.93 3.20 X X X X 19.24 16.01 14.14 12.94 X X
2006 17-Mar-06 37.60 FY05 results X X X X 3.17 3.57 X X X X 18.17 14.43 12.33 10.94 X X21-Apr-06 46.75 1Q06 results X X X X 3.41 3.85 X X X X 22.60 17.94 14.25 12.62 X X18-Aug-06 51.70 1H06 results X X X X 3.26 3.87 4.24 X X X X 19.80 16.30 13.80 12.60 X23-Oct-06 59.10 3Q06 results X X X X 3.38 4.00 4.50 X X X X 22.50 18.00 15.20 13.50 X
2007 22-Mar-07 73.65 FY06 results X X X X X 4.05 4.73 X X X X 27.20 22.20 17.30 14.00 X20-Apr-07 74.90 1Q07 results X X X 2.71 3.32 3.99 4.67 X X X X X X 17.80 14.40 X8-Jun-07 72.85 Sector report X X X 2.71 3.32 3.99 4.67 X X X X 26.30 21.50 17.00 13.80 X
15-Aug-07 80.85 1H07 results X X X 2.71 3.32 4.07 4.85 X X X X 29.80 24.40 18.90 15.00 X30-Jun-08 104.80 Current Forecast X X X 2.71 3.32 4.35 5.96 6.87 X X X 40.19 31.72 22.60 15.36 12.37
EPS Forecast (RMB) P/E
China Mobile v.s. MSCI China
CM/MSCI China
60%70%80%90%
100%
110%120%130%140%150%
Jan-
03
May
-03
Sep-
03
Jan-
04
May
-04
Sep-
04
Jan-
05
May
-05
Sep-
05
Jan-
06
May
-06
Sep-
06
Jan-
07
May
-07
Sep-
07
Jan-
08
May
-08

18
Global Operators Valuation
Source: Bloomberg, CICC research, Note: data based on 30 June 2008
Company Curcy Close Price Market CapEBITDAmargin
Netmargin ROE
(Local Cury) (USD mn) 07A 08E 09E 07A 08E 09E 07A 08E 09E 07A 08E 09E 07A 07A 07ADomestic operatorsChina Mobile HKD 104.80 269,147 22.6 15.2 12.2 5.3 4.2 3.3 9.6 7.3 5.7 2.0% 3.0% 3.9% 54.3% 24.4% 25.1%China Unicom HKD 14.48 25,311 25.0 21.3 16.4 1.9 1.7 1.5 6.0 5.0 4.2 1.5% 1.9% 2.7% 33.2% 7.5% 7.9%China Telecom HKD 4.24 43,994 15.8 13.1 11.4 1.4 1.2 1.1 5.0 4.4 3.8 2.0% 2.4% 2.8% 49.0% 11.6% 10.6%China Netcom HKD 21.25 18,183 13.3 12.4 11.1 1.6 1.4 1.2 4.8 4.2 3.7 2.8% 3.4% 3.2% 50.0% 12.1% 12.8%Average 19.2 15.5 12.8 2.6 2.1 1.8 6.3 5.2 4.4 2.1% 2.7% 3.1% 46.6% 13.9% 14.1%US operatorsVerizon USD 35.4 100,912 18.5 13.5 12.2 2.1 2.0 1.9 5.4 4.9 4.5 4.7% 4.9% 5.0% 32.1% 5.9% 14.7%Sprint Nextel USD 9.5 27,085 -0.9 105.6 109.2 1.2 1.3 1.4 4.5 6.1 6.2 1.1% 0.3% 0.2% 25.6% -73.7% -4.4%AT&T USD 33.69 200,152 17.3 11.1 9.9 1.8 1.8 1.7 6.5 5.9 5.6 4.2% 4.7% 5.0% 35.3% 10.1% 15.5%Average 11.6 43.4 43.8 1.7 1.7 1.7 5.5 5.7 5.4 3.3% 3.3% 3.4% 31.0% -19.2% 8.6%Europe operatorsBritish Telecom GBP 2.00 30,728 9.1 8.4 8.1 2.9 3.4 3.1 4.3 4.2 4.1 8.0% 8.2% 8.6% 28.0% 8.4% 45.5%Vodafone GBP 1.49 158,302 11.5 11.3 10.4 1.0 1.0 1.0 n.m. 7.2 6.8 5.4% 5.4% 5.7% 37.0% 18.8% 9.9%Deutsche Telecom EUR 10.46 71,460 80.5 13.8 12.2 1.1 1.1 1.1 5.2 4.5 4.4 7.5% 7.6% 7.9% 26.3% 0.9% 7.6%France Telecom EUR 18.71 76,916 7.7 9.3 8.8 1.6 1.6 1.5 4.8 4.8 4.7 6.9% 7.4% 7.8% 36.3% 11.9% 17.1%Telefonica EUR 16.88 126,703 9.0 10.5 9.1 4.0 3.4 2.9 5.7 5.8 5.5 4.4% 5.9% 6.8% 40.4% 15.8% 32.4%Telecom Italia EUR 1.28 36,692 9.8 9.8 9.4 1.0 0.9 0.9 5.3 5.0 5.0 6.3% 6.6% 7.0% 37.1% 7.8% 9.3%Average 21.3 10.5 9.7 1.9 1.9 1.7 5.1 5.2 5.1 6.4% 6.9% 7.3% 34.2% 10.6% 20.3%Korea operatorsKT KRW 45,100.00 11,856 8.8 10.2 9.2 1.0 1.0 0.9 3.1 2.9 2.8 4.4% 4.6% 5.0% 30.4% 8.0% 9.6%SK Telecom KRW 190,000.00 14,736 8.4 11.2 9.9 1.2 1.4 1.3 4.5 4.3 4.3 4.9% 4.7% 5.2% 35.7% 14.6% 12.9%KTF KRW 27,750.00 5,108 21.7 14.0 13.4 1.2 1.3 1.2 4.0 4.1 4.2 0.0% 2.3% 2.6% 21.7% 3.4% 6.0%Average 13.0 11.8 10.8 1.2 1.2 1.1 3.9 3.8 3.8 3.1% 3.9% 4.3% 29.3% 8.6% 9.5%Japanese operatorsNTT DoCoMo JPY 158,000.00 66,838 13.9 13.1 13.2 1.6 1.5 1.4 4.3 4.2 4.3 3.0% 3.1% 3.2% 33.6% 10.4% 11.7%KDDI Corporation JPY 662,000.00 27,990 13.6 11.3 10.3 1.8 1.6 1.4 4.6 4.0 3.6 1.6% 1.7% 1.8% 21.1% 6.1% 14.7%Average 13.7 12.2 11.7 1.7 1.5 1.4 4.5 4.1 3.9 2.3% 2.4% 2.5% 27.4% 8.2% 13.2%Other Asia operatorsTelekom Malaysia MYR 3.20 3,505 4.3 13.4 12.6 0.6 1.0 1.0 1.8 6.6 6.3 10.9% 7.3% 7.5% 41.6% 14.3% 7.1%MobileOne SGD 1.86 1,222 10.3 10.3 10.0 8.1 7.0 6.6 5.9 5.8 5.7 5.9% 8.3% 8.7% 39.6% 21.4% 75.9%Singtel SGD 3.59 41,951 14.4 14.0 12.9 2.7 2.5 2.3 13.9 11.8 11.4 3.3% 3.7% 4.1% 29.6% 26.7% 18.6%PLDT PHP 2,350.00 9,859 12.5 11.6 10.3 4.2 3.8 3.6 5.3 5.1 4.8 7.8% 7.4% 8.4% 62.8% 26.1% 33.8%Chunghwa Telecom TWD 76.10 23,963 16.7 15.3 14.4 1.8 2.0 1.9 6.3 6.1 6.0 n.m. 5.7% 6.4% 54.0% 25.9% 13.1%Taiwan Mobile TWD 52.40 6,562 23.7 12.0 11.0 3.0 3.3 3.1 7.5 7.4 7.3 5.0% 6.8% 7.6% 45.3% 12.9% 33.0%Average 13.6 12.8 11.9 3.4 3.3 3.1 6.8 7.1 6.9 6.6% 6.5% 7.1% 45.5% 21.2% 30.2%
P/B Dividend yieldP/E EV/EBITDA

19
0
20
40
60
80
100
120
1997 1998 1999 2000 2001 2002 2003 2004 2005 2006 2007
沃达丰 中国移动 AT&T DOCOMO
China Mobile v.s. Worldwide Peers
050100150200250300350400
1997 1998 1999 2000 2001 2002 2003 2004 2005 2006 2007
沃达丰 中国移动 AT&T DOCOMO
CM: largest subscriber base
mn
0%
10%
20%
30%
40%
50%
1997 1998 1999 2000 2001 2002 2003 2004 2005 2006
沃达丰 中国移动 AT&T DOCOMO
DOCOMO: highest local penetration
CM: lowest ARPU
USD
CM: ARPU relative to average GNI is still higher
0%
2%
4%
6%
8%
10%
1997 1998 1999 2000 2001 2002 2003 2004 2005 2006
沃达丰 中国移动 AT&T DOCOMO
The ratio was 50% of CM in 1999ARPU/GNI per capita
Vodafone CM Vodafone
Vodafone Vodafone
CM
CM CM

20
Distinct Strategic Intent of China Mobile
Overseas mkt strategy
After becoming the controlling shareholder of Paktel, CM promoted unified overseas brand – “ZONG”, which established a foundation of overseas market development.
CM adopt cautious attitude towards overseas deploitation; it would become the next Vodafone if it were over aggressive .
Participating foreign operators operation as a minor shareholder, will finally achieve the controlling objective via steady expansion.
New media industry
CM assigned new CEO (Ye Bing) for wholly-owed subsidiary ASPire, and position the company under a more free structure. Aspriewould develop wireless internet and VAS and improve CM’s industry structure in future information society.
CM’s original cooperation maybe change when it tries to enter internet and SP domain. CM maybe will not realize full coverage towards these domain, but will adopt new strategy to cooperate with SPs.
CM entered strategic cooperation with Peonix, News Corp and Star movie in 2006, preparing to enter media industry.
Restructuring and TD
Restructuring would not bring significant negative pressure. On the contrary, inducing competition would become CM’s impetus to pursue new growth business (eg. going abroad)
TD-SCDMA, more than a 3G standard, is more a state developed communication standard. CM’s voluntarily assuming responsibility of TD trial network construction means politics intent more than commercial intent. However, TD’s capability is greatly different with CDMA2000 and WCDMA, so CM has no much incentive to promote TD and maybe will regard TD as the transition product to 4G.
CM commit himself to LTE development. It is obvious that the company intends to evolve wireless broadband and media info industry.
Rural business
CM commenced to expand to rural market from 2004, which promote resources utilization through marketing tunnel and brand recognition. It provides information related to rural production, daily life and work force info, which was welcomed by rural subs. This increased sub stickness and promoted rural informatization
CM allure rural subs via low tariff and has had good achievement at present. In the future, rural market will become the important resource of sub net adds and revenue growth driver.

21
Key Financial and Operating Data of China Mobile
Key financial and operating data, valuation and financial ratios
Source: Company data, CICC research
(Rmb mn) 2006A 2007A 2008E 2009E 2010E 2006A 2007A 2008E 2009E 2010EProfit and loss Operating dataOperating revenue 295,358 356,959 431,010 491,227 540,221 Subscribers (mn) 301.2 369.3 456.3 522.4 573.1 Operating cost (138,656) (165,537) (199,152) (232,028) (257,652) MOU 381 455 536 639 709 EBITDA 159,574 194,003 233,627 260,697 283,931 Blended ARPU 90.0 89.0 87.0 83.7 82.2 Depreciation and amortizatio (64,777) (67,354) (74,269) (82,528) (89,510) Data ARPU 24.2 24.6 24.9 24.8 25.1 Interest income 2,604 4,015 5,472 6,657 7,827 Annual Churn rate 33% 32% 31% 31% 30%Interest expense (1,510) (1,825) (2,003) (2,003) (2,003) Usage tariff 0.15 0.12 0.10 0.08 0.07 Profit before tax 96,908 129,238 163,621 183,727 201,239 SMS volume (bn) 353 503 703 920 1,126 Net income 66,026 87,062 119,295 137,629 150,747 ValuationEPS (Rmb) 3.32 4.35 5.96 6.87 7.53 P/E 31.7 22.6 15.4 12.4 11.3 EPS (HKD) 3.30 4.64 6.82 8.47 9.28 EV/EBITDA 13.3 9.6 7.2 5.8 5.2 DPS (HKD) 1.54 2.10 3.15 4.05 4.88 P/B 6.6 5.3 4.2 3.3 2.9 Cash flow Dividend yield 1.5% 2.0% 3.0% 3.9% 4.7%Cash flow from Operating 149,346 168,612 203,509 225,204 245,777 FCF yield 3.0% 3.1% 4.6% 5.9% 7.3%Cash flow from Investing (118,841) (123,039) (138,230) (149,543) (160,485) Financial ratioCash flow from Financing (23,587) (37,635) (49,316) (62,413) (74,513) EBITDA margin 54.0% 54.3% 54.2% 53.1% 52.6%Net cash inflow 6,918 7,938 15,963 13,248 10,779 Net profit margin 22.4% 24.4% 27.7% 28.0% 27.9%Balance sheet FCF margin 20.2% 15.7% 17.5% 17.8% 19.3%Total asset 494,676 563,493 651,692 737,029 825,503 Net cash/Equity (%) 36.6% 41.4% 44.3% 44.7% 46.2%--cash and cash equivalent 153,461 188,544 227,506 261,651 302,187 Dividend payout ratio 42.0% 43.6% 45.0% 47.0% 52.0%Total liability 175,303 189,254 213,142 226,530 243,391 Effective tax rate 31.8% 32.5% 27.0% 25.0% 25.0%--total debt 36,638 33,650 33,650 33,650 33,650 Capex/sales 29.5% 29.4% 29.5% 28.0% 26.0%Total Equity 319,002 373,751 437,913 509,697 581,127 ROA 14.4% 16.5% 19.6% 19.8% 19.3%
ROE 22.3% 25.1% 29.4% 29.0% 27.6%ROIC 19.9% 22.8% 27.1% 27.1% 26.0%
22
Risks along with strengths:
Source: CICC research
Strength Weaknesses
Opportunities Threats
SWOT
Analysis

23
The shrinking of traditional business is under control.
The growing new broadband and ICT businesses are strong & sustainable.
Valuations are low.
Good FCF yield may remain even after restructuring.
CDMA: What can CT do that CU can’t?
1. Sales strategy; open market handset for CDMA (LT strategy becomes possible + no need to worry about hurting CU-GSM)
2. Bundle with broadband (free upgrading; Home broadband is self-paid while mobile bill is company- paid)
3. Stop unfavorable internal transactions with the parentco, possibly through leasing fees (or reducing revenue & cost simultaneously; improve margins)
Simulating CT's Growth Potentials 2007 2008 2009 2010 2011 2012 2013Traditional Fixed-line (% of total revenue) 50% 46% 41% 36% 31% 27% 23% -- yoy growth -6% -8% -8% -7% -6% -6% -5%PHS (% of total revenue) 10% 8% 6% 5% 4% 3% 2% -- yoy growth -18% -20% -20% -20% -20% -20% -20%BB+ICT (% of total revenue) 25% 32% 39% 46% 53% 59% 64% -- yoy growth 30% 25% 25% 23% 20% 18% 16%Others (% of total revenue) 15% 15% 14% 14% 13% 12% 11% -- yoy growth 0% 0% 0% 0% 0% 0% 0%
Revenue Growth (-) due to Fixed-line+PHS -4.8% -5.3% -4.5% -3.5% -2.7% -2.1% -1.6%Revenue Growth (+) due to BB+ICT 7.5% 7.9% 9.6% 10.3% 10.6% 10.7% 10.5% -- Revenue Growth (net) 2.7% 2.7% 5.1% 6.8% 7.9% 8.6% 8.8%
Depreciation (% of total revenue) 30.0% 30.0% 29.3% 28.8% 28.5% 28.4% 28.3% -- yoy growth 2.7% 2.7% 5.1% 6.8% 7.9% 8.6%Net profit (% of total revenue) 13% 13% 14% 14% 14% 15% 15% -- yoy growth of net margin 0% 0.0% 5.4% 3.3% 2.1% 1.2% 0.5%Net profit yoy Growth 2.7% 2.7% 10.8% 10.4% 10.2% 9.9% 9.4%
Source: CICC Research
CT (LT Buy, may require patience)

24Source: CICC Research
CU:

25
CT's MKT Cap. relative to CN's MKT Cap.
2.0
2.5
3.0
3.5
4.0
Jan-
07
Feb-
07
Mar
-07
Apr
-07
May
-07
Jun-
07
Jul-
07
Aug
-07
Sep-
07
Oct
-07
Nov
-07
Dec
-07
Jan-
08
Feb-
08
Mar
-08
Apr
-08
May
-08
2 Oct: 3.7X
Source: CICC Research
CN: