china – coming to grips with the new global player · china – coming to grips with the new...
TRANSCRIPT

China – Coming to grips with the new global player
12-11-2006
Horst Siebert *
Kiel Institute for World Economics, Germany, and Bologna Centre, Johns Hopkins
University, Italy.
1. INTRODUCTION
The transformation of the centrally planned economies of Central and Eastern Europe in the 1990s
took place in a disheartening valley of tears. In the reforms that started around 1989, Poland,
Hungary and the then still united Czech and Slovak Republics lost roughly 20 percent of their GDP.
In Russia, where the reforms began in 1991 rather than 1989, the plunge amounted to even more
than 40 percent. East German industrial production collapsed to one third of its former level. The
cause of this J-style transformation curve lay in several phenomena: firms’ products were no longer
competitive under the new conditions, the existing capital stock became obsolete and had to be
rebuilt in a time consuming process, human capital had to adjust and the institutional vacuum of
how property rights would be defined and which line of economic policy would be followed implied
uncertainty for a long time.
* I appreciate critical comments from Richard Pomfret. I am also grateful for comments, including the collection of
data and preparation of tables and figures, from my research assistants Mark Bousfield, Szilard Erhart, Alexander
Schratz and Michael Trinkus.

2
In contrast, China experienced no such J-style transformation curve. Since the Deng Xiaoping
reforms commencing 1978 it has enjoyed high average annual GDP growth rates of nearly ten
percent for the last 25 years. In US dollars, it is now a 2.2 trillion economy with a GDP larger than
the UK (data for 2005).1 It accounts for 5.0 percent of world GDP, representing the world’s fourth
largest economy. Viewed in per capita terms, however, output is still low. Gross national income at
current market prices (GNI) per capita in 2005 stood at US$ 1740, somewhat lower than the average
for the low and middle income countries (US$ 1,918) and 4.0 percent of the US level.2 According to
this measure, China ranks 128th in the world economy.3 World Bank data indicate that 16.6 percent
of the population live below one US (PPP) dollar per day (Data for 2001). All data refer to mainland
China excluding Hong Kong.
A word of caution is in order with respect to the statistical data that underlie this analysis (Holz
2006). In spite of the fact that the data are subject to review by international organizations,
distortions may occur because local and regional politicians have an incentive to massage the
statistically measured results in their favour. For instance, data were heavily distorted in Central and
Eastern Europe prior to the fall of the iron curtain. Moreover, statistical revision of data ex-post is
common for statistical offices of industrialized countries. It would not be surprising if, under
conditions of high growth and stark structural change, revisions are likely to occur in the future. The
1 If not stated otherwise, all data are from the Word Bank’s Country Fact Sheet on China (World Bank 2006a), the
World Development Report 2007 (World Bank 2006b) and the Quarterly Updates (World Bank Office, Beijing 2006 a
and b). Note that the recent data of different institutions are not always consistent. 2 In purchasing power parity China’s GNI amounts to US$ 8.6 trillion, nearly 70 percent of the US GNI of US$ 12.4
trillion and 14 percent of the world’s GNI of US$ 60.6 trillion (2005). Relative to current market prices, purchasing
power parity is an indicator of welfare. It can be seen as denoting economic or even political power. 3 Rank 107 in purchasing power parity (World Bank Development Indicators July 2006).

3
last revision of data in December 2005 by the National Bureau of Statistics, covering the period
since 1993 has brought a downward revision of data on the relative share of investment and an
upward revision on prices, consumption demand and the relative share of the service sector (World
Bank Office, Beijing 2006 a). The revision of data relates only to the production side of
macroeconomic accounting; revision of the expenditure side is still pending. As a consequence,
available data of the macroeconomic accounts on the production and the expenditure side are not
always consistent with each other.
2. THE DRIVERS OF GROWTH
Growth has been spread evenly over the last two and half decades with high average annual real
GDP growth rates of nearly ten percent per decade (Table 1); however quarterly growth rate show a
high volatility . GDP per capita has risen by an average annual real rate of about 8 percent since
1978 (IMF 2006a), real wages have also increased by 8 percent (since 1987). 4According to World
Bank estimates, poverty was reduced by 422 million people in the period 1981-2001, using the
criterion of one US dollar per day income. The two main drivers of growth were exports and
investment.
Table 1 China: Real growth rates of GDP, exports and investment a
4 Calculated with nominal wage increases (ILO 2006) adjusted with the consumer price index (IMF 2006a).

4
a Geometric annual average of growth rates in constant 2000 U.S. dollar prices.
Source: World Bank, World Development Online Indicators, October 2006.
a. Exports as a stimulus for growth
Exports are a major driver of economic growth in China, amounting to 35 percent of GDP (2005).
This figure relates to exports from Mainland China, excluding exports from Hong Kong. Note,
however, that some of mainland China’s exports are shipped through Hong Kong; therefore adding
Hong Kong exports to mainland exports would mean double counting. This high export share is
unusual since large countries normally have a much lower export share. The trade account had a
surplus of 4.4 percent of GDP in 2005, the current account surplus stood at 7.2 percent of GDP.
China has a world market share of 6.8 percent, measured in terms of merchandise trade (2005).
Chinese exports have risen in real terms at the rapid rate of 12.4 percent since 1980, while world
merchandise exports expanded at 4.9 percent in same period; in the period 1995-2005 exports rose
at a much greater pace of 19.7 percent (World Bank 2006a). Rising exports pulled up the economy.
They induced production, investment and employment. Note that in order to determine the increase
1970-1980 1980-1990 1990-2000 2000-2005 1980-2005
GDP 6.2 9.3 10.4 9.4 9.8
Exports na 5.7 14.1 23.3
12.4
Gross capital
Formation
6.8 8.6 10.6 14.5 10.6

5
in real terms, i.e. in the volume of exports, nominal export figures, given in renmimbi, have to be
corrected by a price deflator. Usually, the trade deflator for goods published by the Customs
Administration is applied.
Nearly all exports represent merchandise exports, i.e. exports in goods (excluding services). Almost
all merchandise exports are produced in the manufacturing sector (91 percent, 2004). Yet whilst
China is considered to be the manufacturing workshop of the world, it is astonishing that its exports
consist not only of low technology products. Almost one third of its merchandise exports (30
percent) are high technology exports. In this respect, China is playing ball in the same league as
Japan (24), Korea (33), the Netherlands (29), the United Kingdom (24) and the United States (32)
according to the World Bank classification (2004; World Bank 2006b). Although China’s high
technology exports rely on considerable high technology imports and the issue of delineating high
technology exports may play a role, China’s export basket is seen to be moving up-market into
higher value goods (World Bank Office, Beijing 2006 b). WTO membership (since 2001) has
improved China’s export conditions by securing access to China’s markets abroad. It also
reinforced international investors’ confidence and made China a favourable destination for foreign
investment. The country, however, has to respect and implement WTO-consistent institutional
arrangements in intellectual property rights, safeguards procedures and standards. This may affect
some of its export and import-competing sectors negatively.
The increase in China’s trade volume is not unprecedented. Except for the year 2005, it remains
below the performance shown by other Asian export achievers, like Japan and the newly
industrializing Asian economies - Korea and the other three tigers. Setting an index of 1 for China’s
1978 export volume and comparing it to an export index of Japan with exports in 1955 set equal to

6
1, the rise in China’s real exports in the period 1979-2004 remained below the expansion of
Japanese exports (Figure 1). A similar result holds for Korea with the base year at 1965 and the four
tigers (Hong Kong, Korea, Singapore and Taiwan) at 1966 (Prasad 2004, Figure 2.3). Note,
however, that since the mid 1990s China’s exports exhibit high growth rates, outpacing those of
Japan. In 2005, we can no longer claim that China remains within the export pattern shown by
Japan.
Figure 1 China and Japan: Comparative export growth a
Number of Years
Japan 1955 - 2004
China 1978 - 2004
0
10
20
30
40
50
60
1 3 5 7 9 11 13 15 17 19 21 23 25 27 29 31 33 35 37 39 41 43 45 47 49
Inde
x
a Deflated by the US GDP-deflator and indexed, basis year 1955 = 1 for Japan and 1978 = 1 for China.
Source for data: WTO, WTO Online Statistical Database, November 2006 (for merchanidise trade). - IMF
International Financial Statistics, Online Database, November 2006 (for the US price deflator). Own calculations.
b. Investment – the other driver
Even after the 2005 downward revision of the data for investment, gross capital formation
(previously estimated at over 40 percent), is still high at 38.7 percent of GDP (2004), but closer to

7
values witnessed during the buoyant years of other Asian tigers. Annual average growth rates of
gross capital formation equalled 10.6 percent in the period 1980-2005 (Table 1). Foreign direct
investment plays an important role in investment (see below). Among the other components of GDP
on the expenditure side, household final consumption accounts for 48.5 percent and general
government final consumption for 10.2 percent (2004; data for the expenditure side are not yet
revised).5 Gross national savings are estimated at 47.2 percent of GDP (IMF 2006b, Table 8).
Households save close to thirty percent of their disposable income; firms account for the other part
of gross national savings. The difference between the share of savings and investment in GDP, the
savings-investment gap, reflects the current account surplus. Moreover data from the World Bank6
and the IMF differ; consistency of data between the expenditure side of GDP and the production
side may also be relevant.
Capital accumulation means that new firms are born, new technologies are embodied in new
machines, new products are introduced into the product set of the economy and the economy is
restructured. Learning by doing processes are driven by exports and investment. Capital
accumulation and total factor productivity growth contributed about 4.5 percentage points each to
the GDP growth rate of about ten percent in the early 2000s, with about one percentage point
coming from employment growth (IMF 2005a, Figure in Box 1, p.12). Marginal capital productivity
is at about 13 percent, after about 16 percent in the 1990s.7 Labour productivity in terms of GDP per
5 Total government spending amounts to 19.2 percent of GDP (2005). This includes public investment which is
contained in the investment share of 38.7 percent. 6 The World Bank reports 5 percent for the current account surplus in 2005 instead of 7.2 percent of the IMF (World
Bank 2006a). 7 A rough measure of capital productivity is given by relating the increase of GDP in a year (growth rate times output)
to annual investment of the previous year (investment share times GDP). For 2005, this yields a value for marginal
8
worker increased at an annual average of between seven and eight percent in the early 2000s, with
productivity growth coming half from capital intensity and half from total factor productivity (Ibid).
The information on the decline in the marginal productivity of capital is supported by data on an
increase in the incremental capital output ratio, i.e. the investment needed per additional unit of
output, which has risen from 3 in the 1980s to 4.5 in the early 1990s. Another estimate indicates that
the incremental capital-output ratio has increased from 3.3 in the first half of the 1990s to 4.9 after
2001 (McKinsey 2006). More capital is needed to produce additional output.8 These data can be
interpreted in three ways. First, they reflect a move down the marginal productivity curve of capital
to less productive uses; this tendency is counterbalanced by technological progress shifting the
marginal productivity curve outward. Second, the data may be seen to indicate inefficient
investment, for instance in the state-owned firms. It also highlights the fact that a functioning capital
market that allocates savings to investment efficiently does not exist. Self-financing, financing
through informal family networks and intermediation by the state-owned banks cannot match an
efficient equity market. Third, they might indicate signs of over-investment in several sectors,
creating a distortion in the economy that will have to be painfully corrected in the future. When
over-expansion is corrected, output will fall and unemployment will rise. A reason behind
overheating is the high money and credit growth.
c. Sectoral change, migration of labour and shift of growth clusters
productivity of 29 percent. 8 Note that empirical figures for the marginal capital output ratio are not simply the inverse of marginal capital
productivity. The empirical variables are delineated differently for the two concepts, for instance as one additional
unitof output or as the additional output of a year.

9
In the process of economic growth, China underwent stark changes in the structure of the
production side of its GDP. Agriculture declined from a 28.4 percent share of GDP in 1985 to 13.1
percent in 2005 (World Bank 2006a). Industry expanded its share of 43.1 percent in GDP in 1985 to
46.2 percent in 2004. Earlier, non-revised data had estimated the share of industry to be at 52.9 in
2004. The share of the service sector increased from 28.5 percent in 1985 to 40.7 percent in 2004,
previously estimated at only 31.9 percent. In terms of employment, the primary sector declined from
68.7 percent of total employment in 1980 to 50.0 in 2002 (non-revised data) whereas the secondary
sector increased from 18.2 percent to 21.4 percent and the tertiary sector from 13.1 percent to 28.6
percent in the same period (Prasad 2004, p. 55).
Strong growth tends to be unbalanced among the regions. High dynamics prevail in the urban
centres, especially those of the coastal regions, whereas the west and north are not growing as
strongly. There is a stark divide between the urban centres and the countryside as well as between
coastal regions and the interior.
Migration of rural workers to the booming coastal cities and the movement of the growth centres
inward will continue to ease this structural problem over time. Regional disparity is the key cause of
labour migration. The coastal growth poles offering higher wages attract workers from the interior
of the country. It is estimated that the number of rural labour migrants rose to around 60 million in
2000, 94 million in 2002, and 114 million in 2003 (Huang and Zhan 2005).
China has seen a north- and westward migration of its growth clusters. Starting in the coastal
regions of the South, economic dynamics have spread to the other regions, at first through backward
linkages by stimulating the production of intermediate inputs at lower costs. This helped raise

10
wages in the interior and integrate rural workers into the industrial process. Eventually, the growth
clusters themselves started to migrate to the West as capital targeted new and unexploited
investment opportunities.
d. Entrepreneurship
An important condition for growth is the entrepreneurial spirit of the Chinese. Historically, they
have been traders, and they enjoy accumulating family wealth. These characteristics together with
the traditional value orientation represent powerful incentives for effort and entrepreneurship and
are a sturdy basis for bottom-up processes of individuals and municipalities; they encourage
economic agents - the entrepreneurs - to organize new combinations in the factors of production in
the sense of Schumpeter. The Chinese seem to have been waiting for the Deng Xiaoping reforms,
ready to exploit the options created and to embrace capitalism in spite of the Communist Party’s
official philosophy. The reforms brought a period of positive surprises not unlike the Erhard
reforms in West Germany in 1948. It is no wonder that, according to a survey conducted by the
University of Maryland, the Chinese now show a larger acceptance of the market economy than the
three large continental countries of Europe. 9 Entrepreneurs of Chinese origin living outside
mainland China played an important role in economic dynamics.
3. STRUCTURAL ISSUES
a. State-owned enterprises
9 According to a survey of the of the Center for International and Security studies of the University of Maryland (World Public Opinion. Org) from January 11,2006 , 74 percent of the Chinese population support the market economy,

11
Unlike in the transformation of post-communist countries in Central Eastern Europe, China’s
restructuring strategy was not to deal with the state-owned firms head on but to circumvent their
restructuring simply by letting new economic activities develop outside the government-controlled
sector. In this way, the state-owned firms lost importance. This approach was one of the reasons why
the J-curve effect and it accompanying valley of tears and decline in GDP, experienced by the post-
communist countries of Central and Eastern Europe, were prevented. Although exact data are not
available, state-owned enterprises now account for less than one third of GDP (2005, Economist
2006). They do not include municipal firms that are counted as private. Another source quotes 38
percent of GDP for state-owned firms (Pei 2006). The bulk of the non-state sector are municipal
enterprises. There are only 40 private firms among the 1,520 companies listed on domestic and
foreign exchanges (Ibid). The state remains the monopolist or the dominant player in the most
important sectors, namely in steel, automobiles, energy, transportation and in the banking and
telecommunication service sectors.
State-owned enterprises make losses and are over-indebted; they need to be restructured or given up.
Unemployment will ensue and the unemployed will lack insurance coverage against being without a job;
moreover, people then no longer have insurance in the case of illness and during old age. This represents a
potential area of severe future conflict. In the past, the losses of the state-owned firms were covered by
credits from state-owned banks which were under pressure from local politicians to provide financial
support to them. Eventually, the loans became non-performing.
b. The banking sector
and compared to 36percent in France.

12
Banks are state-owned. This applies to the four big State-owned Commercial Banks as well as to
twelve Joint-Stock Commercial Banks, City and Rural Cooperative Banks, other banks and Asset
Management Companies. All financial institutions are spin-offs of the People’s Bank of China,
which was the only bank in China until 1979. Other spin-offs are governmental policy banks and
regulating agencies for banking, securities and insurance. Three of the state-owned Commercial
Banks have been partly privatised through initial public offerings, with the state (and the state-
owned management companies) still holding about 70 to 80 percent of ownership. For instance, 17
percent of the shares of the Industrial and Commercial Bank of China (ICBC), the largest of the four
state-owned banks, were introduced to trade in Hong Kong and Shanghai in the largest world-wide
initial public offering ever in October 2006, making this institution the fifth biggest bank with a
market capitalization of US$ 147 billion. In addition, 8.5 percent of the assets are held by Goldman
Sachs, Allianz and American Express. State-owned banks have chosen strategic partners (IMF
2006b,Table 9).10 The initial public offering of the Agricultural Bank of China is pending.11 Asset
management companies are the vehicles through which the government exercises its ownership
rights vis-à-vis the four state-owned commercial banks. Each one of asset management companies
is responsible for one of the four state-owned commercial banks.
China’s banking system is fragile. Asset quality is poor and capitalization of banks is low.
Government intervention in the banking system is massive. Banks are not competitive by
international standards. Liquidity of the banking system is high due to monetary policy, banks hold
excessive reserves, inter-bank interest rates are low and credits are expanding strongly. Fully
functioning bond and equity markets that could allocate savings to investment more efficiently than
10 HSBC holds 19.9 percent of the smaller Bank of Communication. 11 The other two state-owned commercial banks are the Bank of China and China Construction Bank.

13
bank intermediation have not yet been developed. Moreover, bank intermediation is subject to
political influence and competes with informal financing; more than half of investment is self-
financed. Investing savings abroad is not a permitted option for savers. Banking deposits are the
main form of savings.12 That is why poor asset quality, low capitalization and the fragility of the
banking systems are crucial to the further development of China. Chinese savers seem confident in
the state-owned banks. If the depositors lost their confidence in the banking sector, a severe risk for
a stable growth process in China would arise. Thus it is essential that bank failures leading to a bank
run be prevented.
The non-performing loans, resulting of the political pressure on banks to provide credit to the
inefficient state-owned enterprises, represent a major risk. The stock of the banking system’s non-
performing loans was estimated at about 40 percent of GDP in 2004 (Blanchard and Giavazzi
2005). Other sources approximate the percentage of total bad loans in GDP to 21 and – with a
higher legacy – to 56 (Roubini and Setser 2005, Tables 1 and 2). Another source estimates the
percentage of non-performing loans to GDP for the total financial system including the asset
management companies is still estimated at 36 percent in 2003-2004 (Garcia-Herrero, Gavila and
Santabarbara 2005). The proportion of non-performing loans to GDP fell in 2005 (IMF 2006b,
p.22). However, the stock of non-performing loans is still estimated at 25 percent of GDP at year
end 2005, including 8 percent for the asset management companies (IMF 2006b, p.40).
In the past, the government has had to recapitalize the state banks with sizable amounts from time to
time. In 1998, the government spent US$ 32.6 billion (about 3½ percent of GDP) in order to save
12 In principle, with the WTO opening of the Chinese banking system in 2007 foreign banks should be allowed to offer
non-Chinese financial assets.

14
the four then wholly state owned commercial banks (Prasad 2004). In 1999-2000 the government
injected about US$ 169.1 billion or 14 percent of GDP via state owned asset management
companies into the financial sector in order to clear the balance sheet of the state owned commercial
banks (Ibid). Bad loans of this magnitude were taken off the banking system’s books in 1999 and
given to four asset management companies (Roubini and Setser 2005). In 2003, US$ 45 billion or
about 4 percent of GDP were used for the same purpose. The People’s Bank of China transferred
the amount to holding companies in order to recapitalize two of the four state-owned banks (China
Construction Bank and the Bank of China). The banks will not convert these assets into renmimbi
but rather retain them as international reserves. This signifies an increase in the central bank’s
balance sheet risk. In 2005, a sum of US$ 15 billion was given to the Industrial & Commercial Bank
of China and US$ 30 billion were transferred to its asset management company. Chinese press
reports indicate that a capital injection of US$ 100 billion will be needed to prepare the Agricultural
Bank of China (with 24 percent of its loans non-performing) for an initial public offering. Problems
with non-performing loans also exist in rural credit cooperatives and smaller city commercial banks.
China makes use of its international reserves to clean up its banks’ balance sheets. Astonishingly,
China’s reserves relative to GDP amount to a proportion not too different from that of the non-
performing loans of the state-dominated financial system relative to GDP. Viewed this way, the
international reserves represent an insurance against a future failure of the banking system, and this
view mitigates against condemning China’s accumulation of international currency reserves.
An alternative to pursuing this piece-meal approach of periodically cleaning up the banks’ balance
sheets would be an explicit policy of improving the risk management of banks, thus strengthening

15
the banking system. This would entail removing non-performing loans from the system and
preventing new ones from arising. However, this policy conflicts with the still important role of
loss-making state-owned enterprises and the Party’s pressure at the local level. Another option
would be to follow a good bank–bad bank policy as Japan did in its crisis in the 1990s, and to
funnel all the losses into one or several institutions (which the government would have to
recapitalize from time to time). Finally, capital markets reliant on equity capital have to be
developed in order to reduce the intermediating role of the banking system.
Initial public offerings can be seen as a device to improve the efficiency of the banking systems, since
they exert pressure on the Chinese banks to become competitive. As of 2007, China will have to admit
foreign banks in accordance with its WTO commitment. In principle, Chinese banks must be competitive
by then, or at least the majority of them. However, foreign banks are limited in many ways. They are only
allowed to open one branch per year. Foreign ownership of Chinese banks is restricted to 25 percent;
ownership of a single investor is limited to 20 percent. The WTO requirement to open its banking
industry also does not imply that the capital account will be fully liberalized (see below). State-owned
firms are given preference on credits from state-owned banks, and this implies unproductive use. Even if
banks were advised by the central government to learn to make money, the local Party leader is likely to
continue to pressure the banker into providing credit to the state-owned enterprises.
4. MONETARY, FISCAL AND EXCHANGE RATE POLICY
a. Money supply and inflation

16
China experienced high inflation rates in the 1980s and 1990s. For instance, the change in the
consumer price index was 19 percent in 1988 and reached its peak of 24.2 percent in 1994. Inflation
rates also were extremely volatile. Whereas the inflation rate was at 18.3 percent in 1989, only one
year later it had fallen to a comparatively low 3.1 percent. The price level declined in the context of
the Asian financial crisis with –0.8 percent in 1998 and –1.4 percent in 1999. Compared to the
1980s, inflationary pressure stemming from a considerable increase in the money supply and strong
credit expansion has been tempered in the past few years. Consumer price inflation, driven mainly
by food prices, was between 0.26 percent (in 2000) and 4.00 percent (in 2004), being 1.8 percent in
2005 after having been negative with – 0.8 percent in 2002. Recent inflation rates are also far less
volatile than those of fifteen years ago. The money supply (broad money according to the IMF
definition) rose in the range of 14.0 percent to 19.6 percent in the period 2000-2005 (IMF 2006b,
Table 4). Credit to non-state sectors expanded in a volatile fashion in the same period with rates
fluctuating between 2.1 (2001) and 26.5 percent (2002). Lower inflation rates and better monetary
policy result from the recognition that rising consumer prices contributed to the unrest that
culminated in Tiananmen Square in 1989. Inflation pressures may arise in the future, for instance
when wage demands of workers surface, when environmental costs are felt, when energy becomes
more expensive or when other constraints materialise.
An independent monetary policy is complicated by high current and capital account surpluses since
they increase outside money. The Chinese Central Bank - the Peoples Bank of China - purchases
foreign exchange and accumulates reserves (see below). Given the high twin surpluses, it is
necessary to sterilize monetary expansion; the Bank of China sells sterilization bonds to the state-
owned banks. From 2003 to 2004 the stock of sterilization papers increased by about 265 percent,
from 2004 to 2005 it increased by about 88 percent or US$ 117 billion - reaching a value of 250

17
billion US$ for the overall stock of bonds.13 However, this vast increase covers only slightly more
than half of the increase in reserves. Not all of the outside money can be sterilized; thus there is an
increase in liquidity showing up in low inter-bank interest rates and the strong expansion of credits.
b. Fiscal Policy
Unlike in Latin American countries, public spending and public budget deficits are not big issues in
China. General government final consumption expenditure stood at 10.2 percent of GDP (2004).
This does not include government spending for investment or the expenditures of state-owned firms.
The public budget deficit was in the range of 1-3 percent of GDP in the period 1999-2005, for
instance it stood at 1.2 percent of GDP in 2005. Fiscal policy was slightly expansionary. Subsidies
to state-owned enterprises make up about one percent of GDP. Official public debt stands at about
18 percent of GDP (2005; IMF 2006b, Annex I). Although this is low compared to other Asian
economies (and especially relative to Latin American countries), implicit liabilities of the state are
higher, including for instance the non-performing loans of the banking system. Explicit and implicit
debt are estimated at 45 per cent of GDP (IMF 2006b). Total debt would rise sharply if a tax-
financed system of social insurance with payments for human health services and pensions were
developed, if the rural-urban divide mandated additional government expenditures to keep social
unrest from exploding and, eventually, if environmental degradation were to be addressed.
Moreover, centre-local fiscal relations are crucial. The central government provides transfers to
local governments. Local authorities borrow through public enterprises, thus circumventing the
formal ban on direct borrowing.
c. Balance of Payments
13 For other data see Roubini and Setser (2005).

18
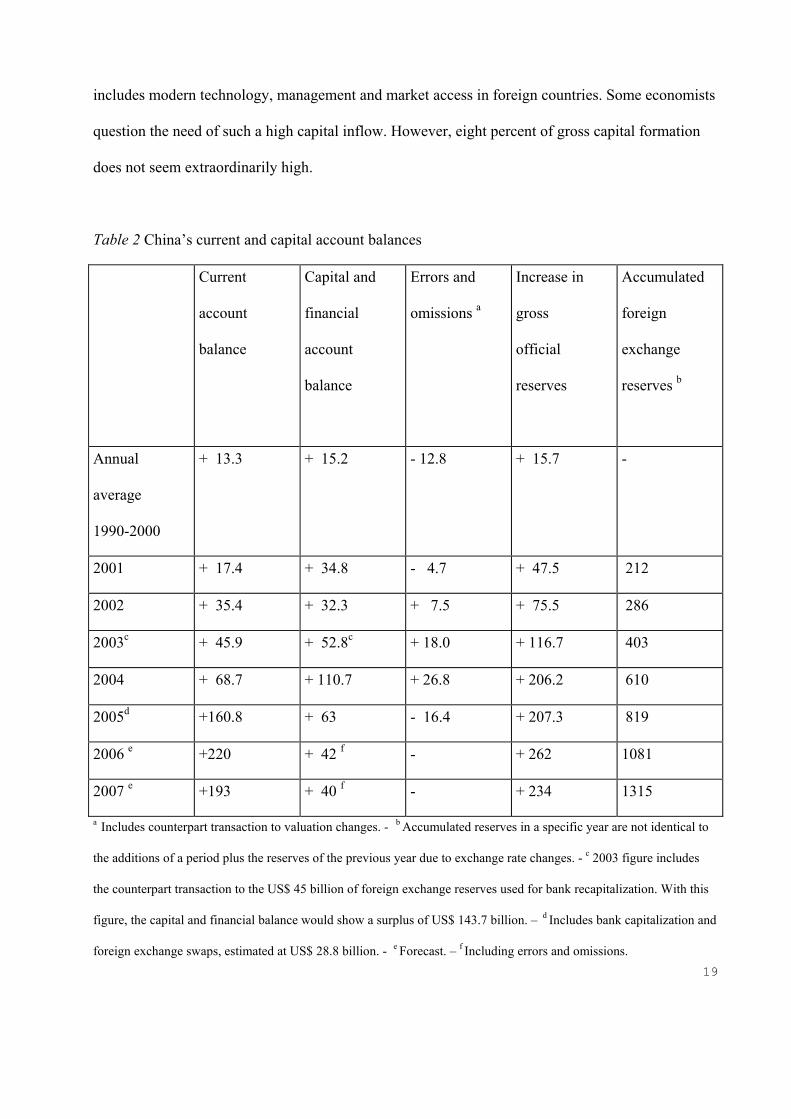
China has enjoyed a surplus both in the current, and in the capital and financial account for many
years. It uses the twin surpluses to accumulate reserves (Table 2). In 2006, the estimated surplus of
the current account stands at US$ 220 billion and that of the capital account (including errors and
omissions) at US$ 42 billion. This translates into an increase of reserves of US$ 262 billion. Total
reserves equal US$ 1081 billion, roughly 43 percent of estimated GDP (if a ten percent real growth
rate is assumed for 2006). They were 37 percent of GDP in 2005. In 2005, the current account
surplus stood at US$ 161 billion and the capital and financial account had a surplus of US$ 63
billion, now excluding errors und omissions. In 2003, US$ 45 billion were used to recapitalize the
banking system. When these are subtracted, the current account and the capital and financial
account surplus of US$ 143.7 billion is reduced to US$ 98.7 billion.
With respect to the trade surplus, the accumulation of reserves can be seen as swapping Chinese
export goods for US Treasuries and other papers. It is feared that China might use its reserves
strategically to boost the value of the renmimbi and to depreciate the US dollar. However, it would
have to accept a sizable loss of its accumulated international reserves. Moreover, China would be
limited in its use of its reserves for this purpose, given the fragility of the banking system.
The capital and financial account includes foreign direct investment and portfolio flows. In 2005,
capital net inflows of US$ 68 billion were in foreign direct investment (3.6 percent of GDP and
about 8 percent of gross capital formation); in 2004, FDI stood at US$ 53 billion and in 2003 at US$
47 billion. It is estimated that FDI in 2006 is of a similar magnitude as in 2005. In the period 2000-
2005, the average (net) FDI inflow was US$ 48.3 billion, in the 1990s it averaged US$ 26 billion
and in the 1980s US$ 1.4 billion (IMF 2006a). In addition to the ample supply of domestic capital
due to the high savings rate, China succeeds in attracting foreign capital, and very often this also
19
includes modern technology, management and market access in foreign countries. Some economists
question the need of such a high capital inflow. However, eight percent of gross capital formation
does not seem extraordinarily high.
Table 2 China’s current and capital account balances
Current
account
balance
Capital and
financial
account
balance
Errors and
omissions a
Increase in
gross
official
reserves
Accumulated
foreign
exchange
reserves b
Annual
average
1990-2000
+ 13.3 + 15.2 - 12.8 + 15.7 -
2001 + 17.4 + 34.8 - 4.7 + 47.5 212
2002 + 35.4 + 32.3 + 7.5 + 75.5 286
2003c + 45.9 + 52.8c + 18.0 + 116.7 403
2004 + 68.7 + 110.7 + 26.8 + 206.2 610
2005d +160.8 + 63 - 16.4 + 207.3 819
2006 e +220 + 42 f - + 262 1081
2007 e +193 + 40 f - + 234 1315
a Includes counterpart transaction to valuation changes. - b Accumulated reserves in a specific year are not identical to
the additions of a period plus the reserves of the previous year due to exchange rate changes. - c 2003 figure includes
the counterpart transaction to the US$ 45 billion of foreign exchange reserves used for bank recapitalization. With this
figure, the capital and financial balance would show a surplus of US$ 143.7 billion. – d Includes bank capitalization and
foreign exchange swaps, estimated at US$ 28.8 billion. - e Forecast. – f Including errors and omissions.

20
Source for data: 1990-2005: IMF, International Financial Statistics, Online Database, October 2006; Forecasts: World
Bank, Quarterly Update, August 2006; Own Calculation.
In its early stage of reform, China’s open door policy for foreign direct investment used joint
ventures between foreign investors, i.e. multinationals, and state-owned enterprises. Now whole
ownership of firms by foreign investors is allowed. Foreign owners can buy out their Chinese
partners. However, looking at property rights for land and at the need for permits, it may remain
advisable to have a Chinese partner (see below). Meanwhile, China’s new strategy includes foreign
direct investment abroad. Its outward FDI in 2005 amounted to US $ 11.3 billion (IMF 2006b,Table
2); it was used to acquire foreign enterprises and create Chinese multinationals.
d. Severe macroeconomic distortions
Using the macroeconomic conditions in other economies as a frame of reference, China exhibits
stark distortions. The twin surpluses in the balance of payments amounting to 10 percent of GDP in
the year 2005 highlight the fact that China massively accumulates foreign reserves that will lose
value when the renmimbi will appreciate in the future. It does not exchange import goods for its
export goods, but it exchanges exports for a stimulation of its economy. Swapping export goods for
international currencies and economic stimulation will have its price later on, when the
misallocation between sectors must be corrected. Gross national saving at 47 percent of GDP keep
consumption low, with households postponing their consumption due to the uncertainty of not
having insurance coverage against health hazards and for old age. While there is a sizable
investment gap between savings and investment, there are strong signs of over-investment in the

21
economy which also will have to be corrected eventually. Monetary conditions support these
distortions.
e. Capital account controls
Capital flows are controlled. Though current account convertibility has existed since 1996, the
capital account has not been liberalized. In April 2006, permission for selected domestic
institutional investors to make transactions outside China was introduced; private citizens can now
buy foreign currency up to 20,000 US dollar rather than 6,000 US dollar per year. Only authorized
institutions are allowed to perform transactions in foreign currency. China is following a cautious
and gradual approach to capital account liberalization, taking into consideration the fragility of its
banking system. The Asian crisis in 1997 and other currency disruptions, likethe financial crisis in
Sweden in 1992, have proven the risk of liberalising the capital account when the banking sector is
not sufficiently robust, i.e. when it is not adequately regulated to withstand shocks and when banks
have too much leeway in extending credits. Finally, a controlled foreign exchange rate is not
consistent with a liberalised capital account. From the point of view of the sequencing of
liberalisation, it is reasonable first to make the foreign exchange rate more flexible and then to
liberalize the capital account in a second step. It would be risky to introduce residents’
convertibility immediately and fully. Market participants hedging political risks would then place
their savings abroad looking for higher rates of return and a diversified risk. This is why introducing
mutual funds for residents is discussed as an option in order to absorb the savings of Chinese
households, including those of entrepreneurs (see above).
f. Exchange rate policy

22
The exchange rate of a country in transition towards a market economy can be expected to go
through two phases. In the first phase, the transformation process and the opening up for trade,
including a sizable reduction in import tariffs, put the export sector and the exchange rate under
pressure, which devalues the currency. In the second phase, when the competitiveness of exports
has been established, appreciation is likely. These two phases can be observed in China.
Throughout the 1980s and the early 1990s, the nominal and the real effective exchange rate of the
renmimbi depreciated sharply. The nominal rate (renmimbi to the US dollar) depreciated from 1.5
in 1980 to 8.6 in 1994 (Figure 2). The real effective exchange rate index (which is the index of the
inverse of the IMF’s real exchange rate index) rose from 33,3 in January 1980 to 167 in June 1993,
with February of the year 2000 set equal to 100 (in contrast to the index used by the IMF, an
increase in this index denotes a depreciation). From 1994 to 1998, the renmimbi appreciated relative
to the US dollar, i.e. the renmimbi/dollar rate fell. It then was held steady at 8.28 until 2004. Since
2005, the renmimbi has appreciated by 4.4 percent to a rate of 7.91 in October 2006. This looks like
a soft crawling peg to the US dollar. In real terms, the renmimbi appreciated from 1993 to 2001,
then depreciated unsteadily until August 2006. Note that the high volatility of the inflation rate
translates into an instability of the real exchange rate. Thus the low inflation rate since 2000 is a
reason behind the real depreciation of the renmimbi since 2001. The revision of the macroeconomic
data in December 2005 to reflect a larger share of services and higher prices in services implied a
ten percentage point real appreciation relative to the previously estimated real exchange rate (World
Bank Office, Beijing 2006 a).
China has followed a policy of pegging the renmimbi, attempting to keep it more or less steady or
changing only slowly. For instance, during the Asian financial crisis in 1997, China kept the

23
nominal rate to the US dollar constant.14 Effective June 21, 2005 the renmimbi is no longer tied to
the US dollar alone, but to a basket consisting of the US dollar, the euro, the yen und and the
Korean won. In addition, the Singapore dollar, the British pound, the Malaysian ringgit, the
Australian dollar, the Russian rouble, the Thailand baht und the Canadian dollar are taken into
consideration. The weights of the currencies in the basket are not disclosed by the Chinese central
bank; they are supposed to reflect the importance of China’s trading partners. Disclosure of the
weights would allow speculators to guess where the renmimbi might be in the future and when the
central bank is likely to intervene. In practice, each day trading on the spot market starts with a
central parity of the rinmimbi to the US dollar determined by the weighted average of fifteen market
makers appointed by the Bank of China rather than beginning with the closing price of the previous
day. Intra-day movements are constrained by a band of 0.3 percent on both sides. China’s medium-
term strategy seems to consist in achieving a greater mix and a better return for its high international
currency reserves. 15 Such a reorientation would benefit the euro and would put the US dollar under
pressure.
Figure 2 Rinmimbi: The nominal and real exchange rate a
14 The real exchange rate appreciated due to the fact that the other Asian currencies depreciated heavily relative to the
US dollar and consequently also to the renmimbi. 15 China does not disclose the composition of its reserves.

24
0
20
40
60
80
100
120
140
160
180
1980 1982 1984 1986 1988 1990 1992 1994 1996 1998 2000 2002 2004 20060
1
2
3
4
5
6
7
8
9
10
Real effective exchange rate index (left scale)
Exchange rate Renmimbi/US$ (right scale)
a Monthly values.
Source: IMF, International Financial Statistics, October 2006, own calculation.
g. Is the renmimbi undervalued?
Since China keeps the exchange rate under tight control rather than letting it float, the question as
to whether the renmimbi is undervalued arises. The presumption is that a floating rinmimbi would
automatically appreciate more than it has done of late. 16
16 Instead of looking at market forces in determining the exchange rate, one may judge the exchange rate in terms of
policy costs, especially opportunity costs in future periods. In this approach, an under-valuation of the renmimbi is seen
as having the advantage for China to stimulate exports and to be a strong impulse for investment and growth and at the
same time a vehicle for structural change. The disadvantage lies in a higher inflation rate since inflation is imported
with an undervalued currency. Moreover, the sector structure would be distorted in favour of the export industry.
Adjustment costs could arise in having to correct this distorted allocation later on. Furthermore, an under-valuation
means higher renmimbi prices for agricultural products since these products are quoted in US dollars and China is a
price taker. This in turn implies a lower real income of industrial workers. Imports of natural resources (oil, copper,

25
However, it is not perfectly clear in which direction a flexible renmimbi would go. Determining the
correct exchange rate is a tricky issue; after all, it is a counterfactual question. Economic forces pull
the exchange rate in different directions. Some forces clearly work in favour of an appreciation.
Following the trade flow view of the exchange rate and taking a long-run view, an increase in
labour productivity and improved access to foreign markets generate pressures for an appreciation.
Reducing regulations that impede imports works in favour of a depreciation. More importantly, the
high current account surplus of 7.2 percent of GDP in 2005 clearly suggests an appreciation of the
renmimbi. In this debate, it is argued that the problem of the US current account deficit can be
solved by an appreciation of the renmimbi.However, the US’s 2004 bilateral trade deficit with
China only amounts to US$ 80 billion (and US$ 111 billion including Hong Kong); the figure is not
too different from the US’ other bilateral deficits with the EU (US$ 102 billion), Japan (US$ 78
billion) and the oil-exporting countries. Data refer to merchandise trade only. For the years 2002-
2005, China’s annual average bilateral surplus with the US stood at US$ 73 billion. In the year 2005
with an unusually high Chinese current account surplus, China’s bilateral merchandise trade surplus
with the US is reported at US$ 114.2 billion (WTO 2006b). We do not yet know whether this figure
is an outlier or whether it indicates a trend. In any case, looking at the US current account deficit of
US$ 800 billion in 2005, the data indicate that a unilateral nominal appreciation of the renmimbi by
China would not solve the US problem. It would be a different story, if most of the Asian currencies
cotton) become more expensive. Finally, a future depreciation of the reserves’ currency, especially the US dollar, would
mean that the value of accumulated reserves would be partially lost. Moreover, the renmimbi value of the state’s bank
capital (denominated in US dollars) falls; the banks’ capital to asset ratio is reduced (Roubini and Setser 2005). Of
course an undervalued currency has negative effects on China’s immediate competitors, among them Pakistan, Egypt
and the Maghreb states, and import-substitute sectors in the industrial countries.

26
would appreciate together with the Renmimbi.17 Admittedly, different data are used in this debate;
the US claims a bilateral deficit with China US$ 201.6 billion (US Congressional Research Service
2006). 18 The main reason for the different figures lies in whether US trade with China includes
Hong Kong.
Following the capital flow view of the exchange rate, labour productivity growth and China’s
improved access to other countries’ markets also operate in favour of an appreciation, making China
more attractive for foreign capital. This would also hold if a more reliable rule of law were
introduced. Other factors, however, would work in favour of a depreciation, among them a too high
inflation rate (representing a real appreciation but requiring a nominal depreciation) and a
liberalisation of the capital account. Thus, residents’ convertibility with a future outflow of
domestic savings would increase demand for US dollars, euros and other currencies and would
imply an increased supply of the renmimbi, dragging its value down. Consequently, the existing
capital controls for residents imply an overvalued renmimbi, i.e. the renmimbi would depreciate
strongly with a liberalized capital account. In terms of macroeconomic equilibrium, high
unemployment can be interpreted to indicate that internal equilibrium is not fully established,
indicating the need to depreciate. Similarly, a greater weight put on social policies will depreciate
the currency.
17 The bilateral US current account deficit with Asia (including Hong Kong but excluding Mainland China) is estimated at US$ 341 billion (2004). If China appreciates, it stimulates Asian exports to China and allows the Asian countries to appreciate their currencies vis-à-vis the US dollar and uncouple somewhat from the Asian US dollar standard. 18 Note that China has a sizable bilateral deficit with Asia of about US$ 70 billion in 2005. This by itself would require
a depreciation of the renmimbi if one were to follow the bilateral view.

27
Combining the trade flow and the capital flow view, the accumulation of reserves clearly points in
the direction of an appreciation. However, so long as the reserves are used as an insurance against
the fragility of the banking system, this remains a different matter.
Economic models run into difficulties in accommodating all these and other factors, including
expectations. Applying the approach used by Wang (2004) to determine the medium-term path of
the real exchange rate, one might conclude that the renmimbi is not substantially undervalued
(Wang 2004, p. 25). Existing studies come up with a wide range of estimates of under-valuation,
ranging from zero to nearly fifty percent (Dunaway, S. and Li, X. 2005). Different methods used,
diverse explanatory variables included and instability in the empirical underlying economic
functions in a rapidly growing development country are reasons for the difference in estimates. To
sum up, the twin deficits point to an appreciation of the renmimbi instead of the real depreciation
that has occurred since 1992; however, the case made for the size of the existing under-valuation of
the renmimbi is not as strong as some American economists suggest. 19 We would know more if
China followed the advice of the IMF and allowed more flexibility in the exchange rate; and China
would also know better to what extent the exchange rate distorts its economy.
5. PROPERTY RIGHTS
19 Compare for instance Bergsten (2006) who estimates the under-valuation of the renmimbi against all currencies at 20-
40 percent.

28
Establishing property rights is crucial in transforming a communist, centrally planned society into a
market economy. They set incentives for the economic agents to produce, invest, innovate, save
and provide work effort. In an approach different from the transformation countries in Central and
Eastern Europe, China has developed its property rights step by step. They come in the form of land
use rights, ownership titles of firms and residential titles. Land use rights are at the core; even firms
need them. Although property rights grant the right to use land, run firms, construct, sell and use
buildings and own apartments, all these rights are subject to control by collective authorities, most
importantly municipalities and the Communist Party. Property rights are far different from their
interpretation in market economies.
Land use rights for individual farmers (outside the collective) were introduced in the Deng
Xiaoping reforms. With these reforms and prices for some crops being freed, agricultural output
rose considerably. Land use rights are leases on the use of land. They are granted for 30 years.
According to the Land Management Law of 1998, a contract between the collective landowner (i.e.
the municipality) and the private farm household defines the rights and duties of both parties
(Article 14). Land use rights are granted by political decision; they were given to those who worked
on the land; party connections may have played a role. The total number of land-lease contracts is
more or less rationed; there is no first hand market for land use rights. However, a thin secondary
market for land use rights exists; it was constitutionalised in 1988 (deLisle 2004). Farmers can rent
out the land with permission, paying a fee to the village administration. Extension of the land use
may be possible.
Land use rights do not comprise full ownership. Land cannot be sold, nor can it be mortgaged.
Farmers do not enjoy capital gains on their land; ultimately, they have no interest to invest in their

29
land when this land may have to be returned to the government. Thus, disincentive problems similar
to those known from Mexcio’s edijo arrangement might arise. Given that farmers cannot negotiate
directly with locating firms and developers, they cannot use the proceeds from selling land for
investment in firms, for moving to the city or for financing their retirement. Not allowing the
marketisation of rural land impedes rural poverty reduction and hinders structural change.
Moreover, agricultural firms cannot optimise the inputs in their production process since there is no
primary market for ownership of that input.
Although land readjustments are restricted (Article 14), farmers are not protected when the land is
allocated to expanding firms or when it is needed for residential construction. Compensation, if any,
is low; for rural land it is at about one tenth of the market value. About 34 million farmers lost their
land-lease contracts in the period 1987-2001 (Lindbeck 2006). De facto local bureaucrats have
ultimate control and ownership of rural land. China’s land lease approach represents a combination
of private use (so far for a limited time period) and public ownership.
Firm ownership comes in different forms. Under conditions controlled by the party, land can be
used for industrial purposes. As a first step, municipalities were allowed to set up firms (township
and village enterprises). Nevertheless, township and village enterprises, representing collectives,
remain under the control of local officials and several supervisory bodies. As a second step, private-
public partnerships were allowed and as a third step private ownership was introduced. State-owned
enterprises were privatised; this includes turning them into township and village firms. Foreigners,
including multinationals, can own enterprises. Whereas firms own the physical assets they use for
production (including the machines and the buildings), enterprise ownership is linked to the
ownership of land and thus hinges on the permission of the party officials. Sons and daughters of

30
the political elite have had privileged access to land that was used to open up firms. Private
ownership of firms depends on which sectors of the economy are at stake and it also varies with
provinces and localities. Public ownership prevails in sectors where government is the dominant
producer, for instance in energy, transportation and telecommunication. The relationship between
asset ownership and land use rights is far from clear. If an entrepreneur has good connections with
the local or provincial government, land use rights may de facto not be limited in time. When there
is a change in leadership, this contract may be void. The relationship of the former political leader
and the current leader is crucial. The local or provincial government has the right to take over a
property whenever it likes; there is no way to prevent this. In one major case, an entrepreneur was
expropriated because it was claimed that he did not possess a land use title, even though the shares
of his firm had already been transacted in Wall Street.
Residential ownership refers to the ownership of buildings, including private apartments. With the
permission of the political authorities, it is possible to convert agricultural land into residential use
for individuals. In contrast to rural land, most urban housing is now privately owned; residential
leases run for 70 years (some for 50 or 40 years). Property owners elect their landlord committees in
order to protect their property against local party politicians.
Property rights are far from being clearly defined; nor are they strong. They are in constant flux and
mushy. Property rights can be bequeathed (within the limited period they are granted) and they may be
extended by local political decisions; however, a property right seems to exist only so long as it is
justified by economic success. The characteristics of Chinese property rights are that they have simply
followed whatever is needed for high growth. Property rights are rarely respected when an expanding
firm needs new location space, when a private investor constructs new residential structures or when the

31
government pursues an infrastructure project. A pay compensation requirement with respect to real estate
was introduced into the constitution in 2004. Implementation of the property rights system and of
individual claim procedures is, however, are far from being established. Compensation is controlled by
the state. Corruption is prevalent, the court system is in development, legal advice is scarce. The rule of
law is one of China’s institutional deficits. A clear bankruptcy law that would allow to sort out property
claims in the event of bankruptcy does not exit, either.
This form of mushy and adjustable property right may be appropriate for the Chinese situation in which
everything is in flux. These adaptable property rights do seem to create enough certainty for people to
invest in the initial period of Chinese transformation, when expected yields are high. They are likely not
to be sufficient later on, when yields become somewhat lower; lower expected yields require more
certainty. The approach to property rights is also affected by the process of transforming a communist
society in which property rights are not supposed to exist. Apparently, there are ideological constraints to
creating property rights. For instance, establishing a rural landowning class would undo the Mao reforms
in which rural landowners were expropriated; quite a few of them were executed. A crucial constraint is
that establishing new rights does not jeopardize the position of the Party. Note, however, that President
Jiang Zemin’s “Three Represents” doctrine calls for the inclusion of the entrepreneurial class – usually
property owners – into the Communist Party.
With respect to intellectual property, China accepted the obligation to honour these rights upon its entry
into the WTO. Its laws and regulations must be amended to conform with the “Agreement on Trade-
Related Aspects of Intellectual Property” (TRIPs). This applies to patents, trademarks and copyrights
including production technologies, fashion and audio and video products. It requires that the Chinese
government forcefully combats product piracy.

32
6. POLICY ISSUES IN THE FUTURE
The crucial issue for the future is whether China’s growth process of the last twenty five years is
sustainable. Normal processes, structural weaknesses, newly arising restraints, such as inadequate
social security-, and institutional deficits may lead to a slower pace of growth.
a. Normal brakes in the process of growth and structural weaknesses
Quite a few factors point towards continued strong growth. The high savings rate, facilitating strong
capital accumulation, entrepreneurship, the migration of the growth clusters into the interior, surplus
labour, the expansion of the real estate and construction sector and above all exports will all be
positive factors. The prospects for growth depend crucially on whether China can maintain the pace
of its capital accumulation, the increase in total factor productivity by a continuous stream of
original innovations and the high rates of export expansion. With respect to exports as the main
stimulus, China is seeking to move out of its position of low-cost producer by pushing into high-
value lines of production and investing in research. China has three times as many graduates in the
natural sciences and in engineering than the US. This approach of moving up the technological
ladder takes some pressure off other labour-intensive exporters affected negatively by China’s
success, for instance Bangladesh. China may further expand its role as a hub, outsourcing the
production of part of its intermediate inputs to partners in Asia. With a strong increase in income
per capita, intra-sector trade with the developed countries will gain importance, and this will lessen

33
the strain felt in the industrialized OECD countries. The risk of being cut off from its markets
through protectionism in the industrialized countries then becomes less likely.
Conversely, normal processes will tend to reduce growth in the future. Real wages will rise more
sharply than in the past as soon as the pool of rural surplus labour is exhausted and wages are no
longer supported by productivity growth at previous levels. Though the excess of rural workers is
estimated at 150 million and about 10 million new workers have joined the work force each year in
the past, eventually labour will become more scarce. China’s appetite for energy and raw materials
will drive up the prices of important inputs, making production more expensive; China bidding for
these resources on the international markets will raise world market prices20. To mitigate congestion
in infrastructure, more resources will have to be invested in infrastructure projects which tend to
have a lower capital productivity than investment in the private sector. Markets in all these areas are
not fully established; consequently a smooth adjustment process to changes in the degree of scarcity
is unlikely. Ageing will also affect the growth rate downward.
More importantly, structural issues and bottlenecks represent constraints to the growth process.
Whilst among the structural problems already discussed the capital losses of the state-owned firms
are likely slowly to lose importance, the fragility of the banking sector may prove a more severe
problem. Other weaknesses will come to the fore. China will have to pay more attention to accidents
at the work place and in industrial production, for instance in the chemical industry. Moreover,
environmental constraints will make themselves increasingly felt. Toxic industrial dumping in the
20 China’s share in world consumption is about 8 percent for petroleum, 27 percent for cotton and 17 percent for wheat
(Siebert 2007).

34
countryside has to be halted; toxic dumps have to be amended. Air and water pollution, and the
deterioration of the soil become less and less acceptable with rising per capita income. They cause
social costs in terms of serious health damage. All these factors will increase the costs of
production. Moreover, China as an international player will eventually want to be part of
multilateral solutions to global environmental problems such as reducing CO2-emissions.
Energy efficiency has to be increased. Retail gasoline prices are still lower than those in the US.
The cheap energy helps to keep inflation in check, but it distorts energy use. China's oil demand is
projected by the Energy Information Administration to more than double and reach 14.2 million
barrels per day by 2025, with net imports of 10.9 million barrels per day. Furthermore, China is
both the largest consumer and producer of coal in the world. China faces major energy-related
environmental problems. According to the World Health Organization, seven out of the ten most
polluted cities in the world are in China.
It may be argued that all these bottlenecks can be overcome with a technocratic approach and by
social engineering. However, more resources must be diverted towards these bottlenecks, and the
capital spent on these issues will have a lower productivity, implying a lower growth rate. In any
case, falsely low scarcity prices for land, capital, energy and the environment have to be corrected
through institutional changes.
b. Social policy constraints
Issues of social protection have not been a major concern in Chinese growth policy. Unemployment,
which has increased due to the restructuring of state-owned firms, is high, given the high GDP

35
growth rate. The urban unemployment rate is estimated at about 5 percent (Prasad 2004, p.52).
Although a generous unemployment insurance has been introduced for the urban unemployed
protecting about 105 million (Lindbeck 2006 p. 55), other workers are not shielded against
unemployment. Protection against health hazards and old-age pension insurance has not been
developed, the level of social protection in China being similar to that of the European countries one
hundred years ago. With the decline of the state-owned enterprises, which provided safe jobs and
human services insurance, a mixed system has developed where, for instance, part of the health
costs are covered by firms, but a large part is self-paid. In 1988, 44.1 percent of health costs in the
cities are estimated to have been self-paid. In the countryside the percentage is much higher at 87.4
percent (Blanchard and Giavazzi 2005, Table 10). The inadequate insurance arrangements for health
and old-age are one of the reasons for high savings. The private savings needed as a substitute for
insurance are inferior in terms of efficiency relative to an insurance solution. Health insurance, for
instance, can be provided more efficiently, if a large number of people with different health risks are
insured. Apparently, China has alternative options to following the European social model.
However, whichever model is chosen, the need to develop a social insurance system is likely to put
a burden on the public budget, increase debt and require higher taxes.
The growing inequality in income distribution and the rural–urban divide represent a severe risk for
the power of the Communist Party. Discontent among farmers due to relatively low income, the
high costs of human health services, insufficient pensions in old age and the arbitrary decisions of
bureaucrats with respect to land use rights and local levies may lead to social unrest in the
countryside which, traditionally, has played an important role in political changes in China. Massive
lay-offs in the rust belt, toxic industrial dumping, affecting farming, fishing and water, and
industrial accidents may add to the unrest. Social upheaval could threaten the ruling Party. That is

36
why rulers fear the Latin-Americanisation of the country and why they have announced the target of
a Harmonious Society. After all, China lacks profound experience in social problem-solving,
compared, for instance, to India.
c. Distorted resource-extensive growth
China’s growth is unbalanced in many ways: exports and investment instead of consumption,
foreign direct investment from abroad instead of financing from domestic savings, inflationary risk
through money and credit expansion instead of price level stability, production and investment
instead of social protection, pollution in favour of production instead of environmental protection
and stimulation of urban centres instead of improvement in the rural areas. It can be argued that
such unbalanced growth is a normal vehicle to obtain high growth rates; that is simply the price to
be paid for this growth. However, imbalances imply serious adjustment costs in the future and the
risk of a crisis. The strong expansion of the export sector will require sectoral readjustment later on,
the investment boom may have to be corrected at high costs, the real estate boom may end in a
bubble that bursts and a banking crisis may have a serious impact on the real side of the economy.
According to this view, China has followed an inefficient, resource-demanding or even resource-
destroying growth path with many distortions. Factoring in these distortions, the GDP growth rate
may actually be lower than measured statistically, say at 7.5 percent per year.21 That is why some
economists plead for another growth strategy with fewer distortions (Blanchard and Giavazzi 2005;
Roubini and Setser 2005). It seems likely that the normal brakes and constraints mentioned will
affect the growth rate. Barring political crises, a lower growth rate of, say, 6 percent annually in the
21 See sources quoted in (Lindbeck 2006, p. 25)

37
next twenty years is more realistic. Such a scenario is more likely since China’s growth is a
catching-up process in which, so far, imitation plays a major role. Such processes lose steam over
time. It would be a different story if China were able to move the technological frontier of the world
itself and was not dependent on the imitation of Western technological solutions.
d. Institutional deficits
Besides normal brakes and constraints, China’s weak institutional arrangements could affect growth
dynamics. It is now well established that institutions are an important factor in economic growth.
The institutional deficits may well be more relevant for the sustainability of Chima’s growth process
than the economic bottlenecks.
An efficient economic system requires a reliable institutional framework since most decisions of
economic agents need a long-run orientation. When rules and institutional frameworks for economic
decisions are lacking, bureaucratic structures, informal relationships, family networks or networks
of friends take their place. While informal networks lend some stability to the system, without
reliable rules conditions for economic agents become arbitrary in many respects; agents then are at
the mercy of bureaucrats and Party officials. Those who have the power to decide can hand out
favours, usually in return for compensation. Corruption is the unavoidable outcome. The rule of law
therefore is a necessary requirement for a sustained growth process.
Individual economic freedom is a necessary condition for growth. This requires that the party define
a decision space for the private sector, guaranteeing economic freedom. An important aspect of the
rule of law is that rights are given to private firms and households and that the holders of these

38
rights can enforce them. This calls for corruption to be pushed back and it mandates clearer property
rights. In addition, the Communist Party must desist from intervening in administrative and court
decisions. Rules must be stable in order to be credible. To respect the dignity of man goes beyond
the demand for economic freedom. All these requirements may limit the power of the Party.
The actual Chinese system of governance has been described as neo-Leninist state, blending a one-
party rule and state control of key sectors of the economy with the market mechanism and an open
economy (Pei 2006). Patronage secures support from key constituents, including the bureaucracy,
the military and the business community. The question remains open whether or not economic
freedom will start a process in which citizens eventually demand political freedom. The
relationship between economic freedom and political freedom, i.e. democracy, seems asymmetrical.
Whereas democracy is accompanied by economic freedom (Friedman 1982), economic freedom
does not necessarily entail political freedom. A major aspect could be that economic agents will
insist on the right to elect those who make the laws governing economic freedom. After all, market
capitalism separates economic and political power and this may put political power on the
defensive. The biggest challenge for China may then well be the demand for democracy. Whether or
not this political demand for democracy will be forcefully articulated in China in the future cannot
realistically be answered at this stage. One answer is that the Chinese derive an immense happiness
from being and becoming rich and will be satisfied (for a long time) with a situation in which the
Communist Party just lets them get rich. Then economic freedom is all there is. In this scenario, the
government remains more or less authoritarian. Another possible answer is that the Communist
Party will introduce some cautious steps towards decentralized democratic procedures, for instance
letting mayors be elected on a decentralized level. Among the political leaders there is a fear that
the Communist Party will fall apart and the country break up. For the Party, the disintegration of

39
the Soviet Union serves as a negative example besides the Latin- Americanisation of social issues.
The result may be a cautious attempt of controlled capitalism, which may then serve as a prototype
for other countries, for instance the Arab oil countries and some developing countries. The least
likely case is the third possible answer, a full move towards democracy, Western style.
Economic fundamentals may impact on the political system and vice versa. Thus, in generating
Chinese multinationals, the issue arises of how China’s products are viewed outside China and
whether their image includes the characteristics of freedom. Social inequality may lead to political
unrest. Lower growth rates may put the political system into question, and political turmoil may
jeopardize the economic growth dynamics of the past. An unstable China, for instance with a
growing unrest of the rural population, will represent a threat to the world. Political rulers may then
be tempted to play with nationalist sentiment to bolster legitimacy.
e. Hard or soft landing?
Excluding a political disruption, for instance a confrontation between China and the United States, a
scenario for the next 25 years might be described as follows: 22 China’s GDP expands at a rate of 6
percent per year, the US’s at 2.5 percent. The world grows at 3.5 percent. Using the revised GDP
data, putting China at 5.0 percent of World GDP and the US at 28.1 percent (in 2005), China will be
at 9.1 percent of world GDP in 2030, the US at 22.0 percent, using market prices. Thus, in 25 years
China would represent 41 percent of the US GDP, compared to 17.9 percent in 2005. The economic
core of the world economy is slowly but steadily moving towards China. Of course, such
22 Taiwan may be a bone of contention in international relations in the future, especially when China is becoming more
powerful economically and will be challenging the leading economic and political position of the US.

40
calculations invite questions. Economic growth knows booms and busts, i.e. a constant growth rate
is unlikely, even in a stable political environment.
A hard landing in the form of a crisis in China cannot be excluded. Such a crisis may come from the
banking system, should depositors lose confidence and a bank run occur. A crisis may arise from
the real side of the economy, if over-investment and a distorted capital stock force major
readjustment. It may also appear if the world economy moves into a slump and Chinese exports
have to compete with other countries in a situation of global oversupply and excess production
capacity. This then could feed into a capital flow reversal with FDI no longer flowing in; eventually
a currency crisis may arise. Furthermore, a crisis could emerge from an energy price shock, for
instance if an oil price shock cuts China off from its needed energy inputs. Global warming puts
China under pressure, possibly inducing it to continue its path of heavy pollution but at the same
time following an isolated approach with many international frictions. Last but not least, a political
crisis could spill over into the economy. With China now a major global player, a crisis there would
have a severe impact on the Asian countries and on the world economy.
7. CONCLUSIONS
In contrast to the centrally planned economies of Central and Eastern Europe in the 1990s,, whose
transformation in the 1990s cost 20 to 40 percent of GDP, China did not experience a J-type
transformation curve. Since the Deng Xiaoping reforms it has enjoyed high average annual GDP
growth rates of nearly ten percent. It now is the world’s fourth largest economy, accounting for 5.0
percent of world GDP with a world market share of 6.8 percent. Excluding political disruptions,

41
China may produce about 10 percent of the world’s GDP in 2030, the US being at about double the
percentage.
• Exports (at 35 percent of GDP) and investment (at 39 percent of GDP) have been the two driving
forces for growth. Loss-making state-owned firms, an inefficient use of savings and a fragile
banking system represent structural weaknesses.
• China uses the large surpluses in its current and capital account to accumulate international
reserves, standing at 37 percent of its GDP. The international reserves have been drawn on to
recapitalize the fragile banking system from time to time. With non-performing loans at 25 percent
of GDP, reserves can be interpreted as an insurance against a future bank failure.
• The exchange rate and capital flows are controlled. The high current account surplus of 7.2
percent of GDP in 2005 and the inflow of FDI suggest a nominal appreciation of the renmimbi.
However, a liberalisation of the capital account would encourage Chinese to export their savings to
be protected in old age and to hedge against political risk. This would devalue the renmimbi. Its
under-valuation therefore hinges on the controlled capital account. We would be better informed on
this if China followed the advice of the IMF and allowed more flexibility in the exchange rate;
China would also be informed to what extent the exchange rate distorts its economy.
• Property rights, crucial in the transformation of a communist economy, come in the form of land use
rights, ownership titles of firms and residential titles. They are in a flux, mushy and are only valid as
long as they are justified by economic success. All these rights are subject to control by collective

42
authorities, most importantly municipalities and the Communist Party. They are de facto revoked when
a more promising use of land is in sight.
• Besides structural weaknesses, normal brakes in the growth process and new constraints will slow
the growth rate in the next decades. Amongst these constraints count higher degrees of energy
scarcity, more safety in the work place, environmental degradation and social security insurance. The
distorted growth process will have to be corrected. The Communist Party is concerned that social
policy issues may lead to an Latin-Americanisation, and therefore introduced the goal of a Harmonious
Society.
• Institutional deficits, for instance the lack of the rule of law, may be more relevant for the future
process of growth than economic constraints, which can be dealt with through a technocratic approach.
It is an open question as to whether economic freedom starts a process in which citizens eventually
demand political freedom. One possible answer is that the Chinese derive an immense happiness from
being and becoming rich and will be satisfied with a situation in which the political Party just lets them
get rich.
• A future crisis in China cannot be excluded. It may come from the banking system, should depositors
lose confidence, causing a bank run. Or it may appear if over-investment and a distorted capital stock
force a major readjustment, if the world economy moves into a slump and Chinese exports have to
compete with other countries in a situation of excess production capacity, or if an energy price shock
cuts China off from its needed energy inputs. Global warming may put China under pressure, possibly
inducing it to continue its path of heavy pollution but at the same time following an isolated approach
with many international frictions. Last but not least, a political crisis could spill over to the economy.

43
REFERENCES
Blanchard, O. J., F. Giavazzi (2005). Rebalancing Growth in China. CEPR Discussion Paper No. 5403.
London, UK. Available HTTP: <http://www.cepr.org/pubs/new-dps/dplist.asp?dpno=5403>.
Bergsten, F. (2006). Clash of the Titans, Newsweek. April 24.
DeLisle, J. (2004). Property Rights Reform in China. Conference Presentation, The Future of Political
Reform in China, 29th January 2004. Available HTTP:
<http://www.fpri.org/transcripts/lecture.20040126.delisle.chinapropertyrights.html>.
Dunaway, S., X. Li (2005). Estimating China’s “Equilibrium” Real Exchange Rate. IMF Working
Paper No. 05/202. Available HTTP: <http://www.imf.org/external/pubs/ft/wp/ 2005/wp05202.pdf>.
Economist (2006). Coming Out: A Survey on China. Economist, 378 (8470). March 25.
Garcia-Herrero, A., S.Gavila and D. Santabarbara (2005). China’s Banking Reform: An assessment of
its evolution and possible impact. Documentos Ocassionales No.0502. Banco de Espana. Available
HTTP: <http://papers.ssrn.com/sol3/papers.cfm?abstract_id=854944>.
Friedman, M. (1982) Capitalism and Freedom. Chicago
Holz, C. A. (2006). Why China’s New GDP Data Matters. Far Eastern Economic Review, 169 (1): 54-
56.

44
Huang, P., S. Zhan (2005). Internal Migration in China: Linking it to Development. Regional
Conference on Migration and Development in Asia. 14-16 March. Available HTTP:
http://www.iom.int/chinaconference/files/documents/bg_papers/China.pdf>[0].
International Labour Organization (ILO) (2006). Labour Statistics Online Data Base.
International Monetary Fund (IMF) (2004). People’s Republic of China. Staff Report for 2004 Article IV
Consultation. Washington, DC. November. Available HTTP:
<http://www.imf.org/external/pubs/ft/scr/2004/cr04351.pdf>.
—— (2005a). People’s Republic of China. Staff Report for 2005 Article IV Consultation. Country.
Washington, DC. November. Available HTTP:
<http://www.imf.org/external/pubs/ft/scr/2005/cr05411.pdf >.
——(2005b). World Economic Outlook: Globalization and External Imbalances. Washington, DC
—— (2006a) International Financial Statistics. Various Issues. Washington, DC.
——(2006b) People’s Republic of China. Staff Report for 2006 Article IV Consultation. Washington,
DC. October. Available HTTP: <http://www.imf.org/external/pubs/ft/scr/2006/cr06394.pdf >.
Lindbeck, A. (2006). An Essay on Economic and Social Change in China, Institute for International
Economic Studies, Stockholm University, and Research Institute for Industrial Economics,
Stockholm, Mimeo.
Pei, M. (2006). The Dark Side of China’s Rise. Foreign Policy Magazine, March/April. Available
HTTP: <http://www.carnegieendowment.org/publications/index.cfm? fa=view&id=18110&prog
=zch>.
Prasad, E. S. (2004). China’s Growth and Integration into the World Economy: Prospects and
Challenges. IMF Occasional Paper 232. Washington, DC: IMF.
Roubini, N., B. Setser (2005). China Trip Report. Available HTTP:
<http://pages.stern.nyu.edu/~nroubini/ChinaTripReport-Roubini-Setser.pdf>.

45
Siebert, H. (2007). The World Economy. A Global Analysis. London: Routledge
US Congressional Research Service (2006). China’s Trade with the United States and the World, CRS
Report for Congress. August 18.
Wang, T. (2004). Exchange Rate Dynamics. In: Barnett, S. A., E. S. Prasad (eds.), China’s Growth and
Integration into the World Economy: Prospects and Challenges. Washington, DC: IMF.
World Bank (2006a). China at a Glance (Country Fact Sheet). August 2006. Washington, DC.
—— (2006b). Development and the Next Generation. World Development Report 2007. Washington,
DC.
—— (2006c). World Development Indicators. Online Data Base. Washington, DC.
World Bank Office, Beijing (2006a). Quarterly Update. February 2006
World Bank Office, Beijing (2006b). Quarterly Update. August 2006
World Trade Organization (WTO) (2006a). International Trade Statistics. Online Data Base. Available
HTTP: <http://www.wto.org/english/res_e/statis_e/statis_e.htm>.
—— (2006b). World Trade Policy Review. Geneva. July
-------------------
Abstract: This paper analyses China’s economic performance in the last 25 years and discusses its
prospect for growth in the future. Exports and investment have been the two driving forces for the
high annual GDP growth rates. FDI plays an important role. However, structural issues such as the
loss-making state-owned firms and the fragile banking industry have to be solved. Monetary policy
is complicated by the accumulation of reserves which, however, provide an insurance for the fragile
banking system. Property rights, a crucial element in transforming a communist society, are far
from being clearly developed. Major policy issues in the future include the correction of the
distorted growth process and of the institutional deficits, especially with respect to the rule of law
and the lack of democracy.

46
Keywords: Drivers of growth, transformation, banking system, balance of payments,
exchange rate policy, under-valuation, property rights, institutional deficits, future
scenarios.
JEL classification: E2,E4, F10,F 43, K