children looked after in england (including adoption) year ... · march 2016 sfr 41/2016, 29...
TRANSCRIPT

Contact: Email: [email protected] Press office: 020 7783 8300 Public enquiries: 0370 000 2288
Children looked after in England
(including adoption) year ending 31
March 2016
SFR 41/2016, 29 September 2016
Numbers of looked after children have continued to steadily rise
The number of looked after children has continued
to rise; it has increased steadily over the last eight
years. There were 70,440 looked after children at 31
March 2016, an increase of 1% compared to 31
March 2015 and an increase of 5% compared to
2012. The rise this year reflects a rise of 1,470 in
unaccompanied asylum seeking children, compared
to a rise of 970 in all looked after children.
The majority of looked after children are placed with foster carers
In 2016 the number of children in foster care
continued to rise; of the 70,440 looked after
children at 31 March 2016, 51,850 (74%)
were cared for in foster placements – the
same proportion as last year.
The numbers of unaccompanied asylum seeking children have increased
In 2016 the number of looked after
unaccompanied asylum seeking children
increased by 54% compared to last year’s
figures, up to 4,210 children at 31 March 2016
from 2,740 in 2015 and up from a low of 1,950
in 2013.
At 31 March 2016, unaccompanied asylum
seeking children represented 6% of the looked
after children population.

Contact: Email: [email protected] Press office: 020 7783 8300 Public enquiries: 0370 000 2288
Contents
Numbers and characteristics of children looked after at 31 March (Table A1 & A3) ...................................................................................................................... 4
Gender and age of children looked after at 31 March 2016 ....................................................... 4
Ethnicity of looked after children ................................................................................................ 4
Unaccompanied asylum seeking children .................................................................................. 5
Reason for being looked after .................................................................................................... 6
Legal status of looked after children .......................................................................................... 6
Placement of children looked after (Table A2) ........................................................................... 7
Number of placements during the year ...................................................................................... 8
Children who started to be looked after (Table C1) ........................................ 9
Children who ceased to be looked after (Table D1) ..................................... 10
Reasons for ceasing to be looked after ................................................................................... 10
Children looked after who were adopted (Tables E1 & E2) .......................... 11
Duration of the stages of the adoption process ....................................................................... 12
Former care leavers (Tables F1a to F1d) ..................................................... 13
‘Staying put’ ............................................................................................................................. 14
Looked after children who were missing or away from placement without authorisation (Table G1) ......................................................................................... 16
Accompanying tables ................................................................................... 17
Further information is available .................................................................... 18
National Statistics ........................................................................................ 19
Technical information ................................................................................... 19
Get in touch ................................................................................................. 19
Media enquiries ....................................................................................................................... 19
Other enquiries/feedback ......................................................................................................... 19
About this release
This Statistical First Release (SFR) provides information about looked after children in England for the year ending 31 March 2016, including where they are placed, their legal status, the numbers starting and ceasing to be looked after, and the numbers who go missing or are away from their placement without authorisation.
Figures cover looked after children who were placed for adoption, the number who were adopted and the average time between different stages of the adoption process.
Contact: Email: [email protected] Press office: 020 7783 8300 Public enquiries: 0370 000 2288
In this publication
The following tables are included in the SFR:
• Children looked after national tables (SFR41_2016_National_tables.xls)
• Children looked after local authority tables (SFR41_2016_LA_tables.xls)
The accompanying quality and methodology document provides information on the data sources, their coverage and quality, and explains the methodology used in producing the data.
Feedback
We are changing how our releases look and welcome feedback on any aspect of this document at [email protected].

4
Numbers and characteristics of children looked after at 31 March (Table A1 & A3)
At 31 March 2016, there were 70,440 looked after children in England, an increase of 970 (1%) on 2015,
and an increase of 3,370 (5%) on 2012. In 2012, 59 children per 10,000 of the population were looked
after; in 2016 the rate was 60 children per 10,000 of the population.
The rise over time reflects the higher number of children starting to be looked after than ceasing. In
particular, in the latest year, we have seen a rise in the number of unaccompanied asylum seeking children
in care, with 3,440 unaccompanied asylum seeking children entering care, and 1,980 leaving care. Many of
the changes seen in the characteristics of the looked after children population as a whole have been
influenced by this increase, for example with a rise in the number of children aged 16 and over, and a rise
in the number of children with an ethnic background of ‘Any other Asian’, ‘African’ or ‘Any other ethnic
group’. If we remove unaccompanied asylum seeking children from the count of looked after children, we
see that there has been a decrease in the looked after children population of 500 (1%) since 2015.
Gender and age of children looked after at 31 March 2016
At 31 March 2016, 56% of children looked after are male, 44% female and these proportions have varied
little over recent years.
The age profile has continued to change over the last four years, with a steady increase in the number and
proportion of older children. 62% of children looked after were aged 10 years and over in 2016 compared
with 56% in 2012. There has been a reduction in the number and proportion of children aged 1-4 years
(from 18% of the looked after population in 2012 to 13% in 2016), and a slight decrease in the number and
proportion of children aged under 1 year (from 6% in 2012 to 5% in 2016).
Figure 1: Children looked after at 31 March by age group:
England, 2012 to 2016
Source: SSDA903
Ethnicity of looked after children
Looked after children are predominantly White, 75% in 2016. Children of Mixed ethnicity were the next
largest group (9%) followed by Black or Black British (7%), Asian or Asian British (4%) and other ethnic
groups (3%) .
Over the last year we can see a rise in the numbers from some minority ethnic groups, in particular ‘Any
other ethnic group’, ‘African’ and ‘Any other Asian background’ (excludes Indian, Pakistani or Bangladeshi).
This is likely to reflect the increase in the numbers of unaccompanied asylum seeking children.

5
Figure 2: Children looked after by ethnicity: England, 31 March 2016
Source: SSDA903
Unaccompanied asylum seeking children
Up to 2009 the number of looked after children who were asylum seeking children was steadily increasing
to a high of 3,900, before falling over the next five years to a low of 1,950 (3% of all looked after children) in
2013. Since then, we have seen the numbers steadily rise up again, and since 2015 there has been a 54%
rise, such that of the 70,440 looked after children at 31 March 2016, 4,210 (6%) were unaccompanied
asylum seeking children. Whilst we do not collect data on the nationality of looked after children, statistics
on asylum applications from unaccompanied asylum seeking children by nationality are published by the
Home Office1.
Figure 3: Number of children looked after, by unaccompanied asylum seeking children (UASC) status: England, position as at 31 March 2004 to 2016
Source: SSDA903
Unaccompanied asylum seeking children are predominantly male, 93% in 2016 (up from 88% in 2012), and
75% are aged 16 years or over. When a child starts to be looked after, their primary category of need is
1 Home Office National Statistics asylum data tables 7.3, 08q at https://www.gov.uk/government/publications/immigration-statistics-april-to-june-2016/list-of-tables.
6
collected. For unaccompanied asylum seeking children, 91% have a primary need of absent parenting and
5% are looked after due to abuse or neglect.
Unaccompanied asylum seeking children are not located evenly across the country; there are higher
numbers in the local authorities where there are access routes into the UK. Kent have seen a 136% rise in
the latest year, up to 865 looked after at 31 March 2016 – 21% of all unaccompanied asylum seeking
children – and there were a further 430 (10%) in Croydon. Two thirds of all unaccompanied asylum seeking
children (66%) were located in London and the South East and a further 11% were in the East of England.
Reason for being looked after
When a child starts to be looked after their primary need is collected and the proportions of children in each
primary need group each year have remained fairly stable. However, we have seen the proportion of
children looked after due to abuse or neglect fall slightly from 62% in 2014, to 61% in 2015 and to 60% in
2016. Over the same time period the proportion of children in need due to absent parenting has risen from
5% in 2014, to 7% in 2016, reflecting the rise in unaccompanied asylum seeking children.
Legal status of looked after children
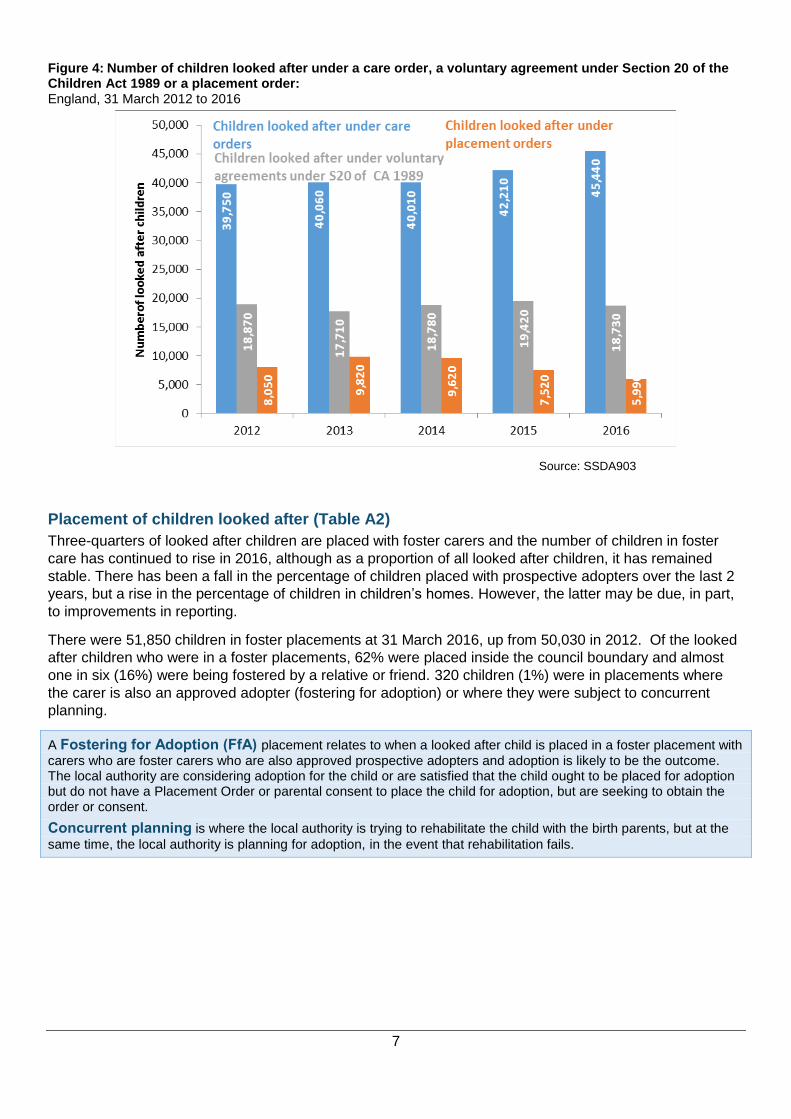
The numbers and proportion of children looked after on a care order have continued to increase. In 2016,
65% (45,440) of children looked after at 31 March were looked after under a care order, up from 61% in
2015 and up from 59% in 2012. Voluntary agreements under Section 20 of the Children Act 1989, which
have fluctuated slightly over recent years, have dipped slightly this year from 28% in 2015 to 27%.
Placement orders have shown some growth over the same time period with a decline more recently, from
12 % in 2012 up to a high of 14% in 2013 and 2014 before falling to 8% in 2016. This is in line with
quarterly adoptions data collected by the Adoption Leadership Board, which has indicated that since
Quarter 2 2013-14, numbers of Adoption Decision Maker decisions for adoption and numbers of adoption
placement orders granted have decreased. The National Adoption Leadership Board has linked this trend
to the impact of two relevant court judgments, known as Re B and Re B-S. The National Adoption
Leadership Board has published guidance on this issue. On the 27 March 2016, the Department for
Education published a new adoption strategy “Adoption – a vision for change” which addresses the decline
in Adoption Decision Maker decisions and adoption placement orders further.
Under the Children Act 1989, a care order is defined as an order made by the court on the application of any local
authority or authorised person to: (a) place a child with respect to whom the application is made in the care of a designated local authority; or (b) put him under the supervision of a designated local authority.
A voluntary agreement under section 20 of the Children Act 1989 enables a local authority to provide
accommodation for any child in need if they consider that to do so would safeguard or promote the child’s welfare. Such an arrangement requires the consent of those with parental responsibility where a child is under 16 or the child themselves where the child is over 16. A local authority is required to provide accommodation for a child within their area under section 20 as a result of: (a) there being no person who has parental responsibility for him; (b) his being lost or having been abandoned; or (c) the person who has been caring for him being prevented (whether or not permanently, and for whatever reason) from providing him with suitable accommodation or care.
Placement order is a court order which gives a local authority the legal authority to place a child for adoption with
any prospective adopters who may be chosen by the authority. Only local authorities may apply for placement orders. The order continues in force until it is revoked, an adoption order is made in respect of the child, the child marries, forms a civil partnership or the child reaches 18.
7
Figure 4: Number of children looked after under a care order, a voluntary agreement under Section 20 of the Children Act 1989 or a placement order: England, 31 March 2012 to 2016
Source: SSDA903
Placement of children looked after (Table A2)
Three-quarters of looked after children are placed with foster carers and the number of children in foster
care has continued to rise in 2016, although as a proportion of all looked after children, it has remained
stable. There has been a fall in the percentage of children placed with prospective adopters over the last 2
years, but a rise in the percentage of children in children’s homes. However, the latter may be due, in part,
to improvements in reporting.
There were 51,850 children in foster placements at 31 March 2016, up from 50,030 in 2012. Of the looked
after children who were in a foster placements, 62% were placed inside the council boundary and almost
one in six (16%) were being fostered by a relative or friend. 320 children (1%) were in placements where
the carer is also an approved adopter (fostering for adoption) or where they were subject to concurrent
planning.
A Fostering for Adoption (FfA) placement relates to when a looked after child is placed in a foster placement with
carers who are foster carers who are also approved prospective adopters and adoption is likely to be the outcome. The local authority are considering adoption for the child or are satisfied that the child ought to be placed for adoption but do not have a Placement Order or parental consent to place the child for adoption, but are seeking to obtain the order or consent.
Concurrent planning is where the local authority is trying to rehabilitate the child with the birth parents, but at the
same time, the local authority is planning for adoption, in the event that rehabilitation fails.
8
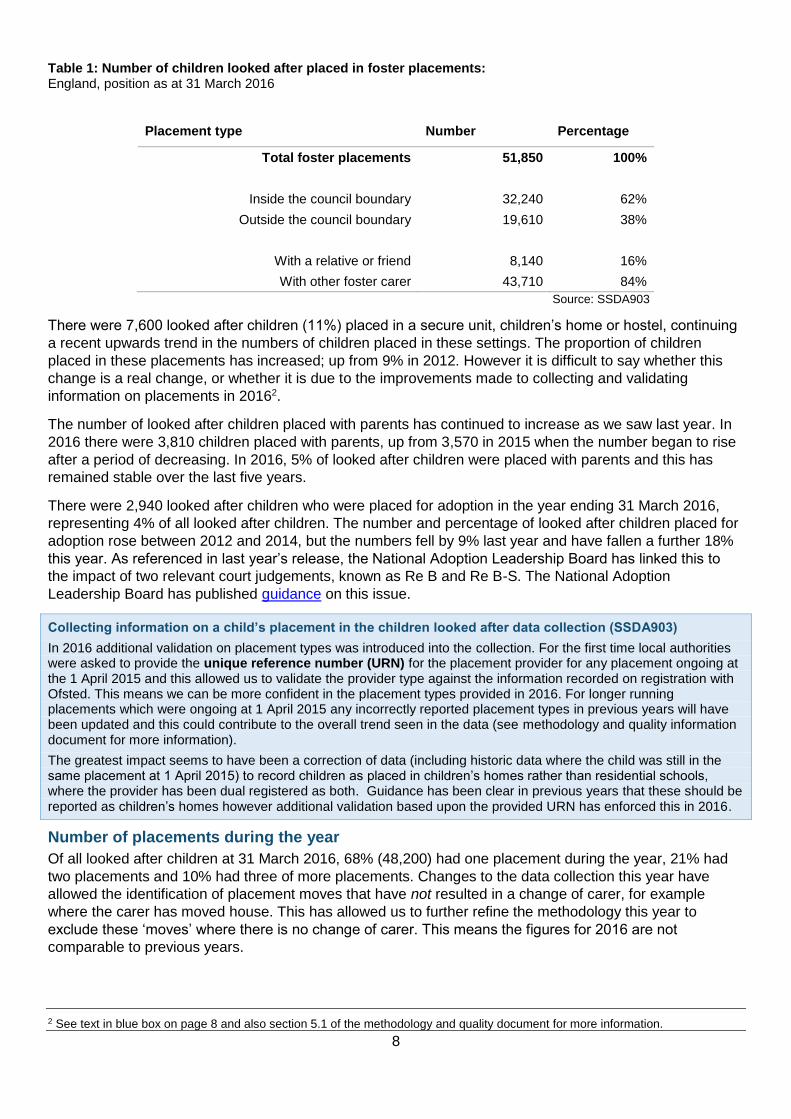
Table 1: Number of children looked after placed in foster placements: England, position as at 31 March 2016
Placement type Number Percentage
Total foster placements 51,850 100%
Inside the council boundary 32,240 62%
Outside the council boundary 19,610 38%
With a relative or friend 8,140 16%
With other foster carer 43,710 84%
Source: SSDA903
There were 7,600 looked after children (11%) placed in a secure unit, children’s home or hostel, continuing
a recent upwards trend in the numbers of children placed in these settings. The proportion of children
placed in these placements has increased; up from 9% in 2012. However it is difficult to say whether this
change is a real change, or whether it is due to the improvements made to collecting and validating
information on placements in 20162.
The number of looked after children placed with parents has continued to increase as we saw last year. In
2016 there were 3,810 children placed with parents, up from 3,570 in 2015 when the number began to rise
after a period of decreasing. In 2016, 5% of looked after children were placed with parents and this has
remained stable over the last five years.
There were 2,940 looked after children who were placed for adoption in the year ending 31 March 2016,
representing 4% of all looked after children. The number and percentage of looked after children placed for
adoption rose between 2012 and 2014, but the numbers fell by 9% last year and have fallen a further 18%
this year. As referenced in last year’s release, the National Adoption Leadership Board has linked this to
the impact of two relevant court judgements, known as Re B and Re B-S. The National Adoption
Leadership Board has published guidance on this issue.
Collecting information on a child’s placement in the children looked after data collection (SSDA903)
In 2016 additional validation on placement types was introduced into the collection. For the first time local authorities were asked to provide the unique reference number (URN) for the placement provider for any placement ongoing at the 1 April 2015 and this allowed us to validate the provider type against the information recorded on registration with Ofsted. This means we can be more confident in the placement types provided in 2016. For longer running placements which were ongoing at 1 April 2015 any incorrectly reported placement types in previous years will have been updated and this could contribute to the overall trend seen in the data (see methodology and quality information document for more information).
The greatest impact seems to have been a correction of data (including historic data where the child was still in the same placement at 1 April 2015) to record children as placed in children’s homes rather than residential schools, where the provider has been dual registered as both. Guidance has been clear in previous years that these should be reported as children’s homes however additional validation based upon the provided URN has enforced this in 2016.
Number of placements during the year
Of all looked after children at 31 March 2016, 68% (48,200) had one placement during the year, 21% had
two placements and 10% had three of more placements. Changes to the data collection this year have
allowed the identification of placement moves that have not resulted in a change of carer, for example
where the carer has moved house. This has allowed us to further refine the methodology this year to
exclude these ‘moves’ where there is no change of carer. This means the figures for 2016 are not
comparable to previous years.
2 See text in blue box on page 8 and also section 5.1 of the methodology and quality document for more information.

9
Children who started to be looked after (Table C1)
The number of children who started to be looked after has been increasing since 2012 and continues to
increase again this year. In 2016 the increase appears to be due to a rise in the numbers of
unaccompanied asylum seeking children starting to be looked after, given the increases are largely seen
amongst males, amongst those aged 16 and over, and amongst those with a primary category of need of
‘absent parenting’.
There were 32,050 children who started to be looked after during the year ending 31 March 2016; an
increase of 2% from the previous year’s figure of 31,340 and an increase of 13% from 2012.
The percentage of children starting to be looked after aged 10 to 15 has remained constant at 29% over the
last four years whilst the proportion aged 16 and over has increased steadily, from 12% in 2012 to 18% in
2016. In both cases this means the actual numbers have been increasing. Over the same period, the
proportion aged under 1 has fallen from 21% in 2012 to 18% in 2016; the proportion aged 1 to 4 years has
fallen from 20% in 2012 to 18% in 2016, whilst the proportion aged 5 to 9 years has remained stable at
17%.
Figure 5: Number of children starting to be looked after by age: England, 2012 to 2016
Source: SSDA903
Of the children who started to be looked after during the year ending 31 March 2016, 19,400 (61%) started
to be looked after under a voluntary agreement under section 20 of the Children Act 1989; this has
fluctuated over recent years (62% in 2015 and 61% in 2014). The percentage starting to be looked after
under a care order dropped in 2014 to 20%, down from 24% in 2013, but has since risen up to 23% in
2016. This reflected a rise in the number of children starting to be looked after under a care order from
6,560 in 2015 to 7,530 in 2016. The percentage who were detained under a child protection order has
remained fairly stable since 2012.
Information on whether children starting to be looked after had previously left care under a permanence
arrangement (that is, adoption, special guardianship order or child arrangements order) was collected for
the first time in 2014. In the year ending 31 March 2016, of the 32,050 children starting to be looked after,
500 (2%) had a previous permanent arrangement; 200 had previously had a special guardianship order (up
from 130 last year), 160 had previously been adopted (compared to 170 last year) and 150 had a child
arrangements order or residence order (down from 190 last year). However it is difficult to read too much
into these numbers given they are small and there are a large number of cases where the local authority
reported they did not know if the child had had a previous permanence arrangement (13% of children
starting to be looked after in 2016).
10
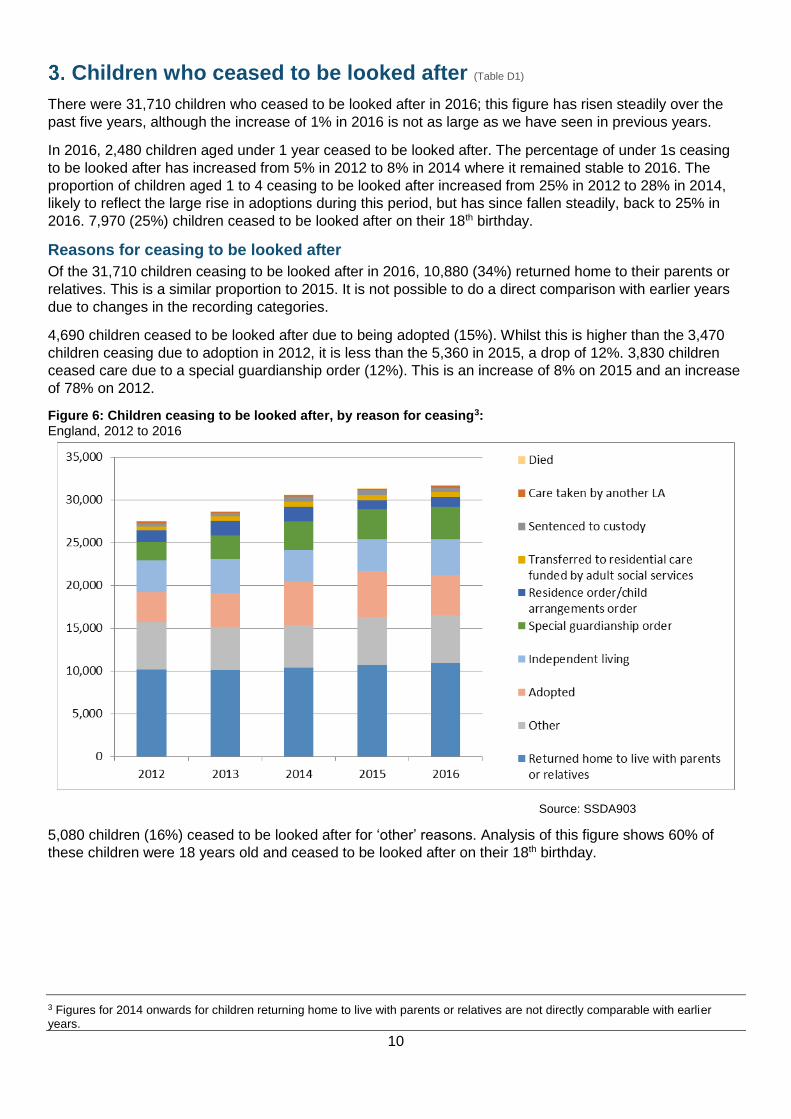
Children who ceased to be looked after (Table D1)
There were 31,710 children who ceased to be looked after in 2016; this figure has risen steadily over the
past five years, although the increase of 1% in 2016 is not as large as we have seen in previous years.
In 2016, 2,480 children aged under 1 year ceased to be looked after. The percentage of under 1s ceasing
to be looked after has increased from 5% in 2012 to 8% in 2014 where it remained stable to 2016. The
proportion of children aged 1 to 4 ceasing to be looked after increased from 25% in 2012 to 28% in 2014,
likely to reflect the large rise in adoptions during this period, but has since fallen steadily, back to 25% in
2016. 7,970 (25%) children ceased to be looked after on their 18th birthday.
Reasons for ceasing to be looked after
Of the 31,710 children ceasing to be looked after in 2016, 10,880 (34%) returned home to their parents or
relatives. This is a similar proportion to 2015. It is not possible to do a direct comparison with earlier years
due to changes in the recording categories.
4,690 children ceased to be looked after due to being adopted (15%). Whilst this is higher than the 3,470
children ceasing due to adoption in 2012, it is less than the 5,360 in 2015, a drop of 12%. 3,830 children
ceased care due to a special guardianship order (12%). This is an increase of 8% on 2015 and an increase
of 78% on 2012.
Figure 6: Children ceasing to be looked after, by reason for ceasing3: England, 2012 to 2016
Source: SSDA903
5,080 children (16%) ceased to be looked after for ‘other’ reasons. Analysis of this figure shows 60% of
these children were 18 years old and ceased to be looked after on their 18th birthday.
3 Figures for 2014 onwards for children returning home to live with parents or relatives are not directly comparable with earlier years.

11
Children looked after who were adopted (Tables E1 & E2)
The numbers of looked after children who were adopted in 2016 decreased for the first time in recent years,
but this was anticipated as in 2015 we saw a reduction in the number of placement orders and a reduction
in the number of children placed for adoption.
4,690 looked after children were adopted in 2016, down 12% on a high of 5,360 in 2015 which followed a
period of growth since 2011.
Figure 7: Number of children looked after adopted: England, 1994 to 2016
Source: SSDA903
The fall in the number of adoptions was seen in the 1 to 4 year old age group, which covers 72% of all
adopted children in 2016. The number of looked after children aged under 1 year who were adopted, and
the number aged 5 to 9 years who were adopted, remained stable in 2016 (230 and 1,020 respectively).
The average age at adoption rose slightly from 3 years and 3 months last year to 3 years and 5 months in
2016. However this is lower than in 2012 where the average age was 3 years and 8 months.
More males were adopted from care than females. 2,490 males (53%) were adopted from care and 2,200
females (47%) but this reflects the fact that there are more males looked after than females. 83% were
white and 11% were mixed, very similar to the last 5 years.
12
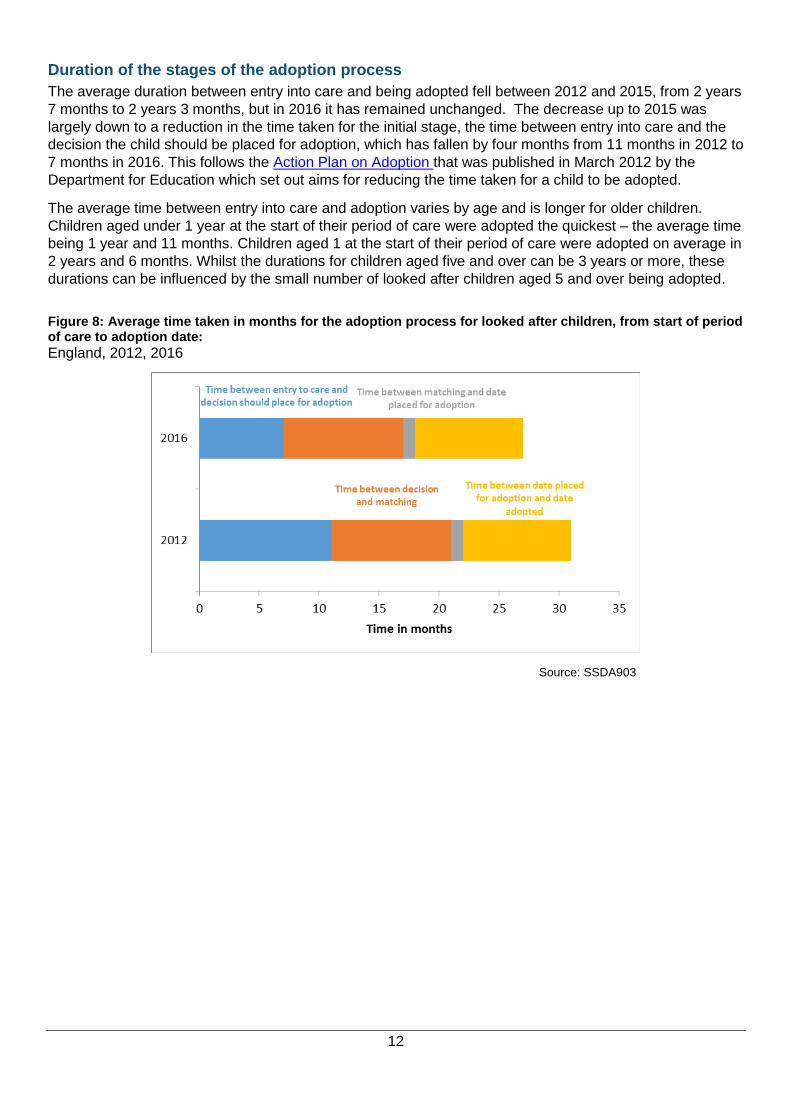
Duration of the stages of the adoption process
The average duration between entry into care and being adopted fell between 2012 and 2015, from 2 years
7 months to 2 years 3 months, but in 2016 it has remained unchanged. The decrease up to 2015 was
largely down to a reduction in the time taken for the initial stage, the time between entry into care and the
decision the child should be placed for adoption, which has fallen by four months from 11 months in 2012 to
7 months in 2016. This follows the Action Plan on Adoption that was published in March 2012 by the
Department for Education which set out aims for reducing the time taken for a child to be adopted.
The average time between entry into care and adoption varies by age and is longer for older children.
Children aged under 1 year at the start of their period of care were adopted the quickest – the average time
being 1 year and 11 months. Children aged 1 at the start of their period of care were adopted on average in
2 years and 6 months. Whilst the durations for children aged five and over can be 3 years or more, these
durations can be influenced by the small number of looked after children aged 5 and over being adopted.
Figure 8: Average time taken in months for the adoption process for looked after children, from start of period of care to adoption date:
England, 2012, 2016
Source: SSDA903

13
Former care leavers (Tables F1a to F1d)
Local authorities continue to stay in touch with more care leavers - ‘in touch’ information has been
published for the first time in 2016.
23,000 (87%) of 19, 20 and 21 year old care leavers were in touch with the local authority, up from 86% in
2015 and up from 82% in 2014. A further 8% were not in touch, for 3% the young person no longer required
services and for 2% the young person refused contact. The percentage ‘in touch’ varies by age; 90% of 19
year olds were in touch, compared to 88% of 20 year olds and 83% of 21 year olds.
In 2016, data for 17 and 18 year olds were collected for the first time and have been published as
experimental statistics. 81% of 17 year olds and 94% of 18 year olds were in touch with the local authority,
although due to their experimental nature the figures should be treated with caution.
Data collected on care leavers
Local authorities provide the department with information about the cohort of children who have turned 17, 18, 19, 20 or 21 in the year who were previously looked after. The cohort covers children looked after for a total of at least 13 weeks after their 14th birthday, including some time after their 16th birthday.
Information for children age 17 and 18 was collected for the first time this year. Due to concerns over the completeness of the data it has been published as experimental statistics and therefore should be treated with caution.
Further information can be found in the quality and methodology document.
Activity and accommodation has been collected for more care leavers this year: in 2016 activity information
was returned for 23,440 19 to 21 year olds (89%), up from 22,920 (87%) in 2015 and up from 22,480 (84%)
in 2014. Accommodation information was returned for 23,570 (89%) 19 to 21 year olds in 2016, up from
23,150 (88%) in 2015 and up from 22,490 (84%) in 2014. Users of the data should be aware that these
increases in children with known data may increase, or decrease the percentages of children in each
category as more information is known.
Based on 2016 data, of the 26,340 former care leavers aged 19, 20 and 21 years old, 10,460 (40%) were
not in employment, education or training (NEET), compared with 14% of all 19 to 21 year olds. The
percentage of care leavers who are NEET has risen by one percentage point in each of the last 2 years.
The increase is seen in the categories for NEET due to illness or disability, and NEET due to pregnancy or
parenting. NEET due to other reasons has decreased, from 27% in 2014, to 25% in 2015, to 23% in 2016.
However, as well as an increase in the percentage of 19 to 21 year old care leavers who are NEET, there
has also been a rise in the percentage of those who are in training and employment. The rise in both
categories is a result of having information about a greater proportion of the population. In 2016 24% of
former care leavers aged 19 to 21 years old were in training and employment, an increase from 23% in
2015 and up from 20% in 2014.
14
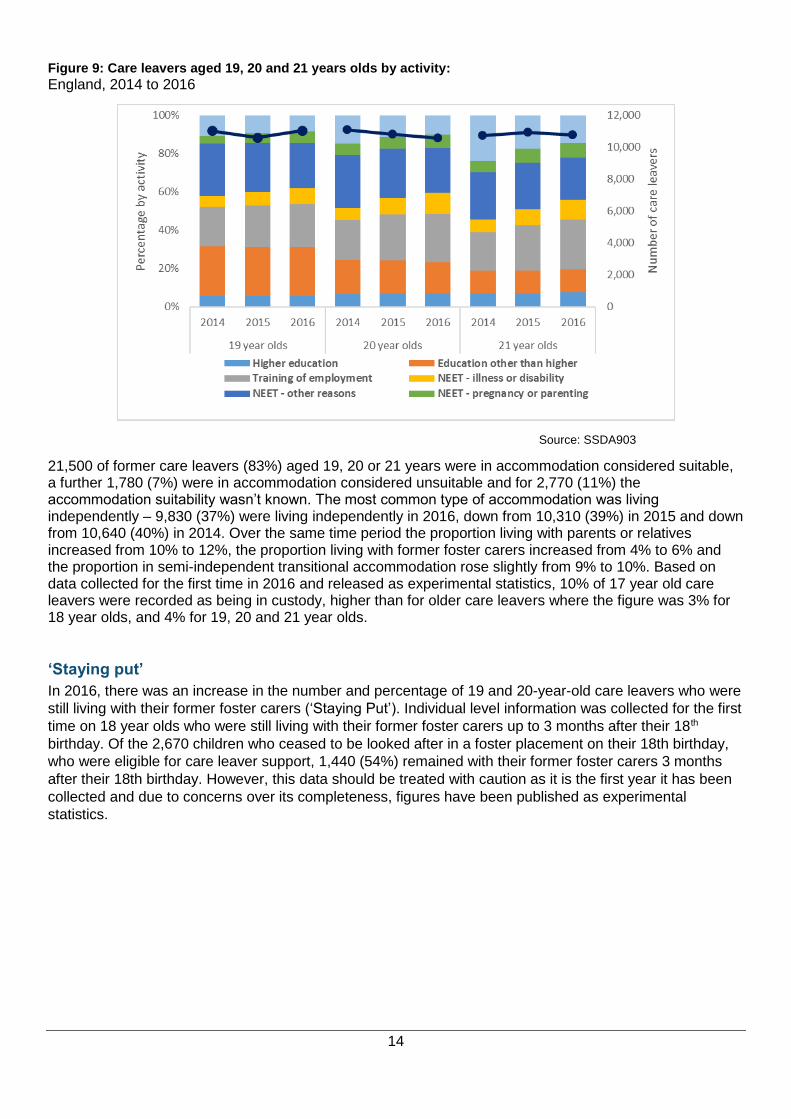
Figure 9: Care leavers aged 19, 20 and 21 years olds by activity:
England, 2014 to 2016
Source: SSDA903
21,500 of former care leavers (83%) aged 19, 20 or 21 years were in accommodation considered suitable, a further 1,780 (7%) were in accommodation considered unsuitable and for 2,770 (11%) the accommodation suitability wasn’t known. The most common type of accommodation was living independently – 9,830 (37%) were living independently in 2016, down from 10,310 (39%) in 2015 and down from 10,640 (40%) in 2014. Over the same time period the proportion living with parents or relatives increased from 10% to 12%, the proportion living with former foster carers increased from 4% to 6% and the proportion in semi-independent transitional accommodation rose slightly from 9% to 10%. Based on data collected for the first time in 2016 and released as experimental statistics, 10% of 17 year old care leavers were recorded as being in custody, higher than for older care leavers where the figure was 3% for 18 year olds, and 4% for 19, 20 and 21 year olds.
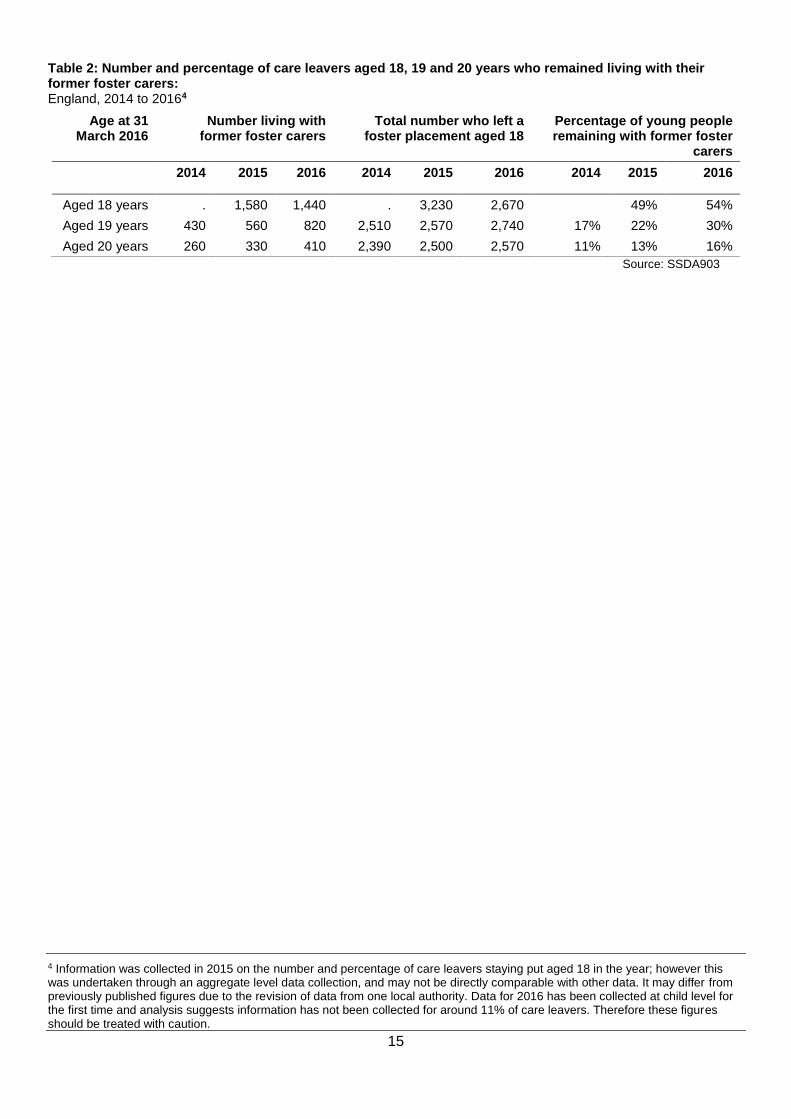
‘Staying put’
In 2016, there was an increase in the number and percentage of 19 and 20-year-old care leavers who were
still living with their former foster carers (‘Staying Put’). Individual level information was collected for the first
time on 18 year olds who were still living with their former foster carers up to 3 months after their 18th
birthday. Of the 2,670 children who ceased to be looked after in a foster placement on their 18th birthday,
who were eligible for care leaver support, 1,440 (54%) remained with their former foster carers 3 months
after their 18th birthday. However, this data should be treated with caution as it is the first year it has been
collected and due to concerns over its completeness, figures have been published as experimental
statistics.
15
Table 2: Number and percentage of care leavers aged 18, 19 and 20 years who remained living with their former foster carers: England, 2014 to 20164
Age at 31 March 2016
Number living with former foster carers
Total number who left a foster placement aged 18
Percentage of young people remaining with former foster
carers
2014 2015 2016 2014 2015 2016 2014 2015 2016
Aged 18 years . 1,580 1,440 . 3,230 2,670 49% 54%
Aged 19 years 430 560 820 2,510 2,570 2,740 17% 22% 30%
Aged 20 years 260 330 410 2,390 2,500 2,570 11% 13% 16%
Source: SSDA903
4 Information was collected in 2015 on the number and percentage of care leavers staying put aged 18 in the year; however this was undertaken through an aggregate level data collection, and may not be directly comparable with other data. It may differ from previously published figures due to the revision of data from one local authority. Data for 2016 has been collected at child level for the first time and analysis suggests information has not been collected for around 11% of care leavers. Therefore these figures should be treated with caution.

16
Looked after children who were missing or away from placement without authorisation (Table G1)
Experimental statistics and comparability between 2015 and 2016
Detailed information on all children looked after who were missing or away from placement without authorisation was collected and published for the first time in 2015. This year local authorities have told us of improvements in the collection and reporting of these figures, however we are not yet fully confident in their quality hence the figures are being published as ‘experimental statistics’ again this year. We will continue to assess the data quality in 2017 to decide if the data is robust enough for the experimental status to be removed. This improvement in the quality of the 2016 figures means they are not comparable to figures for 2015.
There were 8,670 children who were recorded as missing at least once in 20165. This corresponds to 9% of
the cohort of 100,810 children who were looked after at some point during the year. These children had
43,000 missing incidents which is an average of 5 missing incidents per child who went missing. 4,430
children were away from their placement without authorisation in the year. There were 17,560 incidents of
children being away without authorisation, an average of 4 per child.
Most missing incidents were short, 89% lasted two days or less and the median number of days per
missing incident was 1 day. However we need to be cautious interpreting this figure as the duration of
missing incidents is collected in days so a child who went missing for a short period late one evening, but
was found early the next morning would be counted as being missing for 1 day even if they were only
missing for a few hours.
Figure 10: Placements from which children went missing: England, Year ending 31 March 2016
Half of missing incidents were by children who were placed in children’s homes or hostels, and a further
35% of incidents were by children in foster placements.
5 The number of children missing is collected separately from police forces, however this information is not directly comparable due
to the different data collection practices and definitions.
17
Accompanying tables
The following tables are available on the department’s statistics website:
National tables
A1 All children looked after at 31 March by gender, age at 31 March, category of need, ethnic origin, legal status and motherhood status, 2012 to 2016
A2 Children looked after at 31 March by placement, 2012 to 2016
A3 Unaccompanied asylum seeking children looked after at 31 March by gender, age at 31 March, category of need and ethnic origin, 2012 to 2016
B1 Children looked after at any time during the year ending 31 March and those looked after continuously for at least 12 months at 31 March by gender, age at 31 March, placement and ethnic origin, 2012 to 2016
C1 Children who started to be looked after during the years ending 31 March by gender, age on starting, category of need, ethnic origin, legal status and previous permanence arrangement, 2012 to 2016
D1 Children who ceased to be looked after during the years ending 31 March by gender, age on ceasing, reason episode ceased, legal status category of need and ethnic origin, 2012 to 2016
E1 Looked after children who were adopted during the years ending 31 March by gender, age at adoption, ethnic origin, category of need, final legal status, duration of final period of care and age on starting final period of care, 2012 to 2016
E2 Children looked after who were adopted during the year ending 31 March by average time between the different stages of the adoption process and age at start of period of care, 2012 to 2016
F1a Care leavers aged 19, 20 and 21 years old by gender, contact with the local authority and activity, 2014 to 2016
F1b Care leavers aged 19, 20 and 21 years old by accommodation, 2014 to 2016
F1c Care leavers aged 17 and 18 years old by gender, contact with the local authority and activity, 2016
F1d Care leavers aged 17 and 18 years old by accommodation, 2016
G1 Children looked after who were missing or away from placement without authorisation, 2015 and 2016
Local authority and regional tables
LAA1 Children looked after at 31 March, 2012 to 2016
LAA4 Unaccompanied asylum seeking children looked after at 31 March, 2012 to 2016
LAB1 Children looked after at any time during the year ending 31 March and those looked after exclusively under a series of short term placements, 2012 to 2016
LAC1 Children who started to be looked after during the years ending 31 March, 2012 to 2016
LAD1 Children who ceased to be looked after during the years ending 31 March, 2012 to 2016
LAE1 Children who ceased to be looked after and the number and percentage adopted during the years ending 31 March, 2012 to 2016

18
When reviewing the tables, please note that:
Rounding Conventions
The National Statistics Code of Practice requires that reasonable steps
should be taken to ensure that all published or disseminated statistics
produced by the DfE protect confidentiality. National figures have been
rounded to the nearest 10 and local authority figures have been rounded
to the nearest 5. For confidentiality purposes, numbers from one to five
inclusive have been replaced in the published tables by a cross (x). To
ensure the suppressed number cannot be identified by simple arithmetic
secondary suppression may be required. In this case the next smallest
number less than 20 is also suppressed. Where any number is shown as
zero (0), the original figure submitted was zero (0). The following
convention has been used:
”.” means not applicable
“-“ means negligible – used to represent a percentage below 0.5%
UK Comparability of Looked-
After Children’s Statistics
Data is collected and published independently by each of the 4 countries
in the UK. Although there are similarities between the data collected by
the 4 nations, there are also differences which may be down to different
policies and legislation, and differing historical data collections.
Population Estimates Population estimates are used to calculate rates per 10,000 children
under the age of 18 published in Table A1 and LAA1. These are
calculated using the appropriate mid-year population estimates supplied
by the Office for National Statistics (ONS).
Further information is available
Outcomes for looked after
children in England
Information on outcomes for looked after children is available for children
looked after at 31 March 2015. Outcomes include educational attainment,
special educational needs (SEN), exclusions from school. Health including
emotional and behavioural health, offending and substance misuse
information which was published in the outcomes release for 2014 were
published as additional tables to the 2015 children looked after release
instead.
Children in need and child
protection statistics for
England
Information on referrals, assessments and children who were the subject
of a child protection plan (taken from the Children in Need census) is
available for 2015. Statistics for 2016 will be published in November 2016
on the children in need statistics website.
Information on care
proceedings in England
The Children and Family Court Advisory and Support Service (CAFCASS)
publish information on care proceedings applications made by local
authorities where CAFCASS has been appointed by the court to represent
the interests of children.
Local authority expenditure Information on local authority planned expenditure on schools, education,
children and young people’s services is available for the financial year
2015-16. This data is returned to DfE by local authorities via the Section
251 Budget Return.
19
Ofsted statistics Ofsted publish inspection outcomes for local authority children’s services
and children’s social care providers in England as well as data on the
placements of children looked after and fostering in England.
Scotland Statistics on children’s social work in Scotland are available for 2014-15
on the Scottish Government website.
Wales Statistics on children looked after in Wales are available for the period up
to 31 March 2015 on the Welsh Government website.
Northern Ireland Statistics on children looked after in Northern Ireland are available for
2014-15 and are published on the Department of Health, Social Services
and Public Safety website.
National Statistics
The United Kingdom Statistics Authority has designated these statistics as National Statistics, in
accordance with the Statistics and Registration Service Act 2007 and signifying compliance with the Code
of Practice for Official Statistics.
Designation can be broadly interpreted to mean that the statistics:
meet identified user needs;
are well explained and readily accessible;
are produced according to sound methods, and
are managed impartially and objectively in the public interest.
Once statistics have been designated as National Statistics it is a statutory requirement that the Code of
Practice shall continue to be observed.
The Department has a set of statistical policies in line with the Code of Practice for Official Statistics.
Technical information
A quality and methodology document accompanies this SFR. This provides further information on the data
sources, their coverage and quality and explains the methodology used in producing the data, including
how it is validated and processed.
Get in touch
Media enquiries
Press Office News Desk, Department for Education, Sanctuary Buildings, Great Smith Street, London
SW1P 3BT.
Tel: 020 7783 8300
Other enquiries/feedback
Alison Butler, Department for Education, Bishopsgate House, Darlington, DL1 5QT.
Tel: 01325 340465 Email: [email protected]
© Crown copyright 2016
This publication (not including logos) is licensed under the terms of the
Open Government Licence v3.0 except where otherwise stated. Where
we have identified any third party copyright information you will need to
obtain permission from the copyright holders concerned.
To view this licence:
visit www.nationalarchives.gov.uk/doc/open-government-licence/version/3
email [email protected]
write to Information Policy Team, The National Archives, Kew, London, TW9 4DU
About this publication:
Enquiries: Alison Butler, Department for Education, Bishopsgate House, Darlington, DL1 5QT.
Tel: 01325 340465 Email: [email protected]
Reference: [SFR 41/2016]
Follow us on Twitter: @educationgovuk
Like us on Facebook: facebook.com/educationgovuk