child support arrearages - virginia · 2006-09-21 · child support arrearages: a legal, policy,...
TRANSCRIPT

CHILD SUPPORT ARREARAGES:
A Legal, Policy, Procedural, Demographicand Caseload Analysis
Final Report
Funded in part by a Section 1115 Grant from the U.S. Department ofHealth and Human Services, Office of Child Support Enforcement
Division of Child Support Enforcement Virginia Department of Social Services
August 2004

CHILD SUPPORT ARREARAGES:
A Legal, Policy, Procedural, Demographicand Caseload Analysis
Final Report
Prepared by:
Donald W. Myers, D.B.A., Principal Investigator Virginia Commonwealth University, Richmond, VA
Project Manager:
Todd W. Areson, Ph.D. Virginia Division of Child Support Enforcement
August 2004

Virginia Arrearages Study Page ii
Acknowledgments
This research represents a multi-year Office of Child Support Enforcement initiative for Virginia and the Child Support Enforcement community. The final product could not have been as thorough in its coverage without the efforts and resourcefulness of two primary partners: the Center for Support of Families, Chevy Chase, MD, technical consultant; and the Virginia Commonwealth University (VCU) Center for Urban Development, which collected, analyzed, and re-analyzed the data, to ensure a credible, well-documented product.
The Center for the Support of Families (Center) – Vernon Drew, particularly, provided his usual insight and knowledgeable perspective of how other Child Support programs handle collections and arrearages. He also identified the most productive ways to adopt/adapt that larger body of practices to benefit this research. Simultaneously, Susan Paikin of the Center performed a stellar legal analysis of federal and state regulations and statutes impeding collections and arrearages, and addressed where and how they might be used or changed in Virginia to make collecting child support more productive by reducing the build-up of arrears, interest, and fees.
The VCU Center for Urban Development (CUD) was represented by Drs. Michael Pratt and Steven Peterson, and econometrician Howard Sanderson. Steve Peterson was the major designer of the methodology and analysis of the probabilities of a reduction in arrears, resulting from the application of four enforcement tools selected for analysis. He also provided ad hoc consulting advice to the principal investigator as he reviewed and developed additional questions, to extract the most complete explanations from the Division of Child Support Enforcement (DCSE) administrative data set used in the study. The more laborious task fell to Howard Sanderson, whose expertise in manipulating and analyzing the data included suggesting additional opportunities to glean even further meaning from the data. Mike Pratt was extraordinary in coordinating the VCU CUD team throughout the duration of the project.
Dr. Todd Areson, DCSE Project Manager, performed key roles in the planning, administration, conduct, and analysis of this research. To a large extent, the final product reflects his collaborative work. Appreciation is also expressed to other key DCSE personnel –Bill Trainor, Cindy Holdren, Joan Faulkner, and Shawkat Rana. To all, thanks for a job well done! We hope this work analyzing arrearages will benefit not only Virginia but also other child support programs in the U.S. and abroad.
Donald W. Myers Principal Investigator
Virginia Arrearages Study Page iii
This page is left blank intentionally.

Virginia Arrearages Study Page iv
Table of Contents
ACKNOWLEDGMENTS………………………………………………………….……………………………………..ii
EXECUTIVE SUMMARY .......................................................................................................................................xi
Introduction/Background...........................................................................................................................xi
Causes of Arrears: Primary and Contributory .........................................................................................xi
The Arrears Sample...................................................................................................................................xii
Hypotheses ................................................................................................................................................xiii
Findings, Conclusions, and Recommendations ...................................................................................... xiv
INTRODUCTION ......................................................................................................................................................1
BACKGROUND................................................................................................................................................................1
CAUSES OF ARREARS ....................................................................................................................................................1
ARREARS MODEL ..........................................................................................................................................................2
CONTRIBUTORY CAUSES ...............................................................................................................................................3
State Laws and Agency Enforcement Policies...........................................................................................3
Custodial Parent .........................................................................................................................................4
Employers ...................................................................................................................................................4
PRIMARY CAUSES (NONCUSTODIAL PARENT) ..............................................................................................................4
Inability to Pay ............................................................................................................................................4
Lack of Motivation to Pay ...........................................................................................................................6
Recalcitrance ..................................................................................................................................6
Being Overwhelmed ........................................................................................................................6
HYPOTHESES ...........................................................................................................................................................8 Other Assumptions ......................................................................................................................................8
NEED FOR RESEARCH ........................................................................................................................................10
RESEARCH FINDINGS .........................................................................................................................................11
LEGAL CONSTRAINTS TO COLLECTING ARREARS .......................................................................................................11
Size of Support Debt .................................................................................................................................11
Age of the Debt...........................................................................................................................................12
Interest.......................................................................................................................................................12
Assignment of Rights and Distribution .....................................................................................................13
Enforcement Remedies...............................................................................................................................14
Income Withholding ......................................................................................................................14
Limitations on Withholding ..........................................................................................................14
ARREARS MANAGEMENT LITERATURE REVIEW .........................................................................................................14
FOCUS GROUPS...........................................................................................................................................................15
DEMOGRAPHIC CHARACTERISTICS OF NCPS IN SAMPLE ...........................................................................................15
The Sample.................................................................................................................................................15
Age ............................................................................................................................................................16
Age and Payment Frequency.....................................................................................................................19
Gender ........................................................................................................................................................21
Gender Composition of NCPs with Arrears .................................................................................21
NCP Gender and Support Amount................................................................................................22
NCP Gender and Payment Amount/Frequency ............................................................................22
Virginia Arrearages Study Page v
Table of Contents (cont.)
Employment Status ....................................................................................................................................23
Background...................................................................................................................................23
Employment Status and Arrears: I ...............................................................................................24
Employment of All NCPs and NCPs with Arrears ........................................................................25
Employment Status and Support Order Amount............................................................................26
Employment Status and Arrears: II .............................................................................................26
Employment Status and Frequency of Payments ..........................................................................27
Employment Status and Amount of Payments...............................................................................27
Employment Status and Payment Frequency by Arrears Categories ............................................28
Employment Status and Payment Amount by Arrears Categories................................................29
Race…. .... ..................................................................................................................................................30
Race and Employment Status.........................................................................................................31
Race of All NCPs and NCPs Owing Arrears ................................................................................31
NCP Race and Support Order Amount .........................................................................................32
NCP Race and Number of Cases .................................................................................................33
NCP Race and Percent of Arrears Debt ........................................................................................35
NCP Race and Payment Frequency..............................................................................................37
NCP Race and Amount of Payments.............................................................................................38
CASE CHARACTERISTICS OF NCPS OWING ARREARS .................................................................................................38
Type of Arrears Case ................................................................................................................................38
Type of Case: TANF Compared to Non-TANF .......................................................................................39
Type of Support Order ..............................................................................................................................40
Number of Cases Associated with NCP Owing Arrears ...........................................................................40
Number of Cases: Comparing Arrears Sample with Total DCSE Caseload ..........................................41
Number of Cases and Amount of Arrears.................................................................................................42
Number of Cases and Percent of Total Arrears Owed.............................................................................43
Number of Cases and Payment Frequency...............................................................................................44
Number of Cases and Payment Amount ..................................................................................................45
Support Amounts and Arrears Accumulations .........................................................................................45
Arrears Cases and Arrears Owed ..............................................................................................................46
Large Balances and Payment Frequency .................................................................................................48
Statistical Correlation of Arrears Balances and Making a Payment.......................................................48
Payments Made: Arrears Only Cases Compared to Current Support Plus Arrears Cases ....................49
Percent of NCPs Owing Arrears Who Made Payments............................................................................52
Payments Made: In-State Cases Compared to Interstate Cases..............................................................53
Payments Made by Case Type ...................................................................................................................53
All Arrears Cases: Dollar Amount Debt and Interest, 1999 and 2001 ...................................................55
Mean Dollar Amount of NCP Debt, 1999 and 2001.................................................................................58
Arrears Only Cases: Dollar Amount Debt and Interest, 1999 and 2001 .................................................58
Current Support Plus Arrears Cases: Amount of Debt and Interest, 1999 and 2001 ............................61
Summary: Amount of Arrears and Interest as a Percent of Arrears ......................................................63
Payments Made and Support Order Amount: All Arrears, Current Support Plus Arrears, and
Arrears Only Cases .................................................................................................................................63

Virginia Arrearages Study Page vi
Table of Contents (cont.)
ANALYSIS OF SELECTED ENFORCEMENT METHODS ..................................................................................................67
Income Withholding .................................................................................................................................68
Problems with Income Withholding..............................................................................................68
Liens ..........................................................................................................................................................69
Court Enforcement ....................................................................................................................................70
Financial Institution Data Match .............................................................................................................70
Estimations of a Reduction in Arrears Following Implementation of an Enforcement Method ...........71
Implementation of Selected Enforcement Methods and Type of Arrears Case.......................................72
Amount of Arrears and Selected Enforcement Methods .........................................................................73
Arrears Reduction Following Selected Enforcement Methods: Non-TANF/TANF Case
Status 74
Use of Enforcement Methods: TANF and Non-TANF Arrears Cases ...................................................75
Arrears Reduction Following Use of Selected Enforcement Methods: NCP’s Employment
Status 76
Use of Enforcement Methods: Unemployed and Employed NCPs .........................................................76
Arrears Reduction Following Use of Selected Enforcement Methods: Race.........................................76
District Office Use of Enforcement Methods...........................................................................................77
Effects of Selected Enforcement Methods on Payment Frequency and Amount ....................................78
RESPONSES TO HYPOTHESES .........................................................................................................................80
HYPOTHESIS 1: CHARGING FEES ON ARREARS CASES (E.G., FOR INTERCEPTING TAX REFUNDS)
INCREASES THE DIFFICULTY OF COLLECTING PAYMENTS. ............................................................80
HYPOTHESIS 2: CHARGING INTEREST ON ARREARS BALANCES IS AN EFFECTIVE STRATEGY FOR
THE COMMONWEALTH AND CPS TO MOTIVATE NCPS TO PAY. .......................................................80
HYPOTHESIS 3: LARGE ARREARS BALANCES RESULT FROM LARGE SUPPORT ORDER AMOUNTS. ..........................80
HYPOTHESIS 4: NCPS WHO OWE ARREARS ARE EITHER YOUNG OR ELDERLY. ......................................................81
HYPOTHESIS 5: PROPORTIONATELY, FEMALE NCPS OWE MORE ARREARS THAN MALE NCPS. ............................81
HYPOTHESIS 6: RACE IS A FACTOR IN NCPS BEING UNABLE TO PAY CURRENT SUPPORT AND,
THUS, INCURRING ARREARS. ...........................................................................................................81
HYPOTHESIS 7: PROPORTIONATELY, NCPS WHO HAVE MULTIPLE SUPPORT ORDERS OWE
MORE ARREARS THAN NCPS WHO HAVE SINGLE SUPPORT ORDERS. ............................................82
HYPOTHESIS 8: NCPS WHO HAVE LARGE ARREARS AMOUNTS ARE LESS LIKELY TO PAY
CURRENT SUPPORT AND ARREARS. ..................................................................................................82
HYPOTHESIS 9: LARGE ARREARS BALANCES DISSUADE NCPS FROM MAKING PAYMENTS. ...................................82
HYPOTHESIS 10: BASING FEDERAL INCENTIVE PAYMENTS ON STATE PERFORMANCE IN
COLLECTING ARREARS IS A REALISTIC STRATEGY. ........................................................................82
HYPOTHESIS 11: THE ACCRUAL OF ARREARS IS OFTEN DUE TO FACTORS BEYOND STATES’
CONTROL. ......................................................................................................................................83
FINDINGS, CONCLUSIONS, AND RECOMMENDATIONS...........................................................................84
LEGAL ISSUES ............................................................................................................................................................84
DEMOGRAPHIC CHARACTERISTICS OF NCPS IN SAMPLE ...........................................................................................85
Age Considerations ....................................................................................................................................85
Gender ........................................................................................................................................................85
Employment Status ................................................................................................................................... 85

Virginia Arrearages Study Page vii
Table of Contents (cont.)
NCP Gender and Employment ..................................................................................................................86
Race............... .............................................................................................................................................86
Race and Employment ...............................................................................................................................87
CASE CHARACTERISTICS OF NCPS OWING ARREARS.................................................................................................88
NCPs Owing Arrears Only and Current Support Plus Arrears ...............................................................88
TANF and Non-TANF Composition.........................................................................................................88
Last Order in Case File ............................................................................................................................88
Single and Multiple Cases .........................................................................................................................88
Arrears Balances........................................................................................................................................89
Arrears Only Compared to Current Support Plus Arrears.......................................................................89
Payments Made in Arrears Cases: Virginia Compared to U.S. ..............................................................89
Payments Made: Interstate vs. In-State Cases .........................................................................................89
TANF vs. Non-TANF................................................................................................................................90
Interest and Total Debt .............................................................................................................................90
Mean Amount of Debt Owed, 1999 and 2001..........................................................................................90
Effect of Fees .............................................................................................................................................91
Effect of Interest on NCP Debt..................................................................................................................91
ENFORCEMENT METHODS..........................................................................................................................................91
Enforcement Actions and Single/Multiple Cases ....................................................................................91
Use of Liens...............................................................................................................................................91
Income Withholding .................................................................................................................................91
Enforcement Methods: Non-TANF/TANF Case Status..........................................................................92
Effects of Selected Enforcement Methods: NCP Employment Status ....................................................92
Use of Selected Enforcement Methods: NCP Employment Status..........................................................92
District Office Use of Enforcement Methods ............................................................................................92
APPENDIX 1 ............................................................................................................................................................94
PROPOSITIONS RELATED TO THE OCCURRENCE OF ARREARS DUE TO AGENCY CAUSES ...........................................94
PROPOSITIONS RELATED TO THE OCCURRENCE OF ARREARS DUE TO THE CUSTODIAL PARENT...............................94
PROPOSITIONS RELATED TO THE OCCURRENCE OF ARREARS DUE TO NCP EMPLOYERS .........................................94
PROPOSITIONS RELATED TO THE OCCURRENCE OF ARREARS DUE TO THE NCP’S INABILITY TO PAY ......................94
PROPOSITIONS RELATED TO THE OCCURRENCE OF ARREARS DUE TO THE NCP’S MOTIVATION NOT TO PAY .........95
OTHER ASSUMPTIONS ................................................................................................................................................96
APPENDIX 2 ............................................................................................................................................................97
SUMMARY OF ARREARS MANAGEMENT LITERATURE .................................................................................................97
APPENDIX 3 ..........................................................................................................................................................110
THEMES FROM ARREARS MANAGEMENT LITERATURE.............................................................................................110
Prevention of Future Arrearages ...........................................................................................................110
Set Realistic Child Support Orders.............................................................................................110
Provide/Coordinate Support and Relief Programs for NCPs.....................................................110
Swift Enforcement .......................................................................................................................111

Virginia Arrearages Study Page viii
Table of Contents (cont.)
Reduction in Accumulated Arrearages ...................................................................................................111
Aggressive Enforcement Strategies.............................................................................................111
Amnesty Programs/Arrears Adjustment Policy ...........................................................................111
Policy on Interest on Child Support ...........................................................................................111
Examine Appropriateness of Orders...........................................................................................111
Case Closure Review ..................................................................................................................111
APPENDIX 4 ..........................................................................................................................................................112
VIRGINIA ARREARS SURVEY: ANALYSIS ..................................................................................................................112
Survey States (33) ..................................................................................................................................112
Enforcement Remedies Used ..................................................................................................................112
Age of Debt ..............................................................................................................................................112
Size of Debt...............................................................................................................................................113
TANF/Non-TANF....................................................................................................................................113
Interstate...................................................................................................................................................113
Hurdles/Barriers ......................................................................................................................................113
Additional Information Gained From Survey Instrument .....................................................................113
Suggestions for Ways to Increase Collections ........................................................................................114
APPENDIX 5 ..........................................................................................................................................................115
FOCUS GROUP RESULTS ...........................................................................................................................................115
Overall Recommendations on Arrears Collections.................................................................................115
Virginia Arrearages Study Page ix
Exhibits
EXHIBIT 1: PRIMARY AND CONTRIBUTORY CAUSES OF CHILD SUPPORT ARREARS ...................................................xii
EXHIBIT 1: PRIMARY AND CONTRIBUTORY CAUSES OF CHILD SUPPORT ARREARS .....................................................2
Index of Tables
TABLE 1: NONCUSTODIAL PARENTS’ BEHAVIOR DURING SUPPORT NEGOTIATION CONFERENCE .....................................7
TABLE 2: ARREARS CASELOAD, PAYMENT FREQUENCY, AND NCP’S AGE, JULY 2001....................................................18
TABLE 3: EMPLOYMENT STATUS OF COMMONWEALTH OF VIRGINIA CIVILIAN NON-INSTITUTIONAL POPULATION
COMPARED WITH NCPS OWING CHILD SUPPORT ARREARS BY GENDER, AGE, RACE, AND HISPANIC
ORIGIN, 2000 ...............................................................................................................................................20
TABLE 4: NCP’S GENDER, 1999 .................................................................................................................................22
TABLE 5: ARREARS AND FREQUENCY/MEAN PAYMENT BY GENDER...............................................................................23
TABLE 6: ARREARS & NCP’S EMPLOYMENT STATUS, JULY 1999 ..................................................................................25
TABLE 7: NCP’S EMPLOYMENT STATUS.......................................................................................................................26
TABLE 8: NCP’S EMPLOYMENT STATUS, ARREARS, AND PAYMENT FREQUENCY/AMOUNT..............................................27
TABLE 9: PAYMENTS MADE & NCP’S EMPLOYMENT STATUS, 2001 ..............................................................................30
TABLE 10: RACIAL STATUS: ALL NCPS AND NCPS OWING ARREARS ............................................................................32
TABLE 11: PERCENT DISTRIBUTION OF CASES BY NCP RACE .......................................................................................35
TABLE 12: NCP RACE, AMOUNT OF ARREARS, AND PAYMENT FREQUENCY/AMOUNT ....................................................37
TABLE 13: TYPE OF ARREARS CASE, JULY 1999 ...........................................................................................................38
TABLE 14: NON-TANF AND TANF: ENTIRE CASELOAD COMPARED TO ARREARS SAMPLE ............................................39
TABLE 15: ARREARS & TYPE OF SUPPORT ORDER, 1999 ..............................................................................................40
TABLE 16: NUMBER OF CASES AND NCPS OWING ARREARS .........................................................................................41
TABLE 17: COMPARISON OF NUMBER OF CASES ASSOCIATED WITH NCP: TOTAL DCSE CASELOAD VS. ARREARS
SAMPLE ..................................................................................................................................................42
TABLE 18: NUMBER OF CASES ASSOCIATED WITH NCP & AMOUNT OF ARREARS..........................................................43
TABLE 19: NUMBER OF CASES, ARREARS AMOUNT AND PAYMENT HISTORY, JULY 2001 ................................................44
TABLE 20: AMOUNT OF ARREARS AND AVERAGE SUPPORT ORDER – CURRENT SUPPORT PLUS ARREARS CASES,
JULY 1999..............................................................................................................................................46
TABLE 21: DISTRIBUTIONS OF TOTAL ARREARS CASES AND TOTAL ARREARS DEBT, JULY 1999 ......................................47
TABLE 22: ALL ARREARS CASES, FREQUENCY & AMOUNT OF PAYMENTS MADE, 2001 ..................................................49
TABLE 23: PAYMENT MADE WITHIN 12 MONTHS: ARREARS ONLY CASES COMPARED TO CURRENT SUPPORT PLUS
ARREARS CASES, 2001 ............................................................................................................................51
TABLE 24: PAYMENTS MADE BY TYPE OF ARREARS CASE..............................................................................................52
TABLE 25: PAYMENTS MADE WITHIN 12 MONTHS: IN-STATE COMPARED TO INTERSTATE, 2001 ...................................54
TABLE 26: CASE TYPE: FREQUENCY OF CASES, ARREARS OWED, AND PAYMENTS MADE, JULY 2001 ............................55
TABLE 27: AMOUNT OF ARREARS & INTEREST FOR ALL ARREARS CASES, JULY 1999.....................................................56
TABLE 28: AMOUNT OF ARREARS & INTEREST FOR ALL ARREARS CASES, JULY 2001 .....................................................57
TABLE 29: MEAN BALANCES OF NCPS, 1999 & 2001 ..................................................................................................58
TABLE 30: AMOUNT OF ARREARS & INTEREST FOR ARREARS ONLY CASES, JULY 1999 ..................................................60
TABLE 31: AMOUNT OF ARREARS & INTEREST FOR ARREARS ONLY CASES, JULY 2001 ..................................................60
TABLE 32: AMOUNT OF ARREARS & INTEREST FOR CURRENT SUPPORT PLUS ARREARS CASES, JULY 1999.....................62
TABLE 33: AMOUNT OF ARREARS & INTEREST FOR CURRENT SUPPORT PLUS ARREARS CASES, JULY 2001 ....................62

Virginia Arrearages Study Page x
Index of Tables (cont.)
TABLE 34: ALL ARREARS, CURRENT SUPPORT + ARREARS, AND ARREARS ONLY CASES: AMOUNT OF ARREARS,
INTEREST, AND INTEREST AS % OF ARREARS.............................................................................................65
TABLE 35: PERCENT CHANGE IN ARREARS, INTEREST, AND INTEREST AS % OF ARREARS, 1999-2001.............................66
TABLE 36: ARREARS CASES: COMPOSITION, PAYMENTS MADE, AND SUPPORT ORDER AMOUNT, 1999 AND 2001...........67
TABLE 37: PROBABILITY OF A REDUCTION IN THE ARREARS AMOUNT FOR SELECTED TIME PERIODS AFTER
ENFORCEMENT ACTION IS TAKEN; NCPS WITH SINGLE AND MULTIPLE CASES: ALL ARREARS CASES .........72
TABLE 38: COMPARISON OF TYPE OF ARREARS CASE IN WHICH SELECTED ENFORCEMENT METHODS WERE USED,
1999......................................................................................................................................................73
TABLE 39: PERCENT OF ALL ARREARS CASES IN WHICH SELECTED ENFORCEMENT METHODS WERE USED, 1999 .........74
TABLE 40: PROBABILITY OF A REDUCTION IN ARREARS AMOUNT FOLLOWING SELECTED ENFORCEMENT ACTION:
NON-TANF/TANF STATUS .....................................................................................................................75
TABLE 41: FREQUENCY OF USE OF ENFORCEMENT METHODS: TANF AND NON-TANF CASES .....................................75
TABLE 42: PROBABILITY OF REDUCTION IN ARREARS FOLLOWING SELECTED ENFORCEMENT ACTION: NCP’S
EMPLOYMENT STATUS.............................................................................................................................76
TABLE 43: FREQUENCY OF USE OF ENFORCEMENT METHODS: UNEMPLOYED AND EMPLOYED NCPS...........................76
TABLE 44: PROBABILITY OF A REDUCTION IN THE ARREARS AMOUNT AFTER ENFORCEMENT ACTION IS TAKEN:
NCP’S RACE ..........................................................................................................................................77
TABLE 45: DISTRICT OFFICE USE OF SELECTED ENFORCEMENT METHODS ..................................................................78
TABLE 46: FOUR ENFORCEMENT METHODS: PAYMENT FREQUENCY AND AMOUNT.......................................................79

Virginia Arrearages Study Page xi
Executive Summary
Introduction/Background
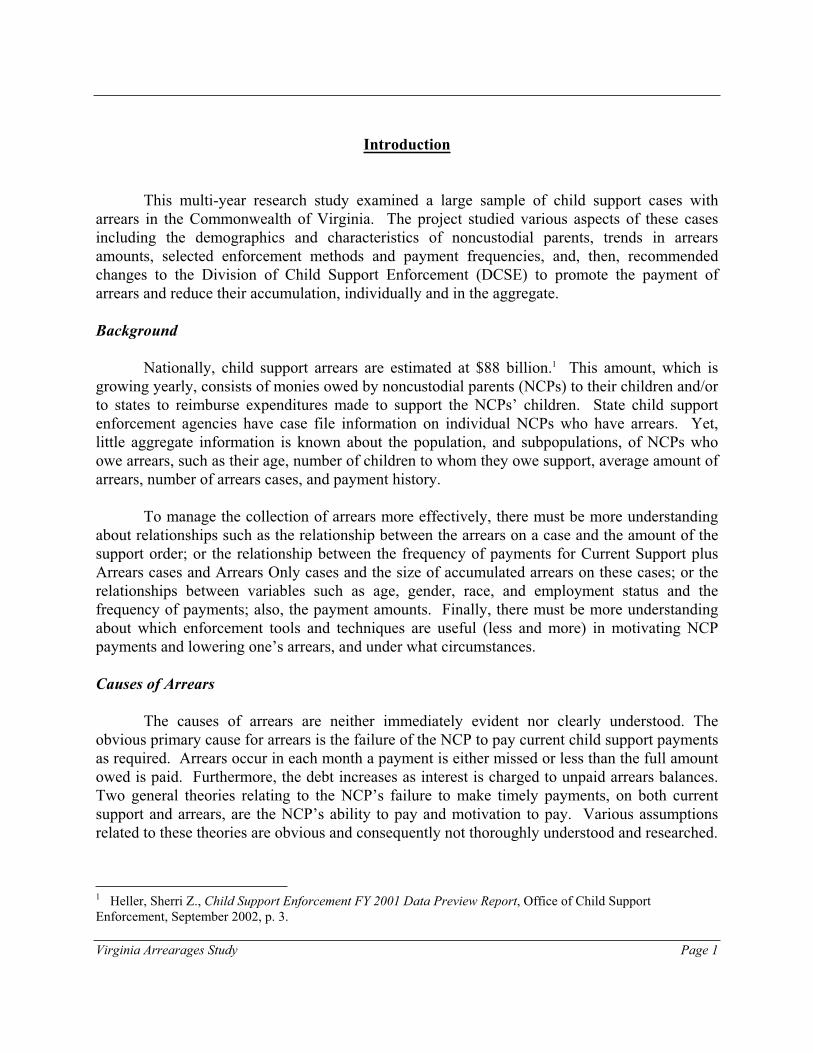
This multi-year research study examined a large sample of child support cases with arrears in the Commonwealth of Virginia. The project studied various aspects of these cases including the demographics and characteristics of noncustodial parents, trends in arrears amounts, selected enforcement methods and payment frequencies, and recommended changes to the Division of Child Support Enforcement (DCSE) to promote the payment of arrears and reduce their accumulation, individually and in the aggregate.
Nationally, child support arrears are estimated at $88 billion.1 This amount, which is growing yearly, consists of monies owed by noncustodial parents (NCPs) to their children and/or to states to reimburse expenditures made to support the NCPs’ children. State child support enforcement agencies have case file information on individual NCPs who have arrears. Yet, little aggregate information is known about the population, and subpopulations, of NCPs who owe arrears, such as their age, number of children to whom they owe support, average amount of arrears, number of cases, and payment history.
To manage the collection of arrears more effectively, enforcement personnel must understand more about relationships such as the relationship between the arrears on a case and the amount of the support order; or the relationship between the frequency of payments for Current Support plus Arrears cases and Arrears Only cases and the size of accumulated arrears on these cases; or the relationships between variables such as age, gender, race, and employment status and the frequency of payments; also, the payment amounts. Finally, they must understand better which enforcement tools and techniques are either less or more useful in motivating NCP payments and lowering the arrears.
Causes of Arrears: Primary and Contributory
Causes of arrears are neither immediately evident nor clearly understood. The obvious primary cause for arrears is the failure of the NCP to pay current child support payments as required. Two general theories relating to the NCP’s failure to make timely payments, on both current support and arrears, are the NCP’s ability to pay and the NCP’s motivation to pay. Other factors such as state laws, child support enforcement agency policies and practices, and the cooperation of employers and custodial parents are important in preventing and reducing
1 Heller, Sherri Z., Child Support Enforcement FY 2001 Data Preview Report, Office of Child Support
Enforcement, September 2002, p. 3.

Virginia Arrearages Study Page xii
arrearages. Assumptions about these factors are neither clearly defined nor understood. See Exhibit 1 for the presumed primary and contributing causes of arrears.
Exhibit 1: Primary and Contributory Causes of Child Support Arrears
The Arrears Sample
This research began with the July 1999 DCSE caseload, drawn from the Child Support Enforcement automated information system (known as APECS), which represented a total of 422,371 cases. First, the total number of cases having arrears was determined – 182,564, or 43.2 percent of the total DCSE caseload. (Note: A case/noncustodial parent was considered to have
PRIMARY (Noncustodial Parent) CONTRIBUTORY (Others)
UNABLE TO PAY UNMOTIVATED TO PAY
State laws State agency policies and practices Retroactive orders Assignment of fees Insufficient personnel Antiquated systems Not using all available
enforcement tools Interest/interest rate Uncooperative CP Uncooperative employer
Order too high Income imputed Order not modified Uncooperative NCP Insufficient income Living expenses too high Multiple support orders Supporting another family Other (e.g., medical bills) IncarceratedUnemployed Sick/disabled Unqualified for work Personal characteristics Inadequate training/educationPoor work history Elderly/frail Youth Discouraged from job searching Other Personal problems Substance abuse Legal Gambling Other personal problems Job discrimination Race Sex
Recalcitrant Anger at mother “Not my child” “Not my responsibility” No contact with child Retroactive support Fee charges Large arrears balance

Virginia Arrearages Study Page xiii
arrears if the arrears status code in APECS was set to Arrears Only or to Current Support plus
Arrears.) Next, from the 182,564 cases owing arrears in July 1999, a large random sample was drawn for detailed study, both to define arrears cases demographically and by case characteristics. This sample of 6,653 cases represented noncustodial parents having at least one case in arrears. (The sample had an error rate of +/- 1.2 percent at the 95 percent level of confidence.) The sample was tracked for a two-year period, from July 1999 through July 2001, by which time the sample size had decreased to 5151 cases, given normal attrition and case closures.
Hypotheses
The presumed causes for the occurrence of arrears among NCPs provide a convenient base from which to develop and test 11 hypotheses. Following are the hypotheses and the results from testing them in this study.
Hypothesis 1: Charging fees on arrears cases (e.g., for intercepting tax refunds) increases the
difficulty in collecting payments. NOT SUPPORTED: The mean amount of fees for All Arrears cases was $13 in July 1999 and $17 in July 2001 (see Table 29).
Hypothesis 2: Charging interest on arrears balances is an effective strategy for the
Commonwealth and CPs to motivate the NCPs to pay. NOT SUPPORTED: Between July 1999 and July 2001, NCPs who owed Current Support plus Arrears had a 4.4 percent increase in total debt that included a 37.8 percent increase in interest owed. Similarly, NCPs who owed Arrears Only had a 15.9 percent decline in total debt that, nevertheless, included a 12.9 percent increase in interest owed. (See Table 35.)
Hypothesis 3: Large arrears balances result from large support order amounts.
SUPPORTED for Arrears Balances $5000 +: See Table 20. For arrears balances below $5000, however, there is no relationship to the support order amount.
Hypothesis 4: NCPs who owe arrears are either young or elderly. NOT SUPPORTED: Infact, 94.2 percent of the NCPs owing arrears are in their “prime” or “near prime” earning years, i.e., from ages 25 through 54 (see Table 2).
Hypothesis 5: Proportionately, female NCPs owe more arrears than male NCPs. NOT
SUPPORTED: Female NCPs are under-represented in those owing arrears, constituting 12 percent of those who owe child support and only 7.4 percent of those owing arrears (see Table 4).
Hypothesis 6: Race is a factor in NCPs being unable to pay current support and, thus, incurring
arrears. NOT SUPPORTED: Black NCPs’ employment rate is 59.7 percent; they represent 60.8 percent of NCPs who owe arrears and hold 53.5 percent of the total debt. White NCPs’

Virginia Arrearages Study Page xiv
employment rate is 49.4 percent; they represent 32 percent of NCPs owing arrears and owe 36.6 percent of the total debt. (See Tables 3 and 12.)
Hypothesis 7: Proportionately, NCPs who have multiple support orders owe more arrears than
NCPs who have single support orders. NOT SUPPORTED: In the 2001 sample, NCPs with one arrears case represented 57.1 percent of those owing arrears yet owed 63.4 percent of the total debt (see Table 19).
Hypothesis 8: NCPs who have large arrears amounts are less likely to pay current support and
arrears. SUPPORTED: NCPs who owed $20,000 or more in arrears represented 15 percent of NCPs in arrears yet owed 52 percent of the total debt. By contrast, NCPs who owed less than $5,000 constituted 48 percent of NCPs with arrears and owed only 8.6 percent of the total debt (see Table 21).
Hypothesis 9: Large arrears balances dissuade NCPs from making payments. SUPPORTED:
As the size of arrears balances increases, the frequency of payments decreases. (See Proposition 31 and Table 22.)
Hypothesis 10: Basing federal incentive payments on state performance in collecting arrears is a
realistic strategy. OUTSIDE SCOPE OF STUDY
Hypothesis 11: The accrual of arrears is often due to factors beyond states’ control.
SUPPORTED: As shown in Exhibit 1, there are both primary and contributory causes beyond the direct control of the states. For example, consider both the motivation and the ability of the NCP to pay.
Appendix 1 contains a listing of propositions (including these 11 hypotheses), and the results, that address subjects relevant to arrears prevention and arrears reduction. These propositions are based upon the primary and contributory causes of arrears displayed in Exhibit
1.
Findings, Conclusions, and Recommendations
The findings, conclusions, and recommendations are based on a legal review of federal and Virginia child support policies and procedures, on information provided by four focus groups and a literature review, and on the “Research Findings” and “Responses to Hypotheses” sections of the full report. They are categorized as:
Legal issues
Demographic characteristics (i.e., age, gender, employment status, race) of NCPs in sample
Case characteristics of NCPs owing arrears
Enforcement methods.

Virginia Arrearages Study Page xv
Legal Issues
Virginia law requires interest to accrue “on all support payments collected by the Department.”2 For low-income obligors, the addition of interest to an already sizeable debt can create barriers to payment and additional enforcement issues. Reduction of the state’s judgment (i.e., interest) rate from nine to six percent in July 2004 will help address part of this problem. For TANF cases, research indicates that when child support is disbursed directly to the family, some fathers are more likely to pay support.3
Recommendation: For TANF debt, DCSE might benefit from examining whether it can use the retroactive portion of a support order as a negotiating tool to reward compliance with the future support obligation and other conditions, by compromising all or a portion of the arrears.
Virginia’s case closure rules (which are based on federal statutes) may contribute to incurring arrears. 22 V.A.C. 40-880-270(E) (3) requires the Department to cease withholding earnings if the whereabouts of the child, or the child and caretaker, become unknown. The regulation provides no guidance regarding the duration of the disappearance of the child. Recommendation: Federal statutes should be changed to allow amending Virginia statutes to define a minimum period for the disappearance of the child, or child and caretaker, before case closure may be initiated.
Demographic Characteristics of NCPs in Sample
Age Considerations
Of NCPs owing arrears, 94.2 percent are in their “prime” and “near-prime” earning ages, 25 through 54.
There is a significant relationship between an increase in NCP age and a declining percentage of NCPs who make a payment on arrears or current support within 12 months. Payment percentage drops precipitously from two-thirds (67.3%) or more through age 54 to one-half (51.3%) from age 55 forward. Recommendation: APECS should flag and Specialists monitor closely those cases where the NCP is approaching the “payment drop-off” age of 54.
Gender
While 88 percent of the NCPs paying child support in the Commonwealth are male, 92.6 percent of NCPs who owe arrears are male.
2 Code of Virginia § 63.2-1952. 3 See CLASP publication, Reauthorization Issues: Child Support Distribution – Getting More Support to Children,
February 2002.

Virginia Arrearages Study Page xvi
Female NCPs who owe arrears have smaller support order amounts (mean = $142) than their male counterparts (mean = $220).
Compared to male NCPs who owe arrears (69.9% made mean payments of $237), a smaller percentage of female NCPs made payments within 12 months (56.7%), and the mean amounts of their payments were smaller ($159). Both the percentages and payment amounts were significantly different.
Employment Status
The Joint Legislative Audit and Review Commission (JLARC) of the Virginia General Assembly estimates that 62 percent of NCPs in the Commonwealth who owe child support are employed. The arrears sample shows that 56.4 percent of NCPs who owe arrears are employed. Comparatively, results from a 1998 California study showed that 59 percent of the NCPs who owed arrears had income, and a recent Colorado study found that 46.9 percent of NCPs who owed arrears had a verified employer.
Employment rates are higher among NCPs owing arrears in Non-TANF cases (57.1%) than in TANF cases (54.2%).
Employed NCPs who owe arrears have a 13 percent higher support obligation ($227) than unemployed NCPs who owe arrears ($201).
The 56.4 percent of employed NCPs who owe arrears are responsible for 48.3 percent of total arrears. Conversely, the 43.6 percent of unemployed NCPs who owe arrears are responsible for 51.7 percent of total arrears.
The percentage of employed NCPs owing arrears who made a payment within 12 months (79.7%) is greater than the percentage of unemployed NCPs owing arrears and making a payment within 12 months (55.2%). This difference is significant.
There is no significant difference in the mean amounts of payments made within 12 months by employed NCPs ($234) and by unemployed NCPs ($232).
The percentage of employed NCPs who made a payment within 12 months is larger than the percentage of unemployed NCPs making a payment, and the difference increases as the amount of arrears increases: The difference is significant and ranges from 15 percent, for arrears between $500 and $999 inclusive, to 60 percent, for arrears $30,000 and over.

Virginia Arrearages Study Page xvii
NCP Gender and Employment
A slightly larger percentage of men (55.7%) than women (53.3%) who owe arrears are employed.
Race
White NCPs constitute 35 percent of all NCPs owing child support and 32 percent of NCPs who owe arrears. The respective percentages for black NCPs are 53 percent and 61 percent and for NCPs of Hispanic origin, 4 percent and 1 percent. Native American and Asian NCPs represented less than 1 percent of NCPs owing child support or arrears. NCP race was unknown for 8 percent who owe support and 6 percent who owe arrears.
Mean support order amounts for NCPs of different races are (in ascending order, rounded): black, $195; Native American, $201; white, $254; Hispanic origin, $267; and Asian, $285.
NCPs with a single arrears case are: Asian, 70.6 percent; Hispanic, 69.0 percent; white, 60.1 percent; and black, 45.7 percent.
NCPs Owing Arrears (%) Percent of Total DCSE Arrearage
Black 60.8 % 53.5 % White 32.0 % 36.6 % Hispanic 1.1 % 1.2 % Native American Asian Unknown 5.8 % 8.4 %
Total 99.7 % a 99.7 %
a
= numbers too small to include in analysis
a
= total not equal to 100% due to rounding
There are no significant differences by race in the percentages among NCPs who made payments within 3 months and 12 months.

Virginia Arrearages Study Page xviii
Race and Employment
Labor Force Participation Rate4 Employ. Rate Unemploy. Rate Total
Black 71.8 % 59.7 % 39.3 % 99.0 % White 75.9 % 49.4 % 48.6 % 98.0 %
Hispanic n/a 40.9 % 57.8 % 98.7 %
Notes: 1. Arrears employment data from July 1999 sample
2. Employed + Unemployed percentages do not total 100% due to rounding
White male earnings (1999) = 30.7% higher than black male earnings.
White female earnings (1999) = 18.1% higher than the black female earnings.
Case Characteristics of NCPs Owing Arrears
NCPs Owing Arrears Only and Current Support Plus Arrears
NCPs’ Arrears Case Total DCSE Arrearage (%)
Arrears Only 27.4 % Current Support plus Arrears 72.6 %
TANF and Non-TANF Composition
Type of Case Total DCSE Caseload, 1999 (%) Arrears Sample, 2000 (%)
Non-TANF Cases 75 % 75.3 % TANF Cases 22 % 23.2 % Other Cases 2 % 1.6 %
Last Order in Case File
Support Order (Type) Number Percent of Total
Consent (OCNT) 40 0.6 % Administrative (OADM) 1,312 20.6 % Court (OCRT) 5,026 78.8 %
TOTAL 6, 378 100.2%
4 “Participation rate” is the percentage of the respective group that is in the labor force.

Virginia Arrearages Study Page xix
Single and Multiple Cases
Cases (#) DCSE Caseload (2000) Arrears Sample (2001) Total Arrears Owed (%)
1 76 % 57.1 % 63.4 % 2 18 % 24.2 % 21.6 % 3 5 % 10.9 % 9.5 % 4 + 1 % 7.3 % 5.1 %
For the 2-year period July 1999 to July 2001, NCPs with one arrears case – 54.2% of NCPs owing arrears – were over-represented in the following categories:
Amount of Arrears Owed NCPs with Single Case (%)
$10,000 – 19,999 56.6 % 20,000 – 29,999 64.7 % 30,000 + 68.6 %
For the 2-year period July 1999 to July 2001, NCPs with multiple arrears cases – 39.7% of NCPs owing arrears – were over-represented in the following categories:
Arrears Owed NCPs with Multiple Cases Owing (%)
$1,000 – 4,999 47.4 % 5,000 – 9,999 47.0 %
Compared to NCPs owing arrears on a single case, NCPs with multiple cases are under-represented in the higher and over-represented in the lower categories of arrears owed. (Note: The “missing” 6.1% of cases equals % of cases closed between 7-99 and 7-01.)
Cases/Arrears Sample Payment Made in 12 Months (%)
1 72.4 % 2 69.8 % 3 61.4 %
4 55.4 % 5 + 43.2 %
Notes: All percentages are significantly different. NCPs with multiple arrears cases also made
smaller payments than NCPs with single arrears cases.
Arrears Balances
Amount of Arrears Percent of Arrears Cases Total Arrears Owed (%)
$1 – 4,999 48.0 % 8.6 % 5,000 – 19,999 37.0 % 39.4 % 20,000 + 15.0 % 52.0 %

Virginia Arrearages Study Page xx
There is a significant inverse relationship between arrears balances and the percentage of NCPs who make a payment within 12 months: As the size of the arrears balance increases, the frequency of payments decreases.
Arrears Only Compared to Current Support Plus Arrears
The percentage of NCPs who owe Current Support plus Arrears and make a payment within 12 months decreases as the arrears balance increases.
Compared to NCPs with Arrears Only cases, significantly larger percentages of NCPs with Current Support plus Arrears cases make a payment within 12 months, for all dollar categories of arrears.
Payments Made in Arrears Cases: Virginia Compared to U.S.
From July 2000 to July 2001, 69 percent of Virginia NCPs who owed arrears made a payment (vs. 54 percent of NCPs nationwide).
Payments Made: Interstate vs. In-State Cases
As a group, a significantly larger percentage of NCPs with interstate cases (71.1%) made a payment within 12 months than did NCPs with in-state cases (68.3%).
The mean payment amount for payments made in 12 months in interstate and in-state cases was $269 and $219, respectively.
TANF vs. Non-TANF
Case Type Percent of Arrears Cases Percent of Total Arrears
TANF-Related : (TANF, TANF Arrears, 24.2 % 19.5 % Foster Care)
Non-TANF Related: (Non-TANF, Non-TANF 74.7 % 79.8 %
Arrears, Medicaid Assistance-Full)
Other (Medicaid Assistance-Partial, Medical
Support Only, Non-IV-D, State & Local
Foster Care) 1.1 % 0.8 %
TOTAL 100.0 % 100.1 %

Virginia Arrearages Study Page xxi
As would be expected, a significantly larger percentage of NCPs owing Non-TANF-related debt made a payment within 12 months than did NCPs owing TANF-related debt.
The mean amount of payments made within 12 months is larger for NCPs owing Non- TANF-related debt with one exception: NCPs with Non-TANF Arrears Only cases.
Interest and Total Debt
As NCPs transition from owing Current Support plus Arrears to owing Arrears Only, interest as a percent of total arrears increases. (Note: All data from Table 34 & rounded.)
Arrears Case Interest as a Percent of Total Arrears:
1999 2001 Change
Current Support + Arrears 21.3 % 28.2 % + 6.9 % Arrears Only 26.4 % 35.5 % + 9.1 %
Arrears Case Total Arrears Owed (‘99-‘01) Interest on Arrears (‘99-‘01)
Current Support + Arrears + $2.0 mil. (4.1%) + $3.9 mil. (37.9 %) Arrears Only – $2.6 mil. (–16.0 %) + $0.55 mil. (13.0 %)
Mean Amount of Debt Owed, 1999 and 2001
The mean amount of NCP debt for 1999 and 2001 was $9,879 and $11,850, respectively.
Effect of Fees
There is no evidence that the assignment of fees to arrears cases increases the difficulty in collecting payments on arrears. The mean amount of fees for All Arrears cases in the sample was $13 and $17 for 1999 and 2001, respectively.
Effect of Interest on NCP Debt
Charging interest on arrears substantially adds to NCPs’ mean debt – and this, despite a 20.0 percent decline in NCPs owing arrears (1999 – 2001). (Note: Data from Tables 27-28.)
Year Interest / Total Arrears (%) Total Arrears ($) Interest Owed ($)
1999 22.6 % $64,742,897 $14,639,321
2001 29.7 % $64,286,095 (–0.7 %) $19,099,254 (+30.5 %)

Virginia Arrearages Study Page xxii
Enforcement Methods
Enforcement Actions and Single/Multiple Cases
The percent probability that an arrears amount is reduced within 12 months using four selected enforcement methods is higher for NCPs with one case than for NCPs with two or more cases. This probability is highest with the use of FIDM (33.9%), followed by income withholding (30.7%), court action (27.8%), and liens (22.8%).
Use of Liens
Regardless of the amount of arrears owed, liens are not used in more than 16.4 percent of NCPs’ cases.
Income Withholding
The percentage of NCPs subject to income withholding ranges from 37.5 percent to 56.0 percent, regardless of the amount of arrears owed.
Enforcement Methods: Non-TANF/TANF Case Status
Following implementation of each of the four enforcement methods, the probability of a reduction in arrears amount is higher for Non-TANF cases than for TANF cases.
For both TANF and Non-TANF cases, FIDM is used least frequently (4.7% and 3.3%, respectively), even though the probability of a reduction in arrears is highest with a FIDM enforcement action.
Income withholding produces the second highest probability of a reduction in arrears for both TANF and Non-TANF cases (19.2% and 28.8%, respectively).
Effects of Selected Enforcement Methods: NCP Employment Status
For both employed and unemployed NCPs, the probability of a reduction in arrears is highest following FIDM actions. However, FIDM actions are used to enforce only 3.6 percent of cases with arrears.
The probability of a reduction in arrears is second highest using income withholding. With income withholding, however, there is a difference of only 3.7 percentage points in the probability of debt reduction in 12 months for unemployed and employed NCPs.

Virginia Arrearages Study Page xxiii
Use of Selected Enforcement Methods: NCPs’ Employment Status
Income withholding is used 50 percent more frequently with employed NCPs (60.9%) than with unemployed (likely recently employed) NCPs (40.6%). For court actions, the percentage use for employed and unemployed NCPs is 18.4 and 15.4 percent, respectively. For liens, the percentages are 13.8 and 12.2 percent, respectively. Finally, for FIDM, the percentages are 4.0 and 3.1 percent, respectively.
District Office Use of Enforcement Methods
Among the District Offices, there are significant differences in the percentage of arrears cases in which the four enforcement methods are used. From smallest to largest, they are:
o Income withholding – the percentage difference in use is smallest. There is a 1.8 times difference, ranging from 37.1 to 65.1 percent use on arrears cases.
o Court enforcement – the percentage ranges from 4.4 to 28.9 percent of cases, a 6.6 times difference. o FIDM – there is a 9-fold difference. Percentage use ranges from a low of 1.1 percent to a high of 10.0 percent of cases. o Liens – at 12.6 times, the largest percentage differential in use. Percentage of use ranges from 2.2 to 27.7 percent.
***
Virginia Arrearages Study Page 1
Introduction
This multi-year research study examined a large sample of child support cases with arrears in the Commonwealth of Virginia. The project studied various aspects of these cases including the demographics and characteristics of noncustodial parents, trends in arrears amounts, selected enforcement methods and payment frequencies, and, then, recommended changes to the Division of Child Support Enforcement (DCSE) to promote the payment of arrears and reduce their accumulation, individually and in the aggregate.
Background
Nationally, child support arrears are estimated at $88 billion.1 This amount, which is growing yearly, consists of monies owed by noncustodial parents (NCPs) to their children and/or to states to reimburse expenditures made to support the NCPs’ children. State child support enforcement agencies have case file information on individual NCPs who have arrears. Yet, little aggregate information is known about the population, and subpopulations, of NCPs who owe arrears, such as their age, number of children to whom they owe support, average amount of arrears, number of arrears cases, and payment history.
To manage the collection of arrears more effectively, there must be more understanding about relationships such as the relationship between the arrears on a case and the amount of the support order; or the relationship between the frequency of payments for Current Support plus Arrears cases and Arrears Only cases and the size of accumulated arrears on these cases; or the relationships between variables such as age, gender, race, and employment status and the frequency of payments; also, the payment amounts. Finally, there must be more understanding about which enforcement tools and techniques are useful (less and more) in motivating NCP payments and lowering one’s arrears, and under what circumstances.
Causes of Arrears
The causes of arrears are neither immediately evident nor clearly understood. The obvious primary cause for arrears is the failure of the NCP to pay current child support payments as required. Arrears occur in each month a payment is either missed or less than the full amount owed is paid. Furthermore, the debt increases as interest is charged to unpaid arrears balances. Two general theories relating to the NCP’s failure to make timely payments, on both current support and arrears, are the NCP’s ability to pay and motivation to pay. Various assumptions related to these theories are obvious and consequently not thoroughly understood and researched.
1 Heller, Sherri Z., Child Support Enforcement FY 2001 Data Preview Report, Office of Child Support
Enforcement, September 2002, p. 3.

Virginia Arrearages Study Page 2
While the NCP’s failure to make payments is the primary cause of arrears, other factors such as state laws, state child support enforcement agency policies and practices, and the cooperation of employers and custodial parents are very important in preventing and reducing arrearages. Assumptions about these factors are neither clearly defined nor understood.
Arrears Model
Exhibit 1 below depicts the major primary and contributory causes of arrears.
Exhibit 1: Primary and Contributory Causes of Child Support Arrears
PRIMARY (Noncustodial Parent) CONTRIBUTORY (Others)
UNABLE TO PAY UNMOTIVATED TO PAY
State laws State agency policies and practices Retroactive orders Assignment of fees Insufficient personnel Antiquated systems Not using all available
enforcement tools Interest/interest rate Uncooperative CP Uncooperative employer
Order too high Income imputed Order not modified Uncooperative NCP Insufficient income Living expenses too high Multiple support orders Supporting another family Other (e.g., medical bills) IncarceratedUnemployed Sick/disabled Unqualified for work Personal characteristics Inadequate training/educationPoor work history Elderly/frail Youth Discouraged from job searching Other Personal problems Substance abuse Legal Gambling Other personal problems Job discrimination Race Sex
Recalcitrant Anger at mother “Not my child” “Not my responsibility” No contact with child Retroactive support Fee charges Large arrears balance
Virginia Arrearages Study Page 3
Contributory Causes
A number of reasons contribute to the NCP’s accumulation of arrears, but are not considered the primary causes of arrears. The following contributory causes are discussed below:
State laws
State agency policies and practices
Custodial parent non-cooperation
Employer non-cooperation.
State Laws and Agency Enforcement Policies
State laws and agency enforcement policies contribute to arrears, for example, by disallowing the forgiveness of arrears and interest that accumulate while NCPs are incarcerated. Some NCPs are either unaware that arrears and interest are accumulating on unpaid debt or do not realize the amount of the accumulations because they do not receive periodic bills of the debt owed. Other state laws and policies that contribute to arrears include the use of default orders, particularly for low-income NCPs, and state budgetary constraints that result in understaffing of state child support enforcement agencies.
As shown in Exhibit 1, several causes contributing to arrears are either directly or indirectly attributed to the state child support enforcement agency’s actions or inactions. For example, an agency may contribute to an arrearage by adding expenses and fees associated with birthing costs and legal services to an NCP’s obligation. These expenses and fees may be incurred before the order is established, but can be retroactively assigned to the NCP at the time of establishment. The Commonwealth of Virginia charges NCPs for:
Fees incident to the case
Temporary Assistance to Needy Families (TANF), Medicaid and other expenses paid by the Commonwealth even if prior to establishment of a child support order
Foster care expenses paid by the Commonwealth
If arrears do occur, the amount may be increased due to interest charged on the unpaid balance. Eventually, even if the NCP is making an effort to reduce his/her obligation, this interest amount can significantly add to an arrearage. The Commonwealth of Virginia charges nine percent annual interest on unpaid arrears.*
______
* The legislature reduced the state judgment (i.e., interest) rate to six percent, effective July 2004. This change
occurred after the period of the study.

Virginia Arrearages Study Page 4
Custodial Parent
Some types of cases, such as those in which public assistance payments are not involved (Non-Temporary Assistance to Families or Non-TANF), require the custodial parent (CP) to inform the agency if the NCP is not making payments as required. If the CP waits until the NCP gets significantly behind in his/her support payments, the arrearage may become large and more difficult to collect.
Employers
Employers may contribute to arrears by not withholding monies from an NCP’s paycheck and making remittances as legally required pursuant to an income-withholding order. Then, too, some employers withhold but do not remit the monies. Still other employers may terminate an NCP’s employment after receiving an income-withholding order. While these actions are not legal, they do occur.
Primary Causes (Noncustodial Parent)
The direct, or primary, causes of arrears accumulation can be attributed to the NCP. The following primary causes are discussed below:
Inability to pay
Lack of motivation to pay o Recalcitranceo Being overwhelmed.
Inability to Pay
As shown in Exhibit 1, an NCP’s ability to pay child support and avoid incurring arrears is a function of one or more variables, such as a steady paycheck that is sufficient to make payments and still cover the NCP’s living expenses. Excessive orders, that is, orders that are too high relative to the NCP’s income or other resources, may cause arrears to occur. Sometimes an NCP’s actions unwittingly add to the accrual of arrears. For example, an NCP’s failure to cooperate with support enforcement personnel in identifying his/her monthly income can result in the entry of estimated (imputed) income higher than actual income, which in turn can lead to an unreasonably high child support order. If the NCP’s income is not enough to pay the ordered child support, an arrearage will then accrue. In other situations, the NCP’s income may decline but the child support order may not be modified to reduce the amount owed, and an arrearage will then accrue. Still other reasons for NCPs’ inability to pay child support include having excessive personal expenses, such as paying for medical bills, and supporting other children.

Virginia Arrearages Study Page 5
Incarcerated NCPs do not have the ability to earn sufficient funds to make timely payments and thus arrears occur and accumulate as interest is charged to the debt. NCPs who are unemployed may also be unable to make timely payments or otherwise avoid the accumulation of arrears. Among the reasons for unemployment are sickness, disability, and inadequate personal qualifications like poor job skills or a sporadic employment history. NCPs may also be unemployable due to personal problems like drug abuse or mental incapacities.
NCPs may have difficulty securing and maintaining a job due to employer discrimination. This discrimination may be based upon the NCP’s age, gender or race. Age discrimination may be due to the NCP being either young or elderly. The U.S. Department of Labor classifies the youth labor force as individuals aged 16 to 24 who are either employed or unemployed but actively seeking work. Individuals who are 65 and over are considered to be in the senior age group of the labor force. Both groups have difficulty securing employment. Youth are not readily employed because they typically lack experience or job skills. Older workers, on the other hand, sometimes suffer the consequences of discrimination based on age. For example, in Fiscal Year 2001, the U.S. Equal Employment Opportunity Commission (EEOC) received 17,405 charges from persons aged 40 and over, alleging employment discrimination.2
Female NCPs may be unable to pay current support and thus incur arrears since they have a reduced presence in the labor force compared to men. In Virginia in 2000, 75.6 percent of men were in the labor force and 73.8 percent of them were employed. In the same year, 61.3 percent of women were in the labor force and 60 percent of them were employed.3 In addition to the reduced presence of women in the labor force, those who are employed or seeking employment may experience discrimination at work. In fiscal year 2001, the EEOC received 25,140 charges alleging discrimination based on gender. Women filed virtually all of these charges. Women who are employed typically are paid less than men. In 1999, the median pay of women who were employed full time was 76.5 percent of men’s pay.4
Race may also be a factor in the ability of NCPs to make timely current support payments. For example, while the labor force participation rate in Virginia in 2000 was higher for black men compared to white men (71.8 percent and 68.1 percent, respectively), black men experienced a significantly higher rate of unemployment compared to white men (4.9 percent and 1.7 percent, respectively). In addition, white males’ earnings were significantly higher than black males’ earnings. In 1999, white males’ earnings were 30.7 percent greater than black males’ earnings.5 The differential based on race also occurs among females, although to a lesser extent. In 1999, white females’ earnings were 18.1 percent higher than earnings of black females.
2 EEOC, Charge Statistics FY 1992 through FY 2002. 3 Bureau of Labor Statistics, Employment status of the civilian non-institutional population by sex, age, race, and
Hispanic origin, 2000 annual averages.4 Bureau of Labor Statistics, Highlights of Women’s Earnings in 1999, May 2000, p. 1. 5 Ibid.

Virginia Arrearages Study Page 6
Lack of Motivation to Pay
Two major causes affecting an NCP’s motivation to pay current child support are a recalcitrance to pay support and being overwhelmed by the financial obligation.
Recalcitrance
Some causes of recalcitrance are general anger toward the child support process, objections to the amount of the support order, denial of paternity, complaints about not being permitted to see the child and anger toward the child’s mother. The state of Colorado conducted an experimental study that included an analysis of the behaviors of NCPs during a conference with the researchers.6 The relative frequencies of exhibited behaviors are shown in Table 1. The researchers did not correlate the extent of recalcitrance with the frequency of non-payment. The extent to which recalcitrance contributes to an NCP’s failure to pay current support and thus incur arrears is not known, but presumably it is a significant cause.
Being Overwhelmed
Another major reason for a lack of motivation to pay is that the NCP feels overwhelmed by the financial responsibility of support obligations given his/her income and employment potential. As noted above, arrears may occur before either paternity or a child support order is established. For example, an NCP may discover that once paternity is established he or she is obliged to pay for the child’s living expenses incurred prior to establishing a support order. Obviously, the length of this prior period and the expenses incurred during the period affect the NCP’s arrears obligations. Responsibility for payment of medical expenses that may have occurred prior to paternity establishment, such as birthing costs and reimbursement of state Medicaid expenses, may be imposed on the NCP.7 As noted above, some states charge the NCP for fees and legal expenses associated with his/her case. Furthermore, if interest is charged on arrears balances, the total debt may continue to rise unless payments exceed the amount of the interest being charged. The total sum of these financial obligations may cause the NCP to feel the arrears debt is beyond his/her ability to pay and, consequently, adversely affect his/her motivation to pay. The extent to which these factors affect an NCP’s motivation to pay is unknown.
6 Pearson, Jessica, Lanae Davis, and Nancy Thoennes, Dropping Debt: An Evaluation of Colorado’s Debt and
Retroactive Child Support Initiative, April 30, 2001, p. 8. 7 Latus, Justin. “Child Support Arrears,” Washington MEMO, American Public Human Services Association
(June 2001), Volume 13, No. 3, p. 3.

Virginia Arrearages Study Page 7
Table 1: Noncustodial Parents’ Behavior during Support Negotiation Conference
NCP Expressed/Exhibited the Behavior: NCP’s Behavior
Yes No
Expressed anger about the child support system
19.7% 80.3%
Objected to the debt amount 32.8 67.2
Objected to the retroactive support order 22.2 77.8
Denied being the father of the child 1.6 98.4
Accused the mother of the child of fraud 7.9 92.1
Complained about not getting to see the child 32.3 67.7
Expressed anger toward the mother of the child 21.9 78.1
Source: Pearson, Jessica, Lanae Davis, and Nancy Thoennes, Dropping Debt: An Evaluation of Colorado’s
Debt and Retroactive Child Support Initiative, April 30, 2001, p. 8.

Virginia Arrearages Study Page 8
Hypotheses
The presumed causes for the occurrence of arrears among NCPs provide a convenient base from which to develop the following hypotheses:
Hypothesis 1: Charging fees on arrears cases (e.g., for intercepting tax returns) increases the difficulty in collecting payments.
Hypothesis 2: Charging interest on arrears balances is an effective strategy for the Commonwealth and CPs to motivate the NCPs to pay.
Hypothesis 3: Large arrears balances result from large support order amounts.
Hypothesis 4: NCPs who owe arrears are either young or elderly.
Hypothesis 5: Proportionately, female NCPs owe more arrears than male NCPs.
Hypothesis 6: Race is a factor in NCPs being unable to pay current support and, thus, incurring arrears.
Hypothesis 7: Proportionately, NCPs who have multiple support orders owe more arrears than NCPs who have single support orders.
Hypothesis 8: NCPs who have large arrears amounts are less likely to pay current support and arrears.
Hypothesis 9: Large arrears balances dissuade NCPs from making payments.
Other Assumptions
To reward state performance in child support collections, a federal incentive system involving payments was developed.8 One of the five performance incentives is intended to stimulate state efforts to increase the collection of arrears. A paramount issue is whether the arrears incentive will spur increased effort by states to collect arrears.9 Also, due to the complex nature and magnitude of the problem, there is some question whether the collection of arrears is
8 Among the five performance indicators that are used to calculate federal incentive payments to states is
performance in collecting arrears. This indicator is calculated by dividing the number of cases in which some
arrearage is collected during a fiscal year by the total number of cases in which arrears are owed. To receive the
highest incentive payment, this quotient must equal 80 percent. 9 Latus, Justin, op. cit., p. 3.
Virginia Arrearages Study Page 9
beyond the states’ capacity and resources to control.10 These two issues are the basis for an additional two hypotheses:
Hypothesis 10: Basing federal incentive payments on state performance in collecting arrears is a realistic strategy.11
Hypothesis 11: The accrual of arrears is often due to factors beyond states’ control.
The results of this project will provide information to analyze these hypotheses and a number of related propositions. Appendix 1 contains a listing of propositions (including these 11 hypotheses) that address subjects relevant to arrears prevention and reduction, and includes a crosswalk to the section of the report in which the hypothesis/proposition is presented and analyzed. The propositions are based upon the primary and contributory causes of arrears displayed in Exhibit 1.
10 Ibid.11 Ibid.

Virginia Arrearages Study Page 10
Need for Research
To address the need for further information on the demographic and case characteristics of NCPs who owe arrears and to examine the effectiveness of collection tools, the federal Office of Child Support Enforcement funded a research project by the Commonwealth of Virginia to investigate these areas:
Study Commonwealth of Virginia and Federal laws and policies that are perceived to impede the collection of child support (see pages 11-14) ;
Conduct a literature review of research on arrears prevention and reduction (see page 14
and Appendices 2 and 3, for a summary);
Conduct focus groups of selected employees of the Division of Child Support Enforcement (DCSE), Commonwealth of Virginia to define effective and ineffective child support enforcement methods and identify new remedies worth experimentation (see page 15 and Appendix 5, for recommendations);
Investigate and analyze key demographic variables of NCPs who owe arrears (see pages
15-38);
Identify and analyze case characteristics in a sample of NCPs who owe arrears (see pages
38-67); and,
Determine the effectiveness of selected enforcement techniques in the payment history of a sample of NCPs who owe arrears12 (see pages 67-79).
12 Initially, this phase of the research involved using a point-in-time methodology involving pre-testing and post-
testing of outcome criteria after selected interventions (best tools and techniques) were applied in selected DCSE
District Offices. This research methodology was changed to the one noted due to several problems, including
unavoidable technical problems in data access through APECS (DCSE’s client database system) and potential
problems from multiple treatment effects caused by using various enforcement methods in lieu of only one. To
complete this phase of the study, direct access to client data files was required since much of the information
necessary to complete the task was not available on the monthly CD-ROMs provided to the researchers.

Virginia Arrearages Study Page 11
Research Findings
In this section, the findings from the different phases of the research project are presented in the following order:
1. Legal Constraints to Collecting Arrears 2. Arrears Management Literature Review 3. Focus Groups 4. Demographic Descriptions of NCPs Owing Arrears 5. Case Characteristics of NCPs Owing Arrears 6. Analysis of Selected Enforcement Methods.
These findings are then applied to the hypotheses drawn at the outset of the project, to determine whether or not the hypotheses were supported. They are also applied to the propositions developed from the variables inherent in the demographic and case characteristics affecting arrears, to determine whether the data support the propositions or not. A summary of the project’s findings and recommendations for improvements to Virginia’s collection and prevention of arrears follows.
Legal Constraints to Collecting Arrears
Virginia has established a child support enforcement system, based upon sound, strict enforcement remedies, policies and procedures. The following observations suggest ways to enhance Virginia’s strong child support program by removing or altering the federal and state legal constraints that were found in the legal review.
Size of Support Debt
When child support is established for a child born outside of marriage, Virginia law directs that the obligation be effective on the date the case was initiated (as set forth below in Code of
Virginia § 20-108.1), and permits requiring the father to pay birthing expenses and/or reimburse Medicaid expenses incurred on behalf of the child.13 This is the case for TANF debt only. Correspondingly, when a child support order is established for a child born during the marriage, the obligation is set to begin the date the support action was initiated14 and Virginia may seek full reimbursement for any TANF or Medicaid benefits paid by the Commonwealth on behalf of the child.15
13 Code of Virginia §§ 20-49.8, 63.2-1903, and 20-108.1.14 Code of Virginia § 20-108.1 (2001); Gifford v. Dunkum, Nos. 0122-95-2, 0123-95-2 (Ct. of Appeals, Feb. 13,
1996).15 Code of Virginia § 63.2-1908.

Virginia Arrearages Study Page 12
The child support obligation is calculated in accord with the Virginia Child Support Guidelines16, unless the court finds that application of the guidelines would be unjust orinappropriate in a particular case.17 Furthermore, the parent’s obligation to reimburse the state for public welfare benefits is limited to the amount of his/her child support obligation. This statutory scheme ameliorates one concern often expressed by commentators: that obligors default, in part, because they are overwhelmed by a sizeable support debt.18 There are reasonable limits on the noncustodial parent’s debt provided there is not an undue delay serving the respondent with notice of the court action or the DCSE administrative support order.19
Age of the Debt
Virginia’s 10-year statute of limitation on judgments has only a minimal impact upon child support debt collection because accrued support arrears are not subject to the statute of limitation of the Code of Virginia § 8.01-251, until the amount of that arrearage is judicially determined and a money judgment is entered. 20
Although child support debts generally become more difficult to collect over time, the common law of Virginia provides that neither laches nor equitable estoppel bars enforcement of child support arrears, when “without legal excuse one does not comply with a lawful decree, requiring him to pay support monies.”21
Interest
Virginia law requires interest to accrue “on all support payments collected by the Department.”22 While the accrual of interest on child support may serve as an incentive for an obligor to pay down his/her debt, it also adds to the size of the arrears.
16 Code of Virginia § 20-108.2.17 Code of Virginia § 20-108.1(B). 18 See, e.g., David. L. Chambers, Fathers, the Welfare System, and the Virtues and Perils of Child Support
Enforcement, 81 Va. L. Rev. 2575 (1995). 19 Under current policies, it can easily take close to a year to establish paternity and an initial support order in a
contested case, if there are no appeals. See 22 Virginia Administrative Code (V.A.C.) §§ 40-880-160 (requiring the
department to access all appropriate location resources within 75 days of application or referral), 40-880-170
(requiring the department to arrange for voluntary blood testing or file a petition for paternity establishment within
90 days of locating the putative parent) and 40-880-190 (requiring the department to establish a child support
obligation or diligently attempt to complete service of process to commence an action for child support within 90
days after the absent parent is located or paternity is established). See, also, DCSE Program Manual, Chapter 15-4. 20 See Woodward v. Greenberg, No. 0560-92-1, 1993 Va. App. LEXIS 307 (Va. Ct. App. Aug. 3, 1993); Carter v
Hall, 42 Va. Cir. 437 (Va. Cir. Ct. 1997); Arthur v. Commonwealth, No. 1762-98-3, 1999 Va. App. LEXIS 62 (Va.
Ct. App. Feb. 2, 1999).21 Arthur v. Commonwealth, No. 1762-98-3, 1999 Va. App. LEXIS 62 (Va. Ct. App. Feb. 2, 1999), citing
Richardson v. Moore, 217 Va. 422, 423-34, 229 S.E.2d 864, 866 (1976) and Martin v. Bales, 7 Va. App. 141, 146-
47, 371 S.E.2d 823, 826 (1988).
22 Code of Virginia § 63.2-1952.

Virginia Arrearages Study Page 13
However, the collection of interest on child support arrears affords the payee some equity when it comes to the array of creditors to whom the obligor is making payments. It also helps to compensate the payee if he or she finds it necessary to take out other loans or to pay interest on household debts when child support is not forthcoming.
Given the policy issues inherent in the accrual and collection of interest, further study may be warranted to determine if any changes to current policy should be made.
Assignment of Rights and Distribution
If a debt is owed to the Commonwealth due to the receipt of public assistance, the Department must apply amounts collected for past due support toward this debt, unless the court order directs otherwise.23 The result, when combined with the application of the federal child support distribution rules24, is a disbursement of child support to the state, rather than to the TANF family. Some commentators assert that when child support goes to the government, rather than to families, obligor parents are sometimes “driven into the underground economy and avoid paying formal support.”25 Research from Wisconsin also indicates that when child support isdisbursed directly to the family, some fathers are more likely to pay support.26
A number of experts find the current child support distribution rules to be excessively complicated and burdensome to implement.27 Some observers feel that the implementation of complex rules such as these add to state IV-D agencies’ computer systems delays and costs, potentially hindering the states’ ability to efficiently implement automated enforcement remedies. In response to these concerns, the U.S. Congress is considering various options for restructuring the child support distribution requirements, including simplifying the rules contained under 42 USC 657.28
Enforcement Remedies
23 22 V.A.C. 40-880-60. 24 42 U.S.C.S. § 657. 25 See CLASP publication, Reauthorization Issues: Child Support Distribution -- Getting More Child Support to
Children, February 2002. 26 Ibid.27 See, e.g. Vicki Turetsky, What If All the Money Came Home?, 5 Pub. Int. L. Rep. 13, Loyola University School
of Law (Spring 2000). 28 See, e.g. S. 916, Children First Child Support Reform Act of 2001; S. 918, Child Support Distribution Act of
2001; S. 685, Strengthening Working Families Act of 2001; H.R. 1471, Child Support Distribution Act of 2001; S.
2524, Work and Family Act of 2002; H.R. 3625, Next Step in Reforming Welfare Act; S. 940 and H.R. 1990,
Leave No Child Behind Act of 2001; and H.R. 4737, Personal Responsibility, Work, and Family Promotion Act of
2002 (passed by House May 16, 2002).
Virginia Arrearages Study Page 14
Income Withholding
Prevention is the key. Unless there is a finding of good cause, immediate withholding of
earnings in all cases reduces the likelihood and amount of accumulated arrears. Current federal and state regulations permit the parties to agree to an alternate arrangement.
Limitations on Withholding
22 V.A.C. 40-880-200(D) provides that the monthly amount of past due support collected will be $65.00 or 25 percent of the current obligation, whichever is greater, and shall not exceed that amount under the federal Consumer Credit Protection Act.29 In cases where the obligor is subject to a current child support obligation, the specified amounts may be very close to the federal ceilings.
Arrears Management Literature Review
Part of this research involved an extensive review of literature either directly or indirectly addressing various aspects of arrears. Appendix 2 contains a summary of the literature that was studied. The two major parts of the literature address prevention and reduction of arrears. Research in preventing arrears is categorized into setting realistic support orders, providing and coordinating support/relief programs for NCPs, and swift enforcement of orders. The five topical areas of research focusing on arrears reduction are: aggressive enforcement strategies, amnesty programs and arrears adjustment, policy on interest charged on arrears debt, examining the appropriateness of orders, and case closure review. A brief outline and analysis of the research is contained in Appendix 3.
Appendix 4 contains the results of a national survey conducted as part of this project to determine state practices involving arrears, particularly large arrears cases. Thirty-three (33) state child support enforcement administrators responded to the survey. Among the principal barriers to the successful collection of arrears identified by these administrators are:
The notification process;
Difficulties in locating NCPs;
Interest charges on debt; and,
Large caseloads handled by enforcement staff.
Focus Groups
29 Under federal law, as much as 65% of an employee’s disposable earnings are subject to garnishment for past due
child support, 15 U.S.C.S. § 1673.

Virginia Arrearages Study Page 15
As part of this research effort, four focus groups were conducted involving child support personnel from the Commonwealth of Virginia. The groups ranged from 8 to 15 participants. Participants included one district manager, supervisors, lead enforcement specialists and enforcement specialists. Most participants were seasoned employees with many years of child support experience. Many excellent ideas were suggested to improve collections and reduce arrears. All participants believed that adequate staffing of child support enforcement is essential to the prevention and collection of arrears. Without sufficient personnel, mistakes are made, in haste, trying to meet the workload, and some necessary work is not accomplished. Other ideas suggested by focus-group participants include:
Decreasing the individual caseworker’s caseload size.
Increasing automation in the use of collection tools and techniques. In the absence of automation, some tools such as liens and driver’s license suspensions require time to implement.
Eliminating or reducing the “due process” notifications for each enforcement remedy.
Appendix 5 contains a summary of ideas proposed by the focus-group participants.
Demographic Characteristics of NCPs in Sample
This phase of the study examined the demographic variables of a random sample of the NCP population. For each demographic variable, a proposition was developed to explain assumed outcomes. Data from the study sample were then analyzed to determine if they supported or refuted the proposition. The demographic variables examined included the NCP’s age, gender, employment status, and race. This descriptive information was obtained from a randomly selected sample of NCPs who owed arrears in July 1999.
The Sample
In July 1999, out of a total caseload of 422,371 cases, DCSE had 182,564 non-Central Office cases (or 43.2 percent) with arrears.30 A case was considered to be in arrears if thearrears status code on DCSE’s Automated Program to Enforce Child Support (APECS) system caseload extract was set to “Arrears Only” or “Current Support plus Arrears.”
A randomly selected sample of 6,653 cases, representing noncustodial parents with at least one case in arrears, was drawn from this sub-population of arrears cases. The sample had
30 Central Office arrears cases were excluded from the study because they can be processed differently from other
cases. Cases assigned to the Central Office are there, typically, because of special circumstances and, thus, may be
subject to atypical enforcement methods and tools.
Virginia Arrearages Study Page 16
an error rate of approximately 1.2 percent at the 95 percent level of confidence.31 With attrition and normal case closures during the two-year tracking period, sample size had decreased to 5,151 by July 2001.
Some demographic and case characteristics data for the 6,653 subjects in the sample cohort were obtained from monthly extracts of the APECS caseload. Other data, including information on the use of the four enforcement tools studied in the project, were obtained directly from the APECS system.
Age
The age of NCPs who have arrears has not been thoroughly investigated in other studies. For example, little is known about the age distribution of these NCPs, their diligence in paying arrears, or the percentage of total arrears debt owed by various age groups. There are certain assumptions about young NCPs (16 to 24 years of age, inclusive), as follows:
They are not employed to the extent of workers in older age categories.
They are less likely than older workers to be actively seeking work.
Their employment history is sporadic. That is, compared to older workers, they have more episodes of intermittent employment, tend to be employed for shorter periods of time, and change jobs more frequently.
As a result of these and related factors, it can be assumed that younger NCPs are less likely to be diligent in making required child support payments and, thus, incur arrears more frequently. In addition, youth are generally assumed to be less responsible in meeting their obligations, whether for child support or otherwise.
On the other hand, NCPs who are 65 and older may have reduced incomes if they are already retired. If they are actively seeking work, these individuals may experience age discrimination. In either case, these NCPs are less able to make consistent child support payments and, thus, avoid the accumulation of arrears.
These assumptions, if correct, would form a basis for the following proposition that younger and older NCPs have a disproportionate share of arrears.
Proposition 1: NCPs who are either 16 to 24 years old inclusive or 65 and over have a
disproportionate share of arrears.
31 That is to say, in 95 out of 100 samples like the one used in this study, the results found should be no more than
1.2 percentage points above or below the figure that would be obtained by studying the full set of 182,564 arrears
cases.

Virginia Arrearages Study Page 17
Table 2 contains the age categories of NCPs and their respective percent of all cases in the sample that owed arrears in July 2001, which was at the conclusion of the project’s data collection phase. Only eight NCPs were under 25 years of age. At the other extreme, there were only 26 individuals aged 65 and over. Ninety-four percent of the individuals were from 25 to 55 years of age, with the age category of 35 to 44 having the largest percentage (47 percent) of the arrears cases. For 1.6 percent of the individuals in the sample, the case records did not contain the NCP’s age.
In sum, neither those classified by the U.S. Department of Labor as in the youth labor force (16 to 24, inclusive) nor those in the senior age categories in the labor force (65 and over), represent a significant portion of NCPs who owe arrears. NCPs in these two groups represent less than one percent (1%) of such individuals. Contrast this to 94.2 percent of the arrears-owing NCPs who are in the “near prime” or “prime” employment age groups of 25 through 54, as defined by the U.S. Bureau of Labor Statistics. This evidence does not support the proposition that younger and older NCPs owe a disproportionately higher share of arrears.

Vir
gin
ia A
rrea
rag
e S
tud
y
Pa
ge
18
Ta
ble
2:
Arr
ears
Ca
selo
ad
, P
aym
ent
Fre
qu
ency
, a
nd
NC
P’s
Ag
e, J
uly
20
01
NC
Ps
Arr
ears
% M
akin
g a
Pay
men
t W
ith
in*
:$
Mea
n P
aym
ent
Am
ou
nt
Age
No
.%
of
To
tal
$ A
mo
un
t %
of
To
tal
3 M
os.
1
2 M
os.
3
Mo
s.
12
Mo
s.
Un
der
18
1
6
,54
11
00
.0
10
0.0
$
57
1
$3
85
18
- 2
4
7
0.1
2
9,7
53
4
2.9
7
1.4
$
17
8
$1
13
25
– 3
4
1,3
63
2
5.1
1
1,0
38
,89
3
17
.2
56
.6
68
.9
$2
35
$
22
0
35
– 4
4
2,5
87
4
7.7
3
1,5
08
,99
8
49
.0
59
.1
72
.0
$2
49
$
23
4
45
– 5
4
1,1
61
2
1.4
1
7,3
42
,14
3
27
.0
56
.4
67
.3
$2
58
$
24
7
55
– 6
4
19
1
3.5
2
,77
4,7
56
4
.3
42
.4
51
.3
$2
95
$
26
5
65
& o
ver
2
6
0.5
2
33
,86
2
0.4
5
3.9
5
3.8
$
22
5
$1
82
Un
kn
ow
n
88
1
.6
1,3
40
,26
3
2.1
4
5.5
5
1.1
$
17
3
$1
86
To
tal
5,4
24
1
00
.0
64
,27
5,2
08
1
00
.0
57
.0
69
.0
$2
48
$
23
3
*
p
erce
nt
mak
ing
a p
aym
ent
wit
hin
bo
th 3
mo
nth
s an
d 1
2 m
on
ths
is d
epen
den
t u
po
n t
he
NC
P’s
ag
e an
d s
ign
ific
ant
at t
he
0.0
5 l
evel
=
less
th
an 0
.1 p
erce
nt

Virginia Arrearages Study Page 19
Age and Payment Frequency
The civilian non-institutional labor force consists of those persons 16 and older who are employed or unemployed yet actively sought work in the four weeks preceding the government survey that determines the area’s employment situation.32
As shown in Table 3, with the exception of the age category 45 to 54 years, the unemployment rate declines for each age category from 16 to 19 years through 55 to 64 years, inclusive. Since having a job would be an important requisite for making timely child support payments, it might be assumed there is a relationship between an NCP’s age and the frequency of payments made within a 12-month period. In addition, one might also assume that as NCPs became older, they might be more financially responsible, which would be evident in the increasing likelihood of child support payments. The following proposition is based on this assumption:
Proposition 2: For NCPs who owe arrears, there is a positive correlation between age and
frequency of making child support payments.
This proposition was tested by correlating NCPs’ ages in the sample cohort with the frequency of payments made over a 12-month period. If the proposition was correct, the correlation would be positive, that is, as the NCP’s age increases, the frequency of making a payment within 12 months also increases. Contrary to expectations, the relationship is slightly negative (-0.03): As the NCP’s age increases, the frequency of making child support payments declines. This relationship is statistically significant.33 These results do not support Proposition 2.
32 U.S. Bureau of Labor Statistics, Employment Situation Summary (May 3, 2002). 33 significant at the 0.05 level

Virginia Arrearages Study Page 20
Table 3: Employment Status of Commonwealth of Virginia Civilian Non-Institutional
Population Compared with NCPs Owing Child Support Arrears by Gender, Age, Race,
and Hispanic Origin, 2000
Virginia Population VirginiaLabor Force**
NCPs Who Owe ArrearsJuly 1999
Group
ParticipationRate*
%Employed
%Unemployed
%Employed
%Unemployed
Gender
Men, total 75.6 73.8 2.3 55.7 43.0
Women, total 61.3 60.0 2.1 53.3 42.9
Race
White, men 75.9 74.5 1.8 49.4 48.6
Black, men 71.8 68.2 4.9 59.7 39.3
Hispanic Origin, both sexes3
78.0 75.2 3.6 40.9 57.8
Age
16 to 19 years, both sexes***
50.4 46.5 7.7 n/a n/a
20 to 24 years, men 87.3 82.6 5.4 62.5 37.5
25 to 34 years, men 95.0 92.5 2.7 58.5 39.8
35 to 44 years, men 94.4 93.2 1.4 58.3 40.6
45 to 54 years, men 91.2 89.6 1.7 51.6 47.2
55 to 64 years, men 68.8 68.1 1.0 43.4 54.0
65 and over, men****17.5 16.9 3.4 46.2 48.7
Age Unknown n/a n/a n/a 39.7 57.4
* ”participation rate” is the percentage of the respective group that is in the labor force (see defin. above for “labor force”) ** consists of those persons in the Virginia civilian non-institutional labor force, 16 and older, who are either employed or
unemployed yet actively sought work in the four weeks preceding the government survey, which determines the area’s
employment situation. *** data available for both sexes only **** national percentages; data for ages 65 and over are not available at state level.
Source of Virginia labor force data: U.S. Bureau of Labor Statistics, Employment status of the civilian non-institutional
population by sex, age, race, and Hispanic origin, 2000 annual averages.

Virginia Arrearages Study Page 21
Gender
Gender Composition of NCPs with Arrears
As noted earlier, since female NCPs (compared to male NCPs) have a reduced presence in the labor force, they may be less able to pay current support and, thus, more likely to incur arrears. Table 3 shows that in Virginia in 2000, 75.6 percent of men were in the labor force, and 73.8 percent of them were employed. In the same year, 61.3 percent of women were in the labor force, and 60 percent of them were employed.34 Also shown in Table 3, 55.7 percent of male NCPs who owed arrears were employed, compared to 53.3 percent of female NCPs.
In addition to the reduced presence of women in the labor force, those who are either employed or seeking employment often experience discrimination at work. As noted previously, in Fiscal Year 2001, the Equal Employment Opportunity Commission (EEOC) received 25,140 charges alleging discrimination based on gender.35 In the same year, the EEOC received 1,251 charges of pay discrimination filed under the Equal Pay Act.36 Women filed virtually all of these charges. In addition, historically, women are typically paid less than men. For example, in 1999, the median pay of women who were employed full-time was 76.5 percent of men’s pay.37
In sum, compared to men, women would be expected to have a reduced ability to pay current support and, thus, be more likely to incur arrears, due to a combination of their reduced presence in the labor force, job discrimination, and lower earnings. This proposition summarizes what might be expected from the effect of these facts:
Proposition 3: Compared to male NCPs, female NCPs who pay child support are
proportionately over-represented in arrears cases.
Table 4 shows the gender composition of NCPs who owe child support and the portion of those NCPs who owe arrears. Eighty-eight percent of the NCPs in the Commonwealth are male and 12 percent are female.38 Using the same ratio, it would be assumed that males and females, respectively, would represent 88 percent and 12 percent of the NCPs who owe arrears. However, as shown in the table, 92.6 percent of the NCPs who owe arrears are male and 7.4 percent are female. Proposition 3 is not supported, based on the information in Table 4.
34 U.S. Bureau of Labor Statistics, Employment status of the civilian non-institutional population by sex, age, race,
and Hispanic origin, 2000 annual averages.35 EEOC, Charge Statistics FY 1992 through FY 2001.36 Ibid.37 U.S. Bureau of Labor Statistics, Highlights of Women’s Earnings in 1999, May 2000, p. 1. 38 Joint Legislative Audit and Review Commission of the Virginia General Assembly, op. cit., p. 16.

Virginia Arrearages Study Page 22
Table 4: NCP’s Gender, 1999
Gender % of NCPs % of NCPs Owing Arrears
Female 12% 7.4%
Male 88% 92.6%
Total 100% 100%
Source: Joint Legislative Audit and Review Commission of the Virginia General Assembly, Final Report: Child
Support Enforcement, November 2000, p. 16.
NCP Gender and Support Amount
As noted above, the median pay of women who were employed full time was 76.5 percent of men’s pay. Since support order amounts are typically set using criteria like income, it would be assumed that compared to male NCPs, female NCPs support amounts would be less. This assumption is the basis for Proposition 4.
Proposition 4: Female NCPs’ ordered obligations are less than those of male NCPs.
Proposition 4 was analyzed by calculating the mean order amount for both males and females. The monthly mean order amount for female NCPs was $142 and for male NCPs, $220. Consistent with Proposition 4, ordered obligations for female NCPs are less than for male NCPs.
NCP Gender and Payment Amount/Frequency
One might assume that although female NCPs are proportionately under-represented among those NCPs who owe arrears, most likely their payment history would not compare favorably with male counterparts who owe arrears. More specifically, due to the facts noted above, such as reduced presence in the job market and employment discrimination, it could be assumed that compared to men, female NCPs would make payments less frequently and the payment amounts would be less. Female NCPs’ payment amounts would be expected to be less since their mean order amounts are smaller. These assumptions form the basis for the following propositions:
Proposition 5: Compared to male NCPs, a smaller percentage of female NCPs make payments.
Proposition 6: Compared to male NCPs, female NCPs make smaller payments.

Virginia Arrearages Study Page 23
The validity of Propositions 5 and 6 was tested using data on the frequency and amount of payments for males and females within 3- and 12-month periods in 2001. The data are shown in Table 5. Consistent with Proposition 5, female NCPs’ frequency of payments for the 3- and 12-month periods was less. Also consistent with Proposition 6, female NCPs’ mean payment amounts for both periods were smaller. All differences are statistically significant.
Table 5: Arrears and Frequency/Mean Payment by Gender
NCPs Arrears % Making a Payment Within:
$ Mean Payment AmountGender
No. % of Total
$ Amount % of Total
3 Mos. 12 Mos. 3 Mos. 12 Mos.
Females 490 7.4% $3,900,664 6.0% 44.7% 56.7% $163 $159
Males 6,163 92.6% $60,808,152 94.0% 57.9% 69.9% $252 $237
Total 6,653 100.0% $64,708,815 100.0% 57.0% 69.0% $248 $233
Note: data for NCPs’ gender and arrears amounts from July 1999; payment data from July 2001
Employment Status
Background
Relatively little is known about the employment history of NCPs. Typically, information about NCPs’ employment is estimated since it is difficult to maintain current records. In the course of conducting this research, employment-related information became available from several states. An experimental study conducted in the state of Colorado found that 46.9 percent of the NCP-research subjects had a verified employer when the data were extracted for the project.39 A study of California arrears cases found 61 percent of NCPs had quarterly earnings for the period 1997-99, for which unemployment taxes were withheld.40 The researchers also examined 1998 California wage files and found 59 percent of NCPs owing arrears had income in that year. Income from earnings is a proxy for being employed since NCPs who receive earned income would be employed. Finally, the Virginia Joint Legislative Audit and Review Commission (JLARC) researchers estimated that the employment rate for Virginia’s NCPs was 62 percent.41
Another study, conducted in Minnesota, indicates the difficulty of obtaining employment information. In this 1998 study, researchers determined that income information was available from the state’s automated child support enforcement record system for only 12 percent of the 39 Thoennes, Nancy and Jessica Person, Understanding Child Support Arrears in Colorado: An Empirical Analysis
Based on a Random Sample of Cases with Arrears, March 2001, p. 8. 40 Sorensen, Elaine, op. cit., p. 4.41 Joint Legislative Audit and Review Commission of the Virginia General Assembly, op. cit., p. 15.

Virginia Arrearages Study Page 24
NCP cases examined.42 The information was obtained from quarterly income data that employers filed for unemployment compensation purposes. For the 12 percent of cases in which income data was available, the income levels were quite low. Twenty percent of the NCPs owing arrears had monthly incomes ranging from 0 to $500. An additional 30 percent owing arrears had monthly incomes in the range of $500 to $1,500. Consequently one-half of the NCPs owing arrears had monthly incomes below $1,500. The researchers noted the income was probably understated since NCPs may or may not have been employed in other quarters of the year, or might have been employed in another state, or in the “unofficial economy.” While it is not possible to use these data to calculate the percent of NCPs who are employed, it is probably safe to assume that most of the NCPs with income below $500 a month are unemployed for a good portion of the time each year. Even at $800 a month, a person working 40 hours per week would be paid below the minimum wage of $5.15 an hour.43
Employment status, that is whether an NCP in the sample was either employed or unemployed, was determined from child support enforcement workers’ entries in the data field of the NCP’s case file. NCPs were considered to be employed if the data field designated the NCP as having an employer and no employment end date existed.
Employment Status and Arrears: I
Once a support order is established, an NCP must make timely payments to avoid incurring arrears or debt to the CP and/or the state. Few NCPs have sufficient resources, such as savings accounts, to pay child support on a regular basis. For example, in a study of NCPs owing arrears in California, only 12 percent had funds in financial institutions and the mean balance of the accounts was $192.44 Consequently, to consistently pay a monthly child support obligation, an NCP must be employed and earning an income which is sufficient for the payment of the required support amount. NCPs who are not employed, therefore, could be assumed over time to become deficient in paying support and thus incur arrears. The following proposition is based on the assumption that NCPs who have arrears are unemployed.
Proposition 7: NCPs who owe arrears have a higher rate of unemployment than employment.
As shown in Table 6, 56.4 percent of the NCPs owing arrears are employed. While the rate of unemployment is very high compared to the rate for the U. S. labor force45, most NCPs owing arrears are employed. These data do not support Proposition 7.
42 Hennessey, James and Jane Venohr, Exploring Options: Child Support Arrears Forgiveness and Passthrough of
Payments to Custodial Families, Policy Studies, Inc., February 9, 2000, pp. 28-29. 43 The minimum wage of $5.15 was effective September 1, 1997. 44 Sorensen, Elaine, op. cit., p. 6.45 According to the U.S. Bureau of Labor Statistics, in the past 10 years the unemployment rate among the U. S.
labor force has ranged from 4.0 to 7.5 percent.

Virginia Arrearages Study Page 25
Table 6: Arrears & NCP’s Employment Status, July 1999
Employment Status No. % of NCPs
Employed 3,692 56.4
Unemployed 2,858 43.6
Total 6,550 100%
Employment of All NCPs and NCPs with Arrears
Presumably, being employed is an important criterion in an NCP’s financial ability to make regular child support payments. It is possible to have income but not to be employed, as in the case of NCPs who are retired and collecting Social Security or receiving an annuity from a pension. With these exceptions, an NCP who is employed will have a greater likelihood of making timely and regular support payments and thus avoid incurring arrears. In addition, it could be assumed NCPs who owe arrears for public assistance payments (i.e., TANF) would have a lower rate of employment than those who do not owe public assistance payments (i.e., Non-TANF). The following proposition is based on that assumption:
Proposition 8: NCPs owing arrears have a lower rate of employment than NCPs who do not
owe arrears. Also, the rate of employment is lower for NCPs owing arrears for TANF cases.
Table 7 contains the employment rates for the entire DCSE caseload (which consists of NCPs who owe only Arrears, those who only owe Current Support, and those who owe both Current Support and Arrears) and for NCPs who owe arrears (i.e., those who owe Arrears Only and those who owe Current Support plus Arrears). A more precise test of the proposition would be to compare the employment rates of those who do not owe arrears and those who do. Unfortunately, those data were not available. As shown in Table 7, the employment rate is higher for NCPs comprising DCSE’s entire caseload compared to the portion of the caseload owing arrears. Data in Table 7 also break out the percentage of NCPs owing arrears for Non-TANF and TANF cases.
Proposition 8 is supported based upon the information in Table 7. Undoubtedly, the difference in employment rates is greater between the group of NCPs without arrears and the group with arrears. However, as noted above, employment information is not available to make that comparison.
Table 7: NCP’s Employment Status
% of NCPs Employed Case Type
Entire DCSE Caseload*
Cases With Arrears Only
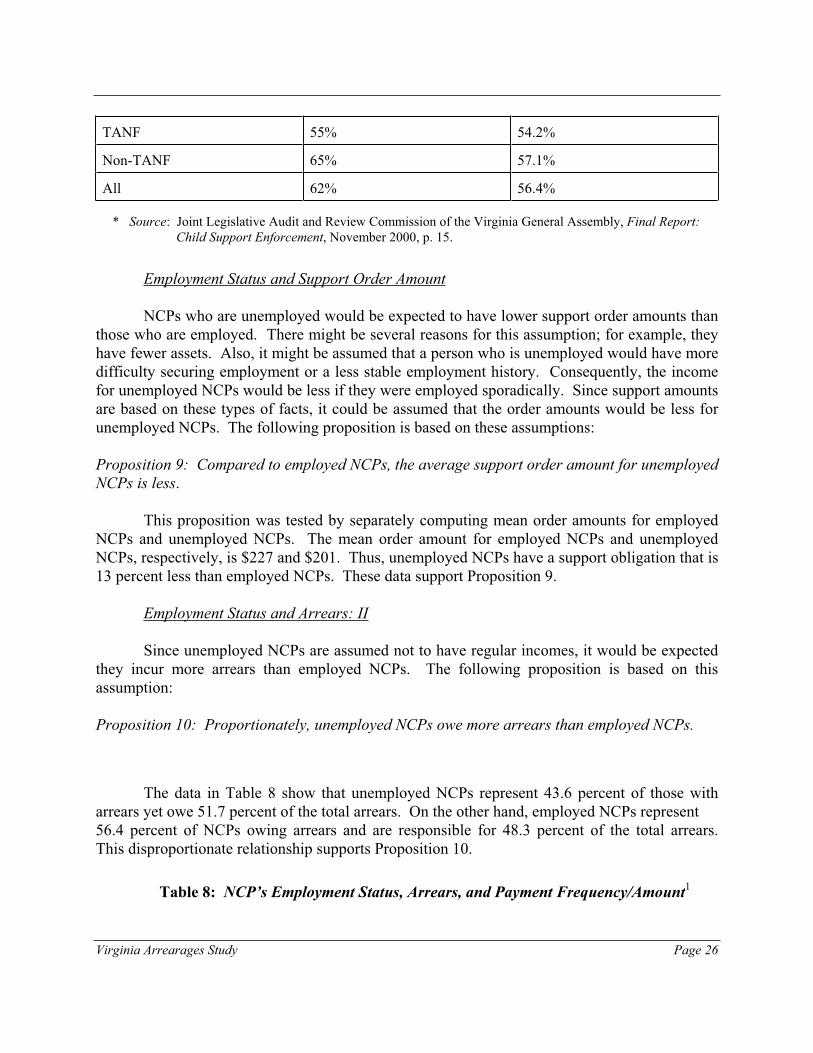
Virginia Arrearages Study Page 26
TANF 55% 54.2%
Non-TANF 65% 57.1%
All 62% 56.4%
* Source: Joint Legislative Audit and Review Commission of the Virginia General Assembly, Final Report:
Child Support Enforcement, November 2000, p. 15.
Employment Status and Support Order Amount
NCPs who are unemployed would be expected to have lower support order amounts than those who are employed. There might be several reasons for this assumption; for example, they have fewer assets. Also, it might be assumed that a person who is unemployed would have more difficulty securing employment or a less stable employment history. Consequently, the income for unemployed NCPs would be less if they were employed sporadically. Since support amounts are based on these types of facts, it could be assumed that the order amounts would be less for unemployed NCPs. The following proposition is based on these assumptions:
Proposition 9: Compared to employed NCPs, the average support order amount for unemployed
NCPs is less.
This proposition was tested by separately computing mean order amounts for employed NCPs and unemployed NCPs. The mean order amount for employed NCPs and unemployed NCPs, respectively, is $227 and $201. Thus, unemployed NCPs have a support obligation that is 13 percent less than employed NCPs. These data support Proposition 9.
Employment Status and Arrears: II
Since unemployed NCPs are assumed not to have regular incomes, it would be expected they incur more arrears than employed NCPs. The following proposition is based on this assumption:
Proposition 10: Proportionately, unemployed NCPs owe more arrears than employed NCPs.
The data in Table 8 show that unemployed NCPs represent 43.6 percent of those with arrears yet owe 51.7 percent of the total arrears. On the other hand, employed NCPs represent 56.4 percent of NCPs owing arrears and are responsible for 48.3 percent of the total arrears. This disproportionate relationship supports Proposition 10.
Table 8: NCP’s Employment Status, Arrears, and Payment Frequency/Amount1
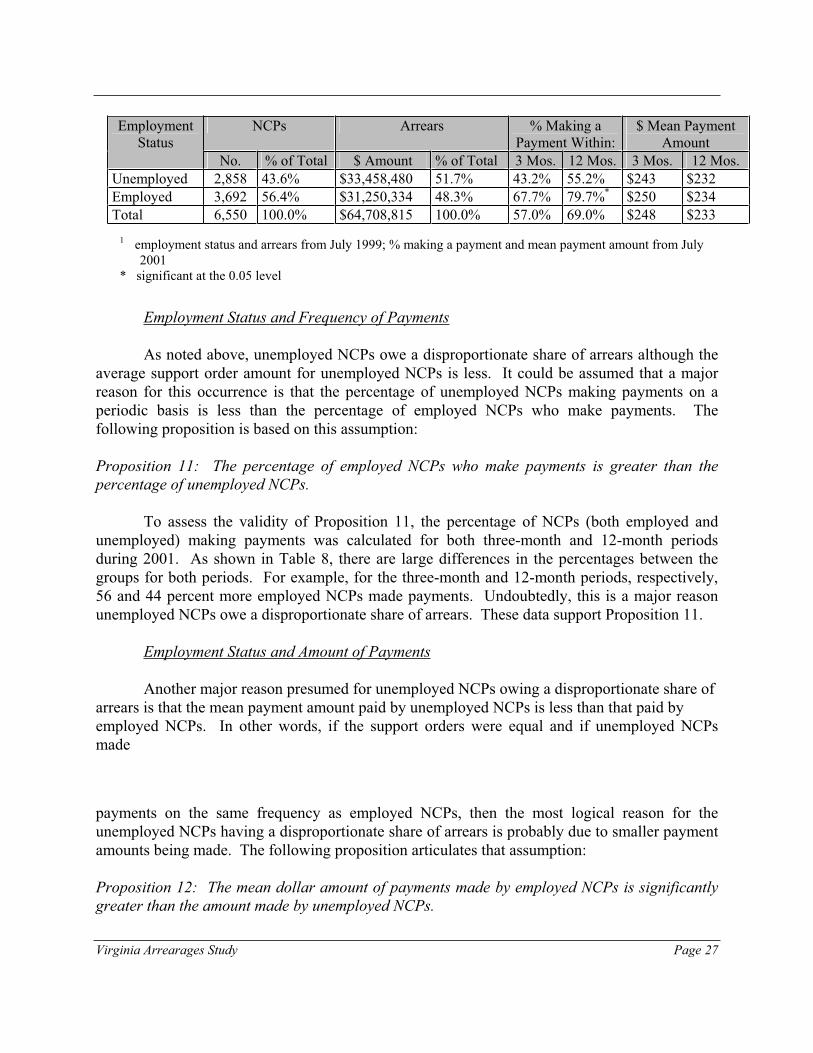
Virginia Arrearages Study Page 27
NCPs Arrears % Making a Payment Within:
$ Mean Payment Amount
Employment Status
No. % of Total $ Amount % of Total 3 Mos. 12 Mos. 3 Mos. 12 Mos.
Unemployed 2,858 43.6% $33,458,480 51.7% 43.2% 55.2% $243 $232
Employed 3,692 56.4% $31,250,334 48.3% 67.7% 79.7%* $250 $234
Total 6,550 100.0% $64,708,815 100.0% 57.0% 69.0% $248 $233
1 employment status and arrears from July 1999; % making a payment and mean payment amount from July
2001
* significant at the 0.05 level
Employment Status and Frequency of Payments
As noted above, unemployed NCPs owe a disproportionate share of arrears although the average support order amount for unemployed NCPs is less. It could be assumed that a major reason for this occurrence is that the percentage of unemployed NCPs making payments on a periodic basis is less than the percentage of employed NCPs who make payments. The following proposition is based on this assumption:
Proposition 11: The percentage of employed NCPs who make payments is greater than the
percentage of unemployed NCPs.
To assess the validity of Proposition 11, the percentage of NCPs (both employed and unemployed) making payments was calculated for both three-month and 12-month periods during 2001. As shown in Table 8, there are large differences in the percentages between the groups for both periods. For example, for the three-month and 12-month periods, respectively, 56 and 44 percent more employed NCPs made payments. Undoubtedly, this is a major reason unemployed NCPs owe a disproportionate share of arrears. These data support Proposition 11.
Employment Status and Amount of Payments
Another major reason presumed for unemployed NCPs owing a disproportionate share of arrears is that the mean payment amount paid by unemployed NCPs is less than that paid by employed NCPs. In other words, if the support orders were equal and if unemployed NCPs made
payments on the same frequency as employed NCPs, then the most logical reason for the unemployed NCPs having a disproportionate share of arrears is probably due to smaller payment amounts being made. The following proposition articulates that assumption:
Proposition 12: The mean dollar amount of payments made by employed NCPs is significantly
greater than the amount made by unemployed NCPs.

Virginia Arrearages Study Page 28
Proposition 12 was tested by computing the mean payment amounts made by both groups of NCPs during the 3-month and 12-month intervals in 2001, as noted above. As shown in Table 8, the mean payment amounts for the two groups are similar. The percentage differences for average payments in the 3-month and 12-month periods, respectively, are 2.8 percent and less than one percent. The differences are not statistically significant. These data do not support Proposition 12.
Employment Status and Payment Frequency by Arrears Categories
Propositions 11 and 12, respectively, concern assumptions about differences in the frequency and amount of payments for all unemployed and employed NCPs, regardless of the debt amount. Another important perspective is to analyze the payment history of unemployed and employed NCPs by examining the amount of the arrears, particularly large arrears of $10,000 or more. Several assumptions can be made about the ability and motivation to pay as the amount of debt increases for both unemployed and employed NCPs. A large debt could be the product of the support order amount and the frequency and size of payments. Proposition 9 included a discussion of the 13 percent difference in the mean support order amounts between employed and unemployed NCPs. This differential, which may vary depending upon the amount of arrears, would be a factor in explaining differences in the arrears owed by the two groups. Perhaps more importantly, the major cause of the arrears accumulations in the two groups is the frequency of payments. As noted in the discussion of Proposition 11, the difference in the frequency of payments made in the 3- and 12-month intervals was 56 percent and 44 percent, respectively. It can be assumed there is a similar differential in payments made by unemployed and employed NCPs for various categories of debt, particularly those of $10,000 or more. These assumptions form the basis for this proposition:
Proposition 13: The percentage of employed NCPs making payments is greater than the
percentage of unemployed NCPs making payments, and this difference widens as the amount of
debt increases.
To assess the validity of Proposition 13, an approach similar to the one used to test Proposition 11 was implemented. The percentage of NCPs, employed and unemployed, making payments for both 3- and 12-month periods during 2001 was calculated for various levels of
arrears. The results are shown in Table 9. Also, the percentage differences in payment frequencywere computed. For simplicity, only the frequencies in payments made within 12 months and for debt categories over $499 are used in this analysis. The percentage difference in the frequency of payments between unemployed and employed NCPs for arrears of $500 to $999 is 15 percent. The differential widens with each successive increase in debt category, as shown below.

Virginia Arrearages Study Page 29
% Difference in Payments in 12 Months Arrears Category by Employed vs. Unemployed NCPs
$1,000 - $4,999 38% $5,000 - $9,999 46% $10,000 - $19,999 50% $20,000 - $29,999 52% $30,000 and over 60%
The differences are quite large as the size of the debt grows. A statistical test was conducted of the frequency of payments made, and all frequencies were statistically significant except for those made within 12 months for arrears of $500-$999. The data support Proposition 13.
A fundamental question from these results is whether increasing arrears cause NCPs, particularly unemployed NCPs, to diminish their diligence in making regular payments. This question was suggested in Exhibit 1 as a cause adversely affecting an NCP’s motivation to make payments. If so, that is another valid reason for preventing arrears from occurring.
Employment Status and Payment Amount by Arrears Categories
As discussed above, Proposition 12 concerns assumptions about the payment amount of all unemployed and employed NCPs, regardless of the debt amount. As with Proposition 13, important information may be gained by analyzing the payment amounts made by unemployed and employed NCPs who have differing amounts of arrears, particularly those with large arrears of $10,000 or more. The discussion involving Proposition 13 identified significant differences in the frequency of payments as a major cause for escalating arrears balances. Perhaps a contributing factor is the size of the payment. The assumption is that employed NCPs would be more financially able to make larger payments. This proposition is based on that assumption:
Proposition 14: Employed NCPs make larger payments than unemployed NCPs, and this
differential widens as the amount of debt increases.
Proposition 14 was tested using an approach similar to the one used to test Proposition 13. The average amount of payments by employed and unemployed NCPs for both 3-month and
12-month periods during 2001 was calculated for various levels of arrears. For simplicity, only the differences in the amount of payments made within 12 months and for debt categories above $499 are used to analyze Proposition 14.
Table 9: Payments Made & NCP’s Employment Status, 2001
% Making a Payment Within: Mean Payment Amount: Amount of Arrears
3 Months 12 Months 3 Months 12 Months

Virginia Arrearages Study Page 30
Unemp Emp. Unemp.
Emp. Unemp Emp. Unemp. Emp.
$1 - $99 83% 92% 83%* 93% $355* $249 $320* $254
$100 - $499 67%* 83% 77%* 89% $241 $246 $252 $251
$500 - $999 64%* 76% 72% 82% $225 $221 $211 $244
$1,000 - $4,999 46%* 67% 60%* 82% $220 $216 $198 $197
$5,000 - $9,999 39%* 59% 52%* 75% $218 $252 $248 $228
$10,000 - $19,999 36%* 61% 51%* 75% $250 $268 $203 $230
$20,000 - $29,999 37%* 59% 49%* 73% $221 $226 $225 $221
$30,000 and over 30%* 50% 41%* 63% $292 $375 $286 $309
Total 43%* 68% 55%* 80% $243 $250 $232 $234
* significant at the 0.05 level
The mean payments for the two groups are shown in Table 9. There is no clear pattern to the amount of payments in relation to the size of the debt for either group. For both groups, the smallest payment amount is generally for arrears of $1,000 to $4,999. In addition, there is no consistent pattern in the differences between the two groups in mean payment amounts made within 12 months. Unemployed NCPs made larger payment amounts in five of the categories, and employed NCPs made larger payments in three categories. Except for the $1-$99 category, none of the differences was statistically significant. Based on these data, Proposition 14 is not supported.
Race
The race of NCPs owing arrears is examined from several perspectives, including employment participation, rate of employment, percentage of arrears debt owed, number of cases,mean support order amount and frequency and dollar amount of payments. As discussed earlier in this report, an NCP’s race may be a factor in the ability to make timely current support payments and, thus, avoid incurring arrears. For example, while the labor force participation rate in Virginia in 2000 was higher for white men compared to black men (75.9 percent and 71.8 percent, respectively), black men experienced a significantly higher rate of unemployment compared to white men (4.9 percent and 1.8 percent, respectively). In addition, white male earnings are significantly greater than black male earnings. In 1999, white males’ earnings were 30.7 percent greater than black males’ earnings.46 The differential based on race also occurs among females, although smaller. In 1999, white females’ earnings were 18.1 percent higher
46 U.S. Bureau of Labor Statistics, op. cit.

Virginia Arrearages Study Page 31
than earnings of black females.
Race and Employment Status
As discussed earlier, labor force participation rate is the percentage of a population or a segment of it that is in the labor force. The labor force consists of those individuals who are employed plus those who are unemployed and actively sought work within the four-week period preceding the period in which they were surveyed. Labor force participation is important since being employed is a fundamental requisite for being financially capable of making child support payments.
As noted above, white males in Virginia have a greater rate of labor force participation, compared to blacks, and their rate of unemployment is lower. Consequently, it would be assumed that black NCPs owing arrears have a higher rate of unemployment than NCPs who are white or of Hispanic origin (Asians and Native Americans were omitted from this analysis since they represent less than one percent of the NCPs owing arrears). The following proposition articulates the assumption relating race to rate of employment:
Proposition 15: In the Virginia labor force, both white and Hispanic-origin NCPs have higher
rates of employment than black NCPs.
Table 3 shows the employment rates for the three major racial groups of NCPs. The employment rates differ substantially among the three groups. Black NCPs have the highest employment rate at 59.7 percent, followed by white NCPs at 49.4 percent. NCPs of Hispanic origin have the lowest rate of employment at 40.8 percent. These data do not support Proposition 15 that white and Hispanic NCPs have higher rates of employment than black NCPs.
Race of All NCPs and NCPs Owing Arrears
As discussed in Proposition 15, black NCPs have the highest rate of employment among the three major racial groups representing NCPs. Consequently, it could be assumed the percentage of black NCPs owing arrears is smaller than the percentage of black NCPs who pay child support. Similarly, the percentages of Hispanic and white NCPs owing arrears would be larger than the respective percentages for both groups who pay child support. The following proposition is based on this assumption:
Proposition 16: Compared to NCPs in other racial groups, the percentage of black NCPs owing
arrears is less than the percentage of black NCPs who pay child support.
Table 10 shows a comparison of the racial composition of all NCPs and those who owe arrears. White NCPs constitute 35 percent of all NCPs paying support but represent a somewhat smaller percentage of NCPs who owe arrears. The percentages for Hispanic NCPs paying child support and owing debt are 4 percent and 1 percent, respectively. Black NCPs represent 53 percent of all NCPs owing support but represent a somewhat larger (61 percent) group of NCPs

Virginia Arrearages Study Page 32
who owe arrears. These data do not support Proposition 16 since black NCPs are over-represented among those who owe arrears, and white and Hispanic-origin NCPs are under-represented.
Table 10: Racial Status: All NCPs and NCPs Owing Arrears
Race All NCPs* NCPs owing Arrears**
Native American n/a Less than 1 percent
Asian n/a Less than 1 percent
Black 53% 61%
Hispanic 4% 1%
White 35% 32%
Unknown 8% 6%
Total 100% 100%
* Source of 2000 data: Joint Legislative Audit and Review Commission of the Virginia General Assembly,
Final Report: Child Support, November 2000, p. 16.
** Source of 1999 data: data JLARC requested and DCSE supplied for JLARC study
n/a = not available
NCP Race and Support Order Amount
In the accumulation of arrears, the support order amount is important, along with other factors such as frequency of payments made and the number of child support cases. Other things being equal, such as the NCP’s capacity and motivation to make support payments, higher support order amounts would be assumed as a cause of arrears accumulation. Since black NCPs represent a disproportionately larger portion of cases with arrears relative to their percentage of all child support cases, it could be assumed their average support order amount would be larger than the amount for either white or Hispanic-origin NCPs. That assumption is expressed in this proposition:
Proposition 17: The mean support order amount for black NCPs owing arrears is larger than
that for white and Hispanic-origin NCPs owing arrears.
The data to assess this proposition were obtained by categorizing the NCPs by race and calculating the mean support order amounts for each racial category. Here are the results:
Racial Group Support Order Amount (Mean)
Black $195 Native American $201

Virginia Arrearages Study Page 33
White $254 Unknown $256 Hispanic origin $267 Asian $285
Black NCPs have the lowest support order amount, and Asian NCPs have the highest. White NCPs have the third lowest order amount, followed by Hispanic-origin NCPs. Based on these data, Proposition 17 is not supported.
NCP Race and Number of Cases
As noted in the discussion above, among the important factors in the accumulation of arrears are the support order amount and the number of cases for which an NCP is responsible. NCPs of Hispanic origin have the second highest mean support amount of NCPs in the five racial groups. However, NCPs of Hispanic origin have the lowest representation of cases with arrears relative to their percentage of the total number of child support cases. This group of NCPs has 4 percent of all child support cases yet represents only 1 percent of cases with arrears. Apparently, the mean support order amount is not the cause of this disproportionately low percentage of arrears owed. It could be assumed, therefore, that the cause may be due to the fact that this group of NCPs is primarily obligated to pay support for only one case. This assumption is expressed in the following proposition:
Proposition 18: Compared to NCPs in other racial groups, NCPs of Hispanic origin have the
highest percentage of NCPs with only one case and the lowest percentage with more than one
case.
To analyze this proposition, the data were categorized by race and number of cases. A percentage distribution of the number of arrears cases for NCPs in each racial group was calculated next. The results are shown in Table 11. Each NCP in the sample was in arrears in at least one case, but not necessarily in all cases for which he/she was paying child support. For example, as shown in Table 11, 60.1 percent of white NCPs have only one case for which they are paying child support. Another 16.1 percent of these NCPs have two cases, 4.7 percent have three cases, 2.4 percent have four cases, and 0.3 percent have five or more cases.
Table 11 also shows the percentage of cases closed between 1999, when the original sample was selected, and 2001, when the collection of data was completed. Of the NCPs in the three largest racial groups (black, Hispanic and white), NCPs of Hispanic origin had the largest percentage of closed cases (19.7 percent), followed by white NCPs (16.5 percent). Black NCPs had the lowest percentage of cases closed, with 7.6 percent.
Multiple-case information is also shown in Table 11. There are large differences in the percentages of multiple cases for NCPs in the three largest racial groups. Somewhat more than 11 percent of arrears cases involving NCPs of Hispanic origin were multiple cases. For black NCPs, 46.7 percent of their arrears cases involved more than one case. White NCPs were the

Virginia Arrearages Study Page 34
second highest racial group here, with 23.5 percent having more than one case. This information helps explain why black NCPs have the highest rate of employment and the lowest mean support amount, yet they are over-represented in the percentage of NCPs with arrears: Black NCPs have more multiple cases than other racial groups.
With respect to Proposition 18, 69 percent of Hispanic-origin NCPs in arrears have only one arrears case. This percentage is slightly exceeded by the 70.6 percent of Asian NCPs with only one case. For white and black NCPs, the percentages with only one arrears case are 60.1 and 45.7, respectively. Finally, although only 1.6 percentage points separate Asian and Hispanic NCPs, Proposition 18 is not supported.

Virginia Arrearages Study Page 35
Table 11: Percent Distribution of Cases by NCP Race
No. of Cases Associated with NCP in the Racial Group Race
0* 1 2 3 4 5 or more
Total**
NativeAmerican
0.0% 66.7% 0.0% 16.7% 16.7% 0.0% 100%
Asian 11.8% 70.6% 17.7% 0.0% 0.0% 0.0% 100%
Black 7.6% 45.7% 25.6% 12.7% 6.2% 2.2% 100%
Hispanic 19.7% 69.0% 9.9% 0.0% 1.4% 0.0% 100%
White 16.5% 60.1% 16.1% 4.7% 2.4% 0.3% 100%
Unknown 29.8% 62.4% 7.3% 0.5% 0.0% 0.0% 100%
Total 11.9% 51.6% 21.3% 9.2% 4.6% 1.4% 100%
* percentage of cases in the original sample closed at the time this analysis was conducted ** may not total 100 percent due to rounding
NCP Race and Percent of Arrears Debt
The amount of an NCP’s arrears is dependent upon factors like employment participation, rate of employment, number of cases for which child support must be paid, mean support order amount, and frequency and amount of payments. The information and discussion for Propositions 15 through 18 present a somewhat mixed picture. Among the three racial groups with the largest portion of arrears cases (i.e., white, black, and Hispanic):
White NCPs have a lower rate of employment than black NCPs but a higher rate than Hispanic NCPs.
Hispanic NCPs have the second highest mean support amount, the second highest percentage of NCPs with one case, and the second lowest percentage of NCPs with more than one case.
Asian NCPs have the largest mean support amount, the largest percentage of NCPs with one case, and the lowest percentage of NCPs with multiple cases.
Black NCPs have the lowest mean support amount, the lowest percentage of NCPs with only one case, and the largest percentage of NCPs with multiple cases.
Finally, white NCPs constitute 35 percent of all NCPs paying support yet represent a somewhat smaller percentage of NCPs who owe arrears (32%). The percentages for Hispanic

Virginia Arrearages Study Page 36
NCPs paying child support and owing debt are 4 percent and 1 percent, respectively. Black NCPs represent 53 percent of all NCPs owing support yet a somewhat larger percent of NCPs who owe arrears (61%).
In sum, among the three racial groups with the largest portion of arrears cases, black NCPs are employed at a greater rate, have the largest share of cases in arrears, have the lowest mean support order amount, have the lowest percentage with only one case, and the largest percentage with more than one case. White NCPs are second in each category. Hispanic NCPs have the lowest employment rate, lowest percentage share of cases in arrears, highest mean support order amount, highest percentage with only one case, and lowest percentage with more than one case.
Black NCPs have responsibility for paying child support for proportionately the largest percentage of multiple cases. This supports the assumption that black NCPs would owe a disproportionately larger portion of the total arrears owed. However, this assumption is somewhat mitigated since black NCPs have the lowest mean support amount and the highest rate of employment, which would suggest a greater ability to pay support and to incur fewer arrears.
To a lesser extent, this assumption would also apply to white NCPs because they have the second highest rate of employment, second largest mean support amount, and the second highest percentage of multiple cases. Since Hispanic NCPs have the lowest employment rate and the highest mean support amount, it might be assumed that they would be less able to pay and would disproportionately owe a larger percentage of debt than either black or white NCPs. This assumption, however, is mitigated by the fact that Hispanic NCPs have the lowest percentage of multiple cases. Given this conflicting information, it could be assumed that each of the three racial groups would have a proportionate share of the total arrears owed. The following proposition is based on this assumption:
Proposition 19: The percentage of total debt owed by NCPs in different racial groups is
proportional to their percentage distribution among NCPs owing arrears debt.
The data to evaluate the proposition are shown in Table 12. Data pertaining to Native American and Asian NCPs involve small numbers, so they are not included in this analysis. NCPs of Hispanic origin owe a very slightly larger percentage of total debt (+ 0.1%) than their percentage representation among NCPs who owe debt. The big differences are between black and white NCPs. Black NCPs represent 60.8 percent of all the NCPs who owe arrears, yet they owe appreciably less of the total debt, 53.5 percent. On the other hand, white NCPs represent 32 percent of NCPs owing arrears and owe 36.6 percent of the total debt. Based on these data, Proposition 19 is not supported.
Table 12: NCP Race, Amount of Arrears, and Payment Frequency/Amount*

Virginia Arrearages Study Page 37
NCPs Arrears % Making a
Payment Within:
$ Mean Payment
Amount
Race
No. % of
Total
$ Amount % of
Total
3 Mos. 12 Mos. 3 Mos. 12 Mos.
NativeAmerican 6 0.1% $59,212 0.1% 50.0% 66.7% $194 $217
Asian 17 0.3% $148,553 0.2% 75.0% 75.0% $337 $317
Black 4,047 60.8% $34,645,593 53.5% 55.8% 68.4% $223 $207
Hispanic 71 1.1% $771,331 1.2% 64.2% 81.1% $362 $294
Unknown 383 5.8% $5,415,713 8.4% 54.2% 65.0% $259 $254
White 2,129 32.0% $23,668,413 36.6% 59.8% 70.6% $290 $282
Total 6,653 100.0% $64,708,815 100.0% 57.0% 69.0% $248 $233
* number of NCPs and arrears amount from July 1999; percent of NCPs making a payment and mean
payment amount from July 2001
NCP Race and Payment Frequency
As noted above, white NCPs owe a larger share of arrears relative to their proportion of NCPs who owe arrears. A possible reason for this disproportionate share of arrears debt is that white NCPs have the second largest mean support order amount and second largest percentage of multiple cases. It could be assumed that, because of these two factors, white NCPs are not making consistent payments, compared to NCPs in the other racial groups, and, therefore, their proportion of total debt is greater. The following proposition is based on this assumption:
Proposition 20: Compared to NCPs in other racial groups, the percentage of white NCPs who
make payments within 3- and 12-month periods is lower.
As shown in Table 12 above, the percentages of Asian and Hispanic NCPs who made payments within both 3 months and 12 months appear somewhat larger than the payment percentages made by NCPs in other racial groups. Contrary to Proposition 20, then, the percentage of white NCPs who made a payment within both 3 months and 12 months was not lower. These data were analyzed using a chi-square statistic. The percentages of NCPs making a payment in both 3 months and 12 months are independent of NCP race, at the 95% level of significance. Proposition 20 is not supported, consequently. There is no significant difference among NCPs in the various racial groups in the percentages who make payments within 3- and 12-month periods.
NCP Race and Amount of Payments
As noted in the discussion involving Propositions 19 and 20, white NCPs owe a proportionately larger share and black NCPs a proportionately smaller share of the total arrears. The frequency of payments made within 3 months and 12 months was statistically similar, as discussed in Proposition 20. Consequently, it could be assumed that white NCPs are incurring a

Virginia Arrearages Study Page 38
disproportionate share of total arrears owed because their average mean payment amounts are less than NCPs in other racial groups. This proposition articulates that assumption:
Proposition 21: White NCPs make smaller mean payments than NCPs in other racial
categories.
Proposition 21 was tested by computing the mean payment amounts made by NCPs in all racial groups during 3- and 12-month intervals in 2001. The results are shown in Table 12. The data in Table 12 support the proposition for Asian and Hispanic NCPs, since their mean payment amounts were greater than those of white NCPs. However, the mean payment amounts made by white NCPs for the two periods were larger than the mean amounts made by Native American and black NCPs. The data do not support Proposition 21.
Case Characteristics of NCPs Owing Arrears
This phase of the research analyzed various characteristics of the cases in arrears, such as type of arrears case, type of support order, number of cases associated with the NCPs, number of cases and amount of arrears, amount of arrears and support order amount, amount of arrears and interest owed, mean balances owed, and payment history.
Type of Arrears Case
As shown in Table 13, 27.4 percent of the arrears cases are Arrears Only, while 72.6 percent are Current Support plus Arrears.
Table 13: Type of Arrears Case, July 1999
Case Type Number of Cases % of Total Cases
Arrears Only 1,825 27.4
Current Support plus Arrears 4,828 72.6
Total 6,653 100%

Virginia Arrearages Study Page 39
Type of Case: TANF Compared to Non-TANF
An important issue in analyzing the case characteristics of NCPs who owe arrears is whether they are TANF or Non-TANF cases. This is relevant for discussion since, as seen in Table 7, the employment rates for NCPs owing arrears are lower in TANF cases than in Non-TANF cases (54.2 percent and 57.1 percent, respectively). Also, as noted in the discussion of Proposition 10, unemployed NCPs who have arrears owe a disproportionately larger share of total arrears. Compared to employed NCPs, a significantly smaller percentage of unemployed NCPs made a payment within 12 months (see Table 9). Since employment rates are lower among NCPs associated with TANF cases, it can be assumed they will represent a larger percentage of the arrears sample. The following proposition expresses this assumption:
Proposition 22: Compared to the distribution of the entire DCSE caseload, NCPs with TANF
cases represent a larger percentage of the arrears sample.
As shown in Table 14, 75 percent of the entire DCSE caseload consists of Non-TANF cases, 22 percent are TANF cases, and the remaining 2 percent are Other.47 The sample of arrears cases has approximately the same percentage distribution: 75.3 percent are Non-TANF, 23.2 percent are TANF, and the remaining 1.6 percent are Other.48 These data do not support the proposition since the distributions in the different types of cases are approximately the same.
Table 14: Non-TANF and TANF: Entire Caseload Compared to Arrears Sample
Case Type Entire DCSE Caseload
(1999 data)*
Arrears Sample (2000 data)
Non-TANF 75% 75.3%
TANF 22% 23.2%
Other 2% 1.6%
Total 100%** 100%**
* Joint Legislative Audit and Review Commission of the Virginia General Assembly, Final Report: Child
Support
Enforcement, November 2000, p. 11. ** total does not equal 100 percent due to rounding
Type of Support Order
47 Joint Legislative Audit and Review Commission of the Virginia General Assembly, op. cit., p. 11. Totals do not
equal 100 percent due to rounding. 48 totals not equal to 100 percent due to rounding
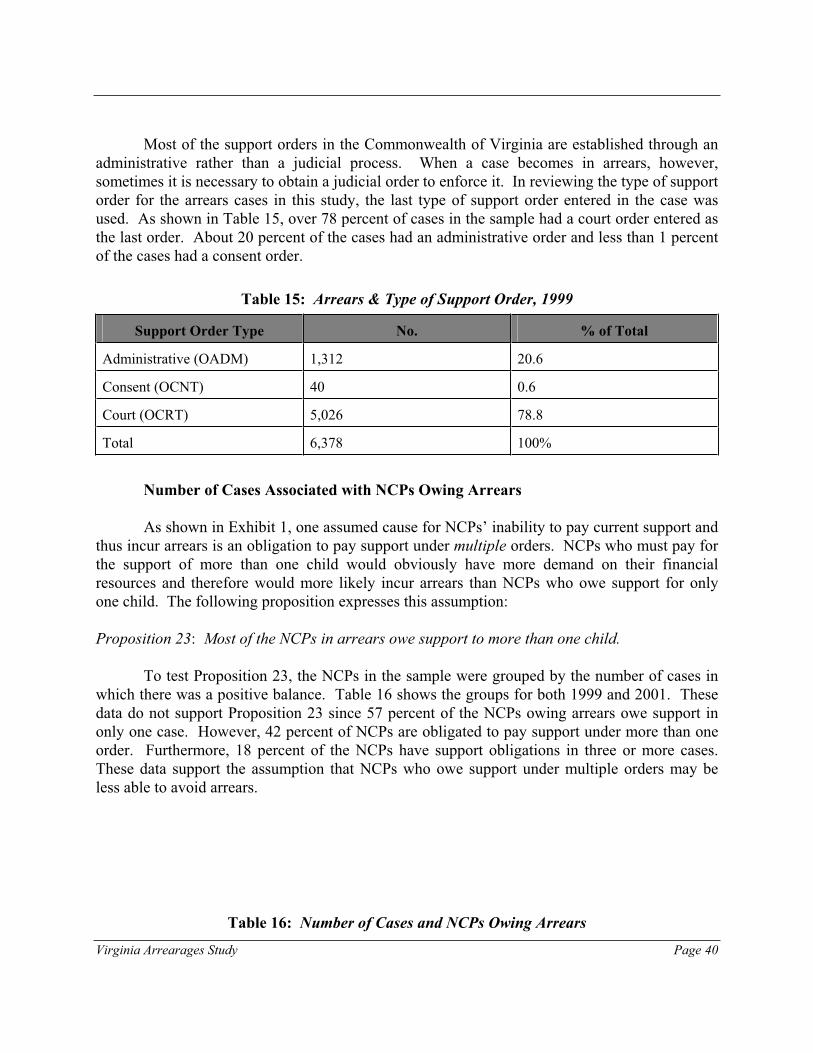
Virginia Arrearages Study Page 40
Most of the support orders in the Commonwealth of Virginia are established through an administrative rather than a judicial process. When a case becomes in arrears, however, sometimes it is necessary to obtain a judicial order to enforce it. In reviewing the type of support order for the arrears cases in this study, the last type of support order entered in the case was used. As shown in Table 15, over 78 percent of cases in the sample had a court order entered as the last order. About 20 percent of the cases had an administrative order and less than 1 percent of the cases had a consent order.
Table 15: Arrears & Type of Support Order, 1999
Support Order Type No. % of Total
Administrative (OADM) 1,312 20.6
Consent (OCNT) 40 0.6
Court (OCRT) 5,026 78.8
Total 6,378 100%
Number of Cases Associated with NCPs Owing Arrears
As shown in Exhibit 1, one assumed cause for NCPs’ inability to pay current support and thus incur arrears is an obligation to pay support under multiple orders. NCPs who must pay for the support of more than one child would obviously have more demand on their financial resources and therefore would more likely incur arrears than NCPs who owe support for only one child. The following proposition expresses this assumption:
Proposition 23: Most of the NCPs in arrears owe support to more than one child.
To test Proposition 23, the NCPs in the sample were grouped by the number of cases in which there was a positive balance. Table 16 shows the groups for both 1999 and 2001. These data do not support Proposition 23 since 57 percent of the NCPs owing arrears owe support in only one case. However, 42 percent of NCPs are obligated to pay support under more than one order. Furthermore, 18 percent of the NCPs have support obligations in three or more cases. These data support the assumption that NCPs who owe support under multiple orders may be less able to avoid arrears.
Table 16: Number of Cases and NCPs Owing Arrears
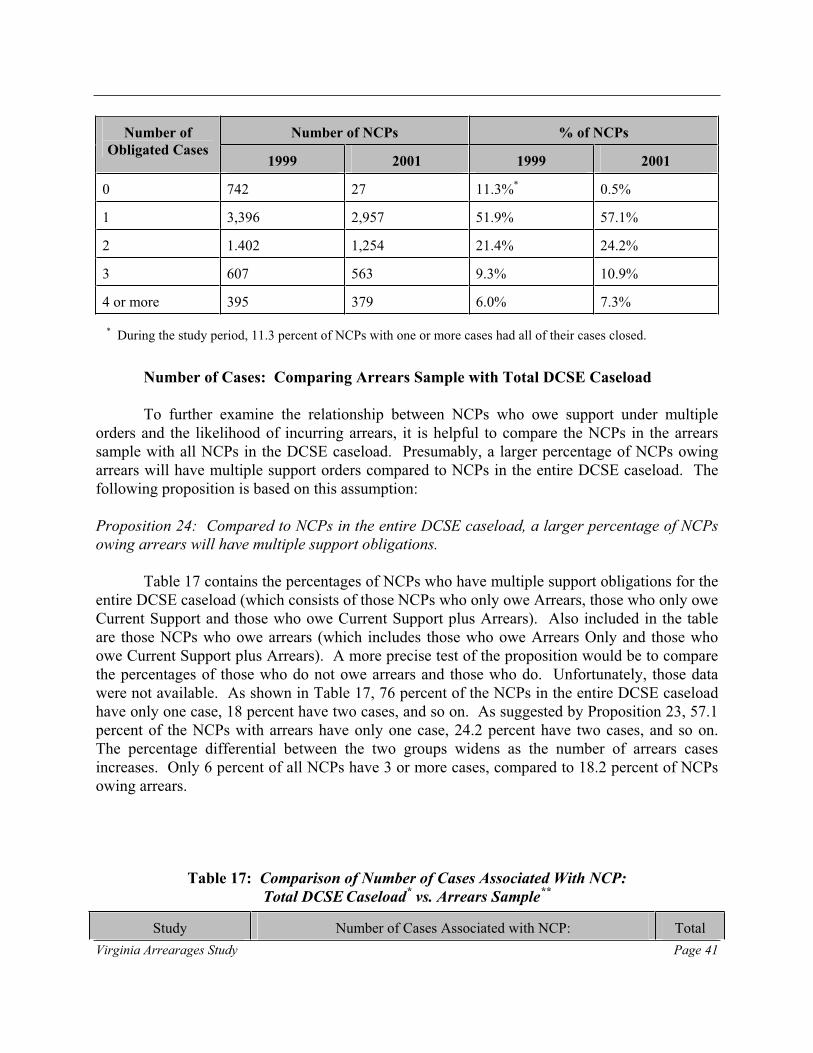
Virginia Arrearages Study Page 41
Number of NCPs % of NCPs Number of
Obligated Cases 1999 2001 1999 2001
0 742 27 11.3%* 0.5%
1 3,396 2,957 51.9% 57.1%
2 1.402 1,254 21.4% 24.2%
3 607 563 9.3% 10.9%
4 or more 395 379 6.0% 7.3%
* During the study period, 11.3 percent of NCPs with one or more cases had all of their cases closed.
Number of Cases: Comparing Arrears Sample with Total DCSE Caseload
To further examine the relationship between NCPs who owe support under multiple orders and the likelihood of incurring arrears, it is helpful to compare the NCPs in the arrears sample with all NCPs in the DCSE caseload. Presumably, a larger percentage of NCPs owing arrears will have multiple support orders compared to NCPs in the entire DCSE caseload. The following proposition is based on this assumption:
Proposition 24: Compared to NCPs in the entire DCSE caseload, a larger percentage of NCPs
owing arrears will have multiple support obligations.
Table 17 contains the percentages of NCPs who have multiple support obligations for the entire DCSE caseload (which consists of those NCPs who only owe Arrears, those who only owe Current Support and those who owe Current Support plus Arrears). Also included in the table are those NCPs who owe arrears (which includes those who owe Arrears Only and those who owe Current Support plus Arrears). A more precise test of the proposition would be to compare the percentages of those who do not owe arrears and those who do. Unfortunately, those data were not available. As shown in Table 17, 76 percent of the NCPs in the entire DCSE caseload have only one case, 18 percent have two cases, and so on. As suggested by Proposition 23, 57.1 percent of the NCPs with arrears have only one case, 24.2 percent have two cases, and so on. The percentage differential between the two groups widens as the number of arrears cases increases. Only 6 percent of all NCPs have 3 or more cases, compared to 18.2 percent of NCPs owing arrears.
Table 17: Comparison of Number of Cases Associated With NCP:
Total DCSE Caseload* vs. Arrears Sample
**
Study Number of Cases Associated with NCP: Total

Virginia Arrearages Study Page 42
0 1 2 3 4 or more
JLARC Study n/a 76% 18% 5% 1% 100%
Arrears Sample 0.5%** 57.1% 24.2% 10.9% 7.3% 100%
* Total DCSE caseload (i.e., the 2000 data used in the JLARC study) includes cases with and without arrears. ** Arrears Sample data are from 2001 and include Arrears Only and Current Support plus Arrears cases. In the
Arrears Sample, 0.5% of cases were closed during the 2-year period of the study.
These data support Proposition 24. Undoubtedly, the differences in the percentages would be greater between the group of NCPs without arrears and the group with them. However, as noted above, the information needed to make that comparison was not available.
Number of Cases and Amount of Arrears
It could be assumed that paying support for multiple cases is related to owing larger arrears. Presumably, it would be financially easier to make payments for only one case than it would for multiple cases. Consequently, there should be a relationship between the number of cases and the amount of arrears owed. NCPs with only one support order would be assumed to represent a smaller percentage of NCPs owing large debts compared to NCPs who have more than one support order. The following proposition expresses this assumption:
Proposition 25: Arrears amounts increase commensurately with the number of support orders.
To test this proposition, the amount of arrears was categorized and related to the number of cases associated with the NCPs. The results are shown in Table 18. The “0” in column 2 means the case in the sample was open when the sample was selected (i.e., in July 1999) yet closed by the time the data were being collected.
The table shows that NCPs with only one case represent a disproportionate percentage of cases with $10,000 and over in arrears. For example, NCPs with a single case represent 54.2 percent of all NCPs in the sample but constitute 56.6 percent of the NCPs owing arrears in the category of $10,000 - $19,999, 64.7 percent of arrears in the $20,000 - $29,999 category, and 68.6 percent of cases with arrears of $30,000 or more. Conversely, the NCPs with two or more cases tend to have a larger percentage of the cases with arrears below $10,000. These facts defy conventional thinking that NCPs with multiple cases are the ones who are accumulating large amounts of arrears. Actually, NCPs who have multiple cases tend to be those who have
Table 18: Number of Cases Associated With NCP & Amount of Arrears*
Number of Cases Associated with NCP: Amount of Arrears
0 1 2 3 4 5 or more

Virginia Arrearages Study Page 43
$1 - $99 11.8% 62.8% 18.9% 3.2% 2.9% 0.4%
$100 - $499 12.7% 58.3% 17.9% 7.4% 2.6% 1.0%
$500 - $999 9.7% 49.9% 22.8% 8.4% 7.9% 1.3%
$1,000 - $4,999 6.3% 46.3% 25.6% 11.9% 7.2% 2.7%
$5,000 - $9,999 3.4% 49.7% 26.6% 12.7% 5.7% 2.0%
$10,000 - $19,999 4.3% 56.6% 22.9% 11.0% 4.0% 1.3%
$20,000 - $29,999 4.1% 64.7% 18.7% 8.0% 3.9% 0.6%
$30,000 and over 5.5% 68.6% 17.1% 5.8% 2.4% 0.7%
Total 6.0% 54.2% 22.9% 10.1% 5.1% 1.6%
* Over entire 2-year sample; contains 24 monthly observations for all NCPs in the sample for total
arrears and number of cases associated with each NCP.
accumulated neither the lowest nor the largest amount of arrears, but rather those who have arrears in the ranges of $1,000 to $4,999 and $5,000 to $9,999. In conclusion, NCPs either at thelower ranges of arrears (less than $1,000) or at the higher ranges ($10,000 or more) are less likely to be associated with multiple cases. These data do not support Proposition 25.
Number of Cases and Percent of Total Arrears Owed
As discussed in Propositions 23 and 24, the responsibility for making child support payments for more than one case would be assumed to test the financial capability of NCPs. All things being equal, such as NCP income and employment stability, it would be assumed that NCPs who have only one child support order would be less likely to accumulate arrears than those who have multiple orders. Consequently, it could be assumed that the percentage of NCPs who have only one support order would represent a smaller corresponding percentage of the total arrears owed. This proposition expresses that assumption:
Proposition 26: NCPs who have only one support order owe a smaller percentage of the total
arrears debt than NCPs who have more than one support order.

Virginia Arrearages Study Page 44
As shown in Table 19, NCPs who have only one case constitute 57.1 percent of the total caseload with arrears. However, the combined arrears of this group constitute 63.4 percent of the total arrears owed. NCPs with two cases represent 24.2 percent of all NCPs in arrears but owe 21.6 percent of the total debt. The same disparity exists for NCPs who have three, four, and five or more cases. Based on these data, Proposition 26 is not supported. In fact, NCPs who have only one support order owe a larger percentage of the total arrears debt than NCPs with more than one support order.
Table 19: Number of Cases, Arrears Amount and Payment History, July 2001
Cases Associated with
NCP
Arrears % Making a
Payment Within:
$ Mean Payment
Amount
No. Cases % of Total $ Amount % of Total 3 Mos. 12 Mos. 3 Mos. 12 Mos.
0 0.5% $310,742 0.5% 45.7%* 48.6%* $291 $185
1 57.1% $40,756,166 63.4% 61.4%* 72.4%* $283 $272
2 24.2% $13,862,662 21.6% 56.9%* 69.8%* $208 $194
3 10.9% $6,074,847 9.5% 46.9%* 61.4%* $173 $151
4 5.5% $2,510,934 3.9% 40.4%* 55.4%* $130 $129
5 or more 1.8% $759,856 1.2% 30.5%* 43.2%* $77 $110
Total 100% $64,275,207 100.0% 57.0% 69.0% $248 $233
* significant at the 0.05 level.
Number of Cases and Payment Frequency
Since NCPs who have only one case have a larger percentage of the total arrears debt than NCPs who have more than one support order, it might be presumed this group does not make payments as frequently as those with multiple support orders and thus would more likely incur arrears. The following proposition expresses this assumption:
Proposition 27: NCPs who have only one case are less likely to make regular support payments
than NCPs who have multiple cases.
To assess this proposition, NCPs were grouped by the number of cases for which they had support obligations. The payment history was then tracked to determine the percentage of NCPsin each group who made any payment in both 3-month and 12-month periods. The results are shown in Table 19. As the number of cases increases, the percentage of NCPs making a payment in 3-month and 12-month periods declines. The percentage of NCPs making a payment is dependent upon the number of cases associated with the NCP, at the 0.05 level of confidence. These data do not support Proposition 27. Compared to NCPs who have only one support order, smaller percentages of NCPs with multiple support orders make payments within both 3 months and 12 months.
Virginia Arrearages Study Page 45
Number of Cases and Payment Amount
Somewhat paradoxically, NCPs with only one case have a larger percentage of the total arrears debt, but they also had a higher rate of making payments within both 3- and 12-month periods than NCPs with multiple support orders. Two plausible reasons for this situation are the amount of the support order is higher for NCPs who have just one case, and the payments being made by this group are smaller, so the debt increases more quickly. The following proposition expresses the latter assumption:
Proposition 28: NCPs with only one case make smaller support payments than NCPs with
multiple cases.
To assess this proposition, NCPs were grouped by the number of cases for which they had support obligations. The average amount of payments made within both 3-month and 12-month periods was calculated for all groups. As shown in Table 19, the average dollar amount of payments for both periods is highest for NCPs with only one case and declines as the number of cases increases. There appears to be an inverse relationship between the number of cases for which support is owed and the payment amount. These data do not support Proposition 28.
Support Amounts and Arrears Accumulations
An assumption about the accumulation of arrears, particularly those that become “sizable” is that large child support obligations tend to result in large arrears. The cause of this situation is that large support orders may not be paid on a timely basis because the NCP is financially unable to make the full monthly payment, due to inadequate income and/or other financial commitments. Another potential cause is that the NCP may view a large support order as unreasonable, particularly if it has been based upon imputed income. An NCP with this perception may be less motivated to make payments on a timely basis, causing arrears to accumulate. The following proposition is based on this assumption:
Proposition 29: Large arrears are related to large order amounts.49
To analyze Proposition 29, the arrears cases were grouped by the amount of debt owed, and the average support order amount for each grouping was computed. As shown in Table 20, contrary to Proposition 29, for arrears below $5,000, the average support order amount declines as the amount of arrears increases. For arrears below $100, the average support order amount is $236. The support order amount continues to decline as the arrears amount reaches $1,000 - $4,999, inclusive. For this group, the average support order amount is $174. Beginning with this level of arrears ($1,000 - $4,999), the average support order amount increases with the amount of
49 Latus, Justin, op. cit., p. 4.

Virginia Arrearages Study Page 46
the debt owed. For debts of $30,000 or more, the average order amount is $391. While these data do not support Proposition 29 for arrears balances below $5,000, they do support it for arrears balances of $5,000 or more.
Table 20: Amount of Arrears and Average Support Order –
Current Support Plus Arrears Cases, July 1999*
Amount of Arrears All
Cases
% of Total
Cases
$ Amount of
Arrears**
% of Total
Arrears
Amount
Average $
Support Order
Amount
$1 - $99 288 4.4 12,102 0.0**** 236
$100 - $499 578 8.9 158,698 0.2 228
$500 - $999 426 6.6 313,205 0.5 216
$1,000 - $4,999 1,821 28.1 5,047,573 7.8 174
$5,000 - $9,999 1,245 19.2 8,937,412 13.8 181
$10,000 - $19,999 1,152 17.8 16,584,008 25.6 219
$20,000 - $29,999 507 7.8 12,427,247 19.2 250
$30,000 and over 466 7.2 21,262,651 32.8 391
Total 6,483 100%*** 64,742,897 100%*** 218
* does not include Arrears Only cases ** includes interest *** may not total 100% due to rounding **** less than 0.1%
Arrears Cases and Arrears Owed
According to federal regulation, all arrears cases are required to receive equal enforcement action to obtain debts owed to the Commonwealth and/or CPs. Support enforcement is labor-intensive, and personnel time and technology used in enforcement are limited resources. In times in which states are financially-strapped, one might question the efficacy of pursuing -- with equal vigor -- two NCPs, one who owes the state $10,000 for TANF payments and the other who owes $500 for the same delinquency. Similarly, pursuing an NCP who owes his/her child $100 in arrears should, on the surface, receive fewer enforcement resources than another NCP who owes his/her child $10,000 in arrears. A starting point in analyzing whether these arguments have any merit is determining the relative frequencies of both the differing amounts of arrears owed and the

Virginia Arrearages Study Page 47
number of NCPs owing them. From another perspective, the question might be addressed by examining the percent of NCPs owing differing amounts of arrears and the number of cases and the total debt represented by them.
Presumably, the amount of arrears debt per NCP is inversely related to the number of NCPs who owe arrears. If the number of NCPs declines as the amount of debt increases, it could be assumed that the largest portions of the total debt are attributed to NCPs with smaller debts. That is, NCPs with smaller arrears balances will represent the largest portions of both the NCP population and of the total arrears debt. The following proposition is based on this assumption:
Proposition 30: NCPs with smaller arrears balances constitute the largest percentages of the
total NCP population and of the total arrears debt.
Table 21 contains the information used to analyze Proposition 30.
Table 21: Distributions of Total Arrears Cases and Total Arrears Debt, July 1999
Amount of Arrears % of Total Arrears Cases % of Total Arrears Debt
$1 - $999 19.9% 0.8%
1,000 – 4,999 28.1 7.8
5,000 – 9,999 19.2 13.8
Subtotal 67.2% 22.4%
$10,000 - 19,999 17.8% 25.6%
20,000 - 29,999 7.8 19.2
30,000 and over 7.2 32.8
Subtotal 32.8% 77.6%
Total 100% 100%
NCPs with arrears under $10,000 represent 67.2 percent of all arrears cases and 22.4 percent of the total arrears debt. An even more disproportionate relationship of total cases to total debt exists for NCPs with less than $5,000 in arrears. NCPs in this category represent almost one-half (48 percent) of the total cases but carry only 8.6 percent of the total debt. At the other end of the spectrum, NCPs who owe arrears of $10,000 or more represent 32.8 percent of all cases yet owe 77.6 percent of the total debt. Furthermore, NCPs who owe arrears of $20,000 or more constitute 15 percent of the total cases and owe 52 percent of the total debt. These data do not support Proposition 30.

Virginia Arrearages Study Page 48
Large Balances and Payment Frequency
Common sense suggests that large arrears balances occur due to such causes as NCPs’ low income or sporadic employment records. As demonstrated in the analysis of relevant propositions above, large arrears balances are also associated with large support order amounts. NCPs living close to the poverty level or with insufficient income to make timely support payments are more likely to accumulate large arrears balances. Furthermore, large arrears balances presumably result from, and adversely affect, an NCP’s motivation to make payments. Thus, both the ability and motivation to make payments toward current support and/or arrears contribute to large arrears balances. Customary thinking holds that large arrears balances occur because NCPs do not have sufficient income to make timely payments. Large arrears balances may also cause an NCP to be less diligent in making payments and may adversely affect his/her motivation to make regular payments on the arrears.50 The following proposition summarizes this contention:
Proposition 31: NCPs with smaller arrears balances make more frequent payments than those
with larger balances.
To evaluate Proposition 31, data were obtained for the percent of NCPs making a payment within 12 months. These data were categorized by the amount of arrears owed. The data, shown in Table 22, tend to support Proposition 31. First, more than 85 percent of NCPs with less than $500 in arrears made a payment within 12 months. From 73 to 78 percent of NCPs with arrears of $500 to $5,000 made a payment within 12 months. Approximately 64 percent of NCPs with arrears of $5,000 to $20,000 made a payment within 12 months. About 60 percent of NCPs with arrears of $20,000 to $30,000 made a payment within 12 months. The group of NCPs with the lowest percentage (about 50 percent) making a payment within 12 months was those with arrears of $30,000 or more. For NCPs with arrears of $5,000 to $20,000, there does not appear to be a relationship between the amount of arrears and the percentage of NCPs making a payment within 12 months. The percent making a payment within 12 months is relatively the same, approximately 64 percent.
Statistical Correlation of Arrears Balances and Making a Payment
To more thoroughly test Proposition 31, NCPs’ arrears balances were correlated with the frequency of payments made within 12 months. The coefficient of correlation was -0.19, indicating that there was an inverse relationship between the amount of arrears balances and the frequency of making payments. Furthermore, the relationship was statistically significant.
50 Latus, Justin, op. cit., p. 5.

Virginia Arrearages Study Page 49
Payments Made: Arrears Only Cases Compared to Current Support Plus Arrears
Cases
As shown in Table 22, NCPs in All Arrears cases (those owing Arrears Only as well as those owing Current Support plus Arrears) who have smaller arrears balances make more frequent payments than those with larger balances. An important operational question is whether this payment trend applies to NCPs who owe Arrears Only. For example, do NCPs who owe Arrears Only have less motivation and/or less ability to make payments? One could assume that since these NCPs no longer owe Current Support, there would be a greater tendency for them to be motivated and able to make payments, compared to NCPs who owe both Current Support and Arrears. It could also be assumed that this tendency applies to all categories of arrears. That is, as the amount of arrears increases, approximately the same percentage of NCPs would make
Table 22: All Arrears Cases, Frequency & Amount of Payments Made, 2001
Percent Making a Payment
Within:
$ Mean Payment Amount Amount of Arrears
3 Mos. 12 Mos. 3 Mos. 12 Mos.
Average
Support
Order
Amount
$1 - $99 89.8% 90.3% $277 $271 $236
$100 - $499 78.0% 85.1% $244 $251 $232
$500 - $999 71.1% 78.3% $222 $232 $210
$1,000 - $4,999 58.3% 72.8% $217 $197 $167
$5,000 - $9,999 49.6% 64.3% $240 $236 $164
$10,000 - $19,999 50.0% 64.3% $262 $221 $207
$20,000 - $29,999 47.9% 60.3% $224 $223 $233
$30,000 and over 38.2% 49.9% $336 $298 $333
Total $210
payments within 3 months and 12 months, and the amount of the payment would remain about the same, regardless of the amount of arrears. The proposition below expresses these assumptions:
Proposition 32: The same percentage of NCPs who owe Arrears Only make payments within 12
months, regardless of the amount of arrears, and the mean dollar amounts of the payments do
not decline as the amount of arrears increases.

Virginia Arrearages Study Page 50
In contrast to the assumptions surrounding Proposition 32, NCPs who owe both Current Support and Arrears could be perceived as having more difficulty, potentially, in making child support payments, especially as the amount of the debt increases, thus adversely affecting their motivation to make payments. This proposition expresses that assumption:
Proposition 33: The percentage of NCPs who owe Current Support plus Arrears who make a
payment within 12 months decreases as the arrears increase, and the mean amount of payments
declines as the amount of arrears increases.
Of the two groups of NCPs, those owing Arrears Only and those owing Current Support plus Arrears, it could be assumed that the former would have less difficulty making payments since they no longer owe Current Support and, thus, would be more motivated to do so. This proposition is based upon that assumption:
Proposition 34: Compared to NCPs with Current Support plus Arrears, a larger percentage of
NCPs with Arrears Only make payments within 12 months, and the mean amount of payments is
larger.
Table 23 contains the data to analyze propositions 32 and 33. As shown in the table, the percentage of NCPs who owe Arrears Only and made a payment within 12 months ranges from a low of 43.8 percent (for those owing from $100 to $499, inclusive) to a high of 54.3 percent (for those owing $10,000 to $19,999, inclusive). There is no statistically significant difference in these percentages. Consequently, the data support Proposition 32. Contrary to the proposition, however, the amount of the payment varies from $84 to $217, depending upon the amount of the arrears. These data do not support Proposition 32, with regard to amount of payment made.
On the other hand, the percentage of NCPs owing Current Support plus Arrears who make a payment in 12 months declines as the amount of the arrears increases. For this group, a very large 95 percent of NCPs who owe less than $100 in arrears made a payment within 12 months. The percentage of NCPs making a payment then declines as the amount of arrears progressively increases, until only 50 percent of the group of NCPs owing $30,000 or more in arrears made a payment within 12 months. These data support the part of Proposition 33 regarding the percentages of NCPs making a payment within 12 months. For arrears under $5,000, the mean amount of the payment declines as the amount of the arrears increases. For arrears balances of $5,000 to $10,000, however, there is an increase in the amount of the payment. Then, the payment amount declines for balances up to $30,000. For balances of $30,000 or more, the amount of payment increases. For the most part, then, the data support Proposition 33, except for the inconsistency in the arrears ranges of $5,000 to $20,000 and $30,000 or more.

Virginia Arrearages Study Page 51
Table 23: Payment Made Within 12 Months: Arrears Only Cases
Compared to Current Support Plus Arrears Cases, 2001
Percent Making a Payment Within 12 mos.:
Mean Payment Amount during 12 Mos. Amount of Arrears
Arrears Only CurrentSupport plus
Arrears
Arrears Only Current Support plus Arrears
$1 - $99 52.4% 95.2%* $175 $278
$100 - $499 43.8% 94.9%* $124 $265
$500 - $999 49.3% 89.2%* $84 $263
$1,000 - $4,999 53.9% 82.0%* $116 $223
$5,000 - $9,999 51.9% 68.2%* $168 $252
$10,000 - $19,999 54.3% 67.3%* $134 $242
$20,000 - $29,999 49.6% 63.8%* $217 $224
$30,000 and over 48.4% 50.2% $163 $326
* percent making a payment was significant at the 0.05 level
In every arrears category, compared to NCPs who owe Arrears Only, larger percentages of NCPs who owe Current Support plus Arrears made a payment within 12 months. Furthermore, with the exception of arrears balances of $30,000 or more, the differences in the two groups are statistically significant. The data do not support Proposition 34. Nor do they support Proposition 34 regarding the amount of payment made, since NCPs who owe Current Support plus Arrears make much larger mean payments than NCPs who owe Arrears Only.
To analyze Proposition 34 from an overall perspective, averages were computed for the percentages of NCPs making payments and mean payment amounts for the two groups, regardless of the amount of arrears. The comparative data are shown in Table 24: 74.2 percent of NCPs who owe Current Support plus Arrears made a payment within 12 months, compared to 52.5 percent for NCPs who owe Arrears Only. These data are statistically significant and do notsupport Proposition 34. In addition, the mean payment amount made within 12 months by NCPs who owe Current Support plus Arrears is much larger ($253) than the amount made by NCPs who owe Arrears Only ($143). These data also do not support Proposition 34.

Virginia Arrearages Study Page 52
Table 24: Payments Made by Type of Arrears Case
Percent Paying Within: Mean Payment Amount Type of Arrears Case
% of Total Cases
3 Mos. 12 Mos. 3 Mos. 12 Mos.
All Arrears 100% 57.0% 69.0% $248 $233
Arrears Only 23.7% 39.5% 52.5% $151 $143
Current Support plus Arrears
76.3% 62.5%* 74.2%* $267 $253
Interstate 27.1% 59.9% 71.1% $277 $269
In-State 72.9% 56.0%* 68.3%* $236 $219
* significant at the 0.05 level for type of arrears case and jurisdiction (interstate vs. in-state)
Percent of NCPs Owing Arrears Who Made Payments
An important indicator of success in collecting arrears is the percent of NCPs who made a payment within a designated period. One performance indicator used by the federal Office of Child Support Enforcement to evaluate state programs is the percentage of NCPs who made a payment within the preceding year. To meet the performance indicator, at least 80 percent of NCPs who are in arrears must have a made a payment of some amount within the past year. This indicator is not easily achieved. For example, in 1999, there were 9 million cases in the U.S. with arrears and only 54 percent of the NCPs in these cases made some payment during the year.51 These data provide a convenient basis for analyzing the payment practices of NCPs in the sample. One assumption is 54 percent of the NCPs in the sample made a payment within the one-year period from July 2000 to July 2001. This proposition is based on that assumption:
Proposition 35: Fifty-four percent of the NCPs in the Virginia arrears sample made a payment
of some amount during the one-year period from of July 2000 to July 2001.
Table 24 contains data to analyze this proposition. As shown in the table, 69 percent of the NCPs in the sample made a payment during the period from July 2000 to July 2001. These data do not support the proposition, since 28 percent more NCPs in the sample, compared to NCPs nationwide, made a payment in the one-year period.
Payments Made: In-State Cases Compared to Interstate Cases
Seventy-four percent of the cases in the DCSE caseload are in-state cases.52 A slightly smaller percentage of the arrears sample, 72.9 percent, was in-state cases. Consistent with the assumption that interstate cases are more difficult to enforce and, thus, more likely to incur 51 Latus, Justin, op. cit., p. 3.52 Joint Legislative Audit and Review Commission of the Virginia General Assembly, op. cit., p. 11.

Virginia Arrearages Study Page 53
arrears, it can be assumed that a higher percentage of NCPs with in-state cases would make payments within 3- and 12–month periods, and the mean amount of their payments would be larger for these two periods. This proposition expresses these assumptions:
Proposition 36: Compared to NCPs in interstate cases, higher percentages of NCPs in in-state
cases make payments within 3 and 12 months and the mean amounts of the payments are higher.
Tables 24 and 25 contain data to analyze this proposition. Table 25 shows payments made by NCPs with interstate and in-state cases, categorized by the amount of arrears. In this table, compared to NCPs with in-state cases, larger percentages of NCPs with interstate cases made payments within 12 months. In two of the categories ($1,000 - $4,999 and $20,000 – $29,999), the differences were statistically significant. Also, as shown in Table 25, NCPs with interstate cases made larger mean payments during the 12-month period. These data do not support Proposition 36.
A similar picture exists for the data in Table 24. In this summary table, 68.3 percent of the NCPs with in-state cases made a payment within 12 months. A higher percentage (71.1 percent) of NCPs with interstate cases made a payment within 12 months. The difference is statistically significant. Again, the data do not support Proposition 36. Furthermore, as shown in Table 24, NCPs with interstate cases made larger mean payments within 12 months, compared to the payments made by NCPs with in-state cases. These data do not support Proposition 36 either.
Payments Made by Case Type
As discussed in the analysis of Proposition 22, the percentage distributions of TANF and Non-TANF cases in both the entire DCSE caseload and the arrears sample were essentially the same.53 It is interesting to speculate on whether the total arrears balance is distributed in proportion to this case mix. Data in two previous tables shed some light on this speculation. As noted in Table 7, the employment rates among NCPs who owe arrears for TANF and Non-TANFcases in the arrears sample are 54.2 percent and 57.1 percent, respectively. The lower rate of employment for NCPs who owe arrears on TANF cases suggests they may be less able to make
53 The distribution of non-TANF, TANF and “Other” cases for the entire DCSE caseload was 75 percent, 22
percent, and 2 percent, respectively. The distribution of the same cases for the arrears sample was 75.3 percent,
23.2 percent, and 1.6 percent, respectively, in July 1999.

Virginia Arrearages Study Page 54
Table 25: Payments Made Within 12 Months: In-State
Compared to Interstate, 2001
Percent Making a Payment Within 12 Mos.
Mean Payment Amount During 12 Mos.
Amount of Arrears
Interstate In-State Interstate In-State
$1 - $99 93.0% 89.5% $276 $270
$100 - $499 89.9% 83.1% $285 $236
$500 - $999 86.2% 75.7% $277 $215
$1,000 - $4,999 77.9% 71.3%* $220 $190
$5,000 - $9,999 65.3% 64.0% $282 $223
$10,000 - $19,999 66.0% 63.6% $255 $206
$20,000 - $29,999 69.1% 55.6%* $245 $208
$30,000 and over 50.5% 49.5% $365 $253
* percent making a payment was significant at the 0.05 level
payments and would consistently accrue additional arrears. To substantiate that assumption,Table 8 shows that unemployed NCPs owe a disproportionately larger portion of arrears. From these data, it could be assumed that, compared with NCPs who owe arrears on Non-TANF cases, NCPs who owe arrears on TANF cases would represent a disproportionately larger portion of arrears. It could be assumed, also, that the percentage of NCPs owing TANF arrears who make payments within 12 months, as well as their payment amounts, would be smaller. The following propositions are based on these assumptions:
Proposition 37: Compared to NCPs who owe arrears on Non-TANF cases, NCPs who owe
arrears on TANF cases represent a disproportionately larger portion of total arrears.
Proposition 38: Compared to NCPs who owe arrears on Non-TANF cases, NCPs who owe
arrears on TANF cases make a smaller percentage of payments within 12 months and their
payment amount is smaller.
Table 26 contains the data to analyze these two propositions. As shown in the table, NCPs who have TANF-related debt constitute 24.2 percent of the arrears sample and owe 19.5 percent of the total debt. Conversely, the NCPs who owe debt on non-TANF related cases represent 74.7 percent of the arrears sample and owe almost 80 percent of the total debt. These

Virginia Arrearages Study Page 55
data do not support Proposition 37. With regard to Proposition 38, the percentage of NCPs owing Non-TANF debt who made a payment within 12 months is larger than the percentage of NCPs owing TANF-related debt who made a payment. Furthermore, these differences are statistically significant. In a similar manner, with the exception of Arrears Only Non-TANF cases (ARRN), the mean amount of payments made within 12 months is larger for NCPs owing Non-TANF related debt. With this one exception, the data support Proposition 38.
Table 26: Case Type: Frequency of Cases, Arrears Owed, and Payments Made, July 2001
Case Type2 No. Cases % Total Cases
$ Amount Arrears
% Total Arrears
% Making a Payment Within:
Mean Payment Amount
3 Mos. 12 Mos. 3 Mos. 12 Mos.
TANF:
TANF 533 9.8% 6,019,328 9.4% 50%* 65%* $194 $182
ARRP 724 13.4% 6,096,551 9.5% 33%* 46%* $157 $145
FC 55 1.0% 353,468 0.6% 20%* 29%* $99 $68
Sub-total 1,312 24.2% 19.5%
Non-TANF:
Non-TANF 2,386 44.0% 31,070,976 48.3% 68%* 78%* $289 $279
ARRN 593 10.9% 8,242,454 12.8% 45%* 57%* $147 $137
MAOF 1,075 19.8% 11,975,059 18.6% 62%* 75%* $249 $232
Sub-total 4,054 74.7% 79.7%
OTHER:
MAOP 43 0.8% 404,300 0.6% 49%* 56%* $161 $143
MSO 2 0.0% 15,554 0.0% 50%* 100%* $63 $106
NIVD 2 0.0% 48,821 0.1% 50%* 50%* $175 $163
SLFC 11 0.2% 48,695 0.1% 27%* 55%* $52 $147
Sub-total 58 1.0% 0.8%
TOTAL 5,424 99.9%1 64,275,207 100.0% 57% 69% $248 $233
* the percentage making a payment within 3 and 12 months is dependent upon the case type, significant at the
0.05 level 1 does not total 100% due to rounding
2 “case type” – for definitions, see Table 46, p. 86
All Arrears Cases: Dollar Amount Debt and Interest, 1999 and 2001
An important case characteristic is the composition of the arrears debt; that is, the portion that represents actual payments missed or underpaid and the portion that represents interest charged on missed or underpaid payments. As shown in Table 27, interest represented 22.6 percent of the arrears owed in 1999 by the 6,483 NCPs in the sample. This percentage amount
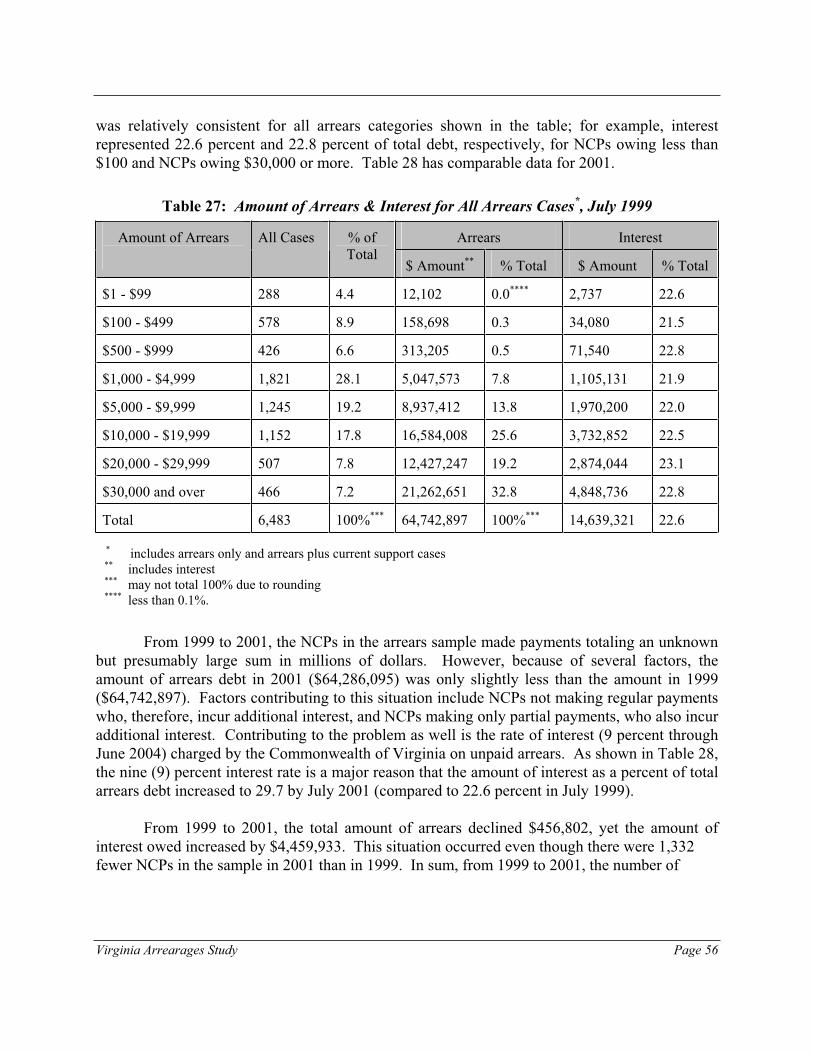
Virginia Arrearages Study Page 56
was relatively consistent for all arrears categories shown in the table; for example, interest represented 22.6 percent and 22.8 percent of total debt, respectively, for NCPs owing less than $100 and NCPs owing $30,000 or more. Table 28 has comparable data for 2001.
Table 27: Amount of Arrears & Interest for All Arrears Cases*, July 1999
Arrears InterestAmount of Arrears All Cases % of Total
$ Amount** % Total $ Amount % Total
$1 - $99 288 4.4 12,102 0.0**** 2,737 22.6
$100 - $499 578 8.9 158,698 0.3 34,080 21.5
$500 - $999 426 6.6 313,205 0.5 71,540 22.8
$1,000 - $4,999 1,821 28.1 5,047,573 7.8 1,105,131 21.9
$5,000 - $9,999 1,245 19.2 8,937,412 13.8 1,970,200 22.0
$10,000 - $19,999 1,152 17.8 16,584,008 25.6 3,732,852 22.5
$20,000 - $29,999 507 7.8 12,427,247 19.2 2,874,044 23.1
$30,000 and over 466 7.2 21,262,651 32.8 4,848,736 22.8
Total 6,483 100%*** 64,742,897 100%*** 14,639,321 22.6
* includes arrears only and arrears plus current support cases ** includes interest *** may not total 100% due to rounding **** less than 0.1%.
From 1999 to 2001, the NCPs in the arrears sample made payments totaling an unknown but presumably large sum in millions of dollars. However, because of several factors, the amount of arrears debt in 2001 ($64,286,095) was only slightly less than the amount in 1999 ($64,742,897). Factors contributing to this situation include NCPs not making regular payments who, therefore, incur additional interest, and NCPs making only partial payments, who also incur additional interest. Contributing to the problem as well is the rate of interest (9 percent through June 2004) charged by the Commonwealth of Virginia on unpaid arrears. As shown in Table 28, the nine (9) percent interest rate is a major reason that the amount of interest as a percent of total arrears debt increased to 29.7 by July 2001 (compared to 22.6 percent in July 1999).
From 1999 to 2001, the total amount of arrears declined $456,802, yet the amount of interest owed increased by $4,459,933. This situation occurred even though there were 1,332fewer NCPs in the sample in 2001 than in 1999. In sum, from 1999 to 2001, the number of
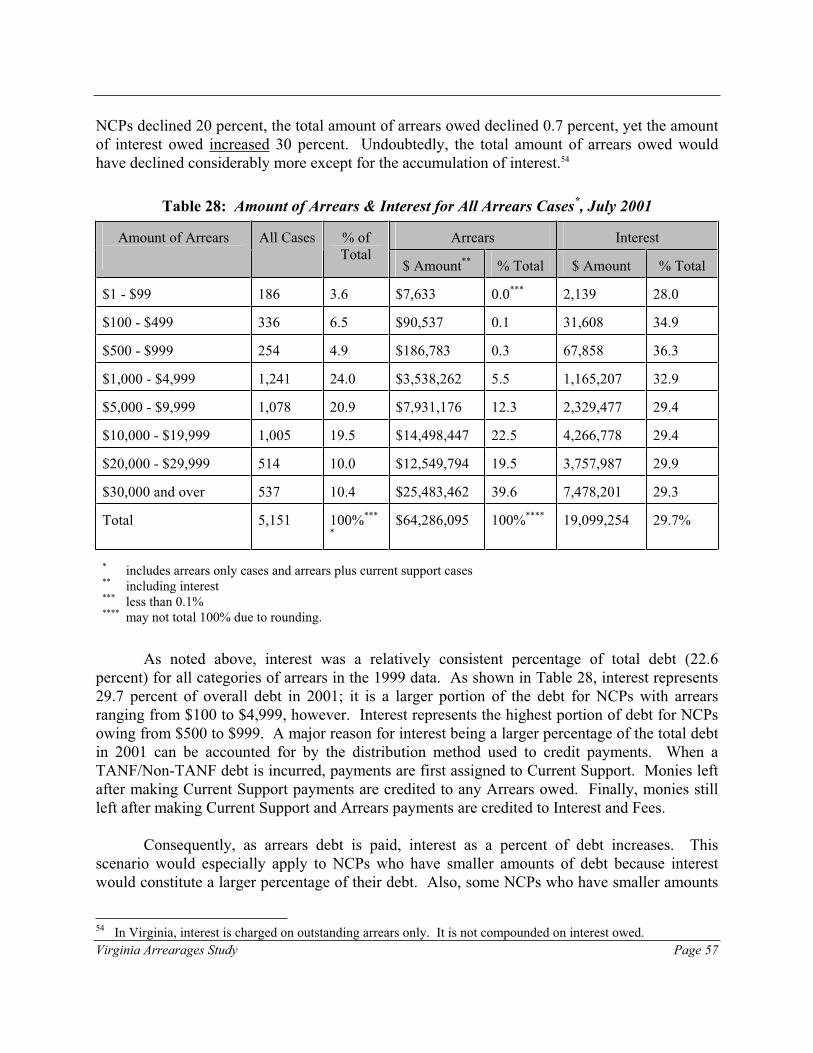
Virginia Arrearages Study Page 57
NCPs declined 20 percent, the total amount of arrears owed declined 0.7 percent, yet the amount of interest owed increased 30 percent. Undoubtedly, the total amount of arrears owed would have declined considerably more except for the accumulation of interest.54
Table 28: Amount of Arrears & Interest for All Arrears Cases*, July 2001
Arrears InterestAmount of Arrears All Cases % of Total
$ Amount** % Total $ Amount % Total
$1 - $99 186 3.6 $7,633 0.0*** 2,139 28.0
$100 - $499 336 6.5 $90,537 0.1 31,608 34.9
$500 - $999 254 4.9 $186,783 0.3 67,858 36.3
$1,000 - $4,999 1,241 24.0 $3,538,262 5.5 1,165,207 32.9
$5,000 - $9,999 1,078 20.9 $7,931,176 12.3 2,329,477 29.4
$10,000 - $19,999 1,005 19.5 $14,498,447 22.5 4,266,778 29.4
$20,000 - $29,999 514 10.0 $12,549,794 19.5 3,757,987 29.9
$30,000 and over 537 10.4 $25,483,462 39.6 7,478,201 29.3
Total 5,151 100%***
*$64,286,095 100%**** 19,099,254 29.7%
* includes arrears only cases and arrears plus current support cases ** including interest *** less than 0.1% **** may not total 100% due to rounding.
As noted above, interest was a relatively consistent percentage of total debt (22.6 percent) for all categories of arrears in the 1999 data. As shown in Table 28, interest represents 29.7 percent of overall debt in 2001; it is a larger portion of the debt for NCPs with arrears ranging from $100 to $4,999, however. Interest represents the highest portion of debt for NCPs owing from $500 to $999. A major reason for interest being a larger percentage of the total debt in 2001 can be accounted for by the distribution method used to credit payments. When a TANF/Non-TANF debt is incurred, payments are first assigned to Current Support. Monies left after making Current Support payments are credited to any Arrears owed. Finally, monies still left after making Current Support and Arrears payments are credited to Interest and Fees.
Consequently, as arrears debt is paid, interest as a percent of debt increases. This scenario would especially apply to NCPs who have smaller amounts of debt because interest would constitute a larger percentage of their debt. Also, some NCPs who have smaller amounts
54 In Virginia, interest is charged on outstanding arrears only. It is not compounded on interest owed.
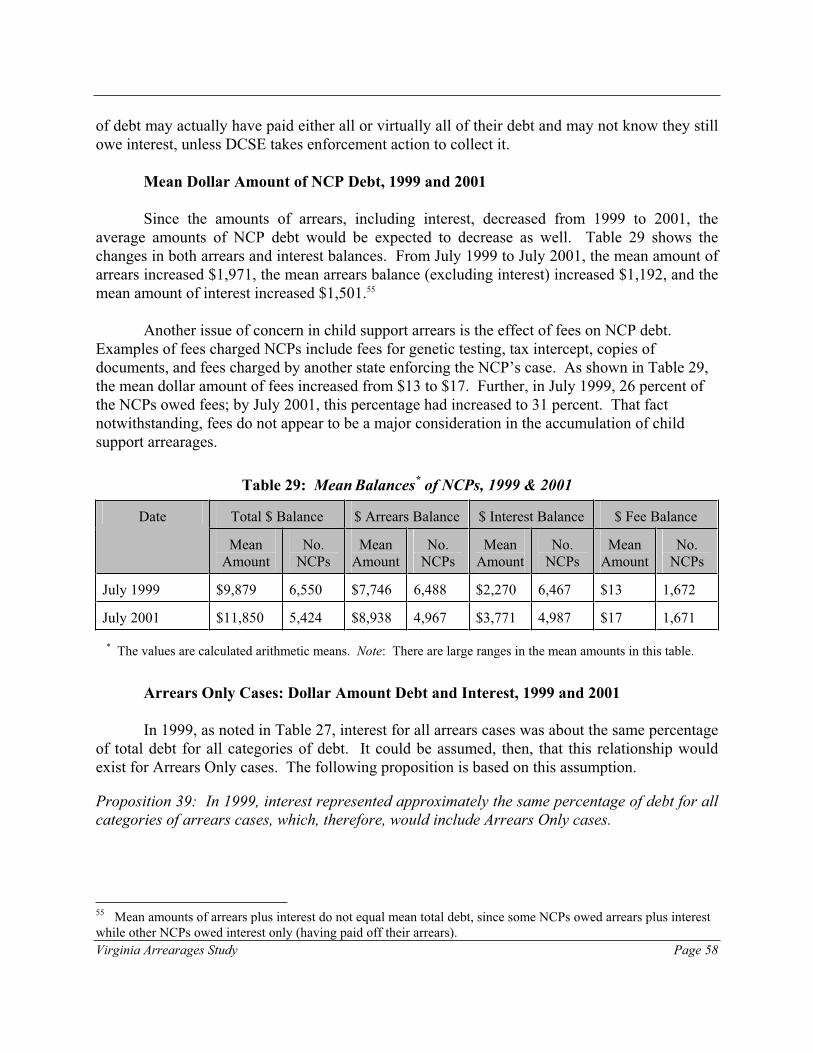
Virginia Arrearages Study Page 58
of debt may actually have paid either all or virtually all of their debt and may not know they still owe interest, unless DCSE takes enforcement action to collect it.
Mean Dollar Amount of NCP Debt, 1999 and 2001
Since the amounts of arrears, including interest, decreased from 1999 to 2001, the average amounts of NCP debt would be expected to decrease as well. Table 29 shows the changes in both arrears and interest balances. From July 1999 to July 2001, the mean amount of arrears increased $1,971, the mean arrears balance (excluding interest) increased $1,192, and the mean amount of interest increased $1,501.55
Another issue of concern in child support arrears is the effect of fees on NCP debt.Examples of fees charged NCPs include fees for genetic testing, tax intercept, copies of documents, and fees charged by another state enforcing the NCP’s case. As shown in Table 29, the mean dollar amount of fees increased from $13 to $17. Further, in July 1999, 26 percent of the NCPs owed fees; by July 2001, this percentage had increased to 31 percent. That fact notwithstanding, fees do not appear to be a major consideration in the accumulation of child support arrearages.
Table 29: Mean Balances* of NCPs, 1999 & 2001
Total $ Balance $ Arrears Balance $ Interest Balance $ Fee Balance Date
MeanAmount
No.NCPs
MeanAmount
No.NCPs
MeanAmount
No.NCPs
MeanAmount
No.NCPs
July 1999 $9,879 6,550 $7,746 6,488 $2,270 6,467 $13 1,672
July 2001 $11,850 5,424 $8,938 4,967 $3,771 4,987 $17 1,671
* The values are calculated arithmetic means. Note: There are large ranges in the mean amounts in this table.
Arrears Only Cases: Dollar Amount Debt and Interest, 1999 and 2001
In 1999, as noted in Table 27, interest for all arrears cases was about the same percentage of total debt for all categories of debt. It could be assumed, then, that this relationship would exist for Arrears Only cases. The following proposition is based on this assumption.
Proposition 39: In 1999, interest represented approximately the same percentage of debt for all
categories of arrears cases, which, therefore, would include Arrears Only cases.
55 Mean amounts of arrears plus interest do not equal mean total debt, since some NCPs owed arrears plus interest
while other NCPs owed interest only (having paid off their arrears).

Virginia Arrearages Study Page 59
On the other hand, by 2001 (as shown in Table 28), interest as a percent of total debt had increased, and the percentage amounts were greater for NCPs who owed less than $1,000 in debt (excluding the $1-99 category). Since NCPs who owe Arrears Only do not have Current Supportobligations, it can be assumed that they are paying off their debt at a faster rate and, as a result, that interest as a percent of their debt would be expected to rise. Consequently, it could be assumed that interest as a percent of debt constitutes a larger percentage of total debt in 2001. This proposition summarizes the assumption:
Proposition 40: In 2001, interest constitutes a larger percentage of total debt for NCPs who
owe Arrears Only than it does for All Arrears cases.
Tables 30 and 31 contain the data to analyze Propositions 39 and 40, respectively. In 1999, interest was 26.4 percent of the total debt of NCPs with Arrears Only cases. In the same year, for All Arrears cases interest was 22.6 percent of the total debt (see Table 27). These data indicate that as NCPs transition from owing Current Support plus Arrears to owing Arrears Only, the percentage of debt that is interest increases. Contrary to Proposition 39, in 1999 interest did not represent the same percentage of debt for various amounts of Arrears Only cases. The interest percentages declined as the amount of debt increased. The percentage was largest for arrears under $100 (43.4 percent). These data do not support Proposition 39.
As shown in Table 31, interest constitutes 35.5 percent of the total debt in July 2001 for NCPs who owe Arrears Only and, compared to arrears categories for All Arrears cases in 2001 (see Table 28), is larger for every arrears category. The percentage is largest (ranging from 46.8 percent to 55.8 percent) for NCPs who owe less than $1,000 in arrears. These data support Proposition 40.

Virginia Arrearages Study Page 60
Table 30: Amount of Arrears & Interest for Arrears Only Cases, July 1999
Arrears InterestAmount of Arrears No.Cases
% of Total
ArrearsCases
$ Amount* % Total $ Amount % Arrears
$1 - $99 43 0.7 2,161 0.0** 938 43.4
$100 - $499 127 2.0 37,485 0.1 13,958 37.2
$500 - $999 138 2.1 101,478 0.2 33.595 33.1
$1,000 - $4,999 565 8.7 1,505,225 2.3 447,088 29.7
$5,000 - $9,999 335 5.2 2,422,015 3.7 654,072 27.0
$10,000 - $19,999 289 4.5 4,144,742 6.4 1,076,419 26.0
$20,000 - $29,999 141 2.2 3,459,536 5.3 892,910 25.8
$30,000 and over 102 1.6 4,608600 7.1 1,181,188 25.6
Total 1,740 26.8 16,281,243 25.1 4,300,168 26.4
Table 31: Amount of Arrears & Interest for Arrears Only Cases, July 2001
Arrears InterestAmount of Arrears No.Cases
% of Total
ArrearsCases
$ Amount* % Total $ Amount % Arrears
$1 - $99 21 0.4 1,111 0.0** 620 55.8
$100 - $499 64 1.2 19,463 0.0** 10,004 51.4
$500 - $999 69 1.3 51,543 0.1 24,116 46.8
$1,000 - $4,999 406 7.9 1,110,222 1.7 468,684 42.2
$5,000 - $9,999 260 5.0 1,857,909 2.9 672,887 36.2
$10,000 - $19,999 232 4.5 3,322,964 5.2 1,158,304 34.9
$20,000 - $29,999 125 2.4 3,023,102 4.7 1,060,146 35.1
$30,000 and over 95 1.8 4,307,426 6.7 1,460,368 33.9
Total 1,272 24.7 13,693,739 21.3 4,855,131 35.5
* including interest ** less than 0.1%

Virginia Arrearages Study Page 61
Current Support Plus Arrears Cases: Amount of Debt and Interest, 1999 and
2001
As noted above, NCPs in All Arrears cases and in Arrears Only cases have large differences in the percentage of total debt represented by interest. In All Arrears cases, the rate of interest as a percent of debt is about the same for all NCPs regardless of debt amount in 1999. In 2001, interest was a larger percentage of debt for NCPs owing from $100 to $1,000 in debt. Conversely, for NCPs who owed Arrears Only, interest as a percent of total debt was largest for those who owed less than $1,000 in 1999 and the percentage amount increased greatly for those owing less than $1,000 in 2001. As noted previously, a major reason for this increase in the interest percentage is the order in which payments are credited, namely to current support, then to arrears, and finally to interest and fees. Since interest is paid last, it should be expected to rise as a percentage of total debt. It would be expected, then, that this same pattern would exist for NCPs who owe Current Support plus Arrears. These propositions summarize that assumption:
Proposition 41: In 1999, interest as a percentage of total debt was approximately the same for
NCPs who owed Current Support plus Arrears, regardless of debt amount.
Proposition 42: In 2001, interest as a percentage of total debt was the largest for NCPs owing
Current Support plus Arrears who owed less than $1,000 in arrears debt.
Tables 32 and 33 contain the information to analyze these propositions. As can be seen in Table 32, contrary to Proposition 41, interest as a percentage of total debt varies among the different debt categories for NCPs owing Current Support plus Arrears in 1999. These data do not support Proposition 41. In 2001, interest as a percent of total debt is greatest for NCPs owing between $100 and $1,000. With the exception of those owing $1-99, these data support Proposition 42.

Virginia Arrearages Study Page 62
Table 32: Amount of Arrears & Interest for Current Support Plus Arrears Cases, July 1999
Table 33: Amount of Arrears & Interest for Current Support Plus Arrears Cases, July 2001
Arrears InterestAmount of Arrears No.Cases
% of Total
ArrearsCases
$ Amount* % Total $ Amount % Arrears
$1 - $99 165 3.2 6,522 0.0** 1,518 23.3
$100 - $499 272 5.3 71,074 0.1 21,603 30.4
$500 - $999 185 3.6 135,240 0.2 43,742 32.3
$1,000 - $4,999 835 16.2 2,428,041 3.8 696,522 28.7
$5,000 - $9,999 818 15.9 6,073,267 9.4 1,656,590 27.3
$10,000 - $19,999 773 15.0 11,175,483 17.4 3,108,474 27.8
$20,000 - $29,999 389 7.6 9,526,692 14.8 2,697,841 28.3
$30,000 and over 442 8.6 21,176,036 32.9 6,017,832 28.4
Total 3,879 75.3 50,592,356 78.7 14,244,123 28.2 * including interest ** less than 0.1%
Arrears InterestAmount of Arrears No.Cases
% of TotalArrearsCases
$ Amount* % Total $ Amount %Arrears
$1 - $99 245 3.8 9,941 0.0** 1,799 18.1
$100 - $499 451 7.0 121,213 0.2 20,122 16.6
$500 - $999 288 4.4 211,727 0.3 37,945 17.9
$1,000 - $4,999 1,256 19.4 3,542,348 5.5 658,043 18.6
$5,000 - $9,999 910 14.0 6,515,396 10.1 1,316,128 20.2
$10,000 - $19,999 863 13.3 12,439,266 19.2 2,656,433 21.4
$20,000 - $29,999 366 5.6 8,967,711 13.9 1,981,134 22.1
$30,000 and over 364 5.6 16,654,051 25.7 3,667,549 22.0
Total 4,743 73.2 48,461,654 74.9 10,339,154 21.3

Virginia Arrearages Study Page 63
Summary: Amount of Arrears and Interest as a Percent of Arrears
Tables 34 and 35 summarize the information in Tables 27-33. As shown in Table 34, from 1999 to 2001, the total debt for All Arrears cases declined from $64.7 million to $64.3 million, or about $400,000. During the same interval, the amount of interest owed increased from $14.6 million to $19.1 million, or about $4.5 million. NCPs who owed Current Support plus Arrears fared worse since their total debt during the two-year period increased about $2.0 million, including an increase of $3.9 million in interest. NCPs with Arrears Only showed a decline during the time period of $2.6 million in total debt yet an increase of about $560,000 in interest owed.
Table 35 shows the percentage changes in debt and interest for the two-year period. NCPs who owed Current Support plus Arrears had a 4.4% increase in total debt, which included a 37.8% increase in interest owed. NCPs who had Arrears Only showed a 15.9% decline in total debt despite having a 12.9% increase in interest.
Payments Made and Support Order Amount: All Arrears, Current Support Plus
Arrears, and Arrears Only Cases
As noted previously, the two major reasons for the accumulation of debt are:
(1) The interest charged on late payments and the failure of NCPs to make timely payments on both current support and arrears, and (2) The failure of NCPs to pay the full amount of each current payment.
Table 36 shows the composition of the NCPs in the sample and data on payments and support order amounts. As noted in the table, the percentage of NCPs making a payment within 12 months was highest for those who owed Current Support plus Arrears. Nevertheless, for this group of NCPs, the percent making a payment within 12 months ranged from a low of 50% for those owing more than $30,000 to 95 percent for those owing less than $500 in arrears. The percentage of NCPs making a payment within 12 months declines as the amount of arrears owed increases. These data illustrate how over time total debt declines slowly or not at all while interest increases. For example, the average support order amount for NCPs owing $1,000 to $5,000 in arrears in this group is $173. Only 82 percent of the NCPs in this group made a payment in a one-year period, and the mean amount of the payment was $223. Obviously, total arrears will increase when the current support order amount is approximately $173 per month and 18 percent of the NCPs did not make a payment in a one-year period.
The payment record for NCPs who owed Arrears Only is more problematic. As shown in Table 36, the percent of NCPs who made a payment within 12 months ranges from 43.8 to 54.3 percent, depending on the amount of arrears owed. Since Arrears Only NCPs do not owe current

Virginia Arrearages Study Page 64
support56, all payments made are credited to arrears, interest, and any fees that may be owed. These NCPs experienced a 15.9 percent decline in total debt, consequently, as shown in Table 35, yet this decline included a 12.9 percent increase in interest.
56 The average support amount for NCPs owing Arrears Only was the same as when they owed Current Support
plus Arrears.

Vir
gin
ia A
rrea
rag
es S
tud
y
Pa
ge
65
Ta
ble
34
:A
ll A
rrea
rs,
Cu
rren
t S
up
po
rt +
Arr
ears
, a
nd
Arr
ears
On
ly C
ase
s: A
mo
un
t o
f
Arr
ears
, In
tere
st,
an
d I
nte
rest
as
% o
f A
rrea
rs
Am
ou
nt
of
Arr
ears
($
mil
lio
ns)
A
mo
un
t o
f In
tere
st (
$ m
illi
on
s)
Inte
rest
as
% o
f A
rrea
rs
19
99
20
01
19
99
20
01
19
99
20
01
Am
ou
nt
of
Arr
ears
All
CS
+
A
AO
All
CS
+A
AO
All
CS
+A
AO
All
CS
+A
AO
All
CS
+A
AO
All
CS
+A
AO
Les
s th
an
$1
00
.01
2
.01
0
.00
2
.00
8
.00
6
.00
1
.00
3
.00
2
.00
1
.00
2
.00
2
.00
1
22
.61
8.1
4
3.4
2
8.0
2
3.3
5
5.8
$1
00
-$4
99
.15
9
.12
1
.03
7
.09
1
.07
1
.01
9
.03
4
.02
0
.01
4
.03
2
.02
2
.01
2
1.5
16
.6
37
.2
34
.9
30
.4
51
.4
$5
00
-$9
99
.31
3
.21
2
.10
1
.18
7
.13
5
.05
2
.07
2
.03
8
.03
4
.06
8
.04
4
.02
4
22
.81
7.9
3
3.1
3
6.3
3
2.3
4
6.8
$1
,00
0-
$4
,99
95
.05
3
.54
1
.51
3
.54
2
.42
1
.11
1
.11
.6
58
.4
47
1
.17
.6
97
.4
69
2
1.9
18
.6
29
.7
32
.9
28
.7
42
.2
$5
,00
0-
$9
,99
98
.93
6
.52
2
.42
7
.93
6
.07
1
.86
1
.97
1
.32
.6
54
2
.33
1
.66
.6
73
2
2.0
20
.2
27
.0
29
.4
27
.3
36
.2
$1
0,0
00
-
$1
9,9
99
16
.6
12
.4
4.1
4
14
.5
11
.1
3.3
2
3.7
3
2.6
6
1.0
8
4.2
7
3.1
1
1.1
6
22
.52
1.4
2
6.0
2
9.4
2
7.8
3
4.9
$2
0,0
00
-
$2
9,0
00
12
.4
8.9
7
3.4
6
12
.5
9.5
2
3.0
2
2.8
7
1.9
8
.89
3
3.7
6
2.7
0
1.0
6
23
.12
2.1
2
5.8
2
9.9
2
8.3
3
5.1
$3
0,0
00
an
d
ov
er2
1.2
1
6.7
4
.61
2
5.5
2
1.1
4
.31
4
.85
3
.67
1
.18
7
.48
6
.02
1
.46
2
2.8
22
.0
25
.6
29
.3
28
.4
33
.9
Tota
l 6
4.7
4
8.5
1
6.3
6
4.3
5
0.5
1
3.7
1
4.6
1
0.3
4
.30
1
9.1
1
4.2
4
.86
2
2.6
21
.3
26
.4
29
.7
28
.2
35
.5
A
ll
=
A
ll a
rrea
rs c
ases
in
th
e sa
mp
le
C
S+
A =
C
ases
in
wh
ich
NC
Ps
ow
e cu
rren
t su
pp
ort
plu
s ar
rear
s
A
O
=
C
ases
in
wh
ich
NC
Ps
ow
e ar
rear
s o
nly
.

Vir
gin
ia A
rrea
rag
es S
tud
y
Pa
ge
66
Ta
ble
35
:P
erce
nt
Ch
an
ge
in A
rrea
rs,
Inte
rest
, a
nd
In
tere
st a
s %
of
Arr
ears
, 1
99
9-2
00
1
% C
han
ge
in $
Arr
ears
, 1
99
9 -
20
01
% C
han
ge
in $
In
tere
st,
19
99
-2
00
1%
Ch
ang
e in
In
tere
st a
s %
of
Arr
ears
, 1
99
9 -
20
01
Am
ou
nt
of
A
rrea
rs
All
CS
+A
AO
All
CS
+A
AO
All
CS
+A
AO
Les
s th
an $
10
0
-36
.9%
-3
3.4
%-4
8.6
%-2
3.8
%-1
5.6
%-3
3.9
%
23
.9%
28
.6%
28
.6%
$1
00
-$4
99
-42
.9%
-4
1.4
%-4
8.1
%-7
.2%
7.4
%-2
8.3
%
62
.6%
83
.1%
38
.0%
$5
00
-$9
99
-40
.4%
-3
6.2
%-4
9.2
%-5
.1%
15
.3%
-28
.2%
5
9.0
%8
0.5
%4
1.3
%
$1
,00
0-$
4,9
99
-29
.9%
-3
1.5
%-2
6.2
%5
.4%
5.8
%4
.8%
5
0.4
%5
4.4
%4
2.1
%
$5
,00
0-$
9,9
99
-11
.3%
-6
.8%
-23
.3%
18
.24
%2
5.9
%2
.9%
3
3.2
%3
5.0
%3
4.1
%
$1
0,0
00
-$1
9,9
99
-12
.6%
-1
0.2
%-1
9.8
%1
4.3
%1
7.0
%7
.6%
3
0.7
%3
0.2
%3
4.2
%
$2
0,0
00
-$2
9,0
00
0.9
9%
6
.2%
-12
.6%
30
.7%
36
.2%
18
.7%
2
9.5
%2
8.2
%3
5.9
%
$3
0,0
00
an
d
ov
er1
9.9
%
27
.1%
-6.5
%5
4.2
%6
4.1
%2
3.6
%
28
.7%
29
.0%
32
.3%
To
tal
-0.7
1%
4
.4%
-15
.9%
30
.5%
37
.8%
12
.9%
3
1.4
%3
2.0
%3
4.2
%
A
ll
=
A
ll a
rrea
rs c
ases
in
th
e sa
mp
le
C
S+
A
=
Cas
es i
n w
hic
h N
CP
s o
we
curr
ent
sup
po
rt p
lus
arre
ars
A
O
=
C
ases
in
wh
ich
NC
Ps
ow
e ar
rear
s o
nly
.
No
te:
All
per
cen
tag
es i
n t
his
tab
le a
re b
ased
up
on
act
ual
do
llar
am
ou
nts
in
Tab
les
30
-33
. T
hey
are
no
t ro
un
ded
, as
are
th
e d
ata
in T
able
34
.

Virginia Arrearages Study Page 67
Table 36: Arrears Cases: Composition, Payments Made, and
Support Order Amount, 1999 and 2001
% of Cases, 1999 % with Payment within 12 Mos.,
2001
$ Mean Payment Amount, 2001
Average Support Order Amount, 1999
Amount of
Arrears
All CS+A AO All CS+A AO All CS+A AO All CS+A AO
$1 - $99 4.4 3.8 0.7 90.3 95.2 52.4 $271 $278 $175 $236 $236 $246
$100 - $499
8.9 7.0 2.0 85.1 94.9 43.8 $251 $265 $124 $228 $229 $269
$500 - $999
6.6 4.4 2.1 78.3 89.2 49.3 $232 $263 $84 $216 $217 $189
$1,000 - $4,999
28.1 19.4 8.7 72.8 82.0 53.9 $197 $223 $116 $174 $173 $203
$5,000 - $9,999
19.2 14.0 5.2 64.3 68.2 51.9 $236 $252 $168 $181 $180 $215
$10,000 - $19,999
17.8 13.3 4.5 64.3 67.3 54.3 $221 $242 $134 $219 $218 $271
$20,000 - $29,999
7.8 5.6 2.2 60.3 63.8 49.6 $223 $224 $217 $250 $251 $219
$30,000and over
7.2 5.6 1.6 49.9 50.2 47.4 $298 $326 $163 $391 $391 $379
Total 100 73.2 26.8 67.4 72.5 52.0 $229 $250 $142 $217 $217 $224
All = All arrears cases in the sample
CS+A = Cases in which NCPs owe current support plus arrears
AO = Cases in which NCPs owe arrears only.
Analysis of Selected Enforcement Methods
Four enforcement methods were selected for this phase of the study. The analysis was intended to measure the interactions of (1) noncustodial parent (NCP) demographics, and (2) arrears collected using four different enforcement methods.57 Instead, however, these interactions
57 The researchers experienced difficulty in using the APECS database for this phase of the research, since each
enforcement method used to collect arrears requires a number of worker- or system-generated actions, which can be
identified by various APECS “event codes.” It is not possible to track the actions required to complete a specific
enforcement method in APECS unless the event codes are used. To address this issue, some short meetings were
held with DCSE information systems staff, in which the researchers were given some information, including a list

Virginia Arrearages Study Page 68
were tested using a non-linear model, to determine differences in arrears collected for each level of the variables. Predictions were made of the probabilities of collecting arrears in various district child support offices, based upon differences in client demographics and the four enforcement methods. The four enforcement techniques examined in this study were income withholding, liens, financial institution data match (FIDM), and court enforcement.58
Income Withholding
Income withholding, sometimes referred to as wage withholding, is a process of obtaining funds from employers and other sources discussed below, normally payable to the NCP, and applying them to the payment of current child support obligations and/or the payment of arrears. The procedure for instituting an income withholding depends upon the source of the income and whether a court orders the withholding. Normally, income withholding is part of the child support order and is initiated immediately, without the NCP missing a payment. If, however, an NCP fails to pay one month’s support (with the exception of military withholding through military allotment, which requires two months of delinquency), a process can be initiated for income withholding. In addition to payroll deduction or military allotment, income withholding can be accomplished by withholding funds due the NCP from unemployment compensation or federal retirement income.
Problems with Income Withholding
As with other enforcement techniques, income withholding is not a perfect solution for the collection of arrears in all situations. First, an employer may discharge the NCP shortly after the Order/Notice to Withhold Income for Child Support (ONWI) is received. There are estimates that, up to five percent of employers take this action for various reasons, even though it is unlawful, to avoid the trouble of withholding pay or to avoid viewing the person not paying child support as an unsuitable employee. Another problem occurs when an employer withholds the earnings but does not remit them to DCSE. Even though failure to remit subjects employers to a
of event codes. The list became of limited value, however, once the researchers learned that some event codes are
not cross-referenced to specific enforcement methods. The researchers, then, attempted to secure other readily
available information, such as a system documentation manual, which might associate the event codes for a
particular enforcement action. This effort was not productive. To resolve the dilemma, the researchers prepared
flow charts of worker- and system-generated actions for each enforcement method. DCSE staff checked the flow
charts for accuracy and made necessary corrections, yet even they were unable to identify event codes for the flow
charts that corresponded to all associated actions for the selected enforcement methods. As a result, the researchers
were unable to track separately the specific effects of the four enforcement tools on an NCP’s payment history.58 As discussed in Footnote 57, DCSE was unable to provide a complete list of event codes associated with the
specific actions required to implement the four enforcement methods being studied. DCSE staff did provide some
of the event codes for each enforcement action. As an alternative, then, each case in the sample was scrutinized
and, if any of the associated event codes appeared in an NCP’s case, it was assumed that the respective enforcement
action(s) was taken. As a consequence, it is possible for some NCPs that a final enforcement action may not have
been completed, although worker actions that triggered the associated “event codes” were clearly taken during the
two-year period of the study.

Virginia Arrearages Study Page 69
fine, there are estimates that up to 15 percent of employers may fail to remit withheld earnings.
Another problem concerns those employers who do make remittances but do not make them in a timely manner. There are estimates that up to 30 percent of employers are late in making remittances. This can be a significant problem for NCPs, given DCSE’s nine (9) percent interest rate (the rate charged during the period of the study). Late payments credited to an NCP’s account incur the interest charge. In addition, the income withholding procedure can be relatively costly for the NCP, since the employer may charge an administrative processing fee of $5 for each child support withholding. If the monthly support amount is $200, then the $5 fee constitutes two and one-half percent of the withheld amount. The percentage of employers who charge the fee is unknown.
Income withholding is also problematic for the self-employed. Finally, NCPs can and do job-hop, or simply quit a job, to avoid paying support once a withholding action is taken. Some estimates figure the percentage of NCPs who job-hop to avoid paying arrears and current support at between 15 and 20 percent. Job-hopping NCPs, who try to stay one step ahead of income withholding, drain DCSE resources since locating them and restarting the withholding process takes additional time and effort.
Further, implementation of the income withholding process requires multiple events, many of which can be delayed by the NCP if he or she contests any of the required actions. For example, the entire process for a military allotment withholding, even when it proceeds in a relatively smooth manner, can require eight or more weeks. Approximately the same amount of time would be required to implement withholding from a federal retiree’s retirement pay. Interstate income withholding is also more time-consuming and fraught with other problems that delay the payment of current support and arrears.
Liens
“A lien is an encumbrance on real or personal property based on support arrears.”59 A lien lasts for 20 years and can be renewed. A DCSE lien is subordinate to a lien filed by a prior mortgagee or other prior lien. Generally, two conditions exist prior to DCSE filing a lien: The NCP’s arrears must be $500 or more, and “. . . there is evidence that the NCP owns real or personal property located in Virginia.”60 A lien may be filed, but is not required, when there is no evidence of property ownership in Virginia. Processing a lien requires approximately 45 days. Some child enforcement workers estimate that approximately 20 percent of liens do result insome collection during the life of the case. On occasion, the mere presence of a lien motivates the NCP to settle his/her arrears.
59 Virginia Department of Social Services, Division of Child Support Enforcement, DCSE Program Manual,
Chapter 24-5. 60 Ibid.

Virginia Arrearages Study Page 70
As with other enforcement actions, there can be problems with liens. Sometimes, it takes considerable effort to locate property owned by the NCP. For example, the NCP may live in one location yet own property in another location. Long delays can result between the issuance of a lien and the securing of funds to pay for arrears once the property is sold. Another issue is the potential liability to DCSE if a lien is not released once the NCP’s child support case is closed.
Court Enforcement
Court enforcement may be used to initiate any one, or combination, of the following actions to collect arrears:
If an NCP is in arrears and a court order already exists, the arrears create a judgment for the amount of the arrears; this judgment can be satisfied through a lien filed against the NCP’s property.
If a judgment does not exist, a court can order the NCP to post a bond to guarantee payment of support. The NCP posts the bond with the Clerk of Court. Any
default in payment may cause the bond to be forfeited.
The NCP can be committed to a correctional work facility, where the sums earned are used to pay support.
A jail sentence may be imposed on the NCP.
A judicial sale of the NCP’s real or personal property may be forced and the proceeds used to pay the arrears.
If the NCP has fraudulently transferred income and/or property to avoid paying child support, the transfer may be voided to obtain a settlement.
Financial Institution Data Match
Financial Institution Data Match (FIDM) is an enforcement method in which DCSE “ . . . is required to enter into agreements with financial institutions doing business within the Commonwealth for the purpose of conducting a quarterly data match . . . to identify accounts belonging to parents who are delinquent in their child support payments.”61 A financial institution includes, “a depository entity, an entity affiliated part, any federal credit union, state credit union, any benefit association, insurance company, safe deposit company, money market mutual fund or similar entity authorized to do business in the Commonwealth.”62 An account in a financial institution includes, “a demand deposit account, checking or negotiable withdrawal order account, savings account, time deposit account, or money market mutual fund account” that is maintained in the Commonwealth.63
61 Virginia Department of Social Services, Division of Child Support Enforcement, DCSE Program Manual,
Chapter 24, Section O. 62 Public Law 104-193, Title III, Subtitle G, Section 372, D (i).63 Ibid., D (ii).
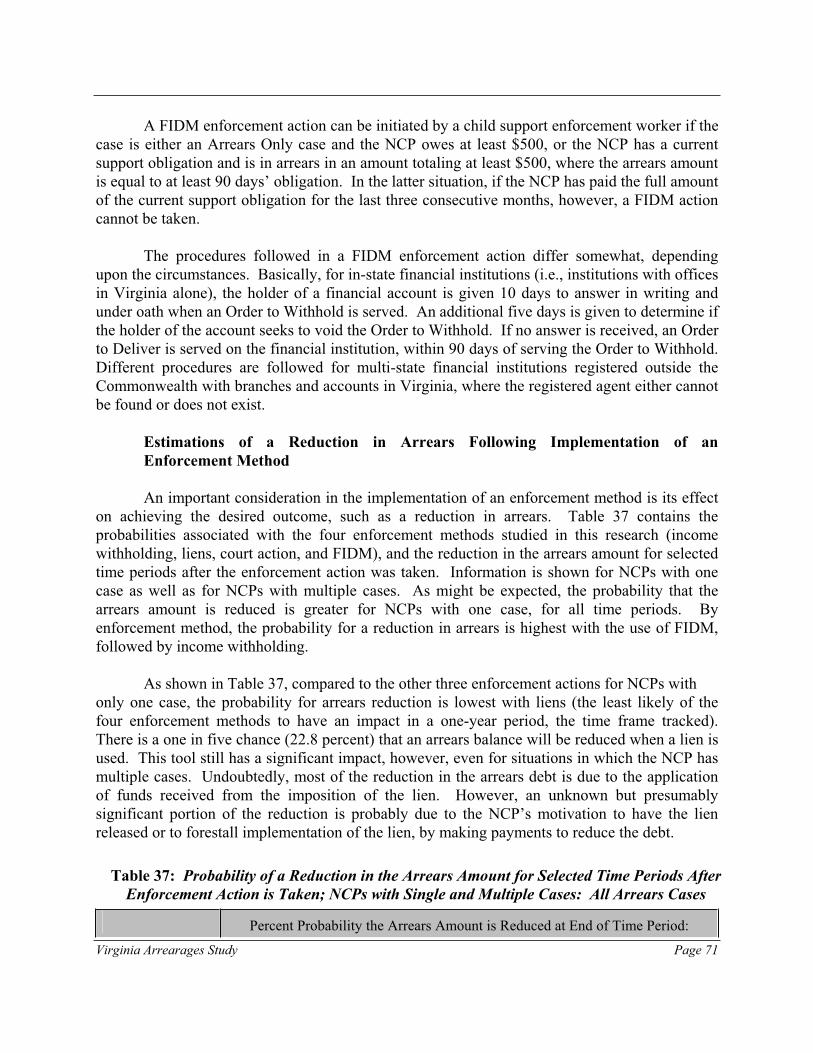
Virginia Arrearages Study Page 71
A FIDM enforcement action can be initiated by a child support enforcement worker if the case is either an Arrears Only case and the NCP owes at least $500, or the NCP has a current support obligation and is in arrears in an amount totaling at least $500, where the arrears amount is equal to at least 90 days’ obligation. In the latter situation, if the NCP has paid the full amount of the current support obligation for the last three consecutive months, however, a FIDM action cannot be taken.
The procedures followed in a FIDM enforcement action differ somewhat, depending upon the circumstances. Basically, for in-state financial institutions (i.e., institutions with offices in Virginia alone), the holder of a financial account is given 10 days to answer in writing and under oath when an Order to Withhold is served. An additional five days is given to determine if the holder of the account seeks to void the Order to Withhold. If no answer is received, an Order to Deliver is served on the financial institution, within 90 days of serving the Order to Withhold. Different procedures are followed for multi-state financial institutions registered outside the Commonwealth with branches and accounts in Virginia, where the registered agent either cannot be found or does not exist.
Estimations of a Reduction in Arrears Following Implementation of an
Enforcement Method
An important consideration in the implementation of an enforcement method is its effect on achieving the desired outcome, such as a reduction in arrears. Table 37 contains the probabilities associated with the four enforcement methods studied in this research (income withholding, liens, court action, and FIDM), and the reduction in the arrears amount for selected time periods after the enforcement action was taken. Information is shown for NCPs with one case as well as for NCPs with multiple cases. As might be expected, the probability that the arrears amount is reduced is greater for NCPs with one case, for all time periods. By enforcement method, the probability for a reduction in arrears is highest with the use of FIDM, followed by income withholding.
As shown in Table 37, compared to the other three enforcement actions for NCPs with only one case, the probability for arrears reduction is lowest with liens (the least likely of the four enforcement methods to have an impact in a one-year period, the time frame tracked). There is a one in five chance (22.8 percent) that an arrears balance will be reduced when a lien is used. This tool still has a significant impact, however, even for situations in which the NCP has multiple cases. Undoubtedly, most of the reduction in the arrears debt is due to the application of funds received from the imposition of the lien. However, an unknown but presumably significant portion of the reduction is probably due to the NCP’s motivation to have the lien released or to forestall implementation of the lien, by making payments to reduce the debt.
Table 37: Probability of a Reduction in the Arrears Amount for Selected Time Periods After
Enforcement Action is Taken; NCPs with Single and Multiple Cases: All Arrears Cases
Percent Probability the Arrears Amount is Reduced at End of Time Period:

Virginia Arrearages Study Page 72
NCP with One Case: NCP with Two or More Cases: Enforcement Method
3 Mos. 6 Mos. 9 Mos. 1 Year 3 Mos. 6 Mos. 9 Mos. 1 Year
Income W/H 24.5% 27.9% 30.3% 30.7% 17.6% 20.7% 22.1% 22.7%
Lien 19.4% 20.8% 21.2% 22.8% 15.5% 16.9% 16.8% 18.3%
FIDM 27.5% 31.2% 32.6% 33.9% 23.1% 26.4% 26.9% 28.1%
Court Action 19.9% 22.7% 25.8% 27.8% 13.4% 16.0% 18.1% 20.0%
Implementation of Selected Enforcement Methods and Type of Arrears Case
Federal guidelines stipulate that all mandated enforcement methods shall be used in appropriate cases. In actual practice, enforcement workers are either unable or choose not to use certain methods. For example, as shown in Table 38, FIDM is used less frequently than the three other methods but, as discussed above, when it is used there is a one in three chance the arrears balance will be reduced after one year. Naturally, FIDM cannot be used if there are no assets to seize. Yet, there appears to be a paradox: While a FIDM action produces the highest benefit, it is used less frequently than the other three enforcement methods. It would also seem that more than 3.6 percent of NCPs owing debt would have funds in financial institutions. In a study of NCPs owing arrears in California, 12 percent had funds in financial institutions; the mean balance of the accounts was only $192.64
Liens are also relatively ineffective unless the NCP either has property or there is a fairly good probability the NCP will acquire property through inheritance or some other means.
There are differences in the use of the four enforcement methods for Arrears Only cases, compared to Current Support plus Arrears cases. The percentage of use is less for Arrears Only cases for all four methods. (See Table 38.)
Table 38: Comparison of Type of Arrears Case in Which Selected
Enforcement Methods Were Used, 1999
% of Cases in Which the Enforcement Method was Used: Type of Case No. of Cases
Court Action FIDM Income W/H Lien
64 Sorensen, Elaine, op. cit., p. 6.

Virginia Arrearages Study Page 73
All Arrears 6,483 17.1% 3.6% 52.0% 13.1%
Arrears Only 1,740 11.2% 3.3% 39.8% 9.5%
Current Support plus Arrears
4,743 19.3% 3.7% 56.5% 14.4%
Amount of Arrears and Selected Enforcement Methods
Table 39 contains data concerning the relative frequency with which the four enforcement methods are used for NCPs owing differing amounts of arrears. As might be expected, all four methods are used less frequently for NCPs with arrears under $500. In addition, liens are used less frequently with NCPs owing less than $1,000 in arrears. Liens are not used in more than 16.4 percent of NCPs’ cases, regardless of the amount of arrears owed. The advantages and disadvantages of using liens as an enforcement tool were discussed earlier. The percentages of NCPs subject to income withholding range from 47 to 56 percent (except for arrears under $500), regardless of the amount of arrears owed.

Virginia Arrearages Study Page 74
Table 39: Percent of All Arrears Cases* in Which Selected
Enforcement Methods Were Used, 1999
Percent of Total Cases in Which Enforcement Method was Used: Amount of Arrears AllCases
Court Action FIDM Income W/H Lien
$1 - $99 288 8.3% 1.4% 37.5% 2.8%
$100 - $499 578 9.0% 1.4% 44.8% 4.7%
$500 - $999 426 14.3% 4.2% 52.1% 10.6%
$1,000 - $4,999 1,821 18.2% 3.4% 56.0% 14.3%
$5,000 - $9,999 1,245 19.6% 4.0% 54.0% 14.9%
$10,000 - $19,999 1,152 19.7% 4.1% 54.0% 15.1%
$20,000 - $29,999 507 19.3% 4.3% 49.3% 16.4%
$30,000 and over 466 15.5% 5.2% 47.0% 14.0%
Total 6,483 17.1% 3.6% 52.0% 13.1%
* Arrears only cases and cases in which the NCP owes current support plus arrears
Arrears Reduction Following Selected Enforcement Methods: Non-TANF/TANF
Case Status
As shown in Table 40, the probabilities of a reduction in arrears were greater following the implementation of each of the four enforcement methods for Non-TANF cases compared to TANF cases. For both types of cases, the probability is greatest with a FIDM enforcement action, yet as noted previously in the discussion of Table 37, this action is taken in less than four (4) percent of all Arrears cases. Income withholding produces the next highest probability of a reduction in arrears in both types of cases. As noted in Table 38, income withholdings are initiated in 52 percent of All Arrears cases, about 40 percent of Arrears Only cases, and 56 percent of Current Support plus Arrears cases. Also shown in Table 38, court enforcement is used in 17 percent of All Arrears cases, which is the second highest in frequency of use among the four methods studied. However, as noted in Table 40, court enforcement is third in the probability of a reduction in arrears amount for both TANF and Non-TANF cases one year after it is used.
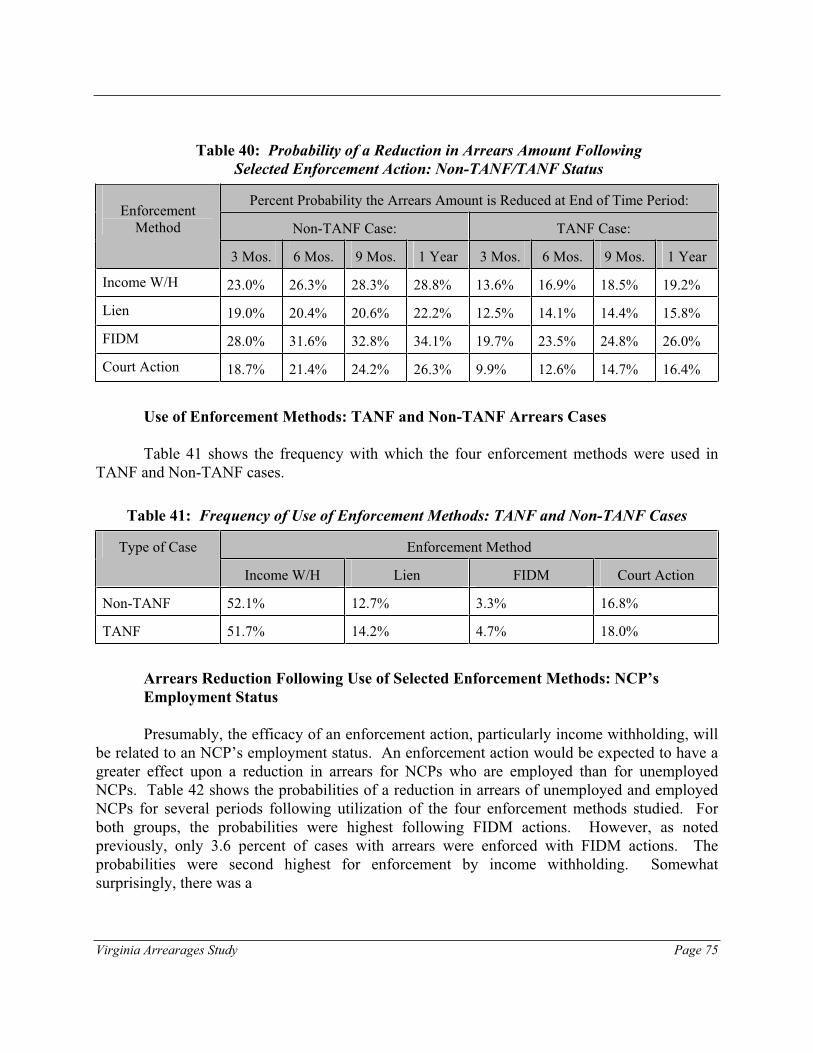
Virginia Arrearages Study Page 75
Table 40: Probability of a Reduction in Arrears Amount Following
Selected Enforcement Action: Non-TANF/TANF Status
Percent Probability the Arrears Amount is Reduced at End of Time Period:
Non-TANF Case: TANF Case:
Enforcement Method
3 Mos. 6 Mos. 9 Mos. 1 Year 3 Mos. 6 Mos. 9 Mos. 1 Year
Income W/H 23.0% 26.3% 28.3% 28.8% 13.6% 16.9% 18.5% 19.2%
Lien 19.0% 20.4% 20.6% 22.2% 12.5% 14.1% 14.4% 15.8%
FIDM 28.0% 31.6% 32.8% 34.1% 19.7% 23.5% 24.8% 26.0%
Court Action 18.7% 21.4% 24.2% 26.3% 9.9% 12.6% 14.7% 16.4%
Use of Enforcement Methods: TANF and Non-TANF Arrears Cases
Table 41 shows the frequency with which the four enforcement methods were used in TANF and Non-TANF cases.
Table 41: Frequency of Use of Enforcement Methods: TANF and Non-TANF Cases
Enforcement Method Type of Case
Income W/H Lien FIDM Court Action
Non-TANF 52.1% 12.7% 3.3% 16.8%
TANF 51.7% 14.2% 4.7% 18.0%
Arrears Reduction Following Use of Selected Enforcement Methods: NCP’s
Employment Status
Presumably, the efficacy of an enforcement action, particularly income withholding, will be related to an NCP’s employment status. An enforcement action would be expected to have a greater effect upon a reduction in arrears for NCPs who are employed than for unemployed NCPs. Table 42 shows the probabilities of a reduction in arrears of unemployed and employed NCPs for several periods following utilization of the four enforcement methods studied. For both groups, the probabilities were highest following FIDM actions. However, as noted previously, only 3.6 percent of cases with arrears were enforced with FIDM actions. The probabilities were second highest for enforcement by income withholding. Somewhat surprisingly, there was a

Virginia Arrearages Study Page 76
difference of only 3.7 percentage points in the probability of debt reduction of unemployed and employed NCPs one year following an income withholding action.
Table 42: Probability of Reduction in Arrears
Following Selected Enforcement Action: NCP’s Employment Status
Percent Probability the Arrears Amount is Reduced at End of Time Period:
Unemployed NCP: Employed NCP: Enforcement
Method
3 Mos. 6 Mos. 9 Mos. 1 Year 3 Mos. 6 Mos. 9 Mos. 1 Year
Income W/H 18.5% 21.9% 23.9% 24.6% 22.7% 25.9% 27.9% 28.3%
Lien 15.6% 17.2% 17.6% 19.3% 19.1% 20.3% 20.4% 22.0%
FIDM 23.7% 27.6% 28.9% 30.4% 28.5% 32.0% 33.1% 34.3%
Court Action 14.6% 17.4% 19.9% 22.0% 18.4% 21.1% 23.8% 25.7%
Use of Enforcement Methods: Unemployed and Employed NCPs
Some enforcement methods are more frequently used for employed NCPs, such as income withholding. However, that method is also appropriate if the unemployed NCP is collecting unemployment compensation or receiving retirement income from a military or civil service benefit pension. Table 43 shows that compared to unemployed NCPs, income withholding is used 50 percent more frequently with NCPs who are employed. A comparison of the frequency of use of the other three enforcement methods for unemployed and employed NCPs is also shown in the table. As might be expected, the other three methods are also used more frequently for employed NCPs; yet, the differences are not as great as they are for income withholding.
Table 43: Frequency of Use of Enforcement Methods: Unemployed and Employed NCPs
Enforcement Method Type of Case
Income W/H Lien FIDM Court Action
Unemployed 40.6% 12.2% 3.1% 15.4%
Employed 60.9% 13.8% 4.0% 18.4%
Arrears Reduction Following Use of Selected Enforcement Methods: Race
Table 44 shows the probability of a reduction in arrears by NCP race following the implementation of the four enforcement methods. One year following the implementation of the enforcement methods, there is a 3.2 to 6.1 percentage point difference in the probability of a

Virginia Arrearages Study Page 77
reduction in arrears between white and non-white NCPs, depending upon the method used. The smallest and largest differences in the probabilities were achieved, respectively, through the use of FIDM and income withholding.
Table 44: Probability of a Reduction in the Arrears Amount After
Enforcement Action is Taken: NCP’s Race
Percent Probability the Arrears Amount is Reduced at End of Time Period:
White: Non-White:Enforcement
Method
3 Mos. 6 Mos. 9 Mos. 1 Year 3 Mos. 6 Mos. 9 Mos. 1 Year
Income W/H 24.7% 28.6% 30.9% 31.8% 20.3% 23.5% 25.3% 25.7%
Lien 20.3% 22.0% 22.4% 24.3% 16.9% 18.1% 18.3% 19.8%
FIDM 27.7% 31.8% 33.4% 35.0% 26.3% 29.7% 30.7% 31.8%
Court Action 19.4% 22.4% 25.4 27.6% 16.1% 18.7% 21.2% 23.1%
District Office Use of Enforcement Methods
In Virginia, child support enforcement is state-based; the caseload is worked in 22 local or “district” (i.e., based on existing judicial districts) offices. Virginia uses both administrative and judicial process. In June 2001, the total DCSE caseload was 389,168. By District Office, the monthly caseload size ranged from a low of 6,193 (Alexandria CSE) to a high of 26,173 (Richmond CSE).
As shown in Table 45, there are considerable differences among the District Offices in the percentage of cases for which the four enforcement methods are used. For court enforcement, the percentages range from 4.4 to 28.9 percent of cases, a multiple of 6.5. For FIDM, there is a 9-fold difference; usage ranges from a low of 1.1 percent to a high of 10 percent of cases. The smallest percentage differential in use is for income withholding – less than twice as often (from 37.1 percent, lowest rate of use, to 65.1 percent, the highest). The largest percentage differential is for liens, almost 13 times from the lowest percentage, 2.2, to the highest, 27.7.

Virginia Arrearages Study Page 78
Table 45: District Office Use of Selected Enforcement Methods1
District Office Arrears Cases2
% of Cases in Which the Collection Method was Used:
No. % of
Total
Court
Action*
FIDM* Income W/H* Lien*
Abingdon 278 4.2% 7.2% 1.1% 37.1% 7.9%
Virginia Beach 388 5.9% 20.9% 3.9% 45.9% 16.0%
Portsmouth 282 4.3% 25.5% 4.6% 58.2% 8.2%
Charlottesville 217 3.3% 12.4% 1.8% 50.2% 11.1%
Fredericksburg 235 3.6% 17.9% 1.7% 47.2% 10.2%
Verona 231 3.5% 23.4% 3.5% 48.1% 12.1%
Richmond 558 8.5% 14.3% 2.9% 56.1% 9.7%
Henrico 395 6.0% 13.4% 1.3% 49.4% 16.5%
Chesapeake 286 4.4% 9.8% 4.5% 52.1% 18.9%
Fairfax 231 3.5% 9.1% 2.2% 45.5% 9.1%
Manassas 178 2.7% 14.0% 8.4% 60.1% 9.0%
Winchester 86 1.3% 16.3% 2.3% 65.1% 3.5%
Alexandria 45 0.7% 4.4% 2.2% 51.1% 2.2%
Arlington 241 3.7% 11.6% 6.2% 53.5% 24.5%
Hampton 564 8.6% 26.8% 6.4% 62.2% 27.7%
Norfolk 302 4.6% 7.3% 2.0% 48.7% 7.0%
Lynchburg 452 6.9% 18.8% 1.1% 48.5% 5.5%
Danville 358 5.5% 7.5% 4.5% 55.0% 17.6%
Newport News 325 5.0% 23.4% 3.1% 52.9% 18.5%
Petersburg 235 3.6% 28.9% 3.0% 51.1% 4.3%
Suffolk 452 6.9% 21.0% 3.3% 50.7% 5.1%
Roanoke 211 3.2% 21.3% 10.0% 53.1% 16.1%
TOTAL 6550 100.0% 17.1% 3.6% 52.4% 13.0%
1 Enforcement methods used at any time during the study period 2 Arrears cases from July 1999
* The percentage of cases in which this enforcement method was used is dependent upon the District Office and
is significant at the 0.05 level.
Effects of Selected Enforcement Methods on Payment Frequency and Amount
Table 46 shows the relationship of case type and enforcement method on the percentage of NCPs making a payment in both 3- and 12-month periods. It also shows the mean dollar amount of payments in both periods.

Vir
gin
ia A
rrea
rag
es S
tud
y
Pa
ge
79
Ta
ble
46
:F
ou
r E
nfo
rcem
ent
Met
ho
ds:
Pa
ymen
t F
req
uen
cy a
nd
Am
ou
nt
Case
Ty
pe
Co
urt
Act
ion
F
IDM
Inco
me
W/H
L
ien
% M
ak
ing
a
Pa
ym
ent
Wit
hin
:
$ M
ean
Pa
ym
ent
Am
ou
nt:
% M
ak
ing
a
Pa
ym
ent
Wit
hin
:
$ M
ean
Pa
ym
ent
Am
ou
nt:
% M
ak
ing
a
Pa
ym
ent
Wit
hin
:
$ M
ean
Pa
ym
ent
Am
ou
nt:
% M
ak
ing
a
Pa
ym
ent
Wit
hin
:
$ M
ean
Pa
ym
ent
Am
ou
nt:
3
M
os.
12
Mo
s.3
Mo
s.1
2M
os.
3M
os.
12
Mo
s.3
Mo
s.1
2M
os.
3M
os.
12
Mo
s.3
Mo
s.1
2M
os.
3M
os.
12
Mo
s.3
Mo
s.1
2M
os.
AD
C
53
%
68
%
$1
99
$
16
5
52
%
72
%
$2
84
$
23
3
59
%
77
%
$1
91
$
16
6
55
%
70
%
$2
29
$
17
6
AR
RN
3
7%
6
2%
$
11
7
$1
22
6
7%
9
3%
$
10
4
$1
82
6
0%
7
9%
$
14
0
$1
34
4
0%
6
4%
$
20
7
$1
35
AR
RP
3
9%
5
7%
$
24
4
$1
90
5
5%
7
3%
$
15
4
$2
01
4
4%
6
3%
$
17
9
$1
55
4
3%
6
3%
$
26
4
$1
99
FC
1
7%
3
3%
$
16
0
$9
7
10
0%
1
00
%
$5
$
39
3
2%
4
8%
$
60
$
57
2
5%
2
5%
$
94
$
10
0
MA
OF
6
0%
7
6%
$
21
6
$2
09
7
1%
8
6%
$
26
3
$2
35
6
9%
8
5%
$
25
3
$2
29
5
4%
7
4%
$
24
6
$2
18
MA
OP
7
5%
7
5%
$
16
8
$1
70
1
00
%
10
0%
$
55
$
55
6
8%
7
7%
$
12
2
$1
19
6
7%
6
7%
$
14
5
$2
00
MS
O
0%
1
00
%
--
$1
50
--
--
--
--
5
0%
1
00
%
$6
3
$1
06
1
00
%
10
0%
$
63
$
63
NA
DC
6
2%
8
0%
$
28
2
$2
70
6
8%
8
2%
$
31
9
$3
44
7
3%
8
7%
$
26
6
$2
66
6
0%
7
8%
$
27
6
$2
55
NIV
D
--
--
--
--
--
--
--
--
--
--
--
--
--
--
--
--
SL
FC
0
%
10
0%
--
$
24
--
--
--
--
4
0%
8
0%
$
40
$
32
0
%
0%
--
--
Av
erag
e 5
6%
7
4%
$
24
4
$2
26
6
5%
8
0%
$
25
8
$2
71
6
6%
8
1%
$
23
7
$2
24
5
4%
7
3%
$
25
7
$2
23
A
DC
=
TA
NF
cas
es
M
AO
P
= M
edic
aid
On
ly-r
elat
ed c
ase,
CS
E s
vcs
. fo
r M
edic
aid
alo
ne
AR
RN
=
N
on
-TA
NF
cas
es w
/ ar
rear
s o
nly
MS
O
=
M
edic
al S
up
po
rt O
nly
(i.
e.,
CS
E w
ork
s ca
se f
or
med
ical
in
sura
nce
only
)
AR
RP
=
T
AN
F c
ase
w/
arre
ars
on
ly
NA
DC
=
N
on
-TA
NF
FC
=
Fo
ster
Car
e ca
ses
N
IVD
=
No
n-I
V-D
cas
es
MA
OF
=
M
edic
aid
On
ly-r
elat
ed c
ase,
fu
ll C
SE
svcs
. S
LF
C
=
S
tate
an
d L
oca
l F
ost
er C
are
case
s

Virginia Arrearages Study Page 80
Responses to Hypotheses
Early in this report, 11 hypotheses were developed from basic assumptions that relate to the primary and contributory causes of arrears (see Exhibit 1, page 2). The project’s research design and data analyses were used to test these hypotheses.
Hypothesis 1: Charging Fees on Arrears Cases (e.g., for intercepting tax refunds) Increases
the Difficulty of Collecting Payments. NOT SUPPORTED
This research found no substantive evidence that fees charged on arrears cases increased the difficulty of collecting payments on arrears. In fact, in the study sample, the mean amount of fees for All Arrears cases was $13 in 1999 and $17 in 2001. (See Table 29.)
Hypothesis 2: Charging Interest on Arrears Balances is an Effective Strategy for the
Commonwealth and CPs to Motivate NCPs to Pay.
NOT SUPPORTED
Virginia law requires charging interest on past-due child support at the state’s “judgment” rate. The effectiveness of the law, however, is subject to question. There are two problems with its implementation. First, arrears continue to accumulate for NCPs who either suffer cuts in their pay or become unemployed (e.g., lose their job, are incarcerated). Second, the amount of interest charged (9 percent, through June 2004; reduced to 6 percent effective July 2004) exceeds market rates. The result is that additional debt accumulates because of the state’s interest rate. For example, between 1999 and 2001, NCPs who owed Current Support plus Arrears had a 4.4 percent increase in total debt that included a 37.8 percent increase in interest owed (see Table 35). NCPs who owed Arrears Only had a 15.9 percent decline in total debt that, nevertheless, included a 12.9 percent increase in interest owed. In effect, interest becomes a noose tying an NCP to a debt that may never be satisfied.
Hypothesis 3: Large Arrears Balances Result from Large Support Order Amounts.
SUPPORTED For ARREARS BALANCES $5000 +
Large support order amounts are related to arrears occurrence when the debt amount is $5,000 or more. For arrears balances below $5,000, there is no relationship to the support order amount. (See Table 20.)

Virginia Arrearages Study Page 81
Hypothesis 4: NCPs Who Owe Arrears Are Either Young or Elderly.
NOT SUPPORTED
Contrary to this hypothesis, neither those in the youth labor market (16 to 24 years of age)nor seniors (65 and over) represent a significant portion of NCPs who owe debt. Instead, 94.2 percent of the NCPs owing arrears are in their “prime” or “near-prime” earning years, ages 25 through 54 (see Table 2).
Hypothesis 5: Proportionately, Female NCPs Owe More Arrears Than Male NCPs.
NOT SUPPORTED
Compared to males, a smaller percentage of female NCPs owe arrears. That is, female NCPs are under-represented among those owing arrears, constituting 12 percent of those owing child support and only 7.4 percent of those owing arrears. Alternately, while 88 percent of NCPs paying child support in the Commonwealth are male, 92.6 percent of NCPs owing arrears are male (see Table 4).
Hypothesis 6: Race is a Factor in NCPs Being Unable to Pay Current Support and, Thus,
Incurring Arrears. NOT SUPPORTED
Contrary to general labor force statistics in Virginia65, among NCPs who owe arrears, black NCPs have the highest employment rate at 59.7 percent, followed by white NCPs at 49.4 percent, and by NCPs of Hispanic origin at 40.9 percent. (See Table 3.) White NCPs constitute 35 percent of all NCPs owing child support and 32 percent of the NCPs who owe arrears. The respective percentages for black NCPs are 53 percent and 61 percent, and for NCPs of Hispanic origin the percentages are 4 percent and 1 percent. Both Native American and Asian NCPs represented less than 1 percent of NCPs owing either child support or arrears. Race was unknown for 8 percent of the NCPs who owe child support and 6 percent of those who owe arrears (see Table 10). Black NCPs represent 60.8 percent of all the NCPs who owe arrears and owe appreciably less of the total debt (53.5 percent). On the other hand, white NCPs represent 32 percent of NCPs owing arrears and owe 36.6 percent of the total debt. There are no significant differences among NCPs of various races in the percent who made payments within 3 months and 12 months. (See Table 12.)
65 The labor force participation rate of black men in Virginia was several percentage points lower than the rate for
white men (71.8 percent and 75.9 percent, respectively). See Table 3. Furthermore, black men experienced a
significantly higher rate of unemployment compared to white men (4.9 percent and 1.8 percent, respectively). In
addition, white male earnings are significantly higher than black males earnings. In 1999, white males’ earnings
were 30.7 percent greater than black males’ earnings. The differential based on race also occurs among females,
although it is smaller: In 1999, white females’ earnings were 18.1 percent higher than black females’ earnings.

Virginia Arrearages Study Page 82
Hypothesis 7: Proportionately, NCPs Who Have Multiple Support Orders Owe More Arrears
Than NCPs Who Have Single Support Orders. NOT SUPPORTED
In 2001, in the arrears sample, 57.1 percent of the NCPs had one case, 24.2 percent had two cases, 10.9 percent had three cases, and 7.3 percent had four or more cases. NCPs with one support order represented 57.1 percent of NCPs owing arrears, owed 63.4 percent of the total debt, and represented the largest percentage of NCPs with arrears who made a payment within 12 months (72.4 percent). See Table 19. That compared with 69.8 percent of NCPs with two orders, 61.4 percent of NCPs with three orders, 55.4 percent of those with four orders, and 43.2 percent of those with five or more orders. (These percentages are all significant at the 0.05 level.) Finally, compared with NCPs who have only one support order, NCPs with multiple support orders made smaller payments within both 3- and 12-month periods.
Hypothesis 8: NCPs Who Have Large Arrears Amounts Are Less Likely to Pay Current
Support and Arrears. SUPPORTED
Hypotheses 8 and 9 address the effect of arrears balances on payments. NCPs who owe less than $5,000 in arrears represent 48 percent of all NCPs in arrears; they owe less than 10 percent (8.6%) of the total debt. In contrast, NCPs who are $20,000 or more in arrears represent 15 percent of all NCPs in arrears and owe 52 percent of the total debt (see Table 21).
Hypothesis 9: Large Arrears Balances Dissuade NCPs From Making Payments.
SUPPORTED
There is a significant relationship between arrears balances and the percentage of NCPs who made a payment within 12 months. As the size of the arrears balance increases, the frequency of payments decreases. (See discussion for Proposition 31 and Table 22.) In conjunction with the findings related to Hypothesis 8, this finding strongly argues for the prevention of large-arrears accumulations.
Hypothesis 10: Basing Federal Incentive Payments on State Performance in Collecting
Arrears Is a Realistic Strategy.66 OUTSIDE SCOPE OF STUDY
Partially to stimulate states’ efforts to increase their collection of arrears, a federal incentive system based on performance indicators was developed and implemented to
reward states’ child support collections.67 A paramount issue here is whether the arrears
66 Latus, Justin, op. cit., p. 3.67
Among the five performance indicators used to calculate federal incentive payments to states is performance in
collecting arrears. This indicator is calculated by dividing the number of cases during the fiscal year in which some
arrearage is collected by the total number of cases in which arrears are owed. To receive the highest incentive
payment, this quotient must equal 80 percent.

Virginia Arrearages Study Page 83
performance indicator will motivate increased efforts by states to collect arrears68,especially when the indicator is not easily achieved. For example, in 1999, there were 9 million cases in the U.S. with arrears, where 54 percent of the NCPs in these cases made some payment during the year.69 By contrast, 69 percent of the NCPs in the Virginia arrears sample made a payment during the period from July 2000 to July 2001 (see Table 24). While this figure exceeds the collective national performance, it is still 11 percentage points short of the 80 percent mark required by the federal incentive. As discussed in Hypotheses 8 and 9, as arrears balances increase, the frequency of payments declines. To achieve the 80 percent target and qualify for incentive payments, states would be well advised to take actions to minimize the accumulation of large arrears in order to increase the probability that more NCPs will make payments within 12 months.
Hypothesis 11: The Accrual of Arrears is Often Due to Factors Beyond States’ Control.
SUPPORTED
As shown in Exhibit 1 and demonstrated by several other hypotheses, there are both primary and contributory causes beyond the direct control of the states, such as the NCP’s motivation not to pay or the agency staffing level (which translates into caseload size per Specialist). Nevertheless, as this research clearly demonstrates, accumulation of child support debt is a perplexing yet manageable problem, requiring attention to the major causes: (1) one’s (economic) ability to pay, (2) whether there is an established pattern of regular payment, (3) the amount of debt already accrued, and (4) the interest rate charged, if any, on overdue support.
68 Latus, Justin, op. cit., p. 3.69 Latus, Ibid.

Virginia Arrearages Study Page 84
Findings, Conclusions, and Recommendations
The conclusions drawn from this research study are based on the following: (1) findings from a review of federal and Virginia child support policies and procedures, (2) information provided by focus groups of experienced Virginia personnel and a literature review, (3) the “Research Findings” section, and (4) the “Responses to Hypotheses” section. This section presents conclusions and recommendations for improvement in the following areas:
Legal issues
Demographic characteristics (i.e., age, gender, employment status, race) of NCPs in sample
Case characteristics of NCPs owing arrears
Enforcement methods.
Legal Issues
Virginia law requires interest to accrue “on all support payments collected by the Department.”70 For low-income obligors, the addition of interest to an already sizeable debt can create barriers to payment and additional enforcement issues. Reduction of the state’s judgment (i.e., interest) rate from nine to six percent in July 2004 will help address part of this problem. For TANF cases, research indicates that when child support is disbursed directly to the family, some fathers are more likely to pay support.71
Recommendation: For TANF debt, DCSE might benefit from examining whether it can use arrearages as a negotiating tool to reward compliance with the future support obligation and other conditions, by compromising all or a portion of the arrears.
Virginia’s case closure rules (which are based on federal statutes) may contribute to the accrual of arrears. 22 V.A.C. 40-880-270(E) (3) requires the Department to cease withholding earnings if the whereabouts of the child, or the child and caretaker, become unknown. The regulation provides no guidance regarding the duration of the disappearance of the child. Recommendation: Federal statutes should be changed to allowing amending Virginia statutes to define a minimum period for the disappearance of the child, or child and caretaker, before case closure may be initiated.
70 Code of Virginia § 63.2-1952.71 CLASP, Reauthorization Issues, op. cit.

Virginia Arrearages Study Page 85
Demographic Characteristics of NCPs in Sample
Age Considerations
Neither those in the youth labor market (16 to 24 years of age) nor senior members of the labor market (65 and over) represent a significant portion of NCPs who owe debt. Instead, 94.2 percent of NCPs owing arrears are in the prime and near-prime earning ages of 25 through 54 (see Table 2).
There is a significant relationship between an increase in NCP age and a declining percentage of NCPs who make a payment on arrears or current support within 12 months. Payment percentage drops precipitously from two-thirds (67.3%) for NCPs in the 45-54 age group to one-half (51.3%) for age 55 forward. Recommendation: APECS should flag and Specialists monitor closely those cases where the NCP is approaching the “payment drop-off” age of 54.
Gender
Eighty-eight percent (88%) of the NCPs paying child support in the Commonwealth are male, yet 92.6 percent of the NCPs who owe arrears are male (see Table 4).
Female NCPs who owe arrears have smaller support order amounts than their male counterparts. The mean order amounts for males and females are $220 and $142, respectively. (See narrative for Proposition 4.)
Compared to male NCPs who owe arrears, a smaller percentage of female NCPs made payments within 12 months, and the mean amounts of their payments were smaller. The percentages and payment amounts, both of which were significantly different, were 56.7 percent and $159 for females and 69.9 percent and $237 for males (see Table 5).
Employment Status
The Joint Legislative Audit and Review Commission of the Virginia General Assembly estimates 62 percent of NCPs in the Commonwealth who owe child support are employed, compared with 56.4 percent of the NCPs who owe arrears (see Table 7). In a recent California study, 59 percent of the NCPs who owed arrears had income in 1998 (the year study data were collected). In Colorado, an experimental study of NCPs who owed arrears found that 46.9 percent had a verified employer.
Virginia Arrearages Study Page 86
Compared to NCPs owing arrears in TANF cases, employment rates are higher among NCPs owing arrears in Non-TANF cases. The rates are 54.2 percent (TANF) and 57.1 percent (Non-TANF). (See Table 7).
NCPs who are employed and owe arrears have a 13 percent higher support obligation than unemployed NCPs who owe arrears. The amounts are $227 and $201, respectively. (See discussion on Proposition 9.)
Employed NCPs represent 56.4 percent of the NCPs who owe arrears and are responsible for 48.3 percent of total arrears. Conversely, unemployed NCPs comprise 43.6 percent of NCPs owing arrears and owe 51.7 percent of total arrears (see Table 8).
The percentage of employed NCPs who owe arrears and made a payment within 12 months (79.7%) is greater than the percentage of unemployed NCPs who made a payment (55.2%). The difference is significant. (See Table 8).
There is no significant difference in the mean amounts of payments made within 12 months by NCPs who were employed compared to mean payments by unemployed NCPs. The mean amounts were $234 for employed NCPs and $232 for unemployed NCPs (see Table 8).
The percentage of employed NCPs who made a payment within 12 months is larger than the percentage of unemployed NCPs making a payment. Further, the difference increases as the amount of arrears increases. The differences, which are significant, ranged from 15 percent for arrears between $500 and $999 (inclusive) to 60 percent for arrears $30,000 and over. (See discussion of Proposition 13.)
NCP Gender and Employment
A slightly larger percentage of men than women who owe arrears are employed: 55.7 percent for men and 53.3 percent for women (see Table 3).
Race
White NCPs constitute 35 percent of all NCPs owing child support and 32 percent of NCPs who owe arrears. The respective percentages for black NCPs are 53 percent and 61 percent, and for NCPs of Hispanic origin, the percentages are 4 percent and 1 percent.Native American and Asian NCPs represented less than 1 percent of NCPs owing child support or arrears. Race was unknown for 8 percent of NCPs who owe support and 6 percent of those who owe arrears. (See Table 10.)

Virginia Arrearages Study Page 87
Mean support order amounts for NCPs of different races are, in ascending order: black, $195; Native American, $201; white, $254; Hispanic origin, $267; and Asian, $285. (See discussion of Proposition 17.)
Sixty-nine percent (69%) of Hispanic NCPs who owe arrears have only a single case.This percentage is slightly exceeded by the 70.6 percent of Asian NCPs with a single case. For white and black NCPs, the percentages with a single case are 60.1 and 45.7, respectively (see Table 11).
NCPs of Hispanic origin owe a slightly larger percentage of total debt than their percentage representation among NCPs who owe debt (1.1 percent and 1.2 percent, respectively). Black NCPs represent 60.8 percent of all NCPs who owe arrears yet owe appreciably less total debt (53.5 percent). On the other hand, white NCPs represent 32 percent of NCPs owing arrears yet owe 36.6 percent of the total debt. Data pertaining to Native American and Asian NCPs involve numbers too small to include in this analysis. (See Table 12.)
There are no significant differences among NCPs of various races in the percentages that made payments within 3 months and 12 months (see Table 12.)
Race and Employment
The labor force participation rate72 of black men in Virginia was several percentage points lower than the rate for white men (71.8 percent vs. 75.9 percent). (See Table 3.)
In Virginia, black men experienced a significantly higher rate of unemployment compared to white men (4.9 percent and 1.8 percent, respectively, in Table 3). In addition, white males’ earnings are significantly higher than black males’ earnings. In 1999, white males’ earnings were 30.7 percent higher than black males’ earnings.73 The differential based on race also occurs among females, although it is smaller. In 1999, white females’ earnings were 18.1 percent higher than the earnings of black females.
Among NCPs who owe arrears, black NCPs have the highest employment rate at 59.7 percent, followed by white NCPs at 49.4 percent. NCPs of Hispanic origin have the lowest rate of employment, at 40.9 percent. (See Table 3.)
72 “Participation rate” is the percentage of the respective group that is in the labor force. The labor force consists
of those persons in the Virginia civilian non-institutional labor force 16 and older who are either employed or
unemployed and actively sought work in the four weeks preceding the government survey that determines the area’s
employment situation. 73 U.S. Bureau of Labor Statistics, Employment status..., Ibid.

Virginia Arrearages Study Page 88
Case Characteristics of NCPs Owing Arrears
NCPs Owing Arrears Only and Current Support Plus Arrears
NCPs who owe Arrears Only and NCPs who owe Current Support plus Arrears represent 27.4 percent and 72.6 percent, respectively, of NCPs who owe arrears (see Table 13).
TANF and Non-TANF Composition
The DCSE caseload is comprised of Non-TANF (75 percent), TANF (22 percent) and Other (2 percent) cases. The arrears sample caseload is 75.3 percent Non-TANF, 23.2 percent TANF, and 1.6 percent Other cases. (See Table 14.)
Last Order in Case File
Of the 6,378 NCPs in the sample cohort, 0.6 percent had a consent order shown as the last order in their case file, 20.6 percent had an administrative order, and 78.8 percent had a court order. (See Table 15.)
Single and Multiple Cases
In 2001, in the arrears sample, 57.1 percent of NCPs had one case, 24.2 percent had two cases, 10.9 percent had three cases, and 7.3 of the NCPs had four or more cases (see Table 17). Comparatively, in the total DCSE caseload, 76 percent of NCPs have only onecase, 18 percent have two cases, 5 percent have three cases, and 1 percent have four or more cases (also, Table 17).
NCPs who owe arrears on a single case represent 54.2 percent of NCPs who owe arrears and constitute 56.6 percent of those owing arrears of $10,000 - $19,999, 64.7 percent of those owing $20,000 - $29,999, and 68.6 percent of those owing $30,000 or more. In contrast, the 39.7 percent of NCPs with multiple cases owe 47.4 percent of the arrears from $1,000 - $4,999 and 47.0 percent of the arrears from $5,000 - $9,999. Compared to NCPs who owe arrears on a single case, then, NCPs with multiple cases are under-represented among NCPs owing arrears in the higher categories and over-represented in the lower categories of arrears. (See Table 18.)
NCPs who have only one support order represent 57.1 percent of all NCPs owing arrears, but they owe 63.4 percent of the total debt. (See Table 19.)

Virginia Arrearages Study Page 89
72.4 percent of NCPs with only one support order make a payment within 12 months compared to 69.8 percent of those with two support orders, 61.4 percent for those with three, 55.4 percent of those with four, and 43.2 percent for those with five or more. These percentages are significantly different. (See Table 19.)
Compared to NCPs with only one support order in arrears, NCPs with multiple support orders make smaller payments within both 3 months and 12 months (see Table 19).
Arrears Balances
NCPs who owe less than $5,000 in arrears represent 48.0 percent of all NCPs in arrears but owe only 8.6 percent of the total debt. NCPs who are $20,000 or more in arrears represent 15 percent of all NCPs in arrears and owe 52.0 percent of the total debt. (See Table 21.)
There is a significant relationship between arrears balances and the percentage of NCPs who made a payment within 12 months: As the size of the arrears balance increases, the frequency of payments decreases. (See discussion on Proposition 31.)
Arrears Only Compared to Current Support Plus Arrears
The percentage of NCPs who owe Current Support plus Arrears and make a payment within 12 months decreases as the arrears balance increases. (See Table 23.)
Compared to NCPs who owe Arrears Only, significantly larger percentages of NCPs who owe Current Support plus Arrears make a payment within 12 months for all dollar categories of arrears. (See Table 23.)
Payments Made in Arrears Cases: Virginia Compared to U.S.
From July 2000 to July 2001, compared to 54 percent of NCPs nationwide, 69.0 percent of Virginia NCPs who owed arrears made a payment. (See Table 24 and discussion of Proposition 35.)
Payments Made: Interstate vs. In-State Cases
As a group, a larger percentage of NCPs with interstate cases (71.1%) made a payment within 12 months compared to NCPs with in-state cases (68.3%). This difference was statistically significant. (See Table 24.)

Virginia Arrearages Study Page 90
The mean payment amount for payments made in 12 months in interstate and in-state cases was $269 and $219, respectively (see Table 24).
TANF vs. Non-TANF
NCPs with TANF-related debt constitute 24.2 percent of NCPs owing arrears yet owe 19.5 percent of the total debt. Conversely, NCPs who have Non-TANF-related debt represent 74.7 percent of NCPs owing arrears and owe 79.7 percent of the total debt.(See Table 26.)
Compared to NCPs owing TANF-related debt, a significantly larger percentage of NCPs who owe Non-TANF-related debt made a payment within 12 months. (Table 26.)
With the exception of NCPs with Non-TANF Arrears Only cases (ARRN), the mean dollar amount of payments made within 12 months is larger for NCPs owing Non-TANF-related debt (Table 26).
Interest and Total Debt
As NCPs transition from owing Current Support plus Arrears to owing Arrears Only, interest as a percent of debt increases. For example, in 1999, interest was 26.4 percent of total debt for NCPs who owed Arrears Only (see Table 30). The percentage for NCPs who owed Current Support plus Arrears was 21.3 percent in the same year (see Table 32).For 2001, interest was 35.5 percent of total debt in Arrears Only cases (Table 31) and 28.2 percent for Current Support plus Arrears cases (Table 33).
From 1999 to 2001, the total debt owed in Current Support plus Arrears cases increased about $2 million, which increase included $3.9 million in interest (see Table 34). During the same period, NCPs who owed Arrears Only saw a decline of $2.6 million in their total debt, which included an increase of about $560,000 in interest owed (see Table 34).
In percentage terms, between 1999 and 2001, NCPs who owed Current Support plus Arrears had a 4.4 percent increase in total debt that included a 37.8 percent increase in interest owed. NCPs who owed Arrears Only had a 15.9 percent decline in total debt that included a 12.9 percent increase in interest owed. (See Table 35.)
Mean Amount of Debt Owed, 1999 and 2001
The mean amount of NCP debt for 1999 and 2001 was $9,879 and $11,850, respectively (see Table 29).
Virginia Arrearages Study Page 91
Effect of Fees
There is no evidence that the assignment of fees to arrears cases increases the difficulty in collecting payments on arrears. The mean amount of fees for all arrears cases in the sample was $13 and $17 for 1999 and 2001, respectively (see Table 29).
Effect of Interest on NCP Debt
Charging interest on arrears substantially adds to NCPs’ mean debt. From 1999 to 2001, the amount of interest as a percent of total arrears increased from 22.6 percent to 29.7 (see Table 34). In monetary terms, from 1999 to 2001, the total arrears owed declined by about $400,000 ($64.7 - $64.3 million), yet the amount of interest owed increased by about $4.5 million ($19.1 - $14.6 million). This situation occurred in spite of a decline in the number of NCPs in the arrears sample by 1,332. In summary, from 1999 to 2001, the number of NCPs declined 20.0 percent, the total arrears owed declined by 0.7 percent, yet the amount of interest owed increased by 30.8 percent.
Enforcement Methods
Enforcement Actions and Single/Multiple Cases
The percent probability that an arrears amount is reduced within 12 months using four selected enforcement methods is higher for NCPs with one case than for NCPs with two or more cases. The probability is highest with the use of FIDM (33.9%), followed by income withholding (30.7%). (See Table 37.)
For NCPs with one case, the probabilities of arrears reductions within 12 months are least with liens: There is about a one in five chance (22.8 percent) that the arrears balance will be reduced when a lien is used (see Table 37).
Use of Liens
Liens are not used in more than 16.4 percent of NCPs’ cases, regardless of the amount of arrears owed (see Table 39).
Income Withholding
The percentage of NCPs subject to income withholding ranges from 37.5 percent to 56.0 percent, depending on the amount of arrears owed. (See Table 39.)

Virginia Arrearages Study Page 92
Enforcement Methods: Non-TANF/TANF Case Status
The probability of a reduction in arrears amount is higher for Non-TANF cases than for TANF cases following implementation of each of the four enforcement methods. (See Table 40.)
For both TANF and Non-TANF cases, while the probability of a reduction in arrears is highest with a FIDM enforcement action, of the four methods studied FIDM is used least frequently. (See Tables 40 and 41.)
Income withholding produces the second highest probability of a reduction in arrears for both TANF and Non-TANF cases (see Table 40).
Effects of Selected Enforcement Methods: NCP Employment Status
For both employed and unemployed NCPs, the probability of a reduction in arrears is highest following FIDM actions; however, FIDM is only used for 3.1 percent of unemployed NCPs and 4.0 percent of employed NCPs. (See Tables 42 and 43.)
For both employed and unemployed NCPs, the probability of a reduction in arrears is second highest using income withholding. There is a difference of only 3.7 percentage points in the probability of debt reduction in 12 months for employed and unemployed NCPs, following an income withholding action. (See Table 42.)
Use of Selected Enforcement Methods: NCP Employment Status
Income withholding is used 50 percent more frequently with NCPs who are employed 60.9%) than with NCPs who are unemployed (40.6%). (See Table 43.)
For court actions, the percentage use for employed and unemployed NCPs is 18.4 and 15.4 percent, respectively. For liens, the percentages are 13.8 and 12.2 percent, respectively; and for FIDM the percentages are 4.0 and 3.1 percent, respectively. (See Table 43.)
District Office Use of Enforcement Methods
Among the District Offices, there are significant differences in the percentage of cases in which the four enforcement methods are used (see Table 45).
Virginia Arrearages Study Page 93
For income withholding, the percentage difference in use by District Office is the smallest. There is a 1.8 times difference, ranging from 37.1 percent to 65.1 percent.
For court enforcement, the percentage ranges from 4.4 to 28.9 percent of cases, a 6.6 times difference.
For FIDM, there is a 9-fold difference. The percentage use ranges from a low of 1.1 percent to a high of 10.0 percent of cases.
Liens show the largest percentage differential in use, a 12.6 times difference. Their percentage of use ranges from 2.2 percent to 27.7 percent.
Among the District Offices, the percentage differences in using the four enforcement methods are statistically significant at the 0.05 level. The percentage of cases in which the four enforcement methods are used is dependent upon the District Office.
***

Virginia Arrearages Study Page 94
Appendix 1*
Propositions Related to the Occurrence of Arrears Due to Agency Causes
Proposition 1-1: Making support orders retroactive is an effective strategy benefiting the
Commonwealth and CPs. Outside Scope of Study
Proposition 1-2: The assignment of fees to arrears cases increases the difficulty in collecting
payments. Not Supported (see Table 29)
Proposition 1-3: DCSE District Offices have adequate personnel to handle the workload.
Outside Scope of Study (Not Supported in earlier Virginia Staffing and Caseload
Standards studies, 9-00 and 12-01, respectively)
Proposition 1-4: DCSE employees have efficient technology to facilitate accomplishment of
their work. Outside Scope of Study
Proposition 1-5: DCSE District Offices are effectively using child support enforcement
methods. Not Supported (see Tables 45-46)
Proposition 1-6: Charging interest on arrears balances is an effective strategy for the
Commonwealth and CPs to motivate the NCPs to pay. Not Supported (see Tables 34-35)
Propositions Related to the Occurrence of Arrears Due to the Custodial Parent
Proposition 2-1: Arrears occur because CPs do not contact DCSE until large arrears result.
Outside Scope of Study
Propositions Related to the Occurrence of Arrears Due to NCP Employers
Proposition 3-1: Arrears occur because employers do not cooperate with DCSE (e.g., do not
make remittances as required, do not withhold income as required, and other ways). Outside
Scope of Study
Propositions Related to the Occurrence of Arrears Due to the NCP’s Inability to Pay
Proposition 4-1: Large arrears balances result from large support order amounts.
Supported (see Proposition 29)
Proposition 4-2: NCPs with support orders set by imputing income have larger arrears balances
and are less likely to make payments. Outside Scope of Study
Proposition 4-3: A cause of arrears is the failure to modify the original support order.
Outside Scope of Study
Proposition 4-4: Uncooperative NCPs cause arrears to occur.
Outside Scope of Study (discussed on pages 4-6)
___________
* Note: Some propositions listed here could not be addressed within the scope of this research.

Virginia Arrearages Study Page 95
Proposition 4-5: NCPs with insufficient income incur arrears.
Outside Scope of Study (discussed on pages 4-5)
Proposition 4-6: NCPs’ living expenses cause them to incur arrears.
Outside Scope of Study
Proposition 4-7: NCPs who are incarcerated are unable to make payments for current support
and/or on arrears. Outside Scope of Study
Proposition 4-8: Proportionately, unemployed NCPs owe more arrears than employed NCPs.
Supported (see Proposition 10)
Proposition 4-9: Employed NCPs make payments on arrears more consistently than unemployed
NCPs. Supported (see Proposition 11)
Proposition 4-10: NCPs with low incomes are unable to make regular/complete payments on
their arrears. Outside Scope of Study
Proposition 4-11: A significant portion of unemployed NCPs are unable to pay arrears because they are unemployable due to one or more causes such as drug abuse, other personal problems, inadequate job skills, spotty work experience and insufficient education and training.
Outside Scope of Study
Proposition 4-12: NCPs who owe arrears are either young or elderly. Not Supported
(see Propositions 1-2)
Proposition 4-13: Proportionately, female NCPs owe more arrears than male NCPs.
Not Supported (see Propositions 3-6)
Proposition 4-14: Race is a factor in NCPs being unable to pay current support and, thus,
incurring arrears. Not Supported (see Proposition 19 and Table 12)
Proposition 4-15: Proportionately, NCPs with multiple support orders owe more arrears than
NCPs with single support orders. Not Supported (see Proposition 26 and Table 19)
Propositions Related to the Occurrence of Arrears Due to the NCP’s Motivation Not to Pay
Proposition 5-1: NCPs are less likely to pay current support and arrears if they dispute paternity.
Outside Scope of Study
Proposition 5-2: NCPs are less likely to pay current support and, thus, incur arrears if they feel it
is not their responsibility to support their children financially. Outside Scope of Study
Proposition 5-3: NCPs are less likely to pay current support and arrears if they are angry with
the mother. Outside Scope of Study
Proposition 5-4: NCPs are less likely to pay current support and arrears if they have no contact
with the child. Outside Scope of Study
Proposition 5-5: NCPs who are charged with retroactive expenses are less likely to pay current
support and arrears. Outside Scope of Study

Virginia Arrearages Study Page 96
Proposition 5-6: Charging fees on arrears cases (e.g., for intercepting tax refunds) increases the
difficulty in collecting payments. Not Supported (see Hypothesis 1)
Proposition 5-7: NCPs who have large arrears amounts are less likely to pay current support and
arrears. Supported (see Proposition 31)
Proposition 5-8: Large arrears balances dissuade NCPs from making payments. Supported
(see Proposition 31)
Other Assumptions
To reward state performance in child support collections, a federal incentive system involving payments was developed.74 One of the five performance incentives is intended to stimulate state efforts to increase the collection of arrears. A paramount issue is whether the arrears incentive will spur increased efforts by states to collect arrears.75 Also, due to the complex nature and magnitude of the problem, there is some question whether the collection of arrears is beyond states’ capacity and resources to control.76 These two issues are the basis for two propositions:
Proposition 6-1: Basing federal incentive payments on state performance in collecting arrears is
a realistic strategy.77 Outside Scope of Study (some discussion with Proposition 35)
Proposition 6-2: The collection of arrears is often impeded by factors beyond states’ control.
Supported (see discussion for Hypothesis 11)
74 Among the five performance indicators that are used to calculate federal incentive payments to states is the
state’s performance in collecting arrears. This indicator is calculated by dividing the number of cases during a fiscal
year in which some arrearage is collected by the total number of cases in which arrears are owed. To receive the
highest incentive payment, this quotient must equal 80 percent. 75 Latus, Justin, op. cit., p. 3.76 Ibid.77 Ibid.

Virginia Arrearages Study Page 97
Appendix 2
Summary of Arrears Management Literature
1. Elaine Sorensen and Chava Zibman, A Look at Poor Dads Who Don’t Pay Child Support,Urban Institute, September 2000.
http://www.urban.org/UploadedPDF/discussion00-07.pdf
This article is similar to the April 2002 paper by Elaine Sorensen that includes more up-to-date data. See #4 below for details.
2. Elaine Sorensen and Chava Zibman, Poor Dads Who Don’t Pay Child Support:
Deadbeats or Disadvantaged? Urban Institute, April 2001.
http://www.urban.org/UploadedPDF/anf_b30.pdf
This article is also similar to the April 2002 paper by Elaine Sorensen. See #4 for a summary of that article.
3. Elaine Sorensen, Helping Poor Nonresident Dads Do More, Urban Institute, April 2002.
http://www.urban.org/UploadedPDF/ShortTakes_3.pdf
This is a short article highlighting the information contained in the April 2002 paper by Elaine Sorensen. See #4 for a more complete summary.
4. Elaine Sorensen and Helen Oliver, Policy Reforms are Needed to Increase Child Support
from Poor Fathers, Urban Institute, April 2002.
http://www.urban.org/UploadedPDF/410477.pdf
The authors took data from the 1999 National Survey of America’s Families to look at a sample of nonresident fathers. Among their findings:
One out of three NCPs lived with income below the poverty level.
More than 25% of these “poor fathers” pay more than 50% of their income in child support while, of those fathers who are not poor, only 2% pay more than 50% of their income in child support.
Sixteen percent (16%) of poor fathers are institutionalized, most in prison.
Fifty percent (50%) of poor fathers are working, while 92% of non-poor fathers are working. One-half of the poor fathers not working reported that they could not work due to disability or health issues (only ¼ of the non-poor fathers not working gave the same reasons).
The authors found, further, that poor fathers have the following significant barriers to work:
Lack of education.
Lack of recent work experience.

Virginia Arrearages Study Page 98
Health issues and lack of health insurance.
Criminal records.
Lack of access to food.
Lack of access to housing.
Lack of telephone service.
Not eligible for Medicaid unless disabled.
The authors also determined that many of the poor fathers had default orders that:
Were based on imputed income.
Were retroactive to the child’s birth.
Included birth costs.
Recommendations:
(1) Provide supports for those poor fathers who pay child support, such as:
Food stamps.
Health insurance.
Work programs. (2) Institute “amnesty” programs that forgive debt owed to the state as long as the
NCP participates in work activities and pays current support obligations. (3) Set realistic child support orders.
5. Final Summary of the Administration for Children and Families Northeast Hub Meeting
on Managing Arrears, April 2001.
http://www.acf.dhhs.gov/programs/cse/pubs/2002/reports/arrears/index.html
This paper summarizes what was discussed during the Northeast Hub Meeting on Managing Arrears held in April 2001. Meeting participants agreed to organize issues into four categories: Prevention, Order Establishment, Early Intervention, and Accrued Arrears Management. Within each category, the participants discussed issues to be considered and strategies that could be used to manage arrears. The participants identified some of the following strategies:
Prevention of Arrears:
System-wide caseload clean-up, e.g., do matches with Vital Statistics/SSA to identify deceased NCPs, look for cases where children are emancipated, look for “dead cases” that fall under federal case-closure criteria, etc.
Outreach activities to aid in prevention, e.g., utilize web resources, agency partners, CBOs, the media, outreach with CPs.
Order Establishment:
States should look at the possibility of even a limited transfer of some establishment functions to an administrative process.
Increase NCP participation rate through clearer language (“YOU MUST APPEAR…”), and through partnership with CBOs to help facilitate visitation and mediation.

Virginia Arrearages Study Page 99
Make default orders provisional or temporary, and avoid standard default order amounts.
Regularly review child support guidelines, and consider establishing a “self-support reserve” to provide for the basic needs of low-income NCPs (i.e., a “living wage”) when setting support.
Collaborate with CBOs and WtW/WIB to assist NCPs in working to overcome barriers to employment and to find employment.
When setting retroactive support, base amount on NCP’s current ability to pay. Also, consider mitigating factors such as state/CP delays in setting obligation and credits for in-kind support.
Consider cap on retroactive arrears when NCP income is below poverty level.
Consider feasibility of collecting non-child support obligations (interest, fees, etc.) and cap these “add-ons” or allow room for negotiation.
Early Intervention:
Consider more frequent reviews for modification.
Provide timely notice to NCPs about opportunity for modification (e.g., when NCP receives unemployment or becomes incarcerated).
Simplify modification process where possible (settlement conferences, easy-to-use pro se packages).
Publicize modification information.
Watch for timeliness of order terminations (e.g., emancipation)
Consider adjustment policy to reduce accrued arrears when the state does not terminate obligation, when appropriate, in a timely manner.
Contact NCP whenever account is 30 days in arrears.
Use one-state interstate actions whenever possible to prevent delays that may occur with two-state actions.
Accrued Arrears Management:
Do caseload clean-up (see above).
Use enforcement actions wherever possible, including FIDM, one-state interstate actions.
Publicize credit bureau reporting thresholds.
Consider suspension of enforcement remedies when appropriate (e.g., amnesty programs, agreement to suspend interest charges, contempt actions, and license suspension if NCP makes regular payments).
Coordinate with CBOs to provide third-party payments (i.e., third party pays percentage of NCP’s arrears in exchange for NCP’s participation in employment program).
Consider a compromise or settlement policy (TANF Arrears Only cases, lump-sum compromises, compromise in exchange for participation in specified employment programs).

Virginia Arrearages Study Page 100
6. Summary of the Administration for Children and Families Northeast Hub Follow-up
Meeting on Managing Arrears, November 2001.
http://www.acf.dhhs.gov/programs/cse/pubs/2002/reports/arrears/index.html
This paper summarizes what was discussed during the follow-up Northeast Hub Meeting on Managing Arrears held in November 2001. Participants discussed policy issues and shared best practices.
Policy Issues Discussed:
There is no IV-D requirement to “represent” either party in the review and adjustment process; state’s role is to facilitate whatever adjustment is appropriate (up or down).
Selling TANF arrears to a collection company at a discounted rate is prohibited under the Act. “So long as the debt remains enforceable in the original judgment amount, the Federal government is entitled to the full Federal share of a collection assigned to the state … regardless of whether the collection is made by a state agency, paid voluntarily by the NCP, or collected by a private entity.”
If interest is considered “child support” under state law, it must be included in the arrears amount for purposes of reporting on line 26 of form OCSE 157.
A CP must consent to any compromise of child support arrears not
permanently assigned to the state (including temporarily assigned arrears). State law may also require the tribunal to endorse any such agreement as well.
The state should continue to collect any arrears enforceable under state law until a case meets case-closure guidelines.
Current Research Activities and Funding Sources:
SIP grants are available to fund arrears prevention campaigns and other arrears management activities.
OCSE Task Order 24 is currently underway – the contractor is investigating at least 16 OCSE-identified policies/practices that may support or undermine payment compliance rates of low-income NCPs. The task order contractor will also examine guideline-related issues raised in recent OIG reports on child support establishment and low-income NCPs, and survey states for best practices that address low-income NCP issues.
Best Practices/Good Ideas:
California – The Urban Institute conducted a recent study of the collectibility of California’s child support arrearages. From the data collected, CLASP is developing specific debt collection strategies for California, and recommending policy changes to avoid future arrears accrual (focusing on interest and avoidance of default orders).
OCSE IM-01-09 – encourages IV-D agencies, courts, legal associations, and the Department of Defense to notify all reservists activated for Operation

Virginia Arrearages Study Page 101
Enduring Freedom of their right to request a review for modification, in a timely manner.
California – recently enacted legislation calling for an arrears forgiveness policy when a family has reunited and payment of the arrears could undermine the reunification.
National Center for Strategic Nonprofit Planning and Community Leadership (NPCL) issued a report entitled “Managing Arrears: Child Support Enforcement and Fragile Families” in May 2001 (see summary below). The report offers recommendations for arrears management policies, especially for low-income parents.
Minnesota – completed its Child Support Delivery Study. The study established a Client Analytic System that segregates NCPs into five categories: complying NCP, misinformed/uninformed NCP, unable to pay NCP, reluctant NCP, evading NCP. The study made recommendations regarding enforcement strategies to be used with each group.
American Public Human Services Association (APHSA) – published information about child support arrears in its Washington Memo in June 2001. The article discusses causes of arrears accumulations and strategies to prevent or reduce arrears.
Northeast Hub States – the report summarizes activities conducted by the states to help prevent and reduce arrears. Also included are “best practice” write-ups for the following states:
~ Connecticut – passed legislation to authorize the Commissioner of Social Services to establish criteria and procedures for the adjustment of arrears owed to the state.
~ Maryland – proposed legislation to temporarily suspend or reduce to $25 per month an NCP’s child support obligation when s/he is incarcerated, through 60 days after release.
~ Maryland – established the Arrearage Expungement Program to allow local offices to expunge all or a part of arrears owed to the state, based on the reason the arrearages accrued (e.g., cases where if NCP had filed for modification, obligation would likely have been reduced, suspended or terminated; would include cases where NCP is incarcerated, has mental/physical disability resulting in loss of income, or is reunified with children).
~ New Hampshire – produces weekly and monthly reports designed to give information about arrears. Weekly reports show incentive measures for each local office (including percentage of cases that have an arrears payment). Monthly reports identify cases that have and have not received arrears payment. State has seen a 5% increase in percentage of cases paying on arrears since implementation of the reports.
Participants at the November 2001 meeting recommended that they meet again in the Summer of 2002, to evaluate results of new initiatives and identify other best practices.

Virginia Arrearages Study Page 102
7. Office of Inspector General, DHHS, The Establishment of Child Support Orders for Low
Income Non-Custodial Parents, OEI-05-99-00390, July 2000.
http://oig.hhs.gov/oei/reports/oei-05-99-00390.pdf
OIG examined methods used to determine child support obligations in 10 states (CO, MA, MD, MS, NY, OK, PA, TX, VA, WA) and the relationship between how these obligations were set to payment compliance in low-income cases.
The OIG found:
The longer the period of retroactive support contained in the order, the less likely the NCP was to pay any support. For example, for those NCPs not charged with any retroactive support, 14% made no payments during the first 32 months of the order. For those NCPs who were charged with 1-12 months of retroactive support, 23% made no payments. For NCPs charged with retroactive arrears greater than 12 months, 34% made no payments.
For orders where income was imputed, almost 50% of the cases showed no payment in the first 32 months of the obligation. For orders not based on imputed income, only 11% of the cases showed no payment.
Most of the sampled states only had informal agreements for IV-D referrals to job programs.
The OIG recommended that states:
Set realistic support obligations
Provide NCPs with employment support with work requirements
Test payment effects of using different period of retroactive arrears awards.
Test negotiating assigned arrears in exchange for payment compliance.
Decrease use of income imputation.
8. Office of Inspector General, DHHS, State Policies Used to Establish Child Support
Orders for Low Income Non-Custodial Parents, OEI-05-99-00391, July 2000.
http://oig.hhs.gov/oei/reports/oei-05-99-00391.pdf
OIG examined state policies used to establish child support obligations in low-income NCP cases by conducting a close-ended survey of all state IV-D directors.
The OIG found:
46 states charge NCPs for retroactive support for TANF paid prior to establishment of the order. Most states charge for paternity tests. Some states charge establishment-related fees, legal fees, and birthing costs.
46 states allow employers to charge fees for income withholding; 7 states charge ongoing case processing fees.
34 states can charge interest on past-due support.
Most states impute income when NCP does not provide income information or is unemployed; 35 states base imputed income on minimum wage at 40 hours per week.

Virginia Arrearages Study Page 103
30 states have established minimum order amounts when the NCP’s income falls below a minimum threshold. Eleven (11) states use a minimum order amount in low-income cases (i.e., there is no income threshold).
9. Office of Inspector General, DHHS, Child Support for Children on TANF, OEI-05-99-00392, February 2002.
http://oig.hhs.gov/oei/reports/oei-05-99-00392.pdf
OIG sampled cases from 10 states (same ones listed in #7) to examine IRS earnings data for the NCPs and NCPs’ compliance with their support orders. Data from 1995 to 1998 were used.
The OIG found:
In 1995, 55% of the NCPs had income below the poverty level.
20% had no reported earnings (1995).
Average earnings for low-income NCPs were $8,500; average reported personal income for males in 1995 was $31,500.
From 1995 to 1998, NCP earnings increased by 28%; however, about 50% of the NCPs still had reported earnings below the poverty level in 1998.
NCPs with earnings below poverty had child support orders amounting to 69% of their reported earnings (1996).
In 1997, 59 % of all child support owed was paid (in all TANF and non-TANF cases). For the NCPs used in this sample, only 39% of the support owed to families on TANF was paid.
Lower reported earnings before order establishment and the number of months of retroactive support awarded tend to have a negative impact on NCP compliance. Increases in earnings and lower ratios of child support obligations to earnings tend to have a positive effect on compliance.
Conclusion: The most effective way to achieve both immediate and long-term child support payments for TANF families is to “set realistic orders when compared to a non-custodial parent’s earnings.”
10. Janet Atkinson and Barbara C. Cleveland, Managing Arrears: Child Support
Enforcement and Fragile Families, National Center for Strategic Nonprofit Planning and Community Leadership, May 2001.
http://www.npcl.org/services/PLC%20on%20arrearsfinaltimesroman.pdf
This report summarizes the activities of the Partners for Fragile Families Peer Learning College held in Boston in January 2001. The meeting addressed the management of child support arrears. Recent research was discussed, and IV-D program directors provided information about their arrears management policies.

Virginia Arrearages Study Page 104
Presentations to the Peer Learning College:
MA Partners for Fragile Families Demonstration Site – partnership between IV-D agency and CBOs. Case managers help fathers to establish visitation, modify child support orders, and negotiate arrears payment plans.
State Arrears Policies – most states use default orders when NCPs fail to respond to hearings notices; most default orders are based on the current minimum wage. Arrears data from CO shows a correlation between default orders, low payment and high arrears.
Cases stipulated at court are more likely to receive payments than those set at a contested hearing.
No state automatically adjusts child support obligations when the NCP is incarcerated.
State Reports:
CO – uses automated software to design reasonable payment plans for NCPs. Also developing statewide policy on arrears payments.
IL – noncustodial parent services unit within IV-D agency; visitation sites for never-married parents; program for incarcerated and formerly incarcerated fathers; hospital-based site to recruit dads into fatherhood program.
IA – emphasizes collection of current support to slow growth of arrears; agency establishes low minimum orders, charges no interest on debts owed to the state, rewards consistent payments and participation in fatherhood program by forgiving up to 80% of debt owed to state.
MD – uses debt owed to state as leverage to encourage payment of current support and participate in fatherhood/substance abuse/employment training programs. Funds 27 privately run Access and Visitation sites (state child support enforcement & TANF funds, and federal grants). Fatherhood unit within IV-D agency.
MA – has developed policies to waive interest and penalties owed to state in exchange for lump sum payment of entire debt (2/3 of payments have been going to state). Developing strategy to close uncollectible cases. Payment plan: If NCP pays current support plus 25% toward arrears, no interest or penalties accrue and enforcement strategies of license revocation, credit clouding and contempt are suspended. Developing policy called “equitable adjustments” when original order appears to be flawed.
NY – found that 75-80% of parents in access and visitation programs pay support. Developed outreach materials for low-income and incarcerated fathers.
Recommendations:
Analyze arrears so that arrears management strategies are tailored to address local problems.
Partner with CBOs who can work with low-income NCPs.

Virginia Arrearages Study Page 105
Ensure provisions of guidelines regarding low-income obligors are fully implemented.
Establish uniform settlement standards.
Partner w/ TANF agency to develop job programs for NCPs.
Avoid default orders in low-income cases, whenever possible.
Set realistic orders.
Minimum orders should not exceed low-income parents’ ability to pay.
Avoid large retroactive support awards in low-income cases.
Suspend enforcement and interest on state debt to encourage payment of current support and arrears owed to family.
Work with criminal justice system to develop programs for incarcerated NCPs.
Combine vigorous enforcement with policy to compromise state debt in appropriate cases.
Stipulate compromise of state arrears if original order was too high.
11. Semi-Annual Performance Report of the Research Project New Approaches to Collecting
Child Support Arrearages: Determining the Composition and Collectibility of
Arrearages, First Report, Washington State Division of Child Support, May 2000.
http://www.wa.gov/dshs/dcs/arrears1_rpt.pdf
This is the first of five reports that document Washington State’s OCSE-funded study of child support arrearages. Goals of the study were:
Understand processes and components of child support that lead to large arrears;
Document mitigating effects of interventions on collectibility;
Determine impact of law and policies on arrears accumulation; and
Recommend strategies to reduce arrearages.
Findings from the first six months of the study:
80% of current support cases also have arrears due.
Bulk of arrears in caseload are concentrated in “hard-to-collect” cases.
Suggested strategies to improve performance on arrearages:
~ Collect more arrears by (1) assigning specialized staff to work Arrears Only cases, and (2) modify orders on cases where NCP already pays.
~ Collect more current support to reduce amount of arrears accumulating.
~ Negotiate lower payments towards arrears. ~ Close unworkable cases promptly. ~ Reduce debts where authorized by law, and where fair. ~ Modify support orders downward, where appropriate. ~ Use FIDM for enforcement. ~ Use New Hire Reporting to locate new employers. ~ Use license suspension program.

Virginia Arrearages Study Page 106
IV-D/WtW cooperative ventures show little immediate impact on payment of arrears (and intensive work on part of staff) but may help correct support orders and reduce debts in the intermediate and longer terms.
Other initiatives that may be helpful:
~ Most-Wanted internet site. ~ Revisiting default orders. ~ Delegate debt write-off decisions to field staff. ~ Contempt referrals. ~ Outreach to prisoners.
12. Semi-Annual Performance Report of the Research Project New Approaches to Collecting
Child Support Arrearages: Determining the Composition and Collectibility of
Arrearages, Second Report, Washington State Division of Child Support, October 2000.
http://www.wa.gov/dshs/dcs/arrears2_rpt.pdf
Summarizes progress made during the second six-month period of the Washington state study. Mostly contains information about development of a case assessment questionnaire and data compilation for predicting arrearage behavior.
13. Determining the Composition and Collectibility of Arrearages, Third Performance
Report, Washington State Division of Child Support, March 2001.
http://www.wa.gov/dshs/dcs/pdf/thirdprogreport.pdf
Summarizes progress made during the third six-month period of the Washington state study. Case assessment was completed (summary of observations to be published in final report), and a tool was developed for predicting child support arrearages using neural network simulation modeling. Tool can predict, with up to 80% accuracy, the direction of change in arrears for an NCP.
14. Semi-Annual Performance Report of the Research Project New Approaches to Collecting
Child Support Arrearages: Determining the Composition and Collectibility of
Arrearages, Fourth Report, Washington State Division of Child Support, November 2001.http://www.wa.gov/dshs/dcs/pdf/fourthprogressreport.pdf
Summarizes progress made from April – October 2001. Team developed a second prediction tool for child support arrearages, using inductive decision tree modeling. This second tool is “easier to understand and is useful for making quick predictions, but is not as powerful” as the first tool.Further progress was made in an analysis of the case assessment done on a sample of 200 cases. The sample represented NCPs whose arrears history fell into one of four patterns: (1) steadily increasing arrears, (2) steadily decreasing arrears, (3) intermittent (arrears increasing and decreasing), and (4) no change (in debt over period). The researchers found:

Virginia Arrearages Study Page 107
Barriers to collection (e.g., incarceration, public assistance, substance abuse, multiple cases) were greatest within the Increasing debt pattern, followed by the Intermittent pattern.
Multiple cases appear to be the most significant factor in arrearages that fall into the Intermittent pattern.
Monthly order amounts appear to be the most significant factor for those cases that fall into the Increasing debt pattern. The monthly order amounts for this group were the highest.
15. Semi-Annual Performance Report of the Research Project New Approaches to Collecting
Child Support Arrearages: Determining the Composition and Collectibility of
Arrearages, Fifth Report, Washington State Division of Child Support, April 2002.
http://www.wa.gov/dshs/dcs/pdf/fifthprogreport.pdf
Summarizes progress made from October 2001 – March 2002. The report summarizes data analysis done to examine the underlying patterns of arrearages, earnings, and order amounts.
16. James A. Hennessey & Jane Venohr, Exploring Options: Child Support Arrears
Forgiveness and Pass-through of Payments to Custodial Families, Policy Studies, Inc., February 2000.
http://www.dhs.state.mn.us/ecs/program/CSREP01.pdf
This study summarizes research activities done to evaluate and to make recommendations on how the State of Minnesota might use debt compromise and pass-through programs in its child support program. Recommendations made regarding debt compromise were:
Develop single, statewide policy on debt compromise that ensures fair and equitable treatment. Use interim process immediately, and develop permanent policy based on analysis of impact/effectiveness of interim policy, and on analysis of arrears forgiveness projects currently being conducted.
Review current practices that may contribute to accumulation of arrears, and develop remedies.
Develop a one-time amnesty program.
17. Wendell E. Primus and Charita L. Castro, A State Strategy for Increasing Child Support
Payments from Low Income Fathers and Improving the Well-Being of Their Children
Through Economic Incentives, Center on Budget and Policy Priorities, April 1999.
http://www.cbpp.org/4-14-99wel.htm
18. Paula Roberts, Setting Support When the Noncustodial Parent is Low Income, Center for Law and Social Policy, February 1999.
http://www.clasp.org/pubs/childenforce/supaward.htm

Virginia Arrearages Study Page 108
19. Vicki Turetsky, Realistic Child Support Policies for Low Income Fathers, Center for Law and Social Policy, March 2000.
http://www.clasp.org/pubs/childenforce/kellogg.htm
20. Paula Roberts, An Ounce of Prevention and a Pound of Cure: Developing State Policy on
the Payment of Child Support Arrears by Low Income Parents, Center for Law and Social Policy, May 2001.
http://www.clasp.org/pubs/childenforce/Arrearage%20Paper.PDF
21. Paula Roberts, Pursuing Justice: A Strategic Approach to Child Support Arrears in
California, Center for Law and Social Policy, May 2002.
http://www.clasp.org/pubs/childenforce/Pursuing_Justice_A_Strategic_Approach_To_CS_Arrears_In_CA.pdf
Summarizes Elaine Sorensen and Chava Zibman’s study of California’s accumulated arrears; makes recommendations regarding reducing and preventing arrears in the future.
Highlights:
Two primary causes of arrears in CA: (1) Charging interest and paying interest before principal, and (2) High child support orders for low-income NCPs.
Per Sorensen and Zibman, of the $14.4 billion in arrears in CA, $8.1 billion is owed by NCPs with annual incomes of less that $5,000. Also, for the same NCPs at this income level, the median monthly support order is $280, twice the net monthly income.
In 1992, all CA counties were required to begin charging interest at 10%; counties who had not charged interest before went back and calculated interest on arrears and recalculated prior distributions so that NCPs who had no arrears suddenly had them. (Sorensen and Zibman believe steep rise in CA’s accumulated arrears from 1992 to 1996 was due to these interest calculations.)
Reduce arrears through aggressive enforcement (income withholding, tax intercepts, FIDM, contempt hearings)
Prevent accumulation (e.g., via clear/concise materials for NCPs, protocols for default orders or little income information, streamline modifications)
Legislative initiatives (reduce and/or cap interest on arrears, pay principal before interest, change threshold for modifying orders, adjust orders for low-income NCPs, and authorize negotiated agreements).
Review orders established before the guidelines (may have been set based on the public assistance grant) to determine if debt could be written off.
Review cases for possible SSDI eligibility and credits towards child support.
Utilize case closure where appropriate.

Virginia Arrearages Study Page 109
22. Public Policy Supporting Two Parent Families/Compromise of Arrearages, Office of Child Support Enforcement, PIQ-99-03, March 1999.
http://www.acf.dhhs.gov/programs/cse/pol/piq-9903.htm
23. State IV-D Program Flexibility with Respect to Low Income Obligors – Imputing Income;
Setting Child Support Orders and Retroactive Support; Compromising Arrearages;
Referral to Work-Related Programs and Other Non-Traditional Approaches to Securing
Support, Office of Child Support Enforcement, PIQ-00-03, September 2000.
http://www.acf.dhhs.gov/programs/cse/pol/piq-00-03.htm
24. Jessica Pearson & Ester Ann Griswold, New Approaches to Child Support Arrears: A
Survey of State Policies and Practices, Center for Policy Research, March 2001.
http://www.centerpolicyresearch.org/StateSurveyReport.htm
25. Nancy Thoennes and Jessica Pearson, Understanding Child Support Arrears in
Colorado: An Empirical Analysis Based on a Random Sample of Cases with Arrears,
Center for Policy Research, March 2001.
http://www.centerpolicyresearch.org
26. Jessica Pearson, Lanae Davis, and Nancy Thoennes, Dropping Debt: An Evaluation of
Colorado's Debt and Retroactive Child Support Initiative, Center for Policy Research, April 30, 2001.
http://www.centerpolicyresearch.org
27. Author unknown, [Article on Arrears Management], APHSA W-Memo, June 2001.
(ordered from APHSA)
28. Office of Child Support Enforcement, A Study of Interest Usage on Child Support
Arrears, State of Colorado, Colorado Multiple Initiatives Grant, [date unknown, most likely 2001].
http://www.acf.dhhs.gov/programs/cse/pubs/reports/colorado/

Virginia Arrearages Study Page 110
Appendix 3
Themes from Arrears Management Literature
Prevention of Future Arrearages
Set Realistic Child Support Orders
Establishment
Reduce use of default orders.
Change way default orders are set.
Change way income is imputed.
Work to get NCP involved in process.
Look at current retroactive child support establishment policy and practices and consider caps for low-income parents.
Consider policy on assessment of interest.
Review and Modification
State: do more frequent/regular reviews.
Consider policy initiatives/legislative changes that allow for abatement/adjustment when NCP is incarcerated or disabled.
Publicize availability of modification wherever possible, especially during times of need (e.g., unemployment, incarceration).
State/Court Procedures
Look for places where some court-administered processes can be transferred to an expedited administrative process.
Make notices and summons clearer (e.g., “YOU MUST APPEAR…”).
Provide/Coordinate Support and Relief Programs for NCPs
Need Supports for Poor NCPs Who Pay Child Support
Income supports.
Health insurance.
Work programs.
Need Supports for Poor NCPs Who are Currently Unemployable
Substance abuse programs.
Coordinate with CBOs, WtW, and WIB to set up programs.

Virginia Arrearages Study Page 111
Working with Incarcerated NCPs
Suspend obligations for incarcerated NCPs with no income.
Notify obligors of opportunity to modify.
Swift Enforcement
Immediate income withholding.
Enforcement plan when non-payment occurs.
One-state interstate remedies.
Reduction in Accumulated Arrearages
Aggressive Enforcement Strategies
Amnesty Programs/Arrears Adjustment Policy
Arrears adjustment for fatherhood program participants.
“Work off” arrears by doing community service work.
Arrears forgiveness policy (in exchange for lump sum payment or in exchange for timely payment of current support).
Policy on Interest on Child Support
Examine Appropriateness of Orders
If order is “pre-guidelines” and based on public assistance grant rather than ability to pay, and if all arrears are assigned to state, may be able to write off debt.
Establish pilot program to assist low-income obligors with modifications.
Case Closure Review
Arrears Only cases, when arrears less than $500 or unenforceable.
Deceased NCPs.
No SSN.

Virginia Arrearages Study Page 112
Appendix 4
Virginia Arrears Survey: Analysis
Survey States (33)
Alabama
Arizona
Arkansas
Colorado
District of Columbia
Florida
Georgia
Hawaii
Idaho
Illinois
Louisiana
Maine
Maryland
Massachusetts
Michigan
Minnesota
Mississippi
Missouri
Montana
NewHampshire
New Jersey
New York
North Carolina
Oregon
South Carolina
South Dakota
Tennessee
Texas
Utah
Washington
West Virginia
Wisconsin
Wyoming
Enforcement Remedies Used
Of the 33 states surveyed, 24 states use income withholding as the primary enforcement remedy.
Of the 33 states surveyed, 12 states use the Tax Offset Program as the secondary enforcement remedy.
Of the 33 states surveyed, 8 states use liens and levies as the third enforcement remedy.
Age of Debt
In most states, the age of the debt did not prohibit or reduce the effectiveness of collections.
The only states that indicated the age of the debt as an issue were the states that have statutes of limitations on collecting child support debts.
Virginia Arrearages Study Page 113
Size of Debt
In all states, the size of the debt did not prohibit or reduce the effectiveness of collections.
TANF/Non-TANF
No variance in the treatment of large arrears cases for TANF and Non-TANF cases.
Interstate
No variance in the treatment of large arrears cases for interstate cases.
Hurdles/Barriers
States indicated different barriers to successful collection on arrears cases:
Notification Process
Location of NCP
Surcharge or interest charges (tend to increase already uncollectible debts)
Large caseloads
Interstate communications
Rejection of UIFSA petitions (incomplete)
Crowded courts
Unreliable information in automated system
Lack of resources.
Additional Information Gained from Survey Instrument
Judicial process was the next most used remedy for the second and third choice in many states. Upon review, however, the states that indicated this are judicial-process states.
The Tax Offset Program ranked highest in the enforcement remedies for the greatest results with the least amount of resources (i.e., it is totally automated).
FIDM is fairly new and, for most states, a manual process that may prove to be a very effective remedy.
Quotation: “The way the Feds are paying the incentives, it would be in the states’ best interest to directly target large arrears cases to reduce the base line of total arrears. This maximizes the incentives.”

Virginia Arrearages Study Page 114
Mississippi is the third largest state in casino revenues, but the legislature refuses to pass casino-intercept proposals.
Judicial enforcement tops the enforcement remedy for a number of states (primarily, judicial states). It is not ranked high, however, for using the least resources since it consumes a lot of resources (i.e., staff time and preparation).
Suggestions for Ways to Increase Collections
More automation of enforcement remedies
Increase number of staff (in order to decrease caseload size).

Virginia Arrearages Study Page 115
Appendix 5
Focus Group Results
Four Virginia focus groups were conducted in the Fairfax, Newport News, Henrico, and
Roanoke District Offices. The size of the groups ranged from 8 to 15 participants. The groups
were comprised of one District Manager (in one focus group), Supervisors, Lead Enforcement
Specialists, and Enforcement Specialists. The focus groups contained a majority of seasoned
workers with many years of child support experience.
Overall Recommendations on Arrears Collections
I. More Automation of Enforcement Remedies
Some of the remedies (liens, for example) require manual calculations. SAFE is not automated, and other remedies still require manual production. “Demand” letters are not automated.
II. Increase Staff
This was unanimous in all four focus groups. The overall consensus was that no matter what new or different options were explored, without sufficient staff nothing would be productive. Examples were given, citing the Amnesty Project where one office mailed out 500 letters. About a third were returned, and the office had insufficient staff to follow up on locating the returned mail, much less filing it. The vast majority of the focus groups believed that the project was a great idea, though.
III. Decrease Caseload Size
All focus group participants indicated that they were unable to give attention to the non-paying. larger arrears cases due to other demands of the caseload. The paying cases required a great deal of time from a customer service standpoint. The Specialists indicated they are required to review a set amount of cases each month and given the current caseload sizes, the required quota does not even come close to their entire caseload.
IV. Hire Support Staff for Clerical Functions
Several of the focus groups indicated that Specialists’ time was being wasted on clerical functions, such as stuffing envelopes, preparing certified mail receipts, data entry of notice of service on APECS. Many of these functions could be done by clerical staff.

Virginia Arrearages Study Page 116
V. Separate Paying Cases from Non-Paying Cases
In the focus groups, the constant theme voiced by the Specialists was that much time is consumed by talking with custodial parents on cases that are paying (i.e., late payments, short payments, etc.). If the cases were segregated and divided between some Specialists handling paying cases only (which are more customer-service oriented) and others the non-paying cases only (which are more collection-oriented), then more focus and direction could be given in a specified timeframe to larger arrears cases with no payments.
VI. Eliminate or Reduce Policy and Procedural Constraints
The focus group participants felt there were too many “due process” notifications for each enforcement remedy. Participants indicated that one initial notice with all remedies cited should suffice.