child care services monthly report - alaska -...
TRANSCRIPT
Child Care Services Monthly Report February 2018 Page 1 of 24
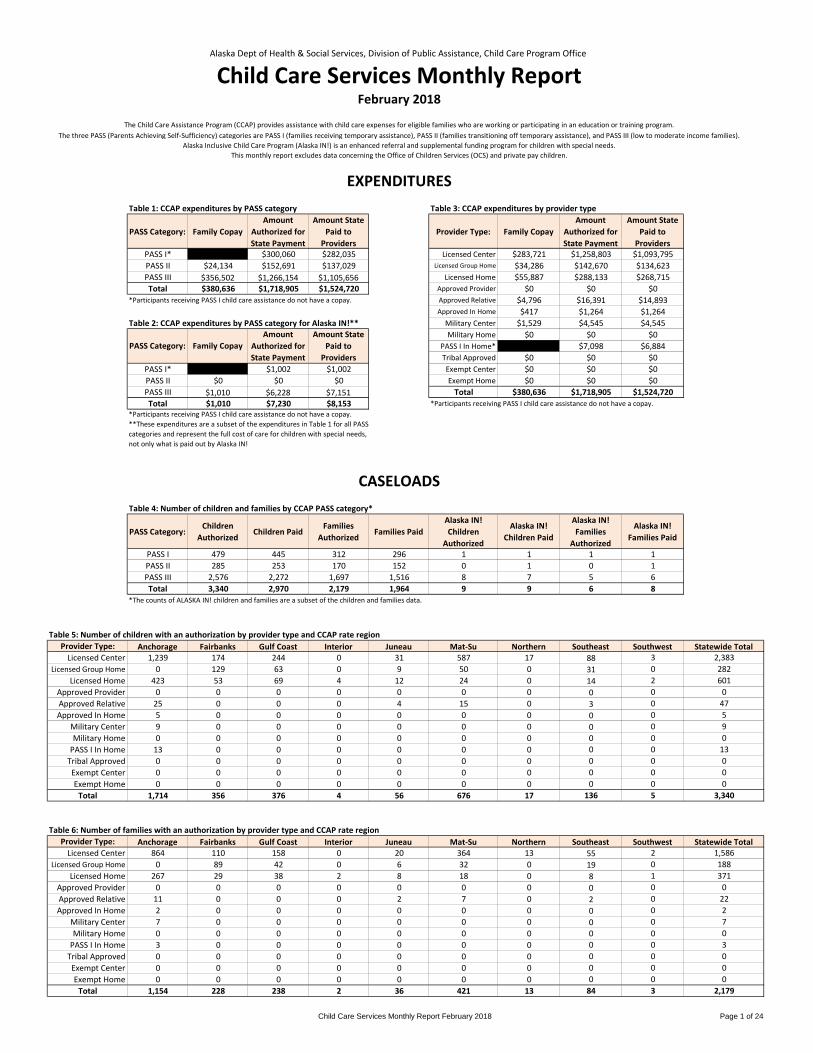
Alaska Dept of Health & Social Services, Division of Public Assistance, Child Care Program Office
Child Care Services Monthly ReportFebruary 2018
The Child Care Assistance Program (CCAP) provides assistance with child care expenses for eligible families who are working or participating in an education or training program.The three PASS (Parents Achieving Self-Sufficiency) categories are PASS I (families receiving temporary assistance), PASS II (families transitioning off temporary assistance), and PASS III (low to moderate income families).
Alaska Inclusive Child Care Program (Alaska IN!) is an enhanced referral and supplemental funding program for children with special needs.This monthly report excludes data concerning the Office of Children Services (OCS) and private pay children.
EXPENDITURESTable 1: CCAP expenditures by PASS category Table 3: CCAP expenditures by provider type
PASS Category: Family CopayAmount
Authorized for State Payment
Amount State Paid to
ProvidersProvider Type: Family Copay
Amount Authorized for State Payment
Amount State Paid to
ProvidersPASS I* $0 $300,060 $282,035 Licensed Center $283,721 $1,258,803 $1,093,795PASS II $24,134 $152,691 $137,029 Licensed Group Home $34,286 $142,670 $134,623PASS III $356,502 $1,266,154 $1,105,656 Licensed Home $55,887 $288,133 $268,715Total $380,636 $1,718,905 $1,524,720 Approved Provider $0 $0 $0
*Participants receiving PASS I child care assistance do not have a copay. Approved Relative $4,796 $16,391 $14,893Approved In Home $417 $1,264 $1,264
Table 2: CCAP expenditures by PASS category for Alaska IN!** Military Center $1,529 $4,545 $4,545Military Home $0 $0 $0
PASS I In Home* $0 $7,098 $6,884Tribal Approved $0 $0 $0
PASS I* $0 $1,002 $1,002 Exempt Center $0 $0 $0PASS II $0 $0 $0 Exempt Home $0 $0 $0PASS III $1,010 $6,228 $7,151 Total $380,636 $1,718,905 $1,524,720Total $1,010 $7,230 $8,153 *Participants receiving PASS I child care assistance do not have a copay.
*Participants receiving PASS I child care assistance do not have a copay. **These expenditures are a subset of the expenditures in Table 1 for all PASS categories and represent the full cost of care for children with special needs, not only what is paid out by Alaska IN!
CASELOADSTable 4: Number of children and families by CCAP PASS category*
PASS Category:Children
AuthorizedChildren Paid
Families Authorized
Families PaidAlaska IN!Children
Authorized
Alaska IN!Children Paid
Alaska IN!Families
Authorized
Alaska IN!Families Paid
PASS I 479 445 312 296 1 1 1 1PASS II 285 253 170 152 0 1 0 1PASS III 2,576 2,272 1,697 1,516 8 7 5 6Total 3,340 2,970 2,179 1,964 9 9 6 8
*The counts of ALASKA IN! children and families are a subset of the children and families data.
Table 5: Number of children with an authorization by provider type and CCAP rate regionProvider Type: Anchorage Fairbanks Gulf Coast Interior Juneau Mat-Su Northern Southeast Southwest Statewide Total
Licensed Center 1,239 174 244 0 31 587 17 88 3 2,383Licensed Group Home 0 129 63 0 9 50 0 31 0 282
Licensed Home 423 53 69 4 12 24 0 14 2 601Approved Provider 0 0 0 0 0 0 0 0 0 0Approved Relative 25 0 0 0 4 15 0 3 0 47Approved In Home 5 0 0 0 0 0 0 0 0 5
Military Center 9 0 0 0 0 0 0 0 0 9Military Home 0 0 0 0 0 0 0 0 0 0
PASS I In Home 13 0 0 0 0 0 0 0 0 13Tribal Approved 0 0 0 0 0 0 0 0 0 0Exempt Center 0 0 0 0 0 0 0 0 0 0Exempt Home 0 0 0 0 0 0 0 0 0 0
Total 1,714 356 376 4 56 676 17 136 5 3,340
Table 6: Number of families with an authorization by provider type and CCAP rate regionProvider Type: Anchorage Fairbanks Gulf Coast Interior Juneau Mat-Su Northern Southeast Southwest Statewide Total
Licensed Center 864 110 158 0 20 364 13 55 2 1,586Licensed Group Home 0 89 42 0 6 32 0 19 0 188
Licensed Home 267 29 38 2 8 18 0 8 1 371Approved Provider 0 0 0 0 0 0 0 0 0 0Approved Relative 11 0 0 0 2 7 0 2 0 22Approved In Home 2 0 0 0 0 0 0 0 0 2
Military Center 7 0 0 0 0 0 0 0 0 7Military Home 0 0 0 0 0 0 0 0 0 0
PASS I In Home 3 0 0 0 0 0 0 0 0 3Tribal Approved 0 0 0 0 0 0 0 0 0 0Exempt Center 0 0 0 0 0 0 0 0 0 0Exempt Home 0 0 0 0 0 0 0 0 0 0
Total 1,154 228 238 2 36 421 13 84 3 2,179
PASS Category: Family CopayAmount
Authorized for State Payment
Amount State Paid to
Providers
Child Care Services Monthly Report February 2018 Page 2 of 24
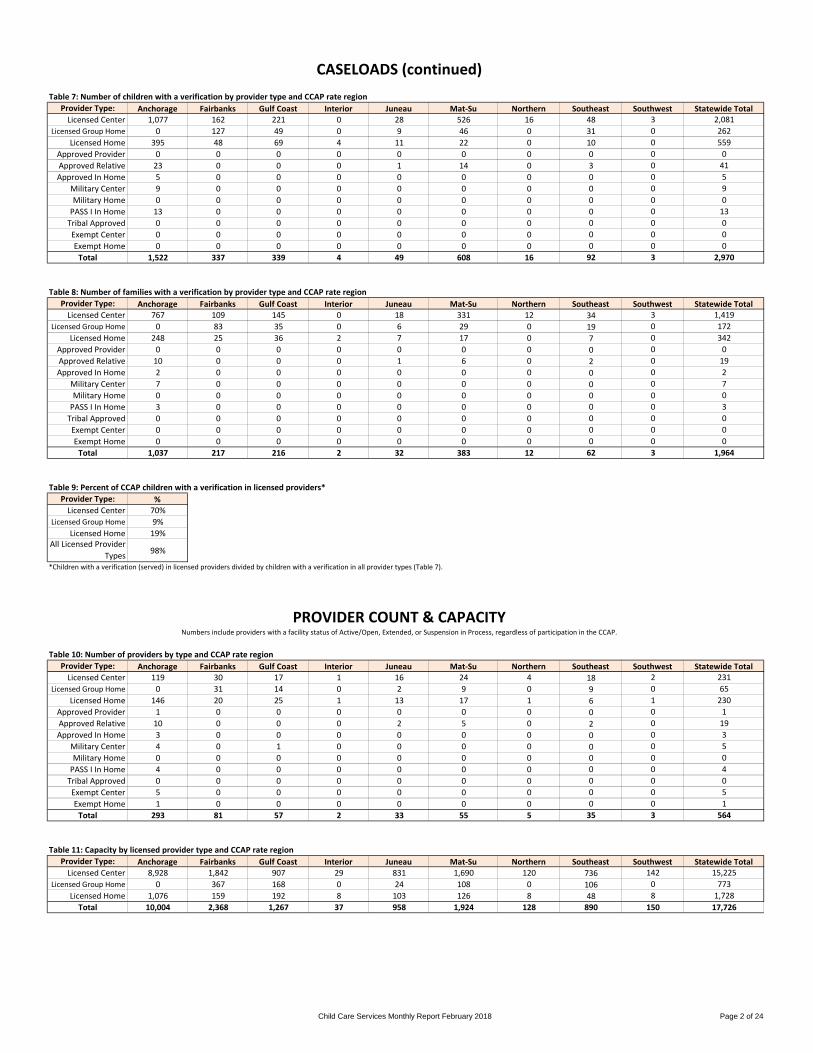
CASELOADS (continued)Table 7: Number of children with a verification by provider type and CCAP rate region
Provider Type: Anchorage Fairbanks Gulf Coast Interior Juneau Mat-Su Northern Southeast Southwest Statewide TotalLicensed Center 1,077 162 221 0 28 526 16 48 3 2,081
Licensed Group Home 0 127 49 0 9 46 0 31 0 262Licensed Home 395 48 69 4 11 22 0 10 0 559
Approved Provider 0 0 0 0 0 0 0 0 0 0Approved Relative 23 0 0 0 1 14 0 3 0 41Approved In Home 5 0 0 0 0 0 0 0 0 5
Military Center 9 0 0 0 0 0 0 0 0 9Military Home 0 0 0 0 0 0 0 0 0 0
PASS I In Home 13 0 0 0 0 0 0 0 0 13Tribal Approved 0 0 0 0 0 0 0 0 0 0Exempt Center 0 0 0 0 0 0 0 0 0 0Exempt Home 0 0 0 0 0 0 0 0 0 0
Total 1,522 337 339 4 49 608 16 92 3 2,970
Table 8: Number of families with a verification by provider type and CCAP rate regionProvider Type: Anchorage Fairbanks Gulf Coast Interior Juneau Mat-Su Northern Southeast Southwest Statewide Total
Licensed Center 767 109 145 0 18 331 12 34 3 1,419Licensed Group Home 0 83 35 0 6 29 0 19 0 172
Licensed Home 248 25 36 2 7 17 0 7 0 342Approved Provider 0 0 0 0 0 0 0 0 0 0Approved Relative 10 0 0 0 1 6 0 2 0 19Approved In Home 2 0 0 0 0 0 0 0 0 2
Military Center 7 0 0 0 0 0 0 0 0 7Military Home 0 0 0 0 0 0 0 0 0 0
PASS I In Home 3 0 0 0 0 0 0 0 0 3Tribal Approved 0 0 0 0 0 0 0 0 0 0Exempt Center 0 0 0 0 0 0 0 0 0 0Exempt Home 0 0 0 0 0 0 0 0 0 0
Total 1,037 217 216 2 32 383 12 62 3 1,964
Table 9: Percent of CCAP children with a verification in licensed providers*Provider Type: %
Licensed Center 70%Licensed Group Home 9%
Licensed Home 19%All Licensed Provider
Types 98%
*Children with a verification (served) in licensed providers divided by children with a verification in all provider types (Table 7).
PROVIDER COUNT & CAPACITYNumbers include providers with a facility status of Active/Open, Extended, or Suspension in Process, regardless of participation in the CCAP.
Table 10: Number of providers by type and CCAP rate region Provider Type: Anchorage Fairbanks Gulf Coast Interior Juneau Mat-Su Northern Southeast Southwest Statewide Total
Licensed Center 119 30 17 1 16 24 4 18 2 231Licensed Group Home 0 31 14 0 2 9 0 9 0 65
Licensed Home 146 20 25 1 13 17 1 6 1 230Approved Provider 1 0 0 0 0 0 0 0 0 1Approved Relative 10 0 0 0 2 5 0 2 0 19Approved In Home 3 0 0 0 0 0 0 0 0 3
Military Center 4 0 1 0 0 0 0 0 0 5Military Home 0 0 0 0 0 0 0 0 0 0
PASS I In Home 4 0 0 0 0 0 0 0 0 4Tribal Approved 0 0 0 0 0 0 0 0 0 0Exempt Center 5 0 0 0 0 0 0 0 0 5Exempt Home 1 0 0 0 0 0 0 0 0 1
Total 293 81 57 2 33 55 5 35 3 564
Table 11: Capacity by licensed provider type and CCAP rate regionProvider Type: Anchorage Fairbanks Gulf Coast Interior Juneau Mat-Su Northern Southeast Southwest Statewide Total
Licensed Center 8,928 1,842 907 29 831 1,690 120 736 142 15,225Licensed Group Home 0 367 168 0 24 108 0 106 0 773
Licensed Home 1,076 159 192 8 103 126 8 48 8 1,728Total 10,004 2,368 1,267 37 958 1,924 128 890 150 17,726
Child Care Services Monthly Report February 2018 Page 3 of 24
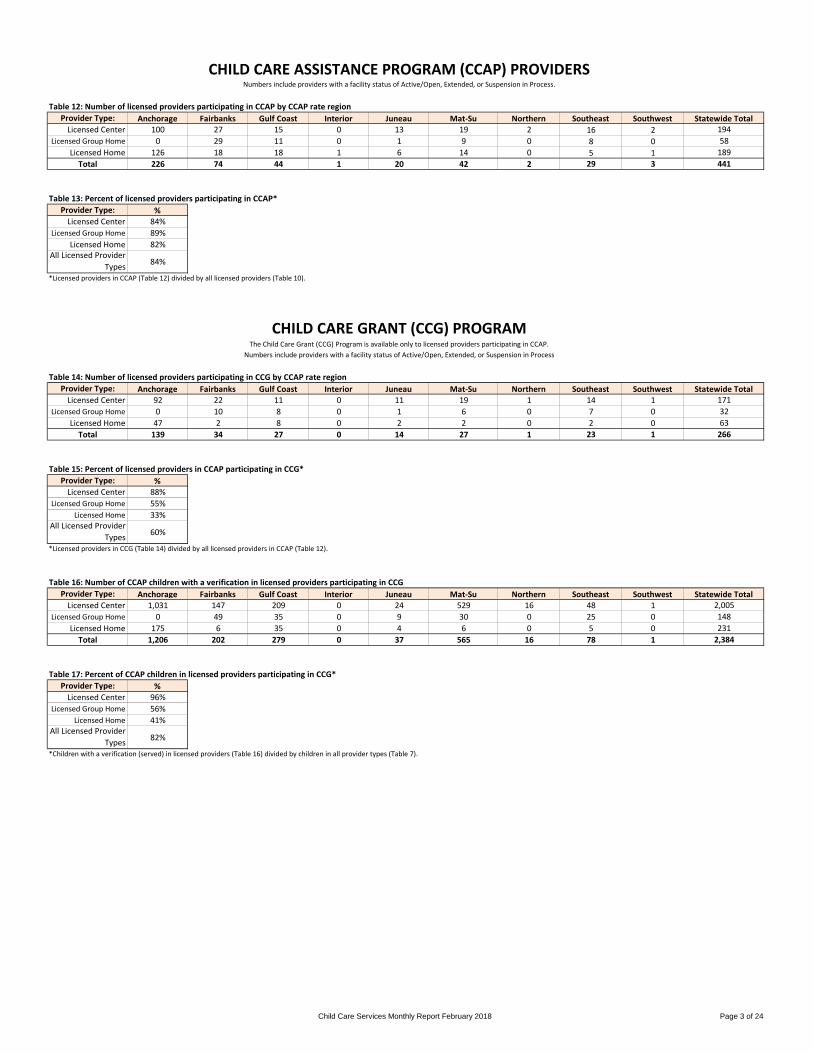
CHILD CARE ASSISTANCE PROGRAM (CCAP) PROVIDERSNumbers include providers with a facility status of Active/Open, Extended, or Suspension in Process.
Table 12: Number of licensed providers participating in CCAP by CCAP rate regionProvider Type: Anchorage Fairbanks Gulf Coast Interior Juneau Mat-Su Northern Southeast Southwest Statewide Total
Licensed Center 100 27 15 0 13 19 2 16 2 194Licensed Group Home 0 29 11 0 1 9 0 8 0 58
Licensed Home 126 18 18 1 6 14 0 5 1 189Total 226 74 44 1 20 42 2 29 3 441
Table 13: Percent of licensed providers participating in CCAP*Provider Type: %
Licensed Center 84%Licensed Group Home 89%
Licensed Home 82%All Licensed Provider
Types 84%
*Licensed providers in CCAP (Table 12) divided by all licensed providers (Table 10).
CHILD CARE GRANT (CCG) PROGRAMThe Child Care Grant (CCG) Program is available only to licensed providers participating in CCAP.
Numbers include providers with a facility status of Active/Open, Extended, or Suspension in Process
Table 14: Number of licensed providers participating in CCG by CCAP rate regionProvider Type: Anchorage Fairbanks Gulf Coast Interior Juneau Mat-Su Northern Southeast Southwest Statewide Total
Licensed Center 92 22 11 0 11 19 1 14 1 171Licensed Group Home 0 10 8 0 1 6 0 7 0 32
Licensed Home 47 2 8 0 2 2 0 2 0 63Total 139 34 27 0 14 27 1 23 1 266
Table 15: Percent of licensed providers in CCAP participating in CCG*Provider Type: %
Licensed Center 88%Licensed Group Home 55%
Licensed Home 33%All Licensed Provider
Types 60%
*Licensed providers in CCG (Table 14) divided by all licensed providers in CCAP (Table 12).
Table 16: Number of CCAP children with a verification in licensed providers participating in CCGProvider Type: Anchorage Fairbanks Gulf Coast Interior Juneau Mat-Su Northern Southeast Southwest Statewide Total
Licensed Center 1,031 147 209 0 24 529 16 48 1 2,005Licensed Group Home 0 49 35 0 9 30 0 25 0 148
Licensed Home 175 6 35 0 4 6 0 5 0 231Total 1,206 202 279 0 37 565 16 78 1 2,384
Table 17: Percent of CCAP children in licensed providers participating in CCG*Provider Type: %
Licensed Center 96%Licensed Group Home 56%
Licensed Home 41%All Licensed Provider
Types 82%
*Children with a verification (served) in licensed providers (Table 16) divided by children in all provider types (Table 7).
Child Care Services Monthly Report January 2018 Page 4 of 24
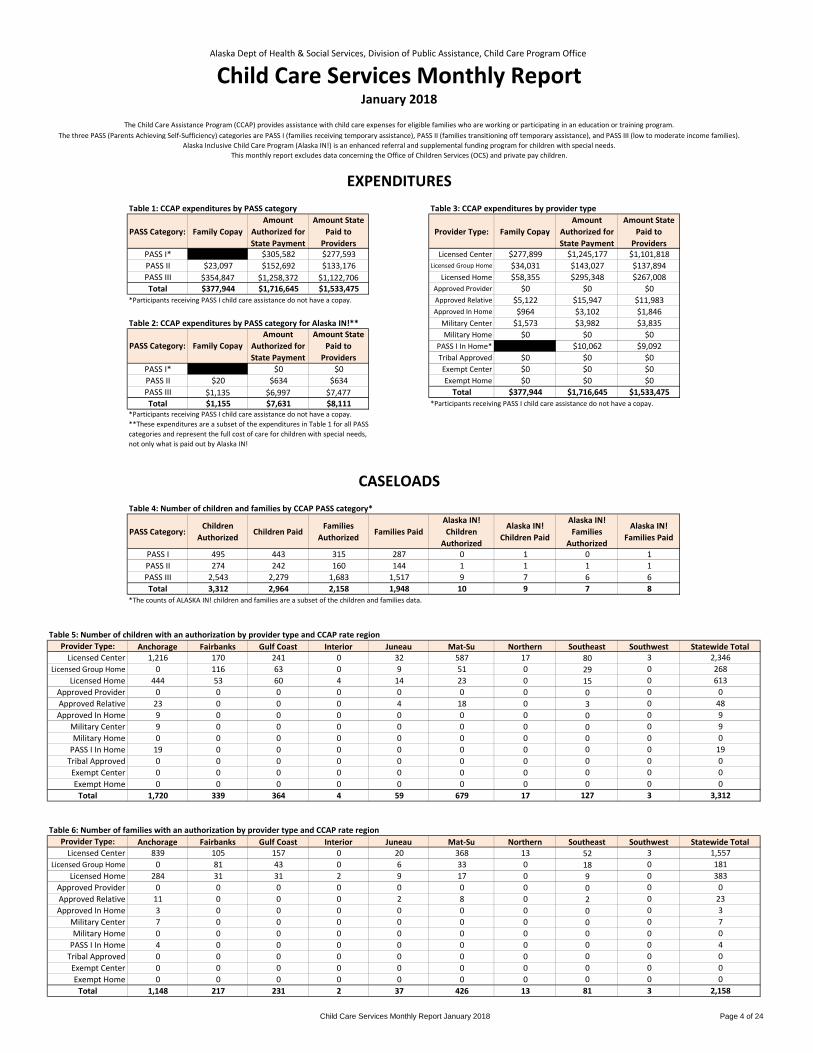
Alaska Dept of Health & Social Services, Division of Public Assistance, Child Care Program Office
Child Care Services Monthly ReportJanuary 2018
The Child Care Assistance Program (CCAP) provides assistance with child care expenses for eligible families who are working or participating in an education or training program.The three PASS (Parents Achieving Self-Sufficiency) categories are PASS I (families receiving temporary assistance), PASS II (families transitioning off temporary assistance), and PASS III (low to moderate income families).
Alaska Inclusive Child Care Program (Alaska IN!) is an enhanced referral and supplemental funding program for children with special needs.This monthly report excludes data concerning the Office of Children Services (OCS) and private pay children.
EXPENDITURESTable 1: CCAP expenditures by PASS category Table 3: CCAP expenditures by provider type
PASS Category: Family CopayAmount
Authorized for State Payment
Amount State Paid to
ProvidersProvider Type: Family Copay
Amount Authorized for State Payment
Amount State Paid to
ProvidersPASS I* $0 $305,582 $277,593 Licensed Center $277,899 $1,245,177 $1,101,818PASS II $23,097 $152,692 $133,176 Licensed Group Home $34,031 $143,027 $137,894PASS III $354,847 $1,258,372 $1,122,706 Licensed Home $58,355 $295,348 $267,008Total $377,944 $1,716,645 $1,533,475 Approved Provider $0 $0 $0
*Participants receiving PASS I child care assistance do not have a copay. Approved Relative $5,122 $15,947 $11,983Approved In Home $964 $3,102 $1,846
Table 2: CCAP expenditures by PASS category for Alaska IN!** Military Center $1,573 $3,982 $3,835Military Home $0 $0 $0
PASS I In Home* $0 $10,062 $9,092Tribal Approved $0 $0 $0
PASS I* $0 $0 $0 Exempt Center $0 $0 $0PASS II $20 $634 $634 Exempt Home $0 $0 $0PASS III $1,135 $6,997 $7,477 Total $377,944 $1,716,645 $1,533,475Total $1,155 $7,631 $8,111 *Participants receiving PASS I child care assistance do not have a copay.
*Participants receiving PASS I child care assistance do not have a copay. **These expenditures are a subset of the expenditures in Table 1 for all PASS categories and represent the full cost of care for children with special needs, not only what is paid out by Alaska IN!
CASELOADSTable 4: Number of children and families by CCAP PASS category*
PASS Category:Children
AuthorizedChildren Paid
Families Authorized
Families PaidAlaska IN!Children
Authorized
Alaska IN!Children Paid
Alaska IN!Families
Authorized
Alaska IN!Families Paid
PASS I 495 443 315 287 0 1 0 1PASS II 274 242 160 144 1 1 1 1PASS III 2,543 2,279 1,683 1,517 9 7 6 6Total 3,312 2,964 2,158 1,948 10 9 7 8
*The counts of ALASKA IN! children and families are a subset of the children and families data.
Table 5: Number of children with an authorization by provider type and CCAP rate regionProvider Type: Anchorage Fairbanks Gulf Coast Interior Juneau Mat-Su Northern Southeast Southwest Statewide Total
Licensed Center 1,216 170 241 0 32 587 17 80 3 2,346Licensed Group Home 0 116 63 0 9 51 0 29 0 268
Licensed Home 444 53 60 4 14 23 0 15 0 613Approved Provider 0 0 0 0 0 0 0 0 0 0Approved Relative 23 0 0 0 4 18 0 3 0 48Approved In Home 9 0 0 0 0 0 0 0 0 9
Military Center 9 0 0 0 0 0 0 0 0 9Military Home 0 0 0 0 0 0 0 0 0 0
PASS I In Home 19 0 0 0 0 0 0 0 0 19Tribal Approved 0 0 0 0 0 0 0 0 0 0Exempt Center 0 0 0 0 0 0 0 0 0 0Exempt Home 0 0 0 0 0 0 0 0 0 0
Total 1,720 339 364 4 59 679 17 127 3 3,312
Table 6: Number of families with an authorization by provider type and CCAP rate regionProvider Type: Anchorage Fairbanks Gulf Coast Interior Juneau Mat-Su Northern Southeast Southwest Statewide Total
Licensed Center 839 105 157 0 20 368 13 52 3 1,557Licensed Group Home 0 81 43 0 6 33 0 18 0 181
Licensed Home 284 31 31 2 9 17 0 9 0 383Approved Provider 0 0 0 0 0 0 0 0 0 0Approved Relative 11 0 0 0 2 8 0 2 0 23Approved In Home 3 0 0 0 0 0 0 0 0 3
Military Center 7 0 0 0 0 0 0 0 0 7Military Home 0 0 0 0 0 0 0 0 0 0
PASS I In Home 4 0 0 0 0 0 0 0 0 4Tribal Approved 0 0 0 0 0 0 0 0 0 0Exempt Center 0 0 0 0 0 0 0 0 0 0Exempt Home 0 0 0 0 0 0 0 0 0 0
Total 1,148 217 231 2 37 426 13 81 3 2,158
PASS Category: Family CopayAmount
Authorized for State Payment
Amount State Paid to
Providers

Child Care Services Monthly Report January 2018 Page 5 of 24
CASELOADS (continued)Table 7: Number of children with a verification by provider type and CCAP rate region
Provider Type: Anchorage Fairbanks Gulf Coast Interior Juneau Mat-Su Northern Southeast Southwest Statewide TotalLicensed Center 1,071 163 218 0 24 536 14 59 3 2,088
Licensed Group Home 0 113 54 0 9 44 0 28 0 248Licensed Home 402 48 62 4 13 19 0 11 0 559
Approved Provider 0 0 0 0 0 0 0 0 0 0Approved Relative 20 0 0 0 1 14 0 3 0 38Approved In Home 6 0 0 0 0 0 0 0 0 6
Military Center 8 0 0 0 0 0 0 0 0 8Military Home 0 0 0 0 0 0 0 0 0 0
PASS I In Home 17 0 0 0 0 0 0 0 0 17Tribal Approved 0 0 0 0 0 0 0 0 0 0Exempt Center 0 0 0 0 0 0 0 0 0 0Exempt Home 0 0 0 0 0 0 0 0 0 0
Total 1,524 324 334 4 47 613 14 101 3 2,964
Table 8: Number of families with a verification by provider type and CCAP rate regionProvider Type: Anchorage Fairbanks Gulf Coast Interior Juneau Mat-Su Northern Southeast Southwest Statewide Total
Licensed Center 750 107 143 0 15 341 10 42 3 1,411Licensed Group Home 0 73 37 0 6 28 0 17 0 161
Licensed Home 256 26 31 2 8 14 0 8 0 345Approved Provider 0 0 0 0 0 0 0 0 0 0Approved Relative 10 0 0 0 1 6 0 2 0 19Approved In Home 2 0 0 0 0 0 0 0 0 2
Military Center 6 0 0 0 0 0 0 0 0 6Military Home 0 0 0 0 0 0 0 0 0 0
PASS I In Home 4 0 0 0 0 0 0 0 0 4Tribal Approved 0 0 0 0 0 0 0 0 0 0Exempt Center 0 0 0 0 0 0 0 0 0 0Exempt Home 0 0 0 0 0 0 0 0 0 0
Total 1,028 206 211 2 30 389 10 69 3 1,948
Table 9: Percent of CCAP children with a verification in licensed providers*Provider Type: %
Licensed Center 70%Licensed Group Home 8%
Licensed Home 19%All Licensed Provider
Types 98%
*Children with a verification (served) in licensed providers divided by children with a verification in all provider types (Table 7).
PROVIDER COUNT & CAPACITYNumbers include providers with a facility status of Active/Open, Extended, or Suspension in Process, regardless of participation in the CCAP.
Table 10: Number of providers by type and CCAP rate region Provider Type: Anchorage Fairbanks Gulf Coast Interior Juneau Mat-Su Northern Southeast Southwest Statewide Total
Licensed Center 119 30 17 1 16 24 4 17 2 230Licensed Group Home 0 30 14 0 2 9 0 9 0 64
Licensed Home 148 21 25 1 14 17 2 6 1 235Approved Provider 1 0 0 0 0 0 0 0 0 1Approved Relative 11 0 0 0 2 6 0 2 0 21Approved In Home 3 0 0 0 0 0 0 0 0 3
Military Center 4 0 1 0 0 0 0 0 0 5Military Home 0 0 0 0 0 0 0 0 0 0
PASS I In Home 3 0 0 0 0 0 0 0 0 3Tribal Approved 0 0 0 0 0 0 0 0 0 0Exempt Center 5 0 0 0 0 0 0 0 0 5Exempt Home 1 0 0 0 0 0 0 0 0 1
Total 295 81 57 2 34 56 6 34 3 568
Table 11: Capacity by licensed provider type and CCAP rate regionProvider Type: Anchorage Fairbanks Gulf Coast Interior Juneau Mat-Su Northern Southeast Southwest Statewide Total
Licensed Center 8,996 1,805 907 29 831 1,690 120 710 142 15,230Licensed Group Home 0 347 168 0 24 108 0 106 0 753
Licensed Home 1,094 167 204 8 109 120 16 48 8 1,774Total 10,090 2,319 1,279 37 964 1,918 136 864 150 17,757

Child Care Services Monthly Report January 2018 Page 6 of 24
CHILD CARE ASSISTANCE PROGRAM (CCAP) PROVIDERSNumbers include providers with a facility status of Active/Open, Extended, or Suspension in Process.
Table 12: Number of licensed providers participating in CCAP by CCAP rate regionProvider Type: Anchorage Fairbanks Gulf Coast Interior Juneau Mat-Su Northern Southeast Southwest Statewide Total
Licensed Center 101 26 15 0 14 19 2 16 2 195Licensed Group Home 0 26 11 0 2 9 0 8 0 56
Licensed Home 126 19 18 1 9 13 0 5 1 192Total 227 71 44 1 25 41 2 29 3 443
Table 13: Percent of licensed providers participating in CCAP*Provider Type: %
Licensed Center 85%Licensed Group Home 88%
Licensed Home 82%All Licensed Provider
Types 84%
*Licensed providers in CCAP (Table 12) divided by all licensed providers (Table 10).
CHILD CARE GRANT (CCG) PROGRAMThe Child Care Grant (CCG) Program is available only to licensed providers participating in CCAP.
Numbers include providers with a facility status of Active/Open, Extended, or Suspension in Process
Table 14: Number of licensed providers participating in CCG by CCAP rate regionProvider Type: Anchorage Fairbanks Gulf Coast Interior Juneau Mat-Su Northern Southeast Southwest Statewide Total
Licensed Center 91 22 12 0 10 19 0 12 1 167Licensed Group Home 0 10 8 0 1 6 0 7 0 32
Licensed Home 47 2 6 0 2 3 0 2 0 62Total 138 34 26 0 13 28 0 21 1 261
Table 15: Percent of licensed providers in CCAP participating in CCG*Provider Type: %
Licensed Center 86%Licensed Group Home 57%
Licensed Home 32%All Licensed Provider
Types 59%
*Licensed providers in CCG (Table 14) divided by all licensed providers in CCAP (Table 12).
Table 16: Number of CCAP children with a verification in licensed providers participating in CCGProvider Type: Anchorage Fairbanks Gulf Coast Interior Juneau Mat-Su Northern Southeast Southwest Statewide Total
Licensed Center 1,013 144 210 0 20 537 0 59 1 1,984Licensed Group Home 0 48 43 0 9 26 0 23 0 149
Licensed Home 185 7 18 0 4 8 0 6 0 228Total 1,198 199 271 0 33 571 0 88 1 2,361
Table 17: Percent of CCAP children in licensed providers participating in CCG*Provider Type: %
Licensed Center 95%Licensed Group Home 60%
Licensed Home 41%All Licensed Provider
Types 82%
*Children with a verification (served) in licensed providers (Table 16) divided by children in all provider types (Table 7).
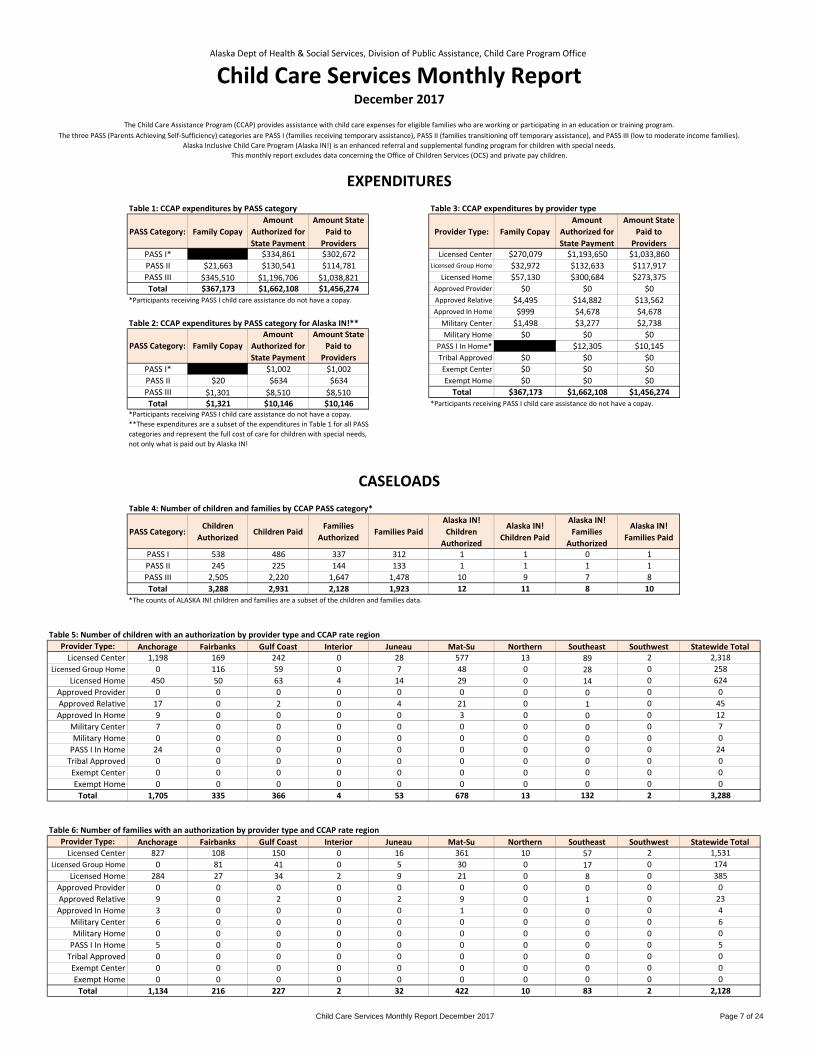
Child Care Services Monthly Report December 2017 Page 7 of 24
Alaska Dept of Health & Social Services, Division of Public Assistance, Child Care Program Office
Child Care Services Monthly ReportDecember 2017
The Child Care Assistance Program (CCAP) provides assistance with child care expenses for eligible families who are working or participating in an education or training program.The three PASS (Parents Achieving Self-Sufficiency) categories are PASS I (families receiving temporary assistance), PASS II (families transitioning off temporary assistance), and PASS III (low to moderate income families).
Alaska Inclusive Child Care Program (Alaska IN!) is an enhanced referral and supplemental funding program for children with special needs.This monthly report excludes data concerning the Office of Children Services (OCS) and private pay children.
EXPENDITURESTable 1: CCAP expenditures by PASS category Table 3: CCAP expenditures by provider type
PASS Category: Family CopayAmount
Authorized for State Payment
Amount State Paid to
ProvidersProvider Type: Family Copay
Amount Authorized for State Payment
Amount State Paid to
ProvidersPASS I* $0 $334,861 $302,672 Licensed Center $270,079 $1,193,650 $1,033,860PASS II $21,663 $130,541 $114,781 Licensed Group Home $32,972 $132,633 $117,917PASS III $345,510 $1,196,706 $1,038,821 Licensed Home $57,130 $300,684 $273,375Total $367,173 $1,662,108 $1,456,274 Approved Provider $0 $0 $0
*Participants receiving PASS I child care assistance do not have a copay. Approved Relative $4,495 $14,882 $13,562Approved In Home $999 $4,678 $4,678
Table 2: CCAP expenditures by PASS category for Alaska IN!** Military Center $1,498 $3,277 $2,738Military Home $0 $0 $0
PASS I In Home* $0 $12,305 $10,145Tribal Approved $0 $0 $0
PASS I* $0 $1,002 $1,002 Exempt Center $0 $0 $0PASS II $20 $634 $634 Exempt Home $0 $0 $0PASS III $1,301 $8,510 $8,510 Total $367,173 $1,662,108 $1,456,274Total $1,321 $10,146 $10,146 *Participants receiving PASS I child care assistance do not have a copay.
*Participants receiving PASS I child care assistance do not have a copay. **These expenditures are a subset of the expenditures in Table 1 for all PASS categories and represent the full cost of care for children with special needs, not only what is paid out by Alaska IN!
CASELOADSTable 4: Number of children and families by CCAP PASS category*
PASS Category:Children
AuthorizedChildren Paid
Families Authorized
Families PaidAlaska IN!Children
Authorized
Alaska IN!Children Paid
Alaska IN!Families
Authorized
Alaska IN!Families Paid
PASS I 538 486 337 312 1 1 0 1PASS II 245 225 144 133 1 1 1 1PASS III 2,505 2,220 1,647 1,478 10 9 7 8Total 3,288 2,931 2,128 1,923 12 11 8 10
*The counts of ALASKA IN! children and families are a subset of the children and families data.
Table 5: Number of children with an authorization by provider type and CCAP rate regionProvider Type: Anchorage Fairbanks Gulf Coast Interior Juneau Mat-Su Northern Southeast Southwest Statewide Total
Licensed Center 1,198 169 242 0 28 577 13 89 2 2,318Licensed Group Home 0 116 59 0 7 48 0 28 0 258
Licensed Home 450 50 63 4 14 29 0 14 0 624Approved Provider 0 0 0 0 0 0 0 0 0 0Approved Relative 17 0 2 0 4 21 0 1 0 45Approved In Home 9 0 0 0 0 3 0 0 0 12
Military Center 7 0 0 0 0 0 0 0 0 7Military Home 0 0 0 0 0 0 0 0 0 0
PASS I In Home 24 0 0 0 0 0 0 0 0 24Tribal Approved 0 0 0 0 0 0 0 0 0 0Exempt Center 0 0 0 0 0 0 0 0 0 0Exempt Home 0 0 0 0 0 0 0 0 0 0
Total 1,705 335 366 4 53 678 13 132 2 3,288
Table 6: Number of families with an authorization by provider type and CCAP rate regionProvider Type: Anchorage Fairbanks Gulf Coast Interior Juneau Mat-Su Northern Southeast Southwest Statewide Total
Licensed Center 827 108 150 0 16 361 10 57 2 1,531Licensed Group Home 0 81 41 0 5 30 0 17 0 174
Licensed Home 284 27 34 2 9 21 0 8 0 385Approved Provider 0 0 0 0 0 0 0 0 0 0Approved Relative 9 0 2 0 2 9 0 1 0 23Approved In Home 3 0 0 0 0 1 0 0 0 4
Military Center 6 0 0 0 0 0 0 0 0 6Military Home 0 0 0 0 0 0 0 0 0 0
PASS I In Home 5 0 0 0 0 0 0 0 0 5Tribal Approved 0 0 0 0 0 0 0 0 0 0Exempt Center 0 0 0 0 0 0 0 0 0 0Exempt Home 0 0 0 0 0 0 0 0 0 0
Total 1,134 216 227 2 32 422 10 83 2 2,128
PASS Category: Family CopayAmount
Authorized for State Payment
Amount State Paid to
Providers
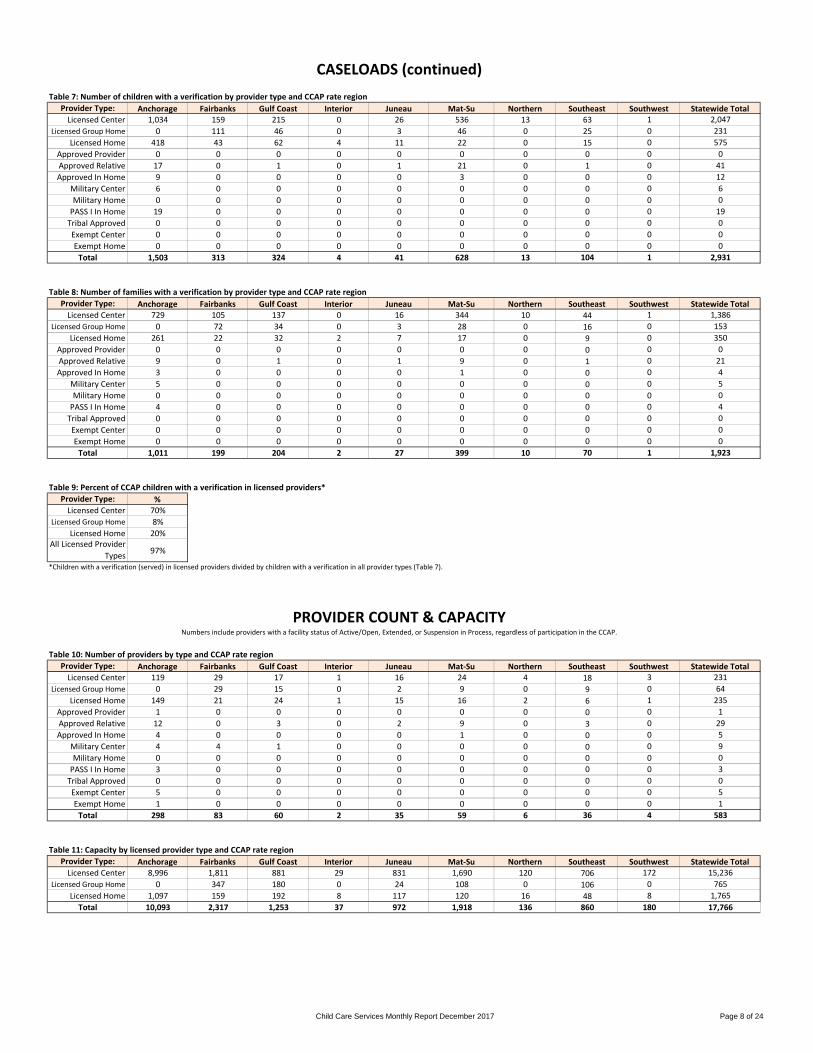
Child Care Services Monthly Report December 2017 Page 8 of 24
CASELOADS (continued)Table 7: Number of children with a verification by provider type and CCAP rate region
Provider Type: Anchorage Fairbanks Gulf Coast Interior Juneau Mat-Su Northern Southeast Southwest Statewide TotalLicensed Center 1,034 159 215 0 26 536 13 63 1 2,047
Licensed Group Home 0 111 46 0 3 46 0 25 0 231Licensed Home 418 43 62 4 11 22 0 15 0 575
Approved Provider 0 0 0 0 0 0 0 0 0 0Approved Relative 17 0 1 0 1 21 0 1 0 41Approved In Home 9 0 0 0 0 3 0 0 0 12
Military Center 6 0 0 0 0 0 0 0 0 6Military Home 0 0 0 0 0 0 0 0 0 0
PASS I In Home 19 0 0 0 0 0 0 0 0 19Tribal Approved 0 0 0 0 0 0 0 0 0 0Exempt Center 0 0 0 0 0 0 0 0 0 0Exempt Home 0 0 0 0 0 0 0 0 0 0
Total 1,503 313 324 4 41 628 13 104 1 2,931
Table 8: Number of families with a verification by provider type and CCAP rate regionProvider Type: Anchorage Fairbanks Gulf Coast Interior Juneau Mat-Su Northern Southeast Southwest Statewide Total
Licensed Center 729 105 137 0 16 344 10 44 1 1,386Licensed Group Home 0 72 34 0 3 28 0 16 0 153
Licensed Home 261 22 32 2 7 17 0 9 0 350Approved Provider 0 0 0 0 0 0 0 0 0 0Approved Relative 9 0 1 0 1 9 0 1 0 21Approved In Home 3 0 0 0 0 1 0 0 0 4
Military Center 5 0 0 0 0 0 0 0 0 5Military Home 0 0 0 0 0 0 0 0 0 0
PASS I In Home 4 0 0 0 0 0 0 0 0 4Tribal Approved 0 0 0 0 0 0 0 0 0 0Exempt Center 0 0 0 0 0 0 0 0 0 0Exempt Home 0 0 0 0 0 0 0 0 0 0
Total 1,011 199 204 2 27 399 10 70 1 1,923
Table 9: Percent of CCAP children with a verification in licensed providers*Provider Type: %
Licensed Center 70%Licensed Group Home 8%
Licensed Home 20%All Licensed Provider
Types 97%
*Children with a verification (served) in licensed providers divided by children with a verification in all provider types (Table 7).
PROVIDER COUNT & CAPACITYNumbers include providers with a facility status of Active/Open, Extended, or Suspension in Process, regardless of participation in the CCAP.
Table 10: Number of providers by type and CCAP rate region Provider Type: Anchorage Fairbanks Gulf Coast Interior Juneau Mat-Su Northern Southeast Southwest Statewide Total
Licensed Center 119 29 17 1 16 24 4 18 3 231Licensed Group Home 0 29 15 0 2 9 0 9 0 64
Licensed Home 149 21 24 1 15 16 2 6 1 235Approved Provider 1 0 0 0 0 0 0 0 0 1Approved Relative 12 0 3 0 2 9 0 3 0 29Approved In Home 4 0 0 0 0 1 0 0 0 5
Military Center 4 4 1 0 0 0 0 0 0 9Military Home 0 0 0 0 0 0 0 0 0 0
PASS I In Home 3 0 0 0 0 0 0 0 0 3Tribal Approved 0 0 0 0 0 0 0 0 0 0Exempt Center 5 0 0 0 0 0 0 0 0 5Exempt Home 1 0 0 0 0 0 0 0 0 1
Total 298 83 60 2 35 59 6 36 4 583
Table 11: Capacity by licensed provider type and CCAP rate regionProvider Type: Anchorage Fairbanks Gulf Coast Interior Juneau Mat-Su Northern Southeast Southwest Statewide Total
Licensed Center 8,996 1,811 881 29 831 1,690 120 706 172 15,236Licensed Group Home 0 347 180 0 24 108 0 106 0 765
Licensed Home 1,097 159 192 8 117 120 16 48 8 1,765Total 10,093 2,317 1,253 37 972 1,918 136 860 180 17,766
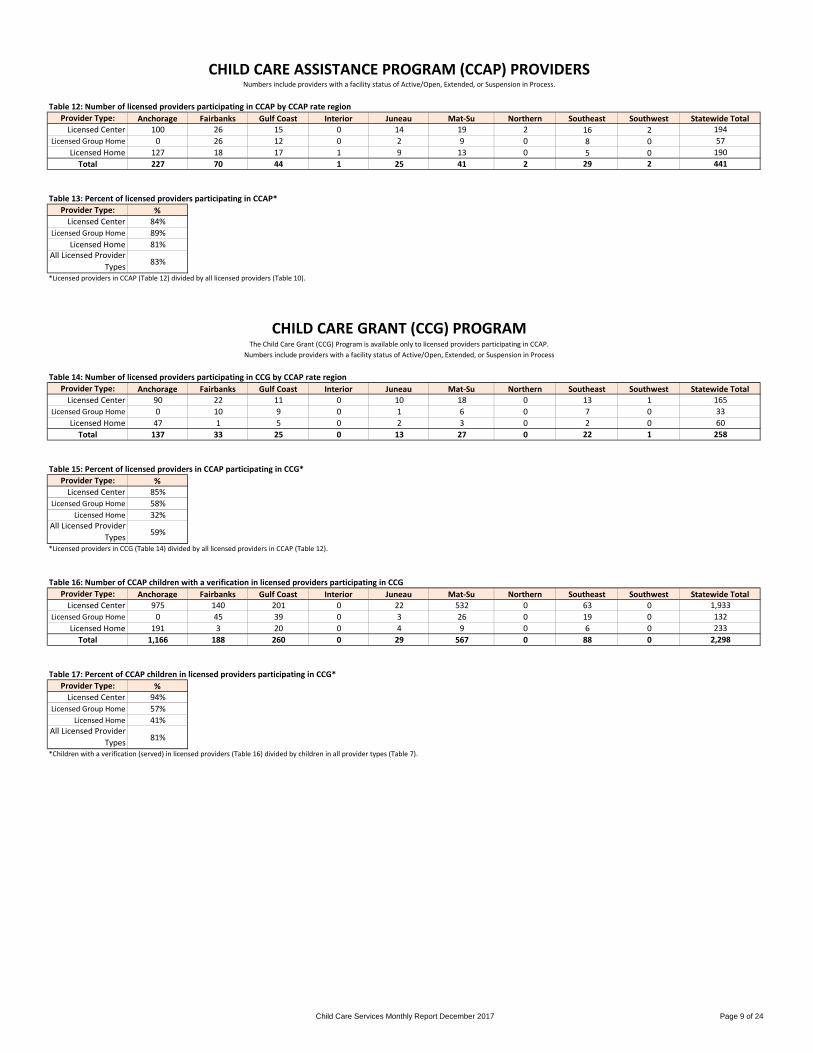
Child Care Services Monthly Report December 2017 Page 9 of 24
CHILD CARE ASSISTANCE PROGRAM (CCAP) PROVIDERSNumbers include providers with a facility status of Active/Open, Extended, or Suspension in Process.
Table 12: Number of licensed providers participating in CCAP by CCAP rate regionProvider Type: Anchorage Fairbanks Gulf Coast Interior Juneau Mat-Su Northern Southeast Southwest Statewide Total
Licensed Center 100 26 15 0 14 19 2 16 2 194Licensed Group Home 0 26 12 0 2 9 0 8 0 57
Licensed Home 127 18 17 1 9 13 0 5 0 190Total 227 70 44 1 25 41 2 29 2 441
Table 13: Percent of licensed providers participating in CCAP*Provider Type: %
Licensed Center 84%Licensed Group Home 89%
Licensed Home 81%All Licensed Provider
Types 83%
*Licensed providers in CCAP (Table 12) divided by all licensed providers (Table 10).
CHILD CARE GRANT (CCG) PROGRAMThe Child Care Grant (CCG) Program is available only to licensed providers participating in CCAP.
Numbers include providers with a facility status of Active/Open, Extended, or Suspension in Process
Table 14: Number of licensed providers participating in CCG by CCAP rate regionProvider Type: Anchorage Fairbanks Gulf Coast Interior Juneau Mat-Su Northern Southeast Southwest Statewide Total
Licensed Center 90 22 11 0 10 18 0 13 1 165Licensed Group Home 0 10 9 0 1 6 0 7 0 33
Licensed Home 47 1 5 0 2 3 0 2 0 60Total 137 33 25 0 13 27 0 22 1 258
Table 15: Percent of licensed providers in CCAP participating in CCG*Provider Type: %
Licensed Center 85%Licensed Group Home 58%
Licensed Home 32%All Licensed Provider
Types 59%
*Licensed providers in CCG (Table 14) divided by all licensed providers in CCAP (Table 12).
Table 16: Number of CCAP children with a verification in licensed providers participating in CCGProvider Type: Anchorage Fairbanks Gulf Coast Interior Juneau Mat-Su Northern Southeast Southwest Statewide Total
Licensed Center 975 140 201 0 22 532 0 63 0 1,933Licensed Group Home 0 45 39 0 3 26 0 19 0 132
Licensed Home 191 3 20 0 4 9 0 6 0 233Total 1,166 188 260 0 29 567 0 88 0 2,298
Table 17: Percent of CCAP children in licensed providers participating in CCG*Provider Type: %
Licensed Center 94%Licensed Group Home 57%
Licensed Home 41%All Licensed Provider
Types 81%
*Children with a verification (served) in licensed providers (Table 16) divided by children in all provider types (Table 7).
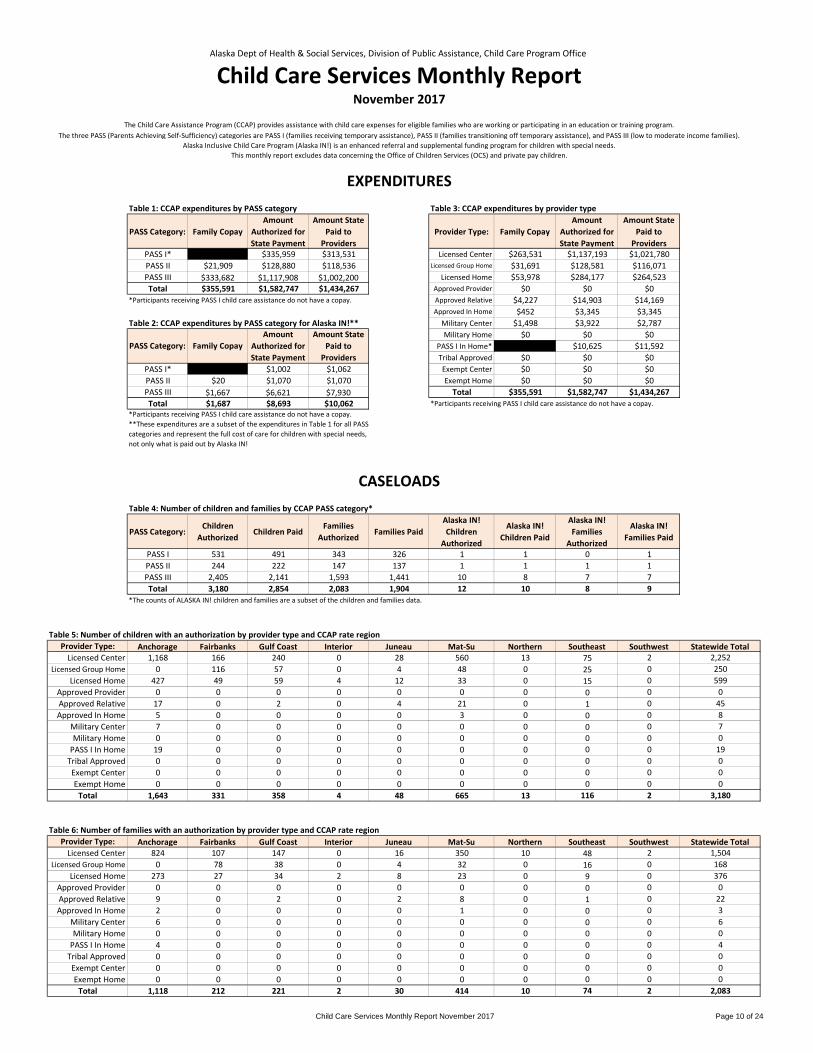
Child Care Services Monthly Report November 2017 Page 10 of 24
Alaska Dept of Health & Social Services, Division of Public Assistance, Child Care Program Office
Child Care Services Monthly ReportNovember 2017
The Child Care Assistance Program (CCAP) provides assistance with child care expenses for eligible families who are working or participating in an education or training program.The three PASS (Parents Achieving Self-Sufficiency) categories are PASS I (families receiving temporary assistance), PASS II (families transitioning off temporary assistance), and PASS III (low to moderate income families).
Alaska Inclusive Child Care Program (Alaska IN!) is an enhanced referral and supplemental funding program for children with special needs.This monthly report excludes data concerning the Office of Children Services (OCS) and private pay children.
EXPENDITURESTable 1: CCAP expenditures by PASS category Table 3: CCAP expenditures by provider type
PASS Category: Family CopayAmount
Authorized for State Payment
Amount State Paid to
ProvidersProvider Type: Family Copay
Amount Authorized for State Payment
Amount State Paid to
ProvidersPASS I* $0 $335,959 $313,531 Licensed Center $263,531 $1,137,193 $1,021,780PASS II $21,909 $128,880 $118,536 Licensed Group Home $31,691 $128,581 $116,071PASS III $333,682 $1,117,908 $1,002,200 Licensed Home $53,978 $284,177 $264,523Total $355,591 $1,582,747 $1,434,267 Approved Provider $0 $0 $0
*Participants receiving PASS I child care assistance do not have a copay. Approved Relative $4,227 $14,903 $14,169Approved In Home $452 $3,345 $3,345
Table 2: CCAP expenditures by PASS category for Alaska IN!** Military Center $1,498 $3,922 $2,787Military Home $0 $0 $0
PASS I In Home* $214 $10,625 $11,592Tribal Approved $0 $0 $0
PASS I* $0 $1,002 $1,062 Exempt Center $0 $0 $0PASS II $20 $1,070 $1,070 Exempt Home $0 $0 $0PASS III $1,667 $6,621 $7,930 Total $355,591 $1,582,747 $1,434,267Total $1,687 $8,693 $10,062 *Participants receiving PASS I child care assistance do not have a copay.
*Participants receiving PASS I child care assistance do not have a copay. **These expenditures are a subset of the expenditures in Table 1 for all PASS categories and represent the full cost of care for children with special needs, not only what is paid out by Alaska IN!
CASELOADSTable 4: Number of children and families by CCAP PASS category*
PASS Category:Children
AuthorizedChildren Paid
Families Authorized
Families PaidAlaska IN!Children
Authorized
Alaska IN!Children Paid
Alaska IN!Families
Authorized
Alaska IN!Families Paid
PASS I 531 491 343 326 1 1 0 1PASS II 244 222 147 137 1 1 1 1PASS III 2,405 2,141 1,593 1,441 10 8 7 7Total 3,180 2,854 2,083 1,904 12 10 8 9
*The counts of ALASKA IN! children and families are a subset of the children and families data.
Table 5: Number of children with an authorization by provider type and CCAP rate regionProvider Type: Anchorage Fairbanks Gulf Coast Interior Juneau Mat-Su Northern Southeast Southwest Statewide Total
Licensed Center 1,168 166 240 0 28 560 13 75 2 2,252Licensed Group Home 0 116 57 0 4 48 0 25 0 250
Licensed Home 427 49 59 4 12 33 0 15 0 599Approved Provider 0 0 0 0 0 0 0 0 0 0Approved Relative 17 0 2 0 4 21 0 1 0 45Approved In Home 5 0 0 0 0 3 0 0 0 8
Military Center 7 0 0 0 0 0 0 0 0 7Military Home 0 0 0 0 0 0 0 0 0 0
PASS I In Home 19 0 0 0 0 0 0 0 0 19Tribal Approved 0 0 0 0 0 0 0 0 0 0Exempt Center 0 0 0 0 0 0 0 0 0 0Exempt Home 0 0 0 0 0 0 0 0 0 0
Total 1,643 331 358 4 48 665 13 116 2 3,180
Table 6: Number of families with an authorization by provider type and CCAP rate regionProvider Type: Anchorage Fairbanks Gulf Coast Interior Juneau Mat-Su Northern Southeast Southwest Statewide Total
Licensed Center 824 107 147 0 16 350 10 48 2 1,504Licensed Group Home 0 78 38 0 4 32 0 16 0 168
Licensed Home 273 27 34 2 8 23 0 9 0 376Approved Provider 0 0 0 0 0 0 0 0 0 0Approved Relative 9 0 2 0 2 8 0 1 0 22Approved In Home 2 0 0 0 0 1 0 0 0 3
Military Center 6 0 0 0 0 0 0 0 0 6Military Home 0 0 0 0 0 0 0 0 0 0
PASS I In Home 4 0 0 0 0 0 0 0 0 4Tribal Approved 0 0 0 0 0 0 0 0 0 0Exempt Center 0 0 0 0 0 0 0 0 0 0Exempt Home 0 0 0 0 0 0 0 0 0 0
Total 1,118 212 221 2 30 414 10 74 2 2,083
PASS Category: Family CopayAmount
Authorized for State Payment
Amount State Paid to
Providers

Child Care Services Monthly Report November 2017 Page 11 of 24
CASELOADS (continued)Table 7: Number of children with a verification by provider type and CCAP rate region
Provider Type: Anchorage Fairbanks Gulf Coast Interior Juneau Mat-Su Northern Southeast Southwest Statewide TotalLicensed Center 1,025 161 211 0 26 521 12 55 2 2,013
Licensed Group Home 0 109 44 0 3 46 0 25 0 227Licensed Home 386 45 54 4 10 31 0 14 0 544
Approved Provider 0 0 0 0 0 0 0 0 0 0Approved Relative 17 0 2 0 1 21 0 1 0 42Approved In Home 5 0 0 0 0 3 0 0 0 8
Military Center 5 0 0 0 0 0 0 0 0 5Military Home 0 0 0 0 0 0 0 0 0 0
PASS I In Home 15 0 0 0 0 0 0 0 0 15Tribal Approved 0 0 0 0 0 0 0 0 0 0Exempt Center 0 0 0 0 0 0 0 0 0 0Exempt Home 0 0 0 0 0 0 0 0 0 0
Total 1,453 315 311 4 40 622 12 95 2 2,854
Table 8: Number of families with a verification by provider type and CCAP rate regionProvider Type: Anchorage Fairbanks Gulf Coast Interior Juneau Mat-Su Northern Southeast Southwest Statewide Total
Licensed Center 742 108 137 0 15 336 9 36 2 1,385Licensed Group Home 0 69 31 0 3 29 0 16 0 148
Licensed Home 249 24 29 2 6 22 0 8 0 340Approved Provider 0 0 0 0 0 0 0 0 0 0Approved Relative 9 0 2 0 1 8 0 1 0 21Approved In Home 2 0 0 0 0 1 0 0 0 3
Military Center 4 0 0 0 0 0 0 0 0 4Military Home 0 0 0 0 0 0 0 0 0 0
PASS I In Home 3 0 0 0 0 0 0 0 0 3Tribal Approved 0 0 0 0 0 0 0 0 0 0Exempt Center 0 0 0 0 0 0 0 0 0 0Exempt Home 0 0 0 0 0 0 0 0 0 0
Total 1,009 201 199 2 25 396 9 61 2 1,904
Table 9: Percent of CCAP children with a verification in licensed providers*Provider Type: %
Licensed Center 71%Licensed Group Home 8%
Licensed Home 19%All Licensed Provider
Types 98%
*Children with a verification (served) in licensed providers divided by children with a verification in all provider types (Table 7).
PROVIDER COUNT & CAPACITYNumbers include providers with a facility status of Active/Open, Extended, or Suspension in Process, regardless of participation in the CCAP.
Table 10: Number of providers by type and CCAP rate region Provider Type: Anchorage Fairbanks Gulf Coast Interior Juneau Mat-Su Northern Southeast Southwest Statewide Total
Licensed Center 119 29 19 1 16 24 4 17 3 232Licensed Group Home 0 30 15 0 2 9 0 9 0 65
Licensed Home 152 20 24 1 15 16 2 6 1 237Approved Provider 1 0 0 0 0 0 0 0 0 1Approved Relative 13 0 3 0 2 8 0 2 0 28Approved In Home 4 0 0 0 0 1 0 0 0 5
Military Center 4 4 1 0 0 0 0 0 0 9Military Home 0 0 0 0 0 0 0 0 0 0
PASS I In Home 3 0 0 0 0 0 0 0 0 3Tribal Approved 0 0 0 0 0 0 0 0 0 0Exempt Center 5 0 0 0 0 0 0 0 0 5Exempt Home 1 0 0 0 0 0 0 0 0 1
Total 302 83 62 2 35 58 6 34 4 586
Table 11: Capacity by licensed provider type and CCAP rate regionProvider Type: Anchorage Fairbanks Gulf Coast Interior Juneau Mat-Su Northern Southeast Southwest Statewide Total
Licensed Center 8,996 1,811 901 29 831 1,690 120 706 172 15,256Licensed Group Home 0 359 180 0 24 108 0 106 0 777
Licensed Home 1,104 151 192 8 109 120 16 48 8 1,756Total 10,100 2,321 1,273 37 964 1,918 136 860 180 17,789

Child Care Services Monthly Report November 2017 Page 12 of 24
CHILD CARE ASSISTANCE PROGRAM (CCAP) PROVIDERSNumbers include providers with a facility status of Active/Open, Extended, or Suspension in Process.
Table 12: Number of licensed providers participating in CCAP by CCAP rate regionProvider Type: Anchorage Fairbanks Gulf Coast Interior Juneau Mat-Su Northern Southeast Southwest Statewide Total
Licensed Center 99 27 16 1 14 19 3 16 3 198Licensed Group Home 0 28 12 0 2 9 0 8 0 59
Licensed Home 130 18 20 1 9 13 0 5 1 197Total 229 73 48 2 25 41 3 29 4 454
Table 13: Percent of licensed providers participating in CCAP*Provider Type: %
Licensed Center 85%Licensed Group Home 91%
Licensed Home 83%All Licensed Provider
Types 85%
*Licensed providers in CCAP (Table 12) divided by all licensed providers (Table 10).
CHILD CARE GRANT (CCG) PROGRAMThe Child Care Grant (CCG) Program is available only to licensed providers participating in CCAP.
Numbers include providers with a facility status of Active/Open, Extended, or Suspension in Process
Table 14: Number of licensed providers participating in CCG by CCAP rate regionProvider Type: Anchorage Fairbanks Gulf Coast Interior Juneau Mat-Su Northern Southeast Southwest Statewide Total
Licensed Center 89 22 12 0 11 18 1 13 1 167Licensed Group Home 0 10 10 0 1 7 0 7 0 35
Licensed Home 50 2 6 0 2 2 0 2 0 64Total 139 34 28 0 14 27 1 22 1 266
Table 15: Percent of licensed providers in CCAP participating in CCG*Provider Type: %
Licensed Center 84%Licensed Group Home 59%
Licensed Home 32%All Licensed Provider
Types 59%
*Licensed providers in CCG (Table 14) divided by all licensed providers in CCAP (Table 12).
Table 16: Number of CCAP children with a verification in licensed providers participating in CCGProvider Type: Anchorage Fairbanks Gulf Coast Interior Juneau Mat-Su Northern Southeast Southwest Statewide Total
Licensed Center 964 139 202 0 22 519 0 55 0 1,901Licensed Group Home 0 41 40 0 3 35 0 19 0 138
Licensed Home 186 4 16 0 4 8 0 6 0 224Total 1,150 184 258 0 29 562 0 80 0 2,263
Table 17: Percent of CCAP children in licensed providers participating in CCG*Provider Type: %
Licensed Center 94%Licensed Group Home 61%
Licensed Home 41%All Licensed Provider
Types 81%
*Children with a verification (served) in licensed providers (Table 16) divided by children in all provider types (Table 7).

Child Care Services Monthly Report October 2017 Page 13 of 24
Alaska Dept of Health & Social Services, Division of Public Assistance, Child Care Program Office
Child Care Services Monthly ReportOctober 2017
The Child Care Assistance Program (CCAP) provides assistance with child care expenses for eligible families who are working or participating in an education or training program.The three PASS (Parents Achieving Self-Sufficiency) categories are PASS I (families receiving temporary assistance), PASS II (families transitioning off temporary assistance), and PASS III (low to moderate income families).
Alaska Inclusive Child Care Program (Alaska IN!) is an enhanced referral and supplemental funding program for children with special needs.This monthly report excludes data concerning the Office of Children Services (OCS) and private pay children.
EXPENDITURESTable 1: CCAP expenditures by PASS category Table 3: CCAP expenditures by provider type
PASS Category: Family CopayAmount
Authorized for State Payment
Amount State Paid to
ProvidersProvider Type: Family Copay
Amount Authorized for State Payment
Amount State Paid to
ProvidersPASS I* $0 $379,462 $334,866 Licensed Center $260,351 $1,252,050 $1,089,011PASS II $20,408 $124,920 $111,872 Licensed Group Home $31,523 $139,511 $123,516PASS III $327,031 $1,209,791 $1,059,446 Licensed Home $49,900 $285,922 $261,965Total $347,439 $1,714,173 $1,506,184 Approved Provider $0 $0 $0
*Participants receiving PASS I child care assistance do not have a copay. Approved Relative $3,515 $17,133 $15,026Approved In Home $652 $4,582 $3,429
Table 2: CCAP expenditures by PASS category for Alaska IN!** Military Center $1,498 $4,136 $2,604Military Home $0 $0 $0
PASS I In Home* $0 $10,839 $10,632Tribal Approved $0 $0 $0
PASS I* $0 $1,002 $1,092 Exempt Center $0 $0 $0PASS II $20 $1,070 $1,120 Exempt Home $0 $0 $0PASS III $1,586 $7,141 $7,171 Total $347,439 $1,714,173 $1,506,184Total $1,606 $9,213 $9,383 *Participants receiving PASS I child care assistance do not have a copay.
*Participants receiving PASS I child care assistance do not have a copay. **These expenditures are a subset of the expenditures in Table 1 for all PASS categories and represent the full cost of care for children with special needs, not only what is paid out by Alaska IN!
CASELOADSTable 4: Number of children and families by CCAP PASS category*
PASS Category:Children
AuthorizedChildren Paid
Families Authorized
Families PaidAlaska IN!Children
Authorized
Alaska IN!Children Paid
Alaska IN!Families
Authorized
Alaska IN!Families Paid
PASS I 600 530 380 346 1 1 0 1PASS II 231 206 139 126 1 1 1 1PASS III 2,381 2,092 1,571 1,391 9 8 6 7Total 3,212 2,828 2,090 1,863 11 10 7 9
*The counts of ALASKA IN! children and families are a subset of the children and families data.
Table 5: Number of children with an authorization by provider type and CCAP rate regionProvider Type: Anchorage Fairbanks Gulf Coast Interior Juneau Mat-Su Northern Southeast Southwest Statewide Total
Licensed Center 1,191 162 249 0 27 571 16 67 2 2,285Licensed Group Home 0 109 61 0 3 53 0 26 0 252
Licensed Home 425 49 55 4 16 26 0 13 0 588Approved Provider 0 0 0 0 0 0 0 0 0 0Approved Relative 22 0 3 0 4 18 0 1 0 48Approved In Home 10 0 0 0 0 3 0 0 0 13
Military Center 7 0 0 0 0 0 0 0 0 7Military Home 0 0 0 0 0 0 0 0 0 0
PASS I In Home 19 0 0 0 0 0 0 0 0 19Tribal Approved 0 0 0 0 0 0 0 0 0 0Exempt Center 0 0 0 0 0 0 0 0 0 0Exempt Home 0 0 0 0 0 0 0 0 0 0
Total 1,674 320 368 4 50 671 16 107 2 3,212
Table 6: Number of families with an authorization by provider type and CCAP rate regionProvider Type: Anchorage Fairbanks Gulf Coast Interior Juneau Mat-Su Northern Southeast Southwest Statewide Total
Licensed Center 842 107 152 0 16 349 12 44 2 1,524Licensed Group Home 0 76 41 0 3 35 0 17 0 172
Licensed Home 263 26 32 2 10 18 0 7 0 358Approved Provider 0 0 0 0 0 0 0 0 0 0Approved Relative 10 0 2 0 2 7 0 1 0 22Approved In Home 3 0 0 0 0 1 0 0 0 4
Military Center 6 0 0 0 0 0 0 0 0 6Military Home 0 0 0 0 0 0 0 0 0 0
PASS I In Home 4 0 0 0 0 0 0 0 0 4Tribal Approved 0 0 0 0 0 0 0 0 0 0Exempt Center 0 0 0 0 0 0 0 0 0 0Exempt Home 0 0 0 0 0 0 0 0 0 0
Total 1,128 209 227 2 31 410 12 69 2 2,090
PASS Category: Family CopayAmount
Authorized for State Payment
Amount State Paid to
Providers

Child Care Services Monthly Report October 2017 Page 14 of 24
CASELOADS (continued)Table 7: Number of children with a verification by provider type and CCAP rate region
Provider Type: Anchorage Fairbanks Gulf Coast Interior Juneau Mat-Su Northern Southeast Southwest Statewide TotalLicensed Center 1,017 152 221 0 27 530 5 49 2 2,003
Licensed Group Home 0 101 50 0 3 47 0 26 0 227Licensed Home 378 46 47 0 13 24 0 13 0 521
Approved Provider 0 0 0 0 0 0 0 0 0 0Approved Relative 22 0 2 0 1 18 0 1 0 44Approved In Home 5 0 0 0 0 3 0 0 0 8
Military Center 6 0 0 0 0 0 0 0 0 6Military Home 0 0 0 0 0 0 0 0 0 0
PASS I In Home 19 0 0 0 0 0 0 0 0 19Tribal Approved 0 0 0 0 0 0 0 0 0 0Exempt Center 0 0 0 0 0 0 0 0 0 0Exempt Home 0 0 0 0 0 0 0 0 0 0
Total 1,447 299 320 0 44 622 5 89 2 2,828
Table 8: Number of families with a verification by provider type and CCAP rate regionProvider Type: Anchorage Fairbanks Gulf Coast Interior Juneau Mat-Su Northern Southeast Southwest Statewide Total
Licensed Center 731 105 139 0 16 330 4 32 2 1,359Licensed Group Home 0 65 33 0 3 31 0 17 0 149
Licensed Home 239 24 27 0 8 17 0 7 0 322Approved Provider 0 0 0 0 0 0 0 0 0 0Approved Relative 10 0 2 0 1 7 0 1 0 21Approved In Home 2 0 0 0 0 1 0 0 0 3
Military Center 5 0 0 0 0 0 0 0 0 5Military Home 0 0 0 0 0 0 0 0 0 0
PASS I In Home 4 0 0 0 0 0 0 0 0 4Tribal Approved 0 0 0 0 0 0 0 0 0 0Exempt Center 0 0 0 0 0 0 0 0 0 0Exempt Home 0 0 0 0 0 0 0 0 0 0
Total 991 194 201 0 28 386 4 57 2 1,863
Table 9: Percent of CCAP children with a verification in licensed providers*Provider Type: %
Licensed Center 71%Licensed Group Home 8%
Licensed Home 18%All Licensed Provider
Types 97%
*Children with a verification (served) in licensed providers divided by children with a verification in all provider types (Table 7).
PROVIDER COUNT & CAPACITYNumbers include providers with a facility status of Active/Open, Extended, or Suspension in Process, regardless of participation in the CCAP.
Table 10: Number of providers by type and CCAP rate region Provider Type: Anchorage Fairbanks Gulf Coast Interior Juneau Mat-Su Northern Southeast Southwest Statewide Total
Licensed Center 119 29 18 1 16 24 4 17 3 231Licensed Group Home 0 31 15 0 2 9 0 9 0 66
Licensed Home 150 19 24 1 15 16 2 6 1 234Approved Provider 1 0 0 0 0 0 0 0 0 1Approved Relative 13 0 3 0 2 8 0 3 0 29Approved In Home 3 0 0 0 0 1 0 0 0 4
Military Center 4 4 1 0 0 0 0 0 0 9Military Home 0 0 0 0 0 0 0 0 0 0
PASS I In Home 4 0 0 0 0 0 0 0 0 4Tribal Approved 0 0 0 0 0 0 0 0 0 0Exempt Center 5 0 0 0 0 0 0 0 0 5Exempt Home 1 0 0 0 0 0 0 0 0 1
Total 300 83 61 2 35 58 6 35 4 584
Table 11: Capacity by licensed provider type and CCAP rate regionProvider Type: Anchorage Fairbanks Gulf Coast Interior Juneau Mat-Su Northern Southeast Southwest Statewide Total
Licensed Center 8,996 1,783 901 29 831 1,690 120 706 172 15,228Licensed Group Home 0 371 180 0 24 108 0 106 0 789
Licensed Home 1,085 151 192 8 117 120 16 48 8 1,745Total 10,081 2,305 1,273 37 972 1,918 136 860 180 17,762

Child Care Services Monthly Report October 2017 Page 15 of 24
CHILD CARE ASSISTANCE PROGRAM (CCAP) PROVIDERSNumbers include providers with a facility status of Active/Open, Extended, or Suspension in Process.
Table 12: Number of licensed providers participating in CCAP by CCAP rate regionProvider Type: Anchorage Fairbanks Gulf Coast Interior Juneau Mat-Su Northern Southeast Southwest Statewide Total
Licensed Center 100 26 16 1 16 19 3 16 3 200Licensed Group Home 0 29 12 0 2 9 0 8 0 60
Licensed Home 130 17 21 1 11 14 0 5 1 200Total 230 72 49 2 29 42 3 29 4 460
Table 13: Percent of licensed providers participating in CCAP*Provider Type: %
Licensed Center 87%Licensed Group Home 91%
Licensed Home 85%All Licensed Provider
Types 87%
*Licensed providers in CCAP (Table 12) divided by all licensed providers (Table 10).
CHILD CARE GRANT (CCG) PROGRAMThe Child Care Grant (CCG) Program is available only to licensed providers participating in CCAP.
Numbers include providers with a facility status of Active/Open, Extended, or Suspension in Process
Table 14: Number of licensed providers participating in CCG by CCAP rate regionProvider Type: Anchorage Fairbanks Gulf Coast Interior Juneau Mat-Su Northern Southeast Southwest Statewide Total
Licensed Center 87 20 12 0 13 18 1 13 1 165Licensed Group Home 0 10 10 0 1 7 0 7 0 35
Licensed Home 50 2 7 0 2 2 0 2 0 65Total 137 32 29 0 16 27 1 22 1 265
Table 15: Percent of licensed providers in CCAP participating in CCG*Provider Type: %
Licensed Center 83%Licensed Group Home 58%
Licensed Home 33%All Licensed Provider
Types 58%
*Licensed providers in CCG (Table 14) divided by all licensed providers in CCAP (Table 12).
Table 16: Number of CCAP children with a verification in licensed providers participating in CCGProvider Type: Anchorage Fairbanks Gulf Coast Interior Juneau Mat-Su Northern Southeast Southwest Statewide Total
Licensed Center 954 130 213 0 24 528 0 49 0 1,898Licensed Group Home 0 37 41 0 3 36 0 18 0 135
Licensed Home 178 4 12 0 6 5 0 5 0 210Total 1,132 171 266 0 33 569 0 72 0 2,243
Table 17: Percent of CCAP children in licensed providers participating in CCG*Provider Type: %
Licensed Center 95%Licensed Group Home 59%
Licensed Home 40%All Licensed Provider
Types 82%
*Children with a verification (served) in licensed providers (Table 16) divided by children in all provider types (Table 7).
Child Care Services Monthly Report September 2017 Page 16 of 24
Alaska Dept of Health & Social Services, Division of Public Assistance, Child Care Program Office
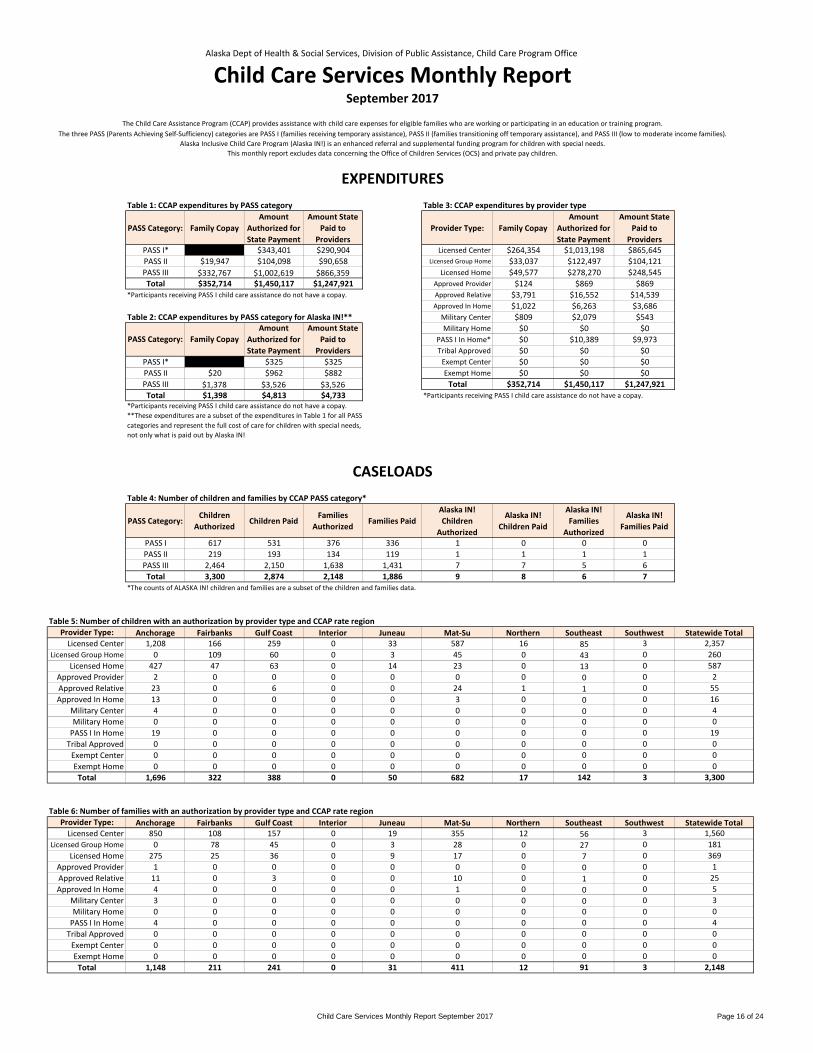
Child Care Services Monthly ReportSeptember 2017
The Child Care Assistance Program (CCAP) provides assistance with child care expenses for eligible families who are working or participating in an education or training program.The three PASS (Parents Achieving Self-Sufficiency) categories are PASS I (families receiving temporary assistance), PASS II (families transitioning off temporary assistance), and PASS III (low to moderate income families).
Alaska Inclusive Child Care Program (Alaska IN!) is an enhanced referral and supplemental funding program for children with special needs.This monthly report excludes data concerning the Office of Children Services (OCS) and private pay children.
EXPENDITURESTable 1: CCAP expenditures by PASS category Table 3: CCAP expenditures by provider type
PASS Category: Family CopayAmount
Authorized for State Payment
Amount State Paid to
ProvidersProvider Type: Family Copay
Amount Authorized for State Payment
Amount State Paid to
ProvidersPASS I* $0 $343,401 $290,904 Licensed Center $264,354 $1,013,198 $865,645PASS II $19,947 $104,098 $90,658 Licensed Group Home $33,037 $122,497 $104,121PASS III $332,767 $1,002,619 $866,359 Licensed Home $49,577 $278,270 $248,545Total $352,714 $1,450,117 $1,247,921 Approved Provider $124 $869 $869
*Participants receiving PASS I child care assistance do not have a copay. Approved Relative $3,791 $16,552 $14,539Approved In Home $1,022 $6,263 $3,686
Table 2: CCAP expenditures by PASS category for Alaska IN!** Military Center $809 $2,079 $543Military Home $0 $0 $0
PASS I In Home* $0 $10,389 $9,973Tribal Approved $0 $0 $0
PASS I* $0 $325 $325 Exempt Center $0 $0 $0PASS II $20 $962 $882 Exempt Home $0 $0 $0PASS III $1,378 $3,526 $3,526 Total $352,714 $1,450,117 $1,247,921Total $1,398 $4,813 $4,733 *Participants receiving PASS I child care assistance do not have a copay.
*Participants receiving PASS I child care assistance do not have a copay. **These expenditures are a subset of the expenditures in Table 1 for all PASS categories and represent the full cost of care for children with special needs, not only what is paid out by Alaska IN!
CASELOADSTable 4: Number of children and families by CCAP PASS category*
PASS Category:Children
AuthorizedChildren Paid
Families Authorized
Families PaidAlaska IN!Children
Authorized
Alaska IN!Children Paid
Alaska IN!Families
Authorized
Alaska IN!Families Paid
PASS I 617 531 376 336 1 0 0 0PASS II 219 193 134 119 1 1 1 1PASS III 2,464 2,150 1,638 1,431 7 7 5 6Total 3,300 2,874 2,148 1,886 9 8 6 7
*The counts of ALASKA IN! children and families are a subset of the children and families data.
Table 5: Number of children with an authorization by provider type and CCAP rate regionProvider Type: Anchorage Fairbanks Gulf Coast Interior Juneau Mat-Su Northern Southeast Southwest Statewide Total
Licensed Center 1,208 166 259 0 33 587 16 85 3 2,357Licensed Group Home 0 109 60 0 3 45 0 43 0 260
Licensed Home 427 47 63 0 14 23 0 13 0 587Approved Provider 2 0 0 0 0 0 0 0 0 2Approved Relative 23 0 6 0 0 24 1 1 0 55Approved In Home 13 0 0 0 0 3 0 0 0 16
Military Center 4 0 0 0 0 0 0 0 0 4Military Home 0 0 0 0 0 0 0 0 0 0
PASS I In Home 19 0 0 0 0 0 0 0 0 19Tribal Approved 0 0 0 0 0 0 0 0 0 0
Exempt Center 0 0 0 0 0 0 0 0 0 0Exempt Home 0 0 0 0 0 0 0 0 0 0
Total 1,696 322 388 0 50 682 17 142 3 3,300
Table 6: Number of families with an authorization by provider type and CCAP rate regionProvider Type: Anchorage Fairbanks Gulf Coast Interior Juneau Mat-Su Northern Southeast Southwest Statewide Total
Licensed Center 850 108 157 0 19 355 12 56 3 1,560Licensed Group Home 0 78 45 0 3 28 0 27 0 181
Licensed Home 275 25 36 0 9 17 0 7 0 369Approved Provider 1 0 0 0 0 0 0 0 0 1Approved Relative 11 0 3 0 0 10 0 1 0 25Approved In Home 4 0 0 0 0 1 0 0 0 5
Military Center 3 0 0 0 0 0 0 0 0 3Military Home 0 0 0 0 0 0 0 0 0 0
PASS I In Home 4 0 0 0 0 0 0 0 0 4Tribal Approved 0 0 0 0 0 0 0 0 0 0
Exempt Center 0 0 0 0 0 0 0 0 0 0Exempt Home 0 0 0 0 0 0 0 0 0 0
Total 1,148 211 241 0 31 411 12 91 3 2,148
PASS Category: Family CopayAmount
Authorized for State Payment
Amount State Paid to
Providers
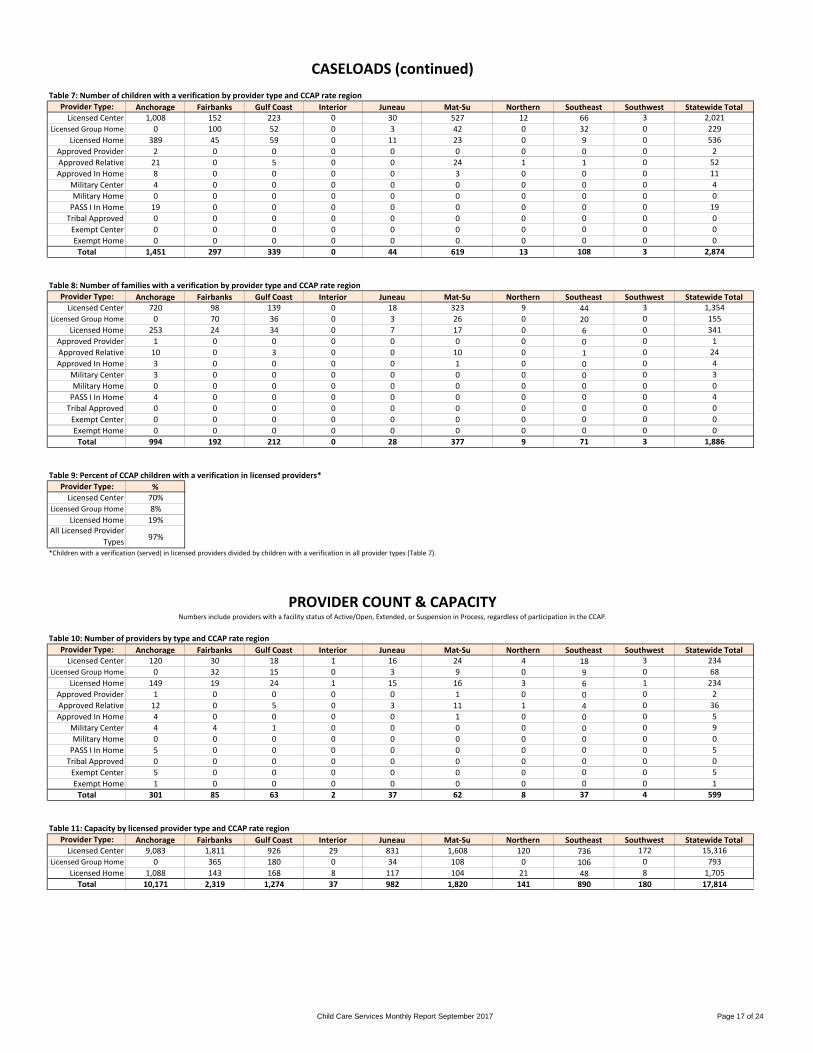
Child Care Services Monthly Report September 2017 Page 17 of 24
CASELOADS (continued)Table 7: Number of children with a verification by provider type and CCAP rate region
Provider Type: Anchorage Fairbanks Gulf Coast Interior Juneau Mat-Su Northern Southeast Southwest Statewide TotalLicensed Center 1,008 152 223 0 30 527 12 66 3 2,021
Licensed Group Home 0 100 52 0 3 42 0 32 0 229Licensed Home 389 45 59 0 11 23 0 9 0 536
Approved Provider 2 0 0 0 0 0 0 0 0 2Approved Relative 21 0 5 0 0 24 1 1 0 52Approved In Home 8 0 0 0 0 3 0 0 0 11
Military Center 4 0 0 0 0 0 0 0 0 4Military Home 0 0 0 0 0 0 0 0 0 0
PASS I In Home 19 0 0 0 0 0 0 0 0 19Tribal Approved 0 0 0 0 0 0 0 0 0 0
Exempt Center 0 0 0 0 0 0 0 0 0 0Exempt Home 0 0 0 0 0 0 0 0 0 0
Total 1,451 297 339 0 44 619 13 108 3 2,874
Table 8: Number of families with a verification by provider type and CCAP rate regionProvider Type: Anchorage Fairbanks Gulf Coast Interior Juneau Mat-Su Northern Southeast Southwest Statewide Total
Licensed Center 720 98 139 0 18 323 9 44 3 1,354Licensed Group Home 0 70 36 0 3 26 0 20 0 155
Licensed Home 253 24 34 0 7 17 0 6 0 341Approved Provider 1 0 0 0 0 0 0 0 0 1Approved Relative 10 0 3 0 0 10 0 1 0 24Approved In Home 3 0 0 0 0 1 0 0 0 4
Military Center 3 0 0 0 0 0 0 0 0 3Military Home 0 0 0 0 0 0 0 0 0 0
PASS I In Home 4 0 0 0 0 0 0 0 0 4Tribal Approved 0 0 0 0 0 0 0 0 0 0
Exempt Center 0 0 0 0 0 0 0 0 0 0Exempt Home 0 0 0 0 0 0 0 0 0 0
Total 994 192 212 0 28 377 9 71 3 1,886
Table 9: Percent of CCAP children with a verification in licensed providers*Provider Type: %
Licensed Center 70%Licensed Group Home 8%
Licensed Home 19%All Licensed Provider
Types 97%
*Children with a verification (served) in licensed providers divided by children with a verification in all provider types (Table 7).
PROVIDER COUNT & CAPACITYNumbers include providers with a facility status of Active/Open, Extended, or Suspension in Process, regardless of participation in the CCAP.
Table 10: Number of providers by type and CCAP rate region Provider Type: Anchorage Fairbanks Gulf Coast Interior Juneau Mat-Su Northern Southeast Southwest Statewide Total
Licensed Center 120 30 18 1 16 24 4 18 3 234Licensed Group Home 0 32 15 0 3 9 0 9 0 68
Licensed Home 149 19 24 1 15 16 3 6 1 234Approved Provider 1 0 0 0 0 1 0 0 0 2Approved Relative 12 0 5 0 3 11 1 4 0 36Approved In Home 4 0 0 0 0 1 0 0 0 5
Military Center 4 4 1 0 0 0 0 0 0 9Military Home 0 0 0 0 0 0 0 0 0 0
PASS I In Home 5 0 0 0 0 0 0 0 0 5Tribal Approved 0 0 0 0 0 0 0 0 0 0
Exempt Center 5 0 0 0 0 0 0 0 0 5Exempt Home 1 0 0 0 0 0 0 0 0 1
Total 301 85 63 2 37 62 8 37 4 599
Table 11: Capacity by licensed provider type and CCAP rate regionProvider Type: Anchorage Fairbanks Gulf Coast Interior Juneau Mat-Su Northern Southeast Southwest Statewide Total
Licensed Center 9,083 1,811 926 29 831 1,608 120 736 172 15,316Licensed Group Home 0 365 180 0 34 108 0 106 0 793
Licensed Home 1,088 143 168 8 117 104 21 48 8 1,705Total 10,171 2,319 1,274 37 982 1,820 141 890 180 17,814
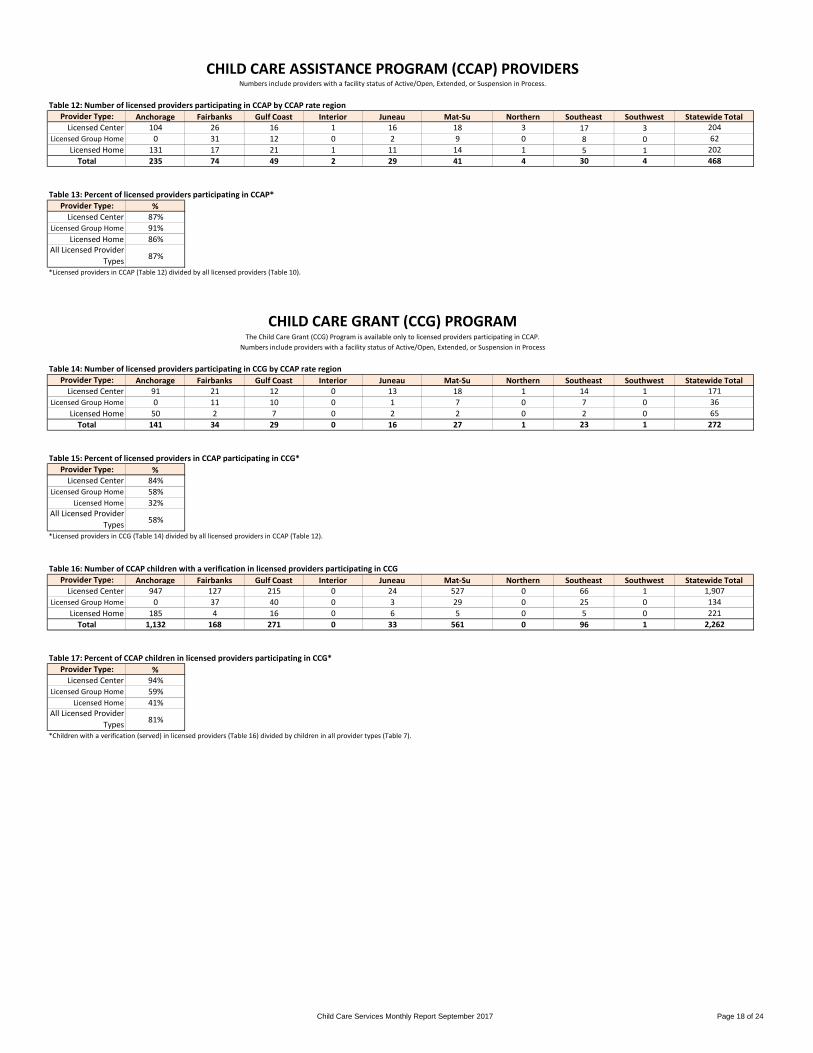
Child Care Services Monthly Report September 2017 Page 18 of 24
CHILD CARE ASSISTANCE PROGRAM (CCAP) PROVIDERSNumbers include providers with a facility status of Active/Open, Extended, or Suspension in Process.
Table 12: Number of licensed providers participating in CCAP by CCAP rate regionProvider Type: Anchorage Fairbanks Gulf Coast Interior Juneau Mat-Su Northern Southeast Southwest Statewide Total
Licensed Center 104 26 16 1 16 18 3 17 3 204Licensed Group Home 0 31 12 0 2 9 0 8 0 62
Licensed Home 131 17 21 1 11 14 1 5 1 202Total 235 74 49 2 29 41 4 30 4 468
Table 13: Percent of licensed providers participating in CCAP*Provider Type: %
Licensed Center 87%Licensed Group Home 91%
Licensed Home 86%All Licensed Provider
Types 87%
*Licensed providers in CCAP (Table 12) divided by all licensed providers (Table 10).
CHILD CARE GRANT (CCG) PROGRAMThe Child Care Grant (CCG) Program is available only to licensed providers participating in CCAP.
Numbers include providers with a facility status of Active/Open, Extended, or Suspension in Process
Table 14: Number of licensed providers participating in CCG by CCAP rate regionProvider Type: Anchorage Fairbanks Gulf Coast Interior Juneau Mat-Su Northern Southeast Southwest Statewide Total
Licensed Center 91 21 12 0 13 18 1 14 1 171Licensed Group Home 0 11 10 0 1 7 0 7 0 36
Licensed Home 50 2 7 0 2 2 0 2 0 65Total 141 34 29 0 16 27 1 23 1 272
Table 15: Percent of licensed providers in CCAP participating in CCG*Provider Type: %
Licensed Center 84%Licensed Group Home 58%
Licensed Home 32%All Licensed Provider
Types 58%
*Licensed providers in CCG (Table 14) divided by all licensed providers in CCAP (Table 12).
Table 16: Number of CCAP children with a verification in licensed providers participating in CCGProvider Type: Anchorage Fairbanks Gulf Coast Interior Juneau Mat-Su Northern Southeast Southwest Statewide Total
Licensed Center 947 127 215 0 24 527 0 66 1 1,907Licensed Group Home 0 37 40 0 3 29 0 25 0 134
Licensed Home 185 4 16 0 6 5 0 5 0 221Total 1,132 168 271 0 33 561 0 96 1 2,262
Table 17: Percent of CCAP children in licensed providers participating in CCG*Provider Type: %
Licensed Center 94%Licensed Group Home 59%
Licensed Home 41%All Licensed Provider
Types 81%
*Children with a verification (served) in licensed providers (Table 16) divided by children in all provider types (Table 7).
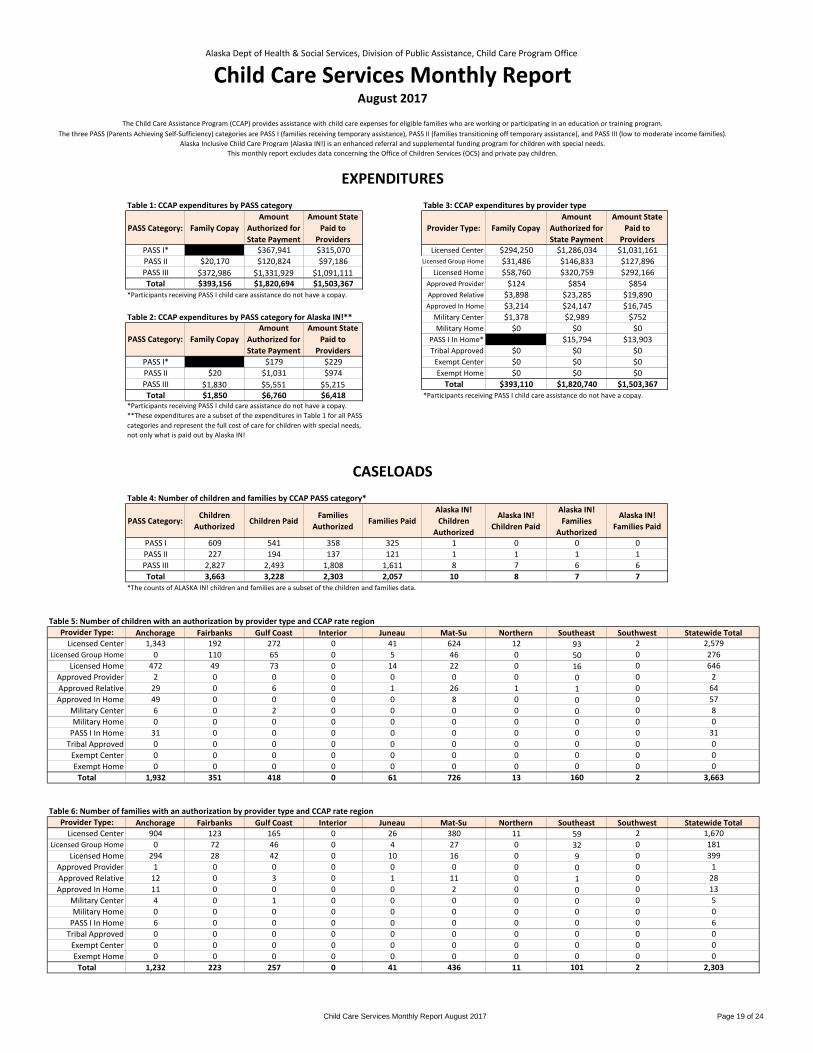
Child Care Services Monthly Report August 2017 Page 19 of 24
Alaska Dept of Health & Social Services, Division of Public Assistance, Child Care Program Office
Child Care Services Monthly ReportAugust 2017
The Child Care Assistance Program (CCAP) provides assistance with child care expenses for eligible families who are working or participating in an education or training program.The three PASS (Parents Achieving Self-Sufficiency) categories are PASS I (families receiving temporary assistance), PASS II (families transitioning off temporary assistance), and PASS III (low to moderate income families).
Alaska Inclusive Child Care Program (Alaska IN!) is an enhanced referral and supplemental funding program for children with special needs.This monthly report excludes data concerning the Office of Children Services (OCS) and private pay children.
EXPENDITURESTable 1: CCAP expenditures by PASS category Table 3: CCAP expenditures by provider type
PASS Category: Family CopayAmount
Authorized for State Payment
Amount State Paid to
ProvidersProvider Type: Family Copay
Amount Authorized for State Payment
Amount State Paid to
ProvidersPASS I* $0 $367,941 $315,070 Licensed Center $294,250 $1,286,034 $1,031,161PASS II $20,170 $120,824 $97,186 Licensed Group Home $31,486 $146,833 $127,896PASS III $372,986 $1,331,929 $1,091,111 Licensed Home $58,760 $320,759 $292,166Total $393,156 $1,820,694 $1,503,367 Approved Provider $124 $854 $854
*Participants receiving PASS I child care assistance do not have a copay. Approved Relative $3,898 $23,285 $19,890Approved In Home $3,214 $24,147 $16,745
Table 2: CCAP expenditures by PASS category for Alaska IN!** Military Center $1,378 $2,989 $752Military Home $0 $0 $0
PASS I In Home* $0 $15,794 $13,903Tribal Approved $0 $0 $0
PASS I* $0 $179 $229 Exempt Center $0 $0 $0PASS II $20 $1,031 $974 Exempt Home $0 $0 $0PASS III $1,830 $5,551 $5,215 Total $393,110 $1,820,740 $1,503,367Total $1,850 $6,760 $6,418 *Participants receiving PASS I child care assistance do not have a copay.
*Participants receiving PASS I child care assistance do not have a copay. **These expenditures are a subset of the expenditures in Table 1 for all PASS categories and represent the full cost of care for children with special needs, not only what is paid out by Alaska IN!
CASELOADSTable 4: Number of children and families by CCAP PASS category*
PASS Category:Children
AuthorizedChildren Paid
Families Authorized
Families PaidAlaska IN!Children
Authorized
Alaska IN!Children Paid
Alaska IN!Families
Authorized
Alaska IN!Families Paid
PASS I 609 541 358 325 1 0 0 0PASS II 227 194 137 121 1 1 1 1PASS III 2,827 2,493 1,808 1,611 8 7 6 6Total 3,663 3,228 2,303 2,057 10 8 7 7
*The counts of ALASKA IN! children and families are a subset of the children and families data.
Table 5: Number of children with an authorization by provider type and CCAP rate regionProvider Type: Anchorage Fairbanks Gulf Coast Interior Juneau Mat-Su Northern Southeast Southwest Statewide Total
Licensed Center 1,343 192 272 0 41 624 12 93 2 2,579Licensed Group Home 0 110 65 0 5 46 0 50 0 276
Licensed Home 472 49 73 0 14 22 0 16 0 646Approved Provider 2 0 0 0 0 0 0 0 0 2Approved Relative 29 0 6 0 1 26 1 1 0 64Approved In Home 49 0 0 0 0 8 0 0 0 57
Military Center 6 0 2 0 0 0 0 0 0 8Military Home 0 0 0 0 0 0 0 0 0 0
PASS I In Home 31 0 0 0 0 0 0 0 0 31Tribal Approved 0 0 0 0 0 0 0 0 0 0
Exempt Center 0 0 0 0 0 0 0 0 0 0Exempt Home 0 0 0 0 0 0 0 0 0 0
Total 1,932 351 418 0 61 726 13 160 2 3,663
Table 6: Number of families with an authorization by provider type and CCAP rate regionProvider Type: Anchorage Fairbanks Gulf Coast Interior Juneau Mat-Su Northern Southeast Southwest Statewide Total
Licensed Center 904 123 165 0 26 380 11 59 2 1,670Licensed Group Home 0 72 46 0 4 27 0 32 0 181
Licensed Home 294 28 42 0 10 16 0 9 0 399Approved Provider 1 0 0 0 0 0 0 0 0 1Approved Relative 12 0 3 0 1 11 0 1 0 28Approved In Home 11 0 0 0 0 2 0 0 0 13
Military Center 4 0 1 0 0 0 0 0 0 5Military Home 0 0 0 0 0 0 0 0 0 0
PASS I In Home 6 0 0 0 0 0 0 0 0 6Tribal Approved 0 0 0 0 0 0 0 0 0 0
Exempt Center 0 0 0 0 0 0 0 0 0 0Exempt Home 0 0 0 0 0 0 0 0 0 0
Total 1,232 223 257 0 41 436 11 101 2 2,303
PASS Category: Family CopayAmount
Authorized for State Payment
Amount State Paid to
Providers
Child Care Services Monthly Report August 2017 Page 20 of 24
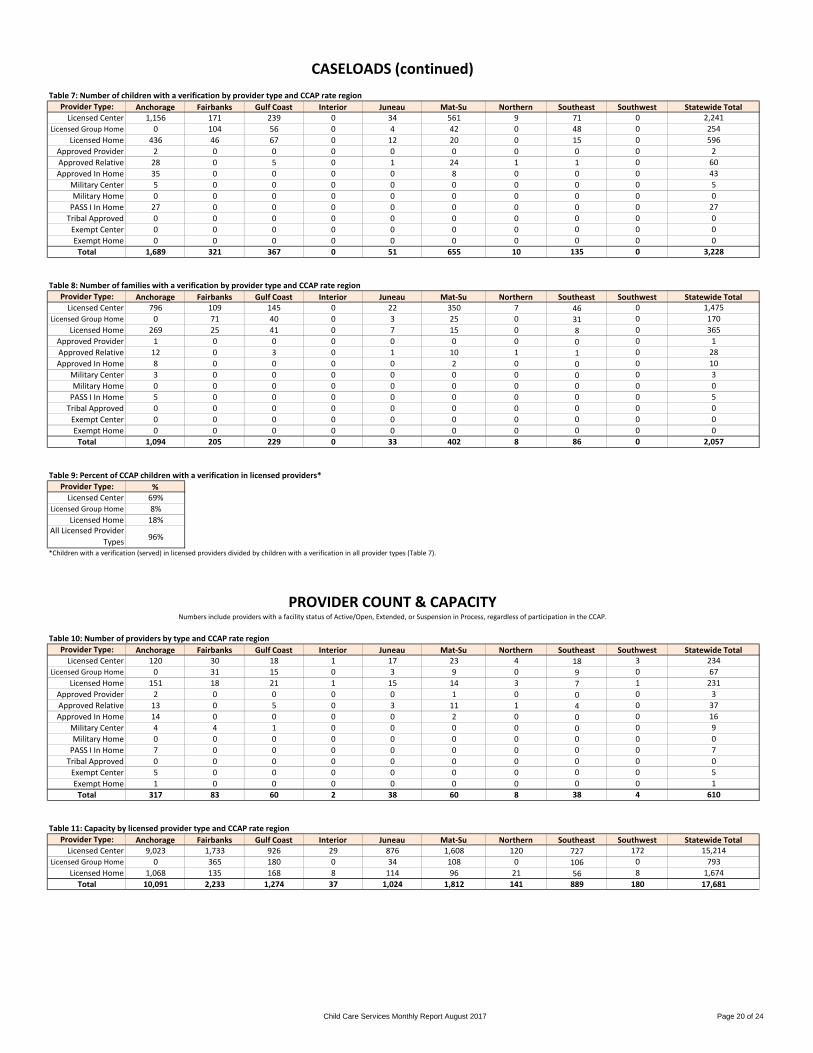
CASELOADS (continued)Table 7: Number of children with a verification by provider type and CCAP rate region
Provider Type: Anchorage Fairbanks Gulf Coast Interior Juneau Mat-Su Northern Southeast Southwest Statewide TotalLicensed Center 1,156 171 239 0 34 561 9 71 0 2,241
Licensed Group Home 0 104 56 0 4 42 0 48 0 254Licensed Home 436 46 67 0 12 20 0 15 0 596
Approved Provider 2 0 0 0 0 0 0 0 0 2Approved Relative 28 0 5 0 1 24 1 1 0 60Approved In Home 35 0 0 0 0 8 0 0 0 43
Military Center 5 0 0 0 0 0 0 0 0 5Military Home 0 0 0 0 0 0 0 0 0 0
PASS I In Home 27 0 0 0 0 0 0 0 0 27Tribal Approved 0 0 0 0 0 0 0 0 0 0
Exempt Center 0 0 0 0 0 0 0 0 0 0Exempt Home 0 0 0 0 0 0 0 0 0 0
Total 1,689 321 367 0 51 655 10 135 0 3,228
Table 8: Number of families with a verification by provider type and CCAP rate regionProvider Type: Anchorage Fairbanks Gulf Coast Interior Juneau Mat-Su Northern Southeast Southwest Statewide Total
Licensed Center 796 109 145 0 22 350 7 46 0 1,475Licensed Group Home 0 71 40 0 3 25 0 31 0 170
Licensed Home 269 25 41 0 7 15 0 8 0 365Approved Provider 1 0 0 0 0 0 0 0 0 1Approved Relative 12 0 3 0 1 10 1 1 0 28Approved In Home 8 0 0 0 0 2 0 0 0 10
Military Center 3 0 0 0 0 0 0 0 0 3Military Home 0 0 0 0 0 0 0 0 0 0
PASS I In Home 5 0 0 0 0 0 0 0 0 5Tribal Approved 0 0 0 0 0 0 0 0 0 0
Exempt Center 0 0 0 0 0 0 0 0 0 0Exempt Home 0 0 0 0 0 0 0 0 0 0
Total 1,094 205 229 0 33 402 8 86 0 2,057
Table 9: Percent of CCAP children with a verification in licensed providers*Provider Type: %
Licensed Center 69%Licensed Group Home 8%
Licensed Home 18%All Licensed Provider
Types 96%
*Children with a verification (served) in licensed providers divided by children with a verification in all provider types (Table 7).
PROVIDER COUNT & CAPACITYNumbers include providers with a facility status of Active/Open, Extended, or Suspension in Process, regardless of participation in the CCAP.
Table 10: Number of providers by type and CCAP rate region Provider Type: Anchorage Fairbanks Gulf Coast Interior Juneau Mat-Su Northern Southeast Southwest Statewide Total
Licensed Center 120 30 18 1 17 23 4 18 3 234Licensed Group Home 0 31 15 0 3 9 0 9 0 67
Licensed Home 151 18 21 1 15 14 3 7 1 231Approved Provider 2 0 0 0 0 1 0 0 0 3Approved Relative 13 0 5 0 3 11 1 4 0 37Approved In Home 14 0 0 0 0 2 0 0 0 16
Military Center 4 4 1 0 0 0 0 0 0 9Military Home 0 0 0 0 0 0 0 0 0 0
PASS I In Home 7 0 0 0 0 0 0 0 0 7Tribal Approved 0 0 0 0 0 0 0 0 0 0
Exempt Center 5 0 0 0 0 0 0 0 0 5Exempt Home 1 0 0 0 0 0 0 0 0 1
Total 317 83 60 2 38 60 8 38 4 610
Table 11: Capacity by licensed provider type and CCAP rate regionProvider Type: Anchorage Fairbanks Gulf Coast Interior Juneau Mat-Su Northern Southeast Southwest Statewide Total
Licensed Center 9,023 1,733 926 29 876 1,608 120 727 172 15,214Licensed Group Home 0 365 180 0 34 108 0 106 0 793
Licensed Home 1,068 135 168 8 114 96 21 56 8 1,674Total 10,091 2,233 1,274 37 1,024 1,812 141 889 180 17,681
Child Care Services Monthly Report August 2017 Page 21 of 24
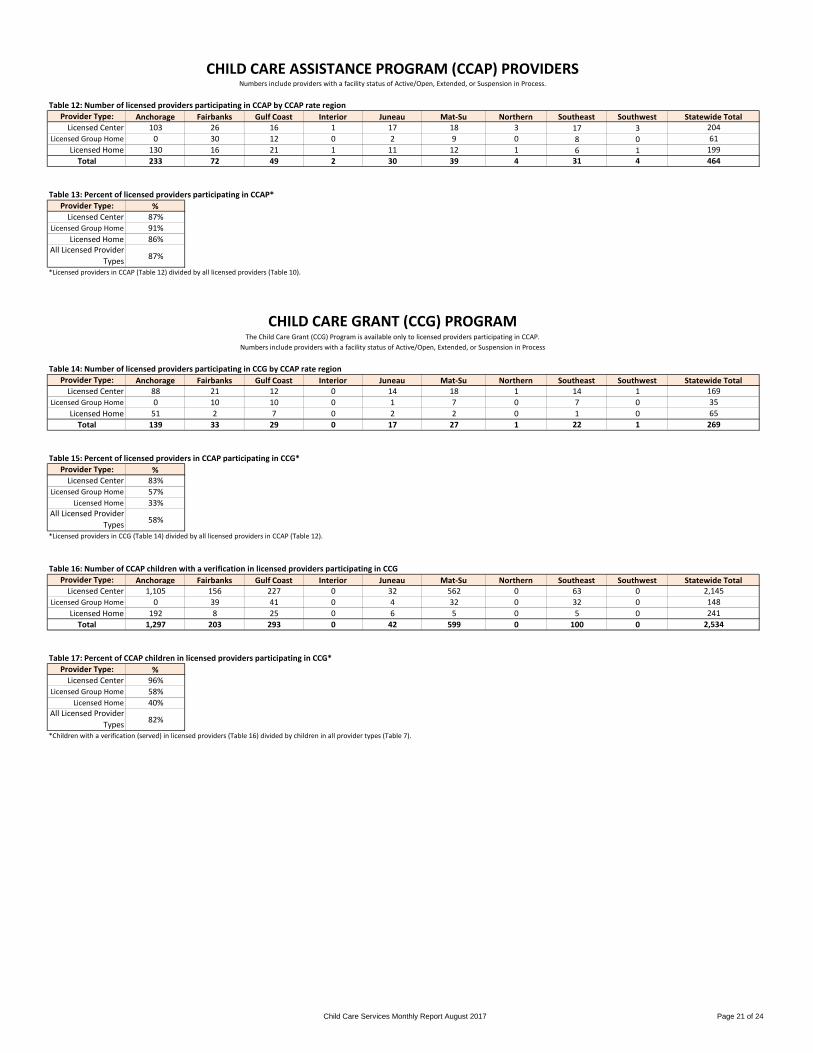
CHILD CARE ASSISTANCE PROGRAM (CCAP) PROVIDERSNumbers include providers with a facility status of Active/Open, Extended, or Suspension in Process.
Table 12: Number of licensed providers participating in CCAP by CCAP rate regionProvider Type: Anchorage Fairbanks Gulf Coast Interior Juneau Mat-Su Northern Southeast Southwest Statewide Total
Licensed Center 103 26 16 1 17 18 3 17 3 204Licensed Group Home 0 30 12 0 2 9 0 8 0 61
Licensed Home 130 16 21 1 11 12 1 6 1 199Total 233 72 49 2 30 39 4 31 4 464
Table 13: Percent of licensed providers participating in CCAP*Provider Type: %
Licensed Center 87%Licensed Group Home 91%
Licensed Home 86%All Licensed Provider
Types 87%
*Licensed providers in CCAP (Table 12) divided by all licensed providers (Table 10).
CHILD CARE GRANT (CCG) PROGRAMThe Child Care Grant (CCG) Program is available only to licensed providers participating in CCAP.
Numbers include providers with a facility status of Active/Open, Extended, or Suspension in Process
Table 14: Number of licensed providers participating in CCG by CCAP rate regionProvider Type: Anchorage Fairbanks Gulf Coast Interior Juneau Mat-Su Northern Southeast Southwest Statewide Total
Licensed Center 88 21 12 0 14 18 1 14 1 169Licensed Group Home 0 10 10 0 1 7 0 7 0 35
Licensed Home 51 2 7 0 2 2 0 1 0 65Total 139 33 29 0 17 27 1 22 1 269
Table 15: Percent of licensed providers in CCAP participating in CCG*Provider Type: %
Licensed Center 83%Licensed Group Home 57%
Licensed Home 33%All Licensed Provider
Types 58%
*Licensed providers in CCG (Table 14) divided by all licensed providers in CCAP (Table 12).
Table 16: Number of CCAP children with a verification in licensed providers participating in CCGProvider Type: Anchorage Fairbanks Gulf Coast Interior Juneau Mat-Su Northern Southeast Southwest Statewide Total
Licensed Center 1,105 156 227 0 32 562 0 63 0 2,145Licensed Group Home 0 39 41 0 4 32 0 32 0 148
Licensed Home 192 8 25 0 6 5 0 5 0 241Total 1,297 203 293 0 42 599 0 100 0 2,534
Table 17: Percent of CCAP children in licensed providers participating in CCG*Provider Type: %
Licensed Center 96%Licensed Group Home 58%
Licensed Home 40%All Licensed Provider
Types 82%
*Children with a verification (served) in licensed providers (Table 16) divided by children in all provider types (Table 7).
Child Care Services Monthly Report July 2017 Page 22 of 24
Alaska Dept of Health & Social Services, Division of Public Assistance, Child Care Program Office
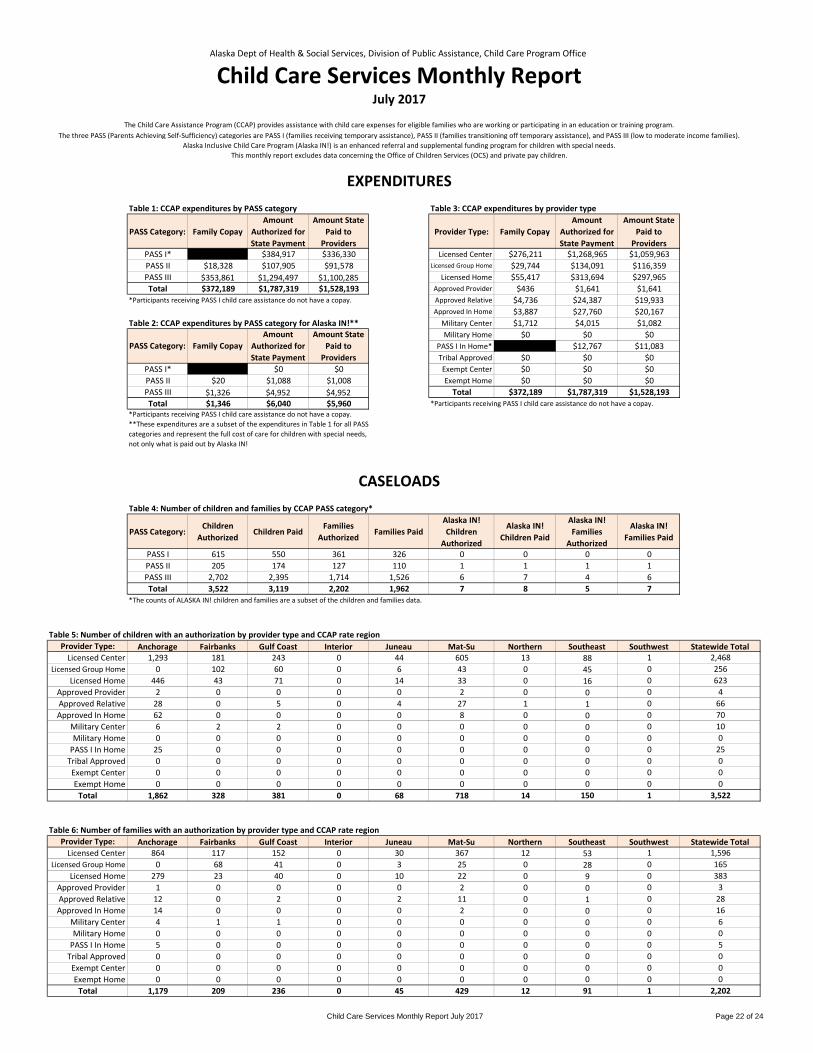
Child Care Services Monthly ReportJuly 2017
The Child Care Assistance Program (CCAP) provides assistance with child care expenses for eligible families who are working or participating in an education or training program.The three PASS (Parents Achieving Self-Sufficiency) categories are PASS I (families receiving temporary assistance), PASS II (families transitioning off temporary assistance), and PASS III (low to moderate income families).
Alaska Inclusive Child Care Program (Alaska IN!) is an enhanced referral and supplemental funding program for children with special needs.This monthly report excludes data concerning the Office of Children Services (OCS) and private pay children.
EXPENDITURESTable 1: CCAP expenditures by PASS category Table 3: CCAP expenditures by provider type
PASS Category: Family CopayAmount
Authorized for State Payment
Amount State Paid to
ProvidersProvider Type: Family Copay
Amount Authorized for State Payment
Amount State Paid to
ProvidersPASS I* $0 $384,917 $336,330 Licensed Center $276,211 $1,268,965 $1,059,963PASS II $18,328 $107,905 $91,578 Licensed Group Home $29,744 $134,091 $116,359PASS III $353,861 $1,294,497 $1,100,285 Licensed Home $55,417 $313,694 $297,965Total $372,189 $1,787,319 $1,528,193 Approved Provider $436 $1,641 $1,641
*Participants receiving PASS I child care assistance do not have a copay. Approved Relative $4,736 $24,387 $19,933Approved In Home $3,887 $27,760 $20,167
Table 2: CCAP expenditures by PASS category for Alaska IN!** Military Center $1,712 $4,015 $1,082Military Home $0 $0 $0
PASS I In Home* $46 $12,767 $11,083Tribal Approved $0 $0 $0
PASS I* $0 $0 Exempt Center $0 $0 $0PASS II $20 $1,088 $1,008 Exempt Home $0 $0 $0PASS III $1,326 $4,952 $4,952 Total $372,189 $1,787,319 $1,528,193Total $1,346 $6,040 $5,960 *Participants receiving PASS I child care assistance do not have a copay.
*Participants receiving PASS I child care assistance do not have a copay. **These expenditures are a subset of the expenditures in Table 1 for all PASS categories and represent the full cost of care for children with special needs, not only what is paid out by Alaska IN!
CASELOADSTable 4: Number of children and families by CCAP PASS category*
PASS Category:Children
AuthorizedChildren Paid
Families Authorized
Families PaidAlaska IN!Children
Authorized
Alaska IN!Children Paid
Alaska IN!Families
Authorized
Alaska IN!Families Paid
PASS I 615 550 361 326 0 0 0 0PASS II 205 174 127 110 1 1 1 1PASS III 2,702 2,395 1,714 1,526 6 7 4 6Total 3,522 3,119 2,202 1,962 7 8 5 7
*The counts of ALASKA IN! children and families are a subset of the children and families data.
Table 5: Number of children with an authorization by provider type and CCAP rate regionProvider Type: Anchorage Fairbanks Gulf Coast Interior Juneau Mat-Su Northern Southeast Southwest Statewide Total
Licensed Center 1,293 181 243 0 44 605 13 88 1 2,468Licensed Group Home 0 102 60 0 6 43 0 45 0 256
Licensed Home 446 43 71 0 14 33 0 16 0 623Approved Provider 2 0 0 0 0 2 0 0 0 4Approved Relative 28 0 5 0 4 27 1 1 0 66Approved In Home 62 0 0 0 0 8 0 0 0 70
Military Center 6 2 2 0 0 0 0 0 0 10Military Home 0 0 0 0 0 0 0 0 0 0
PASS I In Home 25 0 0 0 0 0 0 0 0 25Tribal Approved 0 0 0 0 0 0 0 0 0 0Exempt Center 0 0 0 0 0 0 0 0 0 0Exempt Home 0 0 0 0 0 0 0 0 0 0
Total 1,862 328 381 0 68 718 14 150 1 3,522
Table 6: Number of families with an authorization by provider type and CCAP rate regionProvider Type: Anchorage Fairbanks Gulf Coast Interior Juneau Mat-Su Northern Southeast Southwest Statewide Total
Licensed Center 864 117 152 0 30 367 12 53 1 1,596Licensed Group Home 0 68 41 0 3 25 0 28 0 165
Licensed Home 279 23 40 0 10 22 0 9 0 383Approved Provider 1 0 0 0 0 2 0 0 0 3Approved Relative 12 0 2 0 2 11 0 1 0 28Approved In Home 14 0 0 0 0 2 0 0 0 16
Military Center 4 1 1 0 0 0 0 0 0 6Military Home 0 0 0 0 0 0 0 0 0 0
PASS I In Home 5 0 0 0 0 0 0 0 0 5Tribal Approved 0 0 0 0 0 0 0 0 0 0Exempt Center 0 0 0 0 0 0 0 0 0 0Exempt Home 0 0 0 0 0 0 0 0 0 0
Total 1,179 209 236 0 45 429 12 91 1 2,202
PASS Category: Family CopayAmount
Authorized for State Payment
Amount State Paid to
Providers

Child Care Services Monthly Report July 2017 Page 23 of 24
CASELOADS (continued)Table 7: Number of children with a verification by provider type and CCAP rate region
Provider Type: Anchorage Fairbanks Gulf Coast Interior Juneau Mat-Su Northern Southeast Southwest Statewide TotalLicensed Center 1,088 165 215 0 39 555 9 78 0 2,149
Licensed Group Home 0 91 48 0 6 39 0 45 0 229Licensed Home 433 42 63 0 14 32 0 15 0 599
Approved Provider 2 0 0 0 0 2 0 0 0 4Approved Relative 24 0 4 0 4 25 1 1 0 59Approved In Home 44 0 0 0 0 8 0 0 0 52
Military Center 4 2 0 0 0 0 0 0 0 6Military Home 0 0 0 0 0 0 0 0 0 0
PASS I In Home 21 0 0 0 0 0 0 0 0 21Tribal Approved 0 0 0 0 0 0 0 0 0 0Exempt Center 0 0 0 0 0 0 0 0 0 0Exempt Home 0 0 0 0 0 0 0 0 0 0
Total 1,616 300 330 0 63 661 10 139 0 3,119
Table 8: Number of families with a verification by provider type and CCAP rate regionProvider Type: Anchorage Fairbanks Gulf Coast Interior Juneau Mat-Su Northern Southeast Southwest Statewide Total
Licensed Center 744 105 134 0 26 334 7 45 0 1,395Licensed Group Home 0 60 34 0 4 23 0 28 0 149
Licensed Home 269 24 38 0 8 21 0 8 0 368Approved Provider 1 0 0 0 0 2 0 0 0 3Approved Relative 11 0 2 0 2 10 1 1 0 27Approved In Home 10 0 0 0 0 2 0 0 0 12
Military Center 3 1 0 0 0 0 0 0 0 4Military Home 0 0 0 0 0 0 0 0 0 0
PASS I In Home 4 0 0 0 0 0 0 0 0 4Tribal Approved 0 0 0 0 0 0 0 0 0 0Exempt Center 0 0 0 0 0 0 0 0 0 0Exempt Home 0 0 0 0 0 0 0 0 0 0
Total 1,042 190 208 0 40 392 8 82 0 1,962
Table 9: Percent of CCAP children with a verification in licensed providers*Provider Type: %
Licensed Center 69%Licensed Group Home 7%
Licensed Home 19%All Licensed Provider
Types 95%
*Children with a verification (served) in licensed providers divided by children with a verification in all provider types (Table 7).
PROVIDER COUNT & CAPACITYNumbers include providers with a facility status of Active/Open, Extended, or Suspension in Process, regardless of participation in the CCAP.
Table 10: Number of providers by type and CCAP rate region Provider Type: Anchorage Fairbanks Gulf Coast Interior Juneau Mat-Su Northern Southeast Southwest Statewide Total
Licensed Center 118 28 19 1 17 23 4 19 3 232Licensed Group Home 0 30 15 0 3 9 0 10 0 67
Licensed Home 149 18 21 1 16 14 3 8 1 231Approved Provider 2 0 0 0 0 1 0 0 0 3Approved Relative 13 0 5 0 3 11 1 4 0 37Approved In Home 15 0 0 0 0 1 0 0 0 16
Military Center 4 4 1 0 0 0 0 0 0 9Military Home 0 0 0 0 0 0 0 0 0 0
PASS I In Home 8 0 0 0 0 0 0 0 0 8Tribal Approved 0 0 0 0 0 0 0 0 0 0Exempt Center 4 0 0 0 0 0 0 0 0 4Exempt Home 1 0 0 0 0 0 0 0 0 1
Total 314 80 61 2 39 59 8 41 4 608
Table 11: Capacity by licensed provider type and CCAP rate regionProvider Type: Anchorage Fairbanks Gulf Coast Interior Juneau Mat-Su Northern Southeast Southwest Statewide Total
Licensed Center 8,902 1,733 913 29 876 1,588 120 755 172 15,088Licensed Group Home 0 357 180 0 34 108 0 118 0 797
Licensed Home 1,089 143 168 8 122 96 21 64 8 1,719Total 9,991 2,233 1,261 37 1,032 1,792 141 937 180 17,604

Child Care Services Monthly Report July 2017 Page 24 of 24
CHILD CARE ASSISTANCE PROGRAM (CCAP) PROVIDERSNumbers include providers with a facility status of Active/Open, Extended, or Suspension in Process.
Table 12: Number of licensed providers participating in CCAP by CCAP rate regionProvider Type: Anchorage Fairbanks Gulf Coast Interior Juneau Mat-Su Northern Southeast Southwest Statewide Total
Licensed Center 103 26 15 1 17 18 3 18 3 204Licensed Group Home 0 29 12 0 2 9 0 9 0 61
Licensed Home 132 17 21 1 11 13 1 6 1 203Total 235 72 48 2 30 40 4 33 4 468
Table 13: Percent of licensed providers participating in CCAP*Provider Type: %
Licensed Center 88%Licensed Group Home 91%
Licensed Home 88%All Licensed Provider
Types 88%
*Licensed providers in CCAP (Table 12) divided by all licensed providers (Table 10).
CHILD CARE GRANT (CCG) PROGRAMThe Child Care Grant (CCG) Program is available only to licensed providers participating in CCAP.
Numbers include providers with a facility status of Active/Open, Extended, or Suspension in Process
Table 14: Number of licensed providers participating in CCG by CCAP rate regionProvider Type: Anchorage Fairbanks Gulf Coast Interior Juneau Mat-Su Northern Southeast Southwest Statewide Total
Licensed Center 88 21 12 0 15 18 1 15 1 171Licensed Group Home 0 9 10 0 1 7 0 8 0 35
Licensed Home 49 3 7 0 2 2 0 1 0 64Total 137 33 29 0 18 27 1 24 1 270
Table 15: Percent of licensed providers in CCAP participating in CCG*Provider Type: %
Licensed Center 84%Licensed Group Home 57%
Licensed Home 32%All Licensed Provider
Types 58%
*Licensed providers in CCG (Table 14) divided by all licensed providers in CCAP (Table 12).
Table 16: Number of CCAP children with a verification in licensed providers participating in CCGProvider Type: Anchorage Fairbanks Gulf Coast Interior Juneau Mat-Su Northern Southeast Southwest Statewide Total
Licensed Center 1,044 146 205 0 37 557 0 78 0 2,067Licensed Group Home 0 38 38 0 4 28 0 38 0 146
Licensed Home 177 7 23 0 5 10 0 5 0 227Total 1,221 191 266 0 46 595 0 121 0 2,440
Table 17: Percent of CCAP children in licensed providers participating in CCG*Provider Type: %
Licensed Center 96%Licensed Group Home 64%
Licensed Home 38%All Licensed Provider
Types 82%
*Children with a verification (served) in licensed providers (Table 16) divided by children in all provider types (Table 7).