chemical assessment of ballast water exchange …€¦ · faculty of sciencies of the lisbon...
TRANSCRIPT

ORIGINAL RESEARCHpublished: 09 May 2016
doi: 10.3389/fmars.2016.00066
Frontiers in Marine Science | www.frontiersin.org 1 May 2016 | Volume 3 | Article 66
Edited by:
Angel Borja,
AZTI-Tecnalia, Spain
Reviewed by:
Rafael Riosmena-Rodriguez,
Universidad Autonoma de Baja
California Sur, Mexico
José Lino Vieira De Oliveira Costa,
Centre of Oceanography of the
Faculty of Sciencies of the Lisbon
University, Portugal
*Correspondence:
Monaca Noble
Kathleen R. Murphy
Specialty section:
This article was submitted to
Marine Ecosystem Ecology,
a section of the journal
Frontiers in Marine Science
Received: 19 February 2016
Accepted: 18 April 2016
Published: 09 May 2016
Citation:
Noble M, Ruiz GM and Murphy KR
(2016) Chemical Assessment of
Ballast Water Exchange Compliance:
Implementation in North America and
New Zealand. Front. Mar. Sci. 3:66.
doi: 10.3389/fmars.2016.00066
Chemical Assessment of BallastWater Exchange Compliance:Implementation in North America andNew ZealandMonaca Noble 1*, Gregory M. Ruiz 1 and Kathleen R. Murphy 2*
1Marine Invasions Research Laboratory, Smithsonian Environmental Research Center, Smithsonian Institution, Edgewater,
MD, USA, 2Water Environment Technology, Department of Civil and Environmental Engineering, Chalmers University of
Technology, Gothenburg, Sweden
Fluorescence by naturally occurring dissolved organic matter (FDOM) is a sensitive
indicator of ballast water source, with high FDOM in coastal ballast water decreasing
typically dramatically when replaced by oceanic seawater during ballast water exchange
(BWE). In this study, FDOM was measured in 92 ships arriving at Pacific ports on the US
west coast and in New Zealand, and used to assess their compliance with ballast water
regulations that required 95% replacement of port water to minimize invasive species
risks. Fluorescence in many ships that reported BWEwas significantly higher than is usual
for oceanic seawater, and in several cases, significantly higher than in other ships with
similar provenance and ballast water management. Pre-exchange source port conditions
represented the largest source of uncertainty in the analysis, because residual coastal
FDOM when highly fluorescent can significantly influence the fluorescence signature
of exchanged ballast water. A meta-analysis comparing the intensities of FDOM in
un-exchanged ballast tanks with calculated pre-exchange intensities assuming that ships
all correctly implemented and reported BWE revealed notable discrepancies. Thus, the
incidence of high-FDOM port waters was seven times lower in reality than would be
expected on the basis of these calculations. The results suggest that a significant rate of
reporting errors occur due to a combination of factors that may include inadequate BWE
and unintentional or deliberate misreporting of ballast water management.
Keywords: Pacific Ocean, fluorescence spectroscopy, FDOM, invasion vectors, invasive species, AIS, NIS, CDOM
INTRODUCTION
The transfer of ballast water between ports is an effective mechanism for moving a diverseassemblage of marine and estuarine organisms around the globe, posing considerable risk to themarine environment (Carlton and Geller, 1993; Ruiz et al., 1997; Roman and Darling, 2007).In the United States, controlling ballast water discharge is viewed as an important factor in themanagement of bays, estuaries, and the Great Lakes (Costello et al., 2007; Bailey et al., 2011). InNew Zealand, economically and socially important fisheries are threatened by large volumes ofballast water discharged each year (Hewitt and Campbell, 2007). In both countries, ballast wateris the suspected vector for several marine introductions. Damage caused to the Great Lakes by theZebra Mussel, including extensive fouling and clogging of water intake pipes and impacts on native

Noble et al. Chemical Assessment of Ballast Water
species, led in 1993 to the first ballast water exchange (BWE)requirements for ships entering the Great Lakes from outside theUS exclusive economic zone. This authority was soon extendedto other regions of the country by the National Invasive SpeciesAct of 1996 (H. R. 4283, 104 Congress of the United States).
Ballast water is carried by vessels to provide stability and trimduring sailing and during loading and unloading operations. Itis usually loaded at the same time that cargo is unloaded anddischarged in exchange for cargo, but may also be transferredbetween tanks within a vessel and carried for up to severalmonths or even years. During BWE, port water within ballasttanks is replaced with oceanic water sourced outside of thecoastal zone, preferably at least 200 nautical miles (nmi) fromshore, although coastal BWE is often performed along routesthat remain closer to shore (Miller et al., 2011). Depending ona range of factors including the tank design, type of exchangemethod used, and characteristics of individual species, BWE iscapable of reducing concentrations of coastal organisms by 80–95% (Gray et al., 2007; Minton et al., 2015). The effectivenessof current BWE policy at reducing invasion rates is difficult toevaluate (Costello et al., 2007) and policy efforts over more thana decade have been directed toward replacing BWE with bettertechnological solutions (Briski et al., 2015) and concentration-based performance standards (Albert et al., 2013). However, arange of setbacks have hampered the widespread adoption ofnew treatment technologies and performance standards with theresult that BWE is still the only ballast water treatment methodin widespread use (Minton et al., 2015).
Both the United States and New Zealand governments requirecommercial vessels arriving from overseas to treat or exchangetheir ballast water before discharge to reduce the risk of releasinginvasive coastal species (MAF, 2007; Miller et al., 2011; UnitedStates Coast Guard (USCG), 2012a,b). Despite the legislativerequirement for BWE in both countries, it is difficult to evaluateships’ claims regarding the origin and management of ballastwater. In the United States, the process for determining whethera ship has conducted BWE are detailed in the US Coast Guard’sNavigation and Inspection Circular 07–04, Ch-1. Ballast watermanagement records may be examined, and salinity readingsmay be taken if non-compliance is suspected. In New Zealand,the Ministry of Primary Industries Biosecurity Division prohibitsthe discharge of ballast water into New Zealand waters withoutthe permission of an inspector (MAF, 2005, 2007). To obtainpermission, the vessel’s Master must provide a signed declarationthat the ballast water was subject to mid-ocean BWE. Inspectorsapprove ballast water discharge based on a combination of factorsincluding agreement between ballast management records andsalinity. In both countries, ballast water with salinity between30 and 40 is considered consistent with BWE. However, thiscriterion fails to reliably detect ballast water originating in Pacificrim ports, since many ports in this region have high salinitieseither seasonally or year-round (Doblin et al., 2010).
Previous research indicates that fluorescence by naturallyoccurring dissolved organic matter (FDOM) is a robust coastaltracer, with sensitivity that exceeds many other chemical tracersincluding salinity and trace elements (Murphy et al., 2008a, 2013;Doblin et al., 2010). FDOM quantifies the organic matter fraction
that absorbs light and reemits the radiation as fluorescence(Lakowicz, 2006). In estuaries, FDOM intensities vary withsalinity gradients and biological activity as well as anthropogenicfactors such as industrial effluent, and agricultural and urbanrunoff (Coble, 1996; Stedmon and Markager, 2005; Walker et al.,2009; Guo et al., 2011). Moving offshore away from terrestrialsources and as a result of exposure to sunlight, FDOM derivedfrom terrestrial materials decreases (Duursma, 1974; Bloughand Del Vecchio, 2002; Murphy et al., 2008b; Nelson et al.,2010). Because oceanic levels of FDOM are very low relative toconcentrations at the coast, it can be deduced that samples withhigh FDOM are of coastal origin.
Previous studies have used fluorescence excitation-emissionmatrix spectroscopy to identify wavelengths most appropriatefor measurement (Murphy et al., 2004, 2006). These foundlong-wavelength fluorescence associated with terrestrial organicmatter to be an effective indicator of BWE. In shipboardexperiments conducted in the North Pacific and Atlantic oceans,Murphy et al. (2006) determined that a threshold of 0.7 QSE(parts per billion quinine sulfate equivalents) measured at theC3∗ wavelength pair (λex/λem = 370/494 nm) discriminatedbetween exchanged and unexchanged ballast water in >95% oftests (N = 40 ballast tanks), some of which were in the rangeof oceanic salinities. An extensive survey (>2000 samples) ofC3∗ in ports and at varying distances from land confirmed thatlarge differences in coastal vs. oceanic FDOM levels hold in thePacific Ocean (Murphy et al., 2013). However, natural variabilityin coastal FDOM levels, which may legally represent as muchas five percent of the water in an exchanged ballast tank, makeit difficult to rely upon a simple C3∗ threshold. For example,assuming oceanic C3∗ levels of 0.5 QSE, any ship carrying ballastoriginally from a location where C3∗ exceeds 4.5 QSE will exceed0.7 QSE even after performing 95% BWE.
In practice, given incomplete knowledge of FDOMdistributions in coastal environments on a global scale,reliable chemical assessments of BWE must rely upon a forensicapproach, in which multiple lines of evidence feed into thejudgment of a vessel’s compliance. Assuming that FDOM levelsthat were present in the ballast water tanks prior to BWEare unknown, then port survey data and/or data from othervessels with ballast from the same location can help to constrainestimates of the likely contribution of port water to the measuredFDOM signal upon arrival. To test this approach, FDOM wasmeasured in a diverse cohort of vessels (N = 92 ships) boardedby inspectors at various ports along the US west coast and NewZealand. The results were used to assess BWE compliance ofindividual ships and to gauge the overall level of complianceamong the vessel cohort.
MATERIALS AND METHODS
Experimental DesignReplicate ballast water samples were collected from 99 ballasttanks in 92 ships arriving to the United States or NewZealand. In the United States, ballast water samples werecollected from 73 vessels that arrived at ports in California(47), Oregon (10), and Washington (16) in 2008 and 2009.
Frontiers in Marine Science | www.frontiersin.org 2 May 2016 | Volume 3 | Article 66

Noble et al. Chemical Assessment of Ballast Water
Samples were collected by ballast water inspectors from threestate agencies: the California State Lands Commission (CSLC),the Oregon Department of Environmental Quality (ODEQ), andthe Washington Department of Fish and Wildlife (WDFW).In New Zealand, ballast water samples were collected from 19vessels that arrived at the ports of Auckland (17), Tauranga(1), and Taharoa (1) in May, 2010. Sampling was performedby Ministry of Primary Industries (MPI, formerly Ministry ofAgriculture and Forestry MAF) biosecurity inspectors, assistedby one researcher. Vessels of a range of types and trading historieswere selected in an effort to maximize sample diversity. Ballastwater source and management was self-reported by the vessel.
SamplingSimilar samplingmethodologies were implemented in the UnitedStates and in New Zealand. Ballast water samples were collectedthrough an open manhole from a single tank per vessel in theUnited States and one or two tanks per vessel in New Zealand.Three replicate samples were collected using large Clear-ViewTM
PVC bailers (45.72×2.54 cm, 342mL) from the vertical midpointof the accessible sampling depth. The bailers have a stopperball which allows them to collect samples from select depths.Water flows through the tube as the bailer is lowered into thetank, then when the bailer is retrieved the stopper-ball dropsto the bottom of the tube sealing it. Once filled, the bailerswere drained into a 60mL syringe then filtered using Whatman0.45µm PVDF syringe filters into pre-ashed 125mL amber glassbottles. All equipment was subject to stringent cleaning prior tosampling, bailers and syringes, and filters were acid washed (10%HCl) and rinsed with 18 M� deionized water and air dried ina laminar flow hood. Salinity was measured using a hand-heldrefractometer.
For all tanks scheduled for discharge, data regarding ballastwater sources and management were obtained from ballastwater reporting forms, which constitute legal declarations to theNational Ballast Water Information Clearinghouse in the USand to MPI Biosecurity in New Zealand. For those tanks thatwere not to be discharged in the sampling port, source andmanagement data were collected from the vessel’s log books bythe ballast water inspector. On the basis of these reports, eachsampled tank was assigned to one of fourmanagement categories:exchanged in mid-ocean >200 nmi from shore (BWE, n = 57),exchanged <200 nmi from shore (BWEc, n = 19), filled fromempty in the mid-ocean (FS, n = 11), or carrying unexchangedport water (none, n = 12).
Laboratory AnalysesFDOM fluorescence was measured using a benchtopFluorologr-3 spectrofluorometer (Horiba Jobin Yvon, Edison,NJ). Undiluted filtered seawater samples were analyzed in ratiomode using a 0.5 s integration time and a 1-cm quartz cell heldat 20◦C. Fluorometer bandpasses were set to 5 nm for boththe excitation and emission monochromators. The Fluorolog-3 is configured with a single excitation monochromator(1200 grooves/mm) blazed at 330 nm and a dual emissionmonochromator (1200 grooves/mm) blazed at 500 nm, a water-cooled, red sensitive photomultiplier tube and a 450-watt Xenonarc lamp.
Data were corrected for instrumental and lamp variability andnormalized to quinine sulfate fluorescence intensity as previouslydescribed (Murphy et al., 2010). Fluorescence can be suppressedby absorbing species in the sample matrix, in a phenomenonknown as the inner-filter effect (IFE). Suppression is below 5%at wavelengths where total absorbance (A) is below 0.042 in a 1-cm cell (Kothawala et al., 2013). Absorbance at 370 nmmeasuredusing a Cary 4E UV–Visible spectrophotometer was alwaysbelow 0.015 m−1 so no inner filter correction was necessary.Fluorescence intensities were calibrated against a quinine sulfatedilution series and are expressed in units of concentration (ppbquinine sulfate equivalents, QSE). An approximate conversionof these data to Raman Units (RU, normalized to the area ofthe Raman peak in a clean water blank excited at 350 nm) isobtained by dividing intensities in QSE by 100 (Murphy et al.,2010). Data are reported here for a single wavelength pair, C3∗
(λex/λem = 370/494 nm) that has been extensively studied in thecontext of BWE, and for which BWE thresholds have alreadybeen developed and tested (Murphy et al., 2006, 2013; Doblinet al., 2010).
Chemical Assessments of ComplianceSince terrestrially derived FDOM in the open surface PacificOcean far from land is low and relatively stable compared toat the coasts (Nelson et al., 2010), then a lower bound for C3∗
prior to BWE can be deduced frommeasured C3∗ following BWE(Equation 1)
C3∗pre BWE=C3∗post BWE − ε ∗ C3∗ambient
(1−ε)
In Equation (1), C3∗post BWE is themeasured fluorescence intensity
in a ballast tank was reported as having undergone BWE,C3∗pre BWE is the calculated fluorescence intensity prior to BWE,
and ε is the BWE efficiency. C3∗ambient
is the fluorescence intensityin the ambient ocean where BWE was performed.
In the calculations, BWE efficiency (ε) was assumed equalto the minimum level specified by law (95%), except in thecase of ballast tanks filled from empty in the ocean (FS). Forthese a higher exchange efficiency (99%) was assumed based onearlier studies (Cohen, 1998; Drake et al., 2007). Filling at sea isrelatively efficient because the only sources of port signals areresidual volumes of unpumpable ballast water and sediments.C3∗
ambientwas assumed equal to 0.5 QSE in the open ocean,
and=1QSE in coastal exchange zones. These levels are consistentwith surveys in the North Pacific (Murphy et al., 2013) and areprobably conservative (i.e., represent upper limits) except whenBWE was performed north of 45◦N where oceanic CDOM isrelatively elevated (Nelson et al., 2010). If FDOM at the site ofBWE was actually higher than the assumed level, this wouldresult in C3∗pre BWE being slightly overestimated, of if lower then
C3∗pre BWE would be slightly underestimated. However, a large
over- or under-estimation is unlikely because even a 50% errorin the assumed oceanic C3∗ represents no more than a smallabsolute difference in post-exchange C3∗. Conversely, C3∗pre BWE
is very sensitive to BWE efficiency since a decrease from 95%to 90% efficiency doubles the influence of the residual portsignal.
Frontiers in Marine Science | www.frontiersin.org 3 May 2016 | Volume 3 | Article 66

Noble et al. Chemical Assessment of Ballast Water
Calculated C3∗pre BWE was used in two ways to assess
compliance by individual vessels. First it was compared withmeasured C3∗ at the port of origin, when port data were availablefrom earlier surveys and published reports. Second, it was usedin comparisons with measured C3∗ in other ships that loadedballast water in the same location at approximately the sametime (within 2 weeks). To assess compliance by the cohort asa whole, the distribution of calculated C3∗pre BWE was compared
with the measured distribution of C3∗ in ballast tanks that werereported as having not undergone BWE (n = 48). The samplesize for this comparison was increased by including data from anyrandomly-sampled tank containing unexchanged ballast water inour databases (n = 36). To avoid biasing the results, ships inour database that were deliberately targeted on the basis of sourcecharacteristics were excluded from this comparison.
RESULTS
Table 1 summarizes C3∗ fluorescence and salinity measurementsfor each sampled tank, classified by ballast water source andreported ballast water management (N = 99 tanks from 92ships). The majority of tanks (88%) reportedly underwent sometype of ballast water management. Most were exchanged in mid-ocean more than 200 nmi from land (57%) or in coastal waters(20%), and 11% were filled from empty at sea. All ballast tanksreportedly sourced or exchanged at least 200 nmi from land(BWE and FS categories) had salinities between 31 and 41, i.e.,within the range of salinities considered by regulatory agencies tobe consistent with oceanic sources.
Figure 1 shows the distribution of fluorescence intensitiesamong tanks sampled in each management category. Intensitiesare shown as multiples of the BWE threshold, tc. As expected
FIGURE 1 | Measured C3* fluorescence in 99 ballast tanks as a
function of reported management category. Fluorescence is expressed as
a multiple of the BWE threshold (tc = 0.7 QSE) proposed by Murphy et al.
(2006). Management categories are unexchanged (none), coastal exchange
(BWEc), mid-ocean exchange (BWE), and filled at sea (FS), with number of
tanks in each category listed in parentheses.
in ships that reported no BWE, C3∗ always exceeded tc, whilein half of the tanks, tc was exceeded by more than five times.Conversely, fluorescence intensities in exchanged ballast tankswere frequently much higher than expected. Among tanks thatreportedly underwent mid ocean BWE or were filled at sea(BWE and FS, respectively), 54% of tanks had C3∗ fluorescenceexceeding tc and 25% of tanks had fluorescence exceeding 3tc.Among 19 tanks that reportedly underwent coastal exchange(BWEc), 36% exceeded 3tc, and 26% exceeded 4tc.
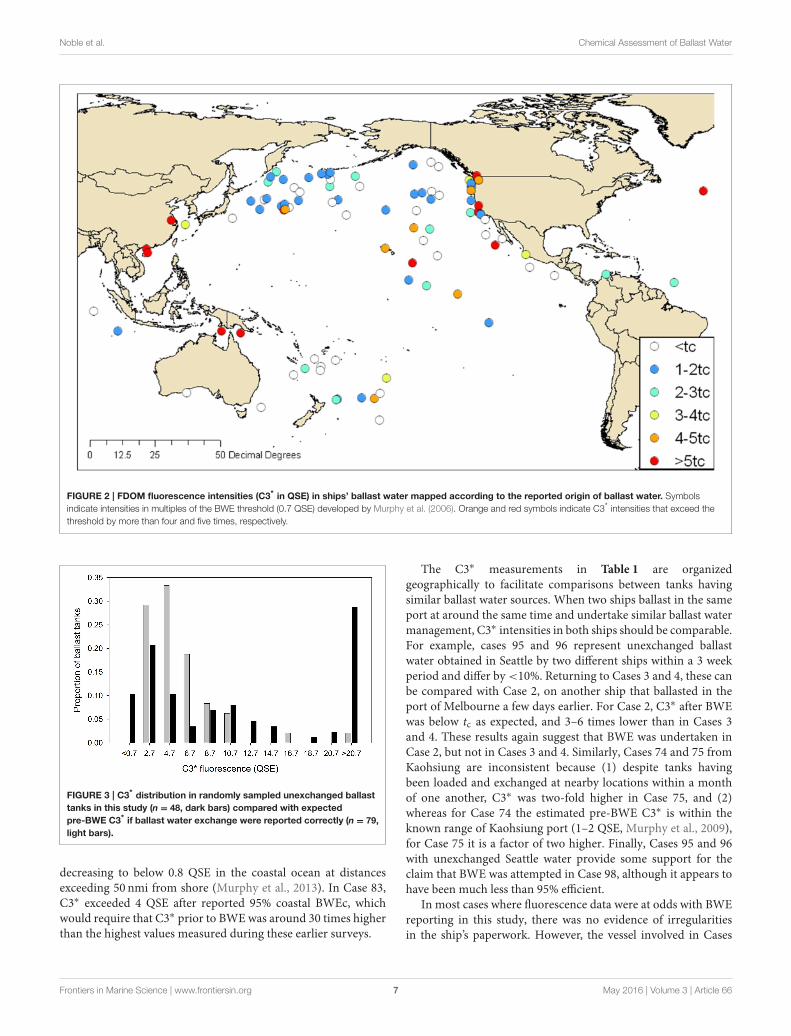
In Figure 2, fluorescence intensities measured in ships’ ballastare mapped according to the reported geographical source of theballast water. For unexchanged ballast water, the reported sourcewas in a port, and for exchanged ballast water, the reported sourcewas the offshore location where BWE took place. Blue symbolsindicate low fluorescence consistent with oceanic sources, andorange and red symbols indicate high fluorescence consistentwith coastal sources. C3∗ fluorescence was typically highest intanks ballasted near land and lowest in ships that reportedoceanic BWE. However, a significant number of tanks that werereportedly exchanged in the open ocean far from land stand outas obvious exceptions to this rule.
Table 1 contains the measured and reported data for eachsampled ballast tank. Additionally, the final column containscalculated source intensities for reportedly exchanged ballasttanks, i.e. estimates of C3∗ prior to BWE deduced using Equation(1), assuming BWE was performed properly. These data areused in Figure 3 to compare the distribution of calculated sourceintensities with the measured distribution of source intensities inunexchanged ballast tanks. Table 1 shows that many calculatedsource intensities (Cases 3, 19, 21-23, 27, 32, 38, 46, 56, 58, 60–64, 83, 89, 97) represent extreme outliers. Most would remainoutliers if the assumptions of the calculation were relaxed byassuming that C3∗ at the exchange location had been 50% higherand BWE efficiency were below 85%. Overall, these data suggestthat in many cases BWE was either misreported or undertakenwith much less than the mandated 95% exchange efficiency.
A number of ships in this survey originated from ports thathave previously been surveyed by our group. These port surveydata can be used to explore whether high C3∗ might reasonablybe explained by residual (<5%) quantities of port water. Cases3 and 4 represent two ballast tanks on the same ship ballastedin the port of Melbourne and later reportedly exchanged. Portsurveys of FDOM in Melbourne do not support this reporting:C3∗ in both tanks (1.4 and 3.2 QSE) was within the typical rangemeasured at the port of Melbourne during winter and springsurveys in 2007 whereas calculated pre-BWE C3∗ (9.6 and 54.4QSE) greatly exceeded this range (Doblin et al., 2010). Similarly,Cases 57–67 represent ships that reportedly filled empty tanks inthe Pacific Ocean at least 200 nmi from land, where C3∗ shouldhave been extremely low. However, measured C3∗ intensitiesare consistent with predominantly open ocean sources in onlytwo cases (57 and 65, with C3∗ ≤0.55). In six other cases,C3∗ intensities were in the range of 1.3–3.1 QSE, suggesting amoderate to large contribution by residual port water. Seasonalsurveys at Los Angeles port and coastal waters in California havebeen conducted over several years by our group and indicate lowbackground C3∗ in the port (<2–3 QSE, Murphy et al., 2009)
Frontiers in Marine Science | www.frontiersin.org 4 May 2016 | Volume 3 | Article 66

Noble et al. Chemical Assessment of Ballast Water
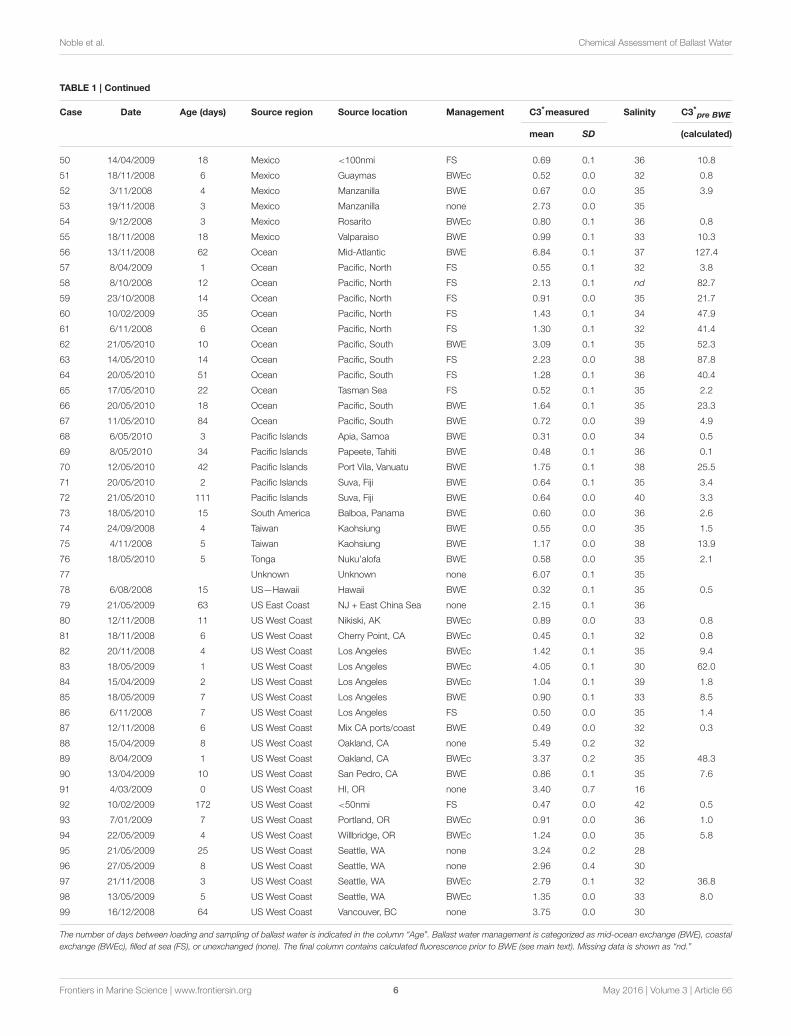
TABLE 1 | Mean fluorescence intensities (C3* = 370/494nm) measured in randomly sampled ballast tanks in ships arriving to Pacific Ocean ports in this
study.
Case Date Age (days) Source region Source location Management C3*measured Salinity C3*pre BWE
mean SD (calculated)
1 20/05/2009 11 Africa Durban BWE 0.84 0.0 35 7.4
2 12/05/2010 5 Australia Melbourne BWE 0.53 0.1 37 1.2
3 14/05/2010 4 Australia Melbourne BWE 3.19 0.2 36 54.4
4 15/05/2010 0 Australia Melbourne BWEc 1.43 0.1 37 19.1
5 15/05/2010 0 Australia Melbourne BWEc 0.85 0.1 37 7.5
6 6/05/2010 1 Australia Sydney BWE 0.58 0.2 41 2.1
7 20/05/2010 2 Australia Sydney BWE 0.38 0.0 36 0.5
8 23/10/2008 16 Caribbean Coast (<2nmi) none 1.81 0.1 35
9 20/05/2009 12 China, N. East Lianyungang BWE 0.56 0.0 35 1.8
10 10/05/2010 12 China, N. East Qingdao BWE 0.59 0.1 35 2.2
11 27/01/2009 8 China, N. East Longkou BWE 1.68 0.0 40 24.2
12 12/03/2009 20 China, N. East Longkou BWE 0.95 0.0 37 9.5
13 25/06/2009 12 China, N. East Dalian BWE 0.93 0.0 35 9.0
14 4/12/2008 10 China, N. East Tianjin BWEc 1.59 1.2 34 12.9
15 17/05/2010 9 China, South Singapore BWEc 1.10 0.2 32 3.1
16 3/11/2008 7 China, S. East Yantian BWE 0.36 0.0 35 0.5
17 15/04/2009 15 China, S. East Yantian BWE 0.75 0.1 36 5.5
18 12/05/2010 25 China, S. East Wenchong none 22.90 1.8 4
19 12/05/2010 8 China, S. East Wenchong BWE 3.67 0.5 34 63.9
20 15/01/2009 China, S. East Zhanjiang none 3.87 0.5 33
21 12/05/2009 12 China, Yangtze 26nmi from Shanghai BWE 3.75 0.1 31 65.6
22 14/05/2010 10 China, Yangtze Shanghai BWEc 6.49 0.1 25 110.8
23 14/05/2010 36 China, Yangtze Shanghai BWEc 3.94 0.3 nd 59.7
24 13/11/2008 12 China, Yangtze Shanghai BWE 1.49 0.5 33 20.3
25 29/05/2009 14 China, Yangtze Shanghai BWE 1.15 0.1 34 13.5
26 30/10/2008 206 China, Yangtze Kouan Shipyard, Taizhou none 16.69 0.2 0
27 20/05/2009 25 China, Yangtze Changshu BWE 3.53 0.4 32 61.2
28 28/05/2009 16 China, Yangtze Nantong BWE 1.07 0.2 35 11.9
29 16/10/2008 4 Germany Bremerhaven BWE 0.49 0.0 32 0.4
30 5/12/2008 6 South America Purto Quetzal, Acajutla BWE 0.52 0.0 36 0.9
31 14/05/2009 11 Indonesia Jakarta BWE 0.43 0.1 36 0.5
32 6/05/2010 16 Indonesia Surabaya BWEc 4.02 0.3 40 61.4
33 20/11/2008 5 Indonesia Tanjungbalai BWE 0.61 0.0 37 2.7
34 18/01/2009 7 Japan Chiba BWE 0.51 0.2 34 0.7
35 7/11/2008 19 Japan Chiba BWE 1.66 0.2 36 23.7
36 22/07/2009 8 Japan Chiba BWE 1.04 0.2 31 11.3
37 14/07/2009 9 Japan Hachinohe BWE 0.93 0.1 34 9.1
38 26/11/2008 16 Japan Harima BWE 3.08 0.4 35 52.1
39 14/05/2009 12 Japan Kashima BWE 0.64 0.1 35 3.4
40 29/05/2009 10 Japan Kashima BWE 0.64 0.1 35 3.2
41 30/04/2009 9 Japan Kawasaki BWE 0.52 0.0 35 0.9
42 11/07/2009 9 Japan Otaru BWE 0.97 0.1 31 9.9
43 2/12/2008 22 Japan Otaru BWE 0.89 0.1 36 8.3
44 12/11/2008 59 Japan South Japan BWE 1.72 0.1 35 24.8
45 7/07/2009 19 Japan Tokyo BWE 1.33 36 17.1
46 12/01/2009 39 Japan Tsuneishi BWE 2.98 0.2 35 50.2
47 23/06/2009 13 Korea Boryeong BWE 1.04 0.3 34 11.4
48 21/05/2009 19 Korea Busan BWE 0.70 0.1 33 4.4
49 4/11/2008 6 Korea Pusan BWE 0.98 0.1 33 10.2
(Continued)
Frontiers in Marine Science | www.frontiersin.org 5 May 2016 | Volume 3 | Article 66
Noble et al. Chemical Assessment of Ballast Water
TABLE 1 | Continued
Case Date Age (days) Source region Source location Management C3*measured Salinity C3*pre BWE
mean SD (calculated)
50 14/04/2009 18 Mexico <100nmi FS 0.69 0.1 36 10.8
51 18/11/2008 6 Mexico Guaymas BWEc 0.52 0.0 32 0.8
52 3/11/2008 4 Mexico Manzanilla BWE 0.67 0.0 35 3.9
53 19/11/2008 3 Mexico Manzanilla none 2.73 0.0 35
54 9/12/2008 3 Mexico Rosarito BWEc 0.80 0.1 36 0.8
55 18/11/2008 18 Mexico Valparaiso BWE 0.99 0.1 33 10.3
56 13/11/2008 62 Ocean Mid-Atlantic BWE 6.84 0.1 37 127.4
57 8/04/2009 1 Ocean Pacific, North FS 0.55 0.1 32 3.8
58 8/10/2008 12 Ocean Pacific, North FS 2.13 0.1 nd 82.7
59 23/10/2008 14 Ocean Pacific, North FS 0.91 0.0 35 21.7
60 10/02/2009 35 Ocean Pacific, North FS 1.43 0.1 34 47.9
61 6/11/2008 6 Ocean Pacific, North FS 1.30 0.1 32 41.4
62 21/05/2010 10 Ocean Pacific, South BWE 3.09 0.1 35 52.3
63 14/05/2010 14 Ocean Pacific, South FS 2.23 0.0 38 87.8
64 20/05/2010 51 Ocean Pacific, South FS 1.28 0.1 36 40.4
65 17/05/2010 22 Ocean Tasman Sea FS 0.52 0.1 35 2.2
66 20/05/2010 18 Ocean Pacific, South BWE 1.64 0.1 35 23.3
67 11/05/2010 84 Ocean Pacific, South BWE 0.72 0.0 39 4.9
68 6/05/2010 3 Pacific Islands Apia, Samoa BWE 0.31 0.0 34 0.5
69 8/05/2010 34 Pacific Islands Papeete, Tahiti BWE 0.48 0.1 36 0.1
70 12/05/2010 42 Pacific Islands Port Vila, Vanuatu BWE 1.75 0.1 38 25.5
71 20/05/2010 2 Pacific Islands Suva, Fiji BWE 0.64 0.1 35 3.4
72 21/05/2010 111 Pacific Islands Suva, Fiji BWE 0.64 0.0 40 3.3
73 18/05/2010 15 South America Balboa, Panama BWE 0.60 0.0 36 2.6
74 24/09/2008 4 Taiwan Kaohsiung BWE 0.55 0.0 35 1.5
75 4/11/2008 5 Taiwan Kaohsiung BWE 1.17 0.0 38 13.9
76 18/05/2010 5 Tonga Nuku’alofa BWE 0.58 0.0 35 2.1
77 Unknown Unknown none 6.07 0.1 35
78 6/08/2008 15 US—Hawaii Hawaii BWE 0.32 0.1 35 0.5
79 21/05/2009 63 US East Coast NJ + East China Sea none 2.15 0.1 36
80 12/11/2008 11 US West Coast Nikiski, AK BWEc 0.89 0.0 33 0.8
81 18/11/2008 6 US West Coast Cherry Point, CA BWEc 0.45 0.1 32 0.8
82 20/11/2008 4 US West Coast Los Angeles BWEc 1.42 0.1 35 9.4
83 18/05/2009 1 US West Coast Los Angeles BWEc 4.05 0.1 30 62.0
84 15/04/2009 2 US West Coast Los Angeles BWEc 1.04 0.1 39 1.8
85 18/05/2009 7 US West Coast Los Angeles BWE 0.90 0.1 33 8.5
86 6/11/2008 7 US West Coast Los Angeles FS 0.50 0.0 35 1.4
87 12/11/2008 6 US West Coast Mix CA ports/coast BWE 0.49 0.0 32 0.3
88 15/04/2009 8 US West Coast Oakland, CA none 5.49 0.2 32
89 8/04/2009 1 US West Coast Oakland, CA BWEc 3.37 0.2 35 48.3
90 13/04/2009 10 US West Coast San Pedro, CA BWE 0.86 0.1 35 7.6
91 4/03/2009 0 US West Coast HI, OR none 3.40 0.7 16
92 10/02/2009 172 US West Coast <50nmi FS 0.47 0.0 42 0.5
93 7/01/2009 7 US West Coast Portland, OR BWEc 0.91 0.0 36 1.0
94 22/05/2009 4 US West Coast Willbridge, OR BWEc 1.24 0.0 35 5.8
95 21/05/2009 25 US West Coast Seattle, WA none 3.24 0.2 28
96 27/05/2009 8 US West Coast Seattle, WA none 2.96 0.4 30
97 21/11/2008 3 US West Coast Seattle, WA BWEc 2.79 0.1 32 36.8
98 13/05/2009 5 US West Coast Seattle, WA BWEc 1.35 0.0 33 8.0
99 16/12/2008 64 US West Coast Vancouver, BC none 3.75 0.0 30
The number of days between loading and sampling of ballast water is indicated in the column “Age”. Ballast water management is categorized as mid-ocean exchange (BWE), coastal
exchange (BWEc), filled at sea (FS), or unexchanged (none). The final column contains calculated fluorescence prior to BWE (see main text). Missing data is shown as “nd.”
Frontiers in Marine Science | www.frontiersin.org 6 May 2016 | Volume 3 | Article 66
Noble et al. Chemical Assessment of Ballast Water
FIGURE 2 | FDOM fluorescence intensities (C3* in QSE) in ships’ ballast water mapped according to the reported origin of ballast water. Symbols
indicate intensities in multiples of the BWE threshold (0.7 QSE) developed by Murphy et al. (2006). Orange and red symbols indicate C3* intensities that exceed the
threshold by more than four and five times, respectively.
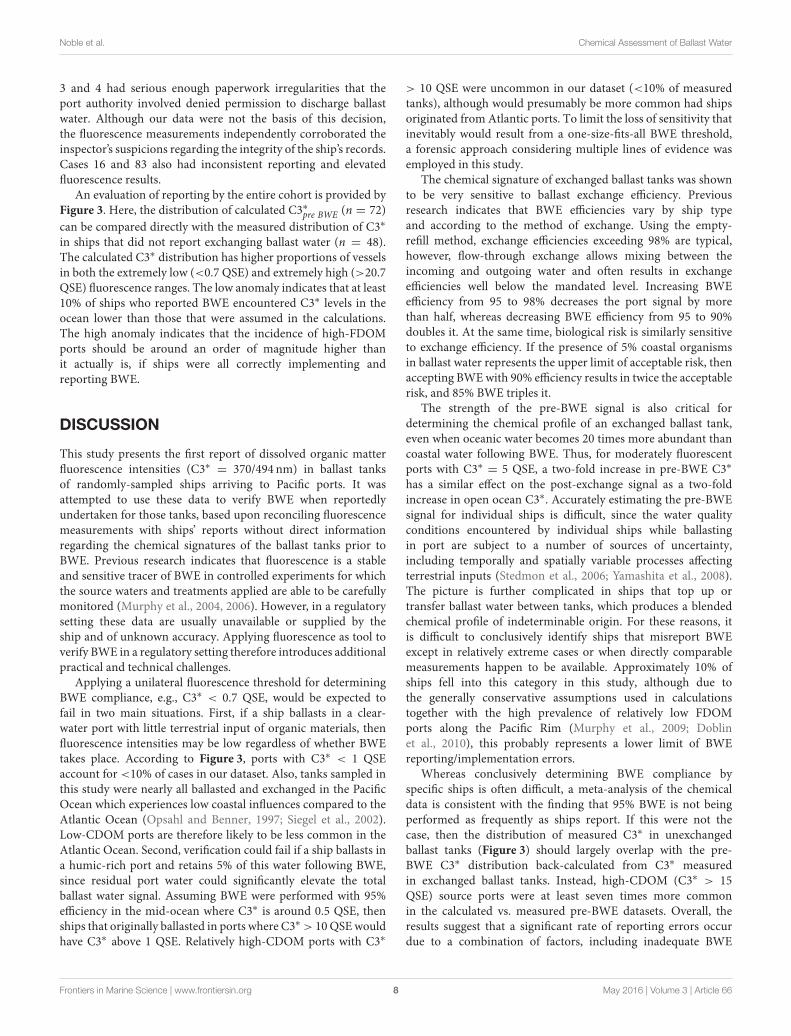
FIGURE 3 | C3* distribution in randomly sampled unexchanged ballast
tanks in this study (n = 48, dark bars) compared with expected
pre-BWE C3* if ballast water exchange were reported correctly (n = 79,
light bars).
decreasing to below 0.8 QSE in the coastal ocean at distancesexceeding 50 nmi from shore (Murphy et al., 2013). In Case 83,C3∗ exceeded 4 QSE after reported 95% coastal BWEc, whichwould require that C3∗ prior to BWEwas around 30 times higherthan the highest values measured during these earlier surveys.
The C3∗ measurements in Table 1 are organizedgeographically to facilitate comparisons between tanks havingsimilar ballast water sources. When two ships ballast in the sameport at around the same time and undertake similar ballast watermanagement, C3∗ intensities in both ships should be comparable.For example, cases 95 and 96 represent unexchanged ballastwater obtained in Seattle by two different ships within a 3 weekperiod and differ by <10%. Returning to Cases 3 and 4, these canbe compared with Case 2, on another ship that ballasted in theport of Melbourne a few days earlier. For Case 2, C3∗ after BWEwas below tc as expected, and 3–6 times lower than in Cases 3and 4. These results again suggest that BWE was undertaken inCase 2, but not in Cases 3 and 4. Similarly, Cases 74 and 75 fromKaohsiung are inconsistent because (1) despite tanks havingbeen loaded and exchanged at nearby locations within a monthof one another, C3∗ was two-fold higher in Case 75, and (2)whereas for Case 74 the estimated pre-BWE C3∗ is within theknown range of Kaohsiung port (1–2 QSE, Murphy et al., 2009),for Case 75 it is a factor of two higher. Finally, Cases 95 and 96with unexchanged Seattle water provide some support for theclaim that BWE was attempted in Case 98, although it appears tohave been much less than 95% efficient.
In most cases where fluorescence data were at odds with BWEreporting in this study, there was no evidence of irregularitiesin the ship’s paperwork. However, the vessel involved in Cases
Frontiers in Marine Science | www.frontiersin.org 7 May 2016 | Volume 3 | Article 66
Noble et al. Chemical Assessment of Ballast Water
3 and 4 had serious enough paperwork irregularities that theport authority involved denied permission to discharge ballastwater. Although our data were not the basis of this decision,the fluorescence measurements independently corroborated theinspector’s suspicions regarding the integrity of the ship’s records.Cases 16 and 83 also had inconsistent reporting and elevatedfluorescence results.
An evaluation of reporting by the entire cohort is provided byFigure 3. Here, the distribution of calculated C3∗pre BWE (n = 72)
can be compared directly with the measured distribution of C3∗
in ships that did not report exchanging ballast water (n = 48).The calculated C3∗ distribution has higher proportions of vesselsin both the extremely low (<0.7 QSE) and extremely high (>20.7QSE) fluorescence ranges. The low anomaly indicates that at least10% of ships who reported BWE encountered C3∗ levels in theocean lower than those that were assumed in the calculations.The high anomaly indicates that the incidence of high-FDOMports should be around an order of magnitude higher thanit actually is, if ships were all correctly implementing andreporting BWE.
DISCUSSION
This study presents the first report of dissolved organic matterfluorescence intensities (C3∗ = 370/494 nm) in ballast tanksof randomly-sampled ships arriving to Pacific ports. It wasattempted to use these data to verify BWE when reportedlyundertaken for those tanks, based upon reconciling fluorescencemeasurements with ships’ reports without direct informationregarding the chemical signatures of the ballast tanks prior toBWE. Previous research indicates that fluorescence is a stableand sensitive tracer of BWE in controlled experiments for whichthe source waters and treatments applied are able to be carefullymonitored (Murphy et al., 2004, 2006). However, in a regulatorysetting these data are usually unavailable or supplied by theship and of unknown accuracy. Applying fluorescence as tool toverify BWE in a regulatory setting therefore introduces additionalpractical and technical challenges.
Applying a unilateral fluorescence threshold for determiningBWE compliance, e.g., C3∗ < 0.7 QSE, would be expected tofail in two main situations. First, if a ship ballasts in a clear-water port with little terrestrial input of organic materials, thenfluorescence intensities may be low regardless of whether BWEtakes place. According to Figure 3, ports with C3∗ < 1 QSEaccount for <10% of cases in our dataset. Also, tanks sampled inthis study were nearly all ballasted and exchanged in the PacificOcean which experiences low coastal influences compared to theAtlantic Ocean (Opsahl and Benner, 1997; Siegel et al., 2002).Low-CDOM ports are therefore likely to be less common in theAtlantic Ocean. Second, verification could fail if a ship ballasts ina humic-rich port and retains 5% of this water following BWE,since residual port water could significantly elevate the totalballast water signal. Assuming BWE were performed with 95%efficiency in the mid-ocean where C3∗ is around 0.5 QSE, thenships that originally ballasted in ports where C3∗ > 10QSEwouldhave C3∗ above 1 QSE. Relatively high-CDOM ports with C3∗
> 10 QSE were uncommon in our dataset (<10% of measuredtanks), although would presumably be more common had shipsoriginated from Atlantic ports. To limit the loss of sensitivity thatinevitably would result from a one-size-fits-all BWE threshold,a forensic approach considering multiple lines of evidence wasemployed in this study.
The chemical signature of exchanged ballast tanks was shownto be very sensitive to ballast exchange efficiency. Previousresearch indicates that BWE efficiencies vary by ship typeand according to the method of exchange. Using the empty-refill method, exchange efficiencies exceeding 98% are typical,however, flow-through exchange allows mixing between theincoming and outgoing water and often results in exchangeefficiencies well below the mandated level. Increasing BWEefficiency from 95 to 98% decreases the port signal by morethan half, whereas decreasing BWE efficiency from 95 to 90%doubles it. At the same time, biological risk is similarly sensitiveto exchange efficiency. If the presence of 5% coastal organismsin ballast water represents the upper limit of acceptable risk, thenaccepting BWEwith 90% efficiency results in twice the acceptablerisk, and 85% BWE triples it.
The strength of the pre-BWE signal is also critical fordetermining the chemical profile of an exchanged ballast tank,even when oceanic water becomes 20 times more abundant thancoastal water following BWE. Thus, for moderately fluorescentports with C3∗ = 5 QSE, a two-fold increase in pre-BWE C3∗
has a similar effect on the post-exchange signal as a two-foldincrease in open ocean C3∗. Accurately estimating the pre-BWEsignal for individual ships is difficult, since the water qualityconditions encountered by individual ships while ballastingin port are subject to a number of sources of uncertainty,including temporally and spatially variable processes affectingterrestrial inputs (Stedmon et al., 2006; Yamashita et al., 2008).The picture is further complicated in ships that top up ortransfer ballast water between tanks, which produces a blendedchemical profile of indeterminable origin. For these reasons, itis difficult to conclusively identify ships that misreport BWEexcept in relatively extreme cases or when directly comparablemeasurements happen to be available. Approximately 10% ofships fell into this category in this study, although due tothe generally conservative assumptions used in calculationstogether with the high prevalence of relatively low FDOMports along the Pacific Rim (Murphy et al., 2009; Doblinet al., 2010), this probably represents a lower limit of BWEreporting/implementation errors.
Whereas conclusively determining BWE compliance byspecific ships is often difficult, a meta-analysis of the chemicaldata is consistent with the finding that 95% BWE is not beingperformed as frequently as ships report. If this were not thecase, then the distribution of measured C3∗ in unexchangedballast tanks (Figure 3) should largely overlap with the pre-BWE C3∗ distribution back-calculated from C3∗ measuredin exchanged ballast tanks. Instead, high-CDOM (C3∗ > 15QSE) source ports were at least seven times more commonin the calculated vs. measured pre-BWE datasets. Overall, theresults suggest that a significant rate of reporting errors occurdue to a combination of factors, including inadequate BWE
Frontiers in Marine Science | www.frontiersin.org 8 May 2016 | Volume 3 | Article 66
Noble et al. Chemical Assessment of Ballast Water
and unintentional or deliberate misreporting of ballast watermanagement.
Experience from the Great Lakes of North America suggeststhat compliance by ships with BWE legislation is strongly linkedto inspection effort (Bailey et al., 2011). Whereas, our earlierresearch established the scientific basis for using fluorescencespectroscopy to trace ballast water origin, this is the first studyto move this technique to the level of implementation anddemonstrate how the technology works when implemented bygovernmental inspectors. In-situ FDOM sensors have recentlyentered the market and offer the possibility of simple real-timemeasurements as long as instrument reliability, stability, andcalibration issues are appropriately handled. Incorporating suchmeasurements into inspection programs at Pacific rim portscould improve the detection of high-risk ballast water and theoverall implementation of BWE in the region.
AUTHOR CONTRIBUTIONS
GR, MN, and KM conceived of the overall study andexperimental design. MN performed the field trials and acquiredthe data in this study with assistance from others as describedin the Acknowledgements. Statistical analyses were performed byMN and KM. KM and MN drafted the article and all authorsrevised it for intellectual content. All authors approve of the finalversion and are accountable for its accuracy.
FUNDING
Funding for this project was provided by California StateLands Commission (CSLC), Washington Department of Fishand Wildlife (WDFW), Oregon Department of EnvironmentalQuality (ODEQ), New Zealand Ministry of Primary Industries(MPI), US Coast Guard Research and Development Center(RDC), and National Sea Grant Ballast Water DemonstrationProgram, Department of Commerce Award #NA050AR4171066.
ACKNOWLEDGMENTS
The authors are indebted to many people and agencies thatassisted with ballast water sampling during this project. We aregrateful to Rian Hooff from ODEQ for assistance in Oregon.From CSLC we extend our thanks to Chris Beckwith, TomBurke, Robert Chatman, Bob Chedsey, Nicole Dobrosk, MauryaFalkner, Ricky Galeon, Daphne Gehringer, Gary Gregory, JackieMackay, Chris Scianni, Bob Shilland, and David Stephens,amongst others. FromWDFW we thank Gary Gertsen and AllenPleus. From MPI we thank Clive Imrie, Stu Rawnsley, GregWilliams, Touzelle Batkin, Brendon Wakeman, Owen Aspen,Kevin Hawkes, Jeff O’Neil, Gary Higgins, Kristy Jacob, TimDas, and others. Assistance with planning and organizing inNew Zealand was provided by Chris Denny, Andrew Bell, LizJones, andNaomi Parker. Jennifer Boehme, Chris Brown, DarrickSparks and Ashley Arnwine at SERC assisted with sampling andanalyses.
REFERENCES
Albert, R. J., Lishman, J. M., and Saxena, J. R. (2013). Ballast water regulations and
the move toward concentration-based numeric discharge limits. Ecol. Appl. 23,
289–300. doi: 10.1890/12-0669.1
Bailey, S. A., Deneau, M. G., Jean, L., Wiley, C. J., Leung, B., and Macisaac,
H. J. (2011). Evaluating efficacy of an environmental policy to prevent
biological invasions. Environ. Sci. Technol. 45, 2554–2561. doi: 10.1021/es10
2655j
Blough, N. V., and Del Vecchio, R. (2002). “Chromophoric DOM in the
coastal environment,” in Biogeochemistry of Marine Dissolved Organic Matter,
eds D. A. Hansell and C. A. Carlson (San Diego, CA: Academic Press),
509–546.
Briski, E., Gollasch, S., David, M., Linley, R. D., Casas-Monroy, O., Rajakaruna,
H., et al. (2015). Combining ballast water exchange and treatment to maximize
prevention of species introductions to freshwater ecosystems. Environ. Sci.
Technol. 49, 9566–9573. doi: 10.1021/acs.est.5b01795
Carlton, J. T., and Geller, J. B. (1993). Ecological roulette: the global
transport of non-indigenous marine organisms. Science 261, 78–82. doi:
10.1126/science.261.5117.78
Coble, P. G. (1996). Characterization of marine and terrestrial DOM in seawater
using excitation-emission matrix spectroscopy. Mar. Chem. 51, 325–346. doi:
10.1016/0304-4203(95)00062-3
Cohen, A. N. (1998). Ships’ Ballast Water and the Introduction of Exotic Organisms
Into the San Francisco Estuary: Current Status of the Problem and Options for
Management. Richmond, CA: San Francisco Estuary Institute.
Costello, C., Drake, J. M., and Lodge, D. M. (2007). Evaluating an invasive species
policy: ballast water exchange in the great lakes. Ecol. Appl. 17, 655–662. doi:
10.1890/06-0190
Doblin, M. A., Murphy, K. R., and Ruiz, G. M. (2010). Thresholds for tracing ships’
ballast water: an Australian case study. Mar. Ecol. Prog. Ser. 408, 19–32. doi:
10.3354/meps08599
Drake, L. A., Doblin, M. A., and Dobbs, F. C. (2007). Potential microbial
bioinvasions via ships’ ballast water, sediment, and biofilm. Mar. Pollut. Bull.
55, 333–341. doi: 10.1016/j.marpolbul.2006.11.007
Duursma, E. K. (1974). “The fluorescence of dissolved organic matter in the sea,” in
Optical Aspects of Oceanography, eds N. G. Jerlov and E. Steeman Nielsen (New
York,NY: Academic Press), 237–256.
Gray, D. K., Johengen, T. H., Reid, D. F., and Macisaac, H. J. (2007). Efficacy
of open-ocean ballast water exchange as a means of preventing invertebrate
invasions between freshwater ports. Limnol. Oceanogr. 52, 2386–2397. doi:
10.4319/lo.2007.52.6.2386
Guo, W. D., Yang, L. Y., Hong, H. S., Stedmon, C. A., Wang, F. L., Xu, J., et al.
(2011). Assessing the dynamics of chromophoric dissolved organic matter in a
subtropical estuary using parallel factor analysis.Mar. Chem. 124, 125–133. doi:
10.1016/j.marchem.2011.01.003
Hewitt, C. L., and Campbell, M. L. (2007). Mechanisms for the prevention of
marine bioinvasions for better biosecurity. Mar. Pollut. Bull. 55, 395–401. doi:
10.1016/j.marpolbul.2007.01.005
Kothawala, D., Murphy, K., Stedmon, C., Weyhenmeyer, G., and Tranvik, L.
(2013). Inner filter correction of dissolved organic matter fluorescence. Limnol.
Oceanogr. Methods 11, 616–630. doi: 10.4319/lom.2013.11.616
Lakowicz, J. R. (2006). Principles of fluorescence spectroscopy, 3rd Edn. New York,
NY: Plenum Press.
MAF (Ministry of Agriculture and Forestry) (2005). Import health standard for
ships’ ballast water from all countries. Rule issued pursuant to Section 22 of the
Biosecurity Act 1993 on 13 June 2005. Wellington.
MAF (Ministry of Agriculture and Forestry) (2007).Managing and Controlling the
Risk to the Marine Environment from Ballast Water Discharges: New Zealand’s
Response to the International Convention for the Control and Management of
Ship’s Ballast Water and Sediments. Wellington: MAF Biosecurity New Zealand
Discussion Paper No: 2007/04
Miller, A. W., Minton, M. S., and Ruiz, G. M. (2011). Geographic limitations
and regional differences in ships’ ballast water management to reduce marine
Frontiers in Marine Science | www.frontiersin.org 9 May 2016 | Volume 3 | Article 66

Noble et al. Chemical Assessment of Ballast Water
invasions in the contiguous United States. Bioscience 61, 880–887. doi:
10.1525/bio.2011.61.11.7
Minton, M. S., Miller, A. W., and Ruiz, G. M. (2015). Implications of ship
type on delivery and management of ballast water, in Biological Invasions in
Changing Ecosystems Vectors, Ecological Impacts, Management and Predictions
Canning-Clode, ed J. De Gruyter Open. 343–364. doi: 10.1515/9783110438
666-021
Murphy, K., Boehme, J., Brown, C., Noble, M., Smith, G., Sparks, D., et al. (2009).
Investigation Into the Distribution of Ballast Water Tracers in Coastal Waters.
US Coast Guard Research and Development Center, Report No: CG-D-01-10
(Groton, CT).
Murphy, K., Boehme, J., Coble, P., Cullen, J., Field, P., Moore, W.,
et al. (2004). Verification of mid-ocean ballast water exchange using
naturally occurring coastal tracers. Mar. Pollut. Bull. 48, 711–730. doi:
10.1016/j.marpolbul.2003.10.015
Murphy, K. R., Boehme, J., Noble, M., Brown, C., Smith, G., Sparks, D.,
et al. (2013). Dissolved organic matter fluorescence in the coastal ocean
along the US Pacific coast: exploring the limits to chemical verification
of ballast water exchange by ships. J. Mar. Syst. 111–112, 157–166. doi:
10.1016/j.jmarsys.2012.10.010
Murphy, K. R., Butler, K. D., Spencer, R. G. M., Stedmon, C. A., Boehme, J. R., and
Aiken, G. R. (2010). The measurement of dissolved organic matter fluorescence
in aquatic environments: an interlaboratory comparison. Environ. Sci. Technol.
44, 9405–9412. doi: 10.1021/es102362t
Murphy, K. R., Field, M. P., Waite, T. D., and Ruiz, G. M. (2008a). Trace elements
in ships’ ballast water as tracers of mid-ocean exchange. Sci. Total Environ. 393,
11–26. doi: 10.1016/j.scitotenv.2007.12.011
Murphy, K. R., Ruiz, G. M., Dunsmuir, W. T. M., and Waite, T. D.
(2006). Optimized parameters for fluorescence-based verification of ballast
water exchange by ships. Environ. Sci. Technol. 40, 2357–2362. doi:
10.1021/es0519381
Murphy, K. R., Stedmon, C. A., Waite, T. D., and Ruiz, G. M.
(2008b). Distinguishing between terrestrial and autochthonous
organic matter sources in marine environments using fluorescence
spectroscopy. Mar. Chem. 108, 40–58. doi: 10.1016/j.marchem.2007.
10.003
Nelson, N. B., Siegel, D. A., Carlson, C. A., and Swan, C. M. (2010). Tracing
global biogeochemical cycles and meridional overturning circulation using
chromophoric dissolved organic matter. Geophys. Res. Lett. 37:L03610. doi:
10.1029/2009gl042325
Opsahl, S., and Benner, R. (1997). Distribution and cycling of terrigenous
dissolved organic matter in the ocean. Nature 386, 480–482. doi: 10.1038/
386480a0
Roman, J., and Darling, J. A. (2007). Paradox lost: genetic diversity and the
success of aquatic invasions. Trends Ecol. Evol. (Amst). 22, 454–464. doi:
10.1016/j.tree.2007.07.002
Ruiz, G. M., Carlton, J. T., Grosholz, E. D., and Hines, A. H. (1997).
Global invasions of marine and estuarine habitats by non-indigenous
species: mechanisms, extent, and consequences. Am. Zool. 37, 621–632. doi:
10.1093/icb/37.6.621
Siegel, D. A., Maritorena, S., Nelson, N. B., Hansell, D. A., and Lorenzi-
Kayser, M. (2002). Global distribution and dynamics of colored dissolved
and detrital organic materials. J. Geophys. Res. Oceans 107, 21-1–21-14. doi:
10.1029/2001jc000965
Stedmon, C. A., and Markager, S. (2005). Resolving the variability of
dissolved organic matter fluorescence in a temperate estuary and its
catchment using PARAFAC analysis. Limnol. Oceanogr. 50, 686–697. doi:
10.4319/lo.2005.50.2.0686
Stedmon, C. A., Markager, S., Søndergaard, M., Vang, T., Laubel, A., Borch, N. H.,
et al. (2006). Dissolved organic matter (DOM) export to a temperate estuary:
seasonal variations and implications of land use. Estuaries Coasts 29, 388–400.
doi: 10.1007/BF02784988
United States Coast Guard (USCG) (2012a). BallastWaterManagement for Control
of Non-Indigenous Species in Waters of the United States, 33 C.F.R. §151.2000–
§151.2080.
United States Coast Guard (USCG) (2012b). Ballast Water Discharge Standard
(BWDS), 33 C.F.R. §151.1511.
Walker, S. A., Amon, R. M. W., Stedmon, C., Duan, S., and Louchouarn, P. (2009).
The use of PARAFACmodeling to trace terrestrial dissolved organic matter and
fingerprint water masses in coastal Canadian Arctic surface waters. J. Geophys.
Res. Biogeosci. 114:G00F06. doi: 10.1029/2009jg000990
Yamashita, Y., Jaffe, R., Maie, N., and Tanoue, E. (2008). Assessing the dynamics
of dissolved organic matter (DOM) in coastal environments by excitation
emission matrix fluorescence and parallel factor analysis (EEM-PARAFAC).
Limnol. Oceanogr. 53, 1900–1908. doi: 10.4319/lo.2008.53.5.1900
Conflict of Interest Statement: The authors declare that the research was
conducted in the absence of any commercial or financial relationships that could
be construed as a potential conflict of interest.
Copyright © 2016 Noble, Ruiz andMurphy. This is an open-access article distributed
under the terms of the Creative Commons Attribution License (CC BY). The use,
distribution or reproduction in other forums is permitted, provided the original
author(s) or licensor are credited and that the original publication in this journal
is cited, in accordance with accepted academic practice. No use, distribution or
reproduction is permitted which does not comply with these terms.
Frontiers in Marine Science | www.frontiersin.org 10 May 2016 | Volume 3 | Article 66