charity commission annual report 2010 - 11
DESCRIPTION
The Charity Commission’s latest Annual Report highlights the regulator’s success in meeting all of its key performance indicators (KPIs) during the past financial year. This is a first for the Commission, and comes during a comprehensive strategic review of the regulator’s role and activities, prompted in part by cuts to its budget of a third over four years. The report, which is structured around the concept of the charity life-cycle to help the public understand how and when the Commission interacts with charities, also reveals the Commission’s progress in encouraging charities to access its services online.TRANSCRIPT
Charity CommissionAnnual Report and Accounts 2010-11
HC 970 | Price: £20.50


HC 970 LONDON: THE STATIONERY OFFICE Price: £20.50
Charity Commission
Annual Report and Accounts 2010-11 (For the year ended 31 March 2011)
Accounts presented to the House of Commons pursuant to Section 6(4) of the Government Resources and Accounts Act 2000
Accounts presented to the House of Lords by Command of Her Majesty
Annual Report presented to Parliament pursuant to section 1A and paragraph 11 of Schedule 1A of the Charities Act 1993
Ordered by the House of Commons to be printed on 30 June 2011

This is part of a series of Annual Reports and Accounts which, along with the Main
Estimates 2010-11, the document Public Expenditure: Statistical Analyses 2010, and
the Supply Estimates 2010-11: Supplementary Budgetary Information, present the
Government’s outturn and planned expenditure for 2010-11.
© Crown Copyright 2011
You may re-use this information (excluding logos) free of charge in any format or medium,
under the terms of the Open Government Licence. To view this licence, visit
http://www.nationalarchives.gov.uk/doc/open-government-licence/ or email:
Where we have identified any third party copyright information you will need to obtain
permission from the copyright holders concerned.
Any enquiries regarding this publication should be sent to us at
This publication is also available for download at www.official-documents.gov.uk and is
also available from our website www.charitycommission.gov.uk
ISBN: 9780102972658
Printed in the UK by The Stationery Office Limited
on behalf of the Controller of Her Majesty’s Stationery Office.
ID P002972658 06/11
Printed on paper containing 75% recycled fibre content minimum.

1
Contents
Introduction by the Chair and Chief Executive 2
Activities and achievements in 2010-11 3
This year’s report 3
This year in figures 3
Planting the seed: registration and the online Register 4
Striking firm roots: helping charities get on with the job 6
Bearing fruit: providing public benefit 8
Weeding out difficulties: tackling serious problems in charities 10
Maintaining fertile ground: promoting good practice 12
Completing the charity life cycle: coming off the Register 14
Our finances: an overview 15
Our performance in 2010-11 16
Statutory objectives 17
Complaints about the Commission’s service 23
Our staff 24
Sustainability report 26
Resource Accounts 2010-11 29
Annual Report and Accounts 2010-11

The past year at the Charity Commission has been
marked by considerable change. In autumn 2010, we
said goodbye to Andrew Hind, whose term of office
had come to an end, and welcomed our new chief
executive. Shortly afterwards, the outcome of the 2010
spending review revealed that our funding is being
reduced by a third over four years.
We responded with a thorough review of our
strategy and structure, informed by a comprehensive
consultation. We were heartened by and grateful for
the insight that our stakeholders across the sector and
beyond brought to the consultation. It is clear that the
public and charities place high value on the existence
of an independent regulator of charities.
At the time of writing, our new strategy is still under
development. But the principles underlying our
future work are clear. Our consultation revealed a
broad consensus that the Commission exists primarily
to serve the public. We will therefore focus on our
core regulatory role and on doing the things that
only we can. Maintaining the register, promoting
compliance with charity law and developing online
guidance will constitute our core activity. We will
also work with the sector to develop a more proactive
approach to identifying and mitigating the key risks
facing charities.
While 2010-11 has been anything but a ‘business
as usual’ year, our day-to-day work has, of course,
continued. It is a testament to the commitment and
professionalism of the Commission’s staff that, despite
the very considerable uncertainty associated with the
strategic review, not least the loss of many valued
colleagues, we have met all of our Key Performance
Indicators (KPIs). This is the first year in which we have
achieved across the board success against the KPIs – a
feat of which we think the Commission’s staff should
be rightly proud. But we are not complacent and
recognise that maintaining these levels of performance
will require continued efforts to improve and
streamline our services and motivate our staff.
The Commission, of course, is not the only organisation
having to review fundamentally its purpose and
priorities. Many charities find themselves in a similar
situation and the sector as a whole faces a long-term
funding challenge.
The Commission cannot solve these problems on
charities’ behalf. However, by providing a robust
framework of charity regulation, we can contribute to
upholding high levels of public trust and confidence in
charities, thus helping to secure continued support for a
sector that plays such a crucial role in society.
Dame Suzi Leather Sam Younger Chair Chief Executive
Introduction by the Chair and Chief Executive
“By providing a robust framework of charity regulation, we can help uphold high levels of public trust and confidence in charities.”
“rising to
the challenge”
2 Annual Report and Accounts 2010-11
3
This year’s report
This year’s report differs slightly from those of previous years. In line with new guidelines, this year’s
document combines the Annual Report and the Resource Accounts, which were previously laid before
Parliament separately.
To make the combined report easy to navigate, we have divided it into three parts. The first functions as
the customary Annual Report, the second sets out how we have performed against our key performance
indicators and the final part details our Resource Accounts for this year.
The Annual Report itself is structured around the theme of the ‘charity life-cycle’ and takes the reader on a
journey through the Commission’s services and priorities, highlighting key areas of our work this year and setting
out where and how our priorities will be changing as a result of the strategic review.
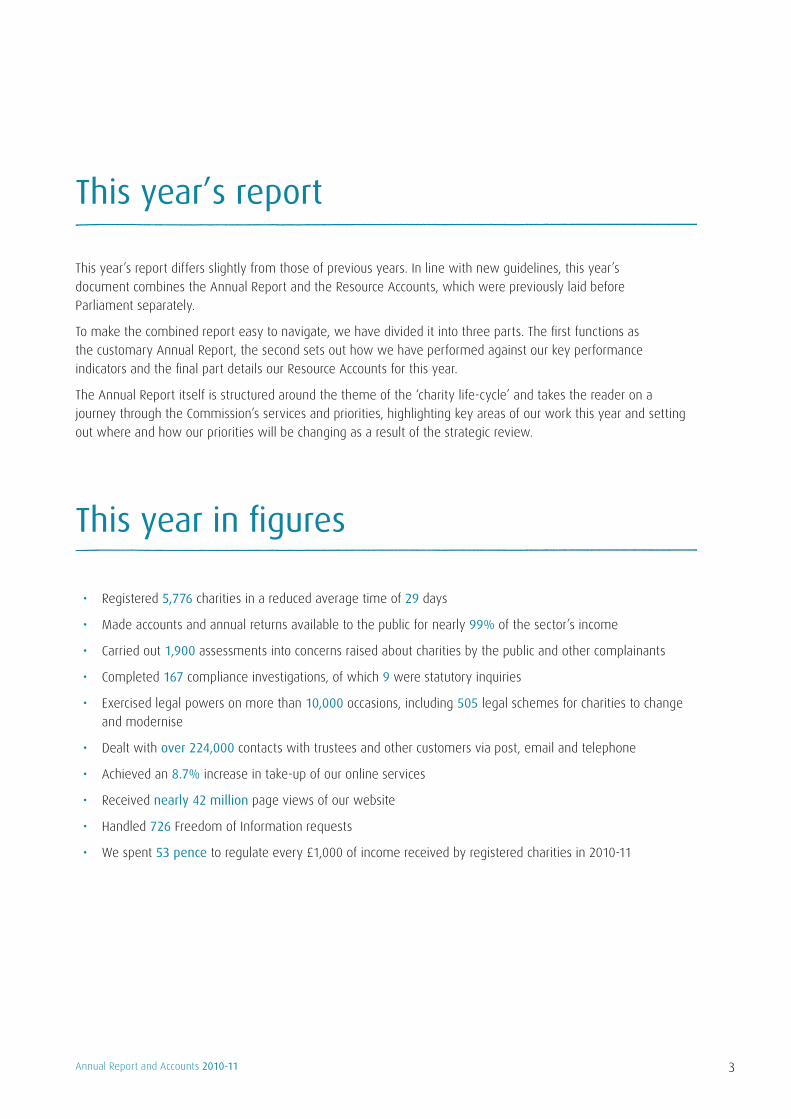
This year in figures
Registered • 5,776 charities in a reduced average time of 29 days
Made accounts and annual returns available to the public for nearly • 99% of the sector’s income
Carried out • 1,900 assessments into concerns raised about charities by the public and other complainants
Completed • 167 compliance investigations, of which 9 were statutory inquiries
Exercised legal powers on more than • 10,000 occasions, including 505 legal schemes for charities to change
and modernise
Dealt with • over 224,000 contacts with trustees and other customers via post, email and telephone
Achieved an • 8.7% increase in take-up of our online services
Received • nearly 42 million page views of our website
Handled • 726 Freedom of Information requests
We spent • 53 pence to regulate every £1,000 of income received by registered charities in 2010-11
Annual Report and Accounts 2010-11

Planting the seed: registration and the online Register
RegistrationRegistration with the Charity Commission is an
important step in the life of most charities – often, it’s
the first step trustees take. While the smallest charities
are not required to register, registration is compulsory
for charities with annual incomes of £5,000 or over1.
This year, 5,776 charities joined the Register.
Being a registered charity is a privilege – we know
from research that people associate charity registration
with legitimacy and trustworthiness2. It is therefore
important that we get the process right. This means
gathering the information needed to ensure charities
are accountable to the public, without placing an
excessive burden on trustees.
The law sets out which organisations can and cannot
be charities. We apply the law by looking at whether
an organisation’s aims are exclusively charitable and
whether it is set up for the public benefit. The time it
takes to register depends on how complex the case
is, but we aim to register charities in an average of 30
days. This year, we exceeded our target by registering
charities in an average of 29 days.
This year, we made registering online even easier, by
upgrading our services to allow charities to send us
supporting documents, such as governing documents,
electronically. That helped increase the proportion of
charities registering online to 88% in 2010-11, up from
50% in 2009-10.
The Charities Act 2006 changed the way some charities
are regulated, meaning that some previously exempt
from registration are now required to register. This
came into force in 2009 and, since then, we have
been working with these charities to bring them on to
the Register. In 2010-11, 36 Student Unions joined the
Register, along with Cardiff, Glamorgan, Swansea and
Swansea Metropolitan Universities and 43 Oxford and
Cambridge University colleges. We have worked closely
with umbrella bodies, including the National Union of
Students, to help streamline the registration process
for these charities. The new framework is designed to
improve accountability across the sector.
The online Register of CharitiesThe Register is available for everyone – including
members of the public and grant-makers – to view
online. Every registered charity has its own entry,
allowing people to find information such as what
it does, who its trustees are, and how it spends its
money. This year, charities’ details were viewed online
over 5.6 million times.
The information displayed on the online Register comes
from charity trustees, who have a duty to send us
certain documents every year.
These reporting requirements are among the
most important ways for charities to demonstrate
transparency and accountability. Research into public
trust in charities, published in July 2010, shows that
people place increasing value on knowing how
charities spend their money3. Submitting documents
on time is therefore an important factor in maintaining
trust in individual charities and the sector as a whole.
The percentage of charities submitting their documents
within the 10-month legal deadline is increasing. 84%
of charities filed annual returns within the deadline
in 2010-11 – up from 81% in 2009-10. These charities
represent over 95% of the sector’s income.
When a charity fails to meet its filing deadline, this
will show against its name on the Register of Charities,
potentially putting it at a disadvantage when raising
funds from the public or applying for grants or
4
1 This excludes exempt and excepted charities. For more information about exempt and excepted charities, please see the relevant pages on the Commission’s website. 2 Focus group research published by Ipsos MORI in December 2010 as part of the Commission’s strategy review. 3 Research into public trust and confidence in charities conducted by Ipsos MORI and published in July 2010.
Annual Report and Accounts 2010-11
“helping good
intentions to germinate”
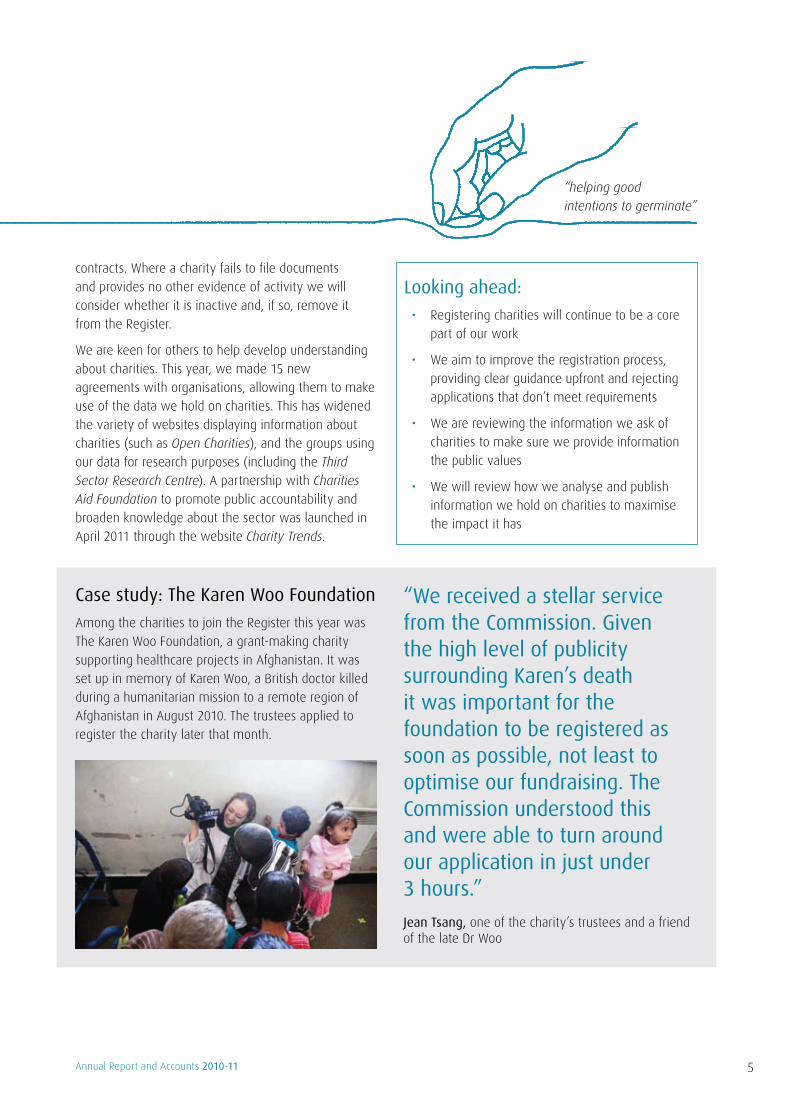
Case study: The Karen Woo FoundationAmong the charities to join the Register this year was
The Karen Woo Foundation, a grant-making charity
supporting healthcare projects in Afghanistan. It was
set up in memory of Karen Woo, a British doctor killed
during a humanitarian mission to a remote region of
Afghanistan in August 2010. The trustees applied to
register the charity later that month.
“We received a stellar service from the Commission. Given the high level of publicity surrounding Karen’s death it was important for the foundation to be registered as soon as possible, not least to optimise our fundraising. The Commission understood this and were able to turn around our application in just under 3 hours.”
Jean Tsang, one of the charity’s trustees and a friend of the late Dr Woo
5
contracts. Where a charity fails to file documents
and provides no other evidence of activity we will
consider whether it is inactive and, if so, remove it
from the Register.
We are keen for others to help develop understanding
about charities. This year, we made 15 new
agreements with organisations, allowing them to make
use of the data we hold on charities. This has widened
the variety of websites displaying information about
charities (such as Open Charities), and the groups using
our data for research purposes (including the Third
Sector Research Centre). A partnership with Charities
Aid Foundation to promote public accountability and
broaden knowledge about the sector was launched in
April 2011 through the website Charity Trends.
Looking ahead:Registering charities will continue to be a core • part of our work
We aim to improve the registration process, • providing clear guidance upfront and rejecting
applications that don’t meet requirements
We are reviewing the information we ask of • charities to make sure we provide information
the public values
We will review how we analyse and publish • information we hold on charities to maximise
the impact it has
Annual Report and Accounts 2010-11

Striking firm roots: helping charities get on with the job
GuidanceMost charities need support at some point in their
development. Our published guidance helps trustees
understand how the law applies to their charities and
what they need to consider when making decisions.
We continuously review our guidance to ensure it is
up-to-date and fit for purpose.
Sometimes, trustees come to us for specific advice.
Often we can refer them to our online guidance.
A sample of 1000 calls to Charity Commission
Direct4 revealed that almost half were about the
Annual Return, annual accounts, our online services,
registration and updating entries on the Register.
We are able to refer most callers on these issues to
the website.
Focus on finance
Since the economic downturn, we have prioritised our
work to review and update our financial guidance. The
updated guidance places greater emphasis on the need
for trustees to take a risk management approach to
their charity’s resources and finances.
In June 2010, we published a set of updated financial
guidance, including guidance on risk management,
dealing with financial difficulties and on reserves. The
guidance explains the issues trustees need to take into
account in the context of charity law and good practice.
Our updated guidance on Charities and Fundraising
details what trustees should consider when taking a
risk-management approach to fundraising. We also
consulted on changes to our guidance on Charities and
Investment and will publish the revised guidance in
summer 2011.
Supporting small charities
We are mindful that smaller charities often need more
basic guidance to reach their full potential in the Big
Society. This year, we created a new section of our
website dedicated to their needs. The pages aim
at helping smaller charities make the most of
our services, and provide basic information on a
broad range of topics, including starting a charity and
finding trustees.
We have also developed guidance signposting smaller
charities to the legal requirements and good practice
recommendations they need to bear in mind when
taking financial decisions. Managing charity assets
and resources: an overview for trustees summarises
our financial guidance and points trustees to detailed
guidance available online.
We are committed to making our website
user-friendly. A survey conducted this year revealed
that most people find our website easy to use and
that the majority of charities asked (84%) used our
online guidance. This year, we achieved a 12%
increase in the number of publications sent
electronically or downloaded.
Responding to change
In September 2010, we published summary guidance
on the charities exemption set out in the new Equality
Act. Our guidance explains that charities may, but only
in very particular circumstances, restrict the people
they help according to a shared characteristic protected
under the Act. We also updated our guidance on
political activity and campaigning to include a section
on Charities and Referendums.
In April 2011, the Charity Tribunal ruled against a
charity’s appeal against our decision not to allow
it to restrict its adoption services to heterosexual
prospective parents. The Tribunal agreed our approach
- based on European law - that the charity had not
provided sufficiently weighty reasons to justify the
proposed discrimination. We recognise the sensitive
nature of this issue and have considered all the
evidence and arguments carefully. The charity has since
6
4 Sample taken in September 2010.
Annual Report and Accounts 2010-11

sought leave to appeal that decision and, at the time of
writing, the Charity Tribunal is considering the request.
Consents and permissionsSometimes, trustees come to us because they want
to do something but don’t have the legal power to, or
because they wish to amend the charity’s objects. We
can help by providing the necessary authority.
We are developing online tools to help reduce the
time we take to consider requests and to help
save resources. This year, we introduced online
forms for dissolving a charity, vesting land in the
Official Custodian and recording a merger. This work,
which saw us shortlisted in the 2010 Whitehall and
Westminster and e-Government National Awards,
helped reduce the post we receive by over 40%
and the calls we take by 22% on 2009-10 levels.
Increases in the proportions of charity advisers
contacting us by email and of charities registering
online were also important factors in reducing the
volume of letters and calls.
“giving charities the support
they need to grow strong”
7
Case study: St Thomas Church Parkgate
“We realised that people in our local community needed a place to meet for activities such as concerts, exhibitions and talks. The Commission provided us with a legal scheme to widen our charity’s objects, allowing us to open the church for wider community purposes, while keeping to our core religious purposes. The church building is now used regularly by local groups, helping to root the church at the heart of the community.”
Reverend Neill Robb, Trustee of St Thomas Parkgate, Neston Credit: Peter Coward
Looking ahead:Providing clear guidance to help trustees • meet their legal duties will continue to be a
key priority. Where appropriate, we will tailor
guidance to charities’ diverse needs
We will develop our partnerships with umbrella • bodies so that they can take on responsibility
for one-to-one advice
We will focus on reducing red tape connected • to permissions required in law, considering
options such as self-certification
Annual Report and Accounts 2010-11
Bearing fruit: providing public benefit
Public benefit has always been at the heart of what it
means to be a charity. Charities’ ability to further the
public good by helping their beneficiaries is among the
reasons they receive high levels of public trust.
The Charities Act 2006 highlighted the requirement
that charities must have aims which are for the public
benefit. Following the 2006 Act, changes were made to
the accounting and reporting framework for charities,
requiring them to report on this in their Trustees’
Annual Report.
People expect charities to demonstrate how they
benefit the public – research published this year
revealed that 94% of people asked think this is ‘crucial’5.
It is the Commission’s responsibility to help raise
awareness that charities should carry out their
aims for the public benefit and that they should
report on this to the public. One of the ways in
which we have been doing that is by carrying out
assessments into the public benefit provided by
groups of individual charities.
This year, our assessments focused on arts charities
and on sports and recreation charities. In July 2010,
we published reports into assessments of four very
different arts charities, all of which were able to
demonstrate that they are charities pursuing their
objects for the public benefit.
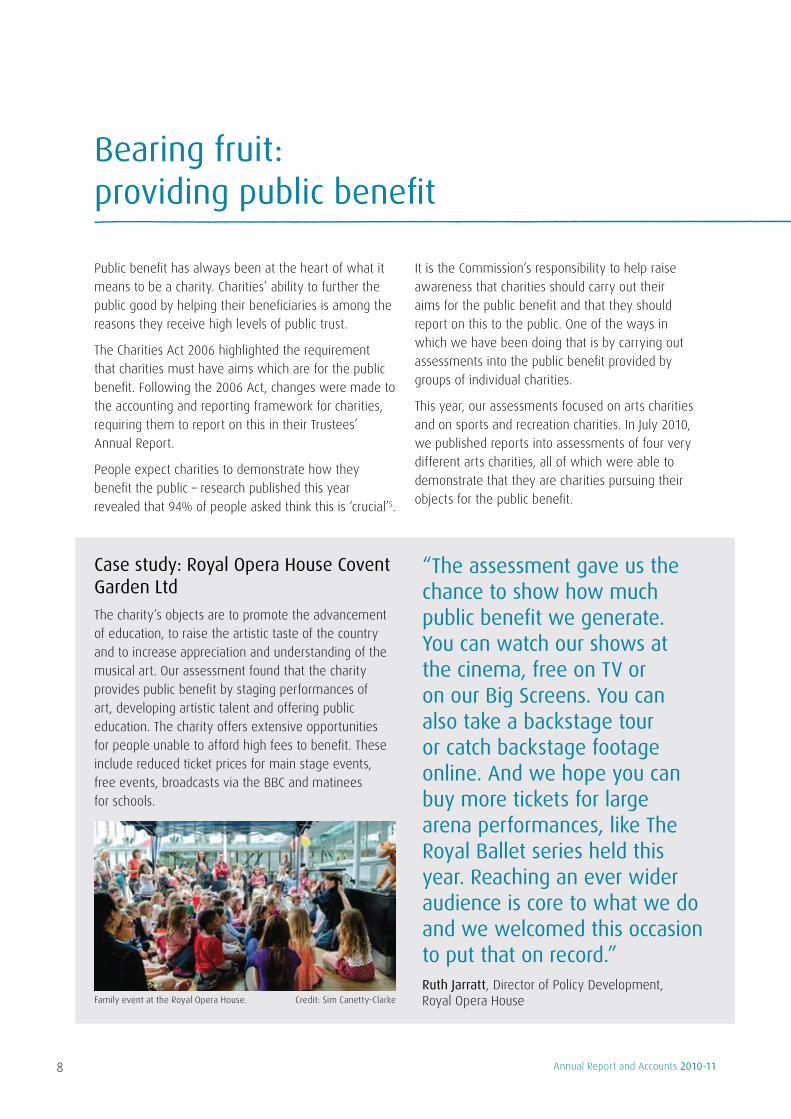
Case study: Royal Opera House Covent Garden LtdThe charity’s objects are to promote the advancement
of education, to raise the artistic taste of the country
and to increase appreciation and understanding of the
musical art. Our assessment found that the charity
provides public benefit by staging performances of
art, developing artistic talent and offering public
education. The charity offers extensive opportunities
for people unable to afford high fees to benefit. These
include reduced ticket prices for main stage events,
free events, broadcasts via the BBC and matinees
for schools.
Family event at the Royal Opera House. Credit: Sim Canetty-Clarke
“The assessment gave us the chance to show how much public benefit we generate. You can watch our shows at the cinema, free on TV or on our Big Screens. You can also take a backstage tour or catch backstage footage online. And we hope you can buy more tickets for large arena performances, like The Royal Ballet series held this year. Reaching an ever wider audience is core to what we do and we welcomed this occasion to put that on record.”Ruth Jarratt, Director of Policy Development, Royal Opera House
8 Annual Report and Accounts 2010-11

In February, we published reports of our assessments
into four recreation and leisure charities, all but one
of which were found to be charities pursuing their
objects for the public benefit. We are in touch with the
charity that was found not to be operating in the public
benefit and will be helping its trustees make
the necessary changes.
We also published emerging findings from our public
benefit assessments, to help trustees with their
reporting. We found that, overall, there is a wide
range of ways in which recreation and leisure charities
and charities for the advancement of the arts can
demonstrate their public benefit. We also found that
many fee-charging charities are innovative in their
approach to providing public benefit for those unable to
afford the fees without increasing the fees they charge
to other beneficiaries. Providing free or subsidised
access is only one of the ways in which they do this.
The report also stressed that membership charities
need to be able to demonstrate that their membership
is open to a broad range of people.
Overall, we concluded that the sector’s reputation and
strength can be enhanced by trustees continuing to
communicate the work their charities do to promote
the public benefit.
This year saw the first use of the power, conferred by
the Charities Act 2006, to bring references in the First-
tier (Charity) Tribunal. It allows the Attorney General
(AG) or the Commission with the AG’s consent, to ask
the Tribunal to determine and clarify charity law.
Two references were made by the AG. The first relates
to the Commission’s public benefit guidance on fee-
charging charitable independent schools. The second,
brought at our request, relates to charities established
for the relief of poverty in favour of a restricted private
class. The Commission is a party to these references,
taking a full part in the proceedings.
At the time of writing, we await the outcome of
the combined hearing in May of a judicial review
of our public benefit guidance and the reference by
the AG in the Upper Tribunal in relation to charitable
independent schools. As a public body we are subject
to legal challenge as to the way we carry out our
responsibilities. We accept this and welcome any
clarification of the law which may result. In preparing
our public benefit guidance, we have been diligent in
consulting charities and others affected, and in making
the legal framework and the process we followed clear.
A decision is expected in summer 2011.
“public benefit reporting -
a charity’s moment in the sun”
9
Looking ahead:We will publish the findings of independent • research into the way in which charities are
reporting on the public benefit they provide in
their Trustees’ Annual Report
We will review our public benefit guidance in • light of these findings, other experience and
guidance from the Tribunal
Consideration of public benefit will continue as • a routine part of our registration process
We will continue to assess the public benefit • provided by individual charities where concerns
are raised with us
We will provide a new interactive tool to • provide trustees with guidance on public
benefit tailored to their particular charity
5 Research into public trust and confidence in charities conducted by Ipsos MORI and published in July 2010.
Annual Report and Accounts 2010-11
Weeding out difficulties: tackling serious problems in charities
Helping charities back on trackMost trustees work tirelessly to ensure their charities
are effectively managed and protected against harm
or abuse. It is comparatively rare for charities to
experience problems serious enough to prompt an
investigation by the Commission.
But, like all organisations, charities are vulnerable to
abuse, and problems requiring our input can and do
occur. Usually, such situations arise because trustees
have failed to put proper systems of governance and
control in place.
We step in where we have serious cause for concern
that a charity’s beneficiaries, assets or reputation are
at risk. Public opinion research carried out during our
strategic review confirmed that people see this role
as one of the most important areas of our work6, as
do charities.
Our approach to this work focuses on helping trustees
get their charities back on a legal footing. To avoid
duplication and make our impact as effective as
possible, we take a multi-agency approach where
necessary. This year, we agreed six new Memoranda
of Understanding with other agencies7, which will see
us exchanging information about our respective work
where relevant.
Most issues in charities are dealt with by our
Assessment Unit, which closed over 1,900 cases this
year. In the most serious cases, we can open an
investigation. The ultimate aim of an investigation is
to find out whether there has been any wrongdoing
and, where necessary, to take action to protect charity
property and assist trustees to put their charity back on
a secure footing.
During 2010-11, we closed investigations into
167 charities, which represents less than 0.1% of
charities on the Register. Nine of these investigations
were Statutory Inquiries – the most serious type of
investigation that enables us to exercise our powers
under the Charities Act to deal with misconduct or
mismanagement or to protect charity property. In the
course of these investigations, we exercised these
powers on 208 occasions. We also made 21 compliance
visits to charities. The total income of the charities
involved in investigations closed this year comes to
over £900m.
Among the most frequent areas of concern leading
to investigations are issues around trusteeship. These
include situations in which dominant trustees exert
undue control over a charity, or in which boards appoint
people who are ineligible or unsuitable to serve as
trustees. Such issues featured in 44% of investigations
closed this year.
As in previous years, issues around the protection
of vulnerable beneficiaries also featured heavily
in our compliance work in 2010-11. Around a third
of investigations closed this year involved cases in
which trustees had failed to demonstrate that they
had systems in place to protect children or vulnerable
adults. Other problems to feature frequently this year
include fraud allegations, accounting issues, conflicts of
interest, failures to comply with a charity’s governing
documents and disputes.
“Ensuring compliance with legal obligations was seen […] as absolutely key for the Commission.”
Ipsos MORI report into public perceptions of the Charity Commission, December 2010
10
6 Focus group research published by Ipsos MORI in December 2010 as part of the Commission’s strategy review. 7 The other agencies with which we have agreed Memoranda of Understanding this year are: Department for Environment, Food and Rural Affairs, Department of Culture, Media and Sports, Electoral Commission, Higher Education Funding Council for England, Higher Education Funding Council for Wales, Land Registry.
Annual Report and Accounts 2010-11

“tackling problems
before they spread”
Investigation case study: Independence South West, a day care and respite centre for severely disabled adults
11
Protecting charities from harmWe also publish advice and guidance to help trustees
prevent serious problems from arising in their charities
in the first place.
We have completed our toolkit for trustees,
Protecting Charities from Harm, by publishing three
additional chapters. The toolkit is a practical guide
providing trustees with the tools they need to
manage risks and protect their charities’ property
from harm and abuse. Chapter 2, Due diligence,
monitoring and verification of the end use of funds,
explains what trustees need to do to make sure their
charity’s funds are used properly and go to the causes
for which they were intended. Chapter 3, on Fraud
and Financial Crime highlights the types of fraud and
financial crime that charities are vulnerable to, and
provides practical advice on how to tackle them. The
fourth and final chapter, Holding, Transferring and
Receiving Funds Safely, provides guidance on trustees’
legal duties and responsibilities in respect of holding,
transferring and receiving funds safely, especially in
an international context8.
We also published updated guidance on Statutory
Inquiries and Regulatory Compliance casework.
The revised guidance aims to help trustees better
understand what it means when we conduct
investigations into charities.
Our updated guidance on Reporting Serious
Incidents, meanwhile, introduced a more
proportionate approach, which allows trustees
greater discretion in deciding whether to report low
value fraud and theft.
Looking ahead:We will adjust our risk framework to focus our • actions on individual interventions where there
is serious risk and where our involvement can
have most impact
Our work will continue to focus on getting • charities back on track
We will retain a capacity for formal • investigations
We opened the investigation after being informed
that the chair of the charity was being investigated in
connection with alleged fraud against a public body.
(In the event, she accepted a police caution and no
charges were brought against her.)
The Commission’s investigation found that the chair
received unauthorised trustee payments as the
CEO of the charity, and that the charity’s vulnerable
beneficiaries had been put at risk of harm due to
poor management, lack of staff training and
inadequate safeguarding procedures. During the
Commission’s investigation, the chair resigned from
the board of trustees and as CEO. The charity has
since elected new trustees and a new chair of the
board. It has also received an improved rating by the
Care Quality Commission.
8 Published during the financial year 2011-12.
Annual Report and Accounts 2010-11

Maintaining fertile ground: promoting good practice
Charities work at the heart of society and rely on public
support to achieve their aims and make a difference.
We have a statutory objective to increase public trust
and confidence in charities and all our activities aim
at contributing to an environment in which charities
can flourish.
Increasing trust and confidence in charitiesWe regularly commission public opinion research to
gauge levels of trust and confidence in charities and to
examine what drives that trust.
This year’s research, conducted by Ipsos MORI
and published in July 2010, suggests people place
increasing emphasis on sound financial management in
charities. The single most important factor contributing
to people’s trust in charities is ‘ensuring a reasonable
proportion of income reaches the end cause’. This has
changed since the survey was last conducted in 2008,
when charities’ ability to make a difference to the
causes they work for was the most important factor.
We are therefore encouraging charities to explain their
spending decisions to donors and to ensure they are
open and accountable to the public – not least by filing
documents on time. The research also revealed that
charities remain among the most trusted groups in
society, achieving an average score of 6.6 out of 10.
That places them third only after doctors and the police.
ResearchWe publish research reports into a wide range of
issues, trends and developments affecting charities.
Their purpose is to strengthen charities’ accountability
by assessing how far they are aware of and are
following best practice. Our research also aims at
helping charities make effective use of their resources.
This year, we published research into young people’s
attitudes towards and experiences of trusteeship. The
report - A Breath of Fresh Air: young people as charity
trustees - found that many charities are missing out on
the skills and fresh perspective young people can bring
to a board.
“A functioning board of trustees needs members with a wealth of experience from different backgrounds; encouraging younger people onto boards is one way to ensure this happens. This is especially important for charities that have a youth focus, but it’s not exclusive. The Charity Commission’s checklist helps charities thinking about including young people on their board make the first step.”
Sean O’Halloran, 18 Chair, Young Advisors
12 Annual Report and Accounts 2010-11

“charities thrive on
public trust and confidence”
13
We used the findings to develop a checklist on finding
and supporting young trustees to help charities identify
the issues to consider when recruiting young people to
their board and to help them support young trustees
once they are appointed.
We also published research into patterns of
collaboration among smaller charities (‘Strength
in numbers – small charities’ experience of
working together’). The research found that most
charities with recent experience of collaboration
(82%) say it was successful. It found that barriers
to collaboration included charities not having
identified an appropriate partner or not having been
approached by another charity.
We are urging trustees to be proactive in seeking out
other organisations they might be able to work with,
rather than waiting for another charity to make the
first move.
Promoting excellenceUpholding independence
Independence is among the most important
characteristics of charities and it is part of our role
to help charities develop and maintain independent
decision-making processes. This year, we worked with
charities and the team behind the Public Bodies Bill to
help ensure the Bill upholds charities’ independence in
deciding whether or not to take on public functions.
Celebrating trusteeship
We joined a number of other organisations (Charity
Trustee Networks, the National Council for Voluntary
Organisations, Reach Volunteering, Getting on Board
and the ICAEW) to launch the first annual Trustees’
Week in October 2010.
The initiative celebrated the work of trustees and
aimed to increase awareness and understanding of
the role. It inspired over 30 events across the country,
generated 21,000 page views of the Trustees’ Week
website, and led to an Early Day Motion signed by 40
MPs. It was also shortlisted for a PR Award.
Supporting charity regulation worldwide
This year, the Commission’s International Programme,
which is funded entirely by external grants9,
established regional teams specialising in NGO
regulation throughout Pakistan. These teams will help
develop an effective NGO regulation system and train
new staff. The Programme also facilitated a review of
NGO regulation in Indonesia, and will be supporting
the Indonesian Government to improve its regulatory
environment through a Canadian-sponsored project.
The Programme has also been working with the UN to
raise awareness of the importance of NGO regulation,
developing a series of international workshops.
Helping prevent fraud against charities
Our work to promote public trust in charities includes
raising awareness of scams or fraudulent activity
associated with charities or charitable giving.
Like all organisations, charities are at risk. The
National Fraud Authority’s Annual Fraud Indicator 2011
estimated that charities lose on average 2.4% of their
annual income to fraud.
This year we issued safer giving alerts around major
faith festivals to remind givers to ensure they donate
to registered charities. We also issued warnings about
bogus clothing collections and helped raise awareness
of an attempted fraud following the Japan earthquake.
Our alerts aim at encouraging safer giving, rather than
discouraging people from giving.
9 For more information about the International Programme, please go to our website.
Annual Report and Accounts 2010-11
14
Completing the charity life cycle: coming off the Register
Over the course of a few years, a similar number
of charities come off the Register as join it. This
year, slightly more charities came off the Register -
around 8,600.
This resulted from our ongoing work to remove
charities that are no longer active. We have also
been speaking to trustees whose charities have
fallen below the £5,000 registration threshold about
coming off the Register. This year, around 300
charities asked to be taken off the Register for that
reason. Sometimes, charities wind up because
they’ve achieved what they were set up for or
because there is no longer a need for their services.
However, some charities fold because they can
no longer secure funding or support. Trustees of
charities that are closing should notify us via our
online Manage Your Charity service. Our guidance
explains how trustees should apply outstanding
assets such as land.
Often, charities decide to join forces with one or
more other charities. It is not our role to push
charities to merge and we recognise the value of a
diverse charity landscape. But we support charities
that have decided to merge by providing
constitutional and legal help; some mergers require
our consent. We also provide online guidance on
collaboration and mergers. We can’t say exactly how
many charities merge, as we don’t have to be involved
in all cases. But we know that many charities take
this route, and, since 2009, our mergers team has
seen a 150% increase in the more complex cases it
deals with.
“making for a
constantly evolving
charity landscape”
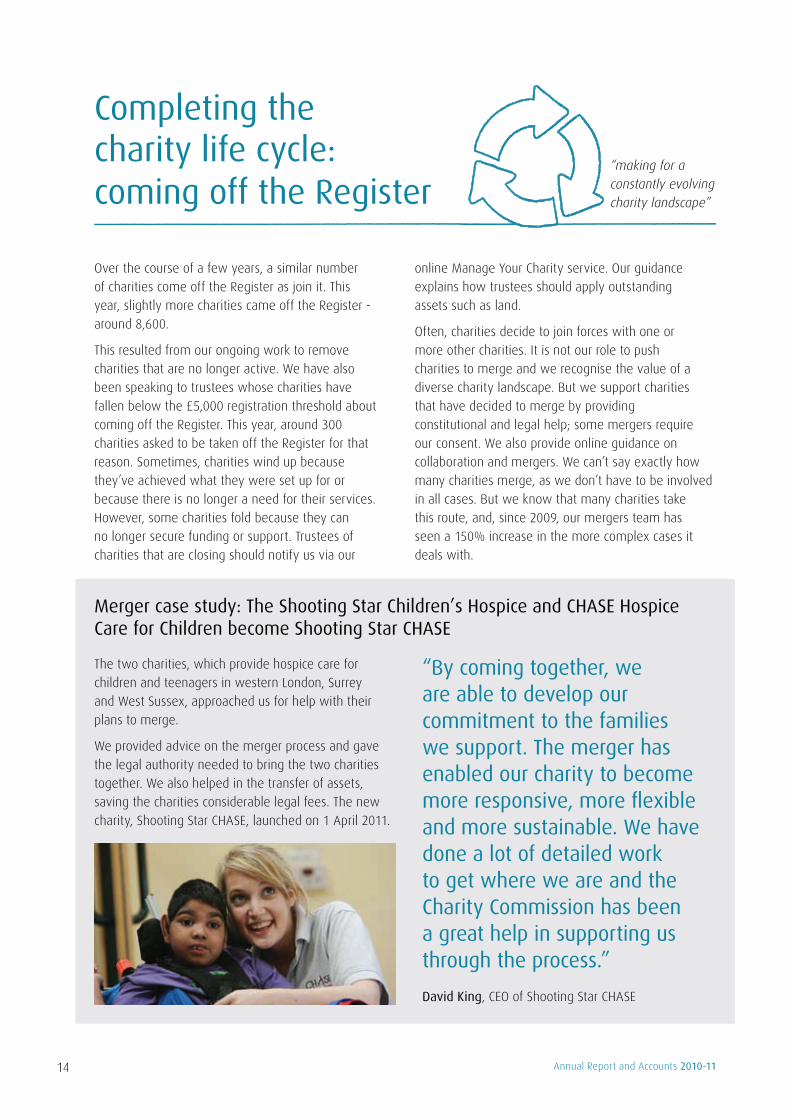
Merger case study: The Shooting Star Children’s Hospice and CHASE Hospice Care for Children become Shooting Star CHASE
The two charities, which provide hospice care for
children and teenagers in western London, Surrey
and West Sussex, approached us for help with their
plans to merge.
We provided advice on the merger process and gave
the legal authority needed to bring the two charities
together. We also helped in the transfer of assets,
saving the charities considerable legal fees. The new
charity, Shooting Star CHASE, launched on 1 April 2011.
“By coming together, we are able to develop our commitment to the families
we support. The merger has enabled our charity to become more responsive, more flexible and more sustainable. We have done a lot of detailed work to get where we are and the Charity Commission has been a great help in supporting us through the process.”
David King, CEO of Shooting Star CHASE
Annual Report and Accounts 2010-11

15
Our finances: an overview
We are funded by the Government, and in the financial year 2010-11 spent a total of £29.4m on our operating
activities and £0.6m on capital investment.
Summary of our financial performanceThis year has been challenging. Our core funding reduced by 3% compared to 2009-10 and access to our reserves
was withdrawn – in 2009-10, we used £1.3m of our reserves to support expenditure. To balance our books, we
have made savings of 25% on our non-pay expenditure compared to 2009-10 and reduced our pay costs by £0.5m
by implementing a recruitment freeze.
The chart below shows how we spent these funds.
Breakdown of our expenditure
Find out moreFurther details of our funding and expenditure are included in the Resource Accounts section of this Report.
64%
7%
2%4%
12%
11%
Staff and related costs (£19.3m)Property and accommodation (£3.3m)
Office services (£2.0m)
Other (£1.1m)
Information Technology (£3.7m)
Capital investment (£0.6m)
Annual Report and Accounts 2010-11

Part two: Our performance in 2010-11
16
BackgroundThe Charity Commission is established by law as the
regulator and registrar of charities in England and Wales
and operates under Schedule 1A of the Charities Act
1993. The Commission is a non-Ministerial Government
Department. The chief executive is the Commission’s
Accounting Officer.
Governance responsibilities for strategy and the future
direction of the Commission, including the allocation
of resources at a strategic level, rest with the Board.
Decisions of the Commission are independent from
Ministerial direction or influence, although they are
open to challenge in the High Court and the Charity
Tribunal. Information about the Board and Executive
Directors is available in the Resource Accounts.
As at 31 March 2011, there were just under 180,000
registered charities listed on the Commission’s
Register of Charities. Of these, 161,700 were either
main or group charities and the remainder were
either subsidiaries or branches of main charities. In
2010-11, the gross annual income of all registered
main and group charities was over £55 billion. There
are 1,772 charities with incomes over £5 million on
the register, accounting for just under 68% of the
sector’s total income.
Charity Commission’s aimOur aim is to provide the best possible regulation of
charities in England and Wales in order to increase
charities’ efficiency and effectiveness and promote
public confidence and trust in the sector.
Strategic prioritiesWe undertook a fundamental Strategic Review in 2005.
This resulted in an amended vision, mission and values.
These are summarised in the publication Charity
working at the heart of society – the way forward
2005–2008. To reflect this change in strategy, a
revised set of Strategic Objectives was agreed with
HM Treasury. A revised Strategic Plan, issued in August
2008, builds on the work carried out during the
Strategic Review, adjusts our plans for the outcome
of the funding settlement achieved in the 2007
Comprehensive Spending Review and reflects our
Strategic Priorities for 2008-11. A copy of our Strategic
Plan for 2008–11 is available on our website.
For 2008-11, we were committed to achieving the
following key strategic priorities:
continuing our commitment to modern, risk • based regulation
delivering organisational change and valuing • our people
independent, objective decision making • and leadership
driving the accountability of charities to • the public
delivering faster, more efficient services to our • customers, and
completing implementation of the Charities • Act 2006.
Delivering against these priorities has enabled the
Commission to achieve the five statutory objectives set
out in the Charities Act 2006.
At the time of writing, we are in the process of
developing a strategic plan to cover the period
2011-2015. The plan will be made publicly available
in due course.
Annual Report and Accounts 2010-11

17
Statutory objectivesThe Commission’s statutory objectives are:
Objective 1 - Public confidence: to increase public trust and confidence in charities
Objective 2 - Public benefit: to promote awareness and understanding of the operation of the public
benefit requirement
Objective 3 - Compliance: to promote compliance by charity trustees with their legal obligations in
exercising control and management of the administration of their charities
Objective 4 - Charitable resources: to promote the effective use of charitable resources
Objective 5 - Accountability: to enhance the accountability of charities to donors, beneficiaries and the
general public
The Corporate Plan for 2008-11 reflects these statutory objectives. Our Key Performance Indicators are aligned with
the statutory objectives as shown below:
KPI 1 - Improve the level of public trust and confidence in charities. Objective 1 – Public confidence
KPI 2 – Achieve standards of service delivery and effectiveness acceptable
to our customers, whilst increasing use of our on-line services annually.Objective 4 – Charitable resources
KPI 3 – Enhance the accountability and transparency of charities by
making key information about individual charities more readily available
to the public.
Objective 5 - Accountability
KPI 4 – Improve the efficiency of formal investigations into charities
begun after 1 April 2006 by completing them quickly and with clear
reported outcomes.
Objective 3 – Compliance
KPI 5 – Demonstrate our impact on the charitable sector by increasing
the sector’s income we directly regulate through our substantive contact
with charities.
Objective 4 – Charitable resources
KPI 6 – Promote awareness and understanding of the operation of the
public benefit requirement.Objective 2 – Public benefit
Annual Report and Accounts 2010-11

18
Our performance in 2010-11
Review of operational performanceAchievement of the Commission’s strategic objectives is measured by reporting on performance against six Key
Performance Indicators (KPIs) which have been agreed with HM Treasury.
Each of the six top-level KPIs is measured via a number of different targets covering the range of our work.
Not all of these KPIs have annual targets and some will provide cumulative results over a period of years. We
publicly report in-year progress against our KPIs on a bi-monthly basis to each open meeting of the Board. Our
performance against KPIs for the financial year is set out in our Annual Report to Parliament.
Achievement of our key performance indicatorsWe have six top-level KPIs, each of which is measured via a number of different targets covering the range of our
work. Not all of these KPIs have annual targets and some will provide cumulative results over a period of years.
The results below show that we met all six KPIs in 2010/11.
KPI 1 - Improve the level of public trust and confidence in charities
Target Achievement
Overall level of public trust and confidence in
charities (survey carried out independently for us
every two years)
To continuously improve
ratings over 2005 baseline
(63% in 2005)
66%
Stakeholder survey of the Commission’s effectiveness
as the charity sector’s regulator (survey carried out
independently for us every two years)
To continuously improve
ratings over 2004 baseline
(63.1% in 2006, 49.3%
in 2004)
68.3% (in 2008)
20 key operational targets met 75% 80%
Trust and confidence in charities compared with other
organisations and professions (every two years)
Charities ranked in top half
of sample of organisations
and professions
Charities ranked 3rd
of 11
Annual Report and Accounts 2010-11
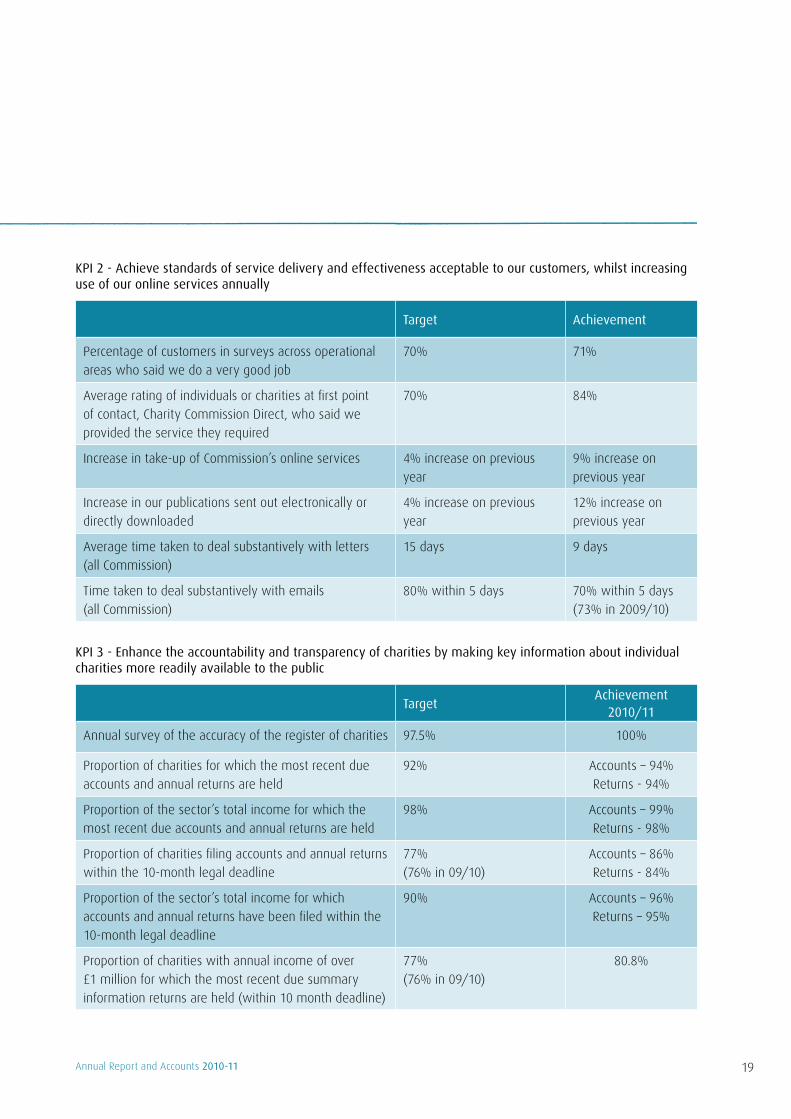
KPI 2 - Achieve standards of service delivery and effectiveness acceptable to our customers, whilst increasing use of our online services annually
Target Achievement
Percentage of customers in surveys across operational
areas who said we do a very good job
70% 71%
Average rating of individuals or charities at first point
of contact, Charity Commission Direct, who said we
provided the service they required
70% 84%
Increase in take-up of Commission’s online services 4% increase on previous
year
9% increase on
previous year
Increase in our publications sent out electronically or
directly downloaded
4% increase on previous
year
12% increase on
previous year
Average time taken to deal substantively with letters
(all Commission)
15 days 9 days
Time taken to deal substantively with emails
(all Commission)
80% within 5 days 70% within 5 days
(73% in 2009/10)
KPI 3 - Enhance the accountability and transparency of charities by making key information about individual charities more readily available to the public
TargetAchievement
2010/11
Annual survey of the accuracy of the register of charities 97.5% 100%
Proportion of charities for which the most recent due
accounts and annual returns are held
92% Accounts – 94%
Returns - 94%
Proportion of the sector’s total income for which the
most recent due accounts and annual returns are held
98% Accounts – 99%
Returns - 98%
Proportion of charities filing accounts and annual returns
within the 10-month legal deadline
77%
(76% in 09/10)
Accounts – 86%
Returns - 84%
Proportion of the sector’s total income for which
accounts and annual returns have been filed within the
10-month legal deadline
90% Accounts – 96%
Returns – 95%
Proportion of charities with annual income of over
£1 million for which the most recent due summary
information returns are held (within 10 month deadline)
77%
(76% in 09/10)
80.8%
19Annual Report and Accounts 2010-11

20
Our performance in 2010-11
KPI 4 – Improve the efficiency and effectiveness of investigations and related regulatory work into charities by improving detection, investigation and prevention and with clear reported outcomes
Our KPI 4 relates to our investigations and related regulatory work. It is divided into three areas:
• Detection
• Investigation, Sanction and Redress
• Prevention and Deterrence
We have two targets in each area and achieved both targets in the investigation area, and achieved one and
narrowly missed one in the other two areas. Under the convention we use for individual targets: Success (Green)
= 100%; Near Miss (usually within 10% of target) (Amber) = 50%, and Failure (Red) = 0%, we have achieved an
83% success rate for the combined ratings (equates to a score of 500 out of 600). Performance of 75% equates to
the minimum standard we set for a Green rating for a KPI.
Detection
Target Achievement
4a Complete 90% of compliance assessments correctly
in 30 working days
90% 86%
4b Carry out a minimum of 20 compliance visits
annually to charities which are subject to monitoring
and identified following a risk assessment
20 21
Investigation, Sanction and Redress
Target Achievement
4c Complete all regulatory compliance cases (excluding
statutory inquiries) within an average of six months
183 days 172 days
4d Ensure 90% of all investigations result in at least one
of the specified beneficial impacts (see opposite*)
which protect charities from mismanagement,
misconduct or abuse
90% 94%
Annual Report and Accounts 2010-11

Prevention and Deterrence
Target Achievement
4e Publish 90% of reports on the results of
investigations within three months of the end of the
substantive investigation process
90% 81%
4f Publish an annual report on the ‘Themes and Lessons
from the Charity Commission’s Compliance Work’
which includes the duration of each statutory inquiry,
the impact of investigations, the use of sanctions
(including legal powers of remedy and protection),
and the operation of our compliance work
Publish report before
end of third quarter of
financial year
Published
22 September 2010
* Beneficial impacts:
charity assets protected and/or recovered•
vulnerable beneficiaries protected •
reputation protected (charity/ charity sector)•
disputes resolved•
charity governance restored to proper standard•
conflicts of interest resolved•
fundraising concerns resolved•
charity no longer operating or applying funds outside its trusts•
useful and effective advice and guidance given•
charity is now complying with legal requirements•
greater transparency achieved in the charity’s operations and published reports and accounts•
moribund charity now functioning•
charity’s relationships with third parties is now properly managed in the best interests of the charity•
direct charitable expenditure has increased or targets are in place to increase this expenditure•
21Annual Report and Accounts 2010-11

22
Our performance in 2010-11
KPI 5 - Demonstrate our impact on the charitable sector by increasing the sector’s income we directly regulate through our substantive contact with charities
Achievement
Income of charities having substantive engagement
with us during the year
£27.1 billion (up from £26.6 bn in 2009/10)
KPI 6 – Promote awareness and understanding of the operation of the public benefit requirement
Targets for this KPI are made up of milestones and product delivery as the programme progresses, and are
the subject of regular reports to the Board. This is a medium term programme and there is no requirement for
completion in-year, but substantial progress is expected. Of our five targets for 2010/11, all have been met. This
gives an overall rating of Green.
Activity Achievement
1. Publish a research report examining the reporting of
public benefit in trustees’ annual reports
Research completed
2. Completion of assessments focusing on arts charities Published July 2010
3. Publish a last phase of assessments focusing on
recreational and leisure charities
Published February 2011
4. Follow up work with charities which did not meet
the requirement in the first phase of assessments
Completed
5. Develop an on-line interactive tool to help
trustees identify guidance relevant to the aims of
their charity
In progress
Annual Report and Accounts 2010-11
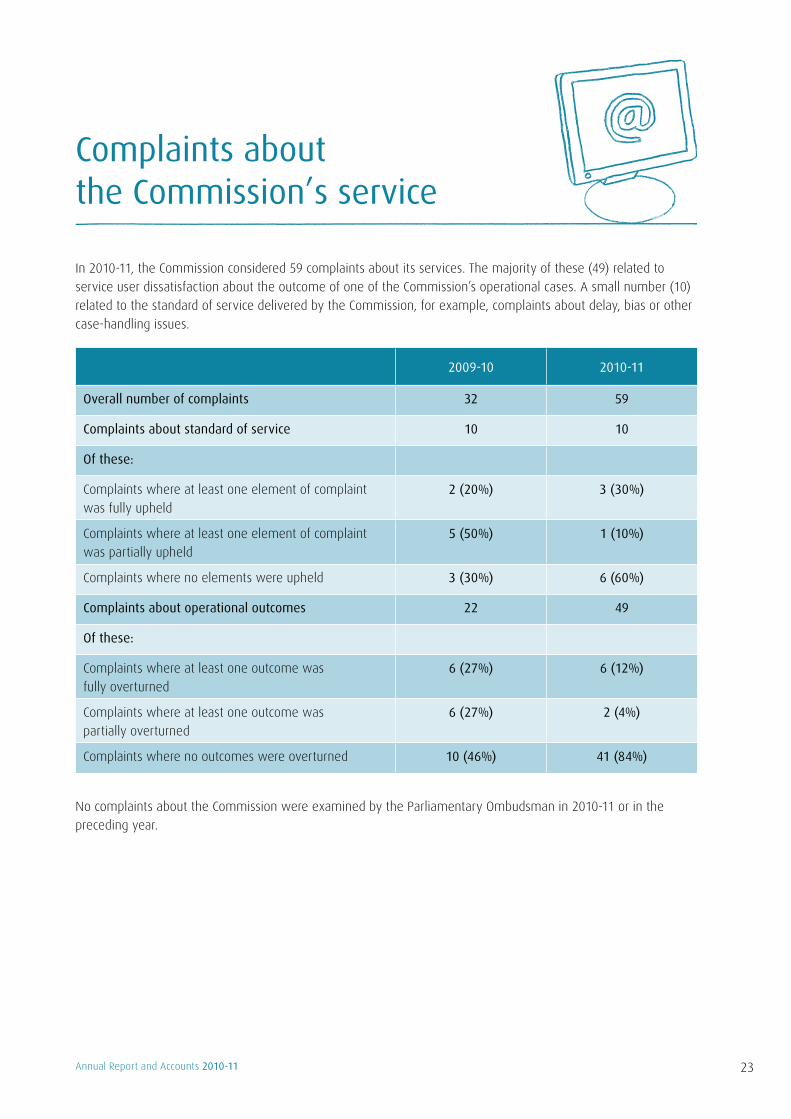
In 2010-11, the Commission considered 59 complaints about its services. The majority of these (49) related to
service user dissatisfaction about the outcome of one of the Commission’s operational cases. A small number (10)
related to the standard of service delivered by the Commission, for example, complaints about delay, bias or other
case-handling issues.
2009-10 2010-11
Overall number of complaints 32 59
Complaints about standard of service 10 10
Of these:
Complaints where at least one element of complaint
was fully upheld
2 (20%) 3 (30%)
Complaints where at least one element of complaint
was partially upheld
5 (50%) 1 (10%)
Complaints where no elements were upheld 3 (30%) 6 (60%)
Complaints about operational outcomes 22 49
Of these:
Complaints where at least one outcome was
fully overturned
6 (27%) 6 (12%)
Complaints where at least one outcome was
partially overturned
6 (27%) 2 (4%)
Complaints where no outcomes were overturned 10 (46%) 41 (84%)
No complaints about the Commission were examined by the Parliamentary Ombudsman in 2010-11 or in the
preceding year.
Complaints about the Commission’s service
23Annual Report and Accounts 2010-11
24
Staffing and recruitmentWe implemented a recruitment freeze from 1 April 2010 and no external recruitment has been initiated since
that date. There were four appointments at the beginning of the year relating to recruitment campaigns run in
2009-10. All new appointments were on fixed-term contracts, including that of the chief executive. The number of
permanent employees reduced as planned by 30 from 444 at 1 April 2010 to 414 at 31 March 2011.
Equality and diversityThe Commission is committed to equality and diversity. In 2010-11, we incorporated our equality and diversity
policy into a Single Equality Scheme and we continued to embed equality and diversity into all of our work. Our
diversity vision is to “act inclusively, upholding equality law, treating everyone fairly and seeking to provide and
promote a culture which delivers the best outcomes for the diverse society in which and for whom we work”.
We are creating an ethos throughout the Commission in which we respond to the needs of our colleagues and
customers, where diversity is truly valued and where everyone is treated with dignity and respect.
The Commission has appointed a Board Member, John Wood, to act as Diversity Champion. He attends the
quarterly meetings of the Diversity Steering Group, which is chaired by the chief executive and includes wide
representation from across the business. Our employment policies incorporate relevant employment law and best
practice to ensure the organisation does not discriminate against anyone who works for it or comes into contact
with the Commission. We monitor our workforce against diversity targets covering ethnicity, gender, disability,
sexual orientation, religion and belief. Training on diversity has been provided to all staff.
The Commission adheres to the Civil Service Code of Practice on the Employment of Disabled People. The Code
ensures that the Commission does not discriminate on grounds of disability. Access to employment, training and
career development and advancement is based solely on competence required for the job and individual ability.
This is reflected in the proportion of Commission staff with a declared disability, which, at 13.4%, is nearly twice
the Civil Service average. We also participate in the “two ticks” guaranteed interview scheme for job applicants
with a disability, and have a Disability Forum for the benefit and support of staff.
Employee relations and involvementThe Commission is committed to open communication and maintaining effective employee relations, both directly
between line managers and their staff, and indirectly between management and the trade unions (Public and
Commercial Services Union, First Division Association and Prospect). Staff engagement is vital to the Commission’s
success and senior management promotes a spirit of co-operation and partnership between all concerned, in
the interests of productivity, efficiency and the well-being of all Commission staff. This means recognising the
responsibilities of managers to manage, the need for good communications with staff and their representatives,
and timely consultation and where appropriate, negotiation, on issues affecting staff and their conditions of
service. It also means running regular staff surveys and taking action on the results. In 2010, we took part in the
Civil Service People Survey, and we are using the results to help us prioritise action to maintain staff engagement.
Our staff
Annual Report and Accounts 2010-11

Communications this year have focused primarily on the impact of reduced funding for the next Spending
Review period 2011-15. The Commission is undertaking a strategic review to determine how best to carry out
its functions within reduced levels of funding and has actively involved staff through a comprehensive internal
consultation process.
Staff developmentThis year we continued to prioritise development of the quality of leadership and management needed at all
levels of the Commission. We have also worked on raising expertise in the organisation through measurable
learning and development and improving productivity and effectiveness.
A range of formal development activities have been delivered to improve technical, management and individual
skills. All training events have been evaluated to demonstrate return on investment with an aggregate score for all
courses giving an average satisfaction rating of 96%.
In preparation for the need to reduce employee numbers in the next Spending Review period, we also developed
and delivered a comprehensive programme of career transition support workshops.
Sickness absenceThe Commission is committed to managing and reducing absence levels and uses a wide range of initiatives.
These include access to occupational health professionals, flexible working opportunities and health promotion
events. In 2010-11, an average of 8.3 working days was lost due to sickness absence (7.5 days in 2009-10).
Social and community issuesThe Commission actively encourages staff to get involved in social and community issues, in particular
volunteering with the not for profit sector, and offers some paid time off to do so.
25Annual Report and Accounts 2010-11

26
Sustainability report
The Charity Commission is committed to sustainable development and reducing the impact of its activities on
the environment. This will be achieved through implementation of our Sustainability Action Plan, a copy of which
can be found on our website. In addition, all Government Departments and Executive Agencies have mandated
targets for reducing greenhouse gas emissions, waste and water consumption. These are known as SOGE targets
(Sustainable Operations on the Government Estate). Our performance against each of the three SOGE targets is set
out below.
Some of the performance measures require historical data that was not collected at the time. Wherever possible,
we have reviewed our records to compile this data. Where our records are incomplete, we have made reasonable
estimates based on the information available. Where data is not available for the baseline year against which
reductions are assessed, it has been extracted from the nearest year from which data can be estimated reliably.
Greenhouse gas emissionsThere are three different classifications of greenhouse gas emissions, known as Scopes:
Scope 1: Direct emissions occurring from sources owned or controlled by the organisation, for example,
emissions from combustible boilers and from organisation-owned fleet vehicles.
Scope 2: Indirect emissions resulting from electricity consumed which is supplied by another party.
Scope 3: Other indirect emissions. All other emissions which occur as a consequence of our activity but
which are not owned or controlled by the Commission. For example, emissions as a result of staff
travel on public transport and emissions resulting from work done on the Commission’s behalf by
its suppliers.
SOGE target Commission performance Target achieved
Reduce carbon emissions by 12.5% by 2010-11
compared to 2006-07 levels
Scopes 1 and 2 – 32% reduction
achieved (Note 1)
Scope 3 – 55% reduction achieved
since 2003-04 (Note 2)
Yes
Yes
Reduce carbon emissions by 30% by 2020-21
compared to 2006-07 levels
Current performance shows that
we are expected to achieve this
target but we will need to sustain
2010-11 performance levels for
the next ten years
Not yet applicable
Note 1: For Scopes 1 and 2, data is only available for our Liverpool and Taunton offices. Data is unavailable for our London and Newport offices as these services are provided by the landlord and recharged to the Commission as part of the service charge.
Note 2: Scope 3 covers all types of travel undertaken by Commission staff and the use of couriers.
Annual Report and Accounts 2010-11
27
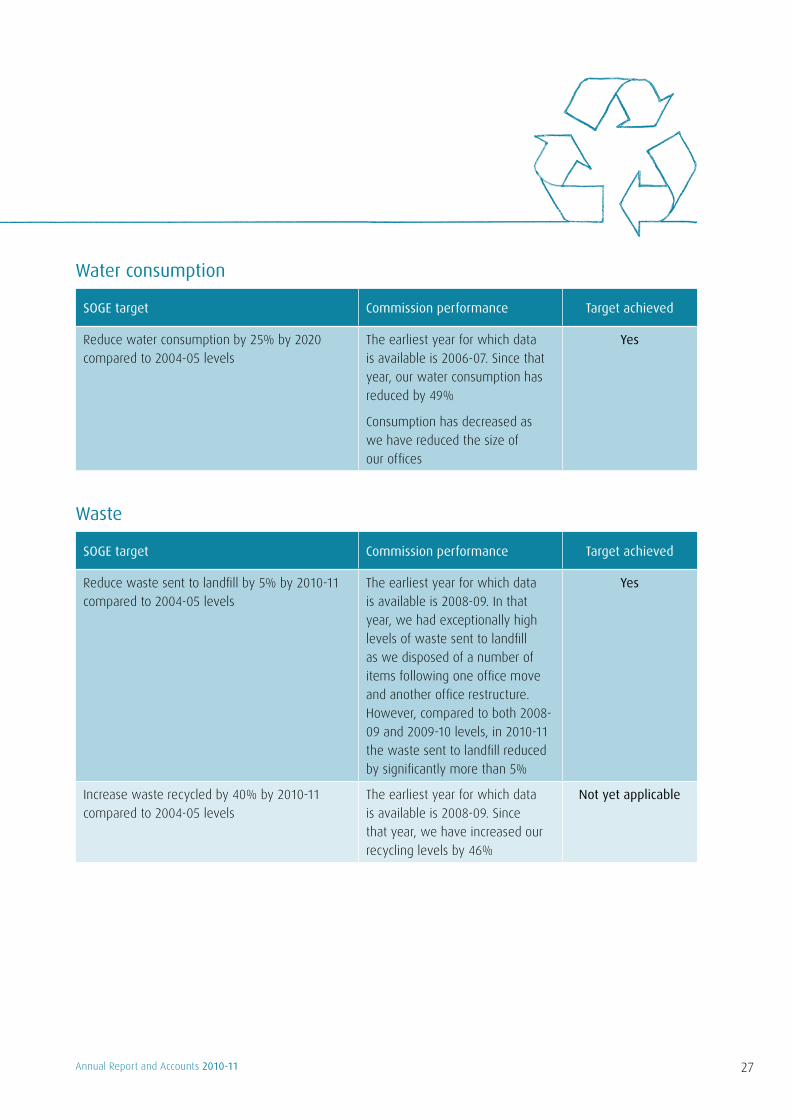
Water consumption
SOGE target Commission performance Target achieved
Reduce water consumption by 25% by 2020
compared to 2004-05 levels
The earliest year for which data
is available is 2006-07. Since that
year, our water consumption has
reduced by 49%
Consumption has decreased as
we have reduced the size of
our offices
Yes
Waste
SOGE target Commission performance Target achieved
Reduce waste sent to landfill by 5% by 2010-11
compared to 2004-05 levels
The earliest year for which data
is available is 2008-09. In that
year, we had exceptionally high
levels of waste sent to landfill
as we disposed of a number of
items following one office move
and another office restructure.
However, compared to both 2008-
09 and 2009-10 levels, in 2010-11
the waste sent to landfill reduced
by significantly more than 5%
Yes
Increase waste recycled by 40% by 2010-11
compared to 2004-05 levels
The earliest year for which data
is available is 2008-09. Since
that year, we have increased our
recycling levels by 46%
Not yet applicable
Annual Report and Accounts 2010-11
28
Sustainability Report
Other actions taken to promote sustainabilityThe Commission implements sustainable procurement, following Office of Government Commerce (OGC) best
practices, which means only purchasing goods and services that are really needed and buying items whose
production, use and disposal minimise negative impacts on the environment and society.
We have taken advantage of lease expiry/breaks to reduce our occupied space in the London and Liverpool offices
and introduced flexible working arrangements supported by hot desking. We have created an area of vacant
space in the Taunton office which we are currently looking to sublet and have introduced light sensors in both our
Taunton and Liverpool offices to reduce unnecessary power consumption.
New video conferencing equipment has been installed across all sites and all staff are encouraged to use this
whenever possible. Where travel is essential, the use of public transport is encouraged.
We have implemented several requirements of the Greening Government ICT Report including actions such as:
reducing the length of time screen savers are used;•
shutting down PCs after office hours;•
introducing organically grown toners in our new printers;•
extending equipment replacement cycles and using virtualisation to reduce the amount of equipment we • use; and
using a carbon neutral company to host/support our website.•
Annual Report and Accounts 2010-11

Part Three: Resource Accounts
Contents
Management commentary 30
Remuneration Report 40
Statement of Accounting Officer’s Responsibilities 46
Statement on Internal Control 47
The Certificate and Report of the Comptroller and Auditor General to the House of Commons 53
Accounting Schedules:
Statement of Parliamentary Supply 55
Statement of Comprehensive Net Expenditure 57
Statement of Financial Position 58
Statement of Cash Flows 59
Statement of Changes in Taxpayers’ Equity 60
Notes to the Accounts 61
Glossary 82
29Annual Report and Accounts 2010-11

Management commentaryThis Management commentary is prepared and published as part of the Charity Commission’s (the Commission’s)
Resource Accounts for 2010-11, as required by the Financial Reporting Manual (FReM) produced by HM Treasury.
Governance arrangementsOur governance structures and processes are described in the paragraphs below.
Role and composition of the BoardThe Commission is a non-Ministerial Government Department. The Chief Executive is the Commission’s
Accounting Officer.
Responsibility for strategy and the direction of the Commission, including the allocation of resources at a
strategic level, rests with the Board. The Board comprises the Chair and up to eight other Board members. The
Board Members are appointed to bring a range of knowledge and experience to the Commission. This includes
knowledge of charity law, accounting and financing of charities and the operation and regulation of charities of
different sizes and descriptions. Two appointed members are required to be legally qualified and one member is
appointed for their knowledge of conditions in Wales.
Decisions of the Commission are independent from Ministerial direction or influence, although they are open to
challenge in the High Court and the Charity Tribunal.
Members of BoardDuring 2010-11, the Board comprised:
Chair Dame Suzi Leather DBE DL
Member (Wales) Simon Jones
Member Sharmila Nebhrajani
Member Dr Andrew Purkis OBE (until 15 October 2010)
Member Theo Sowa CBE
Member (Legal) Simon Wethered
Member (Legal) John Wood
Member John Knight CBE
Member Irene Khan (until 6 March 2011)
Members of the Board are appointed by open competition for three year fixed-term appointments, with the option
of extension or reappointment. During the year, this option was exercised for the following Board Members:
Resource Accounts
30 Annual Report and Accounts 2010-11

Member Date of reappointment Length of new appointment
Simon Jones 15 July 2010 Three years
Sharmila Nebhrajani 15 July 2010 Two years
Dr Andrew Purkis OBE 15 July 2010 Three months
Theo Sowa CBE 15 July 2010 Three years
Simon Wethered 15 July 2010 Two years
John Wood 1 February 2011 Three years
Committees of the BoardThe Board is supported by an Audit Committee and a Senior Civil Service Pay Committee (for details of the latter,
please refer to the Remuneration Report).
Audit CommitteeThe Audit Committee is an appointed Committee of the Board. It supports the Board, and the Chief Executive as
Accounting Officer, in ensuring the adequacy of risk management, internal controls, efficient and effective use of
public funds and financial governance arrangements within the Commission.
During 2010-11, the Audit Committee comprised:
Committee Chair Sharmila Nebhrajani (Board Member)
Committee Member Simon Jones (Board Member)
Committee Member Christopher Daws (Independent Non Executive Member)
Christopher Daws was appointed in August 2009 following an open competition, replacing David Taylor.
The functions of the Audit Committee follow the recommendations of HM Treasury’s Audit Committee Handbook.
Its role includes responsibility for reviewing:
strategic processes and arrangements for risk management, governance, internal control and the prevention • and detection of fraud;
the annual Resource Accounts of the Commission and of the Official Custodian for Charities;•
planned activity and results of both internal and external audit;•
adequacy of management responses to issues identified by audit activity;•
31Annual Report and Accounts 2010-11

assurances relating to the corporate governance requirements of the Commission including the Internal • Audit Annual Report and the opinion on the adequacy of the Commission’s internal control systems;
matters relating to the appointment of internal auditors;•
review of financial data insofar as it provides assurance over the Commission’s internal control • framework; and
the terms of reference for internal audit and the arrangements for co-operation between internal • and external audit.
The Committee met on three occasions in 2010-11 in pursuance of these duties.
Executive DirectorsCorporate decision making that affects the day-to-day operation of the Commission is delegated to the Chief
Executive and the Directors’ Group, which comprises the Chief Executive and the Executive Directors.
Throughout 2010-11 and as at 31 March 2011 (unless otherwise stated), the Directors’ Group comprised:
Chief Executive Andrew Hind (until 4 October 2010)
Chief Executive Sam Younger CBE (from 1 September 2010)
Executive Director, Charity Information & Corporate Services Nick Allaway
Executive Director, Policy & Effectiveness Rosie Chapman
Executive Director, Legal & Compliance Kenneth Dibble
Executive Director, Charity Services David Locke
Andrew Hind was appointed via open competition for a period of four years commencing on 4th October 2004.
This contract was extended by two years to 4th October 2010. An open competition to appoint a successor to
Andrew Hind resulted in the appointment for three years of Sam Younger from 1 September 2010.
Two Directors, Rosie Chapman and Nick Allaway, were appointed via open competition. The other two directors,
Kenneth Dibble and David Locke, were appointed through an internal competition. All four Directors were appointed
under permanent staff terms and their contracts can be terminated (subject to an agreed period of notice, relevant
to the circumstances, given in writing) by the individual Director, by the Commission or by mutual consent.
The remuneration of the Chief Executive and other members of senior management is informed by the Senior
Salaries Review Body. Details on the costs, remuneration and pension arrangements for the Commission’s Board
and senior managers can be found in the Remuneration Report.
Register of InterestsIn common with other public bodies, the Commission has arrangements under which potential conflicts of interest
can be recognised and managed. Board and Audit Committee Members are able to continue to serve as trustees
or officers in charities. It is also normal for those whose livelihoods require professional involvement with charities
to continue with these functions, provided that it is transparent and is not inconsistent with the Commission’s
regulatory role.
Resource Accounts
32 Annual Report and Accounts 2010-11
As a matter of practice, the Chair and the Chief Executive are required not to hold trusteeships during their term
of office. Where the circumstances of a Board or Audit Committee Member or Director involve, or might appear
to involve, clear potential for a material conflict of interest in his or her official role, he or she will declare this
position, and withdraw from related Commission business and discussions.
The Register of Interests, listing the involvement of Board and Audit Committee Members and Directors with
charities both current and past, is open to the public and is published on our website.
Code of Good Practice in Corporate GovernanceThe Commission’s current Governance Framework was adopted by the Board in February 2007 and can be found
on our website. The Framework complies with key aspects of the guidance produced by HM Treasury in Corporate
governance in central government departments: Code of good practice. In particular, the Framework sets out the:
roles of the Chair and Chief Executive;•
relationship and interface between the Board and Executive Team, including delegation of responsibilities;•
registration and declaration of interests; and•
principles and behaviours, including the requirement to adhere to the principles set by the Nolan Committee • on Standards in Public Life.
Payment of suppliersThe Commission is committed to the CBI’s Better Payment Practice Code and aims to pay all undisputed invoices
within 10 days of the later of receipt of goods and services and receipt of the invoice. During the year, the
percentage of invoices paid within 10 days was 80% (83% in 2009-10).
AuditorsThis year’s Resource Accounts have been audited by the National Audit Office (NAO) on behalf of the Comptroller
and Auditor General. No further audit services were received aside. The cost of audit work was £57,600, (£58,800
for 2009-10, with an additional fee of £6,000 for audit work on the transition to International Financial Reporting
Standards). In addition, a notional fee of £1,800 was charged in 2010-11 for the audit of the Official Custodian
of Charities’ 2010-11 Financial Statements (£nil in 2009-10), the cost of which is met by the Commission. No
payments were made to the NAO in 2010-11 for non-audit work undertaken (£nil in 2009-10).
So far as the Accounting Officer is aware, there is no relevant audit information of which the NAO are unaware.
The Accounting Officer has taken all the steps that he ought to have taken to make himself aware of any relevant
audit information and to establish that the NAO are aware of that information. “Relevant audit information” means
information needed by the NAO to prepare their audit report.
33Annual Report and Accounts 2010-11

Reporting of protected personal data related incidentsIn line with Cabinet Office requirements, we report on personal data related incidents and information risk
management. The following tables set out:
a summary of protected personal data related incidents formally reported to the Information Commissioner’s • Office in the financial year (Table 1);
centrally recorded protected personal data related incidents not formally reported to the Information • Commissioner’s Office in the financial year (Table 2); and
protected personal data related incidents in previous financial years (Table 3).•
Table 1: Summary of protected personal data related incidents formally reported to the Information Commissioner’s Office in 2010-11
Date of incident
(month)
Nature of incident Nature of data
involved
Number of people
potentially affected
Notification steps
No incidents to report
Further action on
information risk
None
Table 2: Summary of other protected personal data related incidents in 2010-11
Incidents deemed by the Data Controller not to fall within the criteria for report to the Information
Commissioner’s Office but recorded centrally within the Department are set out below. Small, localised incidents
are not recorded centrally and are not cited in these figures.
Category Nature of incident Total
I Loss of inadequately protected electronic equipment, devices or
paper documents from secured Government premises
0
II Loss of inadequately protected electronic equipment, devices or
paper documents from outside secured Government premises
0
III Insecure disposal of inadequately protected electronic equipment,
devices or paper documents
1
IV Unauthorised disclosure 5
V Other 5
Resource Accounts
34 Annual Report and Accounts 2010-11

Table 3: Year-on-year total numbers of protected personal data related incidents prior to 2010-11
Total number of protected personal data related incidents formally reported to the Information Commissioner’s Office, by category number
Total number of other protected personal data related incidents, by category number
I II III IV V Total I II III IV V Total
2009-10 - - - - - - 2009-10 - - - 2 3 5
2008-09 - - - - - - 2008-09 - - 1 1 - 2
2007-08 - - - - - - 2007-08 - - - - - -
2006-07 - - - - - - 2006-07 - - - - - -
2005-06 - - - - - - 2005-06 - - - - - -
The number of personal data related incidents has risen as more incidents are reported by staff following the
implementation of a new incident reporting procedure and ongoing training. All protected personal data related
incidents are reviewed and procedures are amended where necessary to prevent a recurrence.
Progress against actions in the Coalition’s Programme for GovernmentIn May 2010, the newly elected Coalition Government announced an urgent review of Government expenditure.
A number of major projects were reviewed and many Departments were given reduced Delegated Expenditure
Limits (DEL) for the year 2010-11. The Commission was not required to reduce its DEL and it did not have any major
projects that were subject to review.
In July 2010, the Coalition Government also introduced a number of actions that all Departments are required to
implement. These include a recruitment freeze and controls over specified areas of expenditure. The Commission
had already taken steps in many of these areas in order to deliver a balanced budget. To restrain and reduce our
payroll costs, we introduced a recruitment freeze for all non-temporary staff and there has been no new external
recruitment initiated since 1 April 2010. We have reduced the number of temporary staff from seven as at 1 April
2010 to two by 31 March 2011 and implemented a freeze on the engagement of agency staff. To reduce our
administration costs, we have made use of centrally negotiated procurement contracts wherever possible and
have been seeking to reduce accommodation costs by actively pursuing sub-letting of surplus office space.
Revised internal approval procedures have been introduced in the areas of consultancy, publicity and advertising
expenditure. Any new expenditure on consultants over £20,000 and any expenditure on publicity and advertising
activity requires prior approval from the Accounting Officer and is reported to the Board. There have been no new
consultancy contracts over £20,000 since these revised procedures were implemented. Approved expenditure on
publicity and advertising for the year totalled £2,085. This expenditure relates to stakeholder events to provide
advice and guidance and raise awareness of issues identified through our research activity.
The Commission has received no sponsorship payments in 2010-11 (none in 2009-10).
35Annual Report and Accounts 2010-11

Our fundingThe 2007 Comprehensive Spending Review (CSR) set out the baseline funding we received for each financial year
of the three year period 2008-11. The CSR provided for an annual reduction of 5% in real terms to our revenue
funding for each of those three years. Our baseline revenue funding in 2008-09 was £30.97m. In 2009-10, this
reduced to £30.22m and in 2010-11 it fell to £29.3m.
To access the funding set out in the CSR, we submit an annual Main Estimate to Parliament. Once Parliament
approves the Main Estimate, it forms a statutory authority for HM Treasury to transfer the funds from the
Government’s Consolidated Fund to the Commission. This annual statutory authority is set out in the Consolidated
Funds Act and the Appropriation Act. Our Main Estimate is submitted in March of the preceding financial year to
which the request relates.
As well as receiving our baseline funding of £29.3m authorised in the Main Estimate, we were also permitted
access to £0.4m from the Government Reserve through the Spring Supplementary Estimate published in February
2011. These additional funds were granted to the Commission to settle the balance of relocation costs following
our London office move in June 2009.
On 22 October 2010, the outcome of the 2010 Spending Review was announced. The Charity Commission’s
revenue funding will be reduced by 33% in real terms over the next four financial years and capital funding will be
halved in real terms, as set out in the table below (note, depreciation funding was not ring-fenced in 2010-11).
Funding limits for the Charity Commission for the next Spending Review period (nominal terms)
Year 0 2010-11(£’000s)
Year 1 2011-12(£’000s)
Year 2 2012-13(£’000s)
Year 3 2013-14(£’000s)
Year 4 2014-15(£’000s)
Total Revenue DEL: 29,334 27,979 26,420 22,825 22,104
of which non-ring-fenced 26,499 25,650 22,025 21,254
of which ring-fenced for depreciation 1,480 770 800 850
Total Capital DEL 700 357 361 325 412
Annual reduction in non-ring-fenced
revenue DEL
-1,265
(4.6%)
-849
(3.2%)
-3,625
(14.1%)
-771
(3.5%)
Resource Accounts
36 Annual Report and Accounts 2010-11

The Annual Report provides further commentary on how the Commission is reviewing its activities to operate
within these reduced funding levels.
Results for the yearThis year has been challenging. Apart from needing to work within a 5% reduction in our funding limit, access
to End of Year Flexibility (EYF) was withdrawn. EYF is the balance of underspends from previous years which we
have used in 2008-09 and 2009-10 to fund new investments. The withdrawal of EYF meant that such investments
now needed to be funded from our baseline funding and savings needed to be made elsewhere to compensate.
We therefore had to make significant savings on both our salary costs and day-to-day expenditure to ensure that
we operated within the lower funding limit. During the year, 36 full time equivalent staff who worked on the
Commission’s core activities left the organisation and were not replaced. The continual review of our general and
administrative expenditure realised savings of 25 per cent compared to our 2009-10 outturn.
While addressing these underlying financial pressures, we have also managed our financial position carefully
to fund:
45 voluntary exits and one early retirement that will contribute to staff reductions necessary to remain within • our funding limits for the next Spending Review period 2011-2015 (further details of these costs are provided
in Note 8 to the Resource Accounts);
end of lease costs on our former London and Liverpool offices totalling £0.7m;•
completion of a new database to hold the Register of Charities;•
adjustments to our IT systems to prepare for the registration of Charitable Incorporated Organisations; and•
continued investment in the development of our website to enable charities to complete more transactions • with the Commission electronically.
The overall financial position is satisfactory. We have managed our resources well and have maintained
expenditure within the funding we have received.
37Annual Report and Accounts 2010-11

Reconciliation of resource expenditure between estimates, accounts and budgets
2010-11
(£’000s)
2009-10
(£’000s)
Net Resource Outturn (Estimates) Adjustments to remove:
- Provision voted for earlier years
Adjustments to additionally include:
- Non-voted expenditure in the Operating Cost Statement (OCS)
- Consolidated Fund Extra Receipts in the OCS
Other Adjustments
Net Operating Cost (Accounts) Adjustments to remove:
- Capital Grants financed from Capital Modernisation Fund
- European Union income and related adjustments
- Voted expenditure outside the budget
Adjustments to additionally include:
- Other Consolidated Fund Extra Receipts
- Unallocated resource provision
Other Adjustments
Resource Budget Outturn (Budget) Of which:
- Departmental Expenditure Limits (DEL)
- Annually Managed Expenditure (AME)
30,778
-
-
-
-
28,830
-
-
-
2
-
28,832
29,405
-573
31,478
-
-
-
-
31,421
-
-
-
1
-
31,422
31,421
0
The surplus for the year of £1.95m represents the difference between the Net Resource Outturn (Estimates) of
£30.78m and the Net Operating Cost (Accounts) of £28.83m. We have exercised tight financial control over our
expenditure for the year to remain within our funding limits while obtaining optimum use of our resources. The
reasons for the surplus at year end are set out below.
Surplus Revenue Delegated Expenditure Limit (DEL)
Our Revenue DEL for the year was £29.8m, against which we incurred expenditure of £29.4m. The surplus of
£0.4m arose for the following reasons:
we set aside funds of £0.1m for the potential costs arising from a legal case on which a decision was • expected in mid-March 2011. The decision was not delivered by 31 March and the Resource Accounts
include a provision for this amount, which scores as AME, rather than an accrual which would have scored
as DEL. The pending outcome of the legal case meant that we were unable to allocate the funds to an
alternative purpose;
Resource Accounts
38 Annual Report and Accounts 2010-11

the Resource Accounts include an accrual for the cost of staff annual leave entitlement that has not been taken • by 31 March. This accrual is calculated after the year end and the liability as at 31 March 2011 is £0.1m less
than the liability as at 31 March 2010. The reduction in the accrual is credited to our Net Operating Cost; and
the remaining £0.2m is the total of underspends against a variety of budget heads, none of which are • individually material.
Surplus Annually Managed Expenditure (AME)
We requested £1.0m AME in the Spring Supplementary Estimate to cover the cost of raising a provision for staff
applying to exit under our Voluntary Exit Scheme. At the time the request was made, the total cost of exits for
staff that expressed an interest in the scheme was £3.1m and we were unable to estimate reliably how many of
these would result in a formal application and agreed departure. The actual cost of staff who ultimately applied
for Voluntary Exit was £1.9m and therefore we did not require the full provision approved in the Estimate. AME
is showing a negative outturn as provisions utilised and written back in the year count as negative AME and the
balance of these transactions in 2010-11 exceeds the amount from creating and increasing provisions in the year,
which count as positive AME. There are no Treasury Control Totals in respect of AME.
Performance relating to expenditure controlsThe level of expenditure incurred by Government Departments, including the Charity Commission, is subject to
statutory limits approved by Parliament. It is a fundamental form of accountability that expenditure within a
financial year does not exceed these limits. There are three key financial targets which the Commission must
achieve. Our performance against these targets is set out in the table below:
Revenue DEL
(£’000s)
Capital DEL
(£’000s)
Net Cash Requirement
(£’000s)
Expenditure limits set at the start of the year and subsequent adjustments
Main Estimate 29,334 700 28,873
Spring Supplementary Estimate 444 - 225
Final limit 29,778 700 29,098
Performance against limits
Expenditure incurred 29,405 617 -
Cash drawn down - - 27,533
Performance within funding limit?
The increase to our Revenue DEL in the Spring Supplementary Estimate was funded from the Government Reserve.
39Annual Report and Accounts 2010-11

Remuneration Report
Senior Civil Service (SCS) Pay CommitteeThe Commission’s SCS Pay Committee comprises:
Committee Chair John Wood
Committee Member Dame Suzi Leather
Committee Member Theo Sowa
Committee Member Andrew Hind (to September 2010)
Committee Member Sam Younger (from September 2010)
External Committee Member Louise Rose
The responsibilities of the Committee include:
reviewing and approving annually the SCS Pay Strategy;•
considering the pay recommendations made by line managers for each member of the SCS based on their • performance review report and the guidance produced by the Cabinet Office;
deciding which pay tranche SCS members should be placed in and the amount of bonus they should receive, • taking into account the relative performance of the SCS members and affordability considerations; and
reporting the outcome of its decisions to Human Resources for implementation, and the Cabinet Office for • central monitoring and moderation purposes.
Service contractsCivil Service appointments are made in accordance with the Civil Service Commissioners’ Recruitment Code, which
requires appointment to be on merit on the basis of fair and open competition but also includes the circumstances
when appointments may otherwise be made.
Unless otherwise stated below, the officials covered by this report hold appointments which are open-ended. Early
termination by the Commission, other than for misconduct, would result in the individual receiving compensation
as set out in the Civil Service Compensation Scheme.
Salary and pension entitlementsThe following sections provide details of the remuneration and pension interests of Board Members and the most
senior Executive officials of the Commission.
Resource Accounts
40 Annual Report and Accounts 2010-11

Remuneration (audited)
2010-11 Salary (£’000s)
2010-11 Bonus payments (£’000s)
2009-10 Salary (£’000s)
2009-10 Bonus payments (£’000s)
Dame Suzi Leather DBE * Chair
80-85 0 80-85 0
Andrew Hind ** Chief Executive (to 4 October 2010)
65-70 (125-130 full
year equivalent)
0-5 125-130 0
Sam Younger CBE ** Chief Executive (from 1 September 2010)
75-80 (125-130 full
year equivalent)
0 0 0
Nick Allaway Director
85-90 0-5 85-90 0
Rosie Chapman Director
85-90 0 85-90 0-5
Kenneth Dibble Director
105-110 0 105-110 0-5
David Locke Director
75-80 0 75-80 0-5
Simon Jones Board Member
5-10 0 10-15 0
Sharmila Nebhrajani Board Member
5-10 0 5-10 0
Dr Andrew Purkis OBE Board Member (to 15 October 2010)
5-10 0 20-25 0
Theo Sowa CBE Board Member
10-15 0 5-10 0
Simon Wethered Board Member
15-20 0 15-20 0
John Wood Board Member
15-20 0 15-20 0
John Knight Board Member
5-10 0 0-5 0
Irene Khan Board Member (to 6 March 2011)
5-10 0 0-5 0
John Williams * Board Member (to December 2009)
0 0 10-15 0
Tess Woodcraft * Board Member (to April 2009)
0 0 0-5 0
* Indicates part time non-executive appointed on a three year fixed term contract, with the option of extension or reappointment.
** Andrew Hind was appointed for a period of four years commencing on 4th October 2004. This contract was extended by two years to 4th October 2010. Sam Younger CBE succeeded Andrew Hind from 1 September 2010 and has been appointed for a period of three years.
41Annual Report and Accounts 2010-11

All Board Members serving in 2010-11 received a daily fee of £350. No pension contributions are paid.
“Salary” includes: gross salary, performance pay or bonuses, overtime, reserved rights to London weighting or
London allowances, recruitment and retention allowances and any other allowance to the extent that it is subject
to UK taxation.
Dame Suzi Leather’s home base is out of London. In addition to the above, and in accordance with her contract
of employment, Dame Suzi incurred £19,433 in hotel and travel costs to allow her to fulfil her Charity Commission
commitments in London (£22,520 in 2009-10). The Charity Commission meets the resulting tax liability for
these costs.
Christopher Daws received £0 to £5,000 in remuneration for duties as the independent non-executive member of
the Audit Committee (£0 to £5,000 in 2009-10).
The Chair, Chief Executive and four directors are Senior Civil Servants. A further two members of Commission staff
are also Senior Civil Servants but do not sit on the Directors’ Group. During 2010-11, the salary of one of these
Senior Civil Servants fell within the band £65,000 to £70,000 (£65,000 to £70,000 in 2009-10) and the other fell
within the band £70,000 to £75,000 (£70,000 to £75,000 in 2009-10).
Reimbursement of expenses Expenses claimed by Board Members are in respect of actual receipted expenditure for travel, subsistence and
accommodation. For the Chair, Chief Executive, Directors and other Commission staff, expenses claimed are in
respect of costs expended for business travel and accommodation and subsistence allowance, in accordance with
Civil Service guidelines. In 2010-11, the Commission published on its website details of expenses claimed by the
Chair, Board Members, the Chief Executive and Directors on a quarterly basis.
Resource Accounts
42 Annual Report and Accounts 2010-11
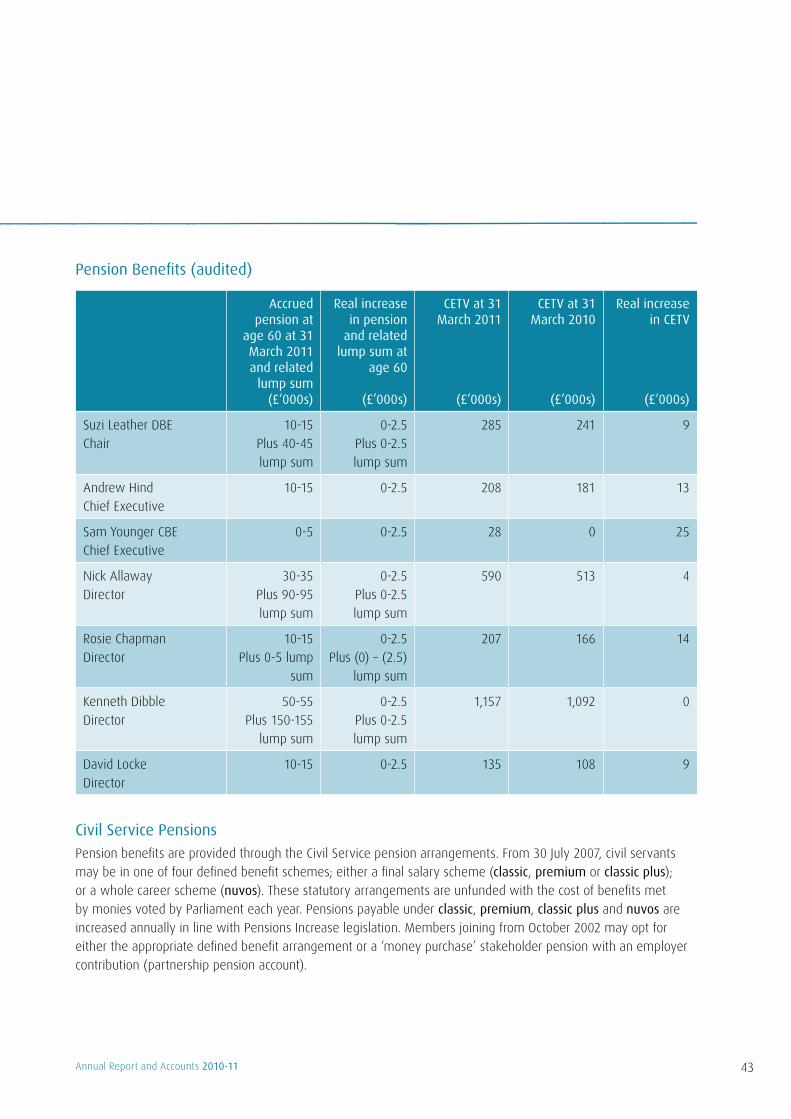
Pension Benefits (audited)
Accrued pension at
age 60 at 31 March 2011 and related
lump sum(£’000s)
Real increase in pension
and related lump sum at
age 60
(£’000s)
CETV at 31 March 2011
(£’000s)
CETV at 31 March 2010
(£’000s)
Real increase in CETV
(£’000s)
Suzi Leather DBE
Chair
10-15
Plus 40-45
lump sum
0-2.5
Plus 0-2.5
lump sum
285 241 9
Andrew Hind
Chief Executive
10-15 0-2.5 208 181 13
Sam Younger CBE
Chief Executive
0-5 0-2.5 28 0 25
Nick Allaway
Director
30-35
Plus 90-95
lump sum
0-2.5
Plus 0-2.5
lump sum
590 513 4
Rosie Chapman
Director
10-15
Plus 0-5 lump
sum
0-2.5
Plus (0) – (2.5)
lump sum
207 166 14
Kenneth Dibble
Director
50-55
Plus 150-155
lump sum
0-2.5
Plus 0-2.5
lump sum
1,157 1,092 0
David Locke
Director
10-15 0-2.5 135 108 9
Civil Service PensionsPension benefits are provided through the Civil Service pension arrangements. From 30 July 2007, civil servants
may be in one of four defined benefit schemes; either a final salary scheme (classic, premium or classic plus); or a whole career scheme (nuvos). These statutory arrangements are unfunded with the cost of benefits met
by monies voted by Parliament each year. Pensions payable under classic, premium, classic plus and nuvos are
increased annually in line with Pensions Increase legislation. Members joining from October 2002 may opt for
either the appropriate defined benefit arrangement or a ‘money purchase’ stakeholder pension with an employer
contribution (partnership pension account).
43Annual Report and Accounts 2010-11
Employee contributions are set at the rate of 1.5% of pensionable earnings for classic and 3.5% for premium,
classic plus and nuvos. Benefits in classic accrue at the rate of 1/80th of final pensionable earnings for each
year of service. In addition, a lump sum equivalent to three years initial pension is payable on retirement. For
premium, benefits accrue at the rate of 1/60th of final pensionable earnings for each year of service. Unlike
classic, there is no automatic lump sum. classic plus is essentially a hybrid with benefits for service before 1
October 2002 calculated broadly as per classic and benefits for service from October 2002 worked out as in
premium. In nuvos, a member builds up a pension based on his/her pensionable earnings during their period
of scheme membership. At the end of the scheme year (31 March) the member’s earned pension account is
credited with 2.3% of their pensionable earnings in that scheme year and the accrued pension is uprated in line
with Pensions Increase legislation. In all cases, members may opt to give up (commute) pension for a lump sum
up to the limits set by the Finance Act 2004.
The partnership pension account is a stakeholder pension arrangement. The employer makes a basic contribution
of between 3% and 12.5% (depending on the age of the member) into a stakeholder pension product chosen
by the employee from a panel of three providers. The employee does not have to contribute, but where they do
make contributions, the employer will match these up to a limit of 3% of pensionable salary (in addition to the
employer’s basic contribution). Employers also contribute a further 0.8% of pensionable salary to cover the cost of
centrally-provided risk benefit cover (death in service and ill health retirement).
The accrued pension quoted is the pension the member is entitled to receive when they reach pension age, or
immediately on ceasing to be an active member of the scheme if they are already at or over pension age.
Pension age is 60 for members of classic, premium and classic plus and 65 for members of nuvos.
Further details about the Civil Service pension arrangements can be found at the website
http://www.civilservice.gov.uk/my-civil-service/pensions/index.aspx
Details of the payments made by the Commission in respect of pensions are set out in Note 8 to the
Resource Accounts.
Cash Equivalent Transfer Values
A Cash Equivalent Transfer Value (CETV) is the actuarially assessed capitalised value of the pension scheme
benefits accrued by a member at a particular point in time. The benefits valued are the member’s accrued benefits
and any contingent spouse’s pension payable from the scheme. A CETV is a payment made by a pension scheme
or arrangement to secure pension benefits in another pension scheme or arrangement when the member leaves
a scheme and chooses to transfer the benefits accrued in their former scheme. The pension figures shown relate
to the benefits that the individual has accrued as a consequence of their total membership of the pension scheme,
not just their service in a senior capacity to which disclosure applies.
The figures include the value of any pension benefit in another scheme or arrangement which the member has
transferred to the Civil Service pension arrangements. They also include any additional pension benefit accrued to
the member as a result of their buying additional pension benefits at their own cost. CETVs are worked out within
the guidelines and framework prescribed by the Institute and Faculty of Actuaries and do not take account of any
actual or potential reduction to benefits resulting from Lifetime Allowance Tax which may be due when pension
benefits are taken.
Resource Accounts
44 Annual Report and Accounts 2010-11

Real increase in CETVThis reflects the increase in CETV that is funded by the employer. It does not include the increase in accrued
pension due to inflation or contributions paid by the employee (including the value of any benefits transferred
from another pension scheme or arrangement) and uses common market valuation factors for the start and end of
the period.
Civil Service voluntary exit packagesRosie Chapman will be leaving under the Civil Service Compensation Scheme (CSCS) Voluntary Exit terms on
31 May 2011 and will receive a compensation payment within the band £50,000 to £100,000. This payment is
recognised in the 2010-11 Resource Accounts although it is not payable until the date of exit.
Sam Younger CBE 17 June 2011
Chief Executive and Accounting Officer
45Annual Report and Accounts 2010-11

Statement of Accounting Officer’s ResponsibilitiesUnder Section 5 of the Government Resources and Accounts Act 2000, HM Treasury has directed the Charity
Commission to prepare for each financial year resource accounts detailing the resources acquired, held, or disposed
of during the year and the use of resources by the department during the year. The accounts are prepared on an
accruals basis and must give a true and fair view of the state of affairs of the Charity Commission and of its net
resource outturn, changes in taxpayers’ equity and cash flows for the financial year.
In preparing the accounts, the Accounting Officer is required to comply with the requirements of the Government
Financial Reporting Manual and in particular to:
observe the Accounts Direction issued by HM Treasury, including relevant accounting and disclosure • requirements, and apply suitable accounting policies on a consistent basis;
make judgements and estimates on a reasonable basis;•
state whether applicable accounting standards, as set out in the • Government Financial Reporting Manual,
have been followed, and disclose and explain any material departures in the accounts; and
prepare the accounts on a going concern basis.•
HM Treasury has appointed the Chief Executive as Accounting Officer of the Charity Commission. The
responsibilities of an Accounting Officer, including responsibility for the propriety and regularity of the public
finances for which the Accounting Officer is answerable, for keeping proper records and safeguarding the Charity
Commission’s assets, are set out in the Accounting Officers’ Memorandum issued by HM Treasury and published in
Managing Public Money.
Resource Accounts
46 Annual Report and Accounts 2010-11

Statement on Internal ControlScope of responsibility
As Accounting Officer, I have responsibility for maintaining a sound system of internal control that supports the
achievement of the Charity Commission’s policies, aims and objectives, whilst safeguarding the public funds and
Departmental assets for which I am personally responsible, in accordance with the responsibilities assigned to me
under Managing Public Money.
The Commission is the independent registrar and regulator for charitable activity. Its primary aim is to provide the
best possible regulation of charities in England and Wales to increase charities’ effectiveness and promote public
trust and confidence in their activities.
As Accounting Officer, I am accountable to Parliament and report to it annually. On managing risk, I involve the
Board and work with the Commission’s Directors’ Group.
The purpose of the system of internal control
The system of internal control is designed to manage risk to a reasonable level rather than to eliminate all risk
of failure to achieve policies, aims and objectives; it can therefore only provide reasonable and not absolute
assurance of effectiveness. The system of internal control is based on an ongoing process designed to identify and
prioritise the risks to the achievement of the Commission’s policies, aims and objectives, to evaluate the likelihood
of those risks being realised and the impact should they be realised, and to manage them efficiently, effectively
and economically. The system of internal control has been in place in the Charity Commission for the year ended
31 March 2011 and up to the date of approval of the Annual Report and Resource Accounts and accords with
Treasury guidance.
Capacity to handle risk
The Commission recognises that to deliver its strategic aims, objectives and priorities successfully it needs sound
corporate governance arrangements. A fundamental feature of strong corporate governance is an effective and
proactive approach to risk management. Effective risk management informs all good decision making, business
planning and implementation.
The Commission’s strategy is to achieve the balance between the need for a robust internal control and effective
governance framework while ensuring that our approach is proportionate and commensurate with our size,
funding, resources and the type and level of risk to which the Commission is exposed.
The Commission’s capacity for risk management is proportionate and directed in the following ways:
safeguarding the Commission’s services, reputation, projects, assets and information security and minimising • the possibility of any organisational failure;
identifying, reporting and managing risks that are directly linked to the achievement of the Commission’s • aims, objectives and priorities at all levels — strategic, corporate and operational — and monitoring them on a
regular basis. This includes anticipating and taking preventative action to avoid risks rather than dealing with
the consequences of risks once they have materialised;
47Annual Report and Accounts 2010-11

embedding a culture of effective risk management throughout the Commission at every level, recognising • that we all have a responsibility to manage risk effectively and ensuring that ownership and accountability for
risk management are clearly assigned and regularly reviewed; and
monitoring the effectiveness of our internal control, learning from our experiences and striving to improve our • systems, processes and procedures where it is necessary and proportionate to do so.
The Commission has a designated internal audit and risk manager responsible for managing the internal audit
programme of work and the development of risk management within the Commission.
The risk and control framework
The Commission’s approach to risk management is embedded in key aspects of our work, including policy
making, service delivery, business planning and project management. The main mechanisms for the identification,
evaluation and mitigation of risk are:
1. Governance Framework
The Commission has a comprehensive Governance Framework which is published on our website. It includes the
legal and constitutional position of the Commission, the role of the Board and principles of Good Governance. The
Governance Framework seeks to:
clarify the complementary roles and responsibilities of the Board and the Directors’ Group;•
determine matters reserved for the Board and those delegated to the Chief Executive, including risk • management and audit issues; and
ensure that Board Members operate in accordance with best practice and in a way that commands the • confidence of the Commission’s stakeholders.
2. Audit Committee
The Audit Committee is responsible for ensuring the adequacy of risk management, internal controls and
governance arrangements within the Commission. The Audit Committee is a Committee of the Commission and
met on three occasions during the year. The Committee considered ten internal audit reports and no audit received
an ‘inadequate’ assurance rating. Based on this work, our internal auditors have concluded that the Commission’s
risk management, control and governance processes are adequate and effective.
The Committee considers the Commission’s Strategic Risk Register at each meeting and all internal and external
audit reports and monitors the implementation of internal audit recommendations. Reports on audit committee
business are presented to the Board following each meeting. During the year, the Audit Committee’s terms of
reference were reviewed and revised to ensure they follow the most recent best practice guidance.
Resource Accounts
48 Annual Report and Accounts 2010-11
3. Risk Management Policy
The framework for the Commission’s risk management process is set out in our Risk Management Policy. The
strategic approach to risk management rests with the Commission’s Board and is cascaded to appropriate
managers with clear responsibility for improving controls and minimising the impact of risks that may be
identified. The Board reviews the Strategic Risk Register twice a year. Internal audit have confirmed that existing
arrangements are fit for purpose and that there is a clear commitment to fully embed risk management
throughout the organisation. They also note that the continued development of risk management arrangements
has been approved and is being progressed within the Commission.
4. Risk registers
The Board and the Directors’ Group identify and evaluate the Strategic Risks that, if realised, are expected to have
the greatest impact on the Commission’s business. These strategic risks are embedded and supported by more
detailed risk registers covering all the Commission’s key functions and activities. All risks have designated owners
who are responsible for maintaining the registers and for overseeing the effective management of identified risks,
including the development of mitigating controls.
5. Strategic Review Programme Board
The Commission established a Strategic Review Programme Board. It is chaired by the Chief Executive and two
representatives from the Board attend, including the Chair. The purpose of the Programme Board is to ensure that
the change management process is effectively and efficiently managed and that individual projects supporting the
change programme deliver as scoped and to agreed deadlines. A Strategic Review Programme Board risk register
has been drafted to manage the risks and is reviewed at each Programme Board meeting.
6. Risk and Proportionality Frameworks
The Commission’s risk appetite is determined by Risk and Proportionality Frameworks covering our Compliance and
Charity Services functions. These Frameworks, published in July 2008 and March 2010 respectively, define when
we will or will not intervene to protect a charity and our regulatory interest while seeking to reduce the burden
of regulation where possible. The Commission’s risk and proportionality frameworks enable us to take a risk and
evidence based approach to targeting resources on the effective regulation of charities. It encourages our staff to
actively identify, evaluate and manage risks in the conduct of day to day business.
7. High risk cases
The Board receives regular reports on the high risk cases currently being dealt with by the Commission. High risk
cases include those with significant risk to a charity’s assets and/or beneficiaries. The criteria for such cases was
reviewed and revised during the year, placing greater emphasis on sector-wide or sub-sectoral risks and issues.
49Annual Report and Accounts 2010-11

Resource Accounts
8. Project management
For each of the Commission’s large scale corporate projects, a Project Board is established and a Senior
Responsible Owner appointed. Oversight of such projects is through the Directors’ Group chaired by the Chief
Executive. Typically, corporate projects are established where significant risk, cost and staff investment are
involved. We are committed to continuous improvement through disseminating lessons learnt and assessing the
realisation of business benefits.
Project Management training (including the identification and mitigation of project risks) has been provided
to appropriate staff. A Project Office is in place which provides advice and guidance on key aspects of project
management, including a clear definition of the standards, expectations, roles and responsibilities and the need for
robust risk and financial management.
9. Anti-Fraud Policy and Fraud Response Plan
The Commission has an Anti-Fraud Policy and Fraud Response Plan, which is available to all staff via the
Commission’s intranet. These were updated and considered by the Audit Committee in October 2010. The
Commission’s financial controls are expressly designed to ensure that opportunities for fraud and corruption are
reduced to the lowest possible level. The Anti-Fraud Policy requires all staff at all times to act honestly and with
integrity and to safeguard the public resources for which the Commission is responsible. The policy sets out the
responsibilities of staff and the process for reporting incidents of fraud.
10. Security Steering Group
The Commission has a Security Steering Group that is chaired by an Executive Director and meets quarterly: It
exists to give overall direction in security issues and ensure compliance with Government security policies and
standards defined by the Cabinet Office and summarised in the Security Policy Framework. All of the Commission’s
ITC systems are subject to annual security accreditation and there are detailed processes and procedures in place
that define the approach to and management of the security around these systems.
11. Data security
There have been no incidents in the year to report to the Information Commissioner’s Office in relation to protected
personal data.
Our programme of continuous improvements to manage the risks in relation to information security included
a review and update of the Risk Management Accreditation Document Set (RMADS) for all systems handling
personal data (each system being accredited separately), implementation of email protective markings, creation
of an Information Asset Register, the provision of annual refresher ‘Protecting Information’ training and training for
Information Asset Owners.
12. Business continuity
The Commission has a Business Continuity Plan (BCP) which covers all aspects of the business and is reviewed
regularly. An Incident Response Plan is also in place. The BCP was activated this year as a result of student
demonstrations that briefly closed our London office. Whilst some learning points materialised from the incident,
the BCP worked effectively and is fit for purpose.
50 Annual Report and Accounts 2010-11

Strategic risks
In 2010-11, the Commission’s strategic risks fell into the areas listed below:
stakeholder expectations of our role are not met;•
insufficient response to the risks facing the sector within our regulatory remit;•
stakeholder engagement is not effective;•
statutory objectives are not met reducing public trust and confidence in charity;•
positioning the Commission for the longer term is not effective;•
insufficient funding to meet our statutory objectives;•
maintaining an effective, motivated, skilled and diverse workforce during a time of considerable change is not • sustainable; and
maintaining business continuity in the event of an unanticipated event causing significant temporary closure • of Commission operations is not effective.
In each area, we have developed and continue to review the mitigation actions to manage the risks identified
effectively without any significant control issues or risks materialising.
In October 2010, following the announcement by the government that the Commission’s budget would be
reduced by 33% in real terms by 2014-15, a strategic review was launched. Although the imminent end of the
current 2008-11 strategy would have necessitated a review in any event, the scale of the reductions meant that
a fundamental re-appraisal was required. As a result, the Commission began an intensive period of internal and
external consultation to help identify where and how it should focus its more limited resources over the coming
four years. The consultation covered future risks to the charity sector, expectations of the Commission in terms
of approach and focus of activity, and whether others could be better placed to take on some of the functions
currently carried out by the Commission. Implementation of the Commission’s new strategy will take place on 1
October 2011.
Significant internal control issues
There were no significant internal control issues in 2010-11 to report.
Review of effectiveness
As Accounting Officer, I have responsibility for reviewing the effectiveness of the system of internal control. My
review of the effectiveness of the system of internal control is informed by the work of the internal auditors and
the Executive Directors within the department who have responsibility for the development and maintenance
of the internal control framework, and comments made by the external auditors in their management letter
and other reports. I have been advised on the implications of the result of my review of the effectiveness of the
system of internal control by the Board and the Audit Committee and a plan to address weaknesses and ensure
continuous improvement of the system is in place.
51Annual Report and Accounts 2010-11

Resource Accounts
At the end of the year, assurance was provided by owners of risk registers in which they confirmed the adequacy
of the risk management and control arrangements for which they had responsibility. This process did not identify
any material weaknesses on control or irregularities in accounting practices. Risk register owners also set out the
key internal controls and sources of assurance within their areas.
During 2010-11, action has been taken where appropriate to address internal control issues and recommendations
made by the Commission’s internal and external auditors, Audit Committee and Board.
The internal auditors have concluded that, in their opinion, for the year ended 31 March 2011, the Commission
had adequate and effective risk management, control and governance processes and procedures to manage the
achievement of our objectives.
Sam Younger, CBE 17 June 2011
Chief Executive and Accounting Officer
52 Annual Report and Accounts 2010-11

THE CERTIFICATE AND REPORT OF THE COMPTROLLER AND AUDITOR GENERAL TO THE HOUSE OF COMMONSI certify that I have audited the financial statements of the Charity Commission for the year ended 31 March 2011
under the Government Resources and Accounts Act 2000. These comprise the Statement of Parliamentary Supply,
Statement of Comprehensive Net Expenditure, the Statement of Financial Position, the Statement of Cashflows, the
Statement of Changes in Taxpayers’ Equity and the related notes. These financial statements have been prepared
under the accounting policies set out within them. I have also audited the information in the Remuneration Report
that is described in that report as having been audited.
Respective responsibilities of the Accounting Officer and auditor
As explained more fully in the Statement of Accounting Officer’s Responsibilities, the Accounting Officer is
responsible for the preparation of the financial statements and for being satisfied that they give a true and
fair view. My responsibility is to audit, certify and report on the financial statements in accordance with the
Government Resources and Accounts Act 2000. I conducted my audit in accordance with International Standards on
Auditing (UK and Ireland). Those standards require me and my staff to comply with the Auditing Practices Board’s
Ethical Standards for Auditors.
Scope of the audit of the financial statements
An audit involves obtaining evidence about the amounts and disclosures in the financial statements sufficient
to give reasonable assurance that the financial statements are free from material misstatement, whether
caused by fraud or error. This includes an assessment of: whether the accounting policies are appropriate to the
Commission’s circumstances and have been consistently applied and adequately disclosed; the reasonableness of
significant accounting estimates made by the Commission; and the overall presentation of the financial statements.
In addition I read all the financial and non-financial information in the Annual Report to identify material
inconsistencies with the audited financial statements. If I become aware of any apparent material misstatements
or inconsistencies I consider the implications for my certificate.
In addition, I am required to obtain evidence sufficient to give reasonable assurance that the expenditure and
income reported in the financial statements have been applied to the purposes intended by Parliament and the
financial transactions conform to the authorities which govern them.
Opinion on Regularity
In my opinion, in all material respects the expenditure and income have been applied to the purposes intended by
Parliament and the financial transactions conform to the authorities which govern them.
Opinion on Financial Statements
In my opinion:
the financial statements give a true and fair view of the state of the Commission’s affairs as at 31 March 2011 • and of its net cash requirement, net resource outturn and net operating cost, for the year then ended; and
the financial statements have been properly prepared in accordance with the Government Resources and • Accounts Act 2000 and HM Treasury directions issued thereunder.
53Annual Report and Accounts 2010-11
Resource Accounts
Opinion on other matters
In my opinion:
the part of the Remuneration Report to be audited has been properly prepared in accordance with • HM Treasury directions made under the Government Resources and Accounts Act 2000; and
the information given in the ‘Our performance in 2010-11’ and ‘Management Commentary’ sections of • the Annual Report for the financial year for which the financial statements are prepared is consistent
with the financial statements.
Matters on which I report by exception
I have nothing to report in respect of the following matters which I report to you if, in my opinion:
adequate accounting records have not been kept; or•
the financial statements and the part of the Remuneration Report to be audited are not in agreement with • the accounting records; or
I have not received all of the information and explanations I require for my audit; or•
the Statement on Internal Control does not reflect compliance with HM Treasury’s guidance.•
Report
I have no observations to make on these financial statements.
Amyas C E Morse 23 June 2011
Comptroller and Auditor General
National Audit Office
157-197 Buckingham Palace Road
Victoria, London, SW1W 9SP
54 Annual Report and Accounts 2010-11

Statement of Parliamentary SupplyFor the year ended 31 March 2011
The Statement of Parliamentary Supply demonstrates to Parliament how we have applied the resources allocated
to the Commission through the Supply Estimate process.
The notes on pages 61 to 81 form part of these accounts.
Summary of Resource Outturn 2010-11
2010-11 2009-10
Estimate Outturn Outturn
Request for Resources 1
Gross Expenditure
Income A in A
Net Total
Gross Expenditure
Income A in A
Net Total
Net outturn
compared with
Estimate: saving/ (excess) Net Total
£’000s £’000s £’000s £’000s £’000s £’000s £’000s £’000s
Revenue Delegated Expenditure Limit
Integrity in Charity 30,778 (1,000) 29,778 30,357 (952) 29,405 373 31,422
(Note 3)
Annually Managed Expenditure
Provisions 1,000 0 1,000 (573) 0 (573) 1,573 0
(Notes 3 and 16)
Total resources 31,778 (1,000) 30,778 29,784 (952) 28,832 1,946 31,422
Non-operating cost A in A
0
0
0
0
0
0
0
0
55Annual Report and Accounts 2010-11

Resource Accounts
Net cash requirement 2010-11
2010-11 2009-10
Note Estimate Outturn
Net outturn compared with
Estimate: saving/ (excess)
Total Outturn
£’000s £’000s £’000s £’000s £’000s
Net cash requirement 5 29,098 27,531 1,567 31,442
Summary of the income payable to the Consolidated Fund
In 2010-11, the Charity Commission received £2k income payable to the Consolidated Fund (£1k in 2009-10).
Explanations of variances between Estimate and Outturn are given in the Management Commentary on pages
37 to 39.
56 Annual Report and Accounts 2010-11

Statement of Comprehensive Net Expenditurefor the year ended 31 March 2011
The Statement of Comprehensive Net Expenditure (known formerly as the Operating Cost Statement) summarises
the resources that have been consumed in the financial year in providing the Commission’s services.
The notes on pages 61 to 81 form part of these accounts.
2010-11 2009-10
Note £’000s £’000s
Administration costs:
Staff costs 8 19,341 18,773
Other Administration costs 9 10,443 13,940
Total Administration costs 29,784 32,713
Operating income 10 (954) (1,292)
Net Operating Cost 28,830 31,421
The Charity Commission does not receive Programme income or incur Programme Costs.
There was no other comprehensive expenditure in 2010-11 (£nil in 2009-10).
57Annual Report and Accounts 2010-11

Resource Accounts
Statement of Financial Positionas at 31 March 2011
The Statement of Financial Position is a summary of all the Commission’s assets and liabilities as at 31 March 2011.
The notes on pages 61 to 81 form part of these accounts.
31 March 2011 31 March 2010
Note £’000s £’000s
Non-current assets:
Property, plant and equipment 11 833 850
Intangible assets 12 2,423 3,493
Total non-current assets 3,256 4,343
Current assets:
Trade and other receivables 13 1,734 1,470
Cash and cash equivalents 14 1,569 47
Total current assets 3,303 1,517
Total assets 6,559 5,860
Current liabilities:
Trade and other payables 15 (5,042) (2,528)
Provisions 16 (532) (1,143)
Total current liabilities (5,574) (3,671)
Non-current assets less net current liabilities 985 2,189
Non-current liabilities:
Provisions 16 (185) (147)
Total non-current liabilities (185) (147)
Assets less liabilities 800 2,042
Taxpayers’ equity:
General fund 800 2,042
Total taxpayers’ equity 800 2,042
Sam Younger Chief Executive and Accounting Officer 17 June 2011
58 Annual Report and Accounts 2010-11
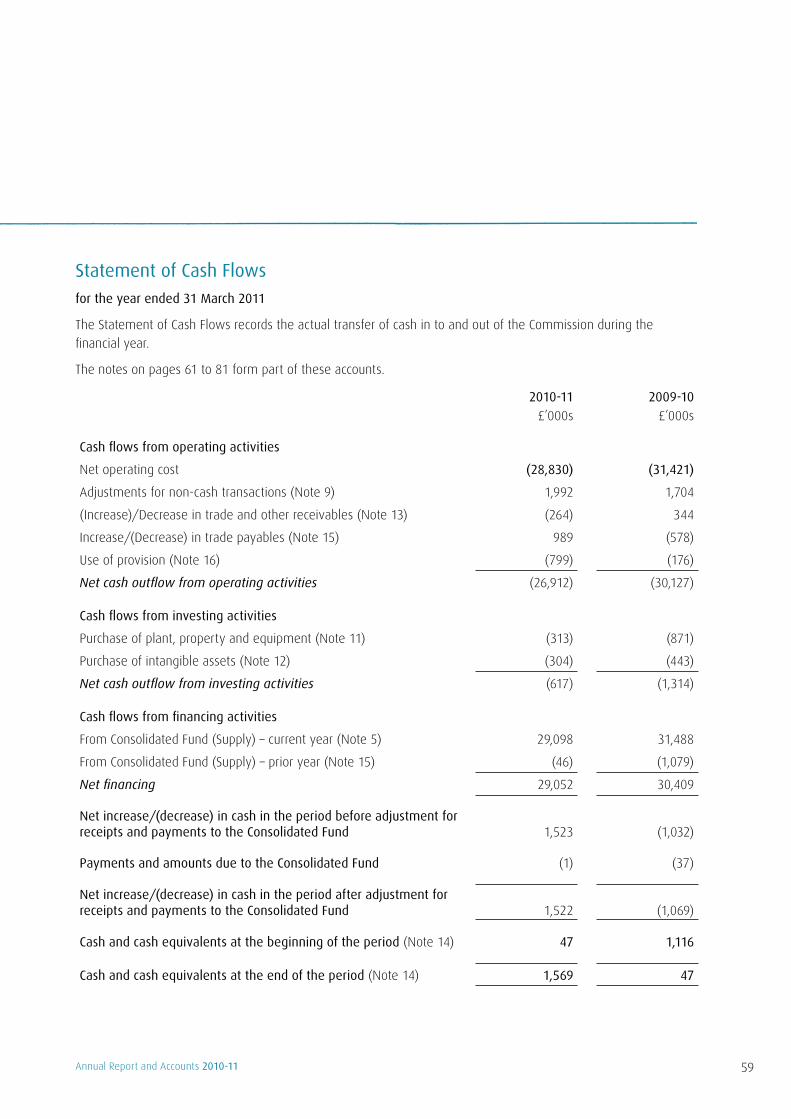
Statement of Cash Flowsfor the year ended 31 March 2011
The Statement of Cash Flows records the actual transfer of cash in to and out of the Commission during the
financial year.
The notes on pages 61 to 81 form part of these accounts.
2010-11 2009-10
£’000s £’000s
Cash flows from operating activities
Net operating cost (28,830) (31,421)
Adjustments for non-cash transactions (Note 9) 1,992 1,704
(Increase)/Decrease in trade and other receivables (Note 13) (264) 344
Increase/(Decrease) in trade payables (Note 15) 989 (578)
Use of provision (Note 16) (799) (176)
Net cash outflow from operating activities (26,912) (30,127)
Cash flows from investing activities
Purchase of plant, property and equipment (Note 11) (313) (871)
Purchase of intangible assets (Note 12) (304) (443)
Net cash outflow from investing activities (617) (1,314)
Cash flows from financing activities
From Consolidated Fund (Supply) – current year (Note 5) 29,098 31,488
From Consolidated Fund (Supply) – prior year (Note 15) (46) (1,079)
Net financing 29,052 30,409
Net increase/(decrease) in cash in the period before adjustment for receipts and payments to the Consolidated Fund
1,523
(1,032)
Payments and amounts due to the Consolidated Fund (1) (37)
Net increase/(decrease) in cash in the period after adjustment for receipts and payments to the Consolidated Fund
1,522
(1,069)
Cash and cash equivalents at the beginning of the period (Note 14) 47 1,116
Cash and cash equivalents at the end of the period (Note 14) 1,569 47
59Annual Report and Accounts 2010-11

Resource Accounts
Statement of Changes in Taxpayers’ Equityfor the year ended 31 March 2011
The Statement of Changes in Taxpayers’ Equity summarises the movement in the net worth of the Commission.
The notes on pages 61 to 81 form part of these accounts.
Changes in taxpayers’ equity for 2010-11 Note £’000s
Balance as at 1 April 2010 2,042
Non-cash charges – auditor’s remuneration 9 59
Net operating cost for the year 4 (28,830)
Total recognised income and expense for 2010-11 (28,771)
Net Parliamentary Funding – drawn down 29,052
Net Parliamentary Funding – deemed 46
Supply payable (1,567)
CFERs payable to the Consolidated Fund 6 (2)
Balance as at 31 March 2011 800
Changes in taxpayers’ equity for 2009-10 Restated
£’000s
Balance as at 1 April 2009 1,886
Non-cash charges – cost of capital 71
Non-cash charges – auditor’s remuneration 65
Net operating cost for the year (31,421)
Total recognised income and expense for 2009-10 (31,285)
Net Parliamentary Funding – drawn down 30,409
Net Parliamentary Funding – deemed 1,079
Supply payable (46)
CFERs payable to the Consolidated Fund (1)
Balance as at 31 March 2010 2,042
60 Annual Report and Accounts 2010-11

Notes to the Resource Accounts1. Statement of accounting policies
These financial statements, which cover the accounting period 1 April 2010 to 31 March 2011, have been
prepared in accordance with the Government Financial Reporting Manual (FReM) 2010-11 issued by HM
Treasury. The accounting policies contained in the FReM apply International Financial Reporting Standards (IFRS)
as adapted or interpreted for the public sector context. Where the FReM permits a choice of accounting policy,
the accounting policy which is judged to be most appropriate to the particular circumstances of the Commission
for the purpose of giving a true and fair view has been selected. The particular policies adopted by the
Commission are described below. They have been applied consistently in dealing with items that are considered
material to the financial statements.
In addition to the primary statements prepared under IFRS, the FReM also requires the Commission to prepare
one additional primary statement. The Statement of Parliamentary Supply (page 55) and supporting notes show
outturn against Estimate in terms of the net resource requirement and the net cash requirement.
The 2009-10 Statement of Changes Taxpayers’ Equity has been restated for the reclassification of certain
equity transactions.
Change in accounting policy: Cost of Capital charge
The 2009-10 Statement of Comprehensive Net Expenditure included a notional cost of capital charge to reflect
the cost to the taxpayer of capital utilised by the Commission in providing its services. The charge was calculated
at a rate set by HM Treasury of 3.5% on the average carrying amount of all assets less liabilities, except for cash
balances with the Officer of the Paymaster General, where the charge is £nil. From 1 April 2010, HM Treasury
has directed that Government Departments are no longer required to include a notional cost of capital charge in
their Resource Accounts. The cost of capital charge in the 2009-10 Statement of Comprehensive Net Expenditure
was £71k. Due to the immaterial value of this balance, the 2009-10 disclosures have not been restated.
A restatement of the prior year comparatives would not affect the net Resource Outturn for the year as a
corresponding adjustment would be made to the Parliamentary Supply. The balance of Total Taxpayers’ Equity
would remain unchanged.
IFRS that have been issued but are not yet effective
IAS24: Related Party Disclosures was amended in November 2009 and will be effective for accounting periods
starting on or after 1 January 2011. The revision of IAS24 simplifies and clarifies the definition of a related party,
and provides government-related entities with partial exemption from the disclosure requirements relating to
related party transactions and outstanding balances. The Charity Commission intends to apply amended IAS24 in
the 2011-12 financial year. The impact of applying this revised standard will not be material.
IFRS 9: Financial Instruments was issued in November 2009 and will be effective for financial reporting periods
beginning on or after 1 January 2013. The new standard simplifies the classification and measurement of financial
assets, previously reported under IAS 39 Financial Instruments: Recognition and Measurement. The application of
this standard will not have a material effect on the disclosure of financial assets within the Charity Commission
financial statements.
61Annual Report and Accounts 2010-11

Resource Accounts
1.1 Accounting convention
These accounts have been prepared under the historical cost convention modified to account for the revaluation of
property, plant and equipment and intangible assets.
1.2 Property, plant and equipment
Expenditure on the acquisition, creation or enhancement of property, plant and equipment is capitalised on an
accruals basis where that expenditure exceeds £1,000 and the benefit it yields has a life of more than one year.
Expenditure on routine repairs and maintenance that does not add to the value of the asset is not capitalised.
Property, plant and equipment are stated at the lower of net current replacement cost and recoverable amount
and is therefore reported at fair value and where held at depreciated historical cost, this is regarded as a suitable
proxy for fair value. On initial recognition, these assets are measured at cost, including any costs such
as installation directly attributable to bringing them into working condition. Indexation rates are not applied
to property, plant and equipment assets as the impact on the net book value of the those assets would not
be material.
1.3 Intangible assets
Intangible assets are assets that do not have physical substance but are identified and controlled by the
Commission and have a life of more than one year, such as software licences. Expenditure on intangible assets
is initially recorded at cost. This includes directly attributable costs for bringing the intangible asset into use.
Intangible assets will only be recognised where these costs exceed £1,000. Once the assets have been brought
into use, they are amortised at a rate calculated to write them down to an estimated residual value on a straight
line basis over their estimated useful life. Intangible assets are therefore reported at fair value and where held
at depreciated historical cost, this is regarded as a suitable proxy for fair value. Indexation is not applied to
intangible assets as these are primarily assets that have been developed in-house for the specific purposes of the
Commission and do not, therefore, have an onward sale value.
1.4 Depreciation and Amortisation
Property, plant and equipment and intangible assets are depreciated/amortised at a rate calculated to write down
their value to their estimated residual value on a straight line basis over their estimated useful life. Depreciation
on property, plant and equipment, and amortisation on intangible assets, is applied in the year of acquisition for
purchased assets or, in the case of assets under construction, in the year which the asset is brought into use.
Asset life is normally in the following ranges:
Information technology .................... 2-7 years
Furniture and fittings .................... 5-7 years
Leasehold improvements .................... Term of lease or initial break point
IT databases .................... 7 years
Websites .................... 7 years
62 Annual Report and Accounts 2010-11

1.5 Impairments
The value of non-current assets is reviewed at the end of each financial year for evidence of reduction in value.
Where an impairment is identified that is attributable to the clear consumption of economic benefit, the loss is
charged to the Statement of Comprehensive Net Expenditure.
1.6 Inventories
The Commission only holds inventories (stock) of stationery, computer spares and similar consumables for its
own use. Due to the nature and low value of these items, they are not recorded in the Statement of Financial
Position. The full cost of these items is recognised in the Statement of Comprehensive Net Expenditure at the
point they are received.
1.7 Operating income
Operating income is income which relates directly to the operating activities of the Commission. It includes income
appropriated in aid of the Estimate and income from the Consolidated Fund. Operating income is stated net of VAT.
Income is recognised at the point there is a legal obligation on the other party to pay the Commission.
1.8 Administration expenditure
Administration expenditure reflect the costs of running the Commission. The classification of expenditure as
administration follows the definition of administration costs set by HM Treasury.
1.9 Foreign currency
As part of the Commission’s International Programme, work is undertaken in foreign countries and expenditure
will be incurred in the local currency. These transactions are converted into £ sterling using the exchange rate at,
or close to, the official exchange rate on the date of the transaction. The International Programme also receives
funding from the Canadian Government in $ Canadian. This funding is converted into £ sterling on the date that
the funds are received by the Commission.
1.10 Pensions
Past and present employees are covered by the provisions of the Principal Civil Service Pension Scheme, which
are described in Note 8. The defined benefit schemes are unfunded and non-contributory except in respect of
dependents’ benefits. The Commission recognises the expected cost of these elements on a systematic and rational
basis over the period during which it benefits from employees’ services by payment to the Principal Civil Service
Pension Scheme (PCSPS) of amounts calculated on an accruing basis. Liability for payment of future benefits is a
charge on the PCSPS and is not, therefore, reflected in the Commission’s Statement of Financial Position. In respect
of the defined contribution schemes, the Commission recognises the contributions payable for the year.
1.11 Leases
The Commission holds only operating leases as recognised under International Accounting Standard (IAS) 17. A
lease is classified as a finance lease if a substantial element of the risk and reward associated with ownership of
the asset is borne by the Commission. All other leases are classified as operating leases. Rental payments due in
respect of operating leases are charged directly to the Statement of Comprehensive Net Expenditure on a straight
line basis over the term of the lease.
63Annual Report and Accounts 2010-11

Resource Accounts
1.12 Provisions
Where the Commission incurs a legal or constructive liability to make a payment, the amount and timing of which
are uncertain at the Statement of Financial Position date, a provision is created on the basis of the best estimate of
the expenditure required to settle the obligation. Where the effect of the time value of money is significant, the
estimated risk-adjusted cash flows are discounted using the real rate set by the Treasury (currently 2.8%).
1.13 Value added tax
Most of the activities of the Commission are outside the scope of VAT. In general, output tax does not apply and
input tax on purchases is not recoverable. Irrecoverable VAT on revenue expenditure is charged to the Statement of
Comprehensive Net Expenditure. VAT incurred on capital expenditure is included within the cost of property, plant
and equipment and intangible assets. Where output VAT is charged or input VAT is recoverable, the amounts are
stated net of VAT.
1.14 Contingent liabilities
In addition to contingent liabilities disclosed in accordance with IAS 37, the Commission discloses for Parliamentary
reporting and accountability purposes certain statutory and non-statutory contingent liabilities where the likelihood
of a transfer of economic benefit is remote, but which have been reported to Parliament in accordance with
the requirements of Managing Public Money. Where the time value of money is material, contingent liabilities
which are required to be disclosed under IAS 37 are stated at discounted amounts and the amount reported to
Parliament noted separately. Contingent liabilities that are not required to be disclosed by IAS 37 are stated at the
amounts reported to Parliament.
1.15 Significant estimates and judgements
The Commission is required, when applying its accounting policies, to make certain judgements, estimates and
associated assumptions relating to assets, liabilities, income and expenditure. These judgements, estimates and
associated assumptions are based on knowledge of current facts and circumstances, assumptions concerning past
events and forecasts of future events and actions. Actual results may differ from these estimates.
2 Segmental analysis
For internal reporting purposes, the Charity Commission operates two segments: Charity Commission core business
and the International Programme. The International Programme is reported separately as it has its own funding
streams and is operated as a distinct unit within the Commission. The primary financial statements record the total
income, expenditure, assets and liabilities of the Charity Commission and the International Programme. The note
below shows the amounts attributable to the two segments.
64 Annual Report and Accounts 2010-11
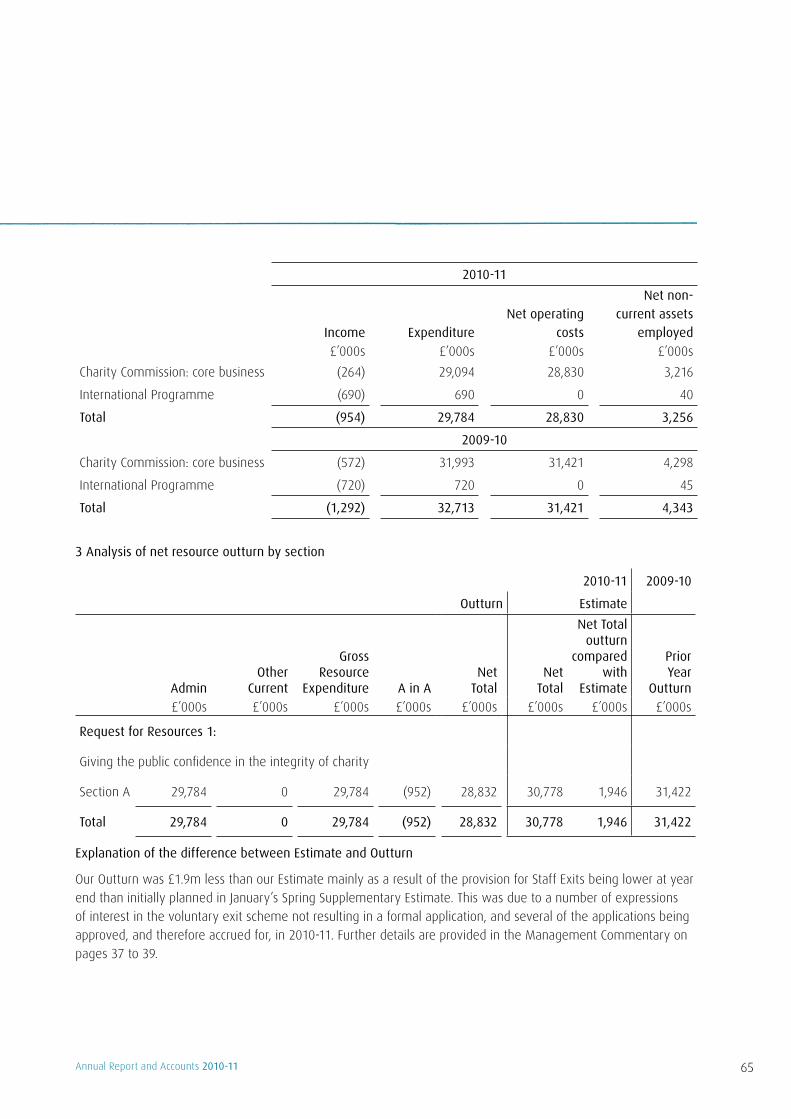
2010-11
Income ExpenditureNet operating
costs
Net non-current assets
employed
£’000s £’000s £’000s £’000s
Charity Commission: core business (264) 29,094 28,830 3,216
International Programme (690) 690 0 40
Total (954) 29,784 28,830 3,256
2009-10
Charity Commission: core business (572) 31,993 31,421 4,298
International Programme (720) 720 0 45
Total (1,292) 32,713 31,421 4,343
3 Analysis of net resource outturn by section
2010-11 2009-10
Outturn Estimate
AdminOther
Current
Gross Resource
Expenditure A in ANet
TotalNet
Total
Net Total outturn
compared with
Estimate
Prior Year
Outturn
£’000s £’000s £’000s £’000s £’000s £’000s £’000s £’000s
Request for Resources 1:
Giving the public confidence in the integrity of charity
Section A 29,784 0 29,784 (952) 28,832 30,778 1,946 31,422
Total 29,784 0 29,784 (952) 28,832 30,778 1,946 31,422
Explanation of the difference between Estimate and Outturn
Our Outturn was £1.9m less than our Estimate mainly as a result of the provision for Staff Exits being lower at year
end than initially planned in January’s Spring Supplementary Estimate. This was due to a number of expressions
of interest in the voluntary exit scheme not resulting in a formal application, and several of the applications being
approved, and therefore accrued for, in 2010-11. Further details are provided in the Management Commentary on
pages 37 to 39.
65Annual Report and Accounts 2010-11

Resource Accounts
4 Reconciliation of outturn to net operating cost against Administration Budget
4.1 Reconciliation of net outturn to net operating cost
2010-11 2009-10
Note OutturnSupply
Estimate
Outturn compared with
Estimate Outturn
£’000s £’000s £’000s £’000s
Net Resource Outturn 3 28,832 30,778 1,946 31,422
Net Supply Income (CFERs) 6 (2) 0 2 (1)
Net Operating Costs 28,830 30,778 1,948 31,421
4.2 Outturn against final Administration Budget
2010-11 2009-10
Budget Outturn Outturn
£’000s £’000s £’000s
Gross Administration Budget 31,778 29,784 32,713
Income allowable against the Administration Budget (1,000) (952) (1,291)
Net outturn against final Administration Budget 30,778 28,832 31,422
66 Annual Report and Accounts 2010-11
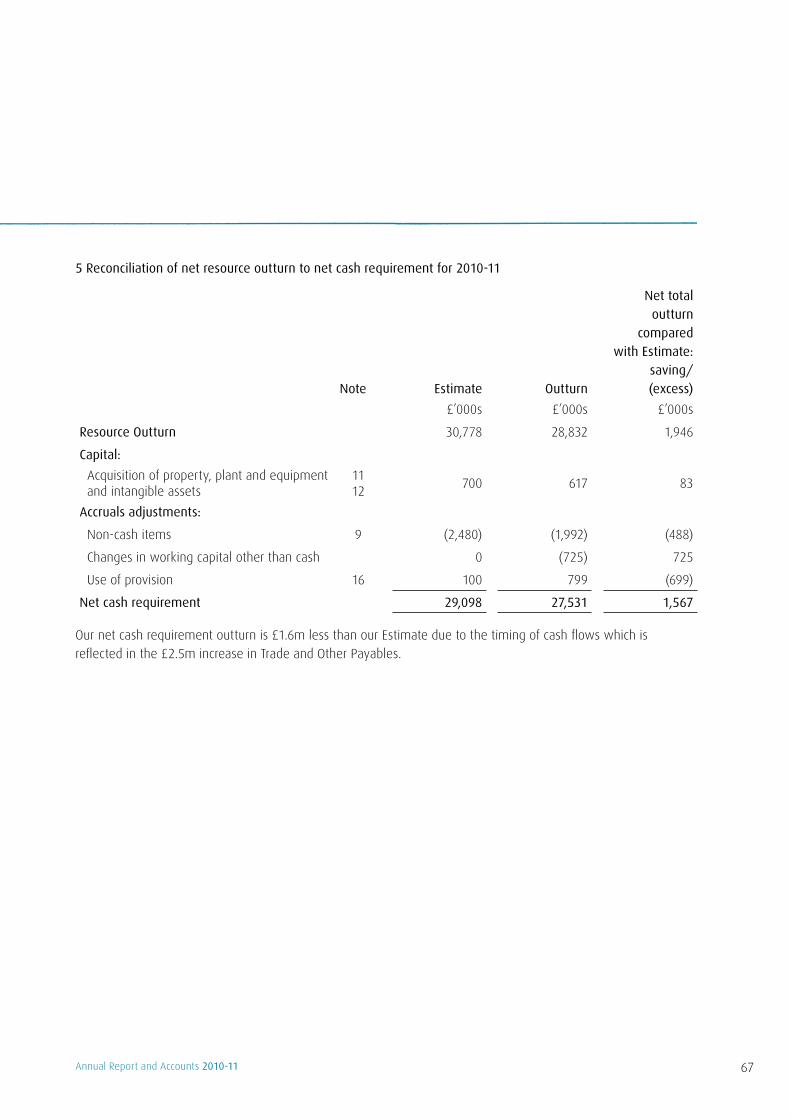
5 Reconciliation of net resource outturn to net cash requirement for 2010-11
Note Estimate Outturn
Net total outturn
compared with Estimate:
saving/ (excess)
£’000s £’000s £’000s
Resource Outturn 30,778 28,832 1,946
Capital:
Acquisition of property, plant and equipment and intangible assets
11 12
700 617 83
Accruals adjustments:
Non-cash items 9 (2,480) (1,992) (488)
Changes in working capital other than cash 0 (725) 725
Use of provision 16 100 799 (699)
Net cash requirement 29,098 27,531 1,567
Our net cash requirement outturn is £1.6m less than our Estimate due to the timing of cash flows which is
reflected in the £2.5m increase in Trade and Other Payables.
67Annual Report and Accounts 2010-11

Resource Accounts
6 Analysis of income payable to the Consolidated Fund
In addition to Appropriations in Aid, the following income relates to the Commission and is payable to the
Consolidated Fund (cash receipts being shown in italics):
Forecast 2010-11 Outturn 2010-11
Income Receipts Income Receipts
£’000s £’000s £’000s £’000s
Operating income and receipts – excess A in A 0 0 0 0
Other operating income and receipts not classified as A in A
0 0 2 2
Sub total 0 0 2 2
Non-operating income and receipts – excess A in A
Other non-operating income and receipts not classified as A in A
0 0 0 0
Other amounts collectable on behalf of the Consolidated Fund
0 0 0 0
Excess cash surrenderable to the Consolidated Fund
0 0 0 0
Total income payable to the Consolidated Fund 0 0 2 2
7 Reconciliation of income recorded within the Statement of Comprehensive Net Expenditure to operating income payable to the Consolidated Fund
2010-11 2009-10
£’000s £’000s
Operating income 954 1,292
Income authorised to be appropriated in aid (952) (1,291)
Operating income payable to the Consolidated Fund 2 1
68 Annual Report and Accounts 2010-11

8 Staff numbers and related costs
2010-11 2009-10
£’000s £’000s
Wages and salaries 13,864 14,317
Social security costs 1,076 1,098
Other pension costs 2,623 2,696
Agency staff 180 556
Severance costs 1,716 98
Increase/(decrease) in IAS 19: employee benefits accrual (82) 27
Total 19,377 18,792
Charged to Capital (36) (19)
Total Net Costs 19,341 18,773
As a non-Ministerial Government Department, the Commission’s pay costs relate to staff. There are no Ministers
or Advisors.
The Principal Civil Service Pensions Scheme (PCSPS), of which most of the Commission’s employees are members,
is an unfunded multi-employer defined benefit scheme but the Commission is unable to identify its share of the
underlying assets and liabilities. A full actuarial valuation was carried out at 31 March 2007. Details can be found in
the resource accounts of the Cabinet Office: Civil Superannuation (www.civilservice-pensions.gov.uk).
For 2010-11, employer’s contributions of £2.23m were payable to the PCSPS (£2.298m in 2009-10) at rates in the
range 16.7% to 24.3% (16.7% to 24.3% in 2009-10) of pensionable pay, based on salary bands. The scheme’s
actuary reviews employer contributions every four years following a full scheme valuation. From 2011-12, the
rates will be in the range of 16.7% to 24.3%. The contribution rates are set to meet the cost of the benefits
accruing during 2010-11 to be paid when the member retires and not the benefits paid during this period to
existing pensioners.
Employees can opt to open a partnership pension account, which is a stakeholder pension with an employer
contribution. Employer’s contributions of £366,801 were paid to one or more of a panel of three appointed
stakeholder pension providers (£368,890 in 2009-10). Employer contributions are age-related and range from 3%
to 12.5% (3% to 12.5% in 2009-10) of pensionable pay. Employers also match employee contributions up to 3% of
pensionable pay. In addition, employer contributions of £1,183, 0.8% (£1,901, 0.8% in 2009-10) of pensionable pay,
were payable to the PCSPS to cover the cost of future provision of lump sum benefits on death in service and ill
health retirement of these employees.
Contributions due to the partnership pension providers at the Statement of Financial Position date were £32,971
(£31,882 in 2009-10). Contributions prepaid at that date were £nil (£nil in 2009-10).
69Annual Report and Accounts 2010-11

Two staff (nil staff in 2009-10) retired early on ill health grounds; the total additional accrued pension liabilities
amounted to £59,530 (£nil in 2009-10).
Average number and cost of persons employed
The average number of full time equivalent (FTE) persons, including senior management, employed during the
year and their related cost, were as follows:
2010-11 2009-10 2010-11 2009-10
Number Number £’000s £’000s
Charity Commission staff 436 466 19,161 18,217
Agency staff 6 17 180 556
Total 442 483 19,341 18,773
Reporting of Civil Service and other compensation schemes - exit packages
In order to maintain expenditure within the reduced funding levels during the next Spending Review period
(2011-2015), the Commission will need to reduce the size of its workforce. A Voluntary Exit Scheme, using the
terms prescribed in the Civil Service Compensation Scheme, was launched in January 2011. As at 31 March 2011,
45 departures had been agreed under the scheme. The cost of the associated compensation payments is reflected
in the Statement of Comprehensive Net Expenditure as this cost is recognised at the point the departure is agreed
and not when the exit occurs.
The following additional staff exits were agreed in the year and the costs are reflected in the Statement of
Comprehensive Net Expenditure:
one exit under Approved Early Retirement terms;•
four exits with statutory redundancy terms for staff whose fixed term contract was terminated;•
three exits with retirement costs for staff whose fixed term contract was terminated;•
two ill-health retirements; and•
one exit with a compensation payment agreed with HM Treasury and not covered by the CSCS.•
Resource Accounts
70 Annual Report and Accounts 2010-11

The table below analyses these exits by cost bandings. Figures for 2009-10 are included in brackets.
Exit package cost band Number of compulsory redundancies
Number of other departures agreed
Total number of exit packages
Less than £10,000 0
(0)
17
(1)
17
(1)
£10,000 - £24,999 0
(0)
15
(0)
15
(0)
£25,000 - £49,999 0
(0)
12
(0)
12
(0)
£50,000 - £99,999 0
(0)
10
(1)
10
(1)
£100,000- £149,999 0
(0)
1
(0)
1
(0)
£150,000- £200,000 0
(0)
1
(0)
1
(0)
Total number of exit packages 0
(0)
56
(2)
56
(2)
Total resource cost (£) 0
(0)
1,715,667
(98,203)
1,715,667
(98,203)
Unless otherwise stated, redundancy and other departure costs have been paid in accordance with the provisions
of the Civil Service Compensation Scheme (CSCS), a statutory scheme made under the Superannuation Act 1972.
Where the Commission has agreed early retirements, the additional costs are met by the Commission and not by
the Civil Service pension scheme. Ill-health retirement costs are met by the pension scheme and are not included
in the table.
71Annual Report and Accounts 2010-11

Resource Accounts
9 Other administration costs
2010-11 2009-10
Note £’000s £’000s
Rentals under operating leases 1,621 2,309
Interest charges (incurred on finance leases) 0 7
1,621 2,316
Non-cash items:
Depreciation 11 314 303
Amortisation 12 1,231 1,121
Revaluation of assets 11 & 12 12 16
Loss on disposal of fixed asset 11 & 12 46 3
Capital Write-off 11 & 12 104 0
Cost of capital charge 1 0 71
Auditor’s remuneration 59 65
Provisions provided in year 16 570 125
Provisions written back in year 16 (344) 0
1,992 1,704
Other expenditure:
Personnel related 1,097 1,971
Accommodation 1,190 2,250
Office services 2,042 2,870
Contracted Services/Consultancy 398 582
Specialist services 2,103 2,192
Losses and special payments 22 0 55
6,830 9,920
Total expenditure 10,443 13,940
72 Annual Report and Accounts 2010-11

10 Income
2010-11 2009-10
£’000s £’000s
Income received in respect of the International Programme:
from other UK Government Departments 665 721
from non-UK entities 25 0
Income received for rendering services to or on behalf of other UK Government Departments
248 496
Other income 16 75
954 1,292
11 Property, plant and equipment
Information Technology
Furniture & Fittings
Leasehold Improvements Total
£’000s £’000s £’000s £’000s
2010-11
Cost or valuation
At 1 April 2010 674 383 691 1,748
Additions 265 48 0 313
Re-lifed assets 1 0 0 1
Disposals (64) (15) 0 (79)
Revaluation 0 0 0 0
At 31 March 2011 876 416 691 1,983
Depreciation
At 1 April 2010 448 302 148 898
Charged in year 122 44 148 314
Disposals (60) (15) 0 (75)
Revaluations 9 4 0 13
At 31 March 2011 519 335 296 1,150
Net book value at 31 March 2010 226 81 543 850
Net book value at 31 March 2011 357 81 395 833
73Annual Report and Accounts 2010-11
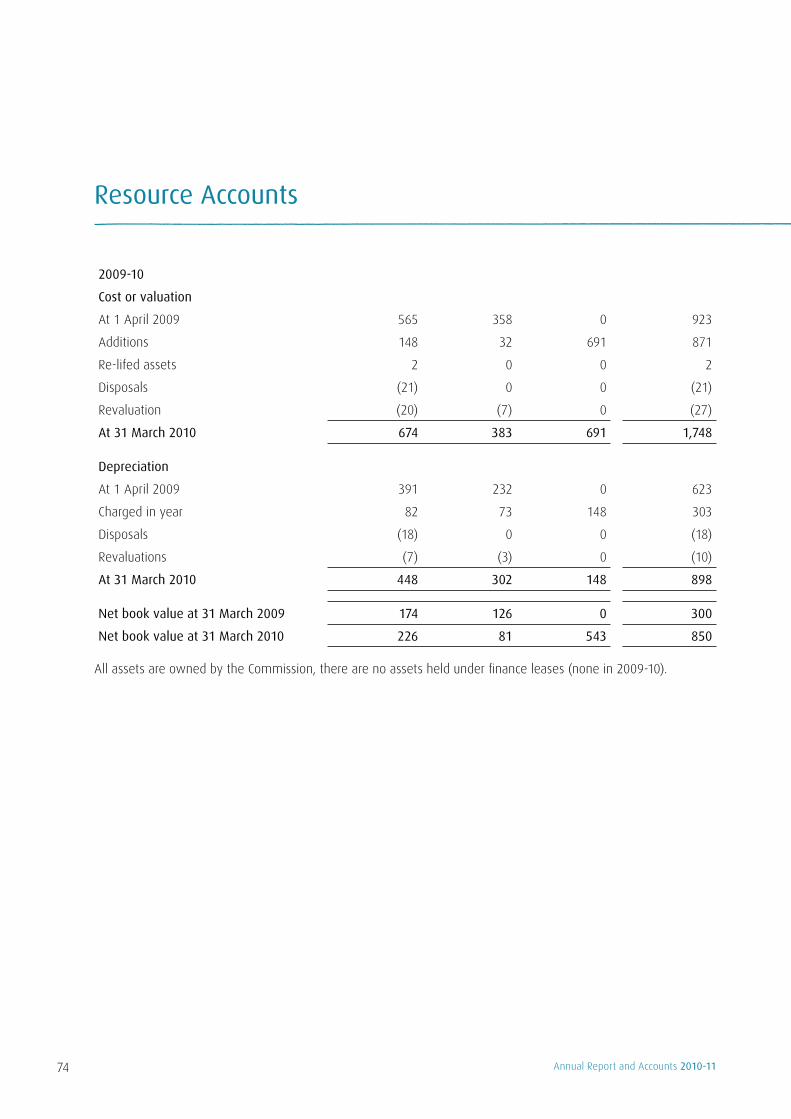
Resource Accounts
2009-10
Cost or valuation
At 1 April 2009 565 358 0 923
Additions 148 32 691 871
Re-lifed assets 2 0 0 2
Disposals (21) 0 0 (21)
Revaluation (20) (7) 0 (27)
At 31 March 2010 674 383 691 1,748
Depreciation
At 1 April 2009 391 232 0 623
Charged in year 82 73 148 303
Disposals (18) 0 0 (18)
Revaluations (7) (3) 0 (10)
At 31 March 2010 448 302 148 898
Net book value at 31 March 2009 174 126 0 300
Net book value at 31 March 2010 226 81 543 850
All assets are owned by the Commission, there are no assets held under finance leases (none in 2009-10).
74 Annual Report and Accounts 2010-11

12 Intangible assets
IT databases Websites
Assets under
construction Total
£’000s £’000s £’000s
2010-11
Cost or valuation
At 1 April 2010 7,801 42 763 8,606
Additions Transfers Disposals Revaluation (write-off)
0 963
(134) 0
0 0 0 0
304 (963)
0 (104)
304 0
(134) (104)
At 31 March 2011 8,630 42 0 8,672
Amortisation
At 1 April 2010 5,078 35 0 5,113
Charged in year Disposals
1,224 (95)
7 0
0 0
1,231 (95)
At 31 March 2010 6,207 42 0 6,249
Net book value at 31 March 2010 2,723 7 763 3,493
Net book value at 31 March 2011 2,423 0 0 2,423
2009-10
Cost or valuation
At 1 April 2009 7,801 42 320 8,163
Additions 0 0 443 443
At 31 March 2010 7,801 42 763 8,606
Amortisation
At 1 April 2009 3,963 29 0 3,992
Charged in year 1,115 6 0 1,121
At 31 March 2010 5,078 35 0 5,113
Net book value at 31 March 2009 3,838 13 320 4,171
Net book value at 31 March 2010 2,723 7 763 3,493
All intangible assets are owned by the Commission, no intangible assets are held under finance leases (£nil in
2009-10). Assets under construction represent expenditure on IT and IS developments.
75Annual Report and Accounts 2010-11
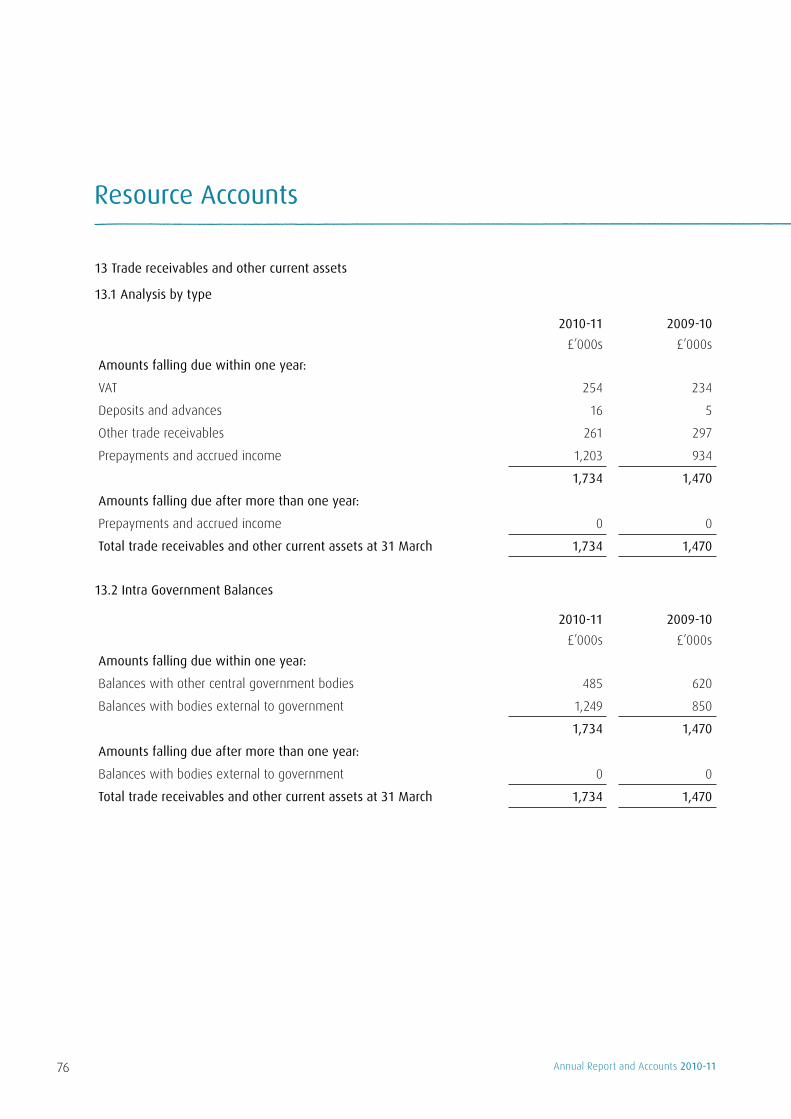
Resource Accounts
13 Trade receivables and other current assets
13.1 Analysis by type
2010-11 2009-10
£’000s £’000s
Amounts falling due within one year:
VAT 254 234
Deposits and advances 16 5
Other trade receivables 261 297
Prepayments and accrued income 1,203 934
1,734 1,470
Amounts falling due after more than one year:
Prepayments and accrued income 0 0
Total trade receivables and other current assets at 31 March 1,734 1,470
13.2 Intra Government Balances
2010-11 2009-10
£’000s £’000s
Amounts falling due within one year:
Balances with other central government bodies 485 620
Balances with bodies external to government 1,249 850
1,734 1,470
Amounts falling due after more than one year:
Balances with bodies external to government 0 0
Total trade receivables and other current assets at 31 March 1,734 1,470
76 Annual Report and Accounts 2010-11

14 Cash and cash equivalents
2010-11 2009-10
£’000s £’000s
Balance at 1 April 47 1,116
Net change in cash and cash equivalent balances 1,522 (1,069)
Balance at 31 March 1,569 47
The following balances at 31 March were held at:
Government Banking Services 1,568 46
Cash in hand 1 1
Balance at 31 March 1,569 47
15 Trade payables and other current liabilities
15.1 Analysis by type
2010-11 2009-10
£’000s £’000s
Amounts falling due within one year:
Taxation and social security 604 652
Trade payables 895 1,172
Other payables 6 69
Staff exit costs 1,453 0
Accruals and deferred income 330 588
Amounts issued from the Consolidated Fund for Supply but not spent at year end
1,567 46
Consolidated Fund extra receipts received and receivable due to be paid to the Consolidated Fund
2 1
4,857 2,528
Amounts falling due after more than one year:
Staff exit costs 185 0
Total trade payables and other current liabilities at 31 March 5,042 2,528
77Annual Report and Accounts 2010-11

Resource Accounts
15.2 Intra Government balances
2010-11 2009-10
£’000s £’000s
Amounts falling due within one year:
Balances with other central government bodies 2,205 699
Balances with bodies external to government 2,834 1,829
5,039 2,528
Amounts falling due after more than one year:
Balances with bodies external to government 0 0
Total trade payables and other current liabilities at 31 March 5,039 2,528
16 Provision for liabilities and charges
Early departure
costs
Property dilapidation
Legal Staff exit costs
Total 2010-11
Total 2009-10
£’000s £’000s £’000s £’000s £’000s £’000s
Balance at 1 April 245 1,045 0 0 1,290 1,341
Provided in year 27 80 100 363 570 125
Provision utilised in year (98) (701) 0 0 (799) (176)
Provision written back 0 (344) 0 0 (344) 0
Balance at 31 March 174 80 100 363 717 1,290
16.1 Analysis of expected timing of cash flows
Payment by 31 March 2012
Payment after 1 April 2012 Total
£’000s £’000s £’000s
Early departure costs 69 105 174
Property dilapidation 0 80 80
Legal 100 0 100
Staff exit costs 363 0 363
Total 532 185 717
78 Annual Report and Accounts 2010-11

16.2 Early departure costs
The Commission meets the additional cost of benefits beyond the normal PCSPS benefits in respect of employees
who retire early by paying the required amounts annually to the PCSPS over the period between early departure
and normal retirement date. The Commission provides in full for this when the early retirement programme
becomes binding on them, by establishing a provision for the estimated payments discounted by the Treasury
discount rate of 2.8% in real terms. In past years, the Commission paid in advance some of its liability for early
retirement by making a payment to the Paymaster General’s account at the Bank of England for the credit of the
Civil Superannuation Vote. The balance remaining is treated as a prepayment.
16.3 Property dilapidation
The Commission moved its London office in June 2009 and surrendered one floor it leased in the Liverpool Office
in May 2010. The respective landlords for these properties submitted claims for dilapidations to the Commission.
These claims were settled in 2010-11 at a value less than the amount provided. The provision not required has
been written back to the Statement of Comprehensive Net Expenditure. A new provision has been created for
dilapidations on our current London office which we anticipate moving from in 2012-13.
16.4 Legal
The decisions of the Commission are open to challenge in the Charity Tribunal and in some instances, the High
Court. Where a challenge against the Commission is successful, the Commission may, in certain circumstances, be
liable for the costs incurred by the other party, particularly if the appeal is in the High Court. This provision relates
to such costs and covers cases considered by the High Court and Court of Appeal during the year on which a
decision had not yet been issued by 31 March 2011.
16.5 Staff exit costs
This provision relates to the cost of CSCS payments to staff who have applied for the Voluntary Exit Scheme but
whose application had not been agreed by the Commission by 31 March 2011. The expenditure to create this
provision is not included in Note 8 but is instead recorded in Note 9 as a non-cash cost in order to demonstrate
that the amount is funded by AME until the provision is utilised.
17 Capital commitments
At 31 March 2011, the Commission had £nil capital commitments (£0.09m as at 31 March 2010).
79Annual Report and Accounts 2010-11

Resource Accounts
18 Commitments under leases
18.1 Operating leases
Total future minimum lease payments under operating leases are given in the table below, analysed according to
the period in which the lease expires.
2010-11 2009-10
£’000s £’000s
Obligations under operating leases comprise:
Buildings
Not later than one year 1,245 1,245
Later than one year and not later than five years 4,527 4,940
Later than five years 980 1,392
6,752 7,577
Other
Not later than one year 0 35
Later than one year and not later than five years 0 0
Later than five years 0 0
0 35
19 Other financial commitments
The Commission has no material financial commitments other than those disclosed in Notes 17 and 18 (£nil in
2009-10).
20 Financial instruments
As the cash requirements of the Commission are met through the Estimates process, financial instruments play a
more limited role in creating and managing risk than would apply to a non-public sector body of a similar size. The
majority of financial instruments relate to contracts for non-financial items in line with the Commission’s expected
purchase and usage requirements and the Commission is therefore exposed to minimal credit, liquidity, foreign
currency or market risk.
21 Contingent liabilities disclosed under IAS 37
The Commission had no contingent liabilities at 31 March 2011 (£nil as at 31 March 2010).
80 Annual Report and Accounts 2010-11

22 Losses and special payments
22.1 Losses statement
2010-11 2009-10
Number £’000s Number £’000s
Total losses for the year 0 0 0 0
22.2 Special payments
2010-11 2009-10
Number £’000s Number £’000s
Total special payments for the year 1 0 4 55
There was one special payment in 2010-11 for £150 (four in 2009-10).
23 Related party transactions
During the year 2010-11, no Board Member, key manager or other related parties undertook any material
transactions with the Commission. As an entity, the Commission had a small number of transactions with other
government departments and other central government bodies. These transactions were with the Foreign and
Commonwealth Office, the Department for Communities and Local Government and the Charity Commission for
Northern Ireland and are reported in the Statement of Parliamentary Supply as Appropriations in Aid (A in A). All
transactions have been undertaken on arm’s length terms.
24 Events after the Statement of Financial Position date
There have been no events after the Statement of Financial Position date requiring an adjustment to the financial
statements. The Annual Report and Accounts were authorised for issue on the same date that the Comptroller and
Auditor General signed his Certificate.
81Annual Report and Accounts 2010-11
GlossaryAccruals Income or expenditure relating to the financial year which had not been received or paid by the financial year end
but is reflected in the financial statements.
Amortisation The writing off of the value of an asset over the useful life of that asset.
Annually Managed Expenditure (AME) Expenditure incurred by the Commission that falls outside the scope of DEL control totals. In general, this relates to
the creation of and increase to provisions.
Appropriations in Aid (A in A) Income received by the Commission, in addition to that voted to it from the Consolidated Fund, that Parliament
authorises the Commission to retain to offset related expenditure. Any income over the authorised limit must be
surrendered to the Consolidated Fund.
Capital expenditure Expenditure greater than £1,000 on the acquisition or construction of plant, property and equipment and intangible
assets, or on enhancing the value of such assets.
Comprehensive Spending Review A three year plan setting out the aims and objectives of the Commission and the related funding and
spending budgets.
Consolidated Fund The Government’s “current account” operated by HM Treasury and used to finance central government spending.
The main source of income to the Fund is taxation receipts.
Consolidated Fund Extra Receipts (CFERs) Income received by the Commission which we are not authorised by Parliament to use to offset our expenditure.
CFERs are paid into the Consolidated Fund.
Contingent liability A possible liability to make a future payment that is dependent on the outcome of certain events, for example,
legal action.
Corporate governance The systems and processes by which organisations are directed and controlled to ensure they meet their aims and
fulfil statutory requirements.
Cost of Capital charge A charge to reflect the opportunity cost of Government funding assets of the Commission. It is a notional charge
included in the financial statements to ensure the full cost of services is recognised. The charge was abolished
from 1 April 2010.
Resource Accounts
82 Annual Report and Accounts 2010-11

Delegated Expenditure Limit (DEL) A control total specified for the Commission. Separate DELs are set for Revenue and Capital. The Commission’s
expenditure cannot exceed its DEL.
Depreciation The measure of wearing out, consumption or other reduction in the useful economic life of non-current assets.
End Year Flexibility (EYF) Equivalent to a reserve, EYF is a mechanism that allows any unspent DEL at year end to be carried forward into
future financial years. Access to EYF was withdrawn in 2010-11.
Estimate/Supply Estimate A summary of the resources and cash voted by Parliament to the Commission for the financial year, against which
we monitor our expenditure.
Excess Vote Additional funding that is approved by Parliament where expenditure by a government department exceeds the
Estimate for the financial year.
Finance lease A lease that transfers substantially the risks and rewards of ownership of the asset to the lessee.
Financial Instrument A contract that gives rise to a financial asset for one party and a financial liability to another party.
Financial Reporting Manual (FreM) The technical accounting guide to preparing the financial statements of Government Departments, written by
HM Treasury.
General Fund This represents the historic costs of the total assets less the liabilities of the Commission. It is included in
Taxpayers’ Equity in the Statement of Financial Position.
Impairment The reduction in value of plant, property and equipment and intangible assets reflecting either the consumption of
economic benefits, such as obsolescence, or physical damage, or a general fall in prices.
International Financial Reporting Standards (IFRS) The financial reporting standards under which the Commission’s financial statements are prepared. IFRSs are set by
the International Accounting Standards Board.
Managing Public Money HM Treasury publication setting out the principles Government Departments should follow when dealing
with resources.
Materiality The extent to which a misstatement or omission in the financial statements might reasonably be expected to
impact on the understanding of the reader.
83Annual Report and Accounts 2010-11

84 Annual Report and Accounts 2010-11
National Audit Office (NAO) The external auditors of the Commission.
Net book value The amount at which non current assets are included in the Statement of Financial Position after providing for
depreciation and revaluations.
Net Cash Requirement The amount of cash to be released from the Consolidated Fund to fund the Commission’s expenditure for the
financial year. The Net Cash Requirement will be different from the DEL as DEL takes into account “non-cash”
expenditure such as depreciation and notional charges for which there is no physical transfer of cash.
Net current replacement cost The current cost of replacing or recreating an asset in its existing use.
Net resource outturn The net total of income and expenditure consumed by the Commission during the financial year.
Non cash transactions Items of expenditure that are recognised in the Commission’s financial statements but do not give rise to the
physical transfer of cash, for example, depreciation.
Operating lease A lease where the risks and rewards of ownership of the asset rest substantially with the lessor.
Outturn The actual level of expenditure and income for the financial year.
Prepayment Payment in the current financial year for goods or services to be received or provided in the next financial year.
Provisions Amounts set aside to fund known liabilities relating to the current or previous financial years, the exact timing and
amount of which is uncertain.
Request for Resources (RfR) The unit of Parliamentary control by which resources for the Commission are granted. A separate RfR is given for
each function of a Government Department. The Commission only has one function designated by Parliament and
therefore only has one RfR.
Revenue expenditure Expenditure on day-to-day activities and other payments that do not give rise to an asset with a life of more than
one financial year.
Supply The resources voted to the Commission by Parliament.
Resource Accounts

85Annual Report and Accounts 2010-11
Trade payables Formerly classified as Creditors. These are amounts the Commission owes for goods and services received in the
financial year for which payment has not been made by the year end.
Trade receivables Formerly classified as Debtors. These are amounts owing to the Commission for goods or services provided in the
financial year for which payment has not been received by the year end.
Vote The process by which Parliament approves the Commission’s funding requested in our Estimate.

86 Annual Report and Accounts 2010-11


Published by TSO (The Stationery Office) and available from:
Online www.tsoshop.co.uk
Mail, telephone, fax and email TSO
PO Box 29, Norwich NR3 1GN
Telephone orders/general enquiries: 0870 600 5522
Order through the Parliamentary Hotline Lo-Call 0845 7 023474
Fax orders: 0870 600 5533
Email: [email protected]
Textphone: 0870 240 3701
The Parliamentary Bookshop
12 Bridge Street, Parliament Square
London SW1A 2JX
Telephone orders/general enquiries: 020 7219 3890
Fax orders: 020 7219 3866
Email: [email protected]
Internet: http://www.bookshop.parliament.uk
TSO@Blackwell and other accredited agents
Customers can also order publications from: TSO Ireland
16 Arthur Street, Belfast BT1 4GD
Telephone orders/general enquiries: 028 9023 8451
Fax orders: 028 9023 5401