characterization of tensile deformation in az91 mg alloy
TRANSCRIPT
UNF Digital Commons
UNF Graduate Theses and Dissertations Student Scholarship
2016
Characterization of Tensile Deformation in AZ91Mg Alloy CastingsOgun UnalUniversity of North Florida
This Master's Thesis is brought to you for free and open access by theStudent Scholarship at UNF Digital Commons. It has been accepted forinclusion in UNF Graduate Theses and Dissertations by an authorizedadministrator of UNF Digital Commons. For more information, pleasecontact Digital Projects.© 2016 All Rights Reserved
Suggested CitationUnal, Ogun, "Characterization of Tensile Deformation in AZ91 Mg Alloy Castings" (2016). UNF Graduate Theses and Dissertations.632.https://digitalcommons.unf.edu/etd/632

CHARACTERIZATION OF TENSILE DEFORMATION
IN AZ91 MG ALLOY CASTINGS
By
Ogűn Űnal
A thesis submitted to School of Engineering
In partial fulfillment of the requirements for the degree of
Master of Science in Mechanical Engineering
UNIVERSITY OF NORTH FLORIDA
COLLEGE OF COMPUTING, ENGINEERING and CONSTRUCTION
April, 2016
Unpublished work © Ogűn Űnal

CERTIFICATION OF APPROVAL
This thesis titled “Characterization of Tensile Deformation in AZ91 Mg Alloy Castings” of
Ogűn Űnal is approved by:
Date
Dr. Murat Tiryakioǧlu, Ph.D., CQE, Advisor
Dr. Paul Eason, Ph.D., PE, Committee Member
Dr. Stephen Stagon, Ph.D., Committee Member
Accepted for the School of Engineering:
Director of School of Engineering,
Dr. Murat Tiryakioǧlu, Ph.D., CQE
Accepted for the College of Computing, Engineering and Construction
Dr. Mark A. Tumeo, Ph.D., PE,
Dean of the College of Computing, Engineering and Construction
Accepted for the University:
Dr. John Kantner, Ph.D.
Dean of the Graduate School

DEDICATION
This thesis is dedicated to my professor Dr. Murat Tiryakioǧlu
who has been a constant source of knowledge and inspiration to me.
Without him, I would be just another engineer.
“Non Scholae Sed Vitae Discimus”
iii

ACKNOWLEDGMENTS
The completion of this thesis could not have been possible without the guidance
and participation of my colleagues. Their contributions are sincerely appreciated and
gratefully acknowledged. It was a priceless pleasure and great experience working with
great faculty and also being a part of a university like University of North Florida.
I would like to express my deep appreciation to Dr. Murat Tiryakioǧlu for his
patience, endless support and understanding spirit. It was a great honor for me to work
under his supervision. His support was essential to my thesis and also to my life. His
wisdom made me a better engineer and a better person. His desire to see me happy,
healthy and successful is the most powerful motivation I can ever imagine.
I am thankful for the chance of working with Dr. Paul Eason and Dr. Stephen
Stagon for the valuable discussions which were essential to this degree.
I would like to thank Dr. Derya Dispinar for his support and supervision. His
encouragement for my career means a lot to me. I also thank my colleagues, Muhammet
Uludag, Huseyin Ozdes, for their support during my research.
Finally, I would like to thank my parents and my sister for their continued
support.
iv

TABLE OF CONTENTS
Certification of Approval ................................................................................................................ ii
Dedication ...................................................................................................................................... iii
Acknowledgments.......................................................................................................................... iv
Table of Contents .............................................................................................................................v
List of Tables ................................................................................................................................. vi
List of Figures ............................................................................................................................... vii
List of Symbol and Abbreviations ...................................................................................................x
Abstract .......................................................................................................................................... xi
Chapter 1: Introduction ..................................................................................................................14
Chapter 2: Literature review ..........................................................................................................17
2.1. Properties of Magnesium ....................................................................................................17 2.2. History of Applications of Magnesium Alloys ...................................................................18 2.3. Mg Alloy Designations .......................................................................................................20 2.4. Mg Alloy Castings and Casting Defects .............................................................................24 2.5. Casting Defects ...................................................................................................................24 2.6. Tensile Deformation ............................................................................................................27
2.6.1. Constitutive Equations and Work Hardening ..............................................................29 2.7. Concept of Ductility Potential and Quality Index ...............................................................31
2.8. Effect of Casting Defects on Tensile Properties in Cast Mg Alloys ...................................35 2.9. Statistics for Fracture ..........................................................................................................36
Chapter 3: Application of the Quality Index Approach for Mg Alloy Castings ............................39
Chapter 4: Experimental Procedure ...............................................................................................45
4.1. Alloy ....................................................................................................................................45 4.2. Tensile Testing ....................................................................................................................45
Chapter 5: Results and Discussion .................................................................................................47
5.1. Tensile Deformation ............................................................................................................52 5.2. Kocks – Mecking Analysis .................................................................................................58 5.3. Fractographs ........................................................................................................................70
Chapter 6: Conclusions ..................................................................................................................78
Chapter 7: Future Work .................................................................................................................80
References ......................................................................................................................................81
v

LIST OF TABLES
Table 1: Crystallographic indices of the slip and twinning planes and directions of
magnesium [21]. ........................................................................................................................... 18
Table 2: Codes of each element for the designation of magnesium alloys [31]. .......................... 21
Table 3: International temper designations [32]. .......................................................................... 22
Table 4: Most commonly used magnesium alloys and their characteristics [34]. ........................ 23
Table 5: The coefficients of Equation 9 for Al-7%Si-Mg, A201 and A206 alloys [60]. ............. 33
Table 6: Detailed information about data indicated in Figure 9 [13]. .......................................... 42
Table 7: Chemical composition in (wt. %) of AZ91D Mg alloy used in this study. .................... 45
Table 8: Tensile data for T4 and T6 conditions. ........................................................................... 48
Table 9: Estimated Weibull parameters for QT data. .................................................................... 51
Table 10: Estimated parameters for the constitutive equations for the two specimens and
the RMSE and R2 of each fit. ........................................................................................................ 55
Table 11: True stress – true plastic strain work hardening rate as function of true stress
for the four constitutive equations. ............................................................................................... 55
Table 12: Result of the Kocks-Mecking analysis of all specimens in T4 and T6. ....................... 65
vi

LIST OF FIGURES
Figure 1: Folding action of a bifilm [4]. ....................................................................................... 26
Figure 2: Typical example of a bifilm on which Fe containing intermetallics precipitated
in an Al-Si alloy [43]. ................................................................................................................... 26
Figure 3: Relatively old and thick tangled bifilm on polished surface [12]. ................................ 27
Figure 4: Work hardening rate a function of the difference between true stress and yield
strength in pure cast Mg in compression (C) and tension [17]. .................................................... 28
Figure 5: Change in Stage III work hardening characteristics with structural quality [16]. ......... 30
Figure 6: Schematic illustration of the change in work hardening behavior in cast Al
alloys with structural quality and ideal behavior in the absence of structural defects [16]. ......... 31
Figure 7: Elongation plotted versus yield strength for cast Al-7%Si-Mg alloys [59] .................. 33
Figure 8: Schematic illustration of the use of the ductility potential to assess structural
quality [59]. ................................................................................................................................... 34
Figure 9: Ductility Potential of various Mg alloy families [13]. .................................................. 40
Figure 10: ASTM B108 test bar mold. ......................................................................................... 45
Figure 11: The geometry of tensile bar with dimensions. ............................................................ 46
Figure 12: Microstructure of AZ91D specimen............................................................................ 47
Figure 13: Relationship between toughness (Ψ) and elongation (eF%) for both conditions. ....... 49
Figure 14: Dot plot analysis of QT data for T4 and T6 specimens. .............................................. 50
Figure 15: Weibull probability plots for QT for both conditions .................................................. 51
Figure 16: Weibull probability plots for QT for both conditions. ................................................. 52
vii
Figure 17: True stress – true plastic strain curves for specimens with (a) highest and (b)
lowest elongation in both tempers. ............................................................................................... 53
Figure 18: Kocks – Mecking diagram and plots of work hardening rate calculated from
derivation of constitutive equations for (a) T4 and (b) T6 [84]. ................................................... 57
Figure 19: KM plots for specimens with highest elongation in (a) T4 and (b) T6 [84]. .............. 59
Figure 20: KM plots for specimens with lowest elongation in (a) T4 and (b) T6. ....................... 60
Figure 21: Dot plot analysis of T4 and T6 samples for Stage III work hardening rate, (a)
ΘIII and (b) K. ................................................................................................................................ 62
Figure 22: Calculation of Stage II work hardening ...................................................................... 64
Figure 23: Contribution of Stage II work hardening .................................................................... 64
Figure 24: Relationship between K and (a) elongation, (b) quality index. ................................... 66
Figure 25: Relationship between (a) elongation and K and (b) quality index and K with
constant. ........................................................................................................................................ 68
Figure 26: Relationship between Stage II work hardening in T4 specimens and yield
strength. ......................................................................................................................................... 69
Figure 27: Overall fractograph of T6 specimens with (a) 3.2% elongation and 0.12
quality index and (b) 8 % elongation and 0.28 quality index. ...................................................... 70
Figure 28: Faceted fracture types in T6 specimen with 8 % elongation and 0.28 quality
index. ............................................................................................................................................. 71
Figure 29: Fracture surface of T6 AZ91 sample with 8% elongation and 0.28 quality
index. ............................................................................................................................................. 71
Figure 30: Pores on the fracture surface of AZ91 T6 samples with 3.28% elongation and
0.12 quality index.......................................................................................................................... 72
viii

Figure 31: Fracture surface of AZ91 T6 samples with 3.28 % elongation and 0.12 quality
index. ............................................................................................................................................. 73
Figure 32: An interesting fracture surface was observed for AZ91D samples. ............................ 73
Figure 33: Overall fractograph of T4 specimen with 16.77 % elongation and 0.52 quality
index. ............................................................................................................................................. 74
Figure 34: Fracture surfaces for T4 specimen from AZ91 samples with 16.77 %
elongation and 0.52 quality index. ................................................................................................ 75
Figure 35: Tearing most likely caused by opened up oxide bifilms for AZ91 samples with
16.77% elongation and 0.52 quality index.................................................................................... 75
Figure 36: Fracture surface the AZ91-T4 specimen with 11.32 % and 0.35 quality index. ......... 76
Figure 37: Fracture surface of the AZ91-T4 specimen with 11.32 % and 0.35 quality
index. ............................................................................................................................................. 77
Figure 38: Ductile fracture surface of AZ91-T4 specimen with 11.32% elongation and
0.35 quality index.......................................................................................................................... 77
ix

LIST OF SYMBOL AND ABBREVIATIONS
Al – Aluminum
Mg – Magnesium
Al2O3 – Alumina
HCP – Hexagonal Close-Packed
MPa – MegaPascal
SEM – Scanning Electron Microscope
σ – True Stress (MPa)
Ԑp – True Plastic Strain
σy – Yield Stress (MPa)
eF – Elongation to Fracture (%)
E – Modulus of Elasticity (MPa)
KM – Kocks–Mecking
K – Kocks–Mecking Parameter
Kv – K parameter for the Voce equation (MPa)
KH – K parameter for the Hollomon equation, also known as strength coefficient (MPa)
KL – K parameter for the Ludwik equation (MPa)
KS – K parameter for the Swift equation (MPa)
Θ – Work hardening rate (MPa)
Θ0 – Initial work hardening rate (MPa)
x

ABSTRACT
Tensile deformation characteristics of cast aluminum alloys have been
investigated extensively. Cast Mg alloys have remained mostly neglected by researchers,
despite their potential for weight savings. This present study is motivated by this gap in
the literature and consists of two stages; in Stage 1, analysis of tensile data gathered from
literature were reanalyzed, and in Stage 2, data generated from tensile testing of 60
specimens of AZ91 Mg alloy castings in both T4 and T6 conditions were analyzed to
characterize work hardening behavior.
In Stage 1, more than 1600 data were collected from the literature for various Mg
alloy families. After plotting these data in yield strength-elongation charts, highest points
were identified and interpreted as the maximum ductility, i.e., ductility potential (eFmax).
The trend in maximum points indicated a linear relationship with yield strength (σY),
expressed as;
Y(max)F 106.08.41%e (1)
This ductility potential equation can be used as a metric to compare elongation obtained
from tensile specimens to measure the structural quality of Mg alloy castings. Moreover,
results indicated that ductility potential was not affected by heat treatment, grain size
(within 30-120 μm), casting geometry, size, the type of casting process nor chemical
composition.
In Phase 2, AZ91 cast Mg alloy specimens in T4 and T6 conditions were tested in
tension to obtain stress-strain data for each specimen. Fits of four constitutive equations,
namely, the Hollomon, Voce, Ludwik and Swift, to true stress-true plastic strain data in
the elastoplastic region were characterized for the specimens with highest elongation
xi

values for T4 and T6 specimens. The coefficient of determination, R2, values for all
equations were in excess of 0.99, suggesting that all four equations provide excellent fits
to tensile data in both conditions.
The change in work hardening rate with true stress was investigated for all
specimens by using Kocks-Mecking (KM) plots. It was determined that work hardening
behavior of Mg alloy castings in T4 and T6 is distinctly different. In T4 specimens, there
is a plateau in work hardening rate at approximately E/25 which was observed in all
specimens. The presence of this plateau is consistent with results given in the literature
for pure Mg. However, this plateau was not observed in any of the T6 specimens. The
reasons for the absence of the plateau in T6 specimens are unknown at this time. In both
T4 and T6 specimens, the KM work hardening model in which work hardening rate
changes linearly with true stress was found to be applicable. This is the first time that
KM model was found to be valid for Mg alloys. Moreover in all specimens, there was a
sudden drop in work hardening rate just prior to final fracture. This drop was first
hypothesized to be due to structural defects in specimens, which was subsequently
validated via fractography. Structural defects were found in all specimens whose fracture
surfaces were investigated, indicating low to medium levels of quality.
The quality index method, originally developed for cast aluminum alloys as the
ratio of elongation to ductility potential, was found not to be applicable to Mg alloys, at
least in its original form. This is due to the fact that work hardening behavior of cast
aluminum alloys follows the KM model and there is no plateau where work hardening
rate is constant. Hence the work hardening behavior of cast aluminum alloys and AZ91
specimens in T6 condition was similar. However the plateau of constant work hardening
xii

rate had a strong effect on elongation in T4 specimens. Therefore quality index analysis,
which is supposed to be independent of alloy condition, did show that T4 and T6
specimens had different quality index levels. This finding contradicted the result from
Stage 1 that aging has no effect on ductility potential. However because of the presence
of structural defects in all specimens, quality index levels were low (0.30-0.45).
Therefore it is unclear at this point whether the work hardening behavior of T4 and T6
specimens would still be different if elongation values were in the proximity of the
ductility potential line. More research is needed to characterize work hardening behavior
of cast Mg alloys in the absence of major structural defects and also address other
questions raised in this study.
xiii
CHAPTER 1: INTRODUCTION
The density of Mg alloys ranges from 1.5 g/cm3 in Mg-Li to 1.8 g/cm3 in Mg-RE
alloys [1]. Because of their low density, Mg alloys offer significant weight saving
potential in load-bearing applications, where weight is critical [2], such as in automotive
and aerospace applications. Nevertheless, cast Mg alloy castings have not been used as
commonly as cast aluminum alloys. The barriers to their wider use have been recently
stated [3]: (i) porosity and hot–tearing during solidification, (ii) complex thermal
treatments and (iii) the lack of knowledge for process design to produce high–integrity
cast magnesium components with high ductility and strength i.e., low porosity that are
free from oxide inclusions. For wider use of Mg alloy castings in structural applications,
these barriers need to be overcome through careful improvement of casting processes.
Therefore, the effect of structural defects such as porosity and oxide inclusions on the
performance of Mg alloy castings needs to be investigated.
Structural defects in castings adversely affect mechanical properties, including
fatigue life [4,5], elongation [6,7,8,9] and tensile strength [10,11]. Research [12] has
shown that the inclusions in castings are mostly prior surface oxides that have been
entrained into the casting. These surface films fold over and form a bifilm which act as
nucleation sites for pores and intermetallics, and eventually lead to premature fracture
under load. It is imperative that the initial melt has a low number of entrained films and
the filling system needs to be designed to minimize or even eliminate additional damage
by entrainment of new surface films. In the absence of structural defects, cast Mg alloys
[13] can have tensile ductility that is significantly higher than most results reported in the
literature.
14
In cast Al alloys, it was found [14,15,16] that true tensile deformation
characteristics cannot be determined when structural defects are present, because these
defects reduce the work hardening rate. Moreover, a sudden drop in work hardening rate
was observed just before final tensile fracture as a result of major structural defects.
Tensile deformation has been shown as a tool to assess structural quality. There have
been only limited number of studies [17,18,19] conducted on the tensile deformation
characteristics of Mg alloys. This study is motivated by this gap in the literature.
In Chapter 2, literature review is provided about commonly known mechanical
properties of Mg alloys, alloy designations, historical development of magnesium alloys
and advantages and disadvantages for industries. Moreover, important casting process
variables are introduced and their effects on the casting quality are discussed.
In Chapter 3, quality index approach taken by Tiryakioǧlu have been used for Mg
alloy castings which was the previous study of the author. In that study [13], author
collected over one thousand and six hundred data points from various studies and plotted
them to the elongation-yield strength chart. Ductility potential line and the equation of the
line were presented. Mg alloy castings that near the ductility potential line are examined.
Effects of grain size, dendrite arm spacing, section thickness, heat treatment and casting
processes are discussed. Equation of the line and the estimation of ductility potential in
the literature are compared.
In Chapter 4, selected Mg alloy and the chemical composition of the specimens
are presented. Casting process and heat treatment procedure of the samples are given.
Dimensions of the specimens and the details regarding the preparation of the sample are
provided. Experimental procedure that author followed in this study is explained.
15

In Chapter 5, quality index of both heat treatment conditions are provided and
compared with the help of ductility potential concept for both tempers. Best fits of
constitutive equations in order to characterize the tensile deformation of Mg alloys are
analyzed. Kocks-Mecking analysis is conducted and relationship between elongation,
also alternatively quality index and work hardening parameters is observed. Contribution
of Stage II work hardening to the T4 specimens is investigated. Important questions
regarding the reasons of differences have been raised. Bifilms and pores on the fracture
surfaces have been investigated with the help of fractographs that obtained with SEM
analysis.
In Chapter 6, conclusions for the characterization of cast AZ91 magnesium alloys
are presented.
In Chapter 7, relevant questions that have been raised regarding the results are
mentioned.
16

CHAPTER 2: LITERATURE REVIEW
Magnesium can be extracted from the hydrosphere or lithosphere. Research [20]
stated that supplies for magnesium can practically be considered as unlimited. In the sea
water, every 1 km3 sea water contains 1.3 million tons of magnesium. Moreover,
magnesium can be found as ores such as dolomite (MgCO3.CaCO3) and magnesite
(MgCO3) in the earth’s crust.
2.1. Properties of Magnesium
Magnesium is a member of the periodic table group 2, having atomic number of
12 and atomic weight of 24.31 g/mol [21]. Magnesium is the lightest of all commonly
used metals with the density of 1.74 g/cm3. It has a melting point of 650oC, an electrical
conductivity of 39%IACS and a thermal conductivity of 167W/mK [21]. Physical
properties of magnesium were presented in the literature [22].
The crystal structure of magnesium is hexagonal close-packed (HCP) and
consequently, slip is more limited than in body-centered cubic (BCC) and face-centered
cubic (FCC) crystal structures. With the lattice parameters a=3.18Å and c=5.19Å,
magnesium has a c/a ratio of 1.624 [21]. Alloying additions affect the c/a ratio in Mg.
Table 1 shows the list of the crystallographic indices of the slip and twinning planes and
directions in Mg.
Deformation in magnesium initially starts with basal slip, which saturates quickly
and leads to twinning. Depending on the parameters such as c/a ratio, other slip planes
can be activated. Slip requires higher shear stress and consequently usually results in
brittle behavior.
17

Table 1: Crystallographic indices of the slip and twinning planes and directions of
magnesium [21].
Planes Directions Type Slip
Direction
Number of
Independent
Systems
{0001} <1120> Basal a 2
{1010} <1120> Prismatic a 2
{1121} <1120> Pyramidal c+a 4
{1012} <1011> Pyramidal (Twinning) c+a* 3
{1011} <1012> Pyramidal (Twinning) c+a* 3
{1122} <1023> Pyramidal (Twinning) c+a 4
{1121} <1026> Pyramidal (Twinning) c+a 4
* Frequent ones
Magnesium can be used in pure form just like most of the other metals. Its HCP
structure and atomic diameter allow for extended solid solubility with many elements.
Like other alloying systems, main purpose of alloying with magnesium is achieving
improvements for alloy properties, especially strength [23]. Most commonly used
alloying elements for magnesium are aluminum, zinc, manganese, zirconium, silver,
yttrium and rare earth elements. Among all these alloying elements, aluminum is
considered as the most common alloying element in Mg alloys [24]. Moreover, copper,
nickel and iron are considered as harmful impurities for the quality of magnesium alloys.
2.2. History of Applications of Magnesium Alloys
First automotive application of magnesium alloys was reported as Indy 500 in
1918 [21]. Also magnesium alloy castings were used for city buses and tractors in
England. Other applications emerged in Germany such as crankcases and housings were
18

made of Mg alloy castings [25]. Most of magnesium alloys were produced by high -
pressure die casting process. Magnesium alloys were one of the main aerospace
construction metals and were used for German military as early as World War I and
exclusively for German aircraft in World War II [21]. Popularity of magnesium alloys
increased with the World War II. Magnesium alloy sheet, casting, forgings and extrusions
were used by the United States Air Force and Soviet aircraft industry. Commercial air
plane producers such as Boeing decided to use magnesium alloys for control surfaces,
door frames, wheels, engine gear boxes, power generation components and structural
components in 1950s. After several reports were issued about magnesium alloys being
dangerous due to corrosion problems and flammability, the use of magnesium alloys
started to decline. Currently most common uses of magnesium are engine castings and
landing gears. Magnesium has also been used in helicopter industries such as gear boxes
[21].
Magnesium wheels that produced with sand casting were used by Porsche in
1960s for racing cars [26]. These magnesium parts lasted more than 150,000 km.
However due to the lack of the improvement in die casting technology, automotive
industry started to lose interest in magnesium alloys [27]. The peak of the use of
magnesium alloys was the Volkswagen Beetle in 1970s for air-cooled engines and gear
boxes [21].
After 1970s, the use of magnesium as a structural powertrain component
dwindled. The reasons behind this result were greater power requirements for the engine.
Therefore application of water cooling instead of air cooling gained more popularity [21].
However most magnesium alloys could not tolerate the new operating environments. As
19

stated above, corrosion resistance was one the major resistance for the use of magnesium
alloy and therefore efforts were made to eliminate this disadvantage for structural
magnesium alloys. Consequently, high purity alloys such as AZ91D, AZ91C, AM60B
and AM60A were developed in the 1980s that resulted in increase of cost which in turn
limited the wider use of magnesium alloys in automotive applications [21]. Recently, a
significant interest in magnesium alloys as a light-weight material to be used in
transportation has been reported [28,29]. Nowadays, cast magnesium alloys are becoming
just as popular in industry as wrought magnesium alloys. Main reason behind this result
is isotropy in mechanical properties of castings and economic advantages of castings
related to mass production [30].
The most significant issue in the production of magnesium alloy components is
the fire hazard, especially during machining process because of the low melting point of
magnesium alloys [21]. It must be noted that especially thin chips comparing to the thick
ones and the dust in grinding are more likely flammable, if heated to melting temperature.
They can easily ignite or explode during the process. To eliminate fire risks, fine cuts,
dull tools, power tool design and heat buildup need to be avoided and proper coolant
needs to be used. Chips and dust on the machines, on the ground or on the clothes must
be cleaned carefully before process. It must be noted that water based coolants cannot be
used since they reduce the salvage value of the scrap and increase the risk of fire [21].
2.3. Mg Alloy Designations
A designation system for Mg alloys was developed by the American Society for
Testing and Materials (ASTM) and is outlined in ASTM-B257. [31]. This designation
uses a three part code. First part is the letter that shows the major elements in the alloy.
20

Second part shows the composition of the alloy and third part code is the letter that
differentiates the alloys which have the same designation. As an example: ZQ91D
indicates that this alloy contains 9% Zinc, 1% Silver and “D” indicates that the fourth
alloy that registered. Table of codes for each alloying element is given in Table 2 [31].
Table 2: Codes of each element for the designation of magnesium alloys [31].
CODE ALLOYING ELEMENT
A Aluminum
B Bismuth
C Copper
D Cadmium
E Rare Earth Elements
F Iron
H Thorium
K Zirconium
L Lithium
M Manganese
N Nickel
Q Silver
R Chromium
S Silicon
T Tin
W Yttrium
Y Antimony
Z Zinc
Temper designations for Mg alloys are provided in Table 3. Most commonly used
tempers in cast Mg alloys are F, T4, T5, T6 and T7.
21

Table 3: International temper designations [32].
Temper Definition
F As fabricated
T1 Cooled from an elevated temperature shaping process and naturally aged
T2 Cooled from elevated temperature - shaping process, cold worked, and
naturally aged
T3 Solution heat treated, cold worked and naturally aged
T4 Solution heat treated and naturally aged
T5 Cooled from an elevated temperature - shaping process and artificially
aged
T6 Solution heat treated and artificially aged
T7 Solution heat treated and artificially overaged
T8 Solution heat treated, cold worked, and artificially aged
T9 Solution heat treated, artificially aged and cold worked
T10 Cooled from elevated temperature shaping process, cold worked, and
artificially aged
Studies have been conducted [31] on the effects of other alloying elements on the
mechanical properties such as tensile strength and hardness. For instance, aluminum
additions to Mg result in the formation of the β-Mg17Al2 phase, which increases strength.
Moreover corrosion resistance and castability are improved when aluminum and zinc are
added together. Zinc additions refine grain structure, whereas Si additions improve creep
resistance, however reduce the castability and corrosion resistance [23,31,33]. Most
widely used cast Mg alloys and their typical characteristics are presented in Table 4 [34].
22

Table 4: Most commonly used magnesium alloys and their characteristics [34].
Alloy Characteristics
AZ63 Good room temperature strength and ductility
AZ81
Tough, leak tight castings with 0.0015Be, used for pressure die-
casting
AZ91 General-purpose alloy used for sand and die castings
AM50 High-pressure die castings
AM20 Good ductility and impact strength
AS41 Good creep properties to 150oC
AS21 Good creep properties to 150oC
AE42 Good creep properties to 150oC
ZK51 sand castings, good room temperature strength and ductility
ZK61 As for ZK51
ZE41 Sand Castings, good room temperature strength, improved castability
ZC63 Pressure-tight castings, good elevated temperature strength, weldable
EZ33 Good castability, pressure-tight, weldable, creep resistant to 250oF
HK31 Sand castings, good castability, weldable, creep resistant to 350oF
HZ32 Same as for HK31
QE22 Pressure tight and weldable, high proof stress to 250oC
QH21
Pressure-tight, weldable, good creep resistance and proof stress to
300oC
WE54 High strength at room and elevated temperatures
WE43 Good corrosion resistance, weldable
M1 Low-to-medium-strength alloy, weldable, corrosion resistant
AZ31 Medium-strength alloy, weldable, good formability
AZ61 High -strength alloy, weldable
AZ80 High-strength alloy
ZM21 Medium-strength alloy, good formability, good damping capacity
ZK30 High strength alloys
ZK60 Good formability
ZMC711 High strength alloys
HK31
High creep resistance to 350oC, short time exposure to 425oC,
weldable
WE43 High temperature creep resistance
WE54 High temperature creep resistance
LA141 Ultra-light weight
23

2.4. Mg Alloy Castings and Casting Defects
For complex shaped parts, casting process is usually the preferred method of
production. The most common casting method for magnesium alloy products has been
die-casting, especially for automotive applications [35]. Like aluminum alloys,
magnesium alloys oxidize rapidly in air. Magnesium alloys are very sensitive to
turbulence during pouring, leading structural defects in the castings [36], which will be
discussed in the next section.
AZ91 is the most widely used magnesium alloy for many applications including
aerospace and automotive applications [34]. Mg-Al alloys where aluminum is the major
alloying element, shows very good castability [37,38]. This result leads to the use of
magnesium alloys in pressure assisted casting processes such as high pressure die casting.
Moreover, other alloy series such as WE shows lower castability. Casting methods such
as permanent and sand mold casting can be supported by pressure in purpose of achieving
thin walled structures [26]. Magnesium has great die-filling properties. Therefore large,
thin-walled and complex shaped components can be produced with magnesium alloys.
Studies [26] also indicated that low heat capacity, lower latent heat of solidification and
less affinity to iron are further advantages of magnesium castings.
2.5. Casting Defects
Casting defects, namely inclusions and pores, are produced during the casting
process but affect the properties and performance of castings adversely. In contrast, most
materials science textbooks emphasize the effect of microstructure, such as grain size,
dendrite arm spacing (DAS), secondary phases, eutectic structures and interface
properties, on mechanical properties in which engineers are taught that mechanical
24

properties are determined by microstructure. For example, reducing grain size is
considered as a way to increase yield strength due to the Hall-Petch affect:
d
k0y (2)
where σ0 is a material constant (MPa) and d is the grain size (μm), k is the specific
strengthening coefficient for each material (MPa.μm0.5). During deformation, grain
boundaries act as obstacles for the dislocation movement, which results in increase in
strength. Strengthening in Mg alloys is achieved in precipitation hardening (e.g., Mg-Zn,
Mg-Al and Mg-Ag systems), solute solution hardening and/or grain size hardening.
Similar to the effect of grain size, reduction in dendrite arm spacing, for instance by
solidification at higher rates, leads to higher strength. From a metallurgical standpoint, a
reduction in grain size or DAS, should result in lower ductility because it is an
established metallurgical principle that there is a strength-ductility compromise. One
property has to be sacrificed to gain in the other. However, elongation was reported to
increase with decreasing DAS in cast Al [39,40] and in Mg [21] alloys. Therefore, the
traditional thinking that “the microstructure controls the properties” for cast metals has
been questioned recently. Campbell [41] commented on the effect of microstructure on
properties as “at worst this not true, and at best it is a half-truth”. Moreover, Campbell
[41] also stated that reduced grain size is only effective in increasing elongation when the
melt is not clean.
The main defects in castings are bifilms and pores. Oxides, that form on the
surface of the molten metal, get entrained into liquid metal during melting (surface of
ingot), melt transfers [42] or mold filling, as depicted schematically in Figure 1. Because
25

most bifilms have neutral buoyancy in liquid metal, they remain suspended in the melt
[4]. During solidification, intermetallics usually nucleate and grow on these bifilms. An
example is provided in Figure 2, in which Fe-bearing intermetallics precipitates on a
bifilm (indicated by an arrow).
Figure 1: Folding action of a bifilm [4].
Figure 2: Typical example of a bifilm on which Fe containing intermetallics
precipitated in an Al-Si alloy [43].
26
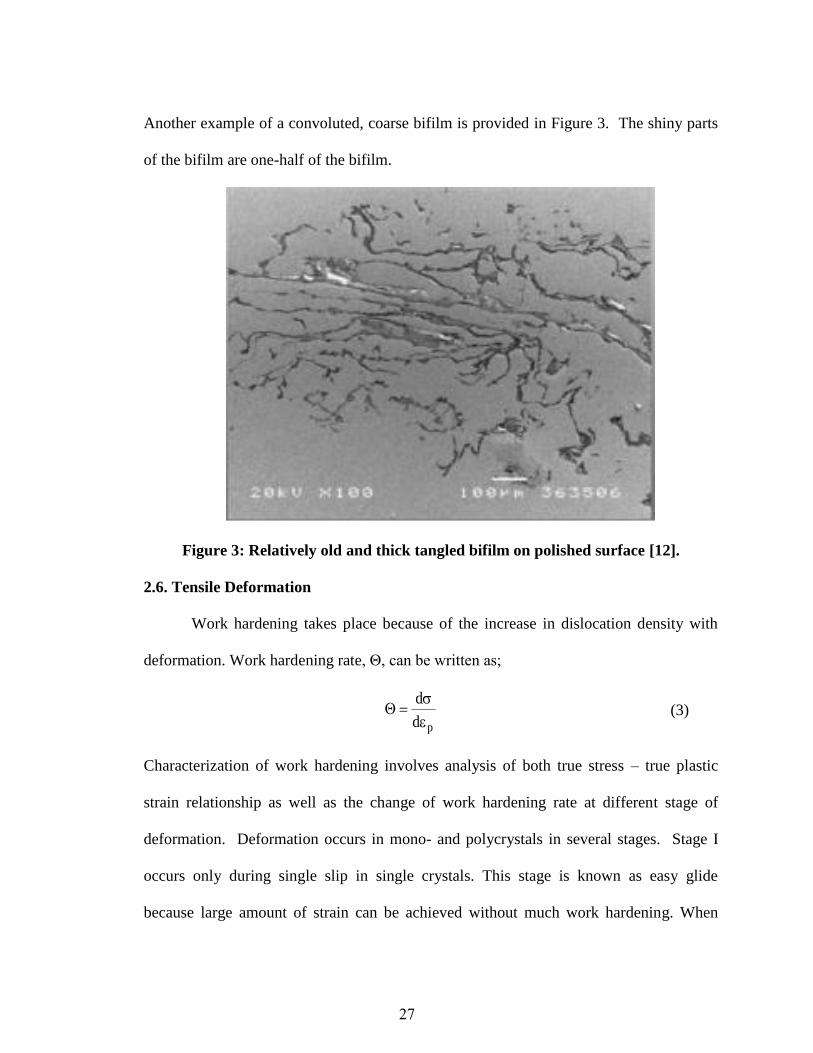
Another example of a convoluted, coarse bifilm is provided in Figure 3. The shiny parts
of the bifilm are one-half of the bifilm.
Figure 3: Relatively old and thick tangled bifilm on polished surface [12].
2.6. Tensile Deformation
Work hardening takes place because of the increase in dislocation density with
deformation. Work hardening rate, Θ, can be written as;
pd
d
(3)
Characterization of work hardening involves analysis of both true stress – true plastic
strain relationship as well as the change of work hardening rate at different stage of
deformation. Deformation occurs in mono- and polycrystals in several stages. Stage I
occurs only during single slip in single crystals. This stage is known as easy glide
because large amount of strain can be achieved without much work hardening. When
27

certain amount of strain is reached, a transition occurs for single crystals from low
hardening rate to larger and cause the raise of Stage II [44]. Stage II, also referred to as
athermal work hardening, is a stage with a higher work hardening rate. Stage II occurs in
both single crystals and polycrystals and work hardening rate decreases with increased
testing temperature. Stage I and Stage II occur independently. Stage III (dynamic work
hardening), corresponds to a steady decrease of work hardening rate [44].
Research [45,46] on the work hardening characteristics of pure magnesium single
crystals showed that Stage I, Stage II and Stage III work hardening all took place, similar
FCC metals [47]. Caceres and Blake [17] investigated the work hardening behavior of
cast pure Mg in tension and compression. Work hardening rate-true stress plot reported
by Caceres and Blake is presented in Figure 4. Note that there is a plateau in work
hardening rate at approximately 1.7 GPa for the curve for tension (as indicated by the
arrow). This is unique to Mg and was not reported for cast Al alloys.
Figure 4: Work hardening rate a function of the difference between true stress and
yield strength in pure cast Mg in compression (C) and tension [17].
28
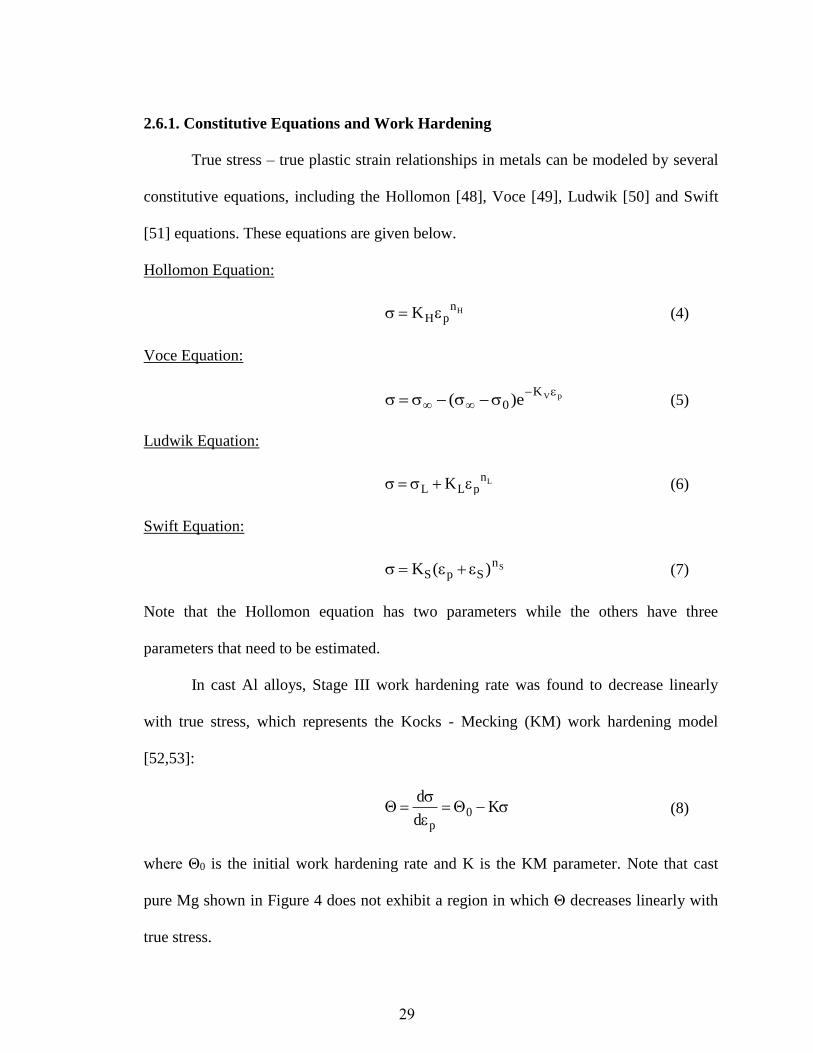
2.6.1. Constitutive Equations and Work Hardening
True stress – true plastic strain relationships in metals can be modeled by several
constitutive equations, including the Hollomon [48], Voce [49], Ludwik [50] and Swift
[51] equations. These equations are given below.
Hollomon Equation:
HnpHK (4)
Voce Equation:
pVK0 e)(
(5)
Ludwik Equation:
LnpLL K (6)
Swift Equation:
SnSpS )(K (7)
Note that the Hollomon equation has two parameters while the others have three
parameters that need to be estimated.
In cast Al alloys, Stage III work hardening rate was found to decrease linearly
with true stress, which represents the Kocks - Mecking (KM) work hardening model
[52,53]:
K
d
d0
p
(8)
where Θ0 is the initial work hardening rate and K is the KM parameter. Note that cast
pure Mg shown in Figure 4 does not exhibit a region in which Θ decreases linearly with
true stress.
29

Characteristics of tensile deformation can be used as a tool to assess the structural
integrity of castings. In castings, work hardening rate analysis has been used [14] to
characterize structural quality; when Θ was plotted versus σ in cast aluminum alloys, a
sudden drop was observed just prior to fracture [15]. Fractographic analysis showed that
this sudden drop could be attributed to major casting defects. In specimens with higher
structural quality (no major defects), there was no sudden drop in Θ and deformation
continued past the intersection of the curves for Θ and σ. The KM parameter K has a
profound effect on elongation, as shown in Figure 5. With increasing K, elongation was
found to decrease in A206-T7 aluminum alloy castings [16]. Also there is a sudden
decrease in Θ just prior to final fracture.
Figure 5: Change in Stage III work hardening characteristics with structural
quality [16].
0
500
1000
1500
2000
2500
300 350 400 450 500
(MPa)
(
MP
a)
Typical HIP
K=10.05
0=5535 MPa
eF=18.1%
Qs=96%
Eutectic HIP
K=24.27
0=10558 MPa
eF=4.9%
Qs=24%
no HIP
K=43.64
0=16546 MPa
eF=2.4%
Qs=13%
Typical HIP
K=21.83
0=9746 MPa
eF=10.9%
Qs=52%
30
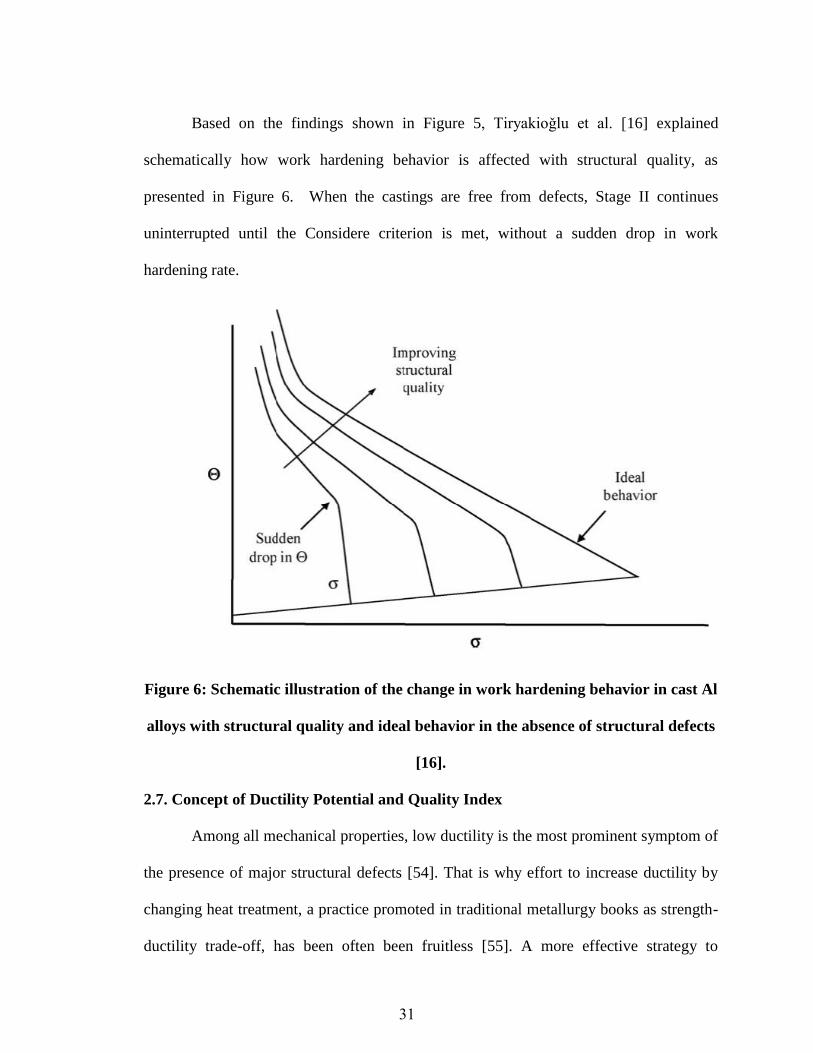
Based on the findings shown in Figure 5, Tiryakioǧlu et al. [16] explained
schematically how work hardening behavior is affected with structural quality, as
presented in Figure 6. When the castings are free from defects, Stage II continues
uninterrupted until the Considere criterion is met, without a sudden drop in work
hardening rate.
Figure 6: Schematic illustration of the change in work hardening behavior in cast Al
alloys with structural quality and ideal behavior in the absence of structural defects
[16].
2.7. Concept of Ductility Potential and Quality Index
Among all mechanical properties, low ductility is the most prominent symptom of
the presence of major structural defects [54]. That is why effort to increase ductility by
changing heat treatment, a practice promoted in traditional metallurgy books as strength-
ductility trade-off, has been often been fruitless [55]. A more effective strategy to
31

increase ductility is to improve the initial melt quality, eliminate liquid metal transfers
and design the filling system carefully so that additional oxide bifilms are not entrained
[12,54].
The use of elongation as a measure of the structural quality of aluminum castings
was proposed by Tiryakioglu et al. [56]. Comparison of current elongation to defect-free
elongation, estimated from work hardening characteristics was proposed as a quality
index. However, structural defects affect the work hardening characteristics significantly
in cast aluminum alloys [14,16]. Therefore, using work hardening characteristics [15] of
specimens with defects to estimate defect-free properties was found [54] to significantly
underestimate eF(max). Subsequently, Tiryakioglu et al. used hundreds of data points from
the aerospace and premium castings literature for Al-7Si-Mg [55], A206 [57] and A201
[58] to estimate eF(max). Because yield strength is minimally affected by structural defects,
it is plotted in the x-axis with eF on the y-axis. The elongation-yield strength plot for cast
Al-7%Si-Mg alloys is presented in Figure 7 [59].
32

Figure 7: Elongation plotted versus yield strength for cast Al-7%Si-Mg alloys [59]
Note that there is a linear relationship between σy and the maximum levels of elongation.
Hence maximum possible elongation or ductility potential, eF, can be expressed [59] as;
y10(max)Fe (9)
where β0 and β1 (MPa-1) are alloy-dependent coefficients, which are presented in Table 5.
Table 5: The coefficients of Equation 9 for Al-7%Si-Mg, A201 and A206 alloys [60].
β0 β1 (MPa-1)
A356-357 36.0 0.064
A201 34.5 0.047
A206 47.8 0.085
0
5
10
15
20
25
30
35
150 200 250 300 350 400 450 500
eF
(%)
Y (MPa)
33

The ductility potential developed for each alloy family can be used as a metric to
compare elongation to ductility potential. Therefore, the quality index, QT, can then be
found by [59];
Y10
F
(max)F
FT
e
e
eQ
(10)
The concept of QT is shown schematically in Figure 8.
Figure 8: Schematic illustration of the use of the ductility potential to assess
structural quality [59].
Tiryakioglu and Campbell [59] have recently suggested that there are three
regions for QT: (1) QT is below 0.25, (2) QT is between 0.25 and 0.70, and (3) QT is above
0.70. Region 1, premature fracture is due to “old”, coarse oxide bifilms which are
typically the skin of ingots. In this region, engineers need to focus on melt quality to
eF
Y
Maximum possible elongation, eF(max)
eF(max)
eF
experimental point
34

eliminate old oxides from remelts. Chilling the melt can increase the quality marginally.
In Region 2, the molten metal which is free from major “old” oxides but there are
“young” oxide bifilms in the beginning of the process which can increase the properties
of the metal. When QT is above 0.70, every small detail of the melt preparation and mold
filling system design needs to be reviewed. In this region, chilling, i.e., decreasing
dendrite arm spacing (DAS) has no effect on elongation [12]. For all three regions,
Tiryakioglu and Campbell proposed specific quality improvement efforts.
2.8. Effect of Casting Defects on Tensile Properties in Cast Mg Alloys
Tensile deformation is cast Mg alloys with defects has been investigated recently
[61,62,63]. Song et al. conducted in situ experiments in die cast AM50 alloys and
observed how the material around pores and bifilms deforms in tension. Only after stress
exceeds yield stress, there was noticeable deformation around pores and bifilms. Song et
al. also stated that (i) the final fracture is probably not due to cracking and/or decohesion
of the β-phase (Mg17Al12) and (ii) the alloy could withstand large amount of plastic
deformation before fracture although the presence of structural defects reduced the
elongation to only 6%. For the same alloy, Lee at al. [64] found a strong correlation
between elongation and area fraction of porosity on the fracture surface. The fracture path
was observed to go through the regions of clusters of structural defects. Lee et al. stated
that the defect-free elongation for the alloy with σy≈120MPa should be 29%. Weiler and
Wood investigated the effect of pores on the elongation and tensile strength of AM60B
alloy castings via experimentation [62] and finite element modeling. As can be expected,
they found that elongation is reduced significantly with increasing size of pores. They
also attempted to estimate elongation when the area fraction of pores is zero, i.e., when
35

the specimen is defect-free, by extrapolating the elongation-area pore fraction
relationship to zero pores. For a specimen with σy≈130 MPa, they estimated the defect-
free elongation eF(max), to be 10%. A similar approach was taken by Lee and Shin [65]
and Lee [66] for AZ91 alloy castings. In these studies, elongation was correlated to the
level of microporosity [65] and grain size [66]. Lee and Shin developed a critical strain
model, which predicted eF(max) to be between 6 and 10% for σy=125 MPa, which agrees
with the results of Weiler and Wood. Lee [66] extrapolated elongation-area pore fraction
relationships for various grain sizes and found that for σy=125 MPa, defect-free
elongation can be estimated as:
)d10x3.1exp(6.13e 3(max)F
(11)
Lee also suggested that the effect of grain size on elongation should become less
pronounced with decreasing level of porosity.
2.9. Statistics for Fracture
To model fracture, Weibull [67,68,69] developed a distribution, based on the
weakest link theory which was introduced earlier by Pierce [70]. Weibull distribution can
be presented as:
m
0
Texp1P (12)
where P is the probability of failure at a given stress, σ, or lower, the threshold value, σT,
is the value below which no specimen is expected to fail. σ0 is the scale parameter, m is
the shape parameter which refers to the Weibull modulus. Weibull found that this theory
can be applied to fracture of ceramics and metals. Largest defects act as the weakest link
by raising the local stresses and resulting in premature fracture. Since the main reason
36

behind the drop in mechanical properties address the structural defects, it is suitable to
state that fracture-related mechanical properties such as fracture stress, elongation,
fracture toughness, fatigue life can be analyzed with the concept of defect-size
distribution [71, 72].
The probability density function, f, for any continuous distribution can be written
as:
d
dPf (13)
For the Weibull distribution, f can be written as:
m
0
T
1m
0
T
0
expm
f (14)
Weibull probability plot is the most common way to apply Weibull fits to data.
Equation 12 can be rearranged in to Equation 14 which can be expressed as:
0T lnmlnmP1lnln (15)
This equation is linear when the left side of the equation is plotted versus ln(σ-σT) with a
slope of m and an intercept of –m ln(σ0). This probability plot can also be obtained when
the same side of the equation is plotted versus ln (σ) [73].
Tiryakioglu and Campbell [74] provided Weibull probability plots for 3-
parameter Weibull distribution and Weibull mixtures. They noted that 2-parameter
Weibull distribution is applicable when castings have defects which were introduced into
the melt during the mold filling, from one source of damage. They noted that, in this case,
σT=0 for 2-parameter Weibull distributions. Therefore Equation 15 can be written as;
0lnmlnmP1lnln (16)
37

A relationship between m in 2-parameter Weibull distributions of fracture strength and
the metal quality has been expressed by Campbell [75]. For pressure die casting m is
usually between 1 and 10, for gravity-filled castings it is between 10 and 30, for high
quality aerospace castings it is in range from 50 to 100.
38

CHAPTER 3: APPLICATION OF THE QUALITY INDEX APPROACH FOR MG
ALLOY CASTINGS
The approach taken by Tiryakioǧlu and coworkers has been applied to Mg alloy
castings by collecting large numbers of tensile data from the literature and analyzing
elongation versus yield strength. A copy of the paper that was published as a result of the
investigation is given in Appendix I.
All data collected from literature are presented in Figure 9. Note that there are
many specimens at low ductility levels (<5%), especially when yield stress exceeds 100
MPa. Therefore, it is easy to understand why low ductility is assumed to be intrinsic in
Mg castings. Figure 9 also shows that for a particular level of yield strength, number of
data points becomes sparse with increasing elongation. The number of points that can be
considered maximum at any given yield strength level is approximately twenty five.
Therefore, less than 2% of all data included in this study represent maximum elongation
values.
In, maximum points seem to have linear trend with yield strength, similar to what
was reported for Al alloy. The line that goes immediately above all maximum points
follows Equation 1;
Y(max)F 106.08.41%e (1)
The line represents the true ductility potential of cast Mg alloys. It also represents the true
(intrinsic) trade-off between ductility and strength, commonly referred to in metallurgy
textbooks.
39

Figure 9: Ductility Potential of various Mg alloy families [13].
It is noteworthy that there are data from almost all Mg alloy systems near the true
ductility potential line. While alloying additions affect the strengthening mechanisms to
reach the desired yield strength, the maximum elongation at that particular yield strength
is independent from the chemical composition of the alloy. This result has significant
implications for the selections of Mg alloys for particular applications and/or future Mg
alloy development effort, because the same strength and elongation can be obtained by
different alloying additions. As an example, at σy=235MPa in Figure 9, there are two data
points just below at line, one from the ZK (Mg-Zn-Zr) alloy family and the other from
the ZQ (Mg-Zn-Ag) alloy family. Although they have almost the same strength and
elongation, the cost for the two alloys can be expected to be vastly different because of
0
5
10
15
20
25
30
35
40
45
0 50 100 150 200 250 300
eF
(%)
Y (MPa)
AM AT
AZ EK
EZ GN
GW HK
QE QK
ZE ZH
ZA ZK
ZQ Mg-20Gd
12 3
4
5
10
9
12
6 78
11
13
16
1415
11
18
17
3
12 3
4
5
10
9
12
6 78
11
11
11
3
19
40

the silver addition in the ZQ series. Hence significant cost savings can be achieved by
selecting a less expensive alloy and careful design of process to minimize structural
defects.
In addition, it was shown by the author that there are almost all alloy families
around the line. Casting geometry and size include plate, separately-cast tensile bars,
ingot, and actual premium and aerospace castings. Hence, it can be stated that maximum
elongation can be reached for any casting shape and size. Specimens with different heat
treatment conditions, produced via various casting process can reach the maximum
elongation levels. A significant result of the study is grain size of specimens near the true
ductility line shows ranges between 10 and 163μm. Hence, there is strong evidence that
grain size has no effect on ductility when castings are free from structural defects.
The ductility potential line can be used to assess the structural quality of all Mg
alloy castings by using Equation 1. Therefore, QT can be used as a metric during any
effort to improve the structural quality and hence the performance of Mg alloy castings.
To examine the relationship between various Mg alloy castings on the ductility
potential line, points around the line were examined more closely, the details of which are
provided in Table 6.
41

Table 6: Detailed information about data indicated in Figure 9 [13].
Point Alloy Temper d (μm) Process Casting
1 EK11 F 30 Permanent mold
casting
5 mm diameter, 25
mm length
2 AZ31 F - Copper mold 150 mm diameter,
200 mm length
3 AT33 F 55 Copper mold 60 mm × 40 mm × 12
mm
4 AZ31 F 163 Copper mold with
electromagnetic stirring
150 mm diameter,
200 mm length
5 QK71 T6 71 Green sand casting 13 mm diameter cast
tensile bars
6 AZ91 W 125* Sand casting 200 mm×100 mm×15
mm plate
7 AM60 F 10*
Intensively sheared
melt, high pressure die
casting
6.4 mm diameter bars
8 GN112 W 70* Permanent mold
casting
70 mm×50 mm×20
mm plate
9 ZQ33 T6 90* Green sand casting 13 mm diameter cast
tensile bars
10 GW63 F 25 High vacuum die
casting
6.3 mm diameter
tensile bars
11 ZK61 T6 76 Green sand casting
25.4 or 50.8 mm-thick
rectangular plates
with chills
12 ZQ71 T6 81 Green sand casting
25.4 or 50.8 mm-thick
rectangular plates
with chills
13 ZA81 T6 80 Permanent mold
casting Ingot
14 ZQ64 T6 - Permanent mold
casting Aerospace casting
15 ZK61 T6 - Green sand casting 13 mm diameter cast
tensile bars
16 ZQ71 T6 - Permanent mold
casting Aerospace casting
17 Mg-
20Gd F 80 Copper mold
70 mm×40 mm×9
mm ingot
18 ZQ91 T6 25 Green sand casting 13 mm diameter cast
tensile bars
19 ZQ64 T6 - - 12 kg premium
quality casting
42

The details in provided in Table 1 have several implications:
1. As mentioned previously, there are data from almost all alloy families around the
line.
2. Casting geometry and size include plate, separately-cast tensile bars, ingot, and
actual premium and aerospace castings. Hence, it can be stated that maximum
elongation can be reached for any casting shape and size.
3. Specimens with different tempers, produced via various casting processes can
reach the maximum elongation levels.
4. Table 6 shows that grain size of specimens near the true ductility line shows ranges
between 10 and 163 μm. Hence, there is strong evidence that grain size has no
effect on ductility when castings are free from structural defects.
That grain size has no effect on the ductility potential is consistent with the finding in
cast Al-7%Si-Mg alloys that SDAS, similarly, does not affect eF(max). Although Lee [66]
has been correct to state that the effect of grain size on elongation is lessened with
increasing quality, the results in the present study suggest that the effect of grain size on
elongation disappears completely as elongation approaches eF(max). If grain size is taken
as a measure of the local solidification time, then, in the absence of bifilms, the
heterogeneous nucleation sites for pores and intermetallics do not exist, resulting in
defect-free castings, regardless of how long it takes for the castings to solidify.
Moreover, cracking along grain boundaries is not expected to occur as easily during
tensile deformation when bifilms (and intermetallics) are not on grain boundaries.
Although grain boundaries are usually assumed to be weak and consequently cracking
along them is considered normal, recent research [76] on bicrystals has shown that the
43

strength of grain boundaries, when inclusions and impurities are not present, approaches
the theoretical strength of monocrystals. Hence cracking along grain boundaries during
tensile deformation and a “beneficial” effect of grain refining should be taken as
symptoms of a high density of bifilms in the structure. This point has been suggested by
Campbell [41] to explain the true “grain refining” effect of Zr, a common alloying
addition in Mg alloys, by the sedimentation of bifilms to the bottom of the melt.
Along the same lines as grain size, the effect of section thickness should be
reevaluated. Hu et al. [77] stated that yield strength and elongation decrease with section
thickness, i.e., solidification time. However, when attention was paid to every detail of
the casting process, Lagowski and Meier [7878] reported that section thickness had no
effect on the ductility of Mg alloys.
Turning our attention to past efforts to estimate defect-free elongation, Equation
11, developed for σY=125 MPa, can be compared with Equation 1. Taking the two
extreme grain size values in Table 9, 10 and 163 μm, Equation 11 yields 13.4% and
11.0% elongation for the defect-free condition. These numbers are significantly lower
than eF(max) = 28.6% found by using Equation 1 for the same yield strength. Hence
Equation 11 underestimates eF(max) significantly. The same conclusion can be made for
the estimates of eF(max) made by Weiler and Wood [62] and Lee and Shin [65]. The
estimate, eF(max) = 29%, provided for Lee et al. [64] at σY≈120 MPa, is almost identical to
the outcome of Equation 1 (29.1%).
44

CHAPTER 4: EXPERIMENTAL PROCEDURE
4.1. Alloy
For this study, the AZ91D magnesium alloy has been selected. Chemical
composition for AZ91D is given in Table 7. Specimens which have been selected for this
study were carried out with T4 and T6 conditions.
Table 7: Chemical composition in (wt. %) of AZ91D Mg alloy used in this study.
Al Zn Mn Si Fe Cu Mg
9.2 0.7 0.3 0.03 0.003 0.001 Balance
4.2. Tensile Testing
Sand cast tensile bars produced in ASTM B108 sand molds (Figure 10) with 12.7
mm diameter were received from a magnesium casting supplier in T4 and T6 conditions.
In the literature [79], it has been stated that AZ91 Mg alloys for the T4 condition follows
the heat treatment procedure which is; 415oC for 16 to 24 hours and maximum heat
treating temperature is 418oC. For T6, it is solution treating at 415oC for 16 to 24 hours,
maximum treatment temperature is 418oC and aging at 168oC for 16 hours.
Figure 10: ASTM B108 test bar mold.
45

These bars were subsequently machined into 6.35 mm diameter bars. The final
geometry of tensile bar is presented in Figure 11. Sixty specimens in each temper were
tested in tension at a strain rate of 10-3/s. True stress and true strain values were obtained
by assuming conservation of volume. The tensile machine used was Instron with an
extansometer attached to the specimen throughout the tensile tensting. Extensometer
gauge length was 25 mm. Data points were digitally recored at 10 data points per
seconds.
Figure 11: The geometry of tensile bar with dimensions.
For the microstructural analysis, specimens were polished with 240μm, 360μm,
600μm, 800μm and 1200μm grit silicon carbide (SiC) paper. This procedure followed by
1μm, 0.3μm and 0.5μm alumina (Al2O3) suspensions.
Specimens with highest and lowest quality index were selected from both
tempers. Samples were sectioned and prepared for electron microscope. Fracture surfaces
of selected specimens were analyzed with a JEOL Scanning Electron Microscope (SEM)
at the University of Florida. Composition of observed intermetallic particles or interfaces
were provided with Energy Dispersive Spectometer (EDS) which was mounted in the
SEM column.
46

CHAPTER 5: RESULTS AND DISCUSSION
The microstructure of the AZ91 castings used in this study is provided in Figure
12. Grain size of the specimens have been calculated with the intercept method [80]. It
can be seen from the Figure 12 that the grain size of the specimens are in range of 120-
150μm according to ASTM E112-13 [80]. Dots were present due to the polishing
procedure of the samples.
Figure 12: Microstructure of AZ91D specimen.
Yield strength, elongation, tensile strength, quality index and toughness, i.e, the
area under the true stress-strain curve, were obtained by tensile testing for T4 and T6
specimens. Results are presented in the Table 8.
47

Table 8: Tensile data for T4 and T6 conditions.
T4 T6
No. σy
(MPa)
ST
(MPa)
eF
(%)
Ψ (MJ/m3)
QT No. σy
(MPa)
ST
(MPa)
eF
(%)
Ψ
(MJ/m3) QT
1 91.16 274.36 13.68 30.69 0.43 1 126.94 271.47 5.27 12.51 0.19
2 92.22 273.06 13.62 30.39 0.43 2 124.47 267.56 5.38 12.68 0.19
3 97.99 287.13 14.54 34.29 0.46 3 126.30 283.95 6.86 16.79 0.24
4 82.06 269.46 11.52 24.95 0.35 4 125.79 287.02 7.32 18.14 0.26
5 90.05 282.90 16.77 39.50 0.52 5 136.34 265.71 4.20 10.03 0.15
6 80.40 266.91 11.86 25.44 0.36 6 141.77 282.87 4.58 11.61 0.17
7 80.88 269.99 13.62 29.72 0.41 7 124.81 271.50 6.12 14.34 0.21
8 82.63 276.65 15.26 34.78 0.46 8 136.18 292.95 7.58 19.32 0.28
9 83.33 283.68 15.64 36.61 0.47 9 136.54 289.29 5.36 13.71 0.20
10 87.17 278.95 15.88 36.28 0.49 10 141.46 276.48 4.52 11.21 0.17
11 72.52 277.39 14.34 32.52 0.42 11 122.74 280.01 5.89 14.32 0.20
12 87.42 278.64 13.68 30.90 0.42 12 99.86 254.58 4.49 9.98 0.14
13 85.53 276.67 15.18 34.60 0.46 13 145.87 266.36 3.28 8.08 0.12
14 76.50 253.70 15.05 31.51 0.45 14 118.82 264.55 5.10 11.76 0.17
15 105.30 282.21 14.30 33.57 0.47 15 122.20 270.60 5.78 13.49 0.20
16 89.07 290.39 16.11 38.84 0.50 16 136.83 266.06 2.85 6.93 0.10
17 85.69 272.44 14.19 31.50 0.43 17 116.05 262.15 2.93 6.99 0.10
18 86.49 274.24 13.81 30.85 0.42 18 119.05 257.51 5.48 12.11 0.19
19 88.97 282.39 16.68 39.01 0.52 19 115.88 275.53 6.85 16.12 0.23
20 96.35 282.29 13.27 30.12 0.42 20 129.39 281.11 6.98 17.13 0.25
21 99.07 275.37 10.84 24.12 0.35 21 119.86 273.49 6.41 15.17 0.22
22 97.51 290.82 13.98 33.49 0.44 22 124.10 296.52 8.67 22.28 0.30
23 90.87 287.04 15.67 37.21 0.49 23 133.62 299.28 7.81 20.24 0.28
24 91.30 283.96 14.71 34.41 0.46 24 136.71 278.47 4.25 10.57 0.16
25 86.93 271.74 12.92 28.17 0.40 25 142.90 297.93 5.82 15.43 0.22
26 95.27 278.71 14.81 33.80 0.47 26 163.74 280.05 3.28 8.35 0.13
27 91.16 287.04 11.32 24.23 0.35 27 124.71 293.76 8.00 20.42 0.28
28 93.32 261.79 10.01 21.20 0.31 - - - - - -
48

For T4, yield strength of specimens range from 80.40 MPa to 105.30 MPa and
elongation ranges from 9.43% to 16.15%. By using elongation data and ductility
potential of each specimen, quality index is calculated. Results range from 0.30 to 0.50
for T4 specimens. This means that T4 specimens used in this study are in Region 2
quality index which indicates that specimens are free from old bifilms but there are young
bifilms introduced into the molten metal.
In Figure 13, the relationship between toughness and elongation is presented.
Hence, there is a strong correlation between toughness and elongation for cast AZ91D
specimens, as indicated by high values of coefficient of determination, R2. This result is
consistent with results reported previously for cast Al alloys [16,81].
Figure 13: Relationship between toughness (Ψ) and elongation (eF%) for both
conditions.
49

For T6, yield strength of specimens ranges from 99.86 MPa to 163.61 MPa and
elongation of each specimen ranges from 2.30% to 8.43%. By using elongation and
ductility potential of each specimen, quality index is calculated. Results range from 0.08
to 0.23. This means specimens used in this study are in region 1 quality index which
indicates that melt quality needs to be focused and old oxide bifilms need to be
eliminated.
Figure 14 shows the dot plot for the quality index of both heat treatment
conditions. In Chapter 3, it was stated that heat treatment did not affect ductility potential.
The experimental results from T4 and T6 specimens, however, suggest that the aging
does indeed affect QT, as presented in Figure 14. Specimens in T4 have clearly higher
quality index. Because castings were produced from the same heat, it is not realistic to
attribute the difference in QT between the two tempers to any structural quality issue. To
determine the reason for this discrepancy, a detailed analysis of the work hardening
behavior in the two conditions is necessary.
Figure 14: Dot plot analysis of QT data for T4 and T6 specimens.
50
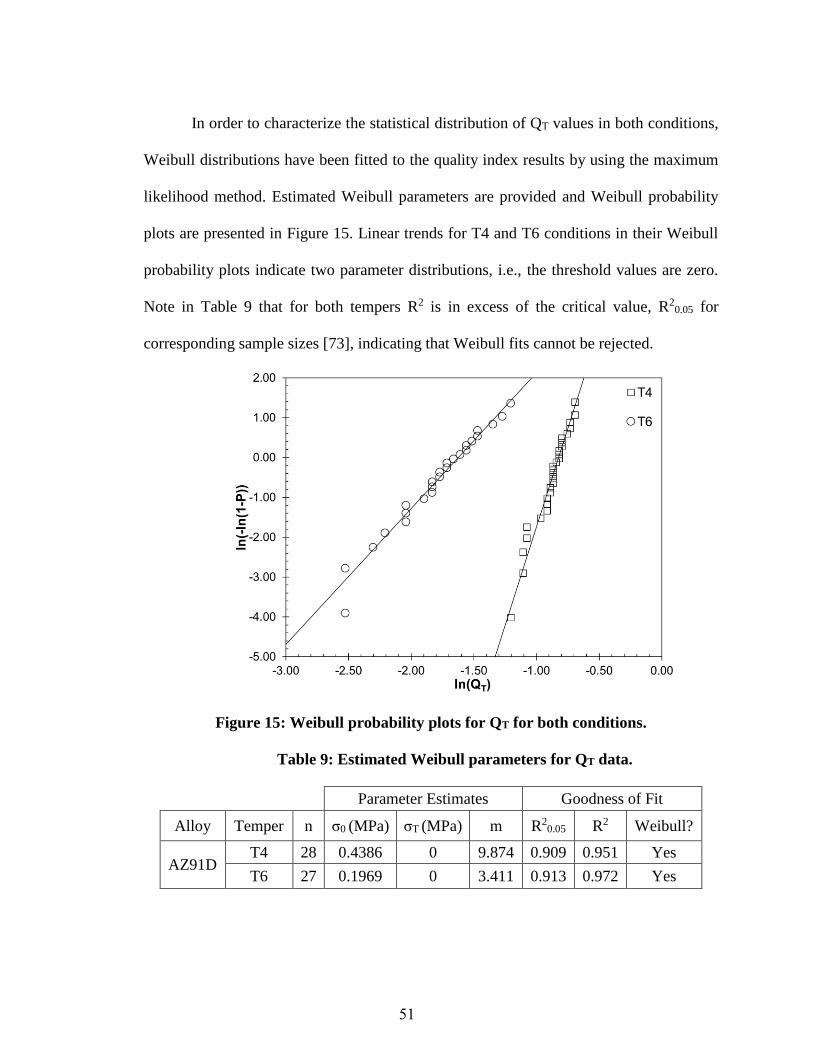
In order to characterize the statistical distribution of QT values in both conditions,
Weibull distributions have been fitted to the quality index results by using the maximum
likelihood method. Estimated Weibull parameters are provided and Weibull probability
plots are presented in Figure 15. Linear trends for T4 and T6 conditions in their Weibull
probability plots indicate two parameter distributions, i.e., the threshold values are zero.
Note in Table 9 that for both tempers R2 is in excess of the critical value, R20.05 for
corresponding sample sizes [73], indicating that Weibull fits cannot be rejected.
Figure 15: Weibull probability plots for QT for both conditions.
Table 9: Estimated Weibull parameters for QT data.
Parameter Estimates Goodness of Fit
Alloy Temper n σ0 (MPa) σT (MPa) m R20.05 R2 Weibull?
AZ91D T4 28 0.4386 0 9.874 0.909 0.951 Yes
T6 27 0.1969 0 3.411 0.913 0.972 Yes
51

The probability density functions for the Weibull distributions for T4 and T6
specimens are presented in Figure 16. The upper distribution of T4 specimens is located
at higher values of quality index than T6 specimens. Note that Weibull distributions of
two sets are significantly apart from each other. This difference is hypothesized to be due
to differences in the work hardening characteristics between T4 and T6 specimens.
Figure 16: Weibull probability plots for QT for both conditions.
5.1. Tensile Deformation
The performance of the four constitutive equations are listed in Table 10 in
modeling the work hardening behavior of AZ91D cast magnesium alloy was assessed by
using tensile data from specimens in T4 and T6 conditions. Moreover, the work
hardening characteristics in T4 and T6 were characterized by using σ – Θ charts. The σ -
εp curves of the specimens with highest and lowest elongation selected for this study are
presented in Figure 17. The specimens with highest elongation had yield strength (σy) of
90.4 and 124.6 MPa and elongation (eF) of 16.2 and 8.0% for T4 and T6 conditions in
52

Figure 17-a and the specimens with lowest elongation had the yield strength (σy) of 93.32
and 145.87 MPa and elongation (eF) of 10.01% and 3.28% for T4 and T6 conditions in
Figure 17-b, respectively.
(a)
(b)
Figure 17: True stress – true plastic strain curves for specimens with (a) highest and
(b) lowest elongation in both tempers.
0
50
100
150
200
250
300
350
400
0.00 0.02 0.04 0.06 0.08 0.10 0.12 0.14 0.16
σ(M
Pa)
p
T6
T4
Ԑp=0.002
53

True-stress-true plastic strain data in the plastic region of the specimens with highest
elongations were used to determine how well the four constitutive equations (Equations
4-7). To find the best fits, Newton-Raphson method was used to minimize the root mean
square error (RMSE), which can be calculated as:
an
yyRMSE t
n1t
(17)
where a is the number of parameters to be fitted and n is the specimens number. The
coefficient of determination, R2,was also calculated for each fit;
tot
res2
SS
SS1R (18)
where SSres is sum of squares of residuals, SStot is total sum of squares for experimental
data.
The values of the estimated parameters as well as RMSE and R2 for each fit are
presented in Table 10. Note that the R2 values in each case is above 0.99 which shows
that all constitutive equations included in this study can be used to characterize the true
stress – true strain relationship in this alloy.
The derivative of the four constitutive equations were taken and rearranged so that
Θ is only a function of σ. These work hardening rate equations are also provided in Table
11. Note that Equation 8 is identical to the work hardening rate for the Voce equation in
Table 11, such that, Θ0 = σ∞KV and K = KV.
54

Table 10: Estimated parameters for the constitutive equations for the two specimens
and the RMSE and R2 of each fit.
T4 T6
Equations Parameters Estimate RMSE
(MPa) R2 Estimate
RMSE
(MPa) R2
Hollomon KH (MPa) 645.2
6.22 0.991 605.0
2.81 0.997 nH 0.346 0.250
Voce
σ∞ (MPa) 393.8
3.14 0.998
341.5
5.14 0.991 σ0 (MPa) 106.9 135.8
KV 10.5 27.2
Swift
KS (MPa) 733.7
3.40 0.997
636.0
2.33 0.998 εS 0.007 0.001
nS 0.413 0.269
Ludwik
σL (MPa) 68.5
3.51 0.997
54.7
1.99 0.999 nL 0.516 0.334
KL (MPa) 729.4 628.2
Table 11: True stress – true plastic strain work hardening rate as function of true
stress for the four constitutive equations.
Constitutive
Equations σ = f(εp) Θ = f(σ)
Hollomon HnpHK
)n
1n(
HH
H
H
Kn
Voce pVK0 e)(
VK
Ludwik LnpLL K
)n
1n(
L
LLL
L
L
K
)(Kn
Swift SnSpS )(K
)n
1n(
SSS
S
S
KnK
55

The change in Θ with the difference between true stress and yield stress (σ–σy) for
the two specimens is presented in Figure 18. Note that curves with work hardening rates
obtained by using the equations in Table 11 and estimated parameters in are also
indicated. For the T4 specimen in Figure 18-a, all constitutive equations initially
underestimate the work hardening rate. The Voce equation provides the best fit after
approximately σ – σy= 50 MPa. All constitutive equations provide almost identical fits
for σ–σy≥100 MPa. For the T6 specimen in Figure 18-b, Hollomon, Swift and Ludwik
equations give similar fits that closely follow the work hardening rate curve. The voce
equation does not provide a good fit especially at lower stress levels.
It is noteworthy that the T4 specimens exhibited first a steep decrease in work
hardening rate, due to a short elastoplastic transition, followed by a plateau in work
hardening rate, indicated as Stage II. Consequently, there is a region in the true stress –
true plastic strain curve in Figure 17 where true stress increases linearly with strain,
approximately between true stress levels of 150 and 250 MPa. For the T4 specimen,
Stage II work hardening is followed by Stage III in which work hardening rate decreases
linearly with stress. The presence of a Stage II with constant work hardening rate was
reported for pure Mg [17] and several Mg alloys [82,83]. Note that Θ is 1850 MPa in
Stage II in Figure 18-a, which is similar to the levels reported for pure Mg [17] and equal
channel angular pressed (ECAP) AM60 alloy [82].
56

(a)
(b)
Figure 18: Kocks – Mecking diagram and plots of work hardening rate calculated
from derivation of constitutive equations for (a) T4 and (b) T6 [84].
57

5.2. Kocks – Mecking Analysis
The work hardening rate in two specimens with highest elongation as a function
of σ-σY is presented in Figure 19. Note that in both specimens, there is a distinct Stage III
work hardening region in Θ decreases linearly with increasing stress, following Equation
8. For the T4 specimen, Θ0=4,827 MPa and K=12.8. For the T6 specimen, Θ0 and K are
5709 MPa and 14.1, respectively.
The result for the T4 and T6 specimens are contradictory in how the four
equations perform. Among the four equations, only Voce equation is based on the
evaluation of the dislocation density with plastic deformation, developed by Kocks and
Mecking [52,53]. Merely fitting the four constitutive equations to the stress – strain data
past yield strength is not sufficient to characterize the plastic deformation behavior in this
alloy.
The results of the Kocks-Mecking analysis for all specimens are given in Table
12. A plateau in work hardening rate at 1800 MPa (~E/25) is observed for T4 specimens.
The presence of a plateau and its value is consistent with the results of Caceres and Blake
[17] as presented in Figure 4. This region was stated as Stage II. It must be noted that the
constant Stage II work hardening is only observed for T4 specimens. In T6 specimens,
there is no plateau with a constant work hardening rate. This is the first time that the
absence of this plateau is reported for Mg alloys. Moreover in both T4 and T6
specimens, there is a region in which work hardening rate decreases linearly with true
stress, following the Kocks-Mecking Stage III work hardening model. Therefore the
work hardening behavior is different from the one reported by Caceres and Blake for cast
pure Mg, as shown in Figure 4.
58

The KM plots for specimens with lowest elongation are presented in Figure 20.
The work hardening behavior is consistent between high and low quality specimens.
(a)
(b)
Figure 19: KM plots for specimens with highest elongation in (a) T4 and (b) T6 [84].
59

(a)
(b)
Figure 20: KM plots for specimens with lowest elongation in (a) T4 and (b) T6.
60

In all specimens, a sudden drop in work hardening rate prior to final fracture is observed.
It was determined [14,15] in cast aluminum alloys via fractographic analysis that this
sudden drop was a result of the presence of structural defects, such as bifilms and pores
in castings. These defects result in premature fracture in tension. Note that the sudden
drop in work hardening rate for both specimens has taken place at a level well above the
level of true stress, as indicated by the “Θ = σ” line. Therefore, the Consideré criterion is
met only at the microscale, in areas around casting defects that acted as stress
concentrators.
To determine the effect of work hardening behavior on ductility, possible
relationships between work hardening parameters, K and Θ, and elongation need to be
investigated. For T4, ΘIII values are clearly lower than T6 specimens. Figure 21 shows
the dot plot of ΘIII for both heat treatment conditions.
61

(a)
(b)
Figure 21: Dot plot analysis of T4 and T6 samples for Stage III work hardening
rate, (a) ΘIII and (b) K.
62

Table 12 shows that decreased K value indicates higher elongation and higher
quality index. Figure 24-a shows the relationship between elongation and K, alternatively
Figure 24-b shows the relationship between quality index and K. In Figure 24, for both
heat treatment conditions, it can be stated that higher elongation indicates lower K values.
Lines of the decrease for both T4 and T6 specimens have very close slopes. This
indicates that the relationship between K and elongation and alternatively the relationship
between K and quality index is independent from the aging. Note that Stage II starts at
the same work hardening rate for all specimens whether they have high elongation or
low.
That is why contribution of Stage II region to the elongation and quality index
needs to be compared with T6 specimens. Calculation of the ΔσII and contribution of
Stage II work hardening are presented in Figure 22 and Figure 23 respectively. From the
equations of the lines, intercept values were calculated and σ of Stage II start was
subtracted from σ of Stage II end. Results are presented in Table 12. Relationships
between K vs. elongation and K vs. quality index are re-analyzed for this purpose.
63

Figure 22: Calculation of Stage II work hardening.
Figure 23: Contribution of Stage II work hardening.
64

Table 12: Result of the Kocks-Mecking analysis of all specimens in T4 and T6.
T4 T6
No. K
(MPa)
II
(MPa)
ΔσII
(MPa) No. K (MPa)
1 14.58 5274.5 1912 101.92 1 20.17 7310.0
2 13.56 5013.5 1879 97.78 2 19.49 6969.4
3 16.61 5996.6 1889 104.69 3 16.35 6180.9
4 20.68 6840.6 1901 99.76 4 16.27 6176.2
5 13.73 5123.7 1850 101.86 5 21.19 7571.1
6 18.64 6318.6 1890 107.78 6 22.37 8342.3
7 14.78 5286.7 1869 103.54 7 16.94 6316.1
8 14.24 5154.2 1850 96.40 8 16.72 6403.1
9 15.42 5725.4 1899 111.02 9 18.31 7098.4
10 15.25 5515.2 1862 109.01 10 22.88 8172.8
11 14.37 5262.3 1875 103.18 11 17.26 6435.4
12 13.39 5003.3 1881 96.72 12 18.45 6506.9
13 14.58 5274.5 1872 104.81 13 24.92 8894.9
14 15.76 5345.7 1922 101.41 14 18.50 6710.0
15 17.29 6237.2 1881 106.40 15 17.87 6572.1
16 12.20 4932.2 1878 107.04 16 21.72 8303.1
17 15.53 5511.5 1869 99.78 17 22.42 8345.1
18 15.76 5595.7 1875 101.66 18 16.78 6006.7
19 13.39 5003.3 1868 98.55 19 16.50 5990.0
20 16.68 5970.6 1882 108.15 20 18.81 6728.8
21 20.00 7000.0 1894 109.04 21 18.47 6608.4
22 16.27 5976.2 1878 101.23 22 17.30 6538.1
23 14.07 5244.0 1883 99.96 23 16.21 6372.7
24 15.76 5745.7 1888 104.88 24 20.16 7709.3
25 17.29 6037.2 1874 105.08 25 19.54 7572.3
26 16.44 5786.4 1868 101.28 26 24.03 8941.9
27 17.29 5937.2 1880 99.49 27 18.23 6793.5
28 19.32 6459.3 1860 96.23 - - -
65
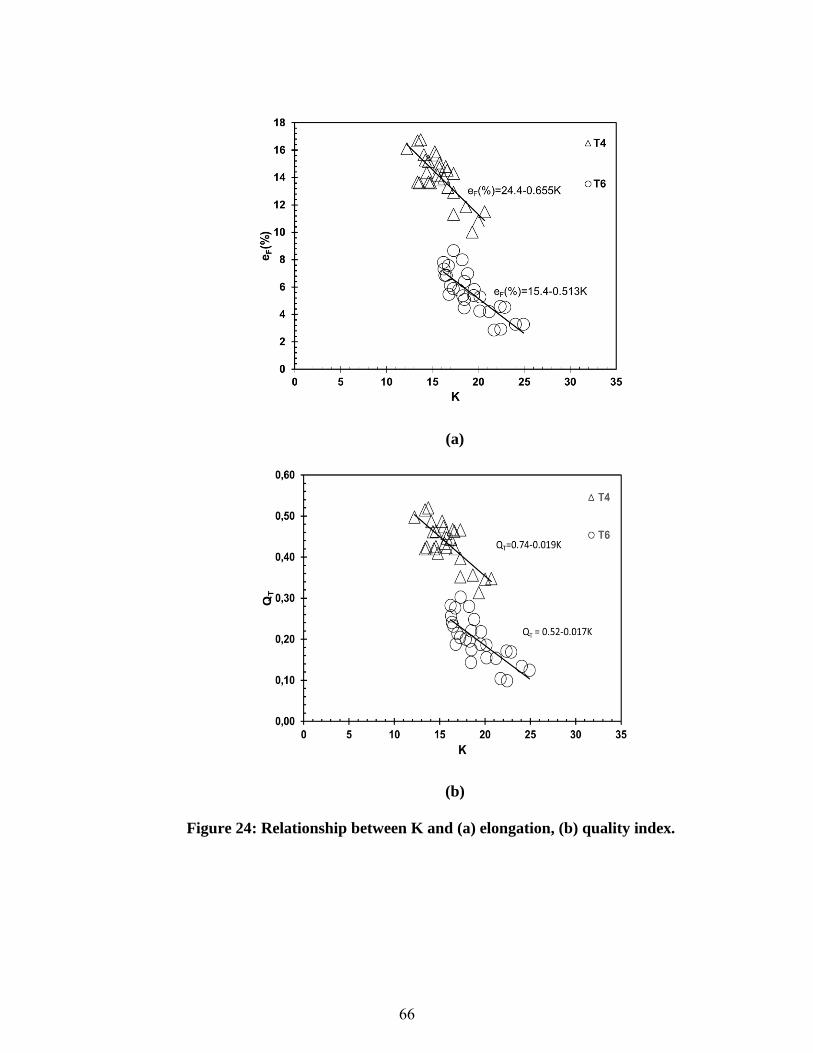
(a)
(b)
Figure 24: Relationship between K and (a) elongation, (b) quality index.
66

Figure 25 shows the absence of Stage II contribution for both (a) elongation and
(b) quality index. In this figure, it can be observed that, in the absence of a plateau in
Stage II, elongation (a) and quality index (b) of T4 specimens are approximately in the
same region with T6 specimens. Hence the only difference in work hardening behavior
between T4 and T6 specimens is the absence of the plateau in T6. The reason for this is
unknown at this time.
Because the plateau in work hardening rate appears in T4 specimens but not in
T6, the QT concept, originally developed for aluminum alloys which follow the same
work hardening behavior and exhibits no such plateau, is not directly applicable to cast
Mg alloys, at least in its original form.
67

(a)
(b)
Figure 25: Relationship between (a) elongation and K and (b) quality index and K
with constant.
68

Figure 26 shows that yield strength has no effect on Stage II work hardening.
Moreover, this might mean that Stage II work hardening is the region that makes the
difference between both heat treatment conditions.
Figure 26: Relationship between Stage II work hardening in T4 specimens and yield
strength.
The steep decrease in Θ, indicative of short elastoplastic transition, is in
contradiction with the results reported [85] for an extruded AZ31B alloy, for which
internal strains developed in tension and compression were measured by in situ neutron
diffraction. The results showed that the elastoplastic transition is extended, sometimes
lasting as long as 10% strain. Moreover, work hardening is a result of “a composite – like
load sharing between soft – and hard – oriented grains” [85]. Note that the decrease in Θ
for the T6 specimen is not as steep and there is not Stage II with a constant work
hardening rate (Figure 19-b). Hence the elastoplastic transition is longer for the T6
specimen. Kocks-Mecking analysis conducted by del Valle et al. [82] on ECAP AM60
69

showed that some specimens displayed the short elastoplastic transition followed by a
Stage II, similar to the T4 specimen (Figure 19-a), whereas others had an extended
elastoplastic transition and no Stage II with a constant Θ, similar to the T6 specimen,
(Figure 19-b). The reason for this difference in ECAP AM60 was attributed to texture
effects.
5.3. Fractographs
To have a better understanding of possible effects of bifilms and pores on deformation,
specimens with highest and lowest elongations were selected for SEM analysis. Oxide
bifilms and pores are observed on the all fracture surfaces of tensile test specimens.
Pores can be seen from Figure 27 for T6 specimen. These pores are evidence of
entrained bifilms. As a result of shrinkage induced shear forces, entrained oxides films
were torn apart and lead specimen to fracture. Note that this fractograph was obtained for
the specimen that has the highest elongation (a) (8%) and one of the lowest elongation (b)
(3.2%) among other T6 specimens.
(a) (b)
Figure 27: Overall fractograph of T6 specimens with (a) 3.2% elongation and 0.12
quality index and (b) 8 % elongation and 0.28 quality index.
70

For the same specimen, ductile fracture morphology was observed in particular
spots. Moreover, in some of these spots, a faceted fracture was also detected. Such
example of the fracture surfaces of AZ91D samples with T6 heat treatment are shown in
Figure 28. Dimples can be seen in Figure 28-b, indicative of ductile fracture.
(a) (b)
Figure 28: Faceted fracture types in T6 specimen with 8 % elongation and 0.28
quality index.
Brittle fracture was observed for T6 specimens. This brittle fracture can also be
seen in Figure 29 and Figure 31. It can be seen in these figures that these specimens show
tortuous fracture surfaces which indicates the brittle fracture.
Figure 29: Fracture surface of T6 AZ91 sample with 8% elongation and 0.28 quality
index.
71
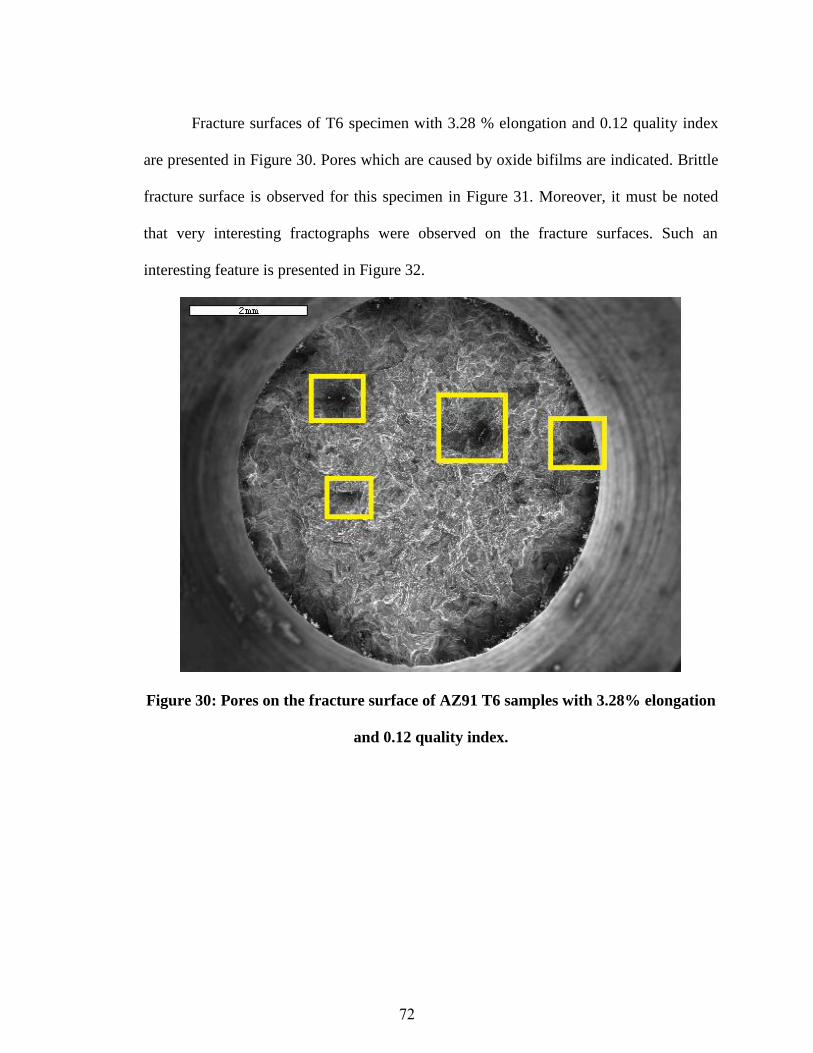
Fracture surfaces of T6 specimen with 3.28 % elongation and 0.12 quality index
are presented in Figure 30. Pores which are caused by oxide bifilms are indicated. Brittle
fracture surface is observed for this specimen in Figure 31. Moreover, it must be noted
that very interesting fractographs were observed on the fracture surfaces. Such an
interesting feature is presented in Figure 32.
Figure 30: Pores on the fracture surface of AZ91 T6 samples with 3.28% elongation
and 0.12 quality index.
72

Figure 31: Fracture surface of AZ91 T6 samples with 3.28 % elongation and 0.12
quality index.
Figure 32: An interesting fracture surface was observed for AZ91D samples.
73

Fracture surfaces of tensile test specimens with T4 heat treatment were also taken
(Figure 33) from AZ91 samples with 16.77% and 0.52 quality index. Consistently with
previous figures, it can be stated that the fractures were occurred where entrained bifilms
were present. Fractographs for fracture surfaces are obtained. Note that more pores have
been detected (Figure 34 (a) and Figure 34 (b)) on the fracture surface of T4 specimen
with lower elongation. Moreover, in particular spots, Mg-Si precipitates are detected and
EDS analysis is conducted. Also for this specimen, high degree of localized ductility has
been observed and it is presented in Figure 35.
Figure 33: Overall fractograph of T4 specimen with 16.77 % elongation and 0.52
quality index.
74

(a) (b)
Figure 34: Fracture surfaces for T4 specimen from AZ91 samples with 16.77 %
elongation and 0.52 quality index.
Figure 35: Tearing most likely caused by opened up oxide bifilms for AZ91 samples
with 16.77% elongation and 0.52 quality index.
75
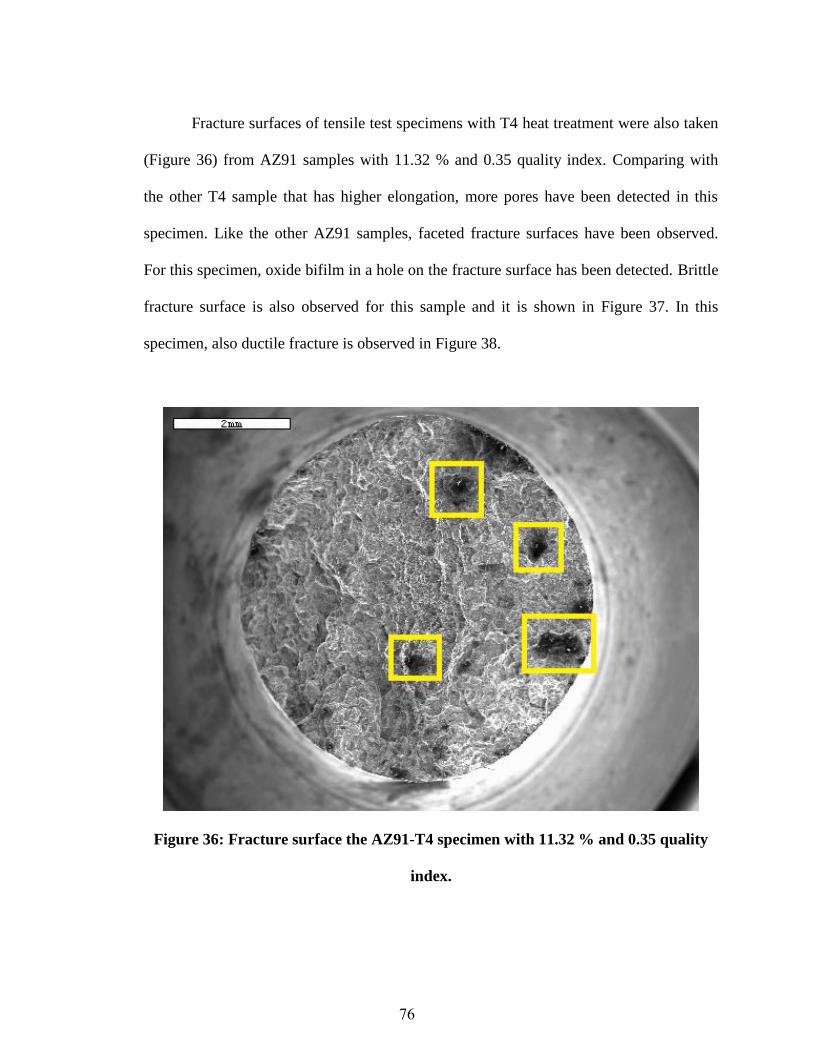
Fracture surfaces of tensile test specimens with T4 heat treatment were also taken
(Figure 36) from AZ91 samples with 11.32 % and 0.35 quality index. Comparing with
the other T4 sample that has higher elongation, more pores have been detected in this
specimen. Like the other AZ91 samples, faceted fracture surfaces have been observed.
For this specimen, oxide bifilm in a hole on the fracture surface has been detected. Brittle
fracture surface is also observed for this sample and it is shown in Figure 37. In this
specimen, also ductile fracture is observed in Figure 38.
Figure 36: Fracture surface the AZ91-T4 specimen with 11.32 % and 0.35 quality
index.
76

Figure 37: Fracture surface of the AZ91-T4 specimen with 11.32 % and 0.35 quality
index.
Figure 38: Ductile fracture surface of AZ91-T4 specimen with 11.32% elongation
and 0.35 quality index.
77

CHAPTER 6: CONCLUSIONS
In this study, the following conclusions were reached:
1. After analyzing more than 1600 data points from the literature for various Mg
alloy families, . the ductility potential (eFmax) for cast Mg alloys was developed as;
Y(max)F 106.08.41%e
This ductility potential equation can be used as a metric to compare elongation
obtained from tensile specimens to measure the structural quality of Mg alloy
castings.
2. Results indicated that ductility potential was not affected by heat treatment
condition, grain size (within 30-120 μm), casting geometry, size, the type of
casting process nor chemical composition.
3. Four constitutive equations, the Hollomon, Voce, Ludwik and Swift, were fitted
to true stress-true plastic strain data in the elastoplastic region of T4 and T6
specimens. Results indicated R2 values for all equations were in excess of 0.99,
suggesting that all four equations provide excellent fits to tensile data in both heat
treatment conditions.
4. The change in work hardening rate with true stress was investigated for all
specimens by using Kocks-Mecking (KM) plots. It was determined that work
hardening behavior in T4 specimens exhibits a plateau in work hardening rate at
approximately E/25. The presence of this plateau is consistent with results given
in the literature for pure Mg.
78

5. None of the T6 specimens exhibited a plateau with constant work hardening rate.
The reasons for the absence of the plateau in T6 specimens are unknown at this
time.
6. In both T4 and T6 specimens, the KM work hardening model in which the work
hardening rate changes linearly with true stress was found to be applicable. This
is the first time that KM model was found to be valid for Mg alloys.
7. Elongation of cast AZ91 was found to decrease linearly with the KM parameter,
K. However the relationship between elongation and K was different for each
temper.
8. In all specimens investigated in this study, there was a sudden drop in work
hardening rate just prior to final fracture. This drop was attributed to structural
defects in specimens via fractography.
9. Because of the difference of the work hardening behavior between T4 and T6
specimens due to the plateau in T4, the quality index method, which is supposed
to be independent of heat treatment, did show that T4 and T6 specimens had
different quality index levels. Consequently, it was concluded that the quality
index method was not applicable to Mg alloys, at least in its original form.
79

CHAPTER 7: FUTURE WORK
Although the present study shed some light on the tensile deformation characteristics of
cast Mg alloys, it has also raised some questions, which are as follows:
1. Does chemical composition have truly no effect on the ductility potential? In
aluminum alloys, different alloy families had different lines, although they are
close to each other.
2. Does the plateau in work hardening rate change with artificial aging time? To
determine the answer to this question, experiments can be designed to test the
effect of aging time, ranging between as quenched and well-overaged. It is
hypothesized that the width of the plateau, ΔσII, is a function of the artificial aging
time.
3. When casting quality is higher, i.e., closer to ductility potential and without major
defects on fracture surfaces, will T6 specimens exhibit a plateau in KM plots?
It is recommended that research be conducted to determine the answer to these questions.
80

REFERENCES
1. D.J. Bray: in AGARD Lecture Series No. 174, 7-1, (1990).
2. P. Krajewski, A. Sachdev, A. Luo, J. Scroth, Ligt Metals Age, 67, 5, (2009), 6-
13.
3. Anon. “High Integrity Magnesium Alloy Components”, USAMP Project AMD
601, Final Report, (2010).
4. J. Campbell, Castings, 2nd Edition, Butterworth-Heinemann Ltd, Oxford, (2003).
5. J. T. Staley Jr., M. Tiryakioglu, J. Campbell, Mater Sci. Eng., A, 465, (2007),
136-145.
6. B. L. Mordike, T. Elbert, Mater. Sci. Eng. A, 302, (2001), 37-45.
7. C. D. Lee, K. S. Shin, Acta Mater., 55, (2007), 4293-4303.
8. C. D. Lee, Mater. Sci. Eng. A, 459, (2007), 355-360.
9. M. Tiryakioǧlu. Mater.Sci Eng. A, 527, (2010), 4546–4549.
10. N. R. Green, J. Campbell, Mater. Sci. Eng. A, 173, (1993), 261-266.
11. C. Nyahumwa, N. R. Green, J. Campbell, Metall. Mater. Trans., A, 32, (2001),
349-358.
12. J. Campbell, Mater. Sci. Technol. 22, 2, (2006), 127-145.
13. O. Űnal, M. Tiryakioǧlu: Mater. Sci. Eng., A, 643, (2015), 51-54.
14. M. Tiryakioğlu, J. Campbell, J.T. Staley: Scripta Mater., 49 (2003) 873–878.
15. M. Tiryakioğlu, J. Campbell, J.T. Staley: Mater. Sci. Eng., A, 368 (2004) 205-
211.
81

16. M. Tiryakioğlu, J.T. Staley, Jr., J. Campbell: Mater. Sci. Eng., A., 487, (2008),
383-387.
17. C. H. Caceres, A.H. Blake, Mater. Sci. Eng., A, 462, (2007), 193-196.
18. H.-Y. Wu, J.-C. Yan, H.-H. Tsai, C.-H. Chiu, G.-Z. Zhou, C.-F. Lin: Mater. Sci.
Eng., A, 527, (2010), 7197-7203.
19. N. Afrin, D.L. Chen, X. Cao, M. Jahazi: Scripta Mater., 57, (2007), 1004–1007.
20. M. Jonsson, Athmospheric Corrosion of Magnesium Alloys, Stockholm, Sweden,
(2007).
21. M. O. Pekguleryuz, K. Kainer, A. Kaya, “Fundamentals of Magnesium Alloy
Metallurgy” Woodhead Publishing, 1st Edition, (2013).
22. J.I. Skar, D. Albright, Magnesium Tech. 2002 (2002) 255-261.
23. M. M. Avedesian, H. Baker, “Magnesium and Magnesium Alloys”, ASM
International. Handbook Committee, (1999).
24. N. Woldman, “Magnesium Casting.” Magnesium, ASM International, (1946).
25. A. Beck, “Magnesium und seine Legierungen”, Springer Verlag, Berling, (1939).
26. C. Blawert, N. Hort and K. U. Kainer, Trans. Indian Inst. Met. 57, 4, (2004), 397-
408.
27. R. Sachnell, R. Hones, F. Kaumle, “Verband fur Materialforschung und
Korrosion an Fahrzeugen”, DVM-Tag, (1995), 175-190.
28. A. Kumar, R.R. Adharapurapu, J.W. Jones, T.M. Pollock, Scr. Mater., 64, (2011),
65-68.
29. C.L. Fan, D.L. Chen, A.A. Luo, Mater. Sci. Eng., A, 519, (2009), 38-45.
82

30. H.A. Patel, D.L. Chen, S.D. Bhole, K. Sadayappan, J. Alloys Compd., 496,
(2010), 140-148.
31. T. B. Abbot, M. A. Easton, C. H. Caceres, Marcel Dekker, (2004), 487-538.
32. J. C. Benedyk, Light Metal Age, Reprinted, International Temper Designation
Systems for Wrought Aluminum Alloys, (2010), 16-22.
33. H. Westengen, Journal Physique IV, (1993), 491–501.
34. S. Fleming, “An Overview of Magnesium based Alloys for Aerospace and
Automotive Applications”, Rensselaer Polytechnic Institute, Hartford, CT,
August, (2012).
35. E. F. Emley, “Principles of Magnesium Technology, Pergamon Press, Oxford,
(1996).
36. A. R. Mirak, M. Divandari, S. M. A. Boutorabi and J. Campbell, International
Journal of Cast Metals Research, 20 (2007) 215-220.
37. F.A. Mirza, D.L. Chen, D.J. Li, X.Q. Zeng, Mater. Sci. Eng., A, 575, (2013), 65–
73.
38. A. Macwan, X.Q. Jiang, C. Li, D.L. Chen, Mater. Sci. Eng., A, 587, (2013), 344–
351.
39. Q.G. Wang, C.H. Cáceres, Mater. Sci. Eng. A, 241 (1998) 72-82.
40. E.W. Miguelucci, AFS Trans., 93 (1985) 913-916.
41. J. Campbell, Metall. & Mater. Trans. A, 46, 11, (2015), 4848-4853.
42. D. Dispinar, J. Campbell, JOM, 182, (2007), 405-410.
43. X. Cao, J. Campbell, Metall. Mater. Trans. A, 34A, (2003), 1409-1420.
83

44. A. D. Rollett, U. F. Kocks, Materials Science Forum, (1993), 1-26.
45. A. Seeger, H. Kronmuller, S. Mader, H. Trauble, Philos Mag, 6, (1961), 639-644.
46. P.B. Hirsch, J.S. Lally. Philos Mag, 12, (1965), 595-602.
47. E. Schmid, W. Boas, “Kristallplastizitat” Berlin: Springer Verlag, (1935).
48. J. H. Hollomon. Trans. AIME., 162, (1945), 268-290.
49. E. Voce, Metallurgia, 51 (1955) 219-226.
50. P. Ludwik, in “Elements der technologischen Mechanik”, p. 32,1909, Leipzig,
Verlag Von Julius Springer
51. H.W. Swift, J. Mech. Phys. Solids, 1 (1952) 1-18.
52. U.F. Kocks: J. Eng. Mater. Tech., 98, (1976), 76.
53. H. Mecking, U.F. Kocks: Acta Metall., 29, (1981), 1865.
54. M. Tiryakioğlu, J. Campbell, N.D. Alexopoulos: Metall. Mater. Trans., B, 40,
(2009), 802-811.
55. M. Tiryakioglu, J. Campbell, N.D. Alexopoulos: Metall. Mater. Trans., A, 40A,
(2009), 1000-1007.
56. M. Tiryakioǧlu, J.T. Staley, J. Campbell: Mater. Sci. Eng. A., 368, (2004) 231-
238.
57. M. Tiryakioǧlu, J. Campbell, N. Alexopoulos, Mater. Sci. Eng. A., 506, (2009)
23-26.
58. M. Tiryakioǧlu, J. Campbell, Mater. Sci. Technol., 25, (2009) 784-789.
59. M. Tiryakioǧlu, J. Campbell, Intl. J. Metalcasting, 8 (2014) 39-42.
60. M. Tiryakioǧlu, J. Campbell: AFS Transactions, 13-1525, (2013), 217-222.
84

61. J. Song, S.-M. Xiong, M. Li, J. Allison: Mater. Sci. Eng., A, 520, (2009) 197-201.
62. J.P. Weiler, J.T. Wood: Mater. Sci. Eng., A, 527, (2009) 25-31.
63. J.P. Weiler, J.T. Wood: Mater. Sci. Eng., A, 527, (2009) 32-37.
64. S.G. Lee, G.R. Patel, A.M. Gokhale, A. Sreeranganathan, M.F. Horstemeyer:
Scripta Mater., 53, (2005), 851-856.
65. C. D. Lee, K. S. Shin, Acta Mater., 55, (2007), 4293-4303.
66. C. D. Lee, Mater. Sci. Eng., A, 459, (2007), 355-360.
67. W. Weibull, “A statistical theory of the strength of materials”. Proc. The Royal-
Swedish Institute for Engineering Research. Nr. 151, (1939).
68. W. Weibull, “The phenomenon of rupture in solids”, Royal Swedish Institute of
Engineering Research (Ingenioersvetenskaps Akad. Handl.), Stockholm, 153, 1-
55 (1939).
69. W. Weibull, J. Applied Mechanics, 13, (1951), 193-197.
70. F.T. Pierce, J. Textile Inst. 17, T355-T368, (1948).
71. M. Tiryakioglu, Metall. and Mater. Trans., A, 46A, (2015), 270-280.
72. B. Epstein, J. American Stat. Assoc., 43, (1948), 403-412.
73. M. Tiryakioglu, D. Hudak, Metal. Mater. Trans., B, 41, (2011), 1130-1135.
74. M. Tiryakioğlu, J. Campbell: Metall. Mater. Trans A., (2010), 41A, 3121-3129.
75. J. Campbell, “Casting”, 2nd Edition, 303, London, Elsevier, (2003).
76. I.M. Mikhailovskij, T.I. Mazilova, V.N. Voyevodin, A.A. Mazilov: Physical
Review B 83, 134115 (2011).
77. H. Hu, M. Zhou, Z. Sun, N. Li: J. Mater. Process. Technol. 201 (2008) 364-368.
85

78. B. Lagowski, J. Meier, “Properties of Sand-Cast Mg Alloys, Part VIII: Foundry
Characteristics of Mg-Zn-Ag-Zr Casting Alloys”, Mines Branch Research Report,
Department of Mines and Technical Surveys, R161, Ottawa, Canada, (1965).
79. “Heat Treater’s Guide, Practices and Procedures for Nonferrous Alloys”, ASM
International, USA, November, (1996).
80. “ASTM E112-13, Standard Test Methods for Determining Average Grain Size”,
ASTM International, West Conshohocken, PA, (2013), www.astm.org
81. M. Tiryakioǧlu, N.D. Alexopoulos, Metallurgical and Materials Transactions A.,
39A, (2008) 2772-2780.
82. J.A. del Valle, F. Carreno, O.A. Ruano: Acta Mater., 54, (2006), 4247-4259.
83. M. Karami, R. Mahmudi: Mater. Sci. Eng., A, 607, (2014), 512-520.
84. O. Űnal, M. Tiryakioǧlu, Shape Casting: 6th International Symposium, TMS,
(2016), 117-124.
85. S.R. Agnew, C.N. Tomé, D.W. Brown, T.M. Holden, S.C. Vogel: Scripta Mater.,
49, (2003), 1003-1008.
86
Short communication
On the ductility potential and assessment of structural quality in Mgalloy castings
O. U��nal, M. Tiryakioğlu n
School of Engineering, University of North Florida, Jacksonville, FL 32224, USA
a r t i c l e i n f o
Article history:Received 19 June 2015Received in revised form30 June 2015Accepted 1 July 2015Available online 8 July 2015
Keywords:Quality indexElongationDuctility potentialDefectsBifilms
a b s t r a c t
Tensile data from literature are reanalyzed to determine ductility potential in magnesium alloys, whichhas yielded a linear relationship between maximum elongation and yield strength. Ductility potentialline is significantly higher than those in the literature. Moreover, grain size, chemical composition,temper do not affect the yield strength-maximum elongation relationship.
& 2015 Elsevier B.V. All rights reserved.
1. Introduction
Mg alloy castings have been attractive candidates in load-bearing applications, where weight is critical [1]. The density ofMg alloys ranges from 1.5 g/cm3 in magnesium–lithium to1.8 g/cm3 in magnesium-rare earth alloys [2]. Despite the sig-nificant weight savings that can be achieved over other light me-tals, Mg alloy castings have not been as common in aerospace andautomotive applications as aluminum alloys. The barriers to theirwider use have been recently addressed [3]: (i) porosity and hot-tearing during solidification, (ii) thermal treatments and (iii) pro-cess design to produce high-integrity cast magnesium componentswith high ductility and strength, low porosity that are free fromoxide bifilms. For wider use of Mg alloy castings in structural ap-plications, these barriers need to be removed through carefulimprovement of casting processes.
Recent research [4] has shown that initial melt quality, hand-ling the molten metal and finally design of the filling system in themold significantly affect the mechanical properties of castings,including fatigue life [5], elongation (eF) [6–11] and tensilestrength [12–13]. Therefore significant improvement in the qualityof magnesium castings should focus on melt preparation andhandling as well as filling system design. Such a quality im-provement effort requires a metric that can be used to gage theeffectiveness of techniques and/or processes implemented.
However, there is no such metric available yet for Mg alloy cast-ings. This study is motivated by this gap in the literature.
A metric for the assessment of structural quality of cast Al al-loys has been developed [14–17] recently, based on the conceptthat, when large numbers of data are analyzed together, there is anincreased likelihood to come across extreme data points whichmay reflect the true property potential of the metal. Using thisproperty potential, a quality index that compares actual to po-tential tensile elongation has been introduced [14–17], along withspecific guidelines on where to focus quality improvement efforts,depending on the current quality level. The same approach hasbeen expanded in this study to cast Mg alloys for various com-positions. Elongation and yield strength (sY) data from 25 in-dependent studies in the literature have been reexamined to de-termine the maximum elongation points for a given yield strengthlevel.
2. Background
Mechanical properties in castings are mainly determined bythe extent of the structural defects such as bifilms and pores. Bi-films are surface films that are entrained into the liquid metaleither through poor handling of the liquid metal or during moldfilling if the filling system has not been designed properly [7].During solidification, bifilms open up under the negative pressuredeveloped in the metal as well as by the diffusion of dissolvedgases. They act as heterogeneous nucleation sites for intermetallics
Contents lists available at ScienceDirect
journal homepage: www.elsevier.com/locate/msea
Materials Science & Engineering A
http://dx.doi.org/10.1016/j.msea.2015.07.0030921-5093/& 2015 Elsevier B.V. All rights reserved.
n Corresponding author. Fax: þ1 904 620 1391.E-mail address: [email protected] (M. Tiryakioğlu).
Materials Science & Engineering A 643 (2015) 51–54
87
APPENDIX I

and pores and/or serve as cracks that lead to hot tearing in thecasting. Because of their overwhelming effect on the mechanicalbehavior, it has been suggested [18] that the microstructure playsalmost no role when there are structural defects in castings.
Among all mechanical properties, low ductility is the mostprominent symptom of the presence of major structural defects[14]. That is why efforts to increase ductility by changing heattreatment, a practice promoted in traditional metallurgy books asstrength-ductility trade-off, has often been fruitless [14,17]. Amore effective strategy to increase ductility is to improve the in-itial melt quality, eliminate liquid metal transfers and design thefilling system carefully so that additional oxide bifilms are notentrained [14,19,20].
Strengthening in Mg alloys is achieved in precipitation hard-ening (e.g., Mg–Zn, Mg–Al and Mg–Ag systems), solute solutionhardening and/or grain size hardening following the well-knownHall–Petch equation:
kd 1y 00.5σ σ= + ( )−
where s0 is a material constant (MPa) and d is the grain size (μm).Alloying additions such as Zr and rare earth (RE) elements havebeen used widely for grain refinement [21] to achieve significantgrain size strengthening. Decreasing grain size was also observedto increase ductility [22–23]. The low ductility of cast Mg alloys atroom temperature has been attributed [2,24] to cracking alonggrain boundaries during tensile deformation as a result of onlythree slip systems being active (in the o11204 directions) due toits hexagonal close packed (hcp) unit cell.
Tensile deformation in cast Mg alloys with defects has beeninvestigated recently [11,25,26]. Song et al. conducted in situ ex-periments on die cast AM50 alloys and observed how the materialaround pores and bifilms deforms in tension. Only after stressexceeds yield strength, there was noticeable deformation aroundpores and bifilms. Song et al. also stated that (i) the final fracture isprobably not due to cracking and/or decohesion of the β-phase(Mg17Al12) and (ii) the alloy could withstand large amount ofplastic deformation before fracture although the presence ofstructural defects reduced the elongation to only 6%. For the samealloy, Lee et al. [27] found a strong correlation between elongationand area fraction of porosity on the fracture surface. The fracturepath was observed to go through the regions of clusters of struc-tural defects. Lee et al. stated that the defect-free elongation forthe alloy with sYE120 MPa should be 29%. Weiler and Wood in-vestigated the effect of pore area fraction on the elongation andtensile strength of AM60B alloy castings via experimentation [25]and finite element modeling [26]. As can be expected, they foundthat elongation is reduced significantly with increasing size ofpores. They also attempted to estimate elongation when the areafraction of pores is zero, i.e., when the specimen is defect-free, byextrapolating the elongation – area pore fraction relationship tozero pores. For a specimen with sYE130 MPa, they estimated thedefect-free elongation, eF(max), to be 10%. A similar approach wastaken by Lee and Shin [8] and Lee [9] for AZ91 alloy castings. Inthese studies, elongation was correlated to the level of micro-porosity [8] and grain size [9]. Lee and Shin developed a criticalstrain model, which predicted eF(max) to be between 6 and 10% forsY¼125 MPa, which agrees with the results of Weiler and Wood.Lee [9] extrapolated elongation-area pore fraction relationships forvarious grain sizes and found that for sY¼125 MPa, defect-freeelongation can be estimated as:
e d13.6 exp 1.3 10 2F max3= ( − × ) ( )( )
−
Lee also suggested that the effect of grain size on elongationshould become less pronounced with decreasing level of porosity.
The use of elongation as a measure of the structural quality of
aluminum castings was proposed by one of the authors and hiscoworkers [19,28]. Comparison of current elongation to defect-freeelongation, estimated from work hardening characteristics [29]was proposed as a quality index. However, structural defects affectthe work hardening characteristics significantly in cast aluminumalloys [30,31]. Therefore, using work hardening characteristics ofspecimens with defects to estimate defect-free properties wasfound [19] to significantly underestimate eF(max). Subsequently,one of the authors and his coworkers used hundreds of data fromthe aerospace and premium castings literature for Al-7% Si–Mg[32], A206 [33] and A201 [34] to estimate eF(max). Because yieldstrength is minimally affected by structural defects, yield strengthis plotted in the x-axis with eF on the y-axis. A linear relationshipbetween yield strength and elongation was found [14] for all al-loys:
e 3YF max 0 1β β σ= − ( )( )
where β0 and β1 (MPa�1) are alloy-dependent coefficients al-though the linear relationships for the three alloys are very similar.Therefore, the quality index, QT, can then be found by;
Qe
ee
4T
F
F max
F
0 1 Yβ β σ= =
− ( )( )
Tiryakioğlu and Campbell [14] have recently suggested that thereare three regions for QT: (1) QT is below 0.25, (2) QT is between0.25 and 0.70, and (3) QT is above 0.70. In Region 1, prematurefracture is due to “old”, coarse oxide bifilms which are typically theskins of ingots. In this region, engineers need to focus on meltquality to eliminate old oxides from remelts. Chilling the melt canincrease the quality marginally. In Region 2, the molten metalwhich is free from major “old” oxides but there are “young” oxidebifilms which are entrained during molten metal transfers andmold filling. Chilling can freeze bifilms in the beginning of theprocess which can increase the properties of the metal. When QT isabove 0.70, every small detail of the melt preparation and moldfilling system design needs to be reviewed. In this region, chilling,i.e., decreasing secondary dendrite arm spacing (SDAS) has noeffect on elongation [17]. For all three regions, Tiryakioğlu andCampbell proposed specific quality improvement efforts.
The approach taken by Tiryakioğlu and coworkers has beenapplied to Mg alloy castings in this study by collecting largenumbers of tensile data from the literature and analyzing elon-gation versus yield strength.
3. Analysis of data and discussion
In this study, elongation and yield strength data from twentyfive independent studies in the literature [35–59] have been re-analyzed. In total, more than one thousand and six hundred datapoints have been collected and analyzed. Alloys from fifteencommercial alloy families as well as a binary alloy have been in-cluded. As indicated above, elongation (y-axis) data have beenplotted versus yield strength (x-axis). The plot for all data is pre-sented in Fig. 1. Note that there are many specimens at low duc-tility levels (r5%), especially when yield strength exceeds100 MPa. Therefore, it is easy to understand why low ductility isassumed to be intrinsic in Mg castings. Fig. 1 also shows that for aparticular level of yield strength, number of data points becomessparse with increasing elongation. The number of points that canbe considered maximum at any given yield strength level is ap-proximately 25. Therefore, less than 2% of all data included in thisstudy represent maximum elongation values.
In Fig. 1, maximum points seem to have linear trend with yieldstrength, similar to what was reported for Al alloys. The line that
O. U��nal, M. Tiryakioğlu / Materials Science & Engineering A 643 (2015) 51–5452
88

goes immediately above all maximum points has the followingequation:
e % 41.8 0.106 5F max yσ( ) = − ( )( )
This line represents the true ductility potential of cast Mg alloys. Italso represents the true (intrinsic) trade-off between ductility andstrength, commonly referred to in metallurgy textbooks.
It is noteworthy that there are data from almost all Mg alloysystems included in this study near the true ductility potentialline. While alloying additions affect the strengthening mechan-isms to reach the desired yield strength, the maximum elongationat that particular yield strength is independent from the chemicalcomposition of the alloy. This result has significant implications forthe selections of Mg alloys for particular applications and/or futureMg alloy development efforts, because the same strength andelongation can be obtained by different alloying additions. As anexample, at syE235 MPa in Fig. 1, there are two data points justbelow the line, one from the ZK (Mg–Zn–Zr) alloy family (#15) andthe other from the ZQ (Mg–Zn–Ag) alloy family (#14). Althoughthey have almost the same strength and elongation, the cost forthe two alloys can be expected to be vastly different because of theAg addition in the ZQ series. Hence, significant cost savings can be
achieved by selecting a less expensive alloy and careful design ofprocesses to minimize structural defects.
Relevant details about selected points on or immediately belowthe line are presented in Table 1. The details in Table 1 have sev-eral implications:
1. As mentioned previously, there are data from almost all alloyfamilies around the line.
2. Casting geometry and size include plate, separately-cast tensilebars, ingot, and actual premium and aerospace castings. Hence,it can be stated that maximum elongation can be reached forany casting shape and size.
3. Specimens with different tempers, produced via various castingprocesses can reach the maximum elongation levels.
4. Table 1 shows that grain size of specimens near the true duc-tility line shows ranges between 10 and 163 μm. Hence, there isstrong evidence that grain size has no effect on ductility whencastings are free from structural defects.
That grain size has no effect on the ductility potential is consistentwith the finding in cast Al-7% Si–Mg alloys that SDAS, similarly,does not affect eF(max). Although Lee [9] has been correct to statethat the effect of grain size on elongation is lessened withincreasing quality, the results in the present study suggest thatthe effect of grain size on elongation disappears completely aselongation approaches eF(max). If grain size is taken as a measure ofthe local solidification time, then, in the absence of bifilms, theheterogeneous nucleation sites for pores and intermetallics do notexist, resulting in defect-free castings, regardless of how long ittakes for the castings to solidify. Moreover, cracking along grainboundaries is not expected to occur as easily during tensiledeformation when bifilms (and intermetallics) are not on grainboundaries. Although grain boundaries are usually assumed to beweak and consequently cracking along them is considered normal,recent research [60] on bicrystals has shown that the strength ofgrain boundaries, when inclusions and impurities are not present,approaches the theoretical strength of monocrystals. Hence crack-ing along grain boundaries during tensile deformation and a“beneficial” effect of grain refining should be taken as symptomsof a high density of bifilms in the structure. This point has beensuggested by Campbell [18] to explain the true “grain refining”effect of Zr, a common alloying addition in Mg alloys, by thesedimentation of bifilms to the bottom of the melt.
Fig. 1. Yield strength versus elongation plot for various series of Mg alloys.
Table 1Detailed information about data indicated in Fig. 1.
Point Alloy Ref. Temper d (μm) Process Casting
1 EK11 35 F 30 Permanent mold casting 5 mm diameter, 25 mm length2 AZ31 36 F – Copper mold 150 mm diameter, 200 mm length3 AT33 37 F 55 Copper mold 60 mm�40 mm�12 mm4 AZ31 36 F 163 Copper mold with electromagnetic stirring 150 mm diameter, 200 mm length5 QK71 38 T6 71 Green sand casting 13 mm diameter cast tensile bars6 AZ91 39 W 125a Sand casting 200 mm�100 mm�15 mm plate7 AM60 40 F 10a Intensively sheared melt, high pressure die casting 6.4 mm diameter bars8 GN112 41 W 70a Permanent mold casting 70 mm�50 mm�20 mm plate9 ZQ33 38 T6 90a Green sand casting 13 mm diameter cast tensile bars10 GW63 42 F 25 High vacuum die casting 6.3 mm diameter tensile bars11 ZK61 43 T6 76 Green sand casting 25.4 or 50.8 mm-thick rectangular plates with chills12 ZQ71 43 T6 81 Green sand casting 25.4 or 50.8 mm-thick rectangular plates with chills13 ZA81 44 T6 80 Permanent mold casting Ingot14 ZQ64 45 T6 – Permanent mold casting Aerospace casting15 ZK61 46 T6 – Green sand casting 13 mm diameter cast tensile bars16 ZQ71 45 T6 – Permanent mold casting Aerospace casting17 Mg–20Gd 47 F 80 Copper mold 70 mm�40 mm�9 mm ingot18 ZQ91 48 T6 25 Green sand casting 13 mm diameter cast tensile bars19 ZQ64 49 T6 – – 12 kg premium quality casting
a Estimated from micrograph.
O. U��nal, M. Tiryakioğlu / Materials Science & Engineering A 643 (2015) 51–54 53
89
Along the same lines as grain size, the effect of section thick-ness should be reevaluated. Hu et al. [61] stated that yield strengthand elongation decrease with section thickness, i.e., solidificationtime. However, when attention was paid to every detail of thecasting process, Lagowski and Meier [43] reported that sectionthickness had no effect on the ductility of Mg alloys.
Turning our attention to past efforts to estimate defect-freeelongation, Eq. (2), developed for sY¼125 MPa, can be comparedwith Eq. (5). Taking the two extreme grain size values in Table 1, 10and 163 μm, Eq. (2) yields 13.4% and 11.0% elongation for the de-fect-free condition. These numbers are significantly lower thaneF(max)¼28.6% found by using Eq. (5) for the same yield strength.Hence Eq. (2) underestimates eF(max) significantly. The same con-clusion can be made for the estimates of eF(max) made by Weilerand Wood [25] and Lee and Shin [8]. The estimate, eF(max)¼29%,provided for Lee et al. [27] at sYE120 MPa, is almost identical tothe outcome of Eq. (5) (29.1%).
The ductility potential line (Eq. (5)) can now be used to assessthe structural quality of all Mg alloy castings by using Eq. (4).Therefore, QT can be used as a metric during any effort to improvethe structural quality and hence the performance of Mg alloycastings. Until guidelines specific to Mg alloys are developed, thequality improvement recommendations made [14] for aluminumalloy castings can be taken as a starting point.
4. Conclusions
� A relationship representing the ductility potential has beendeveloped for all cast Mg alloys:
e % 41.8 0.106F max yσ( ) = −( )
� Most estimates of defect-free elongation for cast Mg alloys inthe literature significantly underestimate the ductilitypotential.
� Grain size has no significant effect on elongation as it ap-proached the ductility potential line.
� Chemical composition of the alloy as well as the temper affectthe yield strength of metal but not the ductility potential at agiven yield strength.
� Casting geometry, size and the type of casting process were notfound to have any effect on the ductility potential.
� The actual elongation can be compared with the ductility po-tential to calculate QT, which can be used as a metric in anyquality improvement effort in Mg alloy castings.
References
[1] P. Krajewski, A. Sachdev, A. Luo, J. Scroth, Light Met. Age 67 (5) (2009) 6–13.[2] D.J. Bray: in AGARD Lecture Series No. 174, 1990, pp. 7–1.[3] Anon, High Integrity Magnesium Alloy Components, 2010 (USAMP Project
AMD 601, Final Report).[4] J. Campbell, Mater. Sci. Technol. 22 (2006) 127–145 (999-1008).[5] J.T. Staley Jr., M. Tiryakioğlu, J. Campbell, Mater Sci. Eng. A 465 (2007) 136–145.[6] B.L. Mordike, T. Elbert, Mater. Sci. Eng. A 302 (2001) 37–45.[7] J. Campbell, Castings, Elsevier, London, 2003 (2nd edition).[8] C.D. Lee, K.S. Shin, Acta Mater. 55 (2007) 4293–4303.[9] C.D. Lee, Mater. Sci. Eng. A 459 (2007) 355–360.[10] M. Tiryakioğlu., Mater.Sci. Eng. A 527 (2010) 4546–4549.[11] J. Song, S.-M. Xiong, M. Li, J. Allison, Mater. Sci. Eng. A 520 (2009) 197–201.[12] N.R. Green, J. Campbell, Mater. Sci. Eng. A 173 (1993) 261–266.[13] C. Nyahumwa, N.R. Green, J. Campbell, Metall. Mater. Trans. A 32 (2001)
349–358.[14] M. Tiryakioğlu, J. Campbell, Intl. J. Metalcast. 8 (2014) 39–42.
[15] M. Tiryakioğlu, J. Campbell, N. Alexopoulos, Mater. Sci. Eng. A 506 (2009)23–26.
[16] M. Tiryakioğlu, J. Campbell, Mater. Sci. Technol. 25 (2009) 784–789.[17] M. Tiryakioğlu, J. Campbell, N.D. Alexopoulos, Metall. Mater. Trans. A 40A
(2009) 1000–1007.[18] J. Campbell, Metall. Mater. Trans. A (2015), http://dx.doi.org/10.1007/
s11661-015-2955-8 (in press).[19] J. Campbell, Mater. Sci. Technol. 22 (2006) 127–145.[20] M. Tiryakioğlu, J. Campbell, N. Alexopoulos, Metall. Mater. Trans. B 40 (2009)
802–811.[21] M. O.Pekguleryuz, K.Kainer, A.Kaya, Woodhead Publishing, 1st edition, 2013.[22] J.A. Chapman, D.V. Wilson, J. Inst. Met. 91 (1962) 39–40.[23] Z.M. Li, A.A. Luo, Q.G. Wang, L.M. Peng, P.H. Fu, G.H. Wu, Mater. Sci. Eng. A 564
(2013) 450–460.[24] G.V. Raynor, The Physical Metallurgy of Magnesium and its Alloys, Pergamon
Press, London, 1959.[25] J.P. Weiler, J.T. Wood, Mater. Sci. Eng. A 527 (2009) 25–31.[26] J.P. Weiler, J.T. Wood, Mater. Sci. Eng. A 527 (2009) 32–37.[27] S.G. Lee, G.R. Patel, A.M. Gokhale, A. Sreeranganathan, M.F. Horstemeyer, Scr.
Mater. 53 (2005) 851–856.[28] M. Tiryakioğlu, J.T. Staley, J. Campbell, Mater. Sci. Eng. A 368 (2004) 231–238.[29] M. Tiryakioğlu, J. Campbell, J.T. Staley, Mater. Sci. Eng. A 368 (2004) 205–211.[30] M. Tiryakioğlu, J. Campbell, J.T. Staley, Scr. Mater. 49 (2003) 873–878.[31] M. Tiryakioğlu, J.T. Staley Jr., J. Campbell, Mater. Sci. Eng. A 487 (2008)
383–387.[32] M. Tiryakioğlu, J. Campbell, N.D. Alexopoulos, Metall. Mater. Trans. A 40A
(2009) 1000–1007.[33] M. Tiryakioğlu, J. Campbell, N. Alexopoulos, Mater. Sci. Eng. A 506 (2009)
23–26.[34] M. Tiryakioğlu, J. Campbell, Mater. Sci. Technol. 25 (2009) 784–789.[35] Y. Huang, W. Gan, K.U. Kainer, N. Hort, J. Magnes. Alloy. 2 (2014) 1–7.[36] J.P. Park, M.G. Kim, U.S. Yoon, U.S. Kim, W.J. Kim, J. Mater. Sci. 44 (2009) 47–53.[37] H.Y. Wang, X.L. Nan, N. Zhang, C. Wang, J.G. Wang, Q.C. Jiang, Mater. Chem.
Phys. 132 (2012) 248–252.[38] B. Lagowski, J. Meier, Properties of Sand Cast Magnesium Alloys, Part IV,,
Department of Mines and Technical Surveys, Ottawa, Canada, (1960), p.756–766 (Mines Branch Research Report, R63).
[39] L. Čižek, M. Greger, L. Pawlica, L.A. Dobrzański, T. Tański, J. Mater.Process.Technol. 157–158 (2004) 466–471.
[40] S. Ji, W. Yang, B. Jiang, J.B. Patel, Z. Fan, Mater. Sci. Eng. A 566 (2013) 119–125.[41] K.Y. Zheng, J. Dong, X.Q. Zeng, W.J. Ding, Mater. Sci. Eng. A 489 (2008) 44–54.[42] S. Li, D. Li, X. Zeng, W. Ding, Trans. Nonferrous Met. Soc. China 24 (2014)
3769–3776.[43] B. Lagowski, J. Meier, Properties of Sand-Cast Mg Alloys, Part VIII: Foundry
Characteristics of Mg–Zn–Ag–Zr Casting Alloys, Department of Mines andTechnical Surveys, Ottawa, Canada, 1965 (Mines Branch Research Report,R161).
[44] J. Wang, R. Liu, T. Luo, Y. Yang, Mater. Des. 47 (2013) 746–749.[45] A.J. Iler, Development of Manufacturing Capability for Producing High Per-
formance Aluminum and Magnesium Alloy Castings, Northrop Corporation,1964 (Report: NOR 64-278).
[46] J. Meier, M. Martinson, AFS Trans. 58 (1950) 742–751.[47] Q. Peng, Y. Wu, D. Fang, J. Meng., L. Wang, J. Rare Earths 24 (2006) 466–470.[48] A. Couture, J.W. Meier, Properties of Sand-Cast Mg Alloys, Part VI: Effect of
Pouring Temperature and Holding Time, Department of Mines and TechnicalSurveys, Ottawa, Canada, 1965 (Mines Branch Research Report, R152).
[49] J. Meier, Research in Premium Quality Casting in Light Alloys,, Department ofMines and Technical Surveys, Ottawa, Canada, 1965 (Mines Branch ResearchReport, R149).
[50] B. Per, P. Ketil, W. Hakon, JOM 55 (2003) 46–51.[51] J. Jiang, Y. Wang, Y. Li, J. Qu, W. Shan, S. Luo, J. Mater. Proc. Technol 212 (2012)
1191–1199.[52] J.H. Forsmark, J.W. Zindel, L. Godlewski, J. Zheng, J.E. Allison, M. Li, Integr.
Mater. Manuf. Innov. 4 (2015) 1–38.[53] J. Jiang, Y. Wang, J. Qu, Trans. Nonferrous Met. Soc. China 24 (2014) 321–333.[54] H. Honsel, P. Zimmermann, Giesserei 50 (1963) 765–781.[55] K.E. Nelson, AFS Trans. 69 (1961) 756–766.[56] B. Lagowski, J. Meier, Properties of Sand Cast Magnesium Alloys, Part V, De-
partment of Mines and Technical Surveys, Ottawa, Canada, 1964 (MinesBranch Research Report, R140).
[57] A. Couture, J.W. Meier, The Effect of Test Bar Variables on the MechanicalProperties of Mg Casting Alloys, Department of Mines and Technical Surveys,Ottawa, Canada, 1965 (Mines Branch Research Report, R151).
[58] A. Couture, J.W. Meier, Properties of Sand-Cast Mg Alloys, Part VII: The Effectof Wall Thickness on Tensile Properties of Mg–Al–Zn Alloy Castings, Depart-ment of Mines and Technical Surveys, Ottawa, Canada, 1965 (Mines BranchResearch Report, R153).
[59] A. Wang, B. Zhang, D. Li, R. Fritzsch, X. Zeng, H.J. Roven, W. Ding, Trans.Nonferrous Met. Soc. China 24 (2014) 3762–3768.
[60] I.M. Mikhailovskij, T.I. Mazilova, V.N. Voyevodin, A.A. Mazilov, Phys. Rev. B 83(2011) 134115.
[61] H. Hu, M. Zhou, Z. Sun, N. Li, J. Mater. Process. Technol. 201 (2008) 364–368.
O. U��nal, M. Tiryakioğlu / Materials Science & Engineering A 643 (2015) 51–5454
90

117
CHARACTERIZATION OF TENSILE DEFORMATION IN AZ91D Mg ALLOY CASTINGS
Abstract
Introduction
Shape Casting: 6th International SymposiumEdited by: Murat Tiryakioglu, Mark Jolly, and Glenn Byczynski
TMS (The Minerals, Metals & Materials Society), 2016
91
APPENDIX II

118
Background
Constitutive Equations = f(εp) = f( )
92

119
Experimental Details and Analysis
Al Zn Mg Si Fe Be Ni Cu Mg
Results and Discussion
93

120
T4 T6
Equations Parameters Estimate RMSE (MPa) R2 Estimate RMSE
(MPa) R2
Hollomon KH (Mpa) nH
Voce ∞ (MPa) 0 (MPa)
KV
Swift KS (MPa) εS nS
Ludwig L (MPa)
nL
KL (MPa)
94

121
95
122
in situ
Conclusions
96

123
97

124
References
98

APPENDIX III
Derivation of Four Constitutive Equations:
Hollomon:
Hn
pHK
)1( Hn
HnKd
d
)1
(H
H
n
n
H
HK
n
Ludwig:
Ln
pLL K
)1( Ln
LL Knd
d
)1
()( L
L
n
n
L
LLL
KKn
Swift: Sn
SpSK )(
)1
(S
S
n
n
S
SSK
nK
Voce:
pVK0 e)(
))(exp()(0 VV KKd
d
VK
99
APPENDIX IV
Calculation of RMSE:
n-a
yyRMSE t
n
t 1
Number of Data Points for T4 specimen: 3237
Number of Data Points for T6 specimen: 2150
Number of Parameters for Hollomon: 2
Number of Parameters for Voce: 3
Number of Parameters for Ludwig: 3
Number of Parameters for Swift: 3
100

APPENDIX V
Calculation of Quality Index:
(max)F
FT
e
eQ
Calculation of Ductility Potential:
YFe 106.08.41(%)(max)
True Stress:
)1( ee
True Strain:
)1ln( e
True Plastic Strain:
)/()1ln( Eep
EMg = 45000 MPa
101
VITA
I graduated High School and applied for undergraduate
program at University of Istanbul. I completed my internship in Kale Aero in 2011. I received
my Bachelors of Science degree in Metallurgy and Materials Engineering in 2014. I have been
accepted for the graduate program in Mechanical Engineering at University of North Florida.
During this program I have worked as teaching, research and laboratory assistant and also I have
published two papers which are listed below:
1. O. Unal, M. Tiryakioglu, On the Ductility Potential and Assessment of Structural Quality
in Mg Alloy Castings, Mater. Sci. and Eng. A. , 643, (2015), 51-54.
2. O. Unal, M. Tiryakioglu, Characterization of Tensile Deformation for AZ91D Mg Alloy
Castings, to be presented in TMS 2016.
102