atomic scale deformation mechanisms of amorphous ... · atomic scale deformation mechanisms of...
TRANSCRIPT

Atomic Scale Deformation Mechanisms of Amorphous Polyethyleneunder Tensile Loading
M.A. Tschopp1, J.L. Bouvard1, D.K. Ward2, M.F. Horstemeyer1
1 Center for Advanced Vehicular Systems, Mississippi State University; Starkville, MS 39759, USA2 Sandia National Laboratory; Livermore, CA 94551, USA
Keywords: Molecular Dynamics, Polyethylene, Deformation
Abstract
The molecular origin of plastic deformation within amor-phous polymers is an important issue that is still notwell understood. Here, we investigate the deformationmechanisms of amorphous polyethylene. Molecular dy-namics simulations were used to apply a tensile load toamorphous polyethylene using a united atom model. Arange of strain rates, chain lengths and chain numberswere sampled to investigate the stress-strain behavior andassociated deformation mechanisms. The large range inthese conditions (e.g., 100 times difference in strain rate)provided the contrast in response necessary to elucidatethe relationship between intrachain (Van der Waal’s inter-actions) and interchain (dihedral rotations) deformationmechanisms in amorphous polyethylene. Simulation re-sults show how internal mechanisms associated with chainrotation and entanglement evolve with increasing defor-mation. These results provide insight into the evolutionof internal state variables for multiscale models of ther-moplastic polymers.
Introduction
The molecular origin of plastic deformation within amor-phous polymers is an important issue that is still not wellunderstood. Atomistic simulations have provided insightinto the plastic deformation behavior of some thermoplas-tic polymer systems. However, although several groupshave studied the static, dynamic, and mechanical proper-ties of polyethylene (PE) systems, research on large sys-tems, particularly for mechanical properties, is still in itsinfancy. Molecular dynamics (MD) and molecular staticssimulations have proven to be essential tools for explor-ing the static, dynamic and mechanical properties of bulkamorphous polymers at the molecular levels. The objec-tive of this research is to study the relevant deformationmechanisms responsible for the different regimes (elas-ticity/yield/strain softening/strain hardening) observedduring uniaxial tension deformation of glassy PE usingatomic-scale simulations with a united atom model. Here,
we have investigated the stress-strain response and theenergy partitioning evolution for different chain lengths,number of chains and strain rates. In addition to stress-strain response, we also evaluated internal mechanismsassociated with bond length, bond angle, dihedral distri-butions, free volume and chain entanglements; for brevity,we present only chain rotation and entanglements here.Our main interest was correlating the stress-strain re-sponse to the deformation mechanisms responsible for themechanical behavior.
Simulation Methodology
Interatomic potential
The interatomic force field for amorphous PE is based ona united atom model using the DREIDING potential [1].There were several reasons why this potential was cho-sen. First, this study investigates uniaxial deformation ofamorphous PE systems with large numbers of monomers(up to 200,000 united atoms) as a function of strain rate.Full atom representations would require approximatelythree times the number of atoms (CH2) along with a morecomputationally-expensive force field and, quite possibly,a smaller timestep or different integration scheme dueto adding hydrogen. Therefore, the use of the unitedatom model and DREIDING potential was influenced inpart by the computational expense. Second, much of theprior literature regarding MD simulations of PE has usedthe DREIDING potential. In this sense, this work canbuild upon results previously obtained, while also provid-ing guidance as to the influence of boundary conditionswhen moving to full atom representations with optimizedforce fields. We leave deformation of full-atom polymerrepresentations for future work.
The united atom model used here considers each methylgroup (i.e., the CH2 monomer) as a single atom witha force field that determines the interactions betweenunited atoms. The DREIDING potential [1] has fourcontributing terms; bond stretching, changes in bond an-gle, changes in dihedral rotation, and van der Waals non-

bonded interactions. The total force field energy can beexpressed as
Etotal = Eb(r) + Eθ(θ) + Eφ(φ) + Enb(r) (1)
In the present simulations, the interaction potential hastwo components which are summed over all possible atomcombinations: bonded and non-bonded interaction terms.The bonded terms comprise bond stretching (r), bond-angle bending (θ) and dihedral angle torsion (φ). Thefunctional form of bonded energy is given as
Eb(r) =1
2Kb (r − r0)
2(2)
Eθ(θ) =1
2Kθ (θ − θ0)
2(3)
Eφ(φ) =
3∑i=0
Ci (cosφ)i
(4)
where Kb and Kθ are the stiffness constants for the bondlength and bond angle potentials, respectively, r0 and θ0are the equilibrium bond length and bond angle, respec-tively, and the variable Ci contains the coefficients of di-hedral multi-harmonic. For the parameters chosen in thepresent work, the global minimum of the dihedral po-tential is at 180◦, which corresponds to the planar transstate. In addition, the two local gauche minima are lo-cated at 60◦ and 300◦. The non-bonded or Van der Waalsinteractions are given by a Lennard-Jones potential, i.e.,
Enb(r) = 4ε
[(σr
)12−(σr
)6], r ≤ rc (5)
where r is the distance between two atoms, σ is the dis-tance at zero energy, and ε is the energy well depth. Thecutoff distance rc is taken as 10.5 Angstroms. The pa-rameters for the PE force field are given in the Table 1.
Deformation simulations
A parallel MD code, LAMMPS [2], that incorporates do-main decomposition was used to deform the polymer sim-ulation cells. A Nose-Hoover thermostat was used to reg-ulate the system temperature [3; 4]. The simulations wereperformed for three chain lengths (100, 1000, and 2000monomers) with three different number of chains (20, 200and 2000) for a total of 2x10⁴ to 2x10⁵ total united atoms;little effect was found with respect to chain length andchain number. The mechanical responses for each simu-lation resulted from averages of three different initial con-figurations to account for entropic effects due to the highnumber of possible chain conformations. Temperatures of
100 K and 250 K were examined here to select a temper-ature sufficiently below the glass transition temperature,Tg, and one close to room temperature but just below Tg.The initial chain structure was created using a methodsimilar to those previously developed using Monte Carloself-avoiding random walks [5]. The chain generation stepused a face-centered cubic (FCC) lattice superimposed onthe simulation cell with the nearest neighbor distance of1.53 Angstroms. Molecules were added to the lattice ina probabilistic stepwise manner, which based the proba-bility of chain growth in certain directions on the bondangle and the density of unoccupied sites in the region.
This initial structure was then inserted into the MDcode where an equilibration sequence was performed priorto deforming the amorphous polymer. The equilibrationsequence relaxes any high energy configurations that areartificially created due to the FCC lattice used to gen-erate the amorphous polymer structure. The relaxationinvolves four different steps. Initially, the simulation ranfor 105 timesteps (∆t=1 fs) using NVT dynamics at 500K followed by relaxation for 5x10⁵ timesteps (∆t=0.5fs) using NPT dynamics at 500 K. The next relaxationcooled the structure down to the desired temperature for5x105 timesteps followed by further relaxation of 5x10⁵
timesteps (∆t=1 fs) at the desired temperature (100 Kand 250 K).
Several microstructure metrics were used to quantita-tively validate the polymer chain geometry following equi-libration. The average bond length for all equilibratedsystems was 1.529 Angstroms and the average bond an-gle was 109.27◦. The average values were slightly lowerthan the equilibrium potential parameters r0 and θ0. Thedihedral angle distribution has a broad distribution withboth gauche and trans peaks. To calculate the fractionof trans conformations within the PE system, a thresholdvalue of 120◦ was used to delineate the gauche peak (cen-
Parameters ValuesKb 350 kcal/molr0 1.53 AngstromsKθ 60 kcal/mol/rad2
θ0 1.911 radC0 1.736 kcal/molC1 -4.490 kcal/molC2 0.776 kcal/molC3 6.990 kcal/molσ 4.01 Angstromsε 0.112 kcal/mol
Table 1: Interatomic potential parameters

tered about 66◦) from the trans peak (centered about180◦). The percent trans conformations in the initialstructure was 73.8% and 68.3% for the 100 K and 250K samples, respectively. The initial densities for theamorphous PE structures ranged from 0.87-0.91 g/cm3,slightly lower than experimental values for low densityPE (0.91-0.94 g/cm3), which contains a high degree ofshort and long chain branching. The glass transitiontemperature was used to verify that such equilibrationof the polymer structure was appropriate for deforma-tion simulations. The glass transition temperature Tg,delimiting the glassy regime to the rubbery one, was de-termined from the change in slope of the specific volumevs. temperature curve. The calculated values of ≈ 300 Khere are similar to those calculated by other groups usingMD, which fall in the range of 250-300 K, close to theexperimentally-measured value of 250 K.
The amorphous PE system was then deformed undera uniaxial tensile strain applied at a constant strain ratewith a zero-pressure condition for the two lateral sim-ulation cell faces. This deformation condition was im-plemented in LAMMPS by decoupling the boundary inthe loading direction from the NPT equations of motion[6]. The stress components were calculated from the sym-metric pressure tensor, which uses components from thekinetic energy tensor and the virial tensor. In additionto calculating the stress as a function of strain, the en-ergy contributions associated with the bond length, bondangles, dihedral angle and non-bonding interactions weretracked as a function of strain. Periodic dumps of theatomic configuration were performed to compute addi-tional microstructure metrics such as chain orientationor the percentage of trans dihedral conformations. Threedifferent strain rates (108 s−1, 109 s−1 and 1010 s−1) wereused with an initial configuration consisting of 20 poly-meric chains, each having 1000 monomers, to investigatethe effect of strain rate. To investigate the influence ofchain length and chain number, PE configurations wereuniaxially deformed at a strain rate of 109 s−1 for differentnumbers of chains (100 and 2000) and chain lengths (20,200, and 2000 monomers). The procedure used here andthe results shown within are described in more detail inHossain et al. [7].
Simulation Results
Stress-strain response
The stress-strain response was averaged for multiple con-figurations and the isothermal stress-strain curve for a20-chain, 1000-monomer per chain amorphous PE system
Figure 1: Stress-strain response of amorphous polyethy-lene deformed in uniaxial tension at strain rate of 1010
s−1 and temperature of 250 K. The accompanying im-ages show the polyethylene structure after equilibrationand at 100% true strain (colors represent united atomson separate chains).
deformed at 250 K and 1010 s−1 strain rate is shown inFigure 1. The stress-strain curve has four distinct regimestypical of experimental curves: elastic, yield, softeningand hardening. Initially, in the elastic regime, the stressincreases nearly linearly with increasing applied strain.Interestingly, the characteristic yield peak observed in ex-periments is also observed at strain rates of 1010 s−1, butis not observed at lower strain rates. Upon reaching theyield point, the stress then shows a decrease in stress forthe strain softening regime. Further deformation of PEcauses an increase in stress during the strain hardeningregime.
Figure 2 shows the stress-strain curves for a 20-chain,1000-monomer per chain amorphous PE system deformedat 250 K using strain rates of 108 s−1, 109 s−1 and 1010
s−1. The simulations at different strain rates exhibit dif-ferent stress-strain curves. The stress-strain curve at astrain rate of 1010 s−1 follows the typical trend with anelastic regime, followed by yield, and then followed by astrain softening and strain hardening regime, as shownin Fig. 1. The elastic modulus and peak yield stress in-creases with increasing strain rate. The trend of higherstresses for higher strain rates continues for the strain

Figure 2: Stress-strain response at 250 K for differentstrain rates.
softening and strain hardening regimes as well. However,the constant strain hardening slope indicates that themechanisms may be similar between the different strainrates. The elastic modulus and the yield stress increasewith increasing strain rate and decreasing temperature.
Internal energy evolution
Figure 3(a) shows the potential energy change of a 20-chain, 1000-monomer per chain amorphous PE system de-formed at 250 K for a strain rate of 1010 s−1, which corre-sponds to the stress-strain behavior observed in Figure 1.In addition to the total energy Etotal, the individual com-ponents of the energy are shown: the non-bonded energyEnb, the bonded energy Eb, the bond angle energy Eθ andthe dihedral energy Eφ. In the elastic region, the dihedral,angle and bond energies remain almost unchanged and amajority of the increase in total energy is correlated withan increase in the non-bonded energy, i.e., Van der Waal’sforces between polymer chains. The non-bonded energyincreases sharply in the elastic and strain softening re-gions, which can be associated with chain slippage mech-anisms. After the elastic region, the non-bonded energystays fairly constant while there are significant changes inthe bond angle and dihedral energies. The energy associ-ated with bond length steadily decreases as bond lengthsmove towards the equilibrium bond length. The dihedralangle energy increases in the strain softening regime and
then steadily decreases in the strain hardening regime asgauche conformations rotate to the lower energy transconformations. The total energy sharply increases in the
(a)
(b)
Figure 3: Energy decomposition for a polyethylene (PE)system with 20 chains consisting of 1000 monomers eachat 250 K for a strain rate of 1010 s−1. The non-bonded en-ergy changes most during the elastic regime, while the di-hedral and bonded energy changes most during the strainsoftening/hardening regimes.

elastic region due to non-bonded interactions and thenslowly decreases over the strain softening and hardeningregions as energy is dissipated via dihedral rotations andbond length changes to accommodate deformation.
Figure 3(b) shows the variation in internal energy for astrain rate of 108 s−1 for a 20-chain, 1000-monomer perchain amorphous PE system at 250 K. The lower strainrate has a significant effect on the energy evolution. Notethe decrease in the non-bonded energy as strain rate islowered. In fact, for a strain rate of 108 s−1, there is verylittle change in the energies associated with bond lengthand bond angles with increasing strain. The non-bondedinteraction energy only slightly increases before decreas-ing with increasing strain. The dihedral angle (and total)energy immediately decreases with increasing strain dur-ing the elastic region, unlike the behavior observed for1010 s−1 strain rate in Fig. 3. Interestingly, because thedihedral energy decrease occurs during the elastic regimeat a strain rate of 108 s−1, the non-bonded interactionenergy does not increase as sharply as higher strain rates,signifying a change in where the energy associated withdeformation is accommodated at lower strain rates.
Internal structure evolution
The change in the dihedral distribution from gauche totrans conformations as a function of strain is also im-portant to deformation in polymer systems. Figure 4shows how the %trans conformations evolves as a func-tion of strain at 250 K. The %trans conformations inthe simulation cell was calculated using a dihedral an-gle threshold of 120◦. Additionally, this data is plot-ted for three different strain rates and for two differentchain length and chain number combinations (20 1000-monomer chains, 2000 100-monomer chains) to comparebehavior between different conditions. First, the %transconformations increases at a faster rate as the strain ratedecreases, i.e., a strain rate of 108 s−1 has the fastestincrease in trans conformations. This is as expected; thelower strain rate will allow more time for chains to ro-tate to trans conformations. However, the main differencebetween the three strain rates occurs in the elastic andstrain softening regimes (εtrue < 0.5), and the increase in%trans conformations during the strain hardening regionis nearly constant. Notice that the 1010 s−1 strain rateshows very little increase in the %trans conformationsfor the elastic region, in agreement with previous simula-tions and experiments. The effect of the polymer chainlength was also examined and one representative curve isincluded in Figure 4 for comparison. For a strain rate of109 s−1, the 2000 100-monomer chain PE system shows
Figure 4: Stress-strain response at 250 K for differentstrain rates.
very similar behavior to the 20 1000-mer chain system,when excluding the initially higher %trans conformationsin the former system.
The chain entanglement evolution is also important fordeformation of polymer systems. In general, fracture ofmany polymer materials is expected to occur due to chaindisentanglement rather than chain scission, because ofthe strong carbon-carbon bonds in the polymer backbone.Here, we have used the geometric technique of Yashiro etal. [8] to calculate the chain entanglement. This techniquefirst creates two vectors which originate from each atomto neighboring atoms that are separated by 10 atoms onthe same chain, i.e., one vector from atom i with atomi − 10 and one vector from atom i to atom i + 10. Theangle between these two vectors is calculated for each ap-plicable atom and a threshold parameter of 90◦ is usedto specify if the atom is classified as entangled or not.The atoms classified as entangled via this technique areconsidered to be constrained by neighboring chains. Here,we have divided the number of ‘entangled’ atoms by thetotal number of atoms to give a normalized entanglementparameter. This entanglement parameter actually repre-sents the percent of entangled atoms and is assumed tobe correlated to the entanglement density.
Figure 5 shows the evolution of the entanglement pa-rameter as a function of strain for three different strainrates and two chain lengths at 250 K. Notice that for theinitial stages of deformation, the entanglement parameter
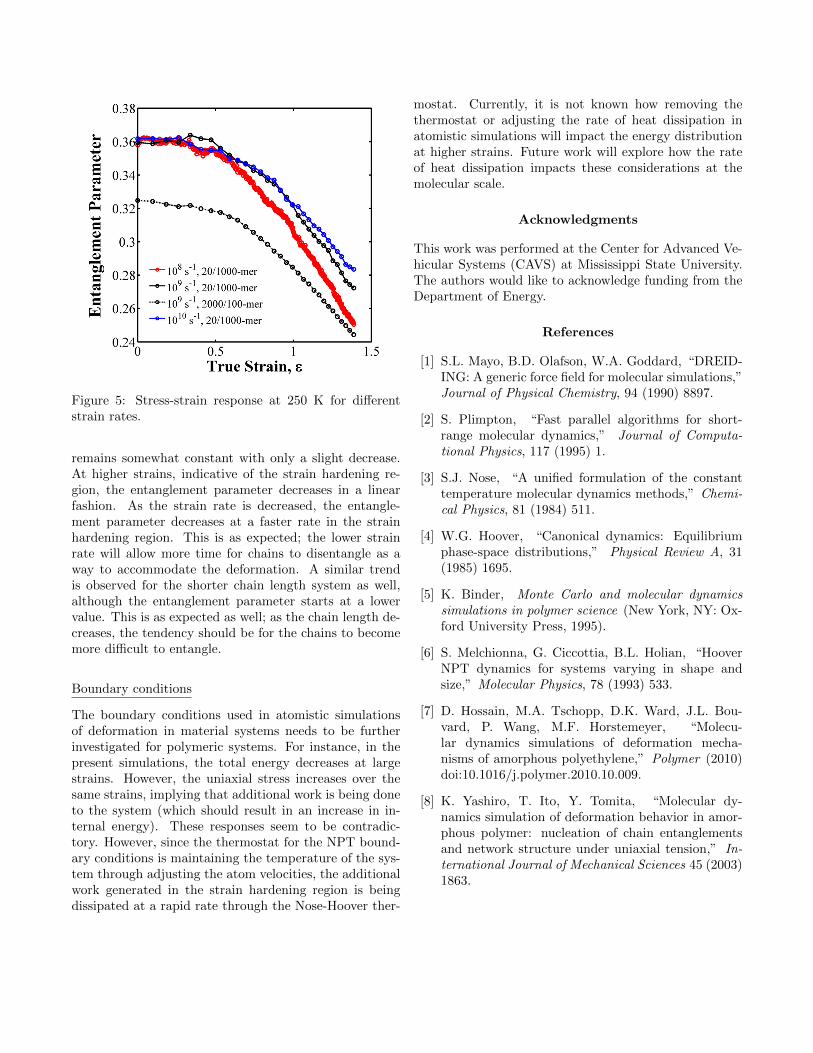
Figure 5: Stress-strain response at 250 K for differentstrain rates.
remains somewhat constant with only a slight decrease.At higher strains, indicative of the strain hardening re-gion, the entanglement parameter decreases in a linearfashion. As the strain rate is decreased, the entangle-ment parameter decreases at a faster rate in the strainhardening region. This is as expected; the lower strainrate will allow more time for chains to disentangle as away to accommodate the deformation. A similar trendis observed for the shorter chain length system as well,although the entanglement parameter starts at a lowervalue. This is as expected as well; as the chain length de-creases, the tendency should be for the chains to becomemore difficult to entangle.
Boundary conditions
The boundary conditions used in atomistic simulationsof deformation in material systems needs to be furtherinvestigated for polymeric systems. For instance, in thepresent simulations, the total energy decreases at largestrains. However, the uniaxial stress increases over thesame strains, implying that additional work is being doneto the system (which should result in an increase in in-ternal energy). These responses seem to be contradic-tory. However, since the thermostat for the NPT bound-ary conditions is maintaining the temperature of the sys-tem through adjusting the atom velocities, the additionalwork generated in the strain hardening region is beingdissipated at a rapid rate through the Nose-Hoover ther-
mostat. Currently, it is not known how removing thethermostat or adjusting the rate of heat dissipation inatomistic simulations will impact the energy distributionat higher strains. Future work will explore how the rateof heat dissipation impacts these considerations at themolecular scale.
Acknowledgments
This work was performed at the Center for Advanced Ve-hicular Systems (CAVS) at Mississippi State University.The authors would like to acknowledge funding from theDepartment of Energy.
References
[1] S.L. Mayo, B.D. Olafson, W.A. Goddard, “DREID-ING: A generic force field for molecular simulations,”Journal of Physical Chemistry, 94 (1990) 8897.
[2] S. Plimpton, “Fast parallel algorithms for short-range molecular dynamics,” Journal of Computa-tional Physics, 117 (1995) 1.
[3] S.J. Nose, “A unified formulation of the constanttemperature molecular dynamics methods,” Chemi-cal Physics, 81 (1984) 511.
[4] W.G. Hoover, “Canonical dynamics: Equilibriumphase-space distributions,” Physical Review A, 31(1985) 1695.
[5] K. Binder, Monte Carlo and molecular dynamicssimulations in polymer science (New York, NY: Ox-ford University Press, 1995).
[6] S. Melchionna, G. Ciccottia, B.L. Holian, “HooverNPT dynamics for systems varying in shape andsize,” Molecular Physics, 78 (1993) 533.
[7] D. Hossain, M.A. Tschopp, D.K. Ward, J.L. Bou-vard, P. Wang, M.F. Horstemeyer, “Molecu-lar dynamics simulations of deformation mecha-nisms of amorphous polyethylene,” Polymer (2010)doi:10.1016/j.polymer.2010.10.009.
[8] K. Yashiro, T. Ito, Y. Tomita, “Molecular dy-namics simulation of deformation behavior in amor-phous polymer: nucleation of chain entanglementsand network structure under uniaxial tension,” In-ternational Journal of Mechanical Sciences 45 (2003)1863.