characterization of rib cortical bone thickness … · acknowledgement ... distribution of the ages...
TRANSCRIPT
Characterization of Rib Cortical Bone Thickness Changes
With Age and Sex
By
Sarah K. Lynch
A Thesis Submitted to the Graduate Faculty of
VIRGINIA TECH – WAKE FOREST UNIVERSITY
SCHOOL OF BIOMEDICAL ENGINEERING & SCIENCES
In Partial Fulfillment of the Requirements
for the Degree of
MASTER OF SCIENCE
Biomedical Engineering
May 2015
Winston-Salem, North Carolina
Approved by:
Joel D. Stitzel, PhD, Advisor, Chair
Examining Committee:
F. Scott Gayzik, PhD
Ashley A. Weaver, PhD

ii
ACKNOWLEDGEMENTS
I would like to start by thanking Dr. Joel D. Stitzel, my advisor and mentor, who
has not only given me the opportunity to pursue higher education but has encouraged me
along the way, both in academics and in life. I can honestly say that I would not be where
I am today without his assistance, understanding, and guidance. I’d like to give a special
thanks to Dr. Ashley Weaver, whose support, contributions, and guidance has been
invaluable, and Dr. Gayzik, for being a great mentor as well. I’d also like to thank Jill
Urban, Elizabeth Davenport, and Samantha Schoell, for their friendship, encouragement,
and support throughout this project, and everyone in the Center for Injury Biomechanics,
for sharing their expertise and support in making this project possible.
I’d finally like to thank my friends and family who have supported me behind the
scenes: offering me encouragement, and understanding as this project came together.
Thanks to my parents, who have always believed in me and offered me motivation when
I needed it most. It is through the efforts of everyone involved, both directly and
indirectly, that this project was made possible.

iii
TABLE OF CONTENTS
List of Tables ............................................................................................................................................ v
List of Figures .......................................................................................................................................... vi
Abstract ................................................................................................................................................ viii
CHAPTER I: INTRODUCTION & BACKGROUND ................................................. 1
Motor Vehicle Crash Thoracic Injuries ...................................................................................................... 1
Thoracic Injury and the Elderly ................................................................................................................. 1
Rib Cortical Bone Thicknesses with Age ................................................................................................... 2
Chapter Summaries .................................................................................................................................. 4 Chapter II: Quantification of Rib Cortical Thickness from Clinical Computed Tomography Scans .................. 4 Chapter III: Characterization and Regression of Rib Cortical Thickness from Clinical Computed Tomography Scans ................................................................................................................................................................ 4 Chapter IV: Summary of Research ................................................................................................................... 4
References ............................................................................................................................................... 5
CHAPTER II: QUANTIFICATION OF RIB CORTICAL THICKNESS FROM
CLINICAL COMPUTED TOMOGRAPHY SCANS ................................................... 8
1. Abstract ............................................................................................................................................... 9
2. Introduction ....................................................................................................................................... 10
3. Methods ............................................................................................................................................. 12
4. Results ............................................................................................................................................... 20
5. Discussion .......................................................................................................................................... 27
6. Conclusion .......................................................................................................................................... 29
7. Acknowledgement ............................................................................................................................. 30
8. References ......................................................................................................................................... 31
9. Appendix ............................................................................................................................................ 34
CHAPTER III: CHARACTERIZATION AND REGRESSION OF RIB
CORTICAL THICKNESS FROM CLINICAL COMPUTED TOMOGRAPHY
SCANS ............................................................................................................................. 36
1. Abstract .............................................................................................................................................. 37
2. Introduction ....................................................................................................................................... 38
3. Methods ............................................................................................................................................. 39
4. Results ............................................................................................................................................... 42
5. Discussion .......................................................................................................................................... 49
6. Conclusion .......................................................................................................................................... 52

iv
7. Acknowledgement ............................................................................................................................. 52
8. References ......................................................................................................................................... 53
CHAPTER IV: SUMMARY OF RESEARCH ............................................................ 56
SCHOLASTIC VITA ..................................................................................................... 57

v
LIST OF TABLES
Table 1. Publication plan for research outlined in this thesis. .......................................... 56
vi
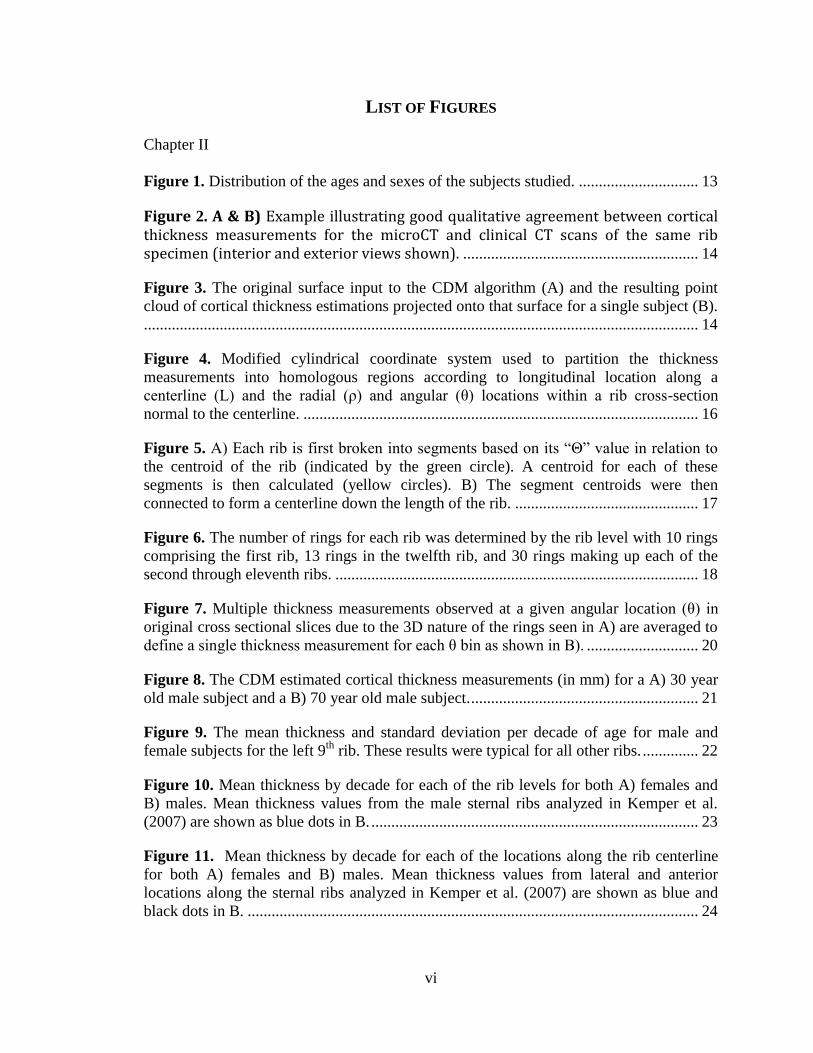
LIST OF FIGURES
Chapter II
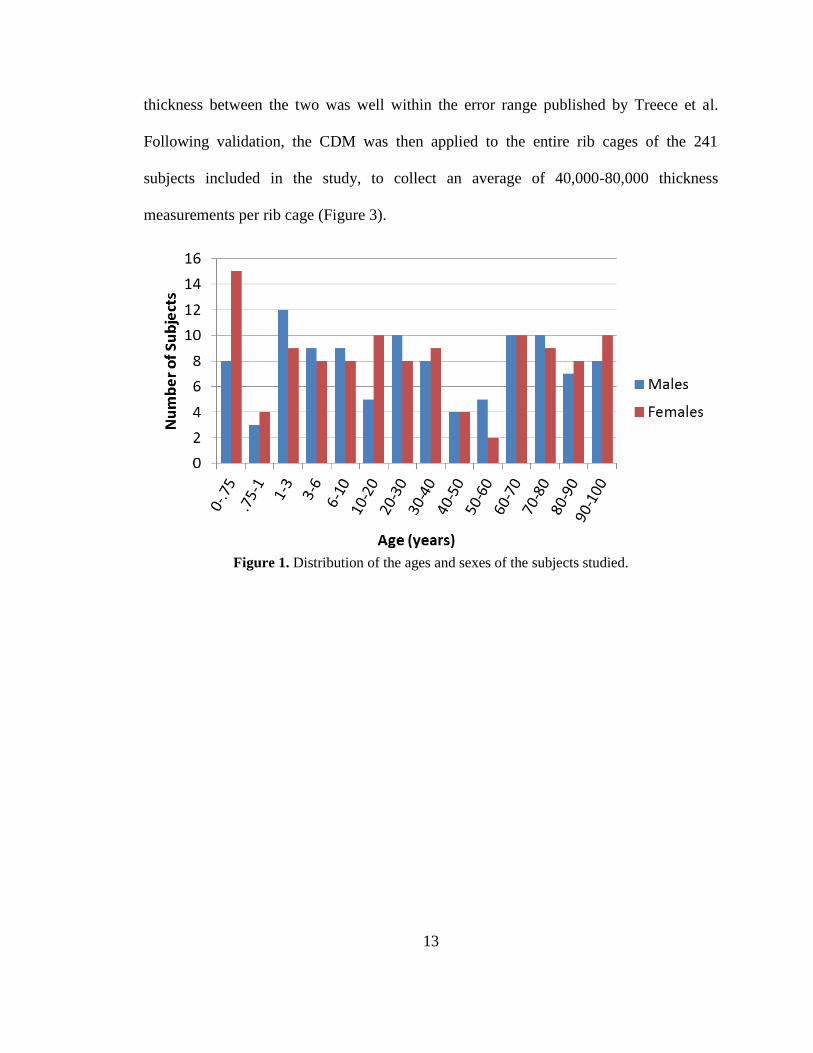
Figure 1. Distribution of the ages and sexes of the subjects studied. .............................. 13
Figure 2. A & B) Example illustrating good qualitative agreement between cortical thickness measurements for the microCT and clinical CT scans of the same rib specimen (interior and exterior views shown). ........................................................... 14
Figure 3. The original surface input to the CDM algorithm (A) and the resulting point
cloud of cortical thickness estimations projected onto that surface for a single subject (B).
........................................................................................................................................... 14
Figure 4. Modified cylindrical coordinate system used to partition the thickness
measurements into homologous regions according to longitudinal location along a
centerline (L) and the radial (ρ) and angular (θ) locations within a rib cross-section
normal to the centerline. ................................................................................................... 16
Figure 5. A) Each rib is first broken into segments based on its “Θ” value in relation to
the centroid of the rib (indicated by the green circle). A centroid for each of these
segments is then calculated (yellow circles). B) The segment centroids were then
connected to form a centerline down the length of the rib. .............................................. 17
Figure 6. The number of rings for each rib was determined by the rib level with 10 rings
comprising the first rib, 13 rings in the twelfth rib, and 30 rings making up each of the
second through eleventh ribs. ........................................................................................... 18
Figure 7. Multiple thickness measurements observed at a given angular location (θ) in
original cross sectional slices due to the 3D nature of the rings seen in A) are averaged to
define a single thickness measurement for each θ bin as shown in B). ............................ 20
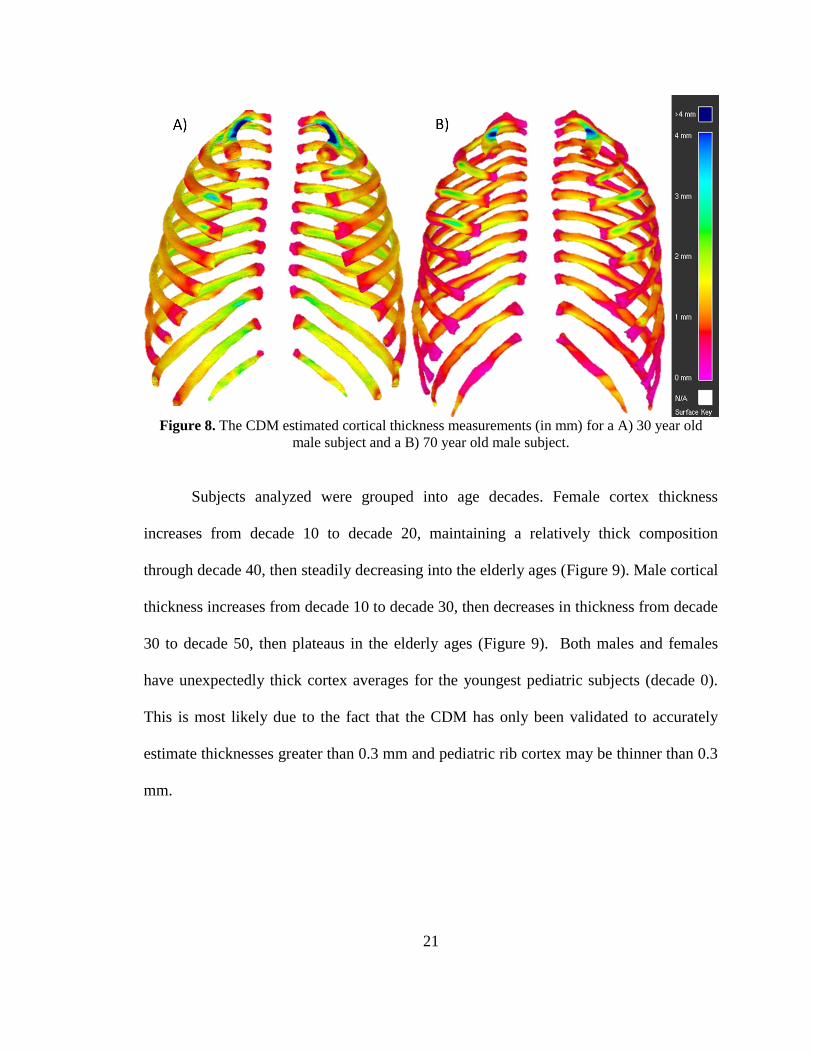
Figure 8. The CDM estimated cortical thickness measurements (in mm) for a A) 30 year
old male subject and a B) 70 year old male subject. ......................................................... 21
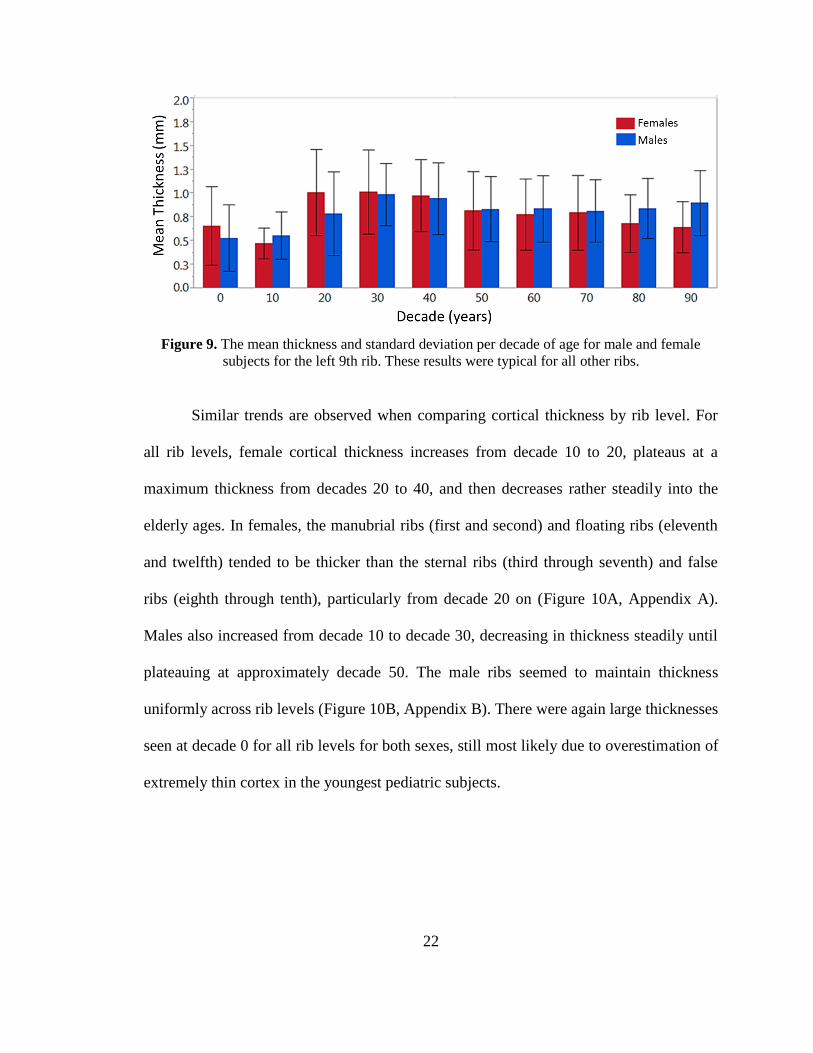
Figure 9. The mean thickness and standard deviation per decade of age for male and
female subjects for the left 9th
rib. These results were typical for all other ribs. .............. 22
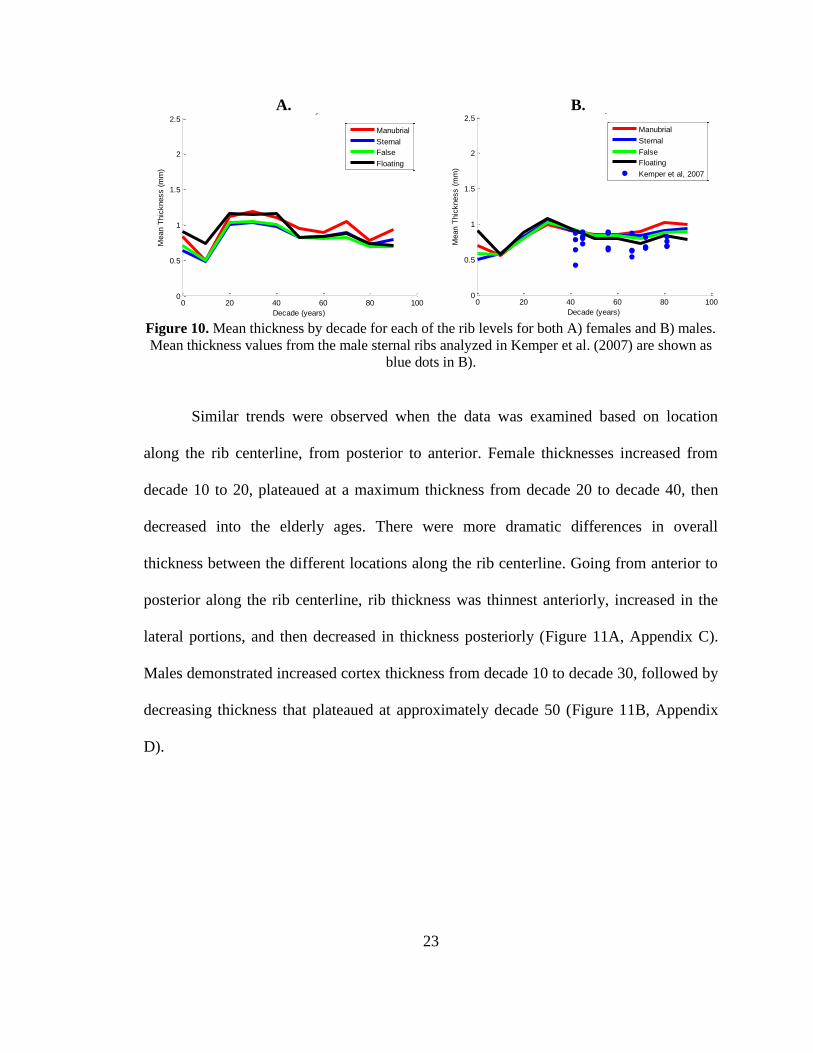
Figure 10. Mean thickness by decade for each of the rib levels for both A) females and
B) males. Mean thickness values from the male sternal ribs analyzed in Kemper et al.
(2007) are shown as blue dots in B. .................................................................................. 23
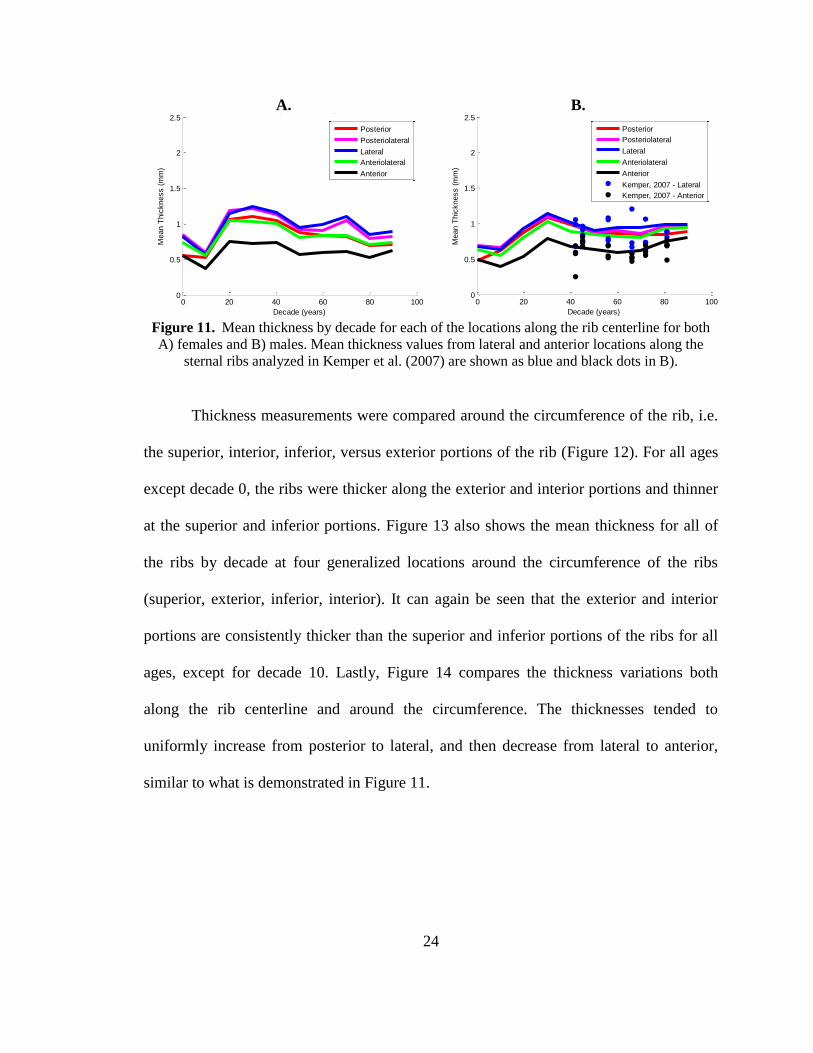
Figure 11. Mean thickness by decade for each of the locations along the rib centerline
for both A) females and B) males. Mean thickness values from lateral and anterior
locations along the sternal ribs analyzed in Kemper et al. (2007) are shown as blue and
black dots in B. ................................................................................................................. 24

vii
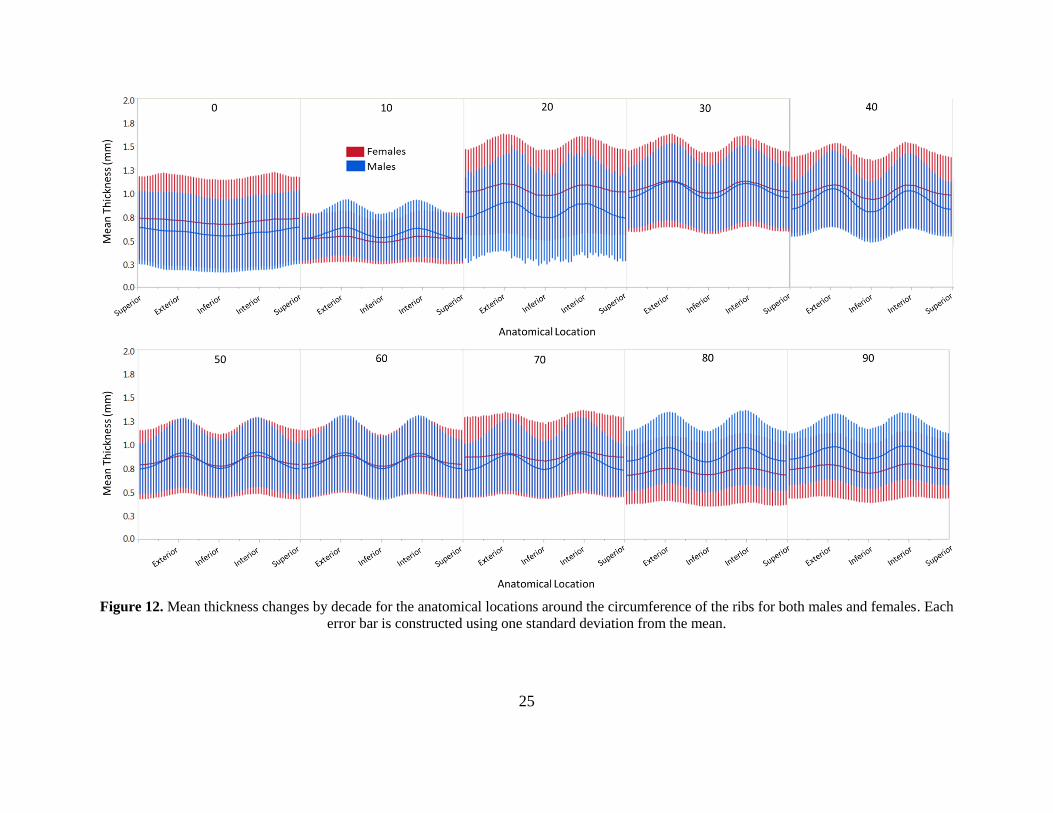
Figure 12. Mean thickness changes by decade for the anatomical locations around the
circumference of the ribs for both males and females. Each error bar is constructed using
one standard deviation from the mean. ............................................................................. 25
Figure 13. Mean thickness changes for males and females by decade for each of the
locations around the circumference of the ribs. ................................................................ 26
Figure 14. Mean thickness plotted by location along the rib centerline for four
anatomical locations around the rib circumference. ......................................................... 26
Chapter III
Figure 15. Distribution of the ages and sexes of the subjects included in this study. ...... 40
Figure 16. The organization of A) rings and B) angle measures into anatomical
categories along the length of the rib and around the circumference of the rib,
respectively. ...................................................................................................................... 41
Figure 17. A) An example regression curve for a single sub-section for the males. B)
This sub-section is on the medial aspect of the third ring on the left fifth rib. ................. 43
Figure 18. The resulting cortex thickness for the entire ribcage for both males and
females at ages 20, 40, 60 and 80. .................................................................................... 43
Figure 19. A) The percent change in cortex thickness (average from the entire rib cage)
relative to a 10 year old for both males and females. B) The regressed cortex thickness
with age for both males and females................................................................................. 44
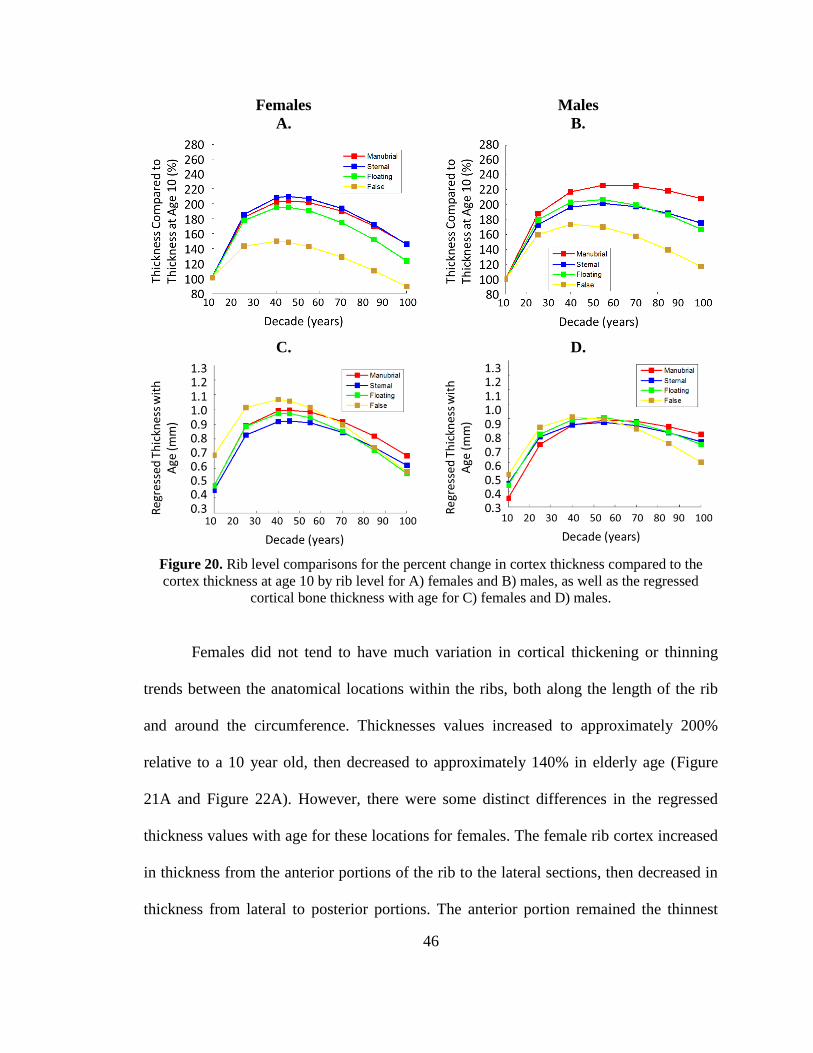
Figure 20. Rib level comparisons for the percent change in cortex thickness compared to
the cortex thickness at age 10 by rib level for A) females and B) males, as well as the
regressed cortical bone thickness with age for C) females and D) males. ........................ 46
Figure 21. The percent change in cortex thickness compared to the cortex thickness at
age 10 by anatomical location down the length of the rib for A) females and B) males, as
well as the regressed cortical bone thickness with age for C) females and D) males....... 48
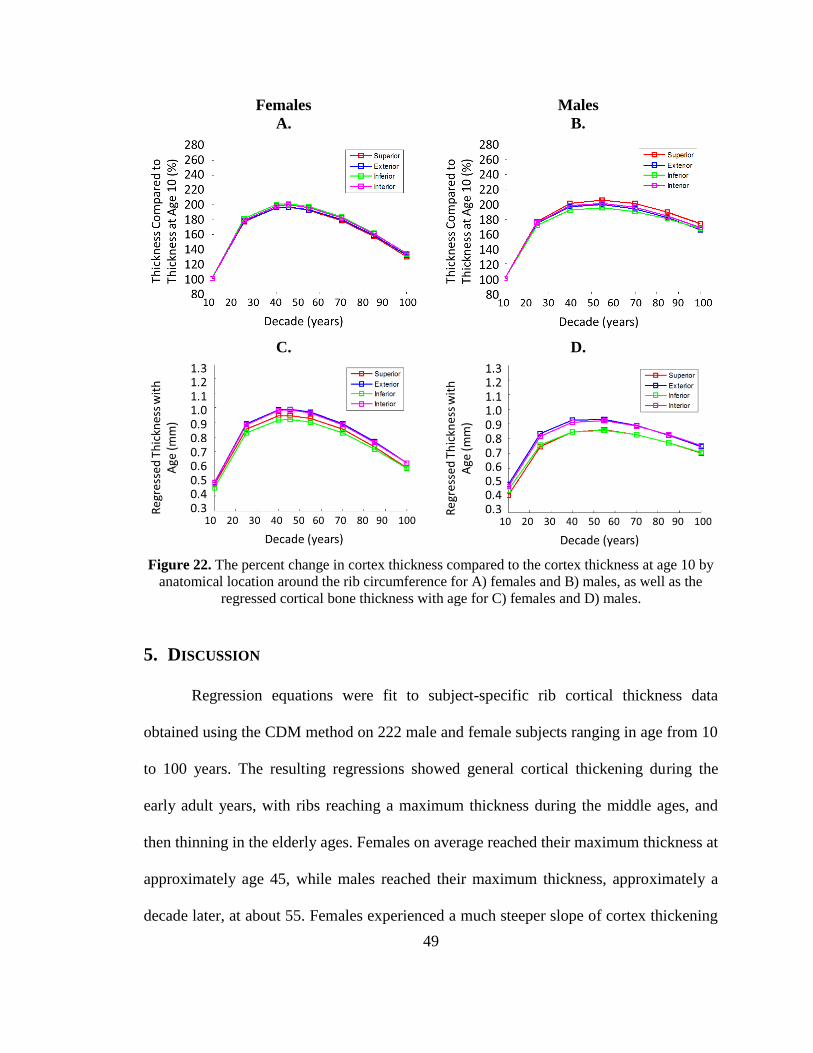
Figure 22. The percent change in cortex thickness compared to the cortex thickness at
age 10 by anatomical location around the rib circumference for A) females and B) males,
as well as the regressed cortical bone thickness with age for C) females and D) males. . 49

viii
ABSTRACT
Motor vehicle crashes (MVCs) were the leading cause of unintentional fatal
injuries and the fourth leading cause of unintentional nonfatal injuries in the United
States in 2007. Of these injuries, the thoracic injuries rank second in terms of frequency
as well as overall economic cost. Of the thoracic injuries, rib fractures are extremely
common; present in nearly 94% of severely injured belted occupants. Elderly occupants
have increased mortality and morbidity associated with rib fractures. One factor that is
thought to influence rib fracture that changes with age (possibly contributing to increased
injury risk in the elderly population) is the rib cortical bone.
The first aspect of this research outlined novel techniques for estimating rib
cortical bone thickness changes with age and sex from retrospective clinical computed
tomography (CT) scan data. The thicknesses estimated using that technique were then
compared by location within the ribcage and between the different ages and sexes. The
second aspect of this research was to fit a regression curve to the cortex thickness
estimations to characterize the exact cortical thickness changes with age at all of the
different locations within the ribcage for both sexes. These results were also compared by
location within the ribcage and between the different sexes.
1
Chapter I: Introduction & Background
MOTOR VEHICLE CRASH THORACIC INJURIES
In 2009, there were an estimated 10.8 million motor vehicle crashes (MVCs) in
the United States alone, which were responsible for nearly 34,000 deaths in the US.
Worldwide, MVCs kill 1.3 million people. MVCs were the leading cause of
unintentional fatal injuries and the fourth leading cause of unintentional nonfatal injuries
in the United States in 2007. In MVCs, thoracic injury ranks second only to head injury
in terms of frequency, number of fatal and serious injuries, as well as overall economic
cost [1]. Although increases in the number and complexity of safety systems have
decreased the amount of thoracic injuries, rib fractures still remain a common injury
among occupants. Rib fractures have been identified in up to 93.5% of severely or fatally
injured belted occupants [2]. Rib fractures are typically caused by large chest deflections,
inducing bending in the ribs and resulting in fracture.
THORACIC INJURY AND THE ELDERLY
Although rib fractures are common, they are associated with an increased risk in
mortality and morbidity in the elderly population [3-5]. Elderly occupants are not only
more likely to be wearing their seatbelts, which puts them at an increased risk for rib
fractures, but rib fractures in the elderly are associated with over two times the mortality
risk of younger patients [3-5]. One study found that 47% of occupants over the age of 64
who died in a frontal collision sustained a fatal thoracic injury [6]. Another study of
occupants from the Crash Injury Research and Engineering Network (CIREN) database

2
found that rib fractures were the worst chest injury sustained in 40% of occupants over
the age of 60 who died of chest injuries [6]. Holcomb et al found increased rib fracture
risk in patients as young as 45 years of age [7].
In 2005, Kent et al describes three ways that the ribs change with age that may
account for the decrease in injury tolerance of rib fractures in the elderly population: 1)
material changes, 2) compositional changes (including cross sectional cortex area), and 3)
thoracic geometry changes. There has been extensive research done to characterize rib
material property changes with age using coupon, whole rib, and whole thorax loading
configurations [8-10]. Rib geometry changes over a large span of ages have also been
quantified [11, 12]. Studies have also been done that examined rib cortical bone thickness
and area variations throughout the ribcage using microscopy estimation and microCT
measurements [13-15].
Kemper et al. (2007) references a study done on seven male cadaver ribs ranging
in age from 42 to 81 years, and Choi’s 2000 paper also used 7 male cadavers, though they
ranged in age from 64 to 75 years [13, 14, 16]. Both of these studies did, however, find
rib cortex thickness variations with rib level (first through twelfth), attachment (true,
false, versus floating), laterality (right versus left), and anatomical region (anterior,
lateral, posterior, superior, inferior, etc.).
RIB CORTICAL BONE THICKNESSES WITH AGE
Another method of obtaining rib cortical thickness data is from clinical computed
tomography (CT) scan measurements. The full-width at half-maximum (FWHM)
technique applied to CT scans estimates the thickness of an object that does not have
3
clearly defined, sharp edges, as is the case with cortical bone in clinical CT scans due to
limited resolution. The FWHM technique, however, tends to overestimate thicknesses of
objects less than 2.5mm thick such as the ribs. A more accurate method for estimating
cortex thickness from clinical CT scans was proposed by Treece et al. which will
henceforth be referred to as the cortical density method (CDM) [17, 18]. The CDM
assumes a constant cortex density to estimate the cortical bone thickness from the clinical
CT scan allowing for accurate estimation of cortex thickness down to approximately 0.3
mm.
Cortical bone varies in thickness based on changes in bone resorption and
formation, which can be influenced by a person’s hormone and activity levels [19-22]. As
a result, there are rib and regional variations in cortex thickness within an individual as
well as variations in cortex thickness between individuals of different ages and sexes.
Many studies have worked to capture the exact changes in cortex thickness and cortical
area with age, though none have looked at the changes with age and sex regionally within
the ribs [23-25].
The first objective of this study is to apply the CDM to a retrospective collection
of clinical CT scans spanning ages 0-100 and both sexes. The second aim of this study is
to compare the resulting estimated cortical thickness variations with age, sex, rib level,
rib attachment, and anatomical location within each rib. The next objective of this study
is to fit a regression curve to cortical thickness estimates throughout the ribcage to
characterize regional cortex thickness changes with age and sex. The final aim of this
study is to compare the resulting regressed cortical thickness variations with age, sex, rib
level, rib attachment, and anatomical location within each rib.

4
CHAPTER SUMMARIES
Chapter II: Quantification of Rib Cortical Thickness from Clinical Computed
Tomography Scans
The objective of this work is to apply the CDM to a retrospective collection of clinical
CT scans spanning ages 0-100 and both sexes. The second aim of this study is to compare
the resulting estimated cortical thickness variations with rib level, rib attachment, age,
sex, and anatomical location within each rib.
Chapter III: Characterization and Regression of Rib Cortical Thickness from
Clinical Computed Tomography Scans
The objective of this study is to fit a regression curve to cortical thickness estimates
throughout the ribcage to characterize regional cortex thickness changes with age and
sex. The second aim of this study is to compare the resulting regressed cortical thickness
variations with age, sex, rib level, and anatomical location within each rib.
Chapter IV: Summary of Research
A brief overview of work presented in this thesis.

5
REFERENCES
1. Ruan, J., et al., Prediction and analysis of human thoracic impact responses and
injuries in cadaver impacts using a full human body finite element model. Stapp
Car Crash J, 2003. 47: p. 299-321.
2. Arajärvi E, S.S., Chest injuries sustained in severe traffic accidents by seatbelt
wearer. J Trauma, 1989(29): p. 37-41.
3. Stawicki, S.P., et al., Rib fractures in the elderly: a marker of injury severity. J
Am Geriatr Soc, 2004. 52(5): p. 805-8.
4. Bergeron, E., et al., Elderly Trauma Patients with Rib Fractures Are at Greater
Risk of Death and Pneumonia. J Trauma, 2003. 54(3): p. 478-485.
5. Bulger, E.M.M.D., et al., Rib Fractures in the Elderly. Journal of Trauma-Injury
Infection & Critical Care, 2000. 48(6): p. 1040-1047.
6. Kent, R., et al., Structural and material changes in the aging thorax and their role
in crash protection for older occupants. Stapp Car Crash J, 2005. 49: p. 231-49.
7. Holcomb, J.B., et al., Morbidity from rib fractures increases after age 45. J Am
Coll Surg, 2003. 196(4): p. 549-55.
8. Golman, A.J., et al., Injury prediction in a side impact crash using human body
model simulation. Accident Analysis & Prevention, 2014. 64: p. 1-8.
9. El-Jawahri, R.E., Laituri, T.R., Ruan, J.S., Rouhana, S.W., Barbat, S.D.,
Development and Validation of Age-Dependent FE Human Models of a Mid-Sized
Male Thorax. Stapp Car Crash Journal, 2010. 54: p. 407-430.
10. Ito, O., Dokko, Y., Ohashi, K. , Development of adult and elderly FE thorax
skeletal models, in Society of Automotive Engineers. 2009.
6
11. Weaver, A.A., S.L. Schoell, and J.D. Stitzel, Morphometric analysis of variation
in the ribs with age and sex. J Anat, 2014. 225(2): p. 246-61.
12. Gayzik, F.S., et al., Quantification of age-related shape change of the human rib
cage through geometric morphometrics. J Biomech, 2008. 41(7): p. 1545-54.
13. Kemper, A.R., et al., The biomechanics of human ribs: material and structural
properties from dynamic tension and bending tests. Stapp Car Crash J, 2007. 51:
p. 235-73.
14. Choi, Y.C. and I. Lee, Thorax FE Model for Older Population. Japanese Scoeity
of Mechanical Engineers, Fukuoka, 2009.
15. Sedlin, E.D. and H.M. Frost, Variations in Cross-section Area of Rib Cortex.
Journal of Gerontology, 1963. 18: p. 9-13.
16. Kemper, A.R., et al., Material properties of human rib cortical bone from
dynamic tension coupon testing. Stapp Car Crash J, 2005. 49: p. 199-230.
17. Treece, G.M., et al., High resolution cortical bone thickness measurement from
clinical CT data. Med Image Anal, 2010. 14(3): p. 276-90.
18. Treece, G.M., K.E. Poole, and A.H. Gee, Imaging the femoral cortex: thickness,
density and mass from clinical CT. Med Image Anal, 2012. 16(5): p. 952-65.
19. Parfitt, A.M., Age-related structural changes in trabecular and cortical bone:
cellular mechanisms and biomechanical consequences. Calcif Tissue Int, 1984.
36 Suppl 1: p. S123-8.
20. Chen, H., et al., Age-related changes in trabecular and cortical bone
microstructure. Int J Endocrinol, 2013. 2013: p. 213234.
7
21. Macdonald, H.M., et al., Age-related patterns of trabecular and cortical bone loss
differ between sexes and skeletal sites: a population-based HR-pQCT study. J
Bone Miner Res, 2011. 26(1): p. 50-62.
22. Thompson, D.D., Age changes in bone mineralization, cortical thickness, and
haversian canal area. Calcif Tissue Int, 1980. 31(1): p. 5-11.
23. Lillie, E.M., et al., Estimation of skull table thickness with clinical CT and
validation with microCT. J Anat, 2015. 226(1): p. 73-80.
24. Urban, J.E., et al., Evaluation of morphological changes in the adult skull with
age and sex. J Anat, 2014.
25. Karlsson, M.K., et al., An Increase in Forearm Cortical Bone Size After
Menopause May Influence the Estimated Bone Mineral Loss-A 28-Year
Prospective Observational Study. J Clin Densitom, 2015.

8
Chapter II: Quantification of Rib Cortical Thickness from
Clinical Computed Tomography Scans
Sarah K. Lynch, Ashley A. Weaver, Samantha L. Schoell, Joel D. Stitzel
Virginia Tech – Wake Forest University Center for Injury Biomechanics,
Winston-Salem, NC

9
1. ABSTRACT
Motor vehicle crashes (MVCs) are responsible for nearly 34,000 deaths in the
United States, with a large number of serious and fatal injuries sustained in MVCs
occurring in the thorax. Thoracic injuries are associated with increased mortality and
morbidity in elderly populations, most likely due to variations that occur within the
ribcage as people age, including geometry, material property, and compositional (cortex)
changes. In this study, cortical bone thickness changes in the ribs were characterized by
applying a cortical thickness estimation algorithm to retrospective clinical computed
tomography (CT) scans of 241 subjects spanning ages 0-100 in both sexes. The rib cortex
thickness estimations were then partitioned into homologous regions and compared with
age, sex, rib level, rib attachment, and anatomical location within each rib. The cortex
was thicker in the manubrial (ribs 1-2) and floating ribs (ribs 8-10) in the females
compared to the female sternal (ribs 3-7) and false (ribs 11-12) ribs, though there was not
much difference in cortex thickness based on rib level for the males. The anterior
portions of the rib cortical bone remained the thinnest for both males and females,
increasing in thickness to a maximum at the lateral portions of the ribs, and then thinning
to the posterior portions. The exterior and interior portions of the ribs were thicker than
the superior and inferior aspects for all locations down the length of the rib for both males
and females for ages 10 and older. Understanding these changes will lead to more
biofidelic thorax models and will lead to enhanced safety for occupants of all ages.

10
2. INTRODUCTION
In 2009, there were an estimated 10.8 million motor vehicle crashes (MVCs) in
the United States alone, which were responsible for nearly 34,000 deaths. In MVCs,
thoracic injury ranks second only to head injury in terms of frequency, number of fatal
and serious injuries, as well as overall economic cost [1]. Specifically, rib fractures have
been identified in up to 93.5% of severely or fatally injured belted occupants [2].
Although rib fractures are common, they are associated with an increased risk in
mortality and morbidity in the elderly population [3-5]. Elderly occupants are not only
more likely to be wearing their seatbelts, which puts them at an increased risk for rib
fractures, but rib fractures in the elderly are associated with over two times the mortality
risk of younger patients [3-5]. One study found that 47% of occupants over the age of 64
who died in a frontal collision sustained a fatal thoracic injury [6]. Another study of
occupants from the Crash Injury Research and Engineering Network (CIREN) database
found that rib fractures were the worst chest injury sustained in 40% of occupants over
the age of 60 who died of chest injuries [6].
Kent et al. (2005) described three ways that the ribs change with age that may
account for the decrease in injury tolerance of rib fractures in the elderly population: 1)
material changes, 2) compositional changes (including cross sectional cortex area), and 3)
thoracic geometry changes [6]. There has been extensive research done to characterize rib
material property changes with age using coupon, whole rib, and whole thorax loading
configurations [7-9]. Rib geometry changes over a large span of ages have also been
quantified [10, 11]. Accurate quantification of rib cortical bone thickness variation with
age and between the sexes has been limited in previous studies, as this thickness is
11
usually measured using microCT scans of elderly cadaver ribs. Kemper et al. (2007)
references a study done on seven male cadaver ribs ranging in age from 42 to 81 years,
and Choi and Lee (2009) also used 7 male cadavers, though they ranged in age from 64 to
75 years [12-14]. Both of these studies did, however, find rib cortex thickness variations
with rib level (first through twelfth), attachment (true, false, versus floating), laterality
(right versus left), and anatomical region (anterior, lateral, posterior, superior, inferior,
etc.).
Another method of obtaining rib cortical thickness data is from clinical computed
tomography (CT) scan measurements. The full-width at half-maximum (FWHM)
technique applied to CT scans estimates the thickness of an object that does not have
clearly defined, sharp edges, as is the case with cortical bone in clinical CT scans due to
limited resolution. The FWHM technique, however, tends to overestimate thicknesses of
objects less than 2.5mm thick such as the ribs. A more accurate method for estimating
cortex thickness from clinical CT scans was proposed by Treece et al. which will
henceforth be referred to as the cortical density method (CDM) [15, 16]. The CDM
assumes a constant cortex density to estimate the cortical bone thickness from the clinical
CT scan allowing for accurate estimation of cortex thickness down to approximately 0.3
mm. The objective of this study is to apply the CDM to a retrospective collection of
clinical CT scans spanning ages 0-100 and both sexes. The second aim of this study is to
compare the resulting estimated cortical thickness variations with age, sex, rib level, rib
attachment, and anatomical location within each rib.

12
3. METHODS
Scan Collection and Segmentation
Clinical thoracic CT scans were retrospectively obtained for 241 healthy, normal
subjects (124 females and 117 males) from the Wake Forest University radiological
database for ages 0-100 years (Figure 1). Any ribs that were fractured or compromised
structurally were excluded from the analysis. Each of the healthy, uncompromised ribs in
each subject’s rib cage was segmented individually using a semi-automated technique in
Mimics (Materialise, Leuven, Belgium). Segmentation of the ribs involved automated
thresholding and region growing operations, followed by manual editing. Each of the
segmented ribs was exported as an individual stereolithography (STL) geometry model
for later use and a whole rib cage STL was exported as well.
Cortical Thickness Estimation Algorithm Validation and Application
The whole rib cage STL was imported as a surface along with the original
subject’s clinical thoracic CT scan into the validated cortical thickness estimation
program, Stradwin [15, 16]. Stradwin used the bone and surrounding soft tissue greyscale
values to estimate the thickness of the cortical bone at each of the STL vertices using the
CDM. This algorithm, which has been validated previously for application to the femur
and skull, was validated in a similar manner for application to the rib cage [15-17].
Anterior and lateral rib sections were taken from the fourth through seventh ribs of six
cadavers. These sections were scanned both with microCT and clinical CT. Both of the
resulting scans were analyzed using the CDM and after a comparison between the
thickness estimations from microCT and clinical CT (Figure 2), the difference in cortical
13
thickness between the two was well within the error range published by Treece et al.
Following validation, the CDM was then applied to the entire rib cages of the 241
subjects included in the study, to collect an average of 40,000-80,000 thickness
measurements per rib cage (Figure 3).
Figure 1. Distribution of the ages and sexes of the subjects studied.

14
A.
B.
Figure 2. A & B) Example illustrating
good qualitative agreement between
cortical thickness measurements for the
microCT and clinical CT scans of the
same rib specimen (interior and exterior
views shown). C) Histogram of the
cortical thickness differences (in mm)
between clinical and microCT scans of
homologous regions of the specimen
above.
C.
Figure 3. A) The original surface input to the CDM algorithm and B) the resulting point cloud of
cortical thickness estimations projected onto that surface for a single subject.
15
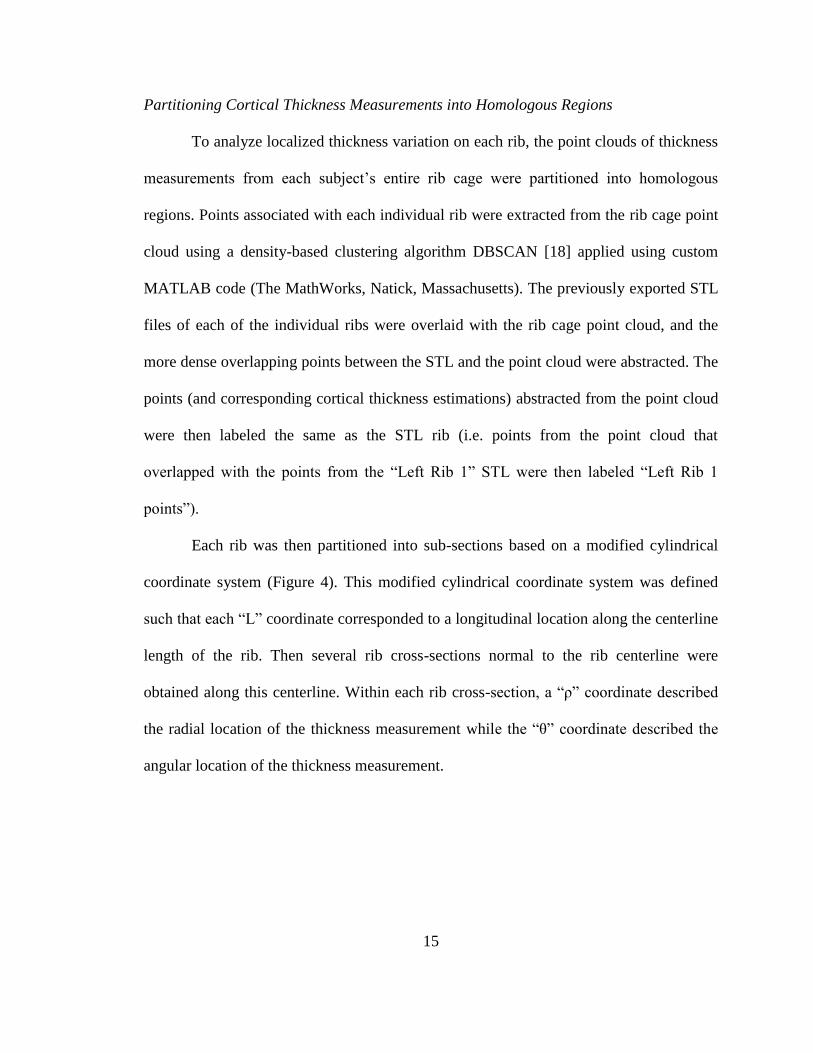
Partitioning Cortical Thickness Measurements into Homologous Regions
To analyze localized thickness variation on each rib, the point clouds of thickness
measurements from each subject’s entire rib cage were partitioned into homologous
regions. Points associated with each individual rib were extracted from the rib cage point
cloud using a density-based clustering algorithm DBSCAN [18] applied using custom
MATLAB code (The MathWorks, Natick, Massachusetts). The previously exported STL
files of each of the individual ribs were overlaid with the rib cage point cloud, and the
more dense overlapping points between the STL and the point cloud were abstracted. The
points (and corresponding cortical thickness estimations) abstracted from the point cloud
were then labeled the same as the STL rib (i.e. points from the point cloud that
overlapped with the points from the “Left Rib 1” STL were then labeled “Left Rib 1
points”).
Each rib was then partitioned into sub-sections based on a modified cylindrical
coordinate system (Figure 4). This modified cylindrical coordinate system was defined
such that each “L” coordinate corresponded to a longitudinal location along the centerline
length of the rib. Then several rib cross-sections normal to the rib centerline were
obtained along this centerline. Within each rib cross-section, a “ρ” coordinate described
the radial location of the thickness measurement while the “θ” coordinate described the
angular location of the thickness measurement.
16
Figure 4. Modified
cylindrical coordinate
system used to
partition the thickness
measurements into
homologous regions
according to
longitudinal location
along a centerline (L)
and the radial (ρ) and
angular (θ) locations
within a rib cross-
section normal to the
centerline.
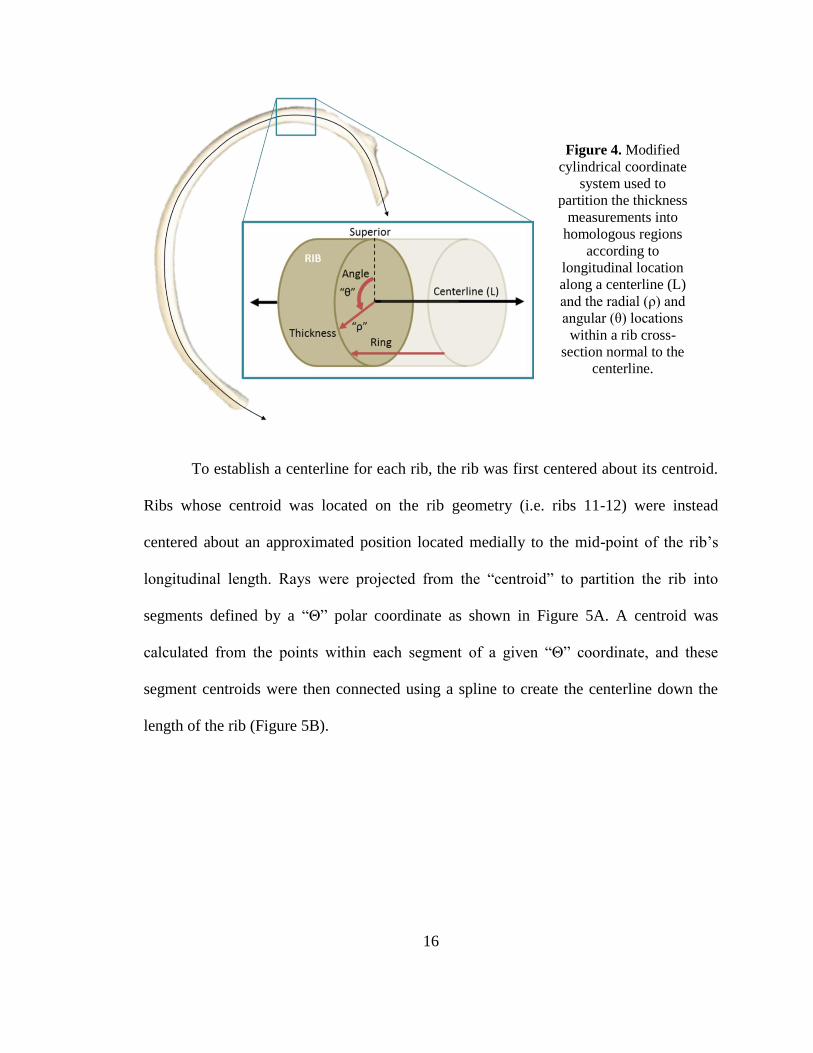
To establish a centerline for each rib, the rib was first centered about its centroid.
Ribs whose centroid was located on the rib geometry (i.e. ribs 11-12) were instead
centered about an approximated position located medially to the mid-point of the rib’s
longitudinal length. Rays were projected from the “centroid” to partition the rib into
segments defined by a “Θ” polar coordinate as shown in Figure 5A. A centroid was
calculated from the points within each segment of a given “Θ” coordinate, and these
segment centroids were then connected using a spline to create the centerline down the
length of the rib (Figure 5B).
17
A.
B.
Figure 5. A) Each rib is first
broken into segments based on
its “Θ” value in relation to the
centroid of the rib (indicated
by the green circle). A centroid
for each of these segments is
then calculated (yellow
circles). B) The segment
centroids were then connected
to form a centerline down the
length of the rib.
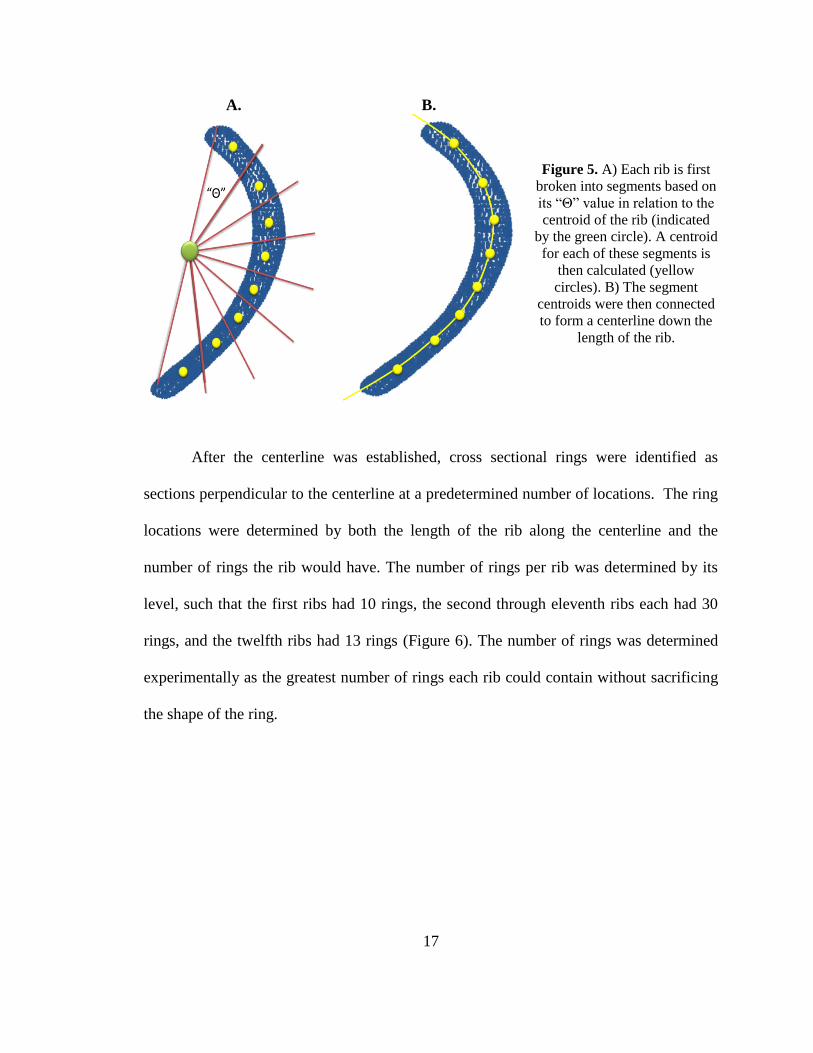
After the centerline was established, cross sectional rings were identified as
sections perpendicular to the centerline at a predetermined number of locations. The ring
locations were determined by both the length of the rib along the centerline and the
number of rings the rib would have. The number of rings per rib was determined by its
level, such that the first ribs had 10 rings, the second through eleventh ribs each had 30
rings, and the twelfth ribs had 13 rings (Figure 6). The number of rings was determined
experimentally as the greatest number of rings each rib could contain without sacrificing
the shape of the ring.

18
Figure 6. The number of rings for each rib was determined by the rib level with 10 rings
comprising the first rib, 13 rings in the twelfth rib, and 30 rings making up each of the second
through eleventh ribs.
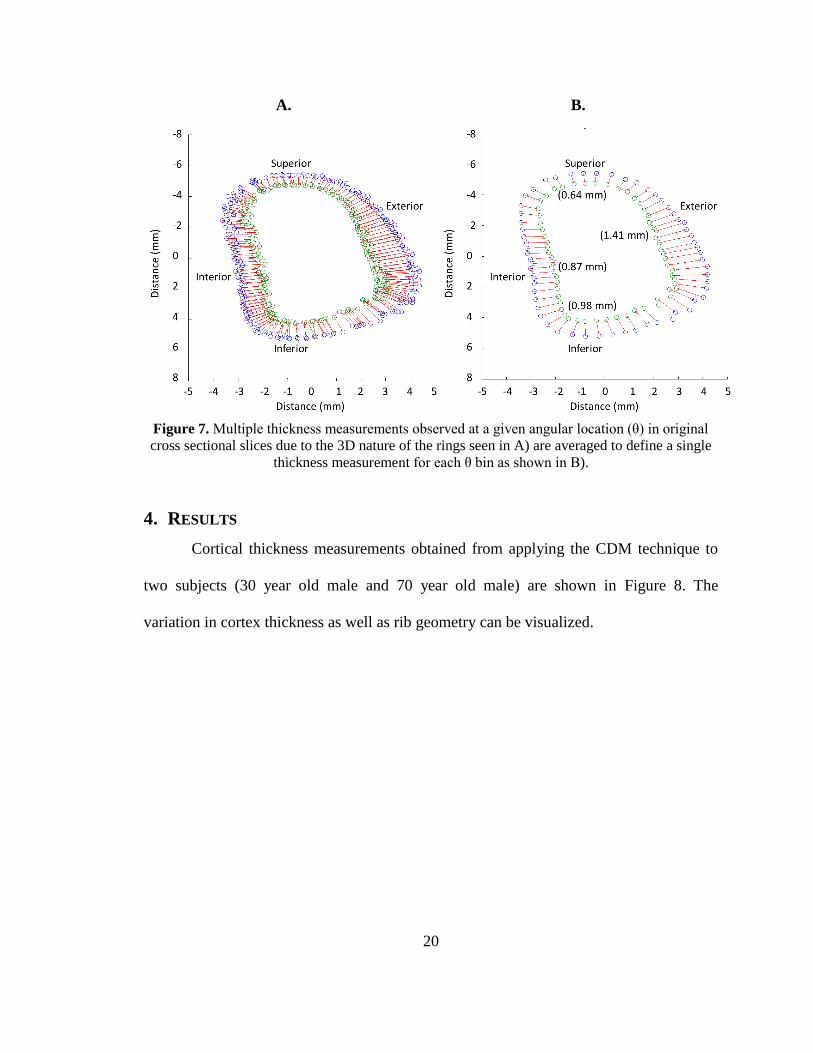
The cross-sectional rings were centered about their centroid and a polar
coordinate system was used to define the angular location “θ” of the thickness
measurements within the ring. Thickness measurements were organized into six degree
increment “θ” bins around the ring circumference (60 bins per ring), and the cortex
thicknesses within each bin were averaged. The averaging technique included identifying
points for each bin that represented the inner and outer cortical bone surfaces within that
bin. First, the outer points in each bin were averaged together to get a mean outer cortex
surface location. Next, the thicknesses associated with each of those outer points were
averaged to get a mean cortex thickness for that bin. Finally, the angles formed between
the outer points and their corresponding inner points were averaged to get a mean
direction to project the thickness measurement to the inner surface. Combining these
three parameters, there is a mean outer surface point defined with a thickness and angle at

19
which that thickness ought to be applied, which captures the corresponding mean inner
surface point. These steps effectively averaged the multiple thickness measurements
within each θ bin to define the outer and inner point locations for a single, averaged
thickness measurement within the bin (Figure 7). The “θ” values for each bin for each
ring started superiorly at 0 degrees, increasing first laterally to 90 degrees, then inferiorly
to 180 degrees, then interiorly to the superior position (0 or 360 degrees).
To ensure the angle measures were normalized and labeled with the appropriate
anatomical location, each ring on the subject’s ribs were compared with a homologous
ring on an atlas rib which had a known superior point. The atlas ribs were obtained from
the Global Human Body Model Consortium’s (GHBMC) 50th
percentile male’s rib cage
and the partitioning methodology described previously was used to partition the atlas ribs
into cross-sectional rings and angular locations. The superior-most point in each atlas
cross-sectional ring was manually selected and the index number recorded. In a previous
study, the atlas rib landmarks were morphed using image registration to each subject rib
[19]. The angular location of the superior-most atlas point after it was morphed to the
subject rib was labeled as having an angle measure of zero (“superior”), and all other
angle measures were then normalized accordingly.
In total, each subject’s rib cage was partitioned into 38,640 sub-sections defined
by rib level, cross-sectional ring location along a rib centerline, and angular location
within the cross-sectional ring. This partitioning technique was applied to all 241 subjects
so that the thickness measurements at each homologous location within the rib cage could
be obtained for all subjects analyzed.
20
A.
B.
Figure 7. Multiple thickness measurements observed at a given angular location (θ) in original
cross sectional slices due to the 3D nature of the rings seen in A) are averaged to define a single
thickness measurement for each θ bin as shown in B).
4. RESULTS
Cortical thickness measurements obtained from applying the CDM technique to
two subjects (30 year old male and 70 year old male) are shown in Figure 8. The
variation in cortex thickness as well as rib geometry can be visualized.
21
Figure 8. The CDM estimated cortical thickness measurements (in mm) for a A) 30 year old
male subject and a B) 70 year old male subject.
Subjects analyzed were grouped into age decades. Female cortex thickness
increases from decade 10 to decade 20, maintaining a relatively thick composition
through decade 40, then steadily decreasing into the elderly ages (Figure 9). Male cortical
thickness increases from decade 10 to decade 30, then decreases in thickness from decade
30 to decade 50, then plateaus in the elderly ages (Figure 9). Both males and females
have unexpectedly thick cortex averages for the youngest pediatric subjects (decade 0).
This is most likely due to the fact that the CDM has only been validated to accurately
estimate thicknesses greater than 0.3 mm and pediatric rib cortex may be thinner than 0.3
mm.
22
Figure 9. The mean thickness and standard deviation per decade of age for male and female
subjects for the left 9th rib. These results were typical for all other ribs.
Similar trends are observed when comparing cortical thickness by rib level. For
all rib levels, female cortical thickness increases from decade 10 to 20, plateaus at a
maximum thickness from decades 20 to 40, and then decreases rather steadily into the
elderly ages. In females, the manubrial ribs (first and second) and floating ribs (eleventh
and twelfth) tended to be thicker than the sternal ribs (third through seventh) and false
ribs (eighth through tenth), particularly from decade 20 on (Figure 10A, Appendix A).
Males also increased from decade 10 to decade 30, decreasing in thickness steadily until
plateauing at approximately decade 50. The male ribs seemed to maintain thickness
uniformly across rib levels (Figure 10B, Appendix B). There were again large thicknesses
seen at decade 0 for all rib levels for both sexes, still most likely due to overestimation of
extremely thin cortex in the youngest pediatric subjects.
23
A.
B.
Figure 10. Mean thickness by decade for each of the rib levels for both A) females and B) males.
Mean thickness values from the male sternal ribs analyzed in Kemper et al. (2007) are shown as
blue dots in B).
Similar trends were observed when the data was examined based on location
along the rib centerline, from posterior to anterior. Female thicknesses increased from
decade 10 to 20, plateaued at a maximum thickness from decade 20 to decade 40, then
decreased into the elderly ages. There were more dramatic differences in overall
thickness between the different locations along the rib centerline. Going from anterior to
posterior along the rib centerline, rib thickness was thinnest anteriorly, increased in the
lateral portions, and then decreased in thickness posteriorly (Figure 11A, Appendix C).
Males demonstrated increased cortex thickness from decade 10 to decade 30, followed by
decreasing thickness that plateaued at approximately decade 50 (Figure 11B, Appendix
D).
0 20 40 60 80 1000
0.5
1
1.5
2
2.5
Mean T
hic
kness (
mm
)
Decade (years)
Female Thickness by Rib Level
Manubrial
Sternal
False
Floating
0 20 40 60 80 1000
0.5
1
1.5
2
2.5
Mean T
hic
kness (
mm
)
Decade (years)
Male Thickness by Rib Level
Manubrial
Sternal
False
Floating
Kemper et al, 2007
24
A.
B.
Figure 11. Mean thickness by decade for each of the locations along the rib centerline for both
A) females and B) males. Mean thickness values from lateral and anterior locations along the
sternal ribs analyzed in Kemper et al. (2007) are shown as blue and black dots in B).
Thickness measurements were compared around the circumference of the rib, i.e.
the superior, interior, inferior, versus exterior portions of the rib (Figure 12). For all ages
except decade 0, the ribs were thicker along the exterior and interior portions and thinner
at the superior and inferior portions. Figure 13 also shows the mean thickness for all of
the ribs by decade at four generalized locations around the circumference of the ribs
(superior, exterior, inferior, interior). It can again be seen that the exterior and interior
portions are consistently thicker than the superior and inferior portions of the ribs for all
ages, except for decade 10. Lastly, Figure 14 compares the thickness variations both
along the rib centerline and around the circumference. The thicknesses tended to
uniformly increase from posterior to lateral, and then decrease from lateral to anterior,
similar to what is demonstrated in Figure 11.
0 20 40 60 80 1000
0.5
1
1.5
2
2.5
Mean T
hic
kness (
mm
)
Decade (years)
Female Thickness by Location Along Rib Centerline
Posterior
Posteriolateral
Lateral
Anteriolateral
Anterior
0 20 40 60 80 1000
0.5
1
1.5
2
2.5
Mean T
hic
kness (
mm
)
Decade (years)
Male Thickness by Location Along Rib Centerline
Posterior
Posteriolateral
Lateral
Anteriolateral
Anterior
Kemper, 2007 - Lateral
Kemper, 2007 - Anterior
25
Figure 12. Mean thickness changes by decade for the anatomical locations around the circumference of the ribs for both males and females. Each
error bar is constructed using one standard deviation from the mean.

26
Figure 13. Mean thickness changes for males and females by decade for each of the locations
around the circumference of the ribs.
Figure 14. Mean thickness plotted by location along the rib centerline for four anatomical
locations around the rib circumference.

27
5. DISCUSSION
The CDM method applied to clinical CT scans obtained cortical thickness
estimates similar to the thicknesses measured from the same specimens using microCT
scans, thus validating the CDM method for application to the rib cage. Cortical bone
changes in thickness with age because the rates at which the bone is broken down and
reformed changes throughout life, based on factors such as hormone and activity levels
[20-23]. This study allowed for analysis of the thicknesses at precise locations
throughout the rib cage for comparison with literature values and also between subjects
(based on age and sex) and locations within a single subject’s rib cage.
Cortex increases in thickness for both males and females from age 10 until the
middle ages, with females reaching a thickness plateau from decade 20 to 40 and males
reaching a maximum thickness at decade 30. Cortex then thins steadily into the elderly
ages for both sexes (Figure 9). Both males and females have unexpectedly thick cortex
averages for the youngest subjects (decade 0). This is most likely due to the fact that the
CDM has only been validated to accurately estimate thicknesses greater than 0.3 mm and
pediatric rib cortex is most likely thinner than 0.3 mm.
Thickness trends from decades 10+ are similar to the trends seen in both the
lumbar and femoral cortical bone area measurement data from the National Health and
Nutrition Examination Survey (NHANES) for both males and females [24]. The female
data has a very similar shape, but reaches a maximum thickness later in life (age 45) than
would be expected from the NHANES cross sectional area trends calculated from DXA
which reach a maximum at age 40 (for the lumbar spine). This may indicate that there is
increasing bone formation of the endosteal surface of the bone with increased bone
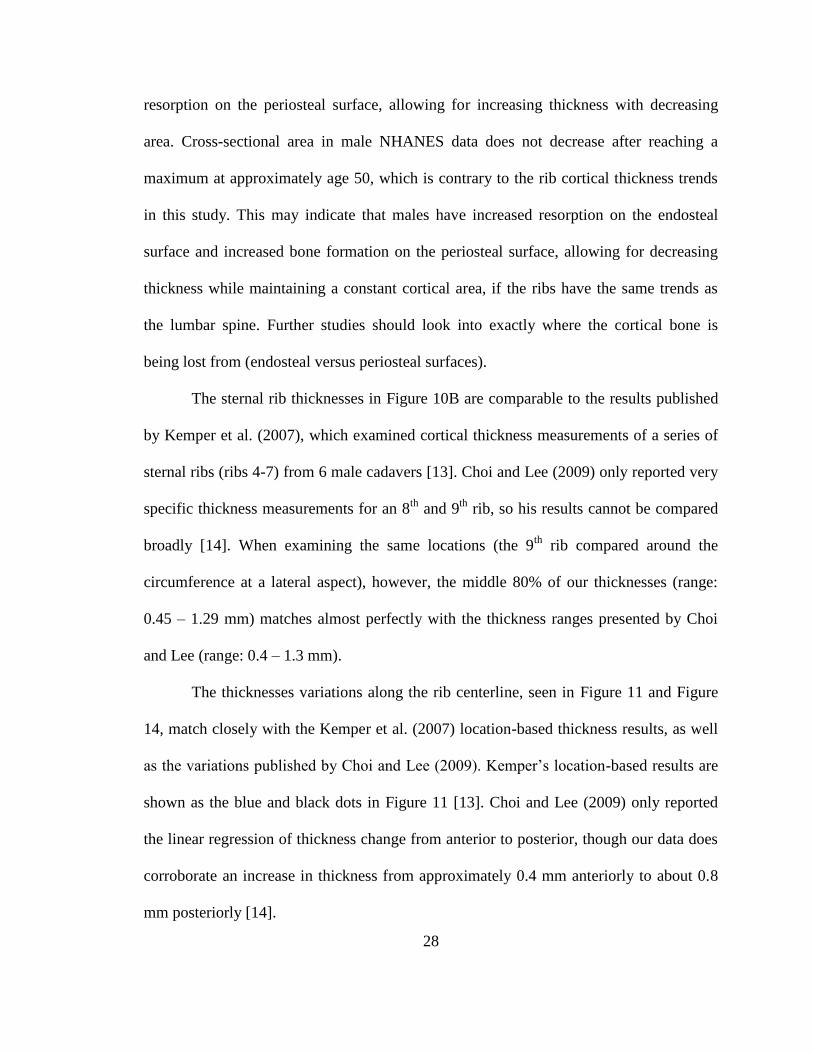
28
resorption on the periosteal surface, allowing for increasing thickness with decreasing
area. Cross-sectional area in male NHANES data does not decrease after reaching a
maximum at approximately age 50, which is contrary to the rib cortical thickness trends
in this study. This may indicate that males have increased resorption on the endosteal
surface and increased bone formation on the periosteal surface, allowing for decreasing
thickness while maintaining a constant cortical area, if the ribs have the same trends as
the lumbar spine. Further studies should look into exactly where the cortical bone is
being lost from (endosteal versus periosteal surfaces).
The sternal rib thicknesses in Figure 10B are comparable to the results published
by Kemper et al. (2007), which examined cortical thickness measurements of a series of
sternal ribs (ribs 4-7) from 6 male cadavers [13]. Choi and Lee (2009) only reported very
specific thickness measurements for an 8th
and 9th
rib, so his results cannot be compared
broadly [14]. When examining the same locations (the 9th
rib compared around the
circumference at a lateral aspect), however, the middle 80% of our thicknesses (range:
0.45 – 1.29 mm) matches almost perfectly with the thickness ranges presented by Choi
and Lee (range: 0.4 – 1.3 mm).
The thicknesses variations along the rib centerline, seen in Figure 11 and Figure
14, match closely with the Kemper et al. (2007) location-based thickness results, as well
as the variations published by Choi and Lee (2009). Kemper’s location-based results are
shown as the blue and black dots in Figure 11 [13]. Choi and Lee (2009) only reported
the linear regression of thickness change from anterior to posterior, though our data does
corroborate an increase in thickness from approximately 0.4 mm anteriorly to about 0.8
mm posteriorly [14].
29
For all decades except decade 0, the ribs were thicker in both sexes along the
interior and exterior portions of the rib as compared to the superior and inferior portions,
which supports results found by previous studies [13, 14]. For decade 0, both sexes show
little regional variation, and this is most likely due to the fact that the CDM is
overestimating the cortex thickness equally in all locations.
In general, male and female cortical thickness tended to increase during young
adulthood, and then decrease as the subjects approached middle and elderly age. Age-
based regression equations would need to be produced for exact correlation between
cortical thickness and age and sex, and this is a topic of future investigation. One
limitation of this study is that the thickness is estimated. Although the estimation
technique was validated, it was professed to be unable to capture thicknesses less than 0.3
mm, and therefore limited the ability to accurately characterize thickness variations in the
youngest pediatric subjects.
6. CONCLUSION
The objective of this work was to estimate the rib cortical bone thickness for a
population of subjects spanning ages 0 to 100 and for both sexes. The cortical thickness
was estimated from clinical CT scans using the CDM technique, which estimates cortical
thicknesses less than 2.5 mm better than traditional methods such as FWHM. The cortex
is thicker in the manubrial and floating ribs in the females compared to the female sternal
and false ribs, though there was not much difference in cortex thickness based on rib
level for the males. The anterior portions of the rib cortical bone remained the thinnest for
both males and females, increasing in thickness to a maximum at the lateral portions of

30
the ribs, and then thinning to the posterior portions. The exterior and interior portions of
the ribs remained thicker than the superior and inferior aspects for all locations along the
rib centerline for both males and females. The methodology presented in this paper has
already been applied to characterize the cortical bone thickness of the skull, and could be
applied to characterize cortical thickness of other bones from normal or diseased subjects.
Accurately characterizing the cortical bone thickness variations in the ribs with age and
sex will allow for a more biofidelic model of the ribcage for any age, which in turn
provides accurate injury information allowing for increased safety for all ages.
7. ACKNOWLEDGEMENT
Funding was provided by the National Highway Traffic Safety Administration under
Cooperative Agreement Number DTN22-09-H-00242. Views expressed are those of the
authors and do not represent the views of NHTSA.
31
8. REFERENCES
1. Ruan, J., et al., Prediction and analysis of human thoracic impact responses and
injuries in cadaver impacts using a full human body finite element model. Stapp
Car Crash J, 2003. 47: p. 299-321.
2. Arajärvi E, S.S., Chest injuries sustained in severe traffic accidents by seatbelt
wearer. J Trauma, 1989(29): p. 37-41.
3. Stawicki, S.P., et al., Rib fractures in the elderly: a marker of injury severity. J
Am Geriatr Soc, 2004. 52(5): p. 805-8.
4. Bergeron, E., et al., Elderly Trauma Patients with Rib Fractures Are at Greater
Risk of Death and Pneumonia. J Trauma, 2003. 54(3): p. 478-485.
5. Bulger, E.M.M.D., et al., Rib Fractures in the Elderly. Journal of Trauma-Injury
Infection & Critical Care, 2000. 48(6): p. 1040-1047.
6. Kent, R., et al., Structural and material changes in the aging thorax and their
role in crash protection for older occupants. Stapp Car Crash J, 2005. 49: p.
231-49.
7. Golman, A.J., et al., Injury prediction in a side impact crash using human body
model simulation. Accident Analysis & Prevention, 2014. 64: p. 1-8.
8. El-Jawahri, R.E., Laituri, T.R., Ruan, J.S., Rouhana, S.W., Barbat, S.D.,
Development and Validation of Age-Dependent FE Human Models of a Mid-
Sized Male Thorax. Stapp Car Crash Journal, 2010. 54: p. 407-430.
9. Ito, O., Dokko, Y., Ohashi, K. , Development of adult and elderly FE thorax
skeletal models, in Society of Automotive Engineers. 2009.

32
10. Weaver, A.A., S.L. Schoell, and J.D. Stitzel, Morphometric analysis of variation
in the ribs with age and sex. J Anat, 2014. 225(2): p. 246-61.
11. Gayzik, F.S., et al., Quantification of age-related shape change of the human rib
cage through geometric morphometrics. J Biomech, 2008. 41(7): p. 1545-54.
12. Kemper, A.R., et al., Material properties of human rib cortical bone from
dynamic tension coupon testing. Stapp Car Crash J, 2005. 49: p. 199-230.
13. Kemper, A.R., et al., The biomechanics of human ribs: material and structural
properties from dynamic tension and bending tests. Stapp Car Crash J, 2007.
51: p. 235-73.
14. Choi, Y.C. and I. Lee, Thorax FE Model for Older Population. Japanese Scoeity of
Mechanical Engineers, Fukuoka, 2009.
15. Treece, G.M., et al., High resolution cortical bone thickness measurement from
clinical CT data. Med Image Anal, 2010. 14(3): p. 276-90.
16. Treece, G.M., K.E. Poole, and A.H. Gee, Imaging the femoral cortex: thickness,
density and mass from clinical CT. Med Image Anal, 2012. 16(5): p. 952-65.
17. Lillie, E.M., et al., Estimation of skull table thickness with clinical CT and
validation with microCT. J Anat, 2015. 226(1): p. 73-80.
18. Daszykowski, M., B. Walczak, and D.L. Massart, Density-based clustering for
exploration of analytical data. Anal Bioanal Chem, 2004. 380(3): p. 370-2.
19. Parfitt, A.M., Age-related structural changes in trabecular and cortical bone:
cellular mechanisms and biomechanical consequences. Calcif Tissue Int, 1984.
36 Suppl 1: p. S123-8.

33
20. Chen, H., et al., Age-related changes in trabecular and cortical bone
microstructure. Int J Endocrinol, 2013. 2013: p. 213234.
21. Macdonald, H.M., et al., Age-related patterns of trabecular and cortical bone
loss differ between sexes and skeletal sites: a population-based HR-pQCT study.
J Bone Miner Res, 2011. 26(1): p. 50-62.
22. Thompson, D.D., Age changes in bone mineralization, cortical thickness, and
haversian canal area. Calcif Tissue Int, 1980. 31(1): p. 5-11.

34
9. APPENDIX A. The mean, standard deviation (STD), and interquartile range (IQR) for the rib cortical
thickness values in mm for the different rib levels by decade for female subjects.
Females Manubrial Sternal False Floating
Decade Mean STD IQR Mean STD IQR Mean STD IQR Mean STD IQR
0 0.83 0.54 0.78 0.64 0.45 0.45 0.71 0.45 0.57 0.91 0.47 0.67
10 0.50 0.31 0.31 0.49 0.21 0.25 0.50 0.20 0.24 0.73 0.39 0.50
20 1.12 0.55 0.68 1.00 0.46 0.66 1.03 0.50 0.77 1.17 0.53 0.75
30 1.18 0.55 0.66 1.03 0.38 0.45 1.05 0.51 0.60 1.14 0.51 0.54
40 1.10 0.56 0.61 0.97 0.34 0.43 1.00 0.42 0.54 1.16 0.53 0.65
50 0.95 0.50 0.56 0.82 0.30 0.41 0.82 0.42 0.50 0.82 0.36 0.48
60 0.90 0.49 0.58 0.83 0.33 0.44 0.81 0.38 0.50 0.83 0.38 0.50
70 1.05 0.54 0.70 0.89 0.37 0.44 0.82 0.42 0.54 0.87 0.45 0.52
80 0.77 0.38 0.41 0.72 0.31 0.34 0.69 0.33 0.37 0.74 0.41 0.46
90 0.93 0.48 0.58 0.79 0.31 0.37 0.69 0.30 0.37 0.71 0.30 0.38
B. The mean, standard deviation (STD), and interquartile range (IQR) for the rib cortical
thickness values in mm for the different rib levels by decade for male subjects.
Males Manubrial Sternal False Floating
Decade Mean STD IQR Mean STD IQR Mean STD IQR Mean STD IQR
0 0.70 0.48 0.64 0.50 0.33 0.30 0.59 0.37 0.38 0.91 0.44 0.67
10 0.56 0.39 0.39 0.58 0.25 0.32 0.57 0.25 0.30 0.57 0.26 0.30
20 0.81 0.69 0.65 0.82 0.48 0.66 0.80 0.45 0.65 0.88 0.49 0.64
30 1.00 0.46 0.45 1.03 0.35 0.44 1.02 0.37 0.47 1.08 0.41 0.54
40 0.91 0.43 0.44 0.91 0.34 0.45 0.93 0.37 0.49 0.93 0.34 0.44
50 0.86 0.46 0.44 0.84 0.29 0.38 0.83 0.33 0.42 0.79 0.31 0.37
60 0.86 0.49 0.50 0.83 0.33 0.39 0.83 0.34 0.48 0.80 0.37 0.44
70 0.89 0.45 0.51 0.84 0.32 0.38 0.80 0.33 0.42 0.72 0.29 0.37
80 1.02 0.50 0.59 0.91 0.33 0.40 0.87 0.33 0.40 0.83 0.35 0.43
90 0.99 0.45 0.49 0.93 0.29 0.37 0.90 0.33 0.46 0.78 0.28 0.38

35
C. The mean, standard deviation (STD), and interquartile range (IQR) for the rib cortical
thickness values in mm for the different ring levels by decade for female subjects.
Females Posterior Posteriolateral Lateral Anteriolateral Anterior
Decade Mean STD IQR Mean STD IQR Mean STD IQR Mean STD IQR Mean STD IQR
0 0.56 0.36 0.35 0.85 0.53 0.71 0.82 0.50 0.66 0.74 0.46 0.61 0.56 0.41 0.49
10 0.53 0.20 0.25 0.60 0.20 0.22 0.57 0.22 0.21 0.55 0.31 0.23 0.36 0.28 0.21
20 1.07 0.46 0.66 1.18 0.45 0.61 1.15 0.51 0.60 1.04 0.49 0.55 0.75 0.44 0.53
30 1.11 0.42 0.48 1.22 0.42 0.51 1.24 0.48 0.47 1.03 0.39 0.37 0.72 0.35 0.38
40 1.04 0.37 0.47 1.13 0.36 0.40 1.16 0.45 0.44 1.00 0.42 0.43 0.73 0.38 0.42
50 0.88 0.31 0.43 0.92 0.36 0.43 0.95 0.44 0.46 0.81 0.34 0.38 0.57 0.29 0.32
60 0.83 0.32 0.44 0.91 0.33 0.43 0.99 0.41 0.49 0.83 0.36 0.42 0.60 0.31 0.37
70 0.82 0.34 0.45 1.04 0.42 0.50 1.10 0.48 0.56 0.84 0.36 0.41 0.61 0.31 0.34
80 0.69 0.28 0.33 0.80 0.36 0.34 0.85 0.39 0.39 0.71 0.30 0.33 0.53 0.27 0.30
90 0.71 0.27 0.36 0.82 0.34 0.35 0.89 0.36 0.42 0.74 0.31 0.37 0.62 0.30 0.38
D. The mean, standard deviation (STD), and interquartile range (IQR) for the rib cortical
thickness values in mm for the different ring levels by decade for female subjects.
MALES Posterior Posteriolateral Lateral Anteriolateral Anterior
Decade Mean STD IQR Mean STD IQR Mean STD IQR Mean STD IQR Mean STD IQR
0 0.48 0.30 0.26 0.69 0.42 0.45 0.67 0.41 0.45 0.63 0.41 0.47 0.49 0.38 0.40
10 0.62 0.30 0.36 0.66 0.23 0.30 0.64 0.26 0.31 0.55 0.24 0.26 0.40 0.24 0.24
20 0.87 0.58 0.68 0.92 0.43 0.62 0.93 0.46 0.69 0.81 0.53 0.61 0.54 0.38 0.45
30 1.08 0.38 0.50 1.10 0.32 0.39 1.14 0.37 0.44 1.03 0.34 0.39 0.79 0.37 0.42
40 0.99 0.41 0.54 1.02 0.33 0.45 1.01 0.35 0.43 0.89 0.28 0.33 0.68 0.29 0.31
50 0.87 0.35 0.48 0.87 0.28 0.37 0.91 0.34 0.38 0.85 0.33 0.32 0.64 0.27 0.32
60 0.86 0.34 0.48 0.91 0.33 0.43 0.94 0.37 0.45 0.82 0.34 0.31 0.60 0.30 0.31
70 0.84 0.35 0.46 0.86 0.32 0.41 0.94 0.35 0.40 0.81 0.29 0.35 0.62 0.31 0.34
80 0.84 0.32 0.44 0.96 0.32 0.38 0.99 0.34 0.40 0.92 0.37 0.37 0.75 0.37 0.36
90 0.88 0.33 0.47 0.96 0.29 0.38 0.98 0.33 0.39 0.94 0.30 0.36 0.81 0.33 0.40

36
Chapter III: Characterization and Regression of Rib Cortical
Thickness from Clinical Computed Tomography Scans
Sarah K. Lynch, Ashley A. Weaver, Samantha L. Schoell, Joel D. Stitzel
Virginia Tech – Wake Forest University Center for Injury Biomechanics,
Winston-Salem, NC
37
1. ABSTRACT
Motor vehicle crashes (MVCs) are responsible for nearly 1.3 million deaths
worldwide, with a large number of serious and fatal injuries sustained in MVCs occurring
in the thorax. Thoracic injuries are more likely to kill or disable elderly occupants due to
variations that occur within the ribcage as people age, including geometry, material
property, and compositional (cortex) changes. In this study, cortical bone thickness
changes in the ribs were characterized by applying a cortical thickness estimation
algorithm to retrospective clinical computed tomography (CT) scans of 222 subjects
spanning ages 10-100 within both sexes. The rib cortex thickness estimations were then
partitioned into homologous regions and compared with age, sex, rib level, rib
attachment, and anatomical location within each rib and the thickness measurements
within each homologous region was averaged. The subject-specific thickness data for
each homologous region was then fit with a regression curve to characterize the thickness
variation at each region with age and sex. Although the cortex showed variations in the
thickness trends (percent change) with age based on rib level, analysis of the regressed
thickness values showed much smaller rib level based variation. The anterior portions of
the rib cortical bone remained the thinnest for both males and females, increasing in
thickness to a maximum at the lateral portions of the ribs, and then thinning to the
posterior portions (although the anterior portion was much thinner than the posterior
portion throughout the lifespan). The exterior and interior portions of the ribs were
thicker than the superior and inferior aspects for all locations around the circumference of
the rib for both males and females for ages 10 and older, though the trends as the
thicknesses changed with age were uniform for all sections. Applying these regression

38
functions for cortical rib thickness will lead to more biofidelic thorax models and
enhanced safety for occupants of all ages.
2. INTRODUCTION
Motor vehicle crashes (MVCs) kill 1.3 million people worldwide every year, with
34,000 of those from the United States alone. In MVCs, the thorax is one of the most
commonly injured body regions, ranking second only to head injuries in terms of
frequency, number of fatal and serious injuries, as well as overall economic cost [1].
Sirmali et al found that almost 40% of hospital patients with thoracic injury have rib
fractures, and Arajärvi et al identified rib fractures in nearly 94% of severely or fatally
injured belted occupants [2, 3]. Unfortunately, rib fractures are not only common, but
they pose an almost doubled risk of mortality and morbidity in the elderly population
than in younger occupants [4-6]. In a study of subjects over the age of 60 who had fatal
chest injuries, it was shown that for 40% of those fatalities, the worst chest injury
sustained was rib fractures, according to the Crash Injury Research and Engineering
Network (CIREN) database [7].
Three factors have been proposed to explain the changes in thoracic injury
tolerance that occur with age: 1) material changes, 2) compositional changes (including
cross sectional cortex area), and 3) thoracic geometric changes [7]. Rib material property
variations have been characterized extensively through the use of whole thorax, whole
rib, and coupon testing [8-12]. Weaver et al and Gayzik et al also characterized three
dimensional rib geometry changes with age and sex [13, 14]. Studies have also examined
rib cortical bone thickness and area variations throughout the ribcage using microscopy
39
estimation, clinical computed tomography (CT) estimation, and microCT measurements
[12, 15, 16, Lynch Chapter II].
Cortical bone varies in thickness based on changes in bone resorption and
formation, which can be influenced by a person’s hormone and activity levels [17-20]. As
a result, there are regional variations in rib cortex thickness within an individual as well
as variations in cortex thickness between individuals of different ages and sexes. Several
studies have quantified changes in cortex thickness and cortical area with age, though
none have fully quantified cortical thickness variation with age and sex regionally within
the ribs [13, 21, 22]. The objective of this study is to develop regression equations to
quantify regional cortex thickness changes with age and sex from a population of 222
subjects. The second aim of this study is to compare the resulting regressed cortical
thickness variations with age, sex, rib level, rib attachment, and anatomical location
within each rib.
3. METHODS
Scan Collection and Segmentation
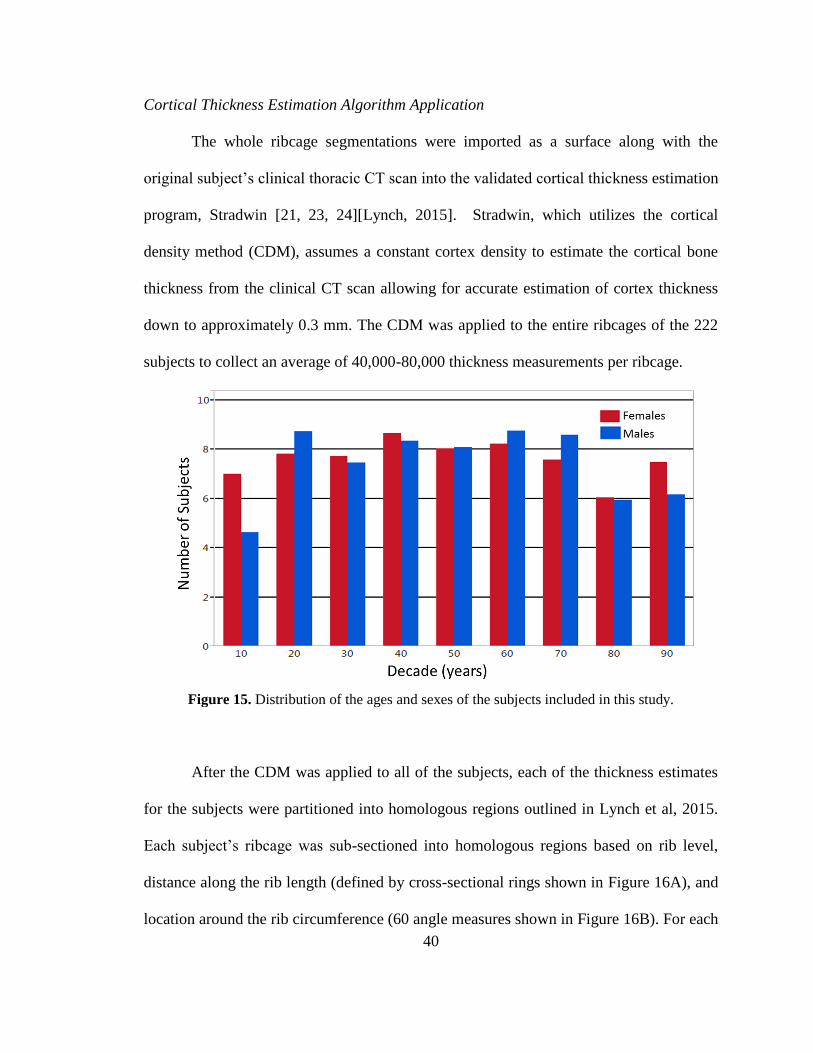
Clinical thoracic CT scans were retrospectively obtained for 222 healthy, normal
subjects (114 females and 108 males) from the Wake Forest Radiological database for
ages 10-100 years (Figure 15). Any ribs that were fractured or compromised structurally
were excluded from analysis. Each of the healthy, uncompromised ribs in each subject’s
ribcage was segmented individually using Mimics (Materialise, Leuven, Belgium).
40
Cortical Thickness Estimation Algorithm Application
The whole ribcage segmentations were imported as a surface along with the
original subject’s clinical thoracic CT scan into the validated cortical thickness estimation
program, Stradwin [21, 23, 24][Lynch, 2015]. Stradwin, which utilizes the cortical
density method (CDM), assumes a constant cortex density to estimate the cortical bone
thickness from the clinical CT scan allowing for accurate estimation of cortex thickness
down to approximately 0.3 mm. The CDM was applied to the entire ribcages of the 222
subjects to collect an average of 40,000-80,000 thickness measurements per ribcage.
Figure 15. Distribution of the ages and sexes of the subjects included in this study.
After the CDM was applied to all of the subjects, each of the thickness estimates
for the subjects were partitioned into homologous regions outlined in Lynch et al, 2015.
Each subject’s ribcage was sub-sectioned into homologous regions based on rib level,
distance along the rib length (defined by cross-sectional rings shown in Figure 16A), and
location around the rib circumference (60 angle measures shown in Figure 16B). For each

41
subject, the thickness values within each homologous region were averaged to obtain a
single average thickness measurement within the homologous region.
A.
B.
Figure 16. The organization of A) rings and B) angle measures into anatomical categories along
the length of the rib and around the circumference of the rib, respectively.
The average thickness measurements within a particular homologous region for
all subjects of a given sex were regressed with age using Equation 1. This equation was
chosen because it fit the subject data well, capturing the cortical thickening through the
young adult ages, a maximum thickness reached in the middle ages, and then the cortical
thinning into the elderly ages.
𝑦 = 𝑎 + 𝑏𝑥𝑙𝑛(𝑥) + 𝑐𝑙𝑛(𝑥) [1]
Where a, b, and c are the regression coefficients, x is subject age in years, and y is the
cortical thickness in mm.
42
Comparisons were made for the regressed cortical thicknesses for both sexes with
age based on rib level (first through twelfth), attachment (manubrial, sternal, false,
floating), and anatomical region (anterior, lateral, posterior, superior, inferior, etc.).
4. RESULTS
A sample regression curve for a single sub-section of the male ribcage can be seen
in Figure 17. Equation 1, shown as the red curve in Figure 17A, is fit to the original
subject thickness estimations for all ages at that sub-section (blue circles). Based on the
regression equation, the thickness of the rib cortical bone is seen to increase steeply
through the younger ages for this particular sub-section, reach a maximum during the
middle ages, and then decrease fairly steadily into the elderly ages. These trends were
generally typical for all sub-sections. Cortical thickness variation trends for the entire
ribcage for both males and females are shown in Figure 18 where the regression
equations are evaluated for ages 20, 40, 60, and 80 years. The cortex thickness for both
sexes increased from age 20 to 40, reached a maximum between 40 and 60 and then
decreased from 60 to 80. There was slight thickening with age seen in some portions of
the first rib for both males and females. Variations in thickness throughout the ribcage
can be visualized too, with thinner cortex at the anterior and posterior portions of each
rib. There are also visible variations between the different ribs and around the rib
circumference.

43
A.
B.
Figure 17. A) An example regression curve for a
single sub-section for the males. B) This sub-section
is on the medial aspect of the third ring on the left
fifth rib.
Figure 18. The resulting cortex thickness for the entire ribcage for both males and females at
ages 20, 40, 60 and 80.
The average cortical thickness of the entire rib cage for each age decade was used
to compute the percent change in thickness relative to a 10 year old (Figure 19A).
10 20 30 40 50 60 70 80 90 1000
0.5
1
1.5
2
Age (years)
Thic
kness (
mm
)
Rib:5, Ring:3, Angle: 270

44
Females tended to increase in percent thickness almost equivalently with the males, until
the maximum thickness is reached (at approximately age 45 for females and 55 for
males). Then females decrease in thickness much more dramatically than males into the
elderly ages. The average maximum thickness for both males and females is
approximately 200% of the cortex thickness at age 10. In elderly age, male and female
cortical thickness decreased to approximately 180% and 140%, respectively. The
regressed cortex thicknesses for the different ages for both sexes show that females begin
with thicker ribs and actually have thicker average cortical bone until approximately age
70 (Figure 19B).
A.
B.
Figure 19. A) The percent change in cortex thickness (average from the entire rib cage) relative
to a 10 year old for both males and females. B) The regressed cortex thickness with age for both
males and females.
Looking specifically at rib level, females had similar trends in the percentage of
cortical thickening for the manubrial (ribs 1-2), sternal (ribs 3-7), and floating (ribs 8-10)
ribs, increasing up to approximately 200% of the thickness at age 10 and decreasing to
about 150% at age 100 (Figure 20A). The female false ribs (ribs 11-12) did not undergo
as much change, increasing only to about 150% of the thickness at age 10 and decreasing
45
to nearly 80% at age 100. Although the female false ribs did not change in thickness as
much, they in the younger ages they were much thicker that the other rib levels.
However, by the elderly ages, the false rib thicknesses are similar to the other rib levels
(Figure 20C). Males had more thickening in their manubrial ribs, up to 225% relative to a
10 year old, which then decreased to 200% in elderly age (Figure 20B). The male
manubrial ribs tended to be thinner than the rest of the ribs in the younger ages (Figure
20D). The male’s sternal and floating ribs mimicked the trends for the females,
increasing to nearly 200% and decreasing to approximately 175% relative to the 10 year
old thickness. The false ribs in males showed the least change in cortex thickness,
increasing only to about 175% then decreasing to about 110% relative to the 10 year old
thickness.
46
Females Males
A.
B.
C.
D.
Figure 20. Rib level comparisons for the percent change in cortex thickness compared to the
cortex thickness at age 10 by rib level for A) females and B) males, as well as the regressed
cortical bone thickness with age for C) females and D) males.
Females did not tend to have much variation in cortical thickening or thinning
trends between the anatomical locations within the ribs, both along the length of the rib
and around the circumference. Thicknesses values increased to approximately 200%
relative to a 10 year old, then decreased to approximately 140% in elderly age (Figure
21A and Figure 22A). However, there were some distinct differences in the regressed
thickness values with age for these locations for females. The female rib cortex increased
in thickness from the anterior portions of the rib to the lateral sections, then decreased in
thickness from lateral to posterior portions. The anterior portion remained the thinnest

47
region of all (Figure 21C). Around the circumference of the rib, it is evident that the
superior and inferior portions remain thinner than the exterior and interior locations
(Figure 22A and C).
Males had less thinning in the anterior portion of the rib compared to both females
and the other rib portions after reaching age 50, increasing to nearly 260% relative to the
10 year old thickness and then decreasing to only 220% at age 100 (Figure 21B). The
anterior portions of the ribs were thinner than other regions for the younger ages, and by
the elderly ages, reached a maximum thickness similar to the rest of the rib. The posterior
and anterolateral rib thicknesses did not vary as much down the rib. Thicknesses in these
regions increased with age to about 190% and then decreased with age to approximately
175% of the thickness at age 10. However, the posterior portion did thin at a faster rate
than all of the other locations. The lateral and posterolateral sections increased to
approximately 175% and then decreased to about 150%. Males also had cortex
thickening from the anterior region to the lateral region, and then thinning posteriorly,
with the anterior aspect remaining the thinnest across all ages (Figure 21D). Similar to
females, males did not seem to have any differences in cortex thickening or thinning
trends in relation to the anatomical location around the circumference of the rib. All four
anatomical regions studied increased to approximately 200% relative to the 10 year old
thickness, and then decreased to approximately 180% at age 100 (Figure 22B). The
regressed thickness values for males did show increased thickness at the exterior and
interior portions of the ribs compared to the superior and inferior sections (Figure 22D).

48
Females Males
A.
B.
C.
D.
Figure 21. The percent change in cortex thickness compared to the cortex thickness at age 10 by
anatomical location down the length of the rib for A) females and B) males, as well as the
regressed cortical bone thickness with age for C) females and D) males.
49
Females Males
A.
B.
C.
D.
Figure 22. The percent change in cortex thickness compared to the cortex thickness at age 10 by
anatomical location around the rib circumference for A) females and B) males, as well as the
regressed cortical bone thickness with age for C) females and D) males.
5. DISCUSSION
Regression equations were fit to subject-specific rib cortical thickness data
obtained using the CDM method on 222 male and female subjects ranging in age from 10
to 100 years. The resulting regressions showed general cortical thickening during the
early adult years, with ribs reaching a maximum thickness during the middle ages, and
then thinning in the elderly ages. Females on average reached their maximum thickness at
approximately age 45, while males reached their maximum thickness, approximately a
decade later, at about 55. Females experienced a much steeper slope of cortex thickening
50
up until their maximum thickness as opposed to males (Figure 19B). Females also had
more dramatic cortex thinning into the elderly ages compared to males, who have slighter
thinning of the cortex after age 55 (Figure 19).
These sex-specific trends, particularly of the cortical thinning into the elderly
ages, presents as expected based on aging bone literature. As bone ages, it has been
shown to have a reduction in new osteoblasts (bone forming cells) as well as a shorter
lifespan for mature osteoblasts [25]. There have also been variations in bone loss
associated with estrogen levels and Frost et al identified increased bone loss in women
after the onset of menopause, which would agree with the increased cortical thinning
trends in women versus men after the maximum thickness is reached [26].
In female rib level analyses, the false ribs changed the least with age (Figure
20A). The female false ribs had the thickest cortex in the younger ages and achieved
similar thicknesses to the rest of the rib levels into the elderly ages (Figure 20C). The
male false ribs also changed the least percent with age, but started out only slightly
thicker than the other ribs and by the elderly ages were much thinner than the rest. The
male and female ribs tended to have similar trends between locations along the rib length
(Figure 21A and B). This data matches well with the data presented in Kemper et al. 2007
work that noted that, at least on the exterior side, the lateral portions of the rib (ranging in
thickness from 1.05 to 1.39 mm) were thicker than the anterior portions (ranging from
0.55 to 0.97 mm) [12]. Looking specifically at male subjects (since Kemper only
included male cadaver ribs from ages 42-81), the regressed values for the lateral section
ranges from approximately 0.60 to approximately 1.0 mm, and the regressed values for
the anterior portion range from about 0.20 mm to about 0.65 mm. Although our ranges
51
include much thinner cortex estimates than Kemper’s data, our data is averaged for the
entire rib (including more than simply the exterior section), which may decrease our
average thicknesses. Our range is also for thicknesses of all ages 10-100, which includes
the thicknesses from the much thinner pediatric and elderly ribs.
Males and females had very similar trends in age-related thickness changes
between the different locations around the circumference of the rib. However, the
superior and inferior portions were thinner than the exterior and inferior portions in both
sexes. These comparisons are similar comparatively to the circumferential variations
found by Choi and Lee (2009) [15]. Choi and Lee fit a curve to raw cortical thickness
measurements taken from lateral cross sections of seven elderly (ages 64-75) Korean
male subjects’ ninth ribs, which ranged from approximately 0.3mm in the superior and
inferior portions to approximately 1.2 mm in the interior portion and 1.0 in the exterior
portion. Our data does not show nearly as much variation for a single rib cross section,
but does show approximately 0.1 mm of variation between the superior/inferior portion
and the interior/exterior portion. These variations may be explained by the fact that
increased bone formation has been identified at locations of increased loading, and the
exterior and interior portions of the rib are the aspects that are under tension and
compression during rib bending [27].
These variations in rib cortical bone thickness with age and sex provide an ideal
basis for comparing normal cortex with diseased cortex (irradiated, cancerous,
osteoporotic, etc.). These regressions can also be used for calculating the approximate
cortical thickness for use in subject-specific finite element models, which can in turn
52
better predict rib fracture in subjects of all ages. Better predictive models for rib fracture
will allow for improved mitigation of thoracic injuries, which in turn saves lives.
6. CONCLUSION
This study used data from 222 subjects to develop functions to quantify rib
cortical thickness variation within the rib cage and with age (10-100 years) and sex. In
general, rib cortex thickens through the young adult ages and reaches a maximum
thickness in the middle ages that is approximately double the cortical thicknesses of a 10
year old. From middle to elderly age, rib cortical thickness decreases steadily to about
180% (males) and 140% (females), relative to the 10 year old cortical thickness.
Thickness variations were observed between different rib levels, locations along the rib
length, and locations around the rib circumference. These regression curves can be used
in the future for comparison with diseased bones as well as for incorporation of variable
cortical thickness into personalized finite element thoraxes.
7. ACKNOWLEDGEMENT
Funding was provided by the National Highway Traffic Safety Administration under
Cooperative Agreement Number DTN22-09-H-00242. Views expressed are those of the
authors and do not represent the views of NHTSA.

53
8. REFERENCES
1. Ruan, J., et al., Prediction and analysis of human thoracic impact responses and
injuries in cadaver impacts using a full human body finite element model. Stapp
Car Crash J, 2003. 47: p. 299-321.
2. Arajärvi E, S.S., Chest injuries sustained in severe traffic accidents by seatbelt
wearer. J Trauma, 1989(29): p. 37-41.
3. Sirmali, M., et al., A comprehensive analysis of traumatic rib fractures:
morbidity, mortality and management. Eur J Cardiothorac Surg, 2003. 24(1): p.
133-8.
4. Stawicki, S.P., et al., Rib fractures in the elderly: a marker of injury severity. J
Am Geriatr Soc, 2004. 52(5): p. 805-8.
5. Bergeron, E., et al., Elderly Trauma Patients with Rib Fractures Are at Greater
Risk of Death and Pneumonia. J Trauma, 2003. 54(3): p. 478-485.
6. Bulger, E.M.M.D., et al., Rib Fractures in the Elderly. Journal of Trauma-Injury
Infection & Critical Care, 2000. 48(6): p. 1040-1047.
7. Kent, R., et al., Structural and material changes in the aging thorax and their role
in crash protection for older occupants. Stapp Car Crash J, 2005. 49: p. 231-49.
8. Golman, A.J., et al., Injury prediction in a side impact crash using human body
model simulation. Accident Analysis & Prevention, 2014. 64: p. 1-8.
9. El-Jawahri, R.E., Laituri, T.R., Ruan, J.S., Rouhana, S.W., Barbat, S.D.,
Development and Validation of Age-Dependent FE Human Models of a Mid-Sized
Male Thorax. Stapp Car Crash Journal, 2010. 54: p. 407-430.
54
10. Ito, O., Dokko, Y., Ohashi, K. , Development of adult and elderly FE thorax
skeletal models, in Society of Automotive Engineers. 2009.
11. Kemper, A.R., et al., Material properties of human rib cortical bone from
dynamic tension coupon testing. Stapp Car Crash J, 2005. 49: p. 199-230.
12. Kemper, A.R., et al., The biomechanics of human ribs: material and structural
properties from dynamic tension and bending tests. Stapp Car Crash J, 2007. 51:
p. 235-73.
13. Urban, J.E., et al., Evaluation of morphological changes in the adult skull with
age and sex. J Anat, 2014.
14. Gayzik, F.S., et al., Quantification of age-related shape change of the human rib
cage through geometric morphometrics. J Biomech, 2008. 41(7): p. 1545-54.
15. Choi, Y.C. and I. Lee, Thorax FE Model for Older Population. Japanese Scoeity
of Mechanical Engineers, Fukuoka, 2009.
16. Sedlin, E.D. and H.M. Frost, Variations in Cross-section Area of Rib Cortex.
Journal of Gerontology, 1963. 18: p. 9-13.
17. Parfitt, A.M., Age-related structural changes in trabecular and cortical bone:
cellular mechanisms and biomechanical consequences. Calcif Tissue Int, 1984.
36 Suppl 1: p. S123-8.
18. Chen, H., et al., Age-related changes in trabecular and cortical bone
microstructure. Int J Endocrinol, 2013. 2013: p. 213234.
19. Macdonald, H.M., et al., Age-related patterns of trabecular and cortical bone loss
differ between sexes and skeletal sites: a population-based HR-pQCT study. J
Bone Miner Res, 2011. 26(1): p. 50-62.

55
20. Thompson, D.D., Age changes in bone mineralization, cortical thickness, and
haversian canal area. Calcif Tissue Int, 1980. 31(1): p. 5-11.
21. Lillie, E.M., et al., Estimation of skull table thickness with clinical CT and
validation with microCT. J Anat, 2015. 226(1): p. 73-80.
22. Karlsson, M.K., et al., An Increase in Forearm Cortical Bone Size After
Menopause May Influence the Estimated Bone Mineral Loss-A 28-Year
Prospective Observational Study. J Clin Densitom, 2015.
23. Treece, G.M., et al., High resolution cortical bone thickness measurement from
clinical CT data. Med Image Anal, 2010. 14(3): p. 276-90.
24. Treece, G.M., K.E. Poole, and A.H. Gee, Imaging the femoral cortex: thickness,
density and mass from clinical CT. Med Image Anal, 2012. 16(5): p. 952-65.
25. Rejtarova, O., et al., Costal cartilages--a clue for determination of sex. Biomed
Pap Med Fac Univ Palacky Olomouc Czech Repub, 2004. 148(2): p. 241-3.

56
Chapter IV: Summary of Research
The research presented in this thesis has yielded important contributions to the
field of injury biomechanics. Through the application of a cortical thickness estimation
algorithm and subsequent analysis of the estimated cortex thicknesses by age and sex, the
following objectives have been completed in this thesis:
1. Compare cortex thicknesses variations with rib level, rib attachment, age, sex, and
anatomical location within each rib.
2. Fit a regression curve to cortical thickness estimates throughout the ribcage to
characterize regional cortex thickness changes with age and sex.
3. Compare the resulting regressed cortical thickness variations with age, sex, rib
level, rib attachment, and anatomical location within each rib.
Quantification of the changes in rib cortical bone thickness with age and sex will
not only allow for personalized finite element models to be created with increased
biofidelity, but can also be used as a basis for comparison with disease states. The
methodology presented here can also be used in a number of applications. Research
presented in Chapter II and Chapter III is expected to be published in scientific journals
listed in Table 1.
Table 1. Publication plan for research outlined in this thesis.
Chapter Topic Journal
II Application of CDM and Subsequent
Organization of Cortex Thickness
Estimates
Journal of Anatomy
III Regression and Analysis of
Regionally Organized Cortex
Thickness Estimates by Age and Sex
Journal of Anatomy
†Published
*Submitted

57
Scholastic Vita
SARAH LYNCH Research Engineer, Injury Biomechanics
EDUCATION
Virginia Tech – Wake Forest University, Winston-Salem, NCM.S. in Biomedical Engineering (May 2015) Center for Injury Biomechanics, Advisor: Dr. Joel D. Stitzel North Carolina State University, Raleigh, NC B.S. in Biomedical Engineering (Dec. 2012)
RESEARCH EXPERIENCE Biomechanics Consultant, Crash Injury Research and Engineering Network Jan. 2013 – Present Principal Investigator: Joel D. Stitzel, PhD Virginia Tech-Wake Forest University Center for Injury Biomechanics National Highway Traffic Safety Administration The CIREN process combines prospective data collection with professional multidisciplinary analysis of medical and engineering evidence to determine injury causation to improve the prevention, treatment, and rehabilitation of motor vehicle crash injuries to reduce deaths, disabilities, and human and economic costs.
Researcher, CIREN Head Injury Biomechanics Research Jan. 2013 – Present Research Intern, CIREN Head Injury Biomechanics Research May 2012 – Aug. 2012 Principal Investigator: Joel D. Stitzel, PhD Virginia Tech-Wake Forest University Center for Injury Biomechanics NHTSA/Crash Injury Research and Engineering Network This study combines medical image analysis and biomechanics to quantify the volume, extent, and distribution of head injuries with respect to crash characteristics and occupant parameters to better predict occupant injury following a motor vehicle crash.
Researcher, NHTSA Chest Morphometrics Data Collection and Model Development Jan. 2013 – Present Principal Investigator: Joel D. Stitzel, PhD Virginia Tech-Wake Forest University Center for Injury Biomechanics National Highway Traffic Safety Administration This study analyzes medical images to quantify the changes in geometry and cortical thickness of the ribcage in relation to age and sex of the subjects. These changes combined with literature reported changes in rib material property results in age- and sex-specific finite element models.
Researcher, Ethicon Abdominal and Pelvic Anatomy Study Nov. 2014 – Present Principal Investigator: Joel D. Stitzel, PhD Virginia Tech-Wake Forest University Center for Injury Biomechanics Ethicon, Inc. This study uses image segmentation, registration, and geometrical modeling techniques to produce 3D geometries of the bony pelvis and several abdominal and pelvic organs from male subjects of approximately the same height and weight as the 50th percentile male. These geometries combined with specific anatomical measurements will allow for an accurate representation of the average male’s bony and soft tissue anatomy for use in colorectal surgery device design and testing. Researcher, CIREN Bone Mineral Density Study Aug. 2013 – Present Principal Investigator: Joel D. Stitzel, PhD Virginia Tech-Wake Forest University Center for Injury Biomechanics National Highway Traffic Safety Administration This study made a correlation between DXA bone density measurements and clinical CT scan greyscale values so that bone mineral density measurements could be estimated from clinical CT scans, allowing for a reduction in radiation, time, and number of tests run on patients.
Research Intern, Human Physiology of Wearable Robots July 2011 – May 2012 Principal Investigator: Gregory Sawicki, PhD UNC Chapel Hill-North Carolina State University Joint Department of Biomedical Engineering This study examined muscle fiber dynamics of hemiparetic walking using an ultrasound probe, as well as associated joint dynamics using Vicon motion capture systems.
(910) 617-2985
Winston-Salem, NC 27103
58
DESIGN EXPERIENCE
Design Engineer, Raptor Hand Prosthetic Aug. 2012 – Oct. 2013
Project Lead: Philip Brown
Design Engineer, Suture Needle Holder Sep. 2013 – Nov. 2013
Project Lead: Philip Brown
Design Engineer, Femoral Artery Patency Device Aug. 2012 – Dec. 2012
Supervisor: Andrew Dimeo, PhD
Project Manager, Design Engineer, Infant Respiratory Monitor Aug. 2011 – May. 2012
Supervisor: Andrew Dimeo, PhD
TEACHING EXPERIENCE
Wake Forest University, Winston-Salem, NC Feb. 2015
Guest Lecturer, Seminar Course
Characterization of Cortical Bone Thickness Changes with Age and Sex
Wake Forest University, Winston-Salem, NC Jan. 2015
Guest Lecturer, Injury Biomechanics
Crash Injury Research and Engineering Network (CIREN)
Davie County High School, Mocksville, NC Sep. 2013 – Jan. 2015
Tutor, Mathematics
Algebra II, Integrated II, A.P. Calculus AB, A.P. Calculus BC
Ravenscroft School, Raleigh, NC Sep. 2012 – Jan. 2013
Tutor/Mentor, Accelerated Learning
Environmental Science, Biology, Astronomy, Basic Mathematics SKILLS
Computer: MATLAB, Microsoft Office, SolidWorks, AutoCad, Mimics, ADAMS, Stradwin, LS PrePost, LS DYNA, Geomagic Studio, Hypermesh, JMP, TeraRecon, PSPICE PUBLICATIONS AND PAPERS
Papers in Refereed Journals
1. Weaver AA, Schoell SL, Nguyen CM, Lynch SK, Stitzel JD. “Morphometric Analysis of Variation in the Sternum with Sex and Age.” Journal of Morphology, 2014 Nov; 275(11): 1284-99. doi: 10.1002/jmor.20302.
Papers in Refereed Conference Publications
1. Lillie EM, Urban JE, Lynch SK, Whitlow CT, Stitzel JD. "Evaluation of the Extent and Distribution of Diffuse Axonal Injury from Real World Motor Vehicle Crashes." Rocky Mountain Bioengineering Proceedings, April 2013.
Other Conference Papers (abstract style or non-refereed)/Scientific Exhibits
1. Lynch SK, Weaver AA, Schoell S, Stitzel JD. “The Characterization of Cortical Bone Thickness Changes in the Thoracic Skeleton with Age and Sex.” 2014 Biomedical Engineering Society Annual Meeting, San Antonio, TX, October 2014.
2. Lillie EM, Urban JE, Lynch SK, Weaver AA, Stitzel JD. "Skull Cortical Thickness Changes in the Adult Skull Measured from Clinical Computed Tomography Scans." World Congress of Biomechanics, Boston, MA, July 2014
3. Lynch SK, Weaver AA, Stitzel JD. “Characterization of Cortical Bone Thickness Changes in the Thoracic Skeleton with Age and Gender.” Virginia Tech-Wake Forest University School of Biomedical Engineering and Sciences Graduate Student Research Symposium, Winston Salem, NC, May 2014.
4. Lillie EM, Urban JE, Lynch SK, Weaver AA, Powers AK, Stitzel JD. "Validation and Evaluation of Full and Cortical Skull Thickness Changes with Age and Sex." Virginia Tech-Wake Forest University School of Biomedical Engineering and Sciences Graduate Student Research Symposium, Winston Salem, NC, May 2014.

59
5. Urban JE, Weaver AA, Schoell S, Lillie EM, Lynch SK, Stitzel JD. "Variation in Anthropometry of the Head and Chest with Age for Application to Human Injury Prediction." SAE 2014 Government/Industry Meeting, Washington, DC, January 2014.
6. Urban JE, Lynch SK, Stitzel JD. "Evaluation of Head Injury: Extent and Distribution of Lesions from Motor Vehicle Crashes." Fortieth International Workshop on Human Subjects for Biomechanical Research, Savannah, GA, October 2012.
Additional Presentations at Professional Meetings/Conferences
1. Lynch, SK, Weaver AA, Schoell SL, Stitzel JD. “Rib Cortical Bone Thickness Changes; A Three-Minute Thesis”, Wake Forest Graduate Student and PostDoc Research Day, March 2015.
2. Weaver AA, Schoell SL, Urban JE, Lynch SK, Lillie EM, Gayzik FS, Stitzel JD. “Development of an Older Occupant FE Model Incorporating Geometry, Material Property, and Cortical Thickness Variation”, Society of Automotive Engineers Government Industry Meeting, January 2015.
3. Stitzel JD, Weaver AA, Lynch SK, Hightower C, Miller AN, Beavers K. “Measurement of Bone Quality for CIREN and Correlation with Age and Fracture Incidence.” CIREN Public Meeting, Charlottesville, VA, September 2014.
4. Urban JE, Lynch SK, Melyiani M, Lillie, EM, Whitlow CT, Maldjian JA, Powers AK, Meredith W, Hardy W, Takhounts E, Stitzel JD. “Understanding Brain Injury Mechanism: Integrating Real-World Lesions, ATD Response and Finite Element Modeling.” CIREN Public Meeting, Washington, DC, September 2013.
5. Urban JE, Lynch SK, Whitlow CT, Maldjian JA, Powers AK, Meredith W, Hardy W, Takhounts E, Stitzel JD. “Understanding Brain Injury Mechanism: Integrating Real-World Lesions, ATD Response and Finite Element Modeling.” CIREN Public Meeting, Washington, DC, September 2012.
Technical Reports
1. Stitzel JD, Duma S, Hardy W, Weaver AA, Urban JE, Schoell S, Lynch SK, Jones DA, Rowson S, Fievisohn E. “Year 5, Annual Report. Head and Thoracic Injury: Epidemiological, Experimental, and Computational Approaches to Injury Reduction.” Report to the National Highway Traffic Safety Administration, Washington, DC, August 2014. 2. Stitzel JD, Duma S, Hardy W, Weaver AA, Urban JE, Schoell S, Lillie EM, Lynch SK, Rowson S, Fievisohn E. “Year 4, Annual Report. Head and Thoracic Injury: Epidemiological, Experimental, and Computational Approaches to Injury Reduction.” Report to the National Highway Traffic Safety Administration, Washington, DC, August 2013.