characterization of optimized recrystallized...
TRANSCRIPT

Characterization of Optimized
Recrystallized Agglomerates

Chapter 8: Characterization of optimized recrystallized agglomerates of MA
Direct tabletting and BA improvement of MA by spherical crystallization tech. 217
8. Characterization of optimized recrystallized agglomerates:
8.1. Particle shape identification by scanning electron microscopy (SEM) and
microscopical photographs:
The shape, surface characteristics and type of crystals of macrolide antibiotics and their
recrystallized agglomerates were analyzed by using a scanning electron microscopy
operating at 10 kV.The samples were dusted onto double sided tape on an aluminum stub
and sputter-coated with gold particles in an argon atmosphere.
8.1.1. SEM and microscopical photographs of ATM and recrystallized agglomerates:
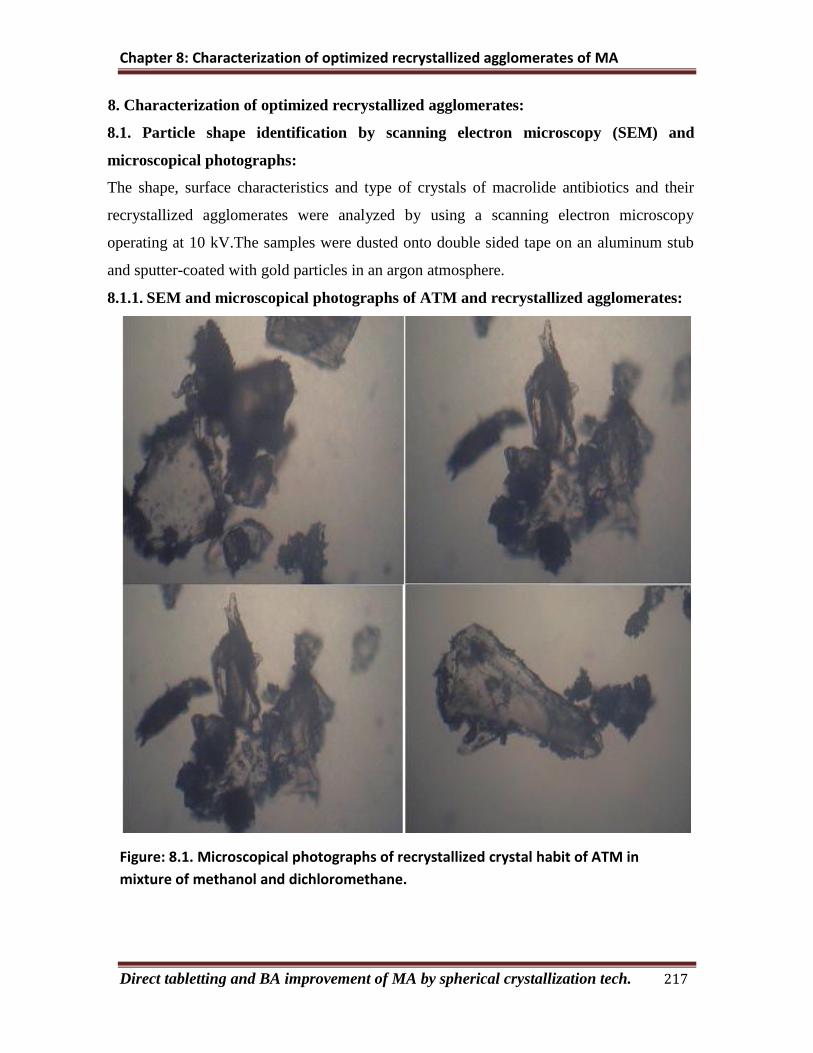
Figure: 8.1. Microscopical photographs of recrystallized crystal habit of ATM in
mixture of methanol and dichloromethane.
Chapter 8: Characterization of optimized recrystallized agglomerates of MA
Direct tabletting and BA improvement of MA by spherical crystallization tech. 218
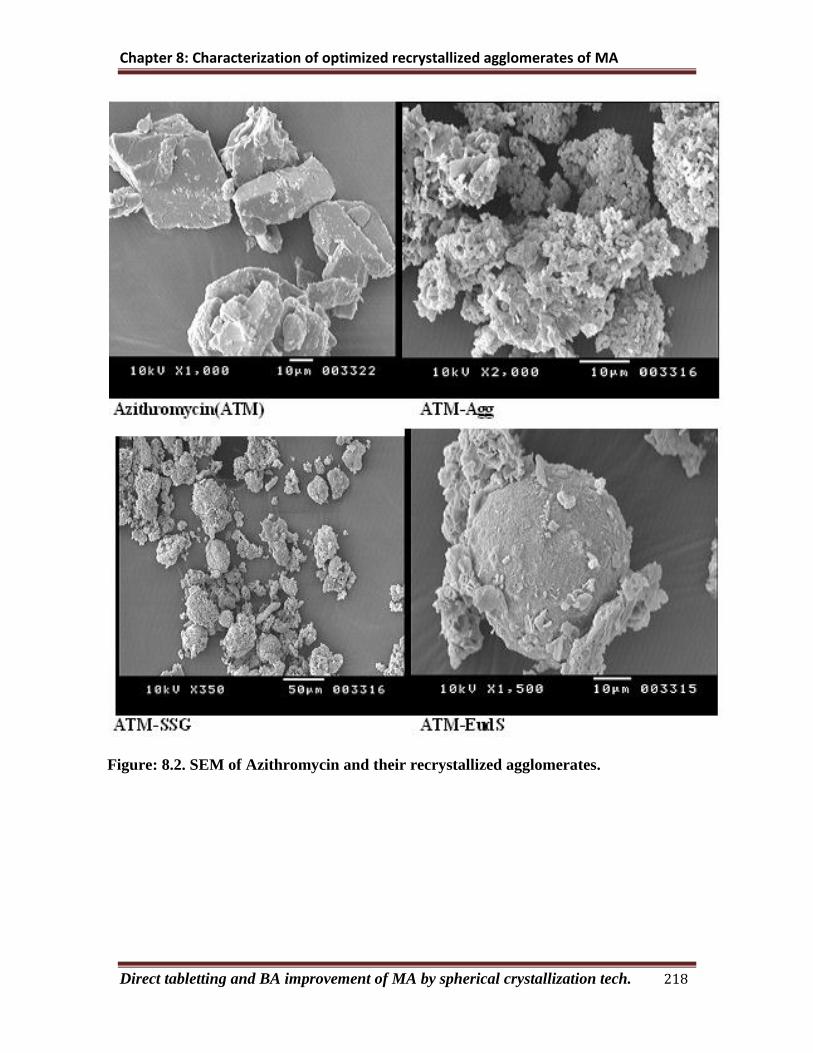
Figure: 8.2. SEM of Azithromycin and their recrystallized agglomerates.

Chapter 8: Characterization of optimized recrystallized agglomerates of MA
Direct tabletting and BA improvement of MA by spherical crystallization tech. 219
Figure: 8.3. Microscopical photographs of Azithromycin and Their recrystallized
agglomerates.

Chapter 8: Characterization of optimized recrystallized agglomerates of MA
Direct tabletting and BA improvement of MA by spherical crystallization tech. 220
8.1.2. SEM and microscopical photographs of CTM and recrystallized agglomerates:
Figure: 8.4. Microscopical photographs of recrystallized crystal habit of CTM in
mixture of Ethanol and dichloromethane.

Chapter 8: Characterization of optimized recrystallized agglomerates of MA
Direct tabletting and BA improvement of MA by spherical crystallization tech. 221
Figure:8.5. SEM photographs of CTM and CTM-Agg at different magnification.

Chapter 8: Characterization of optimized recrystallized agglomerates of MA
Direct tabletting and BA improvement of MA by spherical crystallization tech. 222
Figure: 8.6. SEM photographs of CTM-SSG and CTM-EudS at two magification.

Chapter 8: Characterization of optimized recrystallized agglomerates of MA
Direct tabletting and BA improvement of MA by spherical crystallization tech. 223
8.1.3. SEM and microscopical photographs of RTM and recrystallized agglomerates:
Figure: 8.7. Microscopical photographs of recrystallized crystal habit of RTM in
mixture of Ethanol and chloroform.

Chapter 8: Characterization of optimized recrystallized agglomerates of MA
Direct tabletting and BA improvement of MA by spherical crystallization tech. 224
Figure: 8.8. SEM photographs of RTM and their recrystallized agglomerates.

Chapter 8: Characterization of optimized recrystallized agglomerates of MA
Direct tabletting and BA improvement of MA by spherical crystallization tech. 225
8.1.4. SEM and microscopical photographs of ETM and recrystallized agglomerates:
Figure: 8.9. Microscopical photographs of recrystallized crystal habit of RTM in
mixture of Ethanol and chloroform.

Chapter 8: Characterization of optimized recrystallized agglomerates of MA
Direct tabletting and BA improvement of MA by spherical crystallization tech. 226
Figure: 8.10. SEM photographs of ETM and their recrystallized agglomerates.

Chapter 8: Characterization of optimized recrystallized agglomerates of MA
Direct tabletting and BA improvement of MA by spherical crystallization tech. 227
Figures 8.1, 8.4, 8.7 and 8.9 represent the microscopical photographs of crystal habit of
macrolide antibiotics ATM, CTM, RTM and ETM respectively in the mixture of good
solvent and bridging liquid. From the observations it is clears that the macrolide
antibiotics show platelets, needle or irregular stone shaped crystal habit in mixture of
good solvent and bridging liquid.
Figure: 8.2 and 8.3 represent the SEM and microscopical photographs of ATM and their
recrystallized agglomerates. Figure: 8.5 and 8.6 represent the SEM and microscopical
photographs of CTM and their recrystallized agglomerates. Figure: 8.8 represent the
SEM photographs of RTM and their recrystallized agglomerates and Figure: 8.10
represent the SEM photographs of CTM and their recrystallized agglomerates.
The micro morphological properties of the control raw crystals of macrolide antibiotics
and developed recrystallized agglomerated samples were studied by using SEM and
microscopical photographs. The above mentioned figures show a typical shape of
agglomerated and unagglomerated` crystals of macrolide antibiotics. The control
macrolide antibiotics are irregular stone shaped crystals. Their flow properties are poor
due to the crystal habit and the electrostatic charge. The spherical single particle is
formed by very small shaped recrystallized crystals, which are closely compacted into a
spherical form. In case of agglomerates obtained by QESD method, the emulsion droplets
crystallized instantaneously from their surface inward, so the resultant agglomerates were
very dense in texture. SEM with higher magnification revealed that agglomerates were
spherical aggregates of small recrystallized needle or plate shaped crystals. The bigger
particle size and the associated decreased specific surface of the agglomerates resulted in
better compactibility and cohesivity properties for the developed than the control sample.
The improvement of sphericity may be attributed to a coating developed on the
microcrystals before their binding into agglomerates, which resulted in improved
symmetry of packing and therefore sphericity of recrystallized agglomerates.

Chapter 8: Characterization of optimized recrystallized agglomerates of MA
Direct tabletting and BA improvement of MA by spherical crystallization tech. 228
8.2 Fourier transforms infra red spectroscopy (FTIR) of macrolide antibiotics and
prepared optimized recrystallized agglomerates:
FTIR spectra of the macrolide antibiotics were recorded on Shimadzu FT IR – 8400
spectrophotometer. Potassium bromide pellet method was employed and background
spectrum was recorded under identical situation. Each spectrum was derived from single
average scans collected in the region 400 – 4000 cm-1
at spectral resolution of 2 cm-2
.
Spectra were analyzed by software supplied by Shimadzu.
8.2.1 FTIR spectra of ATM and their optimized recrystallized agglomerates.
Figure: 8.11. FTIR spectra of ATM, ATM-EudS and ATM-HEC.

Chapter 8: Characterization of optimized recrystallized agglomerates of MA
Direct tabletting and BA improvement of MA by spherical crystallization tech. 229
Figure: 8.12. FTIR spectra of ATM-SSG, ATM-N (PEG) and ATM-HPMC.
Table: 8.1. Principal or characteristic FTIR peak of ATM and their recrystallized
agglomerates.
Sr.No Crystal code Principal peak (cm-1
)
1 ATM 1726.35 1182.40 1053.17
2 ATM-EudS 1726.35 1182.40 1053.17
3 ATM-PVP 1726.35 1182.40 1053.17
4 ATM-SSG 1726.35 1182.40 1053.17
5 ATM-N(PEG) 1720.56 1186.26 1051.24
6 ATM-HPMC 1726.35 1184.33 1053.17
Figure: 8.11 and 8.12 represent the FTIR spectra of ATM and optimized recrystallized
agglomerates.Table:8.1 represent the characteristic peaks of ATM and prepared
recrystallized agglomerates. In the range of 4000 to 500 cm-1
azithromycin exhibit a
strong sharp signal at 1726 cm-1
which is due to absorption of the carbonyl group. From
the literature survey the principal or characteristic peak of Azithromycin FTIR includes

Chapter 8: Characterization of optimized recrystallized agglomerates of MA
Direct tabletting and BA improvement of MA by spherical crystallization tech. 230
1721, 1188, 1052cm-1
. The spectrum of recrystallized agglomerates corresponds to the
superimposition of raw crystals of azithromycin (mentioned in above table: 8.1) with no
significant shift of major peaks. The close agreement between the FT-IR spectra of the
raw azithromycin crystals and their recrystallized agglomerates suggested that there were
no changes in the ATM molecular structure caused by the recrystallization and the
agglomeration process. This confirms the presence of azithromycin in recrystallized
agglomerates without changing the chemical structure (1).
8.2.2 FTIR spectra of CTM and their optimized recrystallized agglomerates.
Figure: 8.13. FTIR spectra of CTM, CTM-EudS and CTM-PVP.

Chapter 8: Characterization of optimized recrystallized agglomerates of MA
Direct tabletting and BA improvement of MA by spherical crystallization tech. 231
Figure: 8.14. FTIR spectra of CTM-SSG and CTM-N (HPMC).
Table: 8.2. Principal or characteristic FTIR peak of CTM and their recrystallized
agglomerates.
Sr.No Crystal code Principal peak (cm-1
)
1 CTM 1732.13 1689.70 1172.76 1107.18 1051.24
2 CTM-EudS 1732.13 1689.70 1168.90 1107.18 1053.17
3 CTM-PVP 1732.13 1689.70 1172.76 1107.18 1053.17
4 CTM-SSG 1732.13 1689.70 1172.76 1107.18 1053.17
5 CTM-N(HPMC) 1732.13 1689.70 1172.76 1107.18 1053.17
Figure: 8.13 and 8.14 represent the FTIR spectra of CTM and optimized recrystallized
agglomerates.Table:8.2 represent the characteristic peaks of CTM and prepared
recrystallized agglomerates. The principal peaks of the clarithromycin includes 1734,
1692, 1108, 1170, 1052cm-1
.FT-IR spectra were measured in order to establish the
molecular state in CTM and optimized agglomerated crystals (in above mentioned
Figures).CTM crystals show characteristic peaks of C=O stretching vibration from ketone

Chapter 8: Characterization of optimized recrystallized agglomerates of MA
Direct tabletting and BA improvement of MA by spherical crystallization tech. 232
group in a lactone ring (at 1689.17 cm−1) and from O-C=O stretching vibration in a
lactone ring (at 1732.13 cm−1). The principal peaks of clarithromycin were observed in
their recrystallized agglomerates. This indicated that there was no difference between the
internal structures and conformation of these samples at the molecular level. [2]
8.2.3 FTIR spectra of RTM and their optimized recrystallized agglomerates.
Figure: 8.15. FTIR spectra of RTM, RTM-HPC and RTM-PVP.

Chapter 8: Characterization of optimized recrystallized agglomerates of MA
Direct tabletting and BA improvement of MA by spherical crystallization tech. 233
Figure: 8.16. FTIR spectra of RTM-SSG, RTM-N (PEG) and RTM-EudS.
Figure: 8.15 and 8.16 represent the FTIR spectra of RTM and optimized recrystallized
agglomerates.Table:8.3 represent the characteristic peaks of RTM and prepared
recrystallized agglomerates. FTIR spectrum of Roxithromycin presented characteristic
sharp peaks at
2968 cm−1 (C–H stretching vibration of alkane)
1726 cm−1 corresponding to carbonyl stretching of the lactone ring containing
more than six carbon atoms.
The presence of broad spectra at 3100 to 3710 cm−1 may be due to the presence
of bound moisture indicating incomplete drying.

Chapter 8: Characterization of optimized recrystallized agglomerates of MA
Direct tabletting and BA improvement of MA by spherical crystallization tech. 234
Table: 8.3. Principal or characteristic FTIR peak of RTM and their recrystallized
agglomerates.
Sr.No Crystal code Principal peak (cm-1
)
1 RTM 2968.55 1726.35
2 RTM-HPC 2968.55 1726.35
3 RTM-PVP 2968.55 1726.35
4 RTM-SSG 2968.55 1726.35
5 RTM-BCD 2968.55 1726.35
6 RTM-N(PEG) 2968.55 1726.35
7 RTM-EudS 2968.55 1726.35
The all above mentioned principal peaks of roxithromycin were present in their
recrystallized agglomerates (mentioned in above table: 8.3). The closeness between the
FT-IR spectra of the roxithromycin and their recrystallized agglomerates suggested that
there were no changes in the roxithromycin molecular structure due to recrystallized
agglomeration technique.
8.2.4 FTIR spectra of ETM and their optimized recrystallized agglomerates.
Figure: 8.17. FTIR spectra of ETM, ETM-EudS and ETM-BCD.

Chapter 8: Characterization of optimized recrystallized agglomerates of MA
Direct tabletting and BA improvement of MA by spherical crystallization tech. 235
Figure: 8.18. FTIR spectra of ETM-SSG, ETM-N (PEG), ETM-PEG and ETM-F68.
Figure: 8.17 and 8.18 represent the FTIR spectra of ETM and optimized
recrystallized agglomerates.Table:8.4 represent the characteristic peaks of ETM and
prepared recrystallized agglomerates. The IR spectra of ETM and their
recrystallized agglomerates are shown in above figure. The 1715cm−1
corresponding to carbonyl stretching (C=O) of the lactone ring and 2968 cm−1 (C–
H stretching vibration of alkane) which is the principal peaks of erythromycin.

Chapter 8: Characterization of optimized recrystallized agglomerates of MA
Direct tabletting and BA improvement of MA by spherical crystallization tech. 236
Table: 8.4. Principal or characteristic FTIR peak of ETM and their
recrystallized agglomerates.
Sr.No Crystal code Principal peak (cm-1
)
1 ETM 1714.77 2972.40
2 ETM-EudS 1716.70 2972.40
3 ETM-HPMC 1716.70 2972.40
4 ETM-BCD 1716.70 2972.40
5 RTM-SSG 1716.70 2972.40
6 RTM-F68 1716.70 2972.40
7 RTM-PEG 1714.77 2972.40
8 RTM-N(PEG) 1716.70 2972.40
The result with FTIR seems to indicate there is no significant change in principal
peaks in agglomerated crystals compared to ETM.

Chapter 8: Characterization of optimized recrystallized agglomerates of MA
Direct tabletting and BA improvement of MA by spherical crystallization tech. 237
8.3 Powder X-ray diffraction studies of macrolide antibiotics and their optimized
recrystallized agglomerates:
Powder X-ray diffraction (PXRD) patterns were traced by employing X-ray diffractometer
(Philips PW 1729, Analytical XRD, Holland) for the samples using Ni filtered CuK(α)
radiation (intensity ratio(α1/ α2): 0.500), a voltage of 40 KV, a current of 30 mA and
receiving slit of 0.2 inches. The samples were analyzed over 2 range of 5.010-39.990o
with scanning step size of 0.020 o (2 ) and scan step time of one second.
8.3.1 Powder X-ray diffraction studies of ATM and recrystallized agglomerates:
Figure:8.19. Powder X-ray diffraction studies of ATM,ATM-EudS and ATM-HEC.

Chapter 8: Characterization of optimized recrystallized agglomerates of MA
Direct tabletting and BA improvement of MA by spherical crystallization tech. 238
Figure:8.20. Powder X-ray diffraction studies of ATM-SSG, ATM-N (PEG) and
ATM-HPMC.

Chapter 8: Characterization of optimized recrystallized agglomerates of MA
Direct tabletting and BA improvement of MA by spherical crystallization tech. 239
Table:8.5.2θ and d-value of azithromycin and their recrystallized agglomertates.
Sr.
No.
Angle(02θ) [d-value] of ATM and their recrystallized agglomerates from XRD plot
ATM ATM-Agg ATM-EudS ATM-PVP ATM-SSG ATM-
N(PEG)
ATM-F68 ATM-BCD
1 5.065(17.44) ---------- ---------- ---------- ---------- 5.640(15.66) ---------- ----------
2 6.255(14.11) 6.135(14.40) ---------- 6.265(14.10) ---------- ---------- ---------- 6.300(14.02)
3 7.790(11.34) 7.805(11.32) 7.795(11.34) 7.965(11.10) ---------- ---------- 7.950(11.12) 7.715(11.45)
4 8.090(10.92) ---------- ---------- ---------- 8.010(11.03) 8.175(10.81) ---------- 7.985(11.07)
5 9.550(9.26) ---------- ---------- ---------- ---------- ---------- ---------- ----------
6 9.720(9.10) 9.725(9.90) 9.795(9.03) 9.755(9.06) ---------- ---------- 9.830(8.99) 9.715(9.10)
7 9.840(8.99) ---------- ---------- 9.940(8.90) 10.030(8.81) 10.140(8.72) 9.975(8.86) 9.935(8.90)
8 ---------- ---------- ---------- 11.020(8.03) ---------- ---------- ---------- ----------
9 11.285(7.84) 11.180(7.91) 11.215(7.88) 11.235(7.87) 11.355(7.79) 11.430(7.74) 11.270(7.84) 11.210(7.89)
10 11.945(7.41) ---------- ---------- ---------- ---------- ---------- 11.875(7.44) ----------
11 ---------- 12.230(7.12) 12.390(7.14) 12.275(7.21) ---------- 12.235(7.23) ---------- 12.365(7.15)
12 12.475(7.09) 12.530(7.06) 12.625(7.01) 12.785(6.92) 12.420(7.13) 12.580(7.04)
13 13.955(6.35) 13.905(6.37) 13.975(6.34) ---------- 14.070(6.29) 14.090(6.29) 14.040(6.31) 14.055(6.30)
14 14.670(6.04) 14.750(6.01) ---------- 14.110(6.28) ---------- ---------- ---------- 14.685(6.03)
15 15.325(5.78) 15.245(5.81) 15.305(5.79) 15.455(5.73) 15.455(5.73) 15.745(5.63) 15.260(5.81) 15.410(5.75)
16 15.680(5.64) ---------- ---------- ---------- ---------- ---------- ---------- ----------
17 16.205(5.46) ---------- ---------- 16.370(5.42) ---------- ---------- 16.335(5.43) ----------
18 16.510(5.37) ---------- ---------- ---------- ---------- 16.650(5.33) ---------- ----------
19 17.320(5.12) 17.130(5.18) 17.145(5.17) 17.255(5.14) 17.245(5.14) ---------- ---------- 17.180(5.16)
20 17.770(4.99) ---------- ---------- 17.710(5.01) ---------- 17.755(4.99) 17.505(5.07) 17.445(5.08)
21 18.105(4.89) ---------- ---------- ---------- ---------- ---------- ---------- ----------
22 18.550(4.78) ---------- ---------- 18.705(4.75) 18.720(4.74) 18.845(4.71) 18.750(4.73) 18.635(4.76)
23 19.045(4.66) 19.005(4.67) 19.080(4.65) 19.100(4.65) ---------- ---------- ---------- 19.050(4.66)
24 19.717(4.50) ---------- 19.860(4.46) ---------- ---------- 19.990(4.44) 19.795(4.49) 19.915(4.46)
25 20.090(4.42) 20.000(4.44) ---------- 20.000(4.44) 20.060(4.43) ---------- ---------- ----------
26 20.540(4.33) 20.410(4.35) ---------- 20.515(4.33) 20.590(4.32) ---------- 20.675(4.30) 20.495(4.33)
27 21.125(4.21) 20.930(4.25) ---------- 21.200(4.18) ---------- ---------- ---------- 21.130(4.21)
28 21.790(4.08) 21.640(4.11) ---------- ---------- ---------- 21.840(4.07) 21.670(4.09) 21.700(4.10)
29 22.365(3.98) 22.380(3.97) ---------- 22.570(3.94) ---------- ---------- 22.245(3.99) 22.415(3.97)
30 23.480(3.78) 23.415(3.80) ---------- 23.585(3.77) ---------- ---------- ---------- 23.595(3.77)
31 24.335(3.66) ---------- ---------- ---------- ---------- 24.180(3.68) 23.950(3.72) ----------
32 24.490(3.56) ---------- ---------- ---------- ---------- 25.030(3.56) 24.810(3.58) ----------
33 ---------- 25.410(3.51) 25.250(3.53) 25.620(3.48) 25.625(3.48) ---------- 25.545(3.48) 25.595(3.48)
34 26.250(3.40) ---------- ---------- ---------- ---------- 26.320(3.39) 26.100(3.42) ----------
35 ---------- ---------- ---------- ---------- ---------- ---------- 26.720(3.33) ----------
36 ---------- ---------- ---------- ---------- ---------- ---------- ---------- 27.565(3.23)
37 28.185(3.17) 28.130(3.17) ---------- ---------- ---------- 28.410(3.14) 28.200(3.17) 28.225(3.15)
38 29.225(3.06) 29.450(3.04) ---------- 29.470(3.03) ---------- ---------- 29.385(3.04) 29.545(3.02)
39 30.140(2.97) ---------- ---------- ---------- ---------- 30.625(2.92) 30.380(2.94) ----------

Chapter 8: Characterization of optimized recrystallized agglomerates of MA
Direct tabletting and BA improvement of MA by spherical crystallization tech. 240
Table:8.5.2θ and d-value of azithromycin and their recrystallized agglomertates.
Sr.
No.
Angle(02θ) [d-value] of ATM and their recrystallized agglomerates from XRD plot
ATM ATM-Agg ATM-EudS ATM-PVP ATM- SSG ATM-
N(PEG)
ATM-F68 ATM-BCD
40 31.445(2.85) 31.575(2.83) ---------- 31.530(2.83) ---------- ---------- ---------- 31.645(2.83)
41 32.650(2.74) ---------- ---------- ---------- ---------- ---------- ---------- ----------
42 33.245(2.70) ---------- ---------- ---------- 33.655(2.66) 34.080(2.63) 33.970(2.64) 35.700(2.52)
43 36.015(2.50) 35.710(2.52) 35.705(2.51) 36.280(2.55) ---------- 36.780(2.45) ---------- ----------
44 ---------- ---------- ---------- ---------- ---------- ---------- ---------- 37.480(2.39)
45 38.565(2.33) 38.560(2.33) ---------- ---------- ---------- ---------- ---------- ----------
46 39.955(2.25) 39.655(2.28) ---------- ---------- ---------- 39.210(2.29) ---------- 40.120(2.25)
47 ---------- ---------- ---------- ---------- 41.075(2.19) 41.395(2.18) ----------
48 42.200(2.14) ---------- ---------- 42.925(2.11) ---------- 42.465(2.12) 42.985(2.10) 42.170(2.14)
49 ---------- ---------- ---------- ---------- ---------- 43.000(2.10) ---------- ----------
50 44.575(2.04) ---------- ---------- 44.480(1.99) ---------- 44.795(2.02) 44.525(2.03) ----------
51 ---------- 46.640(1.95) ---------- ---------- ---------- ---------- ---------- ----------
52 ---------- ---------- ---------- ---------- 47.050(1.93) ---------- ---------- ----------
53 ---------- ---------- ---------- ---------- ---------- ---------- 58.700(1.58) ----------
Table:8.6.Number of peaks, 2θ at highest peak and their peak count of azithromycin
and their recrystallized agglomerates
Sr.No Product Code No of
peaks
2θ at height
Peak
Peak count at
height Peak
%RDC
1 ATM 42 9.840 1076 100
2 ATM-Agg 24 9.725 380 35.32 2 ATM-EudS 11 9.795 228 21.19 3 ATM-PVP 26 9.755 433 40.24 4 ATM-SSG 13 10.030 292 27.14 5 ATM- N(PEG) 25 10.140 342 31.78 6 ATM-F68 28 9.830 538 50.00 7 ATM-BCD 30 9.715 467 43.40

Chapter 8: Characterization of optimized recrystallized agglomerates of MA
Direct tabletting and BA improvement of MA by spherical crystallization tech. 241
8.3.2 Powder X-ray diffraction studies of CTM and recrystallized agglomerates:
Figure:8.21. Powder X-ray diffraction studies of CTM, CTM-EudS and CTM-PVP.

Chapter 8: Characterization of optimized recrystallized agglomerates of MA
Direct tabletting and BA improvement of MA by spherical crystallization tech. 242
Figure:8.22. Powder X-ray diffraction studies of CTM-SSG and CTM-N (HPMC).

Chapter 8: Characterization of optimized recrystallized agglomerates of MA
Direct tabletting and BA improvement of MA by spherical crystallization tech. 243
Table:8.7.2θ and d-value of Clarithromycin and their recrystallized agglomerates.
Sr.
No.
Angle(02θ) [d-value] of CTM and their recrystallized agglomerates from XRD
plot
CTM CTM-EudS CTM-PVP CTM-SSG CTM- N(HPMC)
1 8.770(10.07) 8.590(10.28) 8.610(10.27) 8.465 8.665(10.20)
2 9.180(9.63) ---------- 9.155(9.66) 8.930 ----------
3 9.695(9.12) 9.465(9.34) 9.660(9.15) 9.415 9.615(9.20)
4 10.725(8.25) ---------- ---------- 10.785 10.440(8.09)
5 10.895(8.12) 10.895(8.12) 11.050(8.01) ---------- ----------
6 11.590(7.63) ---------- 11.590(7.63) 11.350 ----------
7 11.700(7.56) ---------- ---------- ---------- 11.690(7.57)
8 12.005(7.37) ---------- 12.035(7.35) 12.235 12.275(7.15)
9 12.610(7.02) 12.325(7.18) 12.475(7.09) ---------- ----------
10 ---------- ---------- ---------- 13.635 ----------
11 13.900(6.37) 13.895(6.37) 13.890(6.38) 13.980 13.920(6.36)
12 14.300(6.19) ---------- 14.190(6.24) ---------- ----------
13 15.410(5.75) 15.140(5.85) 15.255(5.81) 15.085 15.385(5.76)
14 15.640(5.66) ---------- ---------- ---------- ----------
15 16.435(5.39) 16.330(5.43) 16.610(5.34) 16.405 ----------
16 ---------- ---------- ---------- 16.805 ----------
17 17.115(5.18) 16.910(5.24) 17.015(5.21) 17.195 17.410(5.09)
18 17.495(5.07) ---------- 17.425(5.09) 17.995 ----------
19 18.335(4.84) 18.375(4.83) 18.210(4.87) ---------- ----------
20 19.145(4.63) 19.230(4.62) 19.195(4.63) 18.930 19.220(4.62
21 20.060(4.43) ---------- 19.920(4.46) 19.765 ----------
22 20.690(4.29) 20.475(4.34) 20.605(4.31) 20.340 20.620(4.31)
23 21.475(4.14) ---------- 21.495(4.14) 21.265 ----------
24 21.715(4.09) ---------- ---------- ---------- ----------
25 22.345(3.98) 22.145(4.02) 22.335(3.98) 22.085 22.315(3.99)
26 23.285(3.82) 23.025(3.86) 23.405(3.78) 23.140 23.400(3.80)
27 24.080(3.69) ---------- 24.010(3.71) 23.945 ----------
28 25.115(3.55) 25.105(3.55) 24.945(3.57) 24.835 25.135(3.54
29 26.085(3.42) ---------- 26.025(3.43) ---------- ----------
30 26.580(3.36) 26.540(3.36) 26.630(3.35) 26.375 ----------
31 27.885(3.20) ---------- 27.865(3.20) ---------- ----------
32 28.565(3.12) ---------- 28.525(3.13) 28.370 28.370(3.15)
33 29.485(3.03) 29.950(2.98) 29.425(3.04) 29.285 ----------
34 30.350(2.95) ---------- 30.195(2.96) 30.035 ----------
35 31.530(2.84) 31.215(2.87) ---------- ---------- ----------
36 32.815(2.73) ---------- 32.790(2.73) 32.600
37 ---------- ---------- ---------- ---------- 33.190(2.70)
38 34.405(2.61) ---------- ---------- 34.945 ----------
39 35.140(2.55) ---------- 35.145(2.56) ---------- ----------
40 36.410(2.47) ---------- 36.415(2.47) 36.030 ----------

Chapter 8: Characterization of optimized recrystallized agglomerates of MA
Direct tabletting and BA improvement of MA by spherical crystallization tech. 244
Table:8.7.2θ and d-value of Clarithromycin and their recrystallized agglomertates.
Sr.
No.
Angle(02θ) [d-value] of RTM and their recrystallized agglomerates from XRD
plot
CTM CTM-EudS CTM-PVP CTM-SSG CTM- N(HPMC)
41 37.530(2.40) 37.720(2.39) ---------- ---------- ----------
42 38.915(2.32) 38.720(2.33) 38.945(2.32) 38.745 38.865(2.32)
43 40.140(2.25) 40.035(2.26) 40.180(2.25) 40.080 40.220(2.25)
44 41.255(2.19) ---------- 41.245(2.19) ---------- ----------
45 41.825(2.16) 41.890(2.15) 41.785(2.16) 41.460 ----------
46 43.110(2.10) ---------- 42.985(2.11) 42.840 ----------
47 ---------- ---------- ---------- 44.875 ----------
48 45.590(1.99) ---------- 45.430(1.99) ---------- 45.080(2.01)
49 46.430(1.96) 46.380(1.98) ---------- 46.480 ----------
50 ---------- ---------- 54.830(1.67) ----------
Table:8.8.Number of peaks, 2θ at highest peak and their peak count and %RDC of
Clarithromycin and their recrystallized agglomerates.
Sr.No Product Code No of peaks 2θ at height
Peak
Peak count at
height Peak
%RDC
1 CTM 45 9.695 412 100
2 CTM-EudS 22 9.465 202 49.03
3 CTM-PVP 38 11.900 369 89.56
4 CTM-SSG 34 11.350 346 83.98
5 CTM- N(HPMC) 18 10.940 219 53.16
Chapter 8: Characterization of optimized recrystallized agglomerates of MA
Direct tabletting and BA improvement of MA by spherical crystallization tech. 245
8.3.3 Powder X-ray diffraction studies of RTM and recrystallized agglomerates.
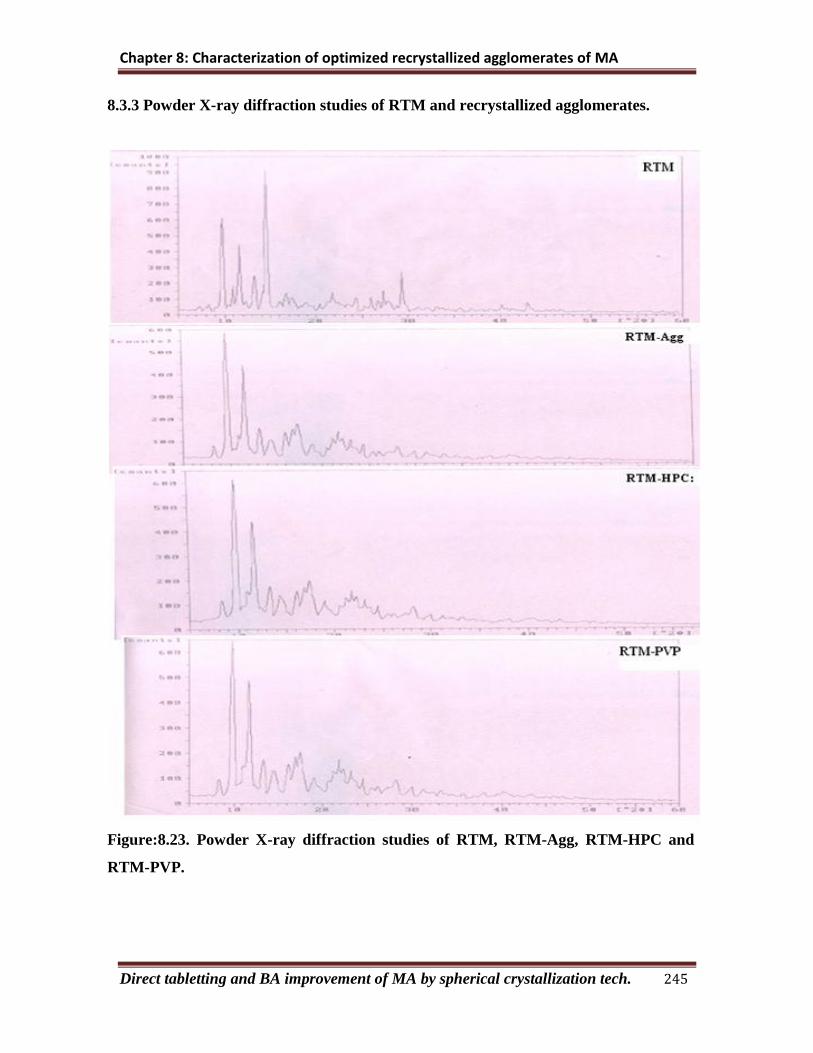
Figure:8.23. Powder X-ray diffraction studies of RTM, RTM-Agg, RTM-HPC and
RTM-PVP.

Chapter 8: Characterization of optimized recrystallized agglomerates of MA
Direct tabletting and BA improvement of MA by spherical crystallization tech. 246
Figure:8.24. Powder X-ray diffraction studies of RTM-SSG, RTM-BCD and RTM-N
(PEG).

Chapter 8: Characterization of optimized recrystallized agglomerates of MA
Direct tabletting and BA improvement of MA by spherical crystallization tech. 247
Table:8.9.2θ and d-value of Roxithromycin and their recrystallized agglomerates.
Sr.
No.
Angle(02θ) [d-value] of RTM and their recrystallized agglomerates from XRD plot
RTM RTM
-Agg
RTM-
PVP
RTM-
N(PEG)
RTM-
HPC
RTM-
EudS
RTM-
BCD
1 5.530(15.97) ---------- ---------- ----------
2 7.290(12.11) ---------- ---------- ---------- ---------- ---------- ----------
3 7.925(11.14) ---------- ---------- ---------- ---------- ---------- ----------
4 8.320(10.62) 8.260(10.69) 8.575(10.30) 8.430(8.430) 8.515(10.37) 8.290(10.66) 8.250(10.71)
5 9.020(9.80) 9.825(8.99) ---------- ---------- ---------- 9.785(9.03) 9.705(9.11)
6 9.820(8.99) 9.980(8.85) ---------- ---------- 9.995(8.85) 9.920(8.91) ----------
7 10.895(8.11) 10.875(8.13) 10.010(8.83) 10.010(8.83) ---------- ---------- ----------
8 11.450(7.72) 11.635(7.59) 11.125(7.95) ---------- 11.150(7.93) 10.955(8.07) 10.955(8.07)
9 11.675(7.57) 11.855(7.46) 11.860(7.46) 11.850(7.47) 11.870(7.45) 11.750(7.54) 11.560(7.65)
10 12.105(7.31) ---------- ---------- ---------- ---------- ---------- ----------
11 12.365(7.15) ---------- ---------- ---------- ---------- ---------- ----------
12 13.025(6.79) 13.180(6.71) 13.245(6.67) ---------- ---------- 13.165(6.72) ----------
13 13.270(6.66) ---------- 13.455(6.57) 13.430(6.59) 13.450(6.58) 13.335(6.66) 13.215(6.70)
14 14.035(6.30) ---------- ---------- ---------- ---------- 14.195(6.23) 14.170(6.25)
15 14.475(6.11) 14.225(6.22) 14.450(6.13) ---------- 14.365(6.17) ---------- ----------
16 14.670(6.03) 14.685(6.03) ---------- 14.510(6.10) ---------- 14.585(6.07) 14.610(6.06)
17 16.045(5.52) 16.025(5.53) 16.030(5.53) 16.185(5.48) 16.195(5.47) 16.005(5.54) 15.875(5.58)
18 16.680(5.31) 16.845(5.26) 16.970(5.23) 16.950(5.23) 16.935(5.23) 16.790(5.28) 16.700(5.31)
19 17.320(5.12) 17.375(5.09) 17.495(5.07) ---------- 17.490(5.07) 17.255(5.14) 17.155(5.17)
20 17.770(4.99) 17.725(4.99) 17.900(4.95) 17.580(5.04) 17.905(4.95) 17.725(4.99) 17.725(4.99)
21 18.280(4.85) ---------- ---------- 18.010(4.92) ---------- ---------- ----------
22 18.825(4.71) 18.815(4.71) 18.905(4.69) ---------- 18.995(4.67) 18.775(4.72) 18.705(4.75)
23 19.335(4.58) ---------- ---------- 19.425(4.57) ---------- ---------- ----------
24 19.715(4.49) ---------- ---------- ---------- ---------- ---------- ----------
25 20.465(4.34) ---------- 20.685(4.29) ---------- 20.585(4.31) 20.445(4.34) 20.395(4.35)
26 21.245(4.18) ---------- 21.205(4.19) ---------- 21.175(4.20) 21.095(4.21) 20.905(4.25)
27 21.645(4.10) ---------- 21.880(4.06) 21.920(4.05) 21.865(4.07) 21.760(4.08) 21.605(4.11)
28 22.035(4.03) 22.090(4.02) ---------- ---------- ---------- 22.125(4.01) 22.050(4.03)
29 22.395(3.97) ---------- 22.320(3.98) 22.435(3.96) 22.345(3.98) ---------- ----------
30 23.445(3.80) 23.035(3.85) 23.110(3.85) 23.155(3.84) 23.145(3.84) 22.950(3.88) 22.865(3.89)
31 24.225(3.67) 24.445(3.64) 24.405(3.65) ---------- 24.495(3.64) 24.300(3.66) 24.340(3.66)
32 25.220(3.53) 25.455(3.50) 25.505(3.49) ---------- 25.505(3.49) 25.380(3.51) 25.370(3.51)
33 25.995(3.43) ---------- ---------- ---------- ---------- ---------- ----------
34 26.705(3.34) 26.080(3.41) 26.205(3.40) ---------- 26.055(3.42) 26.010(3.43) 26.000(3.43)
35 27.285(3.27) 27.095(3.28) 27.100(3.29) ---------- ---------- ---------- ----------
36 27.765(3.21) ---------- ---------- ---------- ---------- ---------- ----------
37 28.085(3.17) 28.130(3.17) 28.305(3.16) 28.290(3.15) 28.220(3.16) 28.060(3.18) 28.100(3.18)

Chapter 8: Characterization of optimized recrystallized agglomerates of MA
Direct tabletting and BA improvement of MA by spherical crystallization tech. 248
Table:8.9.2θ and d-value of Roxithromycin and their recrystallized agglomerates.
Sr.N
o.
Angle(02θ) [d-value] of RTM and their recrystallized agglomerates from XRD plot
RTM RTM
-Agg
RTM-PVP RTM-N(PEG) RTM-HPC RTM-EudS RTM-BCD
38 28.735(3.10) ---------- ---------- ---------- ---------- ----------
39 29.275(3.05) 29.860(2.98) 29.950(2.98) ---------- 30.015(2.98) 29.785(2.99) 29.855(2.99)
40 31.080(2.87) 31.085(2.87) 31.185(2.87) 31.250(2.86) 31.215(2.87) 31.090(2.88) 31.015(2.88)
41 32.075(2.78) ---------- ---------- ---------- ---------- ---------- ----------
42 33.145(2.70) 33.095(2.70) 33.205(2.70) ---------- 33.225(2.70) 33.145(2.70) 33.010(2.72)
43 33.655(2.66) ---------- ---------- ---------- ---------- 33.770(2.66) ----------
44 34.945(2.57) 34.360(2.61) 34.665(2.59) ---------- ---------- ---------- ----------
45 35.835(2.50) 35.590(2.52) 35.760(2.51) ---------- ---------- 35.700(2.52) ----------
46 36.830(2.43) ---------- ---------- ---------- ---------- ---------- ----------
47 38.085(2.36) 38.105(2.36) 38.100(2.37) ---------- 38.080(2.36) 37.960(2.37) 37.850(2.38)
48 39.020(2.30) ---------- ---------- ---------- ---------- ---------- ----------
49 40.230(2.24) 40.215(2.24) 40.315(2.24) 40.400(2.24) 40.210(2.24) 40.420(2.23) 40.175(2.24)
50 40.720(2.21) ---------- ---------- ---------- ---------- ---------- ----------
51 41.285(2.19) ---------- ---------- ---------- ---------- ---------- ----------
52 42.015(2.14) ---------- ---------- ---------- ---------- ---------- ----------
53 43.005(2.10) 43.205(2.09) 43.380(2.09) ---------- 43.285(2.09) 43.395(2.09) 43.175(2.09)
54 45.805(1.97) ---------- ---------- ---------- ---------- ---------- 45.620(1.99)
55 46.710(1.94) 46.770(1.94) 46.890(1.94) ---------- ---------- ---------- ----------
56 49.820(1.82) 50.855(1.79) 48.430(1.88) ---------- ---------- ---------- ----------
57 53.065(1.72) ---------- 54.820(1.68) ---------- ---------- 53.405(1.72) ----------
58 56.325(1.63) ---------- ---------- ---------- ---------- ---------- ----------
59 57.745(1.59) ---------- 57.820(1.60) 57.825(1.60) ---------- ---------- ----------
60 59.180(1.55) ---------- ---------- ---------- ---------- ---------- ----------
Table:8.10.No of peaks, 2θ at highest peak and their peak count and %RDC of
Roxithromycin and their recrystallized agglomerates.
Sr.No Product Code No of peaks 2θ at height
Peak
Peak count at
height Peak
%RDC
1 RTM 59 14.475 1399 100
2 RTM-Agg 32 9.825 562 40.17
3 RTM-PVP 35 10.010 581 41.53
4 RTM-N(PEG) 18 10.010 259 18.51
5 RTM-HPC 26 9.995 595 42.53
6 RTM-EudS 32 9.785 433 30.95
7 RTM-BCD 28 9.705 502 35.88

Chapter 8: Characterization of optimized recrystallized agglomerates of MA
Direct tabletting and BA improvement of MA by spherical crystallization tech. 249
8.3.4 Powder X-ray diffraction studies of ETM and recrystallized agglomerates.
Figure:8.25. Powder X-ray diffraction studies of ETM, ETM-EudS and ETM-BCD.

Chapter 8: Characterization of optimized recrystallized agglomerates of MA
Direct tabletting and BA improvement of MA by spherical crystallization tech. 250
Figure:8.26. Powder X-ray diffraction studies of ETM-HPMC and ETM-SSG.

Chapter 8: Characterization of optimized recrystallized agglomerates of MA
Direct tabletting and BA improvement of MA by spherical crystallization tech. 251
Table:8.11.2θ and d-value of Erythromycin and their recrystallized agglomerates.
Sr.
No.
Angle(02θ) [d-value] of ETM and their recrystallized agglomerates from XRD plot
ETM ETM
-Agg
ETM-
HPC
ETM-
EudS
ETM-
N(HPMC)
ETM-
BCD
ETM-
SSG
1 7.400(11.94) 7.175(12.31) ---------- ---------- ---------- 7.490(11.80) ----------
2 9.245(9.56) 9.175(9.63) 9.120(9.69) 9.250(9.55) 9.210(9.59) ---------- ----------
3 9.685(9.13) ---------- ---------- ---------- ---------- 9.730(9.08) 9.705(9.11)
4 10.175(8.69) 10.100(8.75) ---------- ---------- ---------- ---------- 10.150(8.71)
5 10.330(8.55) ---------- ---------- ---------- 10.340(8.55) 10.360(8.53) ----------
6 12.025(7.36) ---------- ---------- ---------- ---------- 12.140(7.28) 11.955(7.44)
7 12.980(6.81) 12.900(6.86) 12.535(7.06) 12.790(6.92) ---------- ---------- 12.955(6.83)
8 13.710(6.45) ---------- ---------- ---------- 13.005(6.81) 13.125(6.74) ----------
9 14.365(6.16) 14.205(6.23) ---------- ---------- 14.450(6.13) 14.485(6.11) 14.270(6.20)
10 ---------- ---------- 15.215(5.82) ---------- 15.330(5.77) 15.440(5.74) ----------
11 16.190(5.47) ---------- ---------- ---------- 16.150(5.48) 16.630(5.42) 16.180(5.47)
12 17.300(5.12) 17.265(5.14) ---------- ---------- ---------- 17.410(5.09) 17.305(5.12)
13 17.795(4.98) ---------- ---------- ---------- 17.555(5.05) ---------- ----------
14 19.195(4.62) 19.145(4.64) 19.065(4.65) 19.125(4.64) 19.180(4.62) 19.270(4.61) 19.125(4.64)
15 20.085(4.41) 19.855(4.46) ---------- ---------- ---------- 20.020(4.43) 19.925(4.45)
16 20.790(4.26) ---------- ---------- ---------- 20.980(4.24) 20.805(4.27) 20.765(4.27)
17 21.410(4.15) ---------- ---------- ---------- ---------- 21.495(4.13) 21.370(4.15)
18 22.070(4.03) ---------- ---------- ---------- ---------- 22.120(4.02) ----------
19 22.795(3.89) ---------- ---------- ---------- ---------- 22.685(3.92) 22.510(3.95)
20 23.350(3.81) ---------- ---------- ---------- ---------- 23.370(3.81) 23.210(3.83)
21 23.635(3.76) ---------- ---------- ---------- ---------- ---------- ----------
22 26.185(3.40) ---------- ---------- ---------- ---------- 26.220(3.40) ----------
23 26.995(3.30) ---------- ---------- ---------- ---------- 26.965(3.31) 26.830(3.32)
24 27.820(3.20) ---------- ---------- ---------- ---------- 28.020(3.18) 27.850(3.20)
25 29.590(3.02) 29.610(3.02) ---------- ---------- 29.815(2.99) 29.650(3.01) 29.600(3.02)
26 30.805(2.91) ---------- ---------- ---------- ---------- 30.785(2.90) 30.620(2.92)
27 34.095(2.63) ---------- ---------- ---------- ---------- 34.065(2.62) ----------
28 ---------- ---------- ---------- ---------- ---------- 34.955(2.57) ----------
29 ---------- ---------- ---------- ---------- ---------- 37.200(2.42) 37.005(2.43)
30 ---------- ---------- ---------- ---------- ---------- 41.040(2.20) ----------
31 44.650(2.59) ---------- ---------- ---------- ---------- ---------- ----------
32 45.870(2.51) ---------- ---------- ---------- ---------- ---------- ----------
33 47.230(2.41) ---------- ---------- ---------- ---------- ---------- ----------
34 49.470(2.28) ---------- ---------- ---------- ---------- 50.565(1.80) 50.210(1.82)
35 54.105(2.06) ---------- ---------- ---------- ---------- ---------- ----------
36 55.650(1.65) ---------- ---------- ---------- ---------- ---------- ----------

Chapter 8: Characterization of optimized recrystallized agglomerates of MA
Direct tabletting and BA improvement of MA by spherical crystallization tech. 252
Table:8.12.No of peaks, 2θ at highest peak and their peak count and %RDC of
Erythromycin and their recrystallized agglomerates. Sr.No Product Code No of peaks 2θ at height
Peak
Peak count at
height Peak
%RDC
1 ETM 32 12.980 467 100
2 ETM-Agg 9 10.100 79 16.92
3 ETM-HPC 4 9.120 50 10.71
4 ETM-EudS 3 9.250 49 10.49
5 ETM- N(HPMC) 10 9.210 106 22.70
6 ETM-BCD 26 13.125 331 70.88
7 ETM-SSG 19 10.150 188 40.26
Figures 8.19, 8.20 and tables 8.5 and 8.6 represent the XRPD spectra and data of ATM and
recrystallized agglomerates. Figure: 8.21, 8.22 and table: 8.7 and 8.8 represent the XRPD
spectra and data of CTM and recrystallized agglomerates. Figure: 8.23, 8.24 and table:
8.9and 8.10 represent the XRPD spectra and data of RTM and recrystallized agglomerates.
Figure: 8.25, 8.26 and table: 8.11and 8.12 represent the XRPD spectra and data of ETM
and recrystallized agglomerates.
X-ray diffraction pattern for macrolide antibiotics indicated a crystalline form. A sharp
peak between 9–150 2θ was characteristic of the raw crystals of the macrolide antibiotics.
The lack of sharp peaks for macrolide antibiotics was observed in recrystallized
agglomerates indicating transition of crystalline to an amorphous state. Recrystallized
agglomerates had shown peak with reduced intensities indicating decrease in the drug
crystallinity.
The maximum disappearances of peaks were observed in the recrystallized agglomerated
crystals of macrolide antibiotics. There is difference in d-spacing between the XRD spectra
of macrolide antibiotics and the agglomerated crystals at respective 2θ angle referring the
habit modification and change in the intensity of peaks, which indicate different
arrangement of the molecules hence confirming the development of different polymorphic
form.
According to the obtained X-ray diffraction pattern macrolide antibiotics show large
number of peaks and having larger peak counts at highest intense peak comparative to
recrystallized agglomerates. A few diffuse peaks or decrease in crystallinity were observed
in the some agglomerated crystals with different polymers used which may indicate slight
physical interaction of drug with polymers. The decreased drug crystallite size can explain
the faster dissolution rate of the recrystallized agglomerated samples.
The relative degree of crystallinity (RDC) was calculated by ratio of peak intensity of pure
macrolide antibiotic and recrystallized agglomerates. The % relative degree of crystallinity
(% RDC) is reported in tables 8.6, 8.8, 8.10, and 8.12 for ATM, CTM, RTM, ETM and
their respective recrystallized agglomerated crystals. There is significance reduction in
number of peaks, peak intensity and %RDC in prepared recrystallized agglomerates
compared to raw crystals of macrolide antibiotics. The PXRD studies revealed the
substantial loss of crystallinity in recrystallized agglomerates than that of pure macrolide
antibiotics.

Chapter 8: Characterization of optimized recrystallized agglomerates of MA
Direct tabletting and BA improvement of MA by spherical crystallization tech. 253
8.4 Differential scanning calorimetric (DSC) studies of macrolide antibiotics and
recrystallized agglomerates:
Differential scanning calorimetric (DSC) analyses of the samples were carried out by using
differential scanning calorimeter equipped with computer analyzer (Shimadzu TA –60
differential scanning calorimeter, Shimadzu Corporation, Kyoto, Japan). Samples (of 3-7
mg) were heated under nitrogen atmosphere on an aluminum pan at a heating rate of 10
°C/min over the temperature range of 20-3500C.
8.4.1 DSC studies of ATM and their recrystallized agglomerates:
Azithromycin (ATM):
Figure:8.27. DSC spectra of Azithromycin (ATM).
Chapter 8: Characterization of optimized recrystallized agglomerates of MA
Direct tabletting and BA improvement of MA by spherical crystallization tech. 254
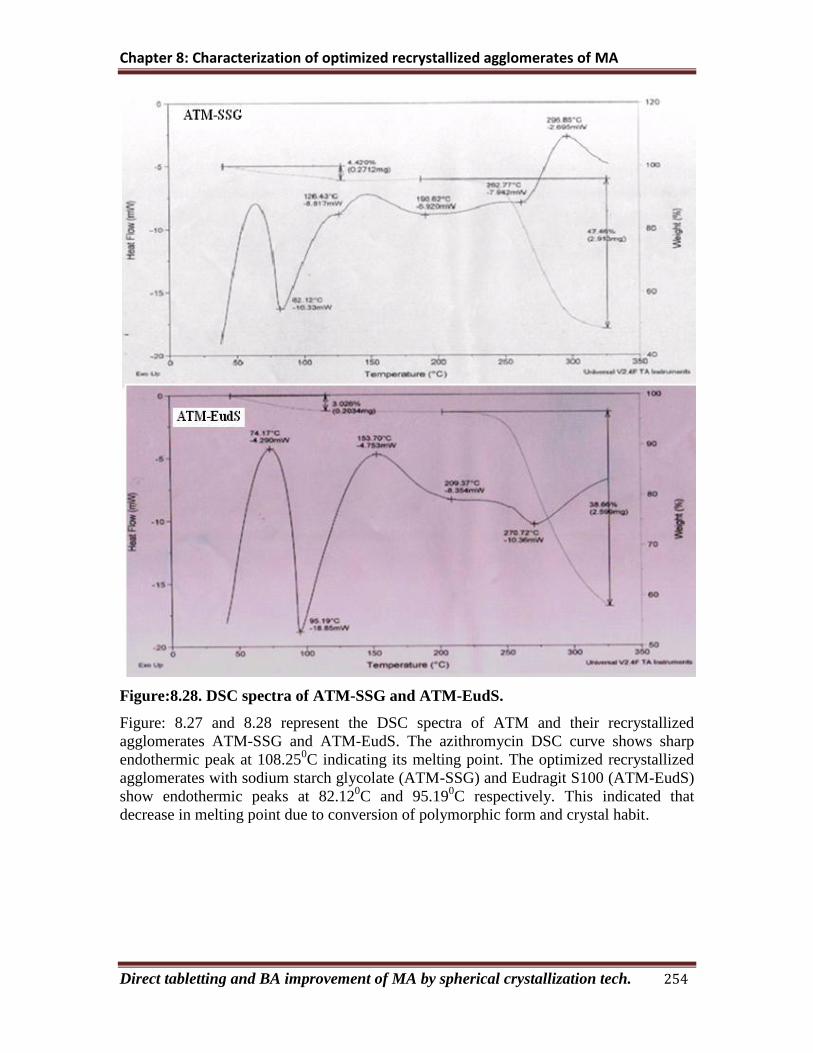
Figure:8.28. DSC spectra of ATM-SSG and ATM-EudS.
Figure: 8.27 and 8.28 represent the DSC spectra of ATM and their recrystallized
agglomerates ATM-SSG and ATM-EudS. The azithromycin DSC curve shows sharp
endothermic peak at 108.250C indicating its melting point. The optimized recrystallized
agglomerates with sodium starch glycolate (ATM-SSG) and Eudragit S100 (ATM-EudS)
show endothermic peaks at 82.120C and 95.19
0C respectively. This indicated that
decrease in melting point due to conversion of polymorphic form and crystal habit.

Chapter 8: Characterization of optimized recrystallized agglomerates of MA
Direct tabletting and BA improvement of MA by spherical crystallization tech. 255
8.4.2 DSC studies of CTM and their recrystallized agglomerates:
Figure:8.29. DSC spectra of CTM, CTM-PVP and CTM-SSG.
Chapter 8: Characterization of optimized recrystallized agglomerates of MA
Direct tabletting and BA improvement of MA by spherical crystallization tech. 256
Figure: 8.29 represent the DSC spectra of CTM and their recrystallized agglomerates
CTM-PVP and CTM-SSG.The DSC study revealed endothermic peak at 220o – 230
oC for
clarithromycin (CTM) at 0oC to 400
oC. The sharp endothermic peak for CTM was
observed as 228.110C indicating its melting point. The observed endothermic peak for
CTM-PVP and CTM-SSG are 228.68 and 228.65 respectively. Which indicate there is
insignificant difference in endothermic peak of CTM and their recrystallized
agglomerates with PVP and SSG.
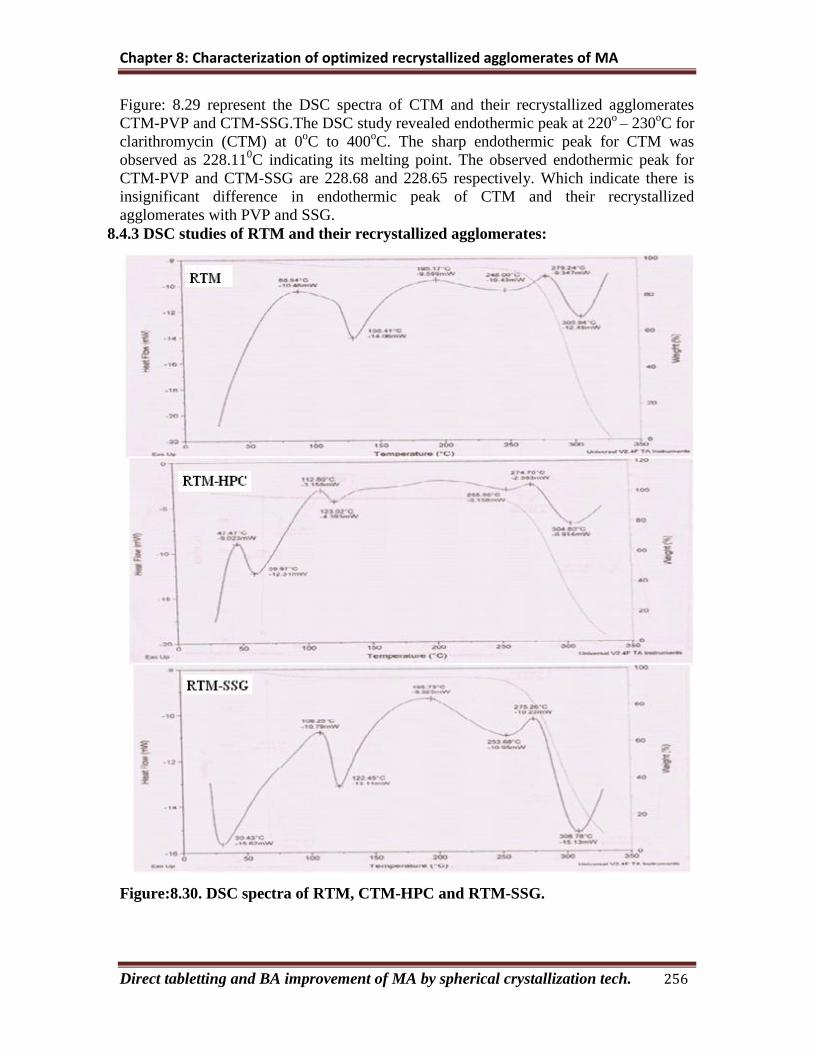
8.4.3 DSC studies of RTM and their recrystallized agglomerates:
Figure:8.30. DSC spectra of RTM, CTM-HPC and RTM-SSG.

Chapter 8: Characterization of optimized recrystallized agglomerates of MA
Direct tabletting and BA improvement of MA by spherical crystallization tech. 257
Figure: 8.30 show an endothermic peak at 130.41 °C for RTM, which can be attributed to
the melting of Roxithromycin. The optimized recrystallized agglomerates show decrease
in melting point 123.020C (RTM-HPC) and 122.45
0C (RTM-SSG) which indicate slight
transformation of roxithromycin to amorphous form and decrease in melting point. The
decrease in melting point may be also due to incorporation of the drug in softened
polymer during the DSC run. The conversion of crystalline solid into partially amorphous
solid surfaces leads to a “dynamic nature “of the recrystallized agglomerates. The
presence of a broad peak may be due to partial conversion to amorphous form and also
lowering of melting point is observed due to melting point depression with shift of the
peak.
Drastic reduction in the energy may be attributed to the conversion to the amorphous
form and its interaction with the polymers. Thus, it can be concluded that complete loss
of crystallinity was observed in case of recrystallized agglomerates. These results proved
the applicability of spherical crystallization to synergistically enhance the efficacy of
processing technology with the aqueous system.
Chapter 8: Characterization of optimized recrystallized agglomerates of MA
Direct tabletting and BA improvement of MA by spherical crystallization tech. 258
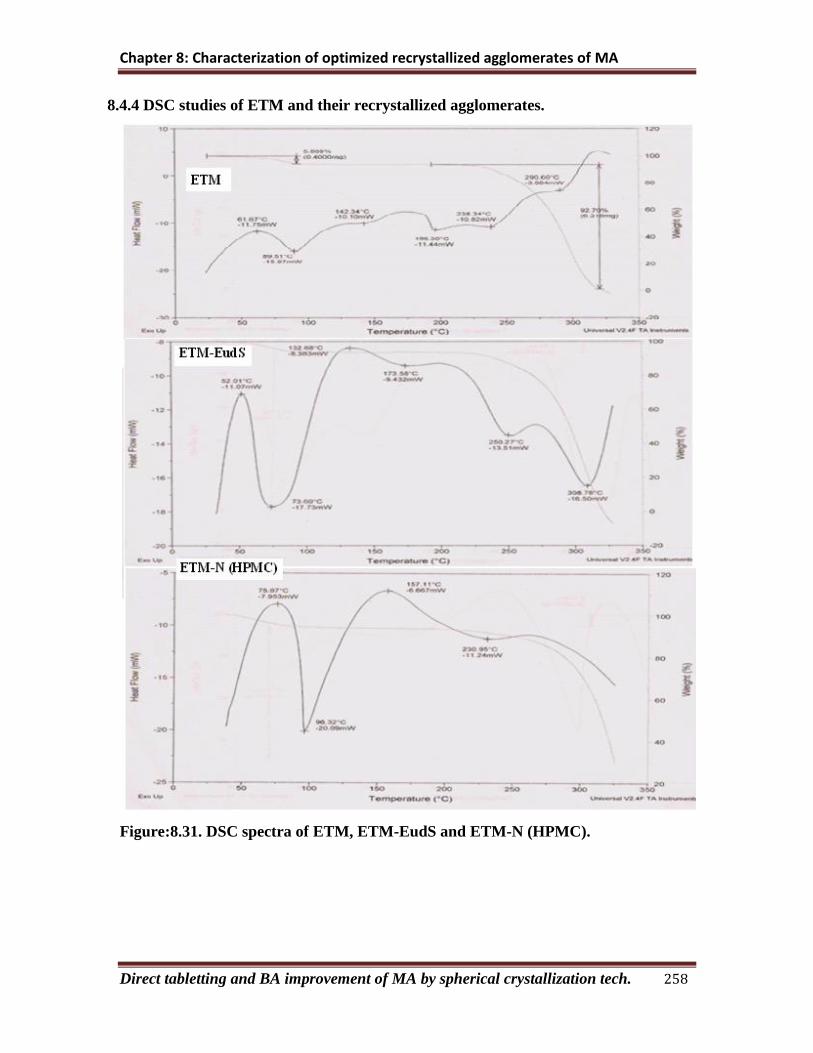
8.4.4 DSC studies of ETM and their recrystallized agglomerates.
Figure:8.31. DSC spectra of ETM, ETM-EudS and ETM-N (HPMC).

Chapter 8: Characterization of optimized recrystallized agglomerates of MA
Direct tabletting and BA improvement of MA by spherical crystallization tech. 259
The Erythromycin base used was dehydrating showed dehydration peak in DSC curves
(figure: 8.31) at 89.510C. Liquefaction peak appeared at 142.34°C. After melting,
erythromycin dehydrated dihydrate transformed into erythromycin anhydrate which is
another erythromycin crystal form. Its melting point peak appears at approximately
196.30°C.The prepared recrystallized agglomerates ETM-EudS and ETM-N (HPMC)
show change in dehydration peak at 73.600C and 96.32
0C respectively. There is also
change in liquefaction peak for ETM-EudS and ETM-N (HPMC) at 132.680C and
157.110C and finally also reduces the melting endothermic peak for ETM-EudS at
173.580C and disappeared for ETM-N (HPMC).These changes in the endothermic peaks
might be due to changes in the internal structure or crystal form of the erythromycin base
[4] .
8.5. References:
1. Gandhi R, Pillai O, Thilagavathi R, Gopalakrishnan B, Lal Kaula C,
Panchagnulaa R (2002) Characterization of Azithromycin hydrates. Eur. J.
Pharm. Sci. 16; 175–184.
2. Inoue Y, Yoshimura S, Tozuka Y, Moribe K, Kumamoto T, Ishikawa T,
Yamamoto K (2007) Application of ascorbic acid 2-glucoside as a solubilizing
agent for clarithromycin: Solubilization and nanoparticle formation. Int. J. Pharm.
331 38–45.
3. Biradar SV, Patil AR, Sudarsan GV, Pokharkar VB (2006) A comparative study
of approaches used to improve solubility of roxithromycin. Powder Technology.
169; 22–32.
4. Wang Z, Wang J, and Dang L (2006) Thermal, phase transition and spectral
studies in erythromycin pseudo polymorphs: dihydrate and acetone solvate. Cryst.
Res. Technol. 41(12); 1219–1225.
