preparation, optimization and in vitro characterization of ... · and burman design and further...
TRANSCRIPT

3rd International Conference on Multidisciplinary Research & Practice P a g e | 431
Volume IV Issue I IJRSI ISSN 2321-2705
Preparation, Optimization and in Vitro
Characterization of Cisplatin Loaded Novel
Polymeric Micelles for Treatment of Lung Cancer Rana H.B.
1, Raj A., Patel A., Gohel M.
Department of Pharmaceutics, Anand Pharmacy College, Anand-388001
Abstract - The purpose of present work was to prepare optimized
novel Cisplatin loaded polymeric micelles administered via
inhalational route through Dry Powder Inhaler for the
treatment of Non-Small Cell of Lung Cancer. Cisplatin loaded
micelles were prepared incorporating Pluronic F-127 using
rotary vacuum evaporation, spray drying and ultrasonic
homogenization technique. The critical process as well as
product related parameters identified and screened by Plackett
and Burman Design and further optimized by 32 factorial
design. Prepared batches were evaluated for morphology,
particle size, entrapment efficiency, drug loading, in-vitro
diffusion study and aerodynamic behavior. Aspiration rate and
Polymer concentration were identified as critical variables using
Plackett and Burman design. Then, 32 full factorial design was
selected for optimization of Polymeric micelles using Aspiration
rate and Polymer concentration as independent variable and %
Encapsulation efficiency and micelle size as dependent
variable.32 factorial design suggested optimized parameters as
Aspirator capacity-42.51 and Polymer concentration- 103.98 mg.
The average micelle size of the optimized batch was found to be
264 nm with an entrapment efficiency of 89%. Micelles were
found to be uniform spherical shape and size was less than 5μm
on the basis of Zeta sizer and Transmission Electron Microscopy
study.
Key Words - Cisplatin, Pluronic F-127, Polymeric micelles, Spray
Drying, Plackett and Burman Design, 32 Full Factorial Design.
I. INTRODUCTION
urrently, Cancers remains the leading cause of death
worldwide. One million of the current 5 million deaths
occur because of lung cancer in world. Smoking is responsible
for upwards of 80% of all lung cancers worldwide. In India,
smoking is prevalent: 29% of adult males, 2.5% of adult
females, 11.7% of male collegians, 8.1% among school
children and adolescents. A quarter of the cigarette or beedi
smokers in India would be killed by tobacco at the ages of 25-
69 years, losing 20 years of life expectancy. Non-smokers
account for 15% of lung cancer cases and these cases are
often attributed to a combination of genetic factors, radon gas,
asbestos, pesticides and air pollution including passive and
static smoking.[1]
There are two major types of lung cancer, non-small
cell lung cancer (NSCLC) and small cell lung cancer (SCLC).
Non-small cell lung cancer accounts for about 85 percent of
lung cancers and includes: Adenocarcinoma, the most
common form of lung cancer in the United States among both
men and women; Squamous cell carcinoma, which accounts
for 25 percent of all lung cancers; Large cell carcinoma,
which accounts for about 10 percent of NSCLC tumors. [2]
At present, many clinical therapeutics options
available for the treatment of lung cancer includes
radiotherapy, chemotherapy, and surgery. The
chemotherapeutic agents like Cisplatin, Carboplatin,
Paclitaxel(Taxol®), Gemcitabine (Gemzar®), Albumin
bounded Paclitaxel(Nab-Paclitaxel, Abraxane®), Vinorelbine
(Navelbine®)most widely used for NSCLC. [3]
Cisplatin (Cis-diamino-di-chloroplatinum, CDDP) is
first line treatment for NSCLC because of its very strong anti-
cancer effects and no cross- resistance. Most of commercial
dosage forms available for cisplatin are inform of injection.
Major drawbacks with these formulations are life threatening
toxicities and allergic skin reactions. Mainly life threatening
toxicities includes renal toxicity, Cytotoxicity; in which
nephrotoxicity depend on dose and concentration of cisplatin
and Non-reversible tissue damage caused by drug’s
cytotoxicity. [4]
Traditional routes of administration for cytotoxic
agents were incompliance to the patients because of invasive
chemotherapy, skilled personnel required every time for the
administration. For this many inconvenience, novel route for
administrating the cytotoxic agents is inhalation route. The
advantages of the lungs as a site of drug application is their
large surface area, thin alveolar epithelium, easily permeable
membrane and extensive vasculature, which allow substantial
and rapid absorption of soluble and permeable active
substances. Therefore, drugs can be absorbed in the lungs to a
relatively high extent after inhalation delivery.[5]
Lipidic nanocarriers are designed to give the
inhalation therapy which has ability to target at lungs such as
micelles, liposomes, microspheres and nanoparticles.
Polymeric micelles are formation of amphiphillic block
copolymers comprising of encapsulated drug within them. It
is more promising approach to overcome systemic toxicity is
application of drug- loaded nano-sized drug carriers. The size
of micelles can be fabricate in the range of 20-200nm and
C

3rd International Conference on Multidisciplinary Research & Practice P a g e | 432
Volume IV Issue I IJRSI ISSN 2321-2705
better bioavailability can be achieved through it. The lipid
based nano carriers having higher ability to accumulate in
lungs and can passively target able on tumor site with EPR
(Enhance permeability and retention) effects without
increasing more the toxicities of cisplatin in body.[6]
The use of novel excipients and nano-micelles in
respiratory drug delivery is limited by the understanding of
how these molecules interact with biological systems. The
micelles used in this study are based on Pluronic F-127, a
non-biodegradable polymer broken down through non-
enzymatic hydrolysis into certain monomers. This polymer is
currently FDA approved and by developing a robust
understanding of particle - cell interaction; it might bolster the
argument for approval of its use in the lungs for specific
clinical indications such as Lung Cancer.[7]
For controlling the release of drug at tumor site as
well as prolonged distribution, exposure of drug to cells of
tumor, polymer conjugation done by Pluronic® co block
polymer.[8] Pluronic®
is promising excipient with wide range
of its application, including sustained release formulations.
Due to nontoxic, biocompatible and overcome the resistance
in cancer and it has ability to enhance penetration of
molecules across the mucosal surfaces.[9] And it has gained
attention for the formulation of spray dried PMs (Polymeric
Micelles) for inhalational delivery. The suitable modes of
administration Nebulizers, Dry Powder Inhaler (DPI),
Metered Dose Inhaler (MDI) [10][11]. Amongst these DPI
can be used as it not contains the propellants and quick to use.
In this context, Objectives of the present
investigation are, Fabrication of polymeric micelles through
optimizing critical parameters (process and product related)
of ultrasonic homogenization and spray drying methods.
II. MATERIAL AND METHOD
A. Material
Cisplatin was a kind gift from S.G. Biopharm (Himachal
Pradesh, India). Pluronic F-127 and PLGA was a kind gift
from BSAF Corporation (Mumbai) and Evonik Industry
(Mumbai) respectively. All other chemicals were of reagent
grade.
B. Drug-Polymer Compatibility studies
1) Fourier Transform Infrared Spectroscopy study:
The Infra red spectra of Cisplatine, Pluronic F-127 (PF-127)
and Cisplatin and PF-127 physical mixture were obtained
using Fourier Transform Infrared Spectrophotometer in order
to detect the interaction between drugs and polymer. Drug /
polymer/ drug – polymer mixture grounded in motor-pestle
with KBr then being compressed on plates. These prepared
plates were placed in light path and spectrum was recorded at
resolution of 2 cm-1
over a frequency range of 4000 to 400
cm-1
.The background spectrum of KBr was used as blank for
determination.[12][13]
2) Differential Scanning Colorimetery study:
The DSC thermograms were recorded on a differential
scanning calorimeter (Jade DSC, Perkin Elmer, Japan). DSC
was performed to study the thermal behavior of pure drugs,
physical mixture of drug and excipients during
preformulation study. The samples of Cisplatin + PF-127
(50%+50%) were placed in pan which was heated from 45
°C to 320.00°C at scanning rate of 10.00 °C/minutes.[14]
C. Solvent Evaporation (Rotatory Flask Evaporation)
Weigh Cisplatin and PF-127 in required amount. Disperse
them in Dich oromethane or Dimethy Formamide and
sonicate the fina dispersion using u trasonic homogenizer for
30 minute at norma amp itude. The resu ting dispersion was
ref uxed using rotary vacuum evaporator for 24 hrs at 60 C at
constant speed of 100 RPM. [7][13]
D. Spray Drying
Weigh the required quantity of Cisplatin and PF-127
accurately, dispersed them in Dimethyl Formamide and made
homogenous dispersion. Dispersion was sonicated using
ultrasonic Homogenizer for 30 minute. A laboratory scale
spray-drying was carried out by using the Bu¨chi mini spray
dryer B-191 (Buchi Laboratory-Techniques, Switzerland)
with a standard nozzle (0.7 mm diameter) to prepare various
types of Cisplatin polymeric micelles. The operating
conditions were set as follows: Aspirator capacity of 45, feed
rate 5 ml/minute and inlet temperature 175°C.Then after it is
collected them from cyclone separator. The obtained
microspheres were stored in a vacuum dessicator at room
temperature. The important process related parameters that
can affect quality of product of micelles are Aspiration
Capacity, The boiling point of solvent, Inlet Temperature,
Flow rate at which gas will flow, Feeding rate of solvent,
Type of Solvent.[15]
E. Screening of processing and product related parameters
using Plackett-Burman Design
PBD is used to screen out those independent variables which
are most significant to the responses. The major limitation of
PBD is that it would not able to detect interaction term
between factors. Plackett-Burman Design was used for the
screening of spray drying related process parameters, where
total no. of 12 experiments were performed for 7 factors at
two level of each that is low and high that is two Centre
points.[16]
A set of 12 experiments were used for preparation
of drug loaded polymeric micelles. This design mostly
investigating every factors and arranges them on the bases of
magnitude of its significant influence on responses. Total 7
independent factors and 2 dependent variables selected for
the design were shown in Table 1.[17]

3rd International Conference on Multidisciplinary Research & Practice P a g e | 433
Volume IV Issue I IJRSI ISSN 2321-2705
Total twelve experimental trials as shown in Table 2,
involving seven independent variables were generated using
Minitab 16 English Software®. The variables were correlated
using the following polynomial Eq...1 with PB design.
Y = A0 + A1X1+ A2X2 + A3X3+ A4X4 +…………+AnXn …….
Eq…. 1
Where, Y is the response, A0 is the constant, and A1, A2…An
are the coefficients of the response.
Suitable polynomial equation involving the individual main
effects and interaction factors was selected based on the
estimation of several statistical parameters, such as the
multiple correlation coefficient (r2), adjusted multiple
correlation coefficient (adjusted r2) and the predicted residual
sum of squares (PRESS), provided by the Minitab 16 English
software®. Suitable model was selected according to the data
which is mentioned in the table and validated.
Table 1: The independent variables and level, Dependent variables and their limits of Plackett-Burman Design
Table 2: Design matrix of Plackett - Burman design
All data generated from Minitab 16 English software® (9.0.0.8) version
Number of
variables Name of independent variables
Levels
Coded values Transform values
Low High Low High
1. Drug : Polymer Ratio -1 +1 1:5 1:10
2. Ultrasonication time (minutes) -1 +1 20 40
3. Ultrasonication Amplitude (%) -1 +1 60 100
4. Solvent Volume (ml) -1 +1 30 50
5. Aspiration Speed -1 +1 40 45
6. Feed Rate(ml/min) -1 +1 5 10
7. Inlet Temperature(°C) -1 +1 160°C 173°C
Dependent variables and their limits
Name of Dependent variables Limits (Range)
1. %EE 60%-90%
2. Micelles Size (Avg. Size) Less than 5 µm
I.V B1 B2 B3 B4 B5 B6 B7 B8 B9 B10 B11 B12
Ultrasonic amplitude (%) 100 100 60 60 60 100 100 100 100 60 60 60
Ultrasonication time(min.) 20 20 20 20 40 40 40 40 20 40 20 40
Aspiration speed 45 45 45 40 45 40 40 45 40 40 40 45
Feed rate (ml/min.) 5 10 10 5 10 10 10 5 5 5 10 5
Inlet Temperature(°C) 153 153 173 153 153 173 153 173 173 153 173 173
Drug: Polymer ratio 1:5 1:10 1:5 1:5 1:10 1:5 1:5 1:10 1:10 1:10 1:10 1:5
Solvent Volume(ml) 50 30 50 30 50 50 30 30 50 50 30 30

3rd International Conference on Multidisciplinary Research & Practice P a g e | 434
Volume IV Issue I IJRSI ISSN 2321-2705
F. Validation of statistical analysis for optimization:
One optimum checkpoint was selected by intensive grid
search, performed over the entire experimental domain, to
validate the chosen experimental design and polynomial
equations. Formulation at specific spray drying condition
corresponding to the checkpoints was prepared and evaluated
for various response properties. Subsequently, the resultant
experimental data of response properties were quantitatively
compared with that of the predicted values and % Prediction
error was calculated. Statistical validity of the polynomials
was established on the basis of ANOVA provision in the
design expert software. Subsequently, the feasibility and grid
searches were performed to locate the composition of
optimum formulations. Also Pareto graphs and 2-D contour
plots were constructed using the Minitab 16 English software.
The ANOVA results are used to determine the most
influencing effect. [18]
G. Optimization of data by factorial 32 design :
The prepared formulations were chosen according to full
factorial design with 2 factors namely, Amount of PF – 127
and aspiration speed utilized in Polymeric micellar
preparation each at 3 levels as shown in Table 3. %
Encapsulation efficiency and micelle size were selected as
responses to be measured for each batch. Experimental design
and analysis were performed using Design Expert® software
(version 9.0.0, Stat-Ease, Inc., Minneapolis, MN) and total 10
batches were prepared as shown in Table 4. [19] [20]
Polynomial model including interaction terms were generated
for all the response variable. The Polynomial equation as
fo ows….
Y=B0+B1X1+B2X2+B12X1X2………Eq.2
Where, B0 is intercept the arithmetic mean response of 10
runs, B1 and B2 is regression coefficient X1 and X2 represents
the interaction terms.[21]
H. Optimization data analysis and validation of optimization
model
Also, statistical validity of polynomials was established on the
basis of ANOVA Provision in the design expert software. 3-D
surface plots and 2-D contour plots were constructed using
DoE software where one optimum checkpoint was selected by
intensive grid search, performed over the entire experimental
domain, to validate the chosen design and polynomial
equation.
Table 3: Independent variables and there levels and
Dependent variables and theirs desired ranges in 32 full
factorial design
Independent
variables
Low
level (-1)
Medium
level(0)
High
level(+1)
X1-Amount of
Polymer 100 150 200
X2-Aspiration 40 42.5 45
Speed
Dependent variables and theirs desired ranges
Dependent Variables Ranges
Y1 - %Encapsulation Efficiency 75% - 90%
Y2 – Micelle size (nm) 200-300 nm
Table 4: Design matrix generated from DoE for 32 factorial
design
Number of runs Amount of polymer (mg) Aspiration speed
1. 150 42.50
2. 200 42.50
3. 200 45.00
4. 100 40.00
5. 100 42.50
6. 150 40.00
7. 200 40.00
8. 150 45.00
9. 150 42.50
10. 100 45.00
Subsequently, the resultant experimental data of response
property were quantitatively compared with that of predicted
values and percentage error was calculated. [22]
I. In vitro characterization of prepared polymeric micelles
1) Particle-size, polydispersity index and zeta-potential
measurements:
The particle size, polydispersity index and zeta potential
measurements for all of the prepared micelles were
determined using dynamic light scattering (DLS) and laser
Doppler velocimetry techniques using a Nano ZS® zetasizer
(Malvern Instruments, Worcestershire, U.K.). The particle
size measurements were intensity-based and were performed
at an angle of 90°. Disperse 10 mg polymeric micelles in 20
ml solvent. The aqueous polymeric micelles dispersion was
added to the sample dispersion unit containing probe.[23]
2) Morphological studies:
Surface morphology of micelles was captured using a
scanning electron microscope. Drop of cisplatin polymeric
micelles was placed on carbon coated (with the help of micro
pipette) grid to form a thin liquid film and then do not forgot
to remove excess solution. The slide was examined and
image was taken at an accelerating voltage of 120Kv.
(Philips, Philips XL 30 ESEM).[24]
3) Critical Micelle Concentration (CMC):
Iodine UV-visible spectroscopy method was used for
determination of CMC of polymers (Wei et al. 2009). UV
absorbances of various dilutions (0.00001-0.1% w/v) of

3rd International Conference on Multidisciplinary Research & Practice P a g e | 435
Volume IV Issue I IJRSI ISSN 2321-2705
po ymers containing standard KI/I2 so ution (25 μ ) were
recorded at 225 nm using UV–visible spectrophotometer after
overnight storage at room temperature. Absorbance values
were plotted against polymer concentration. [20]
4) In –vitro Diffusion study and kinetic study:
The in vitro drug diffusion was performed with the help of
Franz diffusion cell using Dialysis membrane 110 which
having tubing size 0.22 µm. The receptor compartment was
filled with 22.0 ml Phosphate buffer pH 7.4 and maintained at
37°C ± 0.5°C. 10 mg accurately weighed micelles putted on
dialysis membrane. Samples were periodically withdrawn
from the receptor compartment & replaced with the same
amount of fresh buffer solution, and were assayed by U. V.
spectroscopy at 705nm. Then, mechanism of drug release was
determined using various types of kinetic models.[25] To
study the release kinetics of optimized formulation data
obtained from in vitro drug release studies was plotted in
various kinetic models like zero order, first order, Higuchi,
Kosmeyer – peppas model.
5) %Encapsulation Efficiency:
10 mg accurately weighed micelles were dissolved in 1 ml
OPDA and 2 ml buffer solution (PBS 7.4) and allowed to heat
up to 80°C, when the color of solution changes from yellow
to light blue, allow to cool it. Further dilution was made up
with DMF and absorbance was measured in UV
Spectrophotometer (Shimadzu®)
at 705 nm. Finally, Calculate
%EE using following Eq...3.[26]
% Encapsulation efficiency = 𝐏r𝐚𝐜𝐭𝐢𝐜𝐚𝐥 𝐝𝐫𝐮𝐠 𝐜𝐨𝐧𝐭𝐞𝐧𝐭 /𝐓𝐡𝐞𝐨𝐫𝐞𝐭𝐢𝐜𝐚𝐥 𝐝𝐫𝐮𝐠 𝐜𝐨𝐧𝐭𝐞𝐧𝐭 * 𝟏𝟎𝟎 ……Eq. 3
6) Drug loading:
10 mg accurately weighed micelles were dissolved in 1 ml
OPDA and 2 ml buffer solution (PBS 7.4) and allowed to heat
up to 80°C, when the color of solution changes from yellow
to light blue, allow to cool it. Further dilution made up with
DMF and absorbance was measured in UV
Spectrophotometer (Shimadzu®)
at 705 nm. Finally, Calculate
%EE using Eq…4. [27][28]
Drug Loading% = Drug Concentration (mg/ml) / Polymer
concentration (mg/ml) *100…..Eq.4
7) Aerodynamic Evaluation:
The aerodynamic properties of the optimized dry polymeric
micelles were investigated using Anderson cascade impactor.
20mg of optimized sample of polymeric micelles loaded into
a hard gelatin capsule manually. The experiment was carried
out at an air flow rate of 60 ml/min. A capsule filled with
particles was loaded and an actuation time of 4 s was allowed
for each capsule to completely disperse all the particles.
Particles remaining in the capsule, inhaler, throat, pre-
separator, individual impaction plates, and stages were
extracted using phosphate buffer and were assayed using UV
spectrophotomatrically. [29]
III. RESULT AND DISCUSSION
A. Drug-Polymer Compatibility Study
1) Fourier Transmission Infra Red:
The Spectra of FTIR of drug and drug + polymer mixture is
shown in Fig. 1, which indicate absence of any well-defined
interaction between Cisplatin and Pluronic F 127. Thus,
polymer and drug is compatible to each other and no any
additional pick is observed.
Figure 1: FT-IR Spectra of pure Cisplatin and Cisplatin and Pluronic F-127
physical mixture
2) Differential Scanning Colorimetery:
The sharp peak of polymer was observed at 55.10ºC and
peak of drug was observed at 253.28 ºC. DSC pattern of drug
and polymer was shown in Fig. 2 which indicate negligible
change in the melting endotherms of pure drug and exotherm
of the prepared physical mixture of drug and polymer. From
the result of DSC thermogram it was observed that drug and
polymer are compatible with each other.
Figure 2: DSC of Pure Cisplatin and Cisplatin and Pluronic F-127
B. Screening of variables using Plackett and Burman Design
Total twelve experimental trials involving seven independent
variables were generated using Minitab 16 English Software®
and the entrapment efficiency and micelle size were set as
response variables. The measured responses were shown in
Table 6.
Factors that gives the higher p values i.e. above 0.05 was
taken as the non- significant. Table 7 shows that in first

3rd International Conference on Multidisciplinary Research & Practice P a g e | 436
Volume IV Issue I IJRSI ISSN 2321-2705
response Y1 encapsu ation efficiency’s P va ue found to be of
0.04 that was significant as well as micelle size’s P va ue was
found to be 0.04 that also significant to all the dependent
variable.
Table 3: Outline and observed responses by Plackett-burman
design
Batches Matrix * Response -1
(%EE)
Response-2
(Micelle Size µm)
B1 +-+---+ 91.00±0.15 0.14
B2 +-++-+- 72.95±0.24 0.30
B3 --+++-+ 93.18±0.12 0.16
B4 ------- 85.40±0.10 0.18
B5 -+++-++ 75.55±0.15 0.30
B6 ++-++-+ 83.50±0.15 0.18
B7 ++-+--- 88.17±0.18 0.20
B8 +++-++- 67.7±0.70 0.30
B9 +---+++ 67.25±0.15 0.30
B10 -+---++ 69.50±0.18 0.30
B11 ---+++- 70.35±0.20 0.30
B12 -++-+-- 77.1±0.16 0.15
1) Influence of process parameters on Entrapment Efficiency:
Pareto chart was shown in Fig. 3, indicate that drug: polymer
ratio and feed rate having significant effect on response Y1%
i. e. EE. As the feed rate increases, the encapsulation was
increased. From Pareto chart, it was clearly observed that
amount of polymer significantly affect the Encapsulation
Efficiency.
Contour Plots of Response Y1 (%EE) vs. Significant factors
X1 and X2 in Fig. 3 shows that when aspiration speed(X2)
increased from -1 to +1 level and drug: polymer ratio
decreased from +1 to -1 level the % EE was found to be
Higher and in acceptable range. As well as by keeping the
aspiration speed at low level and when amount of polymer
increased from -1 to +1 level the encapsulation was found to
be in decreased in limit and non-acceptable range. And
aspiration speed increased from low-1 to high level+1 and
amount of polymer is at low level, it increases the
encapsulation efficiency. It concludes that when aspiration
speed is high then it increases the encapsulation efficiency.
When aspiration speed and amount of polymer increases the
size of micelles are gradually increases.
Table 4: Summary of Analysis of variance for dependent
variables
Source DF Seq.
Square
Mean
Square F value P value
Response Y1- % EE
Regression 7 896.58 192.08 6.67 0.04
Residual Error 4 76.861 19.21 -
Total 11 11 973.44 -
ResponceY2- Micelle Size(μm)
Regression 7 0.0328 0.0046 0.87
0.04 Residual Error 4 0.0216 0.0054 -
Total 11 0.0544 - -
Fig. 3: Pareto chart of the standardization effect of Independent factors on
response Y1 Entrapment efficiency and contour plot
2). Influence of process parameters on Particle Size:
Pareto chart as shown in Fig. 4 shows that Amount of
polymer and addition effect of aspiration speed affect
significantly on average particle size (i.e response Y2) among
all the factors. Hence, significant factor were amount of
polymer and aspiration speed affecting average size of
polymeric micelles.
Figure 4: Pareto chart of Standardization effects of Independent factors on
response Y2 (Avg. size). And Contour plot of Size (Y2) vs. X1 and X2
Fig. 4 contour plot shows that when the amount of polymer
(X1) increased from -1 to +1 level and aspiration speed (X2)
increased -1 to +1 level average micelle size was found to be
low and optimum.
Represented figure of contour plot of size vs. amount of
polymer and aspiration speed shows that by keeping
aspiration speed at low level and amount polymer increased
form low to high level the average size was found to be
increased. Whereas amount of polymer at low level and
aspiration speed increased from low to high then size is
decreased. Thus, When amount of polymer is at above 0.5
and aspiration speed at medium level the average size was
found to be optimum and within the desired range. When
aspiration speed and amount of polymer increases the size of
micelles was gradually increases. From the PB design, it was
concluded that X1 (Amount of polymer) and X2 (Aspiration
3rd International Conference on Multidisciplinary Research & Practice P a g e | 437
Volume IV Issue I IJRSI ISSN 2321-2705
Speed) were selected as critical parameter which affect the
final product quality.
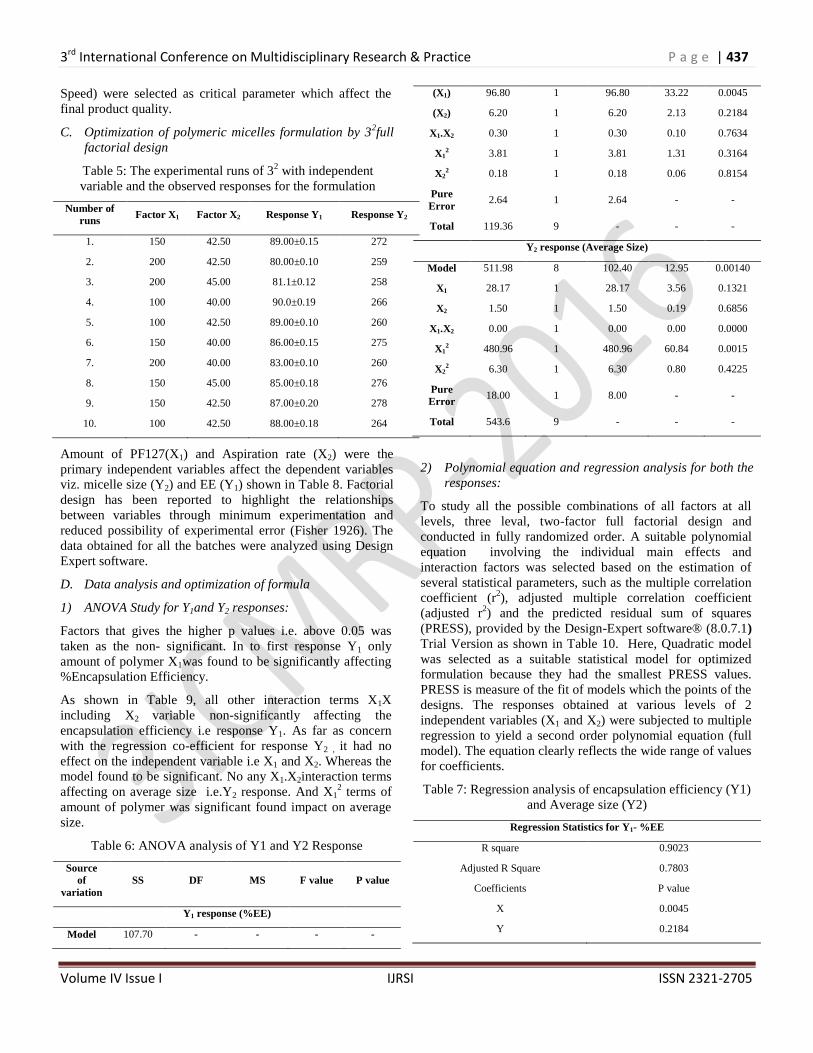
C. Optimization of polymeric micelles formulation by 32full
factorial design
Table 5: The experimental runs of 32 with independent
variable and the observed responses for the formulation
Number of
runs Factor X1 Factor X2 Response Y1 Response Y2
1. 150 42.50 89.00±0.15 272
2. 200 42.50 80.00±0.10 259
3. 200 45.00 81.1±0.12 258
4. 100 40.00 90.0±0.19 266
5. 100 42.50 89.00±0.10 260
6. 150 40.00 86.00±0.15 275
7. 200 40.00 83.00±0.10 260
8. 150 45.00 85.00±0.18 276
9. 150 42.50 87.00±0.20 278
10. 100 42.50 88.00±0.18 264
Amount of PF127(X1) and Aspiration rate (X2) were the
primary independent variables affect the dependent variables
viz. micelle size (Y2) and EE (Y1) shown in Table 8. Factorial
design has been reported to highlight the relationships
between variables through minimum experimentation and
reduced possibility of experimental error (Fisher 1926). The
data obtained for all the batches were analyzed using Design
Expert software.
D. Data analysis and optimization of formula
1) ANOVA Study for Y1and Y2 responses:
Factors that gives the higher p values i.e. above 0.05 was
taken as the non- significant. In to first response Y1 only
amount of polymer X1was found to be significantly affecting
%Encapsulation Efficiency.
As shown in Table 9, all other interaction terms X1X
including X2 variable non-significantly affecting the
encapsulation efficiency i.e response Y1. As far as concern
with the regression co-efficient for response Y2 , it had no
effect on the independent variable i.e X1 and X2. Whereas the
model found to be significant. No any X1.X2interaction terms
affecting on average size i.e.Y2 response. And X12 terms of
amount of polymer was significant found impact on average
size.
Table 6: ANOVA analysis of Y1 and Y2 Response
Source
of
variation
SS DF MS F value P value
Y1 response (%EE)
Model 107.70 - - - -
(X1) 96.80 1 96.80 33.22 0.0045
(X2) 6.20 1 6.20 2.13 0.2184
X1.X2 0.30 1 0.30 0.10 0.7634
X12 3.81 1 3.81 1.31 0.3164
X22 0.18 1 0.18 0.06 0.8154
Pure
Error 2.64 1 2.64 - -
Total 119.36 9 - - -
Y2 response (Average Size)
Model 511.98 8 102.40 12.95 0.00140
X1 28.17 1 28.17 3.56 0.1321
X2 1.50 1 1.50 0.19 0.6856
X1.X2 0.00 1 0.00 0.00 0.0000
X12 480.96 1 480.96 60.84 0.0015
X22 6.30 1 6.30 0.80 0.4225
Pure
Error 18.00 1 8.00 - -
Total 543.6 9 - - -
2) Polynomial equation and regression analysis for both the
responses:
To study all the possible combinations of all factors at all
levels, three leval, two-factor full factorial design and
conducted in fully randomized order. A suitable polynomial
equation involving the individual main effects and
interaction factors was selected based on the estimation of
several statistical parameters, such as the multiple correlation
coefficient (r2), adjusted multiple correlation coefficient
(adjusted r2) and the predicted residual sum of squares
(PRESS), provided by the Design-Expert software® (8.0.7.1)
Trial Version as shown in Table 10. Here, Quadratic model
was selected as a suitable statistical model for optimized
formulation because they had the smallest PRESS values.
PRESS is measure of the fit of models which the points of the
designs. The responses obtained at various levels of 2
independent variables (X1 and X2) were subjected to multiple
regression to yield a second order polynomial equation (full
model). The equation clearly reflects the wide range of values
for coefficients.
Table 7: Regression analysis of encapsulation efficiency (Y1)
and Average size (Y2)
Regression Statistics for Y1- %EE
R square 0.9023
Adjusted R Square 0.7803
Coefficients P value
X 0.0045
Y 0.2184

3rd International Conference on Multidisciplinary Research & Practice P a g e | 438
Volume IV Issue I IJRSI ISSN 2321-2705
X.Y 0.7634
X2 0.3164
Y2 0.8154
Regression Statistics for Y2-Average size
R square 0.9418
Adjusted R Square 0.8691
Coefficients P value
X 0.1321
Y 0.6856
X.Y 1.000
X2 0.0015
Y2 0.4225
3) 2-D and 3-D contour plots of response Y1:
Two dimensional contour plot and three dimensional
responses surface plots are presented, to show the
relationships between the dependent and independent
variable. The different graph shown here is graphical
representation of the various mathematical models.
Figure 5: 2-D and 3-D plots of Response Y1-% Encapsulation Efficiency
It’s for the easy interpretation of arrived resu t. The graphs
will able to overlap and helps to define design space per
current requirements of FDA and ANDA application. Here, 2-
D, contour plots and 3-D response surface plots were plotted
for both response i.e. Y1 and Y2.
The best way to look at the output is to draw two- dimensional
contour plot. The contour plot of %EE reveals non-linearity
(curved lines). The following contour plot Fig. 5 reveled that
relationships between the two independent variables (X1=
Aspiration Speed) (X2=Amount of Polymer) and response Y1
(%Encapsulation Efficiency) was found to be non-linear in
nature. When amount of polymer kept at low level 100 and
aspiration speed increased from 40 to 45 encapsulation
efficiency found to be increased from 82.17 to 88.88. When
the amount of polymer increased from 100 to 200 and by
keeping low level of aspiration the encapsulation efficiency
was found to be decreased. Here, aspiration speed and amount
of PF - 127 both had role in contribution of increment of
encapsulation efficiency.
4) 2-D and 3-D plots of response Y2:
3D surface plot as shown in Fig. 6 shows that the relationship
between X1 and X2 is non-linear in nature and it shows that
as the amount of polymer increases entrapment efficiency
decreases and aspiration speed has less influence on average
size. By keeping amount of polymer at low level 100 and
aspiration speed increased from 40 to 45 the average size was
found to be constant at medium level of aspiration speed. And
by keeping the low level of aspiration speed 40 and increased
level of polymer 100 to 200 the size was increased till
medium level and then decreased. Thus, conclusively the both
the Independent variable influencing on the average size at
medium level of polymer.
Figure 6: 2-D and 3-D plots of Response Y2-% Average Size
5) Overlay plot and validation of design:
The overlay plot is the plot which is generated by
superimposing the contour plots of all the regions and the
common region which is obtained is the overlay plot by which
we can get some predicted standard batches which is called
Check point analysis. The range selected for the overlay plot
was ± 10 as per USFDA criteria.
𝐏𝐫𝐞𝐝𝐢𝐜𝐭𝐞𝐝 𝐯𝐚𝐥𝐮𝐞 𝐞𝐫𝐯𝐞𝐝 𝐯𝐚𝐥𝐮𝐞
𝐩𝐫𝐞𝐝𝐢𝐜𝐭𝐞𝐝 𝐯𝐚𝐥𝐮𝐞 𝟏𝟎𝟎
The relative error should not be more than 5% as per USP. A
checkpoint analysis was performed to confirm the role of the
derived polynomial equation and contour plots (overlay plots)
in predicting the responses. From the extensive grid search,
values of independent variables were taken at 1 check point as
levels of the factors. In the region of the design space as seen
in Fig. 7 shows that any point selected among the region falls
well within the constrains set for the response variables.
Figure 7: Overlay Plot

3rd International Conference on Multidisciplinary Research & Practice P a g e | 439
Volume IV Issue I IJRSI ISSN 2321-2705
The theoretical values of R1 were calculated by substituting
the values in the polynomial equation. The final formulation
Check point batch 1 were selected after taking trials of the
obtained formulations as they were having significantly lower
amount of error as can be seen in Table 11 which consists of
the dependent and the independent variables
6) Checkpoint Batch:
% Entrapment efficiency and micelles size of check point
batches were experimentally determined. They were
compared with the predicted values found from the equation.
The % relative error obtained from checkpoint batch was in
the range of 0.171.73 hence, close resemblance obtained
between observed value and predicted response assessed the
robustness of prediction. This is shown in Table 11 and Fig. 8
and Fig. 9. This value indicates the validity of generated
model. The model suggest that Run 5 which has amount of PF
127 100 mg and aspiration rate 42.5 was optimized.
Table 8: Checkpoint batches with observed responses
Batc
h
I.
V
Opt.
value
Depe
ndent
Facto
r
Predicte
d
Respons
e
Observe
d
Respons
e
%Predictio
n Error
Run
5 X1 103.9 Y1 89.42 89.00 0.46
X2 42.58 Y2 264.25 262 1.6
Figure 8: Linear correlation plot between actual and predicted values b) the
corresponding residual plot for response Y1 (% EE)
Figure 9: Linear correlation plot between actual and predicted values b) the
corresponding residual plot for response Y2 (% Particle size)
E. Characterization of optimized spray dried polymeric micelles
1) Particle size and Zeta Potential:
Fig. 10 shows that avg. size was found to between 200-300
nm, which came in the range of pluronic block co-polymer
micelles i. e 80-200nm. The average size distribution was
evaluated by zeta analysis. If the micelle size was less than
5µm, it has good target ability. Here the micelle size was 200-
300nm, so it is acceptable. Whereas Fig. 10 shows that zeta
potential was found to be -26.0mV and with deviation
observed ±4.24mV. This was in the range of pluronic
micelles i.e. -23.33 to -24.21mV with deviation of ±2.7 mV.
Hence it is acceptable and result was that the prepared
micelles carrying charge that static charge as they were
prepared by spray drying technique and it helps to
disaggregate the micelles particle form each other and it was
found to be stable.
Figure 10: Size distributions by intensity and Zeta potential
2) Transmission Electron Microscopy Study:
The study of TEM micrograph, Fig. 11 shows that the
micelles had size of 200 to 300 nm ranges and spherical in
shape. The micelles observed as separate entity and not in
aggregate form. The observed size was found to be good
target ability over the lungs at the site of cancer, as the all the
derived data of TEM monograph was found to be less than 5
μm. Moreover, TEM study reve ed that a the mice es were
in uniform shaping which easily gone through the surfaces of
alveoli of the lungs.
Figure 11: TEM Morphology of Micelles
3) Critical Miceller Concentration:
The CMC of optimized batch was found to be 0.6 µg/ml. At
this point micelles formation in vesicular structure got started.
As the polymer concentration increases the absorbance also
increases. At the point of 0.6 μg of concentration of po ymer
the threshold of micelle prepared were very much faster. The
CMC of Pluronic micelles generally within the range of 0.2 to
0.6 µg/ml.

3rd International Conference on Multidisciplinary Research & Practice P a g e | 440
Volume IV Issue I IJRSI ISSN 2321-2705
Figure 12: Critical Micelle Concentration
4) In-vitro Diffusion Study:
Figure 13: Cumulative Drug release profile of optimized Cisplatin polymeric
micelle
In vitro drug release study of optimized batch was performed
by Franz diffusion cell. The drug release profile of cisplatin
loaded optimized polymeric micelles showed release up to 10
hrs as shown in Fig. 13. In the study of drug release
mechanism of cisplatin polymeric micelles, the release data
were fitted to the different kinetics models like zero order,
First order, Higuchi order and Kosmeyer peppas. Korsmeyer-
Peppas model describes the release mechanism of drug from
matrix. Release profile of log fraction released versus log time
was p otted and its s ope va ue which is indicated by ‘n’ was
calculated. It was found that n values were obtained 0.5018
which indicates non-fickian diffusion. Maximum R2 i.e. near
to 1 and minimum SSR value was found in case of Higuchi
model which indicated that Higuchi was the best fitted model.
5) Aerodynamic Behavior Study:
Aerodynamic property of polymeric micelle was investigated
by Anderson cascade impactor. The optimized formulation
was subjected to in vitro lung deposition study using
Anderson cascade impactor. The deposition of total amount
of remaining in capsule, device, throat, preseperator and
stages 0-7 polymeric micelle was found to be 82%.
Percentage deposition at stages 6-7 of the cascade impactor
indicates Percentage respirable fraction was used to evaluate
the possibility of delivering the particles to deep parts of the
lung such as alveoli. Percentage respirable fraction was 54%
indicates the high aerosol performance of polymeric micelle
as shown in Fig. 14.
Figure 14: Bar graph representing amount of micelles deposited different
stages and Logarithmic graph of cumulative behavior in terms of Diameter
These kinds of polymeric micelle possess high aerosolization
efficiency, which improve the flow ability of the particles of
the inhaler and promotes the disaggregation into fine particles.
After plotting graph as shown in Fig. 14, Mass Median
Aerodynamic Diameter and Geometric Standard Deviation
was found to be 1.73 μm and 1.49 μm respective y. Optimum
range is defined as 0.5-5μm because partic es <0.5μm are
usua y exha ed whereas partic es >5.0μm are impacted in the
oropharynx. Hence the powder is suitable for the delivery to
the peripheral alveolar airway. Thus resultant data shoes that
ess than 5μm nanopartic es ab e to target on ung site easi y.
IV. CONCLUSION
Optimized batch containing Cisplatin and Pluronic F-127 ratio
of 1:5 having novel effective safe and patient friendly and
overcome the all the drawback of conventional chemotherapy.
Moreover, prepared novel formulation DPI did not causes side
effects as maximum part reaches to the lung. In a future this
would be suitable for effective delivery of anti-cancer therapy
ultimately leads to more patient compliance. The excipients
used in present work can also result in improvement of
bioavailability and they are approveed by FDA for use in
medicine. As the preparative technology and the raw materials
are well known, the scale up work can be easily taken up at
industry. The equipments in preparation of dosage form are
easily available. Better profit expected as such formulation is
not available currently in the market.
REFERENCES
[1]. SIRO Cinepharm USA, Lung Cancer Focus : India, Tracing the
evolution,prevalence, distribution, etiology, association,
occurrence, types, menifestation & imoact of lung cancer in India,
2015. [2]. A. Bhattacharjee, W.G. Richards, J. Staunton, C. Li, S. Monti, P.
Vasa, et al., Classification of human lung carcinomas by mRNA expression profiling reveals distinct adenocarcinoma subclasses,
Proc Natl Acad Sci U S A. 98 (2001) 13790–5.
doi:10.1073/pnas.191502998. [3]. N.E. Board, O.N.T. Page, A.C. Trials, S. Radiation, C. Treatment,
Lung Cancer - Non - Sma Ce : Treatment Options Adjuvant
therapy, (2016) 1–10. [4]. D. Shaloam, P.B. Tchounwou, Cisplatin in cancer therapy:
0
0.2
0.4
0.6
0.8
1
0 0.1 0.2 0.3 0.4 0.5 0.6 0.7 0.8
Ab
sorb
ence
Concentration(µg/ml)
Critical Micelle Conc.
Abs.
CMC
0
20
40
60
80
100
120
0 2 4 6 8 10 12 14
%C
DR
Time (min)
In vitro drug release of optimized micelles
%CDR

3rd International Conference on Multidisciplinary Research & Practice P a g e | 441
Volume IV Issue I IJRSI ISSN 2321-2705
Molecular mechanisms of action, Eur. J. Pharmacol. 740 (2014)
364–378. doi:10.1016/j.ejphar.2014.07.025.Cisplatin.
[5]. J.L. Rau, The inhalation of drugs: advantages and problems., Respir. Care. 50 (2005) 367–382.
[6]. A.Z. Wang, R. Langer, O. Farokhzad, Nanoparticle Delivery of
Cancer Drugs, Annu. Rev. Med. 63 (2012) 185–198. doi:10.1146/annurev-med-040210-162544.
[7]. Z. Sezgin, N. Yüksel, T. Baykara, Preparation and characterization
of polymeric micelles for solubilization of poorly soluble anticancer drugs, Eur. J. Pharm. Biopharm. 64 (2006) 261–268.
doi:10.1016/j.ejpb.2006.06.003.
[8]. A.A. Exner, T.M. Krupka, K. Scherrer, J.M. Teets, Enhancement of carboplatin toxicity by Pluronic block copolymers, J. Control.
Release. 106 (2005) 188–197. doi:10.1016/j.jconrel.2005.04.015.
[9]. A. V. Kabanov, E. V. Batrakova, V.Y. Alakhov, Pluronic?? block copolymers for overcoming drug resistance in cancer, Adv. Drug
Deliv. Rev. 54 (2002) 759–779. doi:10.1016/S0169-
409X(02)00047-9. [10]. N. Islam, E. Gladki, Dry powder inhalers (DPIs)-A review of
device reliability and innovation, Int. J. Pharm. 360 (2008) 1–11.
doi:10.1016/j.ijpharm.2008.04.044.
[11]. S. Newman, Evolution of dry powder inhaler design, formulation,
and performance, Respir Med. 96 (2002) 293–304.
[12]. Y. Wang, Q. Liu, L. Qiu, T. Wang, H. Yuan, J. Lin, et al., Spectrochimica Acta Part A : Mo ecu ar and Biomo ecu ar
Spectroscopy Molecular structure , IR spectra , and chemical
reactivity of cisp atin and transp atin : DFT studies , basis set effect and solvent effect, Spectrochim. Acta Part a Mol. Biomol.
Spectrosc. 150 (2015) 902–908. doi:10.1016/j.saa.2015.06.027.
[13]. X. Yan, R.A. Gemeinhart, Cisplatin delivery from poly(acrylic acid-co-methyl methacrylate) microparticles, J. Control. Release.
106 (2005) 198–208. doi:10.1016/j.jconrel.2005.05.005.
[14]. V. Gupta, V. Dhote, B.N. Paul, P. Trivedi, Development of novel topical drug delivery system containing cisplatin and imiquimod
for dual therapy in cutaneous epithelial malignancy., J. Liposome Res. 24 (2014) 150–62. doi:10.3109/08982104.2013.865216.
[15]. L. Mu, S.S. Feng, Fabrication, characterization and in vitro release
of paclitaxel (Taxol) loaded poly(lactic-co-glycolic acid) microspheres prepared by spray drying technique with
lipid/cholesterol emulsifiers, J. Control. Release. 76 (2001) 239–
254. doi:10.1016/S0168-3659(01)00440-0. [16]. A.S. Zidan, O.A.A. Ahmed, B.M. Aljaeid, Nicotinamide
po ymeric nanoemu sified systems : a qua ity-by-design case study
for a sustained antimicrobial activity, (2016) 1501–1516. [17]. R.K. Deshmukh, J.B. Naik, Optimization of spray-dried diclofenac
sodium-loaded microspheres by screening design, Dry. Technol.
34 (2016) 1593–1603. doi:10.1080/07373937.2016.1138121. [18]. J. Varshosaz, F. Hassanzadeh, H. Sadeghi-aliabadi, Z. Larian, M.
Rostami, Synthesis of Pluronic?? F127-poly (methyl vinyl ether-
alt-maleic acid) copolymer and production of its micelles for
doxorubicin delivery in breast cancer, Chem. Eng. J. 240 (2014) 133–146. doi:10.1016/j.cej.2013.11.086.
[19]. Capreto et al, Mithramycin encapsulated in polymeric
micelles\nby microfluidic technology as novel therapeutic\nprotocol for beta-thalassemia, Int. J. Nanomedicine.
(2012) 307–324. http://dx.doi.org/10.2147/IJN.S25657.
[20]. S. Patil, B. Choudhary, A. Rathore, K. Roy, K. Mahadik, Enhanced oral bioavailability and anticancer activity of novel
curcumin loaded mixed micelles in human lung cancer cells,
Phytomedicine. 22 (2015) 1103–1111. doi:10.1016/j.phymed.2015.08.006.
[21]. L.M. Collins, Resource Management Perspective on Complete and
Reduced, Psychol Methods. 14 (2009) 202–224. doi:10.1037/a0015826.Design.
[22]. S. Bhadra, A.B. Prajapati, D. Bhadra, Development of pH
sensitive polymeric nanoparticles of erythromycin stearate., J. Pharm. Bioallied Sci. 8 (2016) 135–40. doi:10.4103/0975-
7406.171691.
[23]. M. Mehanny, R.M. Hathout, A.S. Geneidi, S. Mansour,
Bisdemethoxycurcumin loaded polymeric mixed micelles as
potential anti-cancer remedy: Preparation, optimization and
cytotoxic evaluation in a HepG-2 cell model, J. Mol. Liq. 214 (2016) 162–170. doi:10.1016/j.molliq.2015.12.007.
[24]. I. Kim, H.J. Byeon, T.H. Kim, E.S. Lee, K.T. Oh, B.S. Shin, et al.,
Doxorubicin-loaded porous PLGA microparticles with surface attached TRAIL for the inhalation treatment of metastatic lung
cancer, Biomaterials. 34 (2013) 6444–6453.
doi:10.1016/j.biomaterials.2013.05.018. [25]. M. Basotra, S. Singh, M. Gulati, Development and Validation of a
Simple and Sensitive Spectrometric Method for Estimation of
Cisplatin Hydrochloride in Tablet Dosage Forms: Application to, ISRN Anal. Chem. 2013 (2013) 1–8. doi:10.1155/2013/936254.
[26]. E. Kahraman, G. Özhan, Y. Özsoy, S. Güngör, Polymeric micellar nanocarriers of benzoyl peroxide as potential follicular targeting
approach for acne treatment, Colloids Surfaces B Biointerfaces.
146 (2016) 692–699. doi:10.1016/j.colsurfb.2016.07.029. [27]. S.S. Desale, S.M. Cohen, Y. Zhao, A. V. Kabanov, T.K. Bronich,
Biodegradable hybrid polymer micelles for combination drug
therapy in ovarian cancer, J. Control. Release. 171 (2013) 339–348. doi:10.1016/j.jconrel.2013.04.026.
[28]. T. Miller, G. Van Colen, B. Sander, M.M. Golas, S. Uezguen, M.
Weigandt, et al., Drug loading of polymeric micelles, Pharm. Res. 30 (2013) 584–595. doi:10.1007/s11095-012-0903-5.
[29]. T. Sebti, K. Amighi, Preparation and in vitro evaluation of lipidic
carriers and fillers for inhalation, Eur. J. Pharm. Biopharm. 63 (2006) 51–58. doi:10.1016/j.ejpb.2005.11.003.