characterization of new york city’s solid waste stream · while providing interesting data for...
TRANSCRIPT

Characterization of New York City’s
Solid Waste Stream
Prepared by:
SCIENCE APPLICATIONS INTERNATIONAL CORPORATION
221 Third Street
Newport, RI 02840
Spring 2000
Prepared for:
New York City Department of Sanitation
Bureau of Waste Prevention, Reuse and Recycling
44 Beaver Street
New York, New York 10004

Characterization of New York City’s Solid Waste Stream Spring 2000
BWPRR Overview
This report is one of a number of waste prevention reports prepared under a long-term
contract by consultant Science Applications International Corporation, and issued at contract
conclusion. The reports are listed below. The New York City Department of Sanitation
(DOS, or the Department), Bureau of Waste Prevention, Reuse and Recycling (BWPRR),
the sponsor, has issued a Foreword to the studies; it acknowledges the many contributors
and frames a position based on its considerable efforts to review, practice, and measure
waste prevention. The Foreword appears at the beginning of the first report in the series,
Measuring Waste Prevention in New York City. Interested readers are strongly encouraged to
access the material through the Department’s web site at www.ci.nyc.ny.us/strongest.
Print or electronic versions are available through BWPRR.
Some of the estimates made in this report for particular products have been used in
Measuring Waste Prevention. As this report explains, the estimates of the various products’
portion of the waste are based on allocating national waste data, with alternate measures for
products given local information. In some cases, most noteworthy the various paper cate-
gories, there are inconsistencies between the nationally based and locally based estimates.
In addition, the estimates under-represent current recycling because study preceded the final
expansion of New York City’s residential and institutional recycling program. That expansion,
completed in Fall 1997, added mixed paper, milk cartons and juice packs, and bulky metal
items to the designated materials that the Department collects. In this report, milk cartons
are assumed not to be recycled based on national data.
While providing interesting data for consideration, the report is not, in and of itself, a
recommendation for recycling particular items. Such recommendations are policy decisions
that must be based on full consideration of costs, and on up-to-date knowledge of the current
waste stream. Estimating local waste generation from national data is not intended as a
substitute for a citywide waste composition study that samples from the entire waste stream,
over all seasons. The Department has proposed such a study, subject to available funding.

Packaging Restrictions Research Spring 2000
2
Waste Prevention Reports:
• Measuring Waste Prevention in New York City
• Survey of Waste Prevention Programs in Major Cities, States and Countries
• Procurement Strategies Pursued by Federal Agencies and Jurisdictions Beyond NYC
for Waste Prevention and Recycled Products
• Inter-Agency Task Force Action Plan to Encourage the Use of Recycled-Content Building
Materials
• Materials Exchange Research Report
• Characterization of NYC’s Solid Waste Stream
• Life Span Costing Analysis Case Studies
• Packaging Restrictions Research: Targeting Packaging for Reduction, Reuse and
Recycled Content
• NYCitySen$e Summary Report
• NYC WasteLe$$ Summary Report

Characterization of New York City’s Solid Waste Stream Spring 2000
Table of Contents
Introduction . . . . . . . . . . . . . . . . . . . . . . . . . . . . . . . . . . . . . . . . . . . . . . . . 5
Exhibit 1. Materials Included in the New York
City Waste Composition Analysis . . . . . . . . . . . . . . . 6
Research Methodologies . . . . . . . . . . . . . . . . . . . . . . . . . . . . . . . . 9
Summary of Results . . . . . . . . . . . . . . . . . . . . . . . . . . . . . . . . . . . 10
Exhibit 2. Summary of Quantity of Each Material in
New York . . . . . . . . . . . . . . . . . . . . . . . . . . . . . . . . . . . 11
Exhibit 3. Waste Stream Composition Analysis –
Major Categories . . . . . . . . . . . . . . . . . . . . . . . . . . . . . 13
Exhibit 4. Durable Goods . . . . . . . . . . . . . . . . . . . . . . . . . . . 13
Exhibit 5. Vehicle-Associated Products . . . . . . . . . . . . . . . . . 13
Exhibit 6. Personal Items . . . . . . . . . . . . . . . . . . . . . . . . . . . . 14
Exhibit 7. Containers . . . . . . . . . . . . . . . . . . . . . . . . . . . . . . . 14
Exhibit 8. Paper Goods . . . . . . . . . . . . . . . . . . . . . . . . . . . . . . 14
Exhibit 9. Miscellaneous Products . . . . . . . . . . . . . . . . . . . . . 15
Conclusions . . . . . . . . . . . . . . . . . . . . . . . . . . . . . . . . . . . . . . . . . . . 15
Exhibit 10. Peer Review List . . . . . . . . . . . . . . . . . . . . . . . . . 18
Endnotes . . . . . . . . . . . . . . . . . . . . . . . . . . . . . . . . . . . . . . . . . . . . . . . . . . . 20
APPENDICES
New York City Waste Stream Composition Analysis:
Appendix 1 - Furniture and Furnishings . . . . . . . . . . . . . . . . . . . . . . 21
Appendix 2 - Major and Small Appliances . . . . . . . . . . . . . . . . . . . . 22
Appendix 3 - Carpets and Rugs . . . . . . . . . . . . . . . . . . . . . . . . . . . . 25
Appendix 4 - Clothing and Footwear . . . . . . . . . . . . . . . . . . . . . . . . 27
Appendix 5 - Towels, Sheets, and Pillowcases . . . . . . . . . . . . . . . . . 29
Appendix 6 - Vehicle-Associated Products: Scrap Tires, Air Filters,
Oil Filters, and Lead-Acid Batteries . . . . . . . . . . . . . . . . . . . . . 30
Appendix 7 - Motor Oil . . . . . . . . . . . . . . . . . . . . . . . . . . . . . . . . . . . 37
Appendix 8 - Disposable Razors . . . . . . . . . . . . . . . . . . . . . . . . . . . . 40
Appendix 9 - Shaving Cream Cans . . . . . . . . . . . . . . . . . . . . . . . . . . 42
Appendix 10 - Toothbrushes . . . . . . . . . . . . . . . . . . . . . . . . . . . . . . . 43
3

Characterization of New York City’s Solid Waste Stream Spring 2000
APPENDICES (continued)
New York City Waste Stream Composition Analysis:
Appendix 11 - Disposable Diapers . . . . . . . . . . . . . . . . . . . . . . . . . . . 45
Appendix 12 - Non-Deposit Beverage Containers . . . . . . . . . . . . . . . 48
Appendix 13 - Clear HDPE Jugs . . . . . . . . . . . . . . . . . . . . . . . . . . . . 57
Appendix 14 - Milk Cartons . . . . . . . . . . . . . . . . . . . . . . . . . . . . . . . . 59
Appendix 15 - Aerosol Cans . . . . . . . . . . . . . . . . . . . . . . . . . . . . . . . . 60
Appendix 16 - Bag-in-Boxes . . . . . . . . . . . . . . . . . . . . . . . . . . . . . . . . 62
Appendix 17 - Folding Cartons . . . . . . . . . . . . . . . . . . . . . . . . . . . . . . 65
Appendix 18 - Office Paper . . . . . . . . . . . . . . . . . . . . . . . . . . . . . . . . . 66
Appendix 19 - Newspapers . . . . . . . . . . . . . . . . . . . . . . . . . . . . . . . . . 69
Appendix 20 - Magazines . . . . . . . . . . . . . . . . . . . . . . . . . . . . . . . . . . 72
Appendix 21 - Books . . . . . . . . . . . . . . . . . . . . . . . . . . . . . . . . . . . . . 75
Appendix 22 - Telephone Directories . . . . . . . . . . . . . . . . . . . . . . . . . 77
Appendix 23 - Third-Class Mail . . . . . . . . . . . . . . . . . . . . . . . . . . . . . . 82
Appendix 24 - Paper Towels . . . . . . . . . . . . . . . . . . . . . . . . . . . . . . . . 84
Appendix 25 - Paper Plates and Cups . . . . . . . . . . . . . . . . . . . . . . . . . 86
Appendix 26 - Polybags from Dry Cleaners . . . . . . . . . . . . . . . . . . . . . 88
Appendix 27 - Hangers from Dry Cleaners . . . . . . . . . . . . . . . . . . . . . 89
Appendix 28 - Household Batteries . . . . . . . . . . . . . . . . . . . . . . . . . . 91
Appendix 29 - Thermostats . . . . . . . . . . . . . . . . . . . . . . . . . . . . . . . . . 97
Appendix 30 - Latex Paint . . . . . . . . . . . . . . . . . . . . . . . . . . . . . . . . . . 100
Appendix 31 - Fluorescent Tubes and Ballasts . . . . . . . . . . . . . . . . . . 103
Appendix 32 - Incandescent Bulbs . . . . . . . . . . . . . . . . . . . . . . . . . . . 110
Appendix 33 - Pallets/Wood Packaging . . . . . . . . . . . . . . . . . . . . . . . . 114
Appendix 34 - Food Wastes . . . . . . . . . . . . . . . . . . . . . . . . . . . . . . . . 116
Appendix 35 - Plastic Wraps . . . . . . . . . . . . . . . . . . . . . . . . . . . . . . . . 118
Appendix 36 - Paper and Plastic Grocery Bags . . . . . . . . . . . . . . . . . . 121
Appendix 37 - Plastic Plates and Cups . . . . . . . . . . . . . . . . . . . . . . . . 127
Appendix 38 - Single-Use Cameras . . . . . . . . . . . . . . . . . . . . . . . . . . . 128
Appendix 39 - Toilets . . . . . . . . . . . . . . . . . . . . . . . . . . . . . . . . . . . . . 131
Appendix 40 - Writing Instruments . . . . . . . . . . . . . . . . . . . . . . . . . . . 134
Appendix 41 - Trash Bags . . . . . . . . . . . . . . . . . . . . . . . . . . . . . . . . . 135
4

Characterization of New York City’s Solid Waste Stream Spring 2000
Introduction
This report provides the results of a material-specific waste composition analysis of the New York
City municipal solid waste stream. The study was funded primarily by a grant awarded to the
NYC Department of Sanitation (DOS) by the U.S. Environmental Protection Agency (EPA)
Region II. It is intended to assist DOS in focusing its resources more effectively on appropriate
products and packaging to target for waste prevention and recycling, and to enhance DOS’s
capabilities in measuring the impacts of its waste prevention policies and programs, by calculating
relative quantities of various products and packaging generated as waste in New York City.
Historically, waste composition analyses conducted by the federal government, states, and
municipalities, including New York City, have primarily focused on broad material categories,
rather than specific products and packaging. This report, instead, focuses on a variety of
specific products chosen for their waste reduction potential. Rather than characterizing
general material categories, such as paper, the report examines much more specific categories,
such as paper towels and books.
Data on quantities of specific products or packaging can enable policy makers to:
1) apply limited budgetary resources toward determining which products and packaging,
based on their relative contributions to municipal solid waste, to target for waste
prevention and/or recycling;
2) plan and evaluate policies and programs targeting the prevention and/or recycling
of specific wastes by facilitating projections and measurement of policy and
programmatic impacts;
3) motivate the public to prevent and recycle waste by highlighting the amounts of
waste resulting from the disposal of consumer products; and
4) potentially help substantiate pursuing legislative options that target products and
packaging that are particularly large contributors to municipal solid waste.
Before selecting the items for which analyses were conducted for this report, DOS solicited
input from organizations including the U.S. Environmental Protection Agency; INFORM, a
national environmental research organization; the Cornell Waste Management Institute; and
DOS’s citizen Solid Waste Advisory Boards. DOS made the final selection of items to examine,
in consultation with its contracted consultant, Science Applications International Corporation
(SAIC).
The criteria applied for selecting items included:
• Do consumers have choices within the product or packaging category that can impact
waste generation?
• Is there potential for the product or packaging to be diverted for reuse, refurbishing,
donation, or resale via one of the reusable materials matchmaking and donations
programs operating in New York City?
5

Characterization of New York City’s Solid Waste Stream Spring 2000
• Is the item targeted for collection by DOS’s Pilot Special Waste Collection Program —
a self-serve, drop-off program for designated household items, such as motor oil and
batteries? DOS is interested in developing baseline waste generation data to calculate
diversion rates achieved by the collection program.
• Are there potentially untapped opportunities for recycling the product or packaging?
• Is the item a “problem” waste, such as a waste that poses significant litter, recycling or
waste management challenges?
• Do public education, technical assistance, regulatory, or other policy options exist
that could promote or require waste prevention and/or recycling of the particular
product or packaging?
It is anticipated that policy makers in other cities and states may find the data presented in this
report useful, allowing them to identify potential materials to target that will provide the most return
for their waste prevention and recycling efforts and expenditures. Policy makers can apply
similar methodologies and extrapolate from the findings in this report to characterize their own
waste streams. This can facilitate maximizing the productivity of limited resources dedicated for
implementing programs and tracking program results.
Exhibit 1 identifies the materials included in the waste composition analysis, and provides a
rationale, based upon the criteria discussed above, for including each item in the study. Many
of the selected items meet many or all of the selection criteria. Certainly, additional items could
have been examined for DOS by its consultant, but this was not feasible within the budget of
this project. However, the methodologies applied, as presented within the appendices, are
adaptable, such that additional items could be studied in the future.
Exhibit 1. Materials Included in the New York City Waste Composition Analysis
Material Primary Rationale for Inclusion in Analysis
Durable Goods
Furniture and Furnishings Can be salvaged for repair and reuse.
Major Appliances Can be salvaged for reuse or recycled.
Small Appliances Can be salvaged for reuse or recycled.
Carpets and Rugs Can be reused or recycled.
Clothing and Footwear Can be reused or recycled.
Towels, Sheets, Pillowcases Can be reused or recycled.
Vehicle-Associated Products
Scrap Tires Useful life can be extended through inspection, maintenance, and repair;
can be retreaded, recycled, or used for refuse-derived fuel.
Air Filters Reusable filters can replace single-use filters; metal components can be recycled.
Oil Filters Targeted by DOS Pilot Special Waste Collection Program; oil can be drained
and recycled; filters can recycled.
Lead-Acid Batteries Targeted by DOS Pilot Special Waste Collection Program; lead and other
components can be recycled.
6

Characterization of New York City’s Solid Waste Stream Spring 2000
Exhibit 1 (continued). Materials Included in the New York City Waste Composition Analysis
Material Primary Rationale for Inclusion in Analysis
Motor Oil Longer-life synthetic oil can replace standard motor oil; oil can be recycled.
Personal Items
Disposable Razors Alternatives can be promoted, such as durable, reusable razors with
replaceable blades. Packaging can be reduced.
Shaving Cream Cans Alternatives can be promoted that generate less waste, such as using reusable
shaving brush and shaving soap.
Toothbrushes Alternatives can be promoted that generate less waste, such as reusable
toothbrushes with disposable heads; packaging can be reduced.
Disposable Diapers Alternatives can be promoted that generate less waste, such as cloth diapers.
Containers
Non-Deposit Beverage Can be recycled; could potentially be included in an expanded NY State
Containers Redeemable Beverage Container Act.
Clear HDPE Jugs Can be replaced by bulk milk dispensers in institutions and businesses; can
be recycled. Refillable jugs can be encouraged.
Milk Cartons Can be recycled. Alternatives, such as plastic or glass jugs, can be encouraged.
Aerosol Cans Can be recycled in scrap metal or metal container collection programs.
Bag-in-Boxes Can be replaced by refillable beverage dispensing systems; can be recycled.
Folding Cartons Can be recycled.
Paper Goods
Office Paper Can be reduced or recycled.
Newspapers Can be reduced or recycled.
Magazines Can sometimes be donated and can be recycled.
Books Can be donated or recycled.
Telephone Directories Over-distribution can be minimized, particularly by apartment and office
buildings specifying quantities requested to coincide with demand;
can be recycled.
Third-Class Mail Can develop programs to reduce unwanted direct mail; can be recycled.
Paper Towels Alternatives can be promoted that reduce waste, such as installing hot air
hand dryers in public restrooms or using linen hand towels.
Paper Plates and Cups Alternatives can be promoted that generate less waste, such as reusable
plates and refillable cups.
Miscellaneous Products
Polybags from Dry Cleaners Reusable dry cleaning bags can be promoted; used single-use polybags can
be accepted from dry cleaners’ customers and recycled by the dry cleaners.
Hangers from Dry Cleaners Dry cleaners can take back hangers from their
customers for reuse. Household Batteries Targeted by DOS Pilot Special
Waste Collection Program.
Thermostats Targeted by DOS Pilot Special Waste Collection Program.
7

Characterization of New York City’s Solid Waste Stream Spring 2000
Exhibit 1 (continued). Materials Included in the New York City Waste Composition Analysis
Material Primary Rationale for Inclusion in Analysis
Latex Paint Targeted by DOS Pilot Special Waste Collection Program.
Fluorescent Tubes Targeted by DOS Pilot Special Waste Collection Program
Ballasts Can be recycled.
Incandescent Bulbs Alternatives can be promoted that generate less waste, such as longer life
bulbs.
Pallets/Wood Packaging Can be reused, refurbished, or recycled, including via a reusable materials
match making program.
Food Wastes Can be composted. Programs can be established to donate usable food
products to food banks.
Plastic Wraps Can be reduced or recycled.
Paper and Plastic Grocery Can be targeted for waste prevention, such as by promoting reusable bags
Bags or reusing paper or plastic bags.
Plastic Plates and Cups Alternatives can be identified that generate less waste, such as reusable
plates and refillable mugs and cups.
Single-Use Cameras Durable, reusable cameras can be promoted; single-use cameras can be
recycled. Users can be encouraged to return cameras to a photofinishing lab
that participates in a camera recycling program.
Toilets Can be recycled.
Writing Instruments Alternatives can be promoted that generate less waste, such as refillable pens.
Trash Bags Purchase recycled-content bags; purchase appropriate size and strength so that
bags are not discarded only partially full or double bagged due to breakage.
This report investigates materials generated by New York City residents, commercial and
industrial businesses, and institutions including government agencies and other not-for-profit
organizations. Residential and institutional waste is collected by New York City Department of
Sanitation personnel and disposed at the Fresh Kills landfill on Staten Island. Commercial and
industrial wastes are collected by private carters, and virtually all is disposed outside of New
York City. Many of the items are generated by all three sources (residential, institutional, and
commercial), and cannot easily be attributed to one primary source. The large portion of the
wastes are generated by residents and institutions, and as discussed below (see section titled
“Summary of Results”), are significant components of the DOS-collected waste stream.
The municipal solid waste (MSW) waste stream includes wastes from residential, institutional,
and commercial sources. Residential wastes are generated by single and multi-family homes.
Commercial sources of waste include office buildings, retail and wholesale establishments,
and restaurants. Institutional sources are schools, libraries, hospitals, and prisons, as well as
some industrial sites where packaging is generated. MSW does not include the process wastes
from these industrial sites. Residential wastes are estimated to consistute 55 to 65 percent
of total MSW generation nationally. Commercial and institutional wastes constitute between
35 and 45 percent.
8

Characterization of New York City’s Solid Waste Stream Spring 2000
MSW includes wastes such as durable goods, nondurable goods, containers and packaging,
food scraps, yard trimmings, and miscellaneous inorganic wastes. Examples of wastes from
these categories include appliances, automobile tires, newspapers, clothing, boxes, disposable
tableware, office and classroom paper, wood pallets, and cafeteria wastes. MSW does not
include wastes from other sources, such as construction and demolition debris, automobile
bodies, municipal sludges, combustion ash, and industrial process wastes that might also be
disposed in municipal waste landfills and incinerators.1
Research Methodologies
Rather than conducting a traditional waste sort, DOS’s approach to obtaining data was to
pursue a much more cost effective strategy to approximate the findings that would be obtained
from a waste sort. DOS determined that in order for a “waste sort” to yield credible data, an
extremely extensive and expensive study would need to be conducted in order to account for
seasonal fluctuations, demographic variables, and other confounding factors. For a city with a
population of over seven million, this type of study could cost in excess of $1 million.
Instead, the approach that was used involved extrapolation from a 1989 waste composition
consultant study performed for DOS; per capita sales information obtained from industry and
trade associations; existing waste composition data obtained from a variety of federal, state and
local sources; and New York City demographic information.
Since the majority of the materials presented in this report had not been quantified by other
studies, it was necessary to develop unique methodologies for quantifying the amounts present
in New York City’s waste stream. Different types of data exist for different materials. For this
reason, the research methodologies used in this study vary by material.
Several materials were quantified by extrapolating from national data included in U.S. EPA’s
Characterization of Municipal Solid Waste in the United States: 1995 Update. This document
provided national generation and disposal figures, as well as recycling rates for each material.
The method used by Franklin & Associates to determine the disposal figures is a “materials flow
methodology.” This is based on production data (by weight) for materials and products in the
waste stream, with adjustments made for imports, exports, and product lifespans. Quantities in
New York City’s waste stream were estimated using the percentage of the U.S. population
residing in New York City. The following basic assumptions were used throughout the analyses:
• The U.S. population is 248 million people;
• The New York City population is 2.9% of the U.S. population, or 7.3 million people;
• The New York City population including commuters and tourists is 8.5 million people; and
• There are 2.8 million households in New York City.
Quantification of most of the wastes relied on data provided by industry sources, trade
associations, retail outlets in New York City, the Department of Commerce, and other national
data sources. Information obtained for the study includes production figures, sales figures,
per capita usage figures, market share, and other similar data. All final figures are presented by
9

Characterization of New York City’s Solid Waste Stream Spring 2000
weight (tons) to facilitate comparisons among materials and determine the percentage of the
total waste stream that each represents.
Subsequent to review of draft research methodologies and findings by the NYC Department of
Sanitation, all analyses were submitted for peer review by trade group representatives, industry
representatives and other data/information sources; other consultants familiar with the topic,
such as Franklin & Associates, Inc., which developed EPA’s Characterization of Municipal Solid
Waste in the United States: 1995 Update; and staff at the U.S. EPA. Peer reviewers were asked to
assess the appropriateness of each methodology, assumptions made, data used in calculations,
and conclusions reached.
Summary of Results
For this report, 46 materials were characterized. Detailed analyses for each material are
presented in Appendices 1-41. (There are fewer appendices than materials studied because
several of the items were grouped together within appendices). These analyses describe each
item investigated, and present the methodology used to estimate quantities. Each appendix
presents the assumptions, the calculations used to determine the final estimate, and the
limitations of the research findings. Exhibit 2 provides a summary of the overall results for
each material.
The findings indicate that, after recycling, several materials examined in this study contribute a
conservative estimate of more than 100,000 tons each to the New York City waste stream, and
may contribute as much as 400,000 tons. In order of descending quantity, these are:
• Food waste,
• Pallets/wood packaging,
• Furniture and furnishings,
• Newspaper,
• Non-deposit beverage containers,
• Folding cartons,
• Plastic wraps,
• Clothing and footwear,
• Office paper,
• Third-class mail, and
• Disposable diapers.
Even with recycling programs in place, each of these eleven materials contribute between
100,000 tons and more than 400,000 tons to New York City’s annual solid waste stream.
Food waste, the largest percentage quantity of materials analyzed, account for the equivalent of
one month’s worth of waste going to the Fresh Kills Landfill.5 Together these eleven largest
10
Characterization of New York City’s Solid Waste Stream Spring 2000
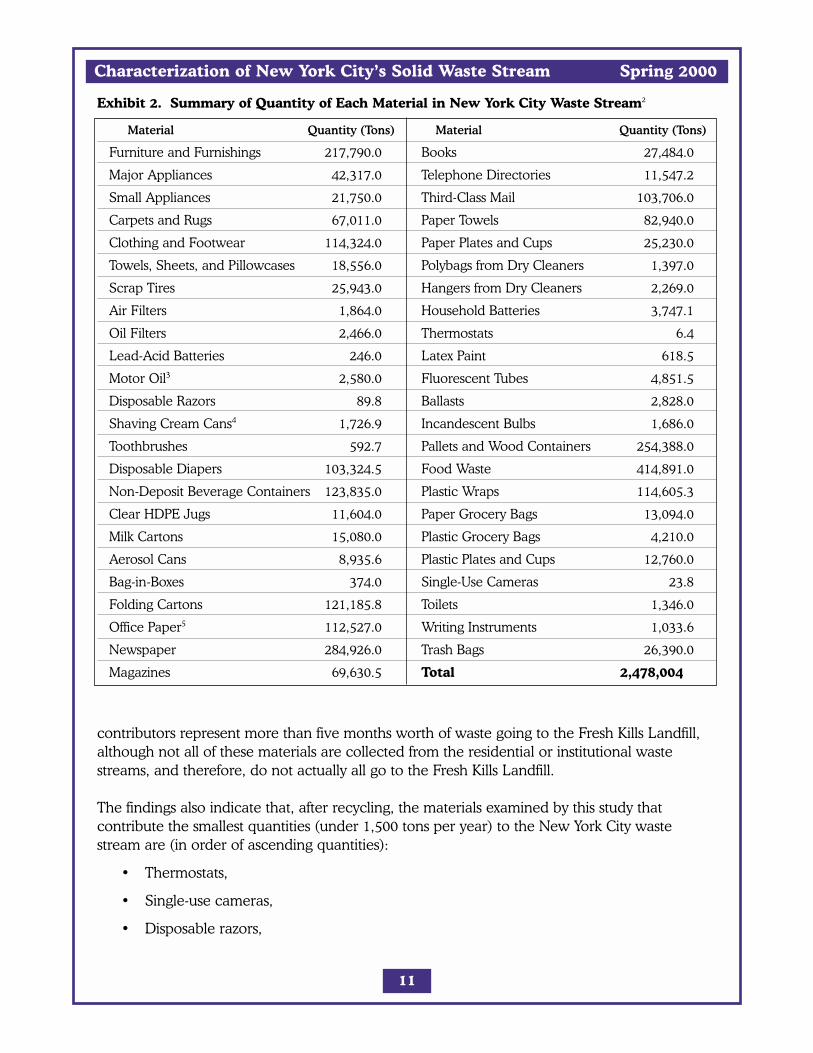
Exhibit 2. Summary of Quantity of Each Material in New York City Waste Stream2
Material Quantity (Tons) Material Quantity (Tons)
Furniture and Furnishings 217,790.0 Books 27,484.0
Major Appliances 42,317.0 Telephone Directories 11,547.2
Small Appliances 21,750.0 Third-Class Mail 103,706.0
Carpets and Rugs 67,011.0 Paper Towels 82,940.0
Clothing and Footwear 114,324.0 Paper Plates and Cups 25,230.0
Towels, Sheets, and Pillowcases 18,556.0 Polybags from Dry Cleaners 1,397.0
Scrap Tires 25,943.0 Hangers from Dry Cleaners 2,269.0
Air Filters 1,864.0 Household Batteries 3,747.1
Oil Filters 2,466.0 Thermostats 6.4
Lead-Acid Batteries 246.0 Latex Paint 618.5
Motor Oil3 2,580.0 Fluorescent Tubes 4,851.5
Disposable Razors 89.8 Ballasts 2,828.0
Shaving Cream Cans4 1,726.9 Incandescent Bulbs 1,686.0
Toothbrushes 592.7 Pallets and Wood Containers 254,388.0
Disposable Diapers 103,324.5 Food Waste 414,891.0
Non-Deposit Beverage Containers 123,835.0 Plastic Wraps 114,605.3
Clear HDPE Jugs 11,604.0 Paper Grocery Bags 13,094.0
Milk Cartons 15,080.0 Plastic Grocery Bags 4,210.0
Aerosol Cans 8,935.6 Plastic Plates and Cups 12,760.0
Bag-in-Boxes 374.0 Single-Use Cameras 23.8
Folding Cartons 121,185.8 Toilets 1,346.0
Office Paper5 112,527.0 Writing Instruments 1,033.6
Newspaper 284,926.0 Trash Bags 26,390.0
Magazines 69,630.5 Total 2,478,004
contributors represent more than five months worth of waste going to the Fresh Kills Landfill,
although not all of these materials are collected from the residential or institutional waste
streams, and therefore, do not actually all go to the Fresh Kills Landfill.
The findings also indicate that, after recycling, the materials examined by this study that
contribute the smallest quantities (under 1,500 tons per year) to the New York City waste
stream are (in order of ascending quantities):
• Thermostats,
• Single-use cameras,
• Disposable razors,
11

Characterization of New York City’s Solid Waste Stream Spring 2000
12
• Lead-acid batteries;
• Bag-in-boxes;
• Toothbrushes;
• Latex paint;
• Writing Instruments;
• Toilets; and
• Polybags from Drycleaning.
Thermostats and toilets contribute relatively little to the waste stream because their average
lifespans are longer than most other products analyzed in this report, many thermostats lasting
for more than thirty years and many toilets lasting more than 20 years. Single-use cameras
contribute little because they have a high recycling rate. This is based on an industry-developed
infrastructure for returning cameras to the manufacturer. Lead-acid batteries also contribute
little to the waste stream because they have a high recycling rate, in part resulting from: the
high value of lead as a recyclable commodity; New York State legislation that places a surcharge
on new batteries sold without the return of a used battery; and New York City’s prohibition of
disposal of lead-acid batteries in the residential waste stream. Disposable razors, toothbrushes,
and writing instruments are small and lightweight, creating relatively little waste. Bag-in-boxes
offer a product in concentrated form. This allows for the distribution of a large quantity of
beverages to be distributed in very little packaging compared to bottles or cans of beverages.
Polybags are an extremely lightweight product, contributing little to the weight of the waste
stream. Together these ten items represent the equivalent of less than one day’s waste going
to the Fresh Kills Landfill.
The total quantity of waste generated annually from all 46 materials represents 38 percent of
New York City’s total annual solid waste stream of 6,517,650 tons7 and is equivalent to
62 percent of the amount of waste going to the Fresh Kills Landfill. However, not all of the
waste quantified in this study is collected by DOS and disposed at Fresh Kills. Approximately
3,983,610 tons of the total New York City waste stream, composed of residential and institutional
wastes, goes to the Fresh Kills Landfill each year, while the remaining 2,534,040 tons, composed
of commercial wastes, are sent to transfer stations for export to other landfills.
DOS-collected waste is approximately 60 percent of the total municipal solid waste generated
annually in New York City. If the waste characterized in this report were representative of the
total distribution of waste from residential, institution, and commercial sources, then 60 percent,
or 1,486,826 tons, of this waste could be attributed to residential and institutional sources.
Exhibit 3 shows the percentage that each of the six categories of materials analyzed contributes
to the total New York City solid waste stream. Exhibits 4 through 9 show the breakdown by
material within each category.

Characterization of New York City’s Solid Waste Stream Spring 2000
13
Miscellaneous
Products 13.2%
Paper Goods 11.0%
Vehicle-Associated
Products 0.5%
Containers 4.3%
Personal Items 1.6%
Durable Goods 7.6%
Other 62.0%
Furniture and
Furnishings 45.2%
Clothing and
Footwear 23.7%Carpets and Rugs 13.9%
Small Appliances 4.5%
Major Appliances 8.8%Towels, Sheets,
Pillowcases 3.9%
Lead-Acid Batteries 0.7%
Oil Filters 7.5%
Air Filters 5.6%%
Scrap Tires 78.4%
Motor Oil 7.8%
Exhibit 3. Waste Stream Composition Analysis - Major Categories
(Percent of Total NYC Waste Stream)
Exhibit 4. Durable Goods
(Percent of Total NYC Waste Stream = 7.4%)
Exhibit 5. Vehicle-Associated Products
(Percent of Total NYC Waste Stream = 0.5%)

Characterization of New York City’s Solid Waste Stream Spring 2000
14
Disposable
Diapers 97.7%
Toothbrushes 0.6%
Shaving Cream Cans 1.6%
Disposable Razors 0.1%
Non-Deposit Beverage
Containers 44.1%
Folding
Cartons 43.1%Bag-in-Boxes 0.1%
Aerosol Cans 3.2%
Milk Cartons 5.4%
Clear HDPE Jugs 4.1%
Newspaper 39.7%
Third-Class Mail 14.4%
Office Paper 15.7%
Paper Plates and Cups 3.5%
Paper Towels 11.6%
Telephone Directories 1.6%
Books 3.8%
Magazines 9.7%
Exhibit 6. Personal Items
(Percent of Total NYC Waste Stream = 1.6%)
Exhibit 7. Containers
(Percent of Total NYC Waste Stream = 4.3%)
Exhibit 8. Paper Goods
(Percent of Total NYC Waste Stream = 11.0%)

Characterization of New York City’s Solid Waste Stream Spring 2000
15
Incandescent Bulbs 0.2%
Writing Instruments 0.1%
Trash Bags 3.1%
Ballasts 0.3% Paper Grocery Bags 1.5%
Plastic Wrap 13.3%
Plastic Grocery Bags 0.5%
Plastic Plates and Cups 1.5%
Single-Use Cameras 0.0%
Pallets 29.6%
Fluorescent Tubes 0.6%
Thermostats 0.0%
Latex Paint 0.1%
Household Batteries 0.4%
Polybags 0.2%
Hangers 0.3%
Toilets 0.2%
Food Waste 48.2%
Exhibit 9. Miscellaneous Products
(Percent of Total NYC Waste Stream = 13.2%)
Conclusions
Although the waste characterization estimates presented in this report are deemed reasonably
representative of the quantities of each material found in the New York City solid waste stream,
they have certain limitations that should be recognized. Many are based on national data,
from which New York City data are extrapolated. The use of many products and materials
within New York City may not be representative of national usage; therefore, estimates based
on national data may vary in accuracy, depending on the product and its relative usage in
New York City. For example, New York City’s office paper generation may be much higher
than national per capita figures due to the large business and financial districts in the City.
In addition, data from one or more manufacturers or suppliers were often used. Therefore,
the accuracy of the findings in some cases is a function of the reliability of the data provided by
these businesses, and the extent to which the data they provided are representative of product
sales in New York City. Additional limitations, specific to each material, are discussed in the
appendices.
Despite the recognized limitations, the study indicates that although the research methodology
may not yield as precise, quantitative findings as a more conventional “waste sort” (although
the precision of waste sorts are limited by their own set of confounding factors), the selected
approach provides reasonably credible data, and adaptable methodologies of value to DOS,
and potentially to solid waste planners and others throughout the nation.

Characterization of New York City’s Solid Waste Stream Spring 2000
DOS may in the future be interested in quantifying waste contributed by other products and
packaging. Likewise, other jurisdictions may be interested in adapting the research methodologies
applied in this study, or in studying additional items. Therefore, some lessons drawn from this
exercise include the following:
Time Intensive. Although the type of waste quantification study conducted is a
less ambitious endeavor than a full-fledged, statistically significant physical waste
sort, significant time and energy was devoted to conducting the research. DOS’s
consultant, SAIC, devoted over 400 hours to conducting the research and writing
the report, assisted by an additional 300 hours provided by a DOS graduate
student intern. DOS staff also dedicated significant time to review and comment
on the report, as did the pro bono peer reviewers. Labor time included:
developing the research and quantification methodologies appropriate for each
item; identifying the appropriate information sources; contacting these sources
by telephone and/or fax to explain the purpose of the research, sometimes in
great detail as necessary to gain their trust; following up with information
sources to ensure that information promised was provided and in sufficient
detail; applying the research findings to the quantification methodology; seeking
input and/or confirmation from information sources and peer reviewers,
including DOS staff, regarding the accuracy of the calculations; and writing the
draft and final reports. Since the research required significant telephone out-
reach, the research was expedited to the extent that consultant staff and the
intern assigned to the project were available full-time to receive return
phone calls.
Funds Required. Necessary funding for the research was fairly minimal.
The consultant’s costs were funded in their entirety by an EPA grant of $32,677,
plus in-kind labor provided by DOS staff and some additional funding. Other
jurisdictions could presumably quantify the same items examined in this study
in-house with minimal labor by adapting the methodologies and data utilized for
this DOS project. The methodologies could also likely be adapted to study
additional/alternative items, with the number of items studied adjusted
depending upon the availability of labor or funding to contract the work.
Importance of Review by Peers and Information Providers. An important
element of the project research was the effort to request the information
providers and peer reviewers, discussed above, to review the calculations
and methodologies for the purpose of commenting on the validity of the
methodologies, accuracy of the data applied, and the resulting findings. This
helped to minimize the likelihood of errors, and enhance the credibility of the
research and findings. The research team received very favorable feedback and
reactions to the draft reports, as well as useful input that was applied in refining
the quantification methodologies and findings.
16

Characterization of New York City’s Solid Waste Stream Spring 2000
Utility of the findings. Although each item examined in this study may
contribute relatively small percentages to New York City’s total waste stream,
in combination they contribute significant quantities. As New York City’s
mandatory, citywide recycling program has become more established, and as
waste prevention is anticipated to receive increasing attention in the context of
the pending closure of the City’s one remaining landfill by the end of 2001, this
study is invaluable for selecting which additional items to target for waste pre-
vention and recycling, including items that may be viewed as “problem wastes”,
and for projecting and measuring the impact of waste prevention and recycling
initiatives undertaken by DOS and other entities in New York City. By looking
beyond broad material categories, and focusing on specific products and pack-
aging in the City’s waste stream, the study is of utmost importance for helping
DOS to prioritize its limited resources in pursuing its waste prevention and
recycling objectives. Furthermore, due to the adaptability of the findings to
other jurisdictions, the findings should prove valuable for assisting other
jurisdictions in meeting similar objectives.
17

Characterization of New York City’s Solid Waste Stream Spring 2000
Exhibit 10. Peer Review List
The following is a list of reviewers asked to provide comments on each of the product-specific appen-
dices for the NYC waste characterization report. At least one person was asked to review each appendix
and, in some cases, two or three people reviewed the information. An asterisk (*) indicates that the
reviewer received a copy of the appendix but did not respond with any comments. A double asterisk
(**) indicates that the reviewer responded with comments and/or corrections, which were incorporated
into the appendix.
1) furniture and furnishings - Marge Franklin, Franklin & Associates (913-649-2225)**
2) major and small appliances - Marge Franklin, Franklin & Associates (913-649-2225)**
3) carpets and rugs - Marge Franklin, Franklin & Associates (913-649-2225)**
4) clothing and footwear - Marge Franklin, Franklin & Associates (913-649-2225)**
5) towels, sheets, pillowcases - Marge Franklin, Franklin & Associates (913-649-2225)**
6) scrap tires - John Serumgard, Scrap Tire Management Council/National Association of
Rubber Manufacturers (202-682-4880)**
7) air filters - Allen Bricker, Baldwin Filters (800-828-4453 x292)**
8) oil filters - Greg Griggs, Filter Manufacturers Council (919-549-4800)**
9) lead-acid batteries - Katie Chiampou, Wienberg, Bergson, & Newman (202-962-8599)**
Saskia Mooney, Wienberg, Bergson, & Newman (202-962-8595)**
10) motor oil - Brad Jones, API (202-682-8343)**
11) disposable razors - Mark Sullivan, BIC (203-783-2237)**
12) shaving cream cans - Mike Thomspon/Joe Yost, CSMA (202-872-8110)**
Jim Kruk, Pfizer (212-573-3125)**
13) toothbrushes - American Dental Association
14) disposable diapers - Marge Franklin, Franklin & Associates (913-649-2225)**
15) non-deposit beverage containers - Andrea Foote, Beverage World (212-822-5930)*
Pat Franklin, Container Recycling Institute **
16) clear HDPE jugs - Marge Franklin, Franklin & Associates (913-649-2225)*
17) milk cartons - Marge Franklin, Franklin & Associates (913-649-2225)*
18) aerosol cans - Mike Thompson/Joe Yost, CSMA (202-872-8110)** Mary Beth Rizzuto,
Steel Recycling Institute (800-876-7274)**
19) bag-in-box - Gina Concepcione, Coke (800-359-6518)*
Peter Wilcox, Pepsi (914-767-78813)*
20) folding cartons - Marge Franklin, Franklin & Associates (913-649-2225)**
Dave Stuck, AFPA (202-463-2700)*
21) office paper - Marge Franklin, Franklin & Associates (913-649-2225)**
Dave Stuck, AFPA (202-463-2700)*
22) newspaper - Marge Franklin, Franklin & Associates (913-649-2225)**
Dave Stuck, AFPA (202-463-2700)*
23) magazines - Marge Franklin, Franklin & Associates (913-649-2225)**
Dave Stuck, AFPA (202-463-2700)*
18
* = appendix sent, but reviewer did not respond ** = reviewer has commented on appendix

Characterization of New York City’s Solid Waste Stream Spring 2000
Exhibit 10 (continued). Peer Review List
24) books - Marge Franklin, Franklin & Associates (913-649-2225)**
Dave Stuck, AFPA (202-463-2700)*
25) telephone directories - Marge Franklin, Franklin & Associates (913-649-2225)**
John Halenar, NYNEX (212-643-4919)**
26) third-class mail - Marge Franklin, Franklin & Associates (913-649-2225)**
Charles Vidich, U.S. Postal Service (203-285-4260)
27) paper towels - Marge Franklin, Franklin & Associates (913-649-2225)**
Dave Stuck, AFPA (202-463-2700)*
28) paper plates and cups - Marge Franklin, Franklin & Associates (913-649-2225)**
29) polybags - Paul Ligon, Tellus Institute (617-266-5400)**
Bill Cites, Neighborhood Cleaners Association (212-967-3002)*
30) hangers - Paul Ligon, Tellus Institute (617-266-5400)**
Bill Cites, Neighborhood Cleaners Association (212-967-3002)*
31) household batteries - Charles Monohan, Panasonic (201-392-6464)**
Ray Balfour, Rayovac and NEMA (608-275-4584)**
Saskia Mooney, Wienberg, Bergson, & Newman (202-962-8595)**
32) thermostats - Ellie Ruposa, Honeywell (718-553-5926)*
Greg Swain, Honeywell*
Nancy Jansen, Honeywell (612-954-6865)**
33) latex paint - Kevin Sall, National Paint and Coatings Association (202-462-6272)**
34) fluorescent tubes - Ms. Ipsata Ganguli, Alta Resources**
Rick Erdheim, NEMA**
Stephen Saslafsky, FulCircle Ballast Recyclers (718-328-4667)**
35) ballasts - Ms. Ipsata Ganguli, Alta Resources**
Rick Erdheim, NEMA**
Stephen Saslafsky, FulCircle Ballast Recyclers (718-328-4667)**
36) incandescent bulbs - Rick Erdheim, NEMA**
37) pallets/wood packaging - Sam Baker, National Wooden Pallet and Container
Association (703- 527-7667)**
Marge Franklin, Franklin & Associates (913-649-2225)**
38) food waste - Marge Franklin, Franklin & Associates (913-649-2225)**
39) plastic wraps - Marge Franklin, Franklin & Associates (913-649-2225)**
40 )paper grocery bags - Dave Stuck, AFPA (202-463-2700)**
41) plastic grocery bags - Bob Householder, Sonoco Products (803-383-3213)**
42) plastic plates and cups - Marge Franklin, Franklin & Associates (913-649-2225)**
43) single-use cameras - Sarah Fogler, Kodak (716-724-4080)**
Connie, Photo Marketing Association (517-788-8100)*
44) toilets - Warren Liebold, NYS Dept. of Environmental Conservation (718-595-6656)**
45) writing instruments - Mark Sullivan, BIC (203-783-2237)**
46) trash bags - Marge Franklin, Franklin & Associates (913-649-2225)**
19
* = appendix sent, but reviewer did not respond ** = reviewer has commented on appendix

Characterization of New York City’s Solid Waste Stream Spring 2000
ENDNOTES
1 U.S. EPA, Characterization of Municipal Solid Waste in the United States: 1995 Update.2 Estimates calculated as ranges in the appendices are presented here as range midpoints of low range and high range estimates,
unless otherwise indicated.3 This figure is the estimated quantity of used motor oil illegally disposed in New York City. It does not include the quantity of oil
managed through recycling or legal disposal.4 This figure is not calculated into the total for this table because shaving cream cans are already included in the figure for aerosol
cans.5 The City of New York disposes of approximately 13,000 tons per day of residential and institutional waste at the Fresh Kills
Landfill in Staten Island, NY.6 New York City Department of Sanitation, “Comprehensive Solid Waste Management Plan: Final Update and Plan Modification,”
February 15, 1996. Figure includes residential, commercial, and institutional wastes collected by DOS and private carters for
disposal at Fresh Kills and other solid waste facilities after recovery of materials for recycling. It also includes construction and
demolition debris.7 U.S. EPA, Characterization of Municipal Solid Waste in the United States: 1995 Update, Tables 13 and 14.8 New York City Department of Planning, 1995 census data.9 U.S. EPA, Characterization of Municipal Solid Waste in the United States: 1995 Update, Table 12.
10 U.S. EPA, Characterization of Municipal Solid Waste in the United States: 1995 Update, Table 13.11 U.S. EPA, Characterization of Municipal Solid Waste in the United States: 1995 Update, Tables 13 and 14.12 Ibid.13 New York City Department of Planning, 1995 census data.14 U.S. EPA, Characterization of Municipal Solid Waste in the United States: 1995 Update, Table 12.15 Ibid, Table 13.16 New York City Department of Planning, 1995 census data.17 U.S. EPA, Characterization of Municipal Solid Waste in the United States: 1995 Update, Table 12.18 Ibid, Table 13.
20

Characterization of New York City’s Solid Waste Stream Spring 2000
APPENDIX 1
New York City Waste Stream Composition Analysis:
Furniture and Furnishings
Introduction
This analysis estimates the quantity, in tons, of used furniture and furnishings in the New York
City waste stream. Furniture and furnishings refers to a broad range of household and
commercial items, including tables, chairs, desks, cabinets, and shelving. The primary material
component of this category is wood, although a substantial quantity of ferrous metals also may
be found in furniture and furnishings. Additionally, glass and plastic also will be found in notable
quantities. EPA’s Characterization of Municipal Solid Waste in the United States: 1995 Update lists
the recycling rate for furniture as negligible. Nationwide, furniture and furnishings comprise
approximately 4.7 percent of the total MSW waste stream.7
The exact quantity of furniture and furnishings disposed in New York City is not available; therefore,
estimates were developed based on data obtained from previously conducted studies.
Methodology
The estimates presented in this study were derived from national diposal figures and recycling
rates for furniture and furnishings. The national estimates are presented in EPA’s Characterization
of Municipal Solid Waste in the United States: 1995 Update and are based on data collected by
Franklin & Associates. The method used by Franklin & Associates to determine the disposal
figures is a “materials flow methodology.” This is based on production data (by weight) for
materials and products in the waste stream, with adjustments for imports, exports, and product
lifespans.
The ratio of U.S. population to New York City population is applied to the national estimates
of the quantity of furniture and furnishings disposed to generate an estimate for New York City.
This estimate is then adjusted to account for recycling.
Assumptions
• 248.7 million people in the U.S. in 1990.
• 7.3 million people living in New York City in 1990.8
• 7,510,000 tons of furniture and furnishings generated in the U.S. municipal waste
stream in 1994.9
• The recycling rate for furniture and furnishings is assumed to be 0 percent.10
Calculations
• 248.7 million people in the U.S. divided by 7.3 million people living in New York City =2.9 percent of the total population lives in New York City.
21

Characterization of New York City’s Solid Waste Stream Spring 2000
• 7,510,000 tons of furniture and furnishings generated in the U.S. waste stream x 2.9
percent (NYC population share) = 217,790 tons of furniture and furnishings generated
in the New York City waste stream in 1994.
Results
• A total of approximately 217,790 tons of old furniture and furnishings are generated anddiscarded in New York City each year.
Discussion
The estimates regarding the quantity of furniture and furnishings discarded in the New York
City waste stream each year are based on EPA’s national waste characterization data. Where
previously conducted, up-to-date studies exist, the consultant deemed it more reasonable and
cost-effective to modify that data to New York City rather than duplicate a previous effort.
The estimates presented for furniture and furnishings may slightly overestimate the quantity of
appliances discarded because the figures presented by Franklin & Associates are based on
Department of Commerce production data and may not accurately reflect resale, donation, or
storage of used furniture and furnishings. However, the data used for this report were the
most current available to the consultant and are deemed to be representative of the annual
quantities of furniture and furnishings found in the New York City waste stream each year.
1 U.S. EPA, Characterization of Municipal Solid Waste in the United States: 1995 Update, Tables 13 and 14.2 New York City Department of Planning, 1995 census data.3 U.S. EPA, Characterization of Municipal Solid Waste in the United States: 1995 Update, Table 12.4 U.S. EPA, Characterization of Municipal Solid Waste in the United States: 1995 Update, Table 13.
APPENDIX 2
New York City Waste Stream Composition Analysis:
Major and Small Appliances
Introduction
This analysis estimates the quantity, in tons, of major appliances and small appliances in the
New York City waste stream. Major appliances, or “white goods” typically include such
household and commercial appliances as refrigerators, stoves, and washer/dryer units. Major
appliances generally consist primarily of steel components, but also may have substantial
quantities of plastic, glass, and rubber. The high steel content, however, results in a high
recycling rate, approximately 56.7 percent, by weight, according to the Steel Recycling
Institute. Nationwide, major appliances comprise approximately 0.9 percent of the total
MSW waste stream.11
22

Characterization of New York City’s Solid Waste Stream Spring 2000
Small appliances typically refers to household items such as hair dryers, toasters and toaster
ovens, and coffee makers, but also may include commercial appliances such as office coffee
makers. Small appliances contain higher percentages of materials other than steel than do
major appliances and thus tend to be recycled at a much lower rate. EPA’s Characterization of
Municipal Solid Waste in the United States: 1995 Update lists the recycling rate for small appliances
as negligible. Small, but still negligible quantities of ferrous metals may be recovered from
small appliances. Nationwide, small appliances comprise approximately 0.5 percent of the
total MSW waste stream.12
The exact quantities of major and small appliances disposed in New York City are not available;
therefore, estimates were developed based on industry sales data obtained from previously
conducted studies.
Methodology
The estimates presented in this study were derived from national disposal figures and recycling
rates for major appliances and small appliances. The national estimates are presented in
EPA’s Characterization of Municipal Solid Waste in the United States: 1995 Update and are based
on data collected by Franklin & Associates. The method used by Franklin & Associates to
determine the disposal figures is a “materials flow methodology.” This is based on production
data (by weight) for materials and products in the waste stream, with adjustments for imports,
exports, and product lifespans.
The ratio of U.S. population to New York City population is applied to the national estimates of
the quantity of major and small appliances disposed to generate an estimate for New York City.
This estimate is then adjusted to account for recycling.
Major Appliances
Assumptions
• 248.7 million people in the U.S. in 1990.
• 7.3 million people living in New York City in 1990.13
• 3,370,000 tons of major appliances generated in the U.S. municipal waste stream in 1994.14
• The recycling rate for major appliances is assumed to be 56.7 percent.15
Calculations
• 248.7 million people in the U.S. divided by 7.3 million people living in
New York City = 2.9 percent of the total population lives in New York City.
• 3,370,000 tons of major appliances generated in the U.S. waste stream x 2.9 percent
(NYC population share) = 97,730 tons of major appliances generated in the
New York City waste stream in 1994.
23

Characterization of New York City’s Solid Waste Stream Spring 2000
• 56.7 percent recycling rate x 97,730 tons of major appliances generated in New York City
= 42,317 tons of major appliances disposed in the New York City waste stream in 1994.
Results
• A total of approximately 97,730 tons of old major appliances are generated in New
York City each year.
• Accounting for recycling, these appliances contribute 42,317 tons a year to the New
York City waste stream.
Small Appliances
Assumptions
• 248.7 million people in the U.S. in 1990.
• 7.3 million people living in New York City in 1990.16
• 750,000 tons of small appliances generated in the U.S. municipal waste stream in 1994.17
• The recycling rate for small appliances is assumed to be negligible.18
Calculations
• 248.7 million people in the U.S. divided by 7.3 million people living in New York City
= 2.9 percent of the total population lives in New York City.
• 750,000 tons of small appliances generated in the U.S. waste stream x 2.9 percent
(NYC population share) = 21,750 tons of small appliances generated in the New York
City waste stream in 1994.
• 0 percent recycling rate x 21,750 tons of small appliances generated in New York City
= 21,750 tons of small appliances disposed in the New York City waste stream in 1994.
Results
• A total of approximately 21,750 tons of small appliances are generated and discarded
in New York City each year.
Discussion
The estimates regarding the quantity of major appliances and small appliances discarded in the
New York City waste stream each year are based on EPA’s national waste characterization data.
Where previously conducted, up-to-date studies exist, the consultant deemed it more reasonable
and cost-effective to modify that data to New York City rather than duplicate a previous effort.
The estimates presented for both major and small appliances may overestimate the quantity
of appliances discarded because the figures presented by Franklin & Associates are based on
Department of Commerce production data and may not accurately reflect resale, donation,
or storage of used appliances. However, the data used for this report were the most current
24

Characterization of New York City’s Solid Waste Stream Spring 2000
available to the consultant and are deemed to be representative of the annual quantities of
major appliances and small appliances found in the New York City waste stream each year.
1 U.S. EPA, Characterization of Municipal Solid Waste in the United States: 1995 Update, Tables 13 and 14.2 Ibid.3 New York City Department of Planning, 1995 census data.4 U.S. EPA, Characterization of Municipal Solid Waste in the United States: 1995 Update, Table 12.5 Ibid, Table 13.6 New York City Department of Planning, 1995 census data.7 U.S. EPA, Characterization of Municipal Solid Waste in the United States: 1995 Update, Table 12.8 Ibid, Table 13.
APPENDIX 3
New York City Waste Stream Composition Analysis:
Carpets and Rugs
Introduction
This analysis estimates the quantity, in tons, of used carpets and rugs in the New York City
waste stream. Carpets and rugs refers to all types of carpets and rugs manufactured from a
range of fibers, including natural fibers (e.g., cotton, wool and silk) and synthetic fibers
(e.g., nylon and PET). The category also includes adhesives, backing and padding/underlay
used with carpets and rugs. EPA’s Characterization of Municipal Solid Waste in the United States:
1995 Update lists the recycling rate for carpets and rugs as 0.4 percent. Nationwide, carpets
and rugs comprise approximately 1.4 percent of the total MSW waste stream.1
The exact quantity of carpets and rugs disposed in New York City is not available; therefore,
estimates were developed based on data obtained from previously conducted studies.
Methodology
The estimates presented in this study were derived from national disposal figures and recycling
rates for carpets and rugs. The national estimates are presented in EPA’s Characterization of
Municipal Solid Waste in the United States: 1995 Update and are based on data collected by
Franklin & Associates. The method used by Franklin & Associates to determine the disposal
figures is a “materials flow methodology.” This is based on production data (by weight) for
materials and products in the waste stream, with adjustments for imports, exports, and product
lifespans.
The ratio of U.S. population to New York City population is applied to the national estimates
of the quantity of carets and rugs disposed to generate an estimate for New York City. This
estimate is then adjusted to account for recycling.
25

Characterization of New York City’s Solid Waste Stream Spring 2000
Assumptions
• 248.7 million people in the U.S. in 1990.
• 7.3 million people living in New York City in 1990.2
• 2,320,000 tons of carpets and rugs generated in the U.S. municipal waste stream in 1994.3
• The recycling rate for carpets a rugs is assumed to be 0.4 percent.4
Calculations
• 248.7 million people in the U.S. divided by 7.3 million people living in New York City
= 2.9 percent of the total population lives in New York City.
• 2,320,000 tons of carpets and rugs generated in the U.S. waste stream x 2.9 percent
(NYC population share) = 67,280 tons of carpets and rugs generated in the New York
City waste stream in 1994.
• 0.4 percent recycling rate x 67,280 tons of carpets and rugs generated in New York City
= 67,011 tons of carpets and rugs disposed in the New York City waste stream in 1994.
Results
• A total of approximately 67,280 tons of old carpets and rugs are generated in
New York City each year.
• Accounting for recycling, these items contribute 67,011 tons a year to the New York City
waste stream.
Discussion
The estimates regarding the quantity of carpets and rugs discarded in the New York City waste
stream each year are based on EPA’s national waste characterization data. Where previously
conducted, up-to-date studies exist, the consultant deemed it more reasonable and cost-
effective to modify that data to New York City rather than duplicate a previous effort.
The estimates presented for carpet and rugs may overestimate the quantity discarded because
the figures are based on industry production data and may not accurately reflect resale,
donation, or storage of used carpets and rugs. However, the data used for this report were the
most current available to the consultant and are deemed to be representative of the annual
quantities of carpets and rugs found in the New York City waste stream each year
1 U.S. EPA, Characterization of Municipal Solid Waste in the United States: 1995 Update, Tables 13 and 14.2 New York City Department of Planning, 1995 census data.3 U.S. EPA, Characterization of Municipal Solid Waste in the United States: 1995 Update, Table 12.4 U.S. EPA, Characterization of Municipal Solid Waste in the United States: 1995 Update, Table 13.
26

Characterization of New York City’s Solid Waste Stream Spring 2000
APPENDIX 4
New York City Waste Stream Composition Analysis:
Clothing and Footwear
Introduction
This analysis estimates the quantity, in tons, of used clothing and footwear in the New York City
waste stream. Clothing and footwear refers to all types of pants, shirts, jackets, sports shoes,
dress shoes and all other articles of clothing. The primary material components of this category
are textiles, rubber, and leather, with small quantities of plastic and metal. EPA’s Characterization
of Municipal Solid Waste in the United States: 1995 Update lists the recycling rate for clothing
and footwear as 12.2 percent. Nationwide, clothing and footwear comprise approximately
2.5 percent of the total MSW waste stream.1
The exact quantity of clothing and footwear disposed in New York City is not available; therefore,
estimates had to be developed based on data obtained from previously conducted studies.
Methodology
The estimates presented in this study were derived from national disposal figures and recycling
rates for clothing and footwear. The national estimates are presented in EPA’s Characterization
of Municipal Solid Waste in the United States: 1995 Update and are based on data collected by
Franklin & Associates. The method used by Franklin & Associates to determine the disposal
figures is a “materials flow methodology.” This is based on production data (by weight) for
materials and products in the waste stream, with adjustments for imports, exports, and product
lifespans.
The ratio of U.S. population to New York City population is applied to the national estimates of
the quantity of clothing and footwear disposed to generate an estimate for New York City. This
estimate is then adjusted to account for recycling.
Assumptions
• 248.7 million people in the U.S. in 1990.
• 7.3 million people living in New York City in 1990.2
• 4,490,000 tons of clothing and footwear generated in the U.S. municipal waste stream
in 1994.3
• The recycling rate for clothing and footwear is assumed to be 12.2 percent.4
Calculations
• 248.7 million people in the U.S. divided by 7.3 million people living in
New York City = 2.9 percent of the total population lives in New York City.
27

Characterization of New York City’s Solid Waste Stream Spring 2000
• 4,490,000 tons of clothing and footwear generated in the U.S. waste stream x
2.9 percent (NYC population share) = 130,210 tons of clothing and footwear
generated in the New York City waste stream in 1994.
• 12.2 percent recycling rate x 130,210 tons of clothing and footwear generated in New
York City = 114,324.4 tons of clothing and footwear disposed in the New York City
waste stream in 1994.
Results
• A total of approximately 130,210 tons of old clothing and footwear are generated in
New York City each year.
• Accounting for recycling, these articles contribute 114,324 tons a year to the New York
City waste stream.
Discussion
The estimates regarding the quantity of clothing and footwear discarded in the New York City
waste stream each year are based on EPA’s national waste characterization data. Where
previously conducted, up-to-date studies exist, the consultant deemed it more reasonable and
cost-effective to modify that data to New York City rather than duplicate
a previous effort.
The estimates presented for clothing and footwear may overestimate the quantity discarded
because the figures presented by Franklin & Associates are based on Department of Commerce
production data and may not accurately reflect resale, donation, or storage of used clothing
and footwear. In addition, the quantity indicated as recovered for recycling consists mainly of
exports of clothing. Recycling and reuse of the clothing would occur outside of the U.S.
However, the data used for this report were the most current available to the consultant and
are deemed to be representative of the annual quantities of clothing and footwear found in the
New York City waste stream each year.
1 U.S. EPA, Characterization of Municipal Solid Waste in the United States: 1995 Update, Tables 16 and 17.2 New York City Department of Planning, 1995 census data.3 U.S. EPA, Characterization of Municipal Solid Waste in the United States: 1995 Update, Table 15.4 U.S. EPA, Characterization of Municipal Solid Waste in the United States: 1995 Update, Table 16.
28

Characterization of New York City’s Solid Waste Stream Spring 2000
APPENDIX 5
New York City Waste Stream Composition Analysis:
Towels, Sheets, Pillowcases
Introduction
This analysis estimates the quantity, in tons, of towels, sheets, and pillowcases in the New York
City waste stream. Towels, sheets, and pillowcases refers to items used in home, commercial, and
institutional settings. EPA’s Characterization of Municipal Solid Waste in the United States: 1995 Update
lists the recycling rate for towels, sheets, and pillowcases as 16.9 percent. Nationwide, towels,
sheets, and pillowcases comprise approximately 0.4 percent of the total MSW waste stream.1
The exact quantity of towels, sheets, and pillowcases disposed in New York City is not available;
therefore, estimates were developed based on data obtained from previously conducted studies.
Methodology
The estimates presented in this study were derived from national disposal figures and recycling
rates for towels, sheets, and pillowcases. The national estimates are presented in EPA’s
Characterization of Municipal Solid Waste in the United States: 1995 Update and are based on
data collected by Franklin & Associates. Generation estimates are based on sales data from
the Department of Commerce along with data on average weights for each type of product.
Adjustments are made for net imports of these products based on Department of Commerce
data. The Council for Textile Recycling reports on recovery of textiles for exports, reprocessing,
and reuse. The ratio of U.S. population to New York City population is applied to the national
estimates of the quantity of towels, sheets, and pillowcases disposed to generate an estimate
for New York City. This estimate is then adjusted to account for recycling.
Assumptions
• 248.7 million people in the U.S. in 1990.
• 7.3 million people living in New York City in 1990.2
• 770,000 tons of towels, sheets, and pillowcases generated in the U.S. municipal waste
stream in 1994.3
• The recycling rate for towels, sheets, and pillowcases is assumed to be 16.9 percent.4
Calculations
• 248.7 million people in the U.S. divided by 7.3 million people living in New York City =
2.9 percent of the total population lives in New York City.
• 770,000 tons of towels, sheets, and pillowcases generated in the U.S. waste stream x
2.9 percent (NYC population share) = 22,330 tons of towels, sheets, and pillowcases
generated in the New York City waste stream in 1994.
29

Characterization of New York City’s Solid Waste Stream Spring 2000
• 16.9 percent recycling rate x 22,330 tons of towels, sheets, and pillowcases generated
in New York City = 18,556 tons of towels, sheets, and pillowcases disposed in the
New York City waste stream in 1994.
Results
• A total of approximately 22,330 tons of old towels, sheets, and pillowcases
are generated in New York City each year.
• Accounting for recycling, these items contribute 18,556 tons per year to the
New York City waste stream.
Discussion
The estimates regarding the quantity of towels, sheets, and pillowcases discarded in the
New York City waste stream each year are based on EPA’s national waste characterization data.
Where previously conducted, up-to-date studies exist, the consultant deemed it more reasonable
and cost-effective to modify that data to New York City rather than duplicate a previous effort.
The data used for this report were the most current available to the consultant and are deemed
to be representative of the annual quantities of towels, sheets, and pillowcases found in the
New York City waste stream each year.
1 U.S. EPA, Characterization of Municipal Solid Waste in the United States: 1995 Update, Tables 16 and 17.2 New York City Department of Planning, 1995 census data.3 U.S. EPA, Characterization of Municipal Solid Waste in the United States: 1995 Update, Table 15.4 U.S. EPA, Characterization of Municipal Solid Waste in the United States: 1995 Update, Table 21.
APPENDIX 6
New York City Waste Stream Composition Analysis:
Vehicle-Associated Products
Introduction
This study provides estimates for the quantities of tires, oil filters, air filters, and lead-acid
batteries in the New York City waste stream. The analyses for each of these vehicle-associated
products are based on estimated generation rates for passenger cars, delivery trucks, tractor
trailers, taxis, buses, and rental cars.
Data are not available to quantify the number of each vehicle-associated product in the waste
stream directly. However, estimates can be calculated using the following data assumptions for
each vehicle type:
• number of vehicles,
30

Characterization of New York City’s Solid Waste Stream Spring 2000
• average number of miles driven per year,
• average lifespan of each product,
• recycling rates for each product, and
• the average weight of each product.
The assumptions for each category were gathered from a wide range of sources, including
national trade associations, product manufacturers, companies operating trucks in New York
City, and State and City agencies. Figure 1 [next page] provides the detailed calculations and
results for each product. The footnotes to Figure 1 explain in detail each data element and the
data source. The following section describes in greater detail each of the data assumptions
used in this analysis. The third section presents in the methodology and provides an example
of how the data elements are used in the methodology. The final section provides a discussion
of the findings.
Assumptions
Number of Vehicles
The number of vehicles in each class is taken from New York State Department of Motor Vehicle
registration data for the number of registered vehicles in New York City in 1993, the most recent
year for which data are available. Data for delivery trucks and tractor trailers are aggregated in
the registration figures. Based on discussions with companies operating trucks in the New York
City area, a ratio of 75:25 was used to disaggregate the registration data for trucks.
Multiplier
The multiplier is the average number of each product that is consumed by each class of vehicle
over a year. The multiplier for tires, oil filters and air filters is the lifespan of the product divided
by the average number of miles driven per year. For tires, this number is then adjusted for the
number of tires on the vehicle. The multiplier for batteries is based on figures provided by the
Battery Council International, indicating a lifespan for lead-acid batteries in the Northeast of
approximately four years.
Annual Generation
Annual generation is the total number of each product that is used each year, prior to recycling.
This figure is the product of the number of vehicles and the multiplier.
Recycling Rate
The recycling rate is simply the percent of the discarded product that is returned to productive
use through recycling. This does not include reuse activities, such as tire swings and playground
equipment. The 12.9 percent recycling rate for tires is taken from U.S. EPA’s Characterization of
Municipal Solid Waste in the United States: 1994 Update. The Scrap Tire Management Council
claims a much higher 55 percent reuse/recycling rate for all discarded tires. The 55 percent
figure includes combustion for energy recovery, which while it is a preferred management
31

Ch
ara
cte
rizatio
n o
f New
Yo
rk C
ity’s S
olid
Waste
Str
eam
Sp
ring 2
00
0
32
Figure 1. New York City Waste Characterization: Vehicle—Associated Product Estimates
Number of Multiplier Annual Recycling Quantity in WeightProduct Vehicle Type Vehicles (1993)1 (# per yr) Generation Rate Waste Stream (in tons)
Tires Passenger Cars and
Light Pickups2 1,783,695 1.13 1,962,065 12.9%4 1,708,958 17,090.5
Delivery Trucks 43,002 2.786 119,474 104,062 2,081.7
Tractor Trailers 10,751 4.508 48,380 42,139 2,107.9
Taxis 37,294 6.3210 235,698 205,293 2,053.
Buses 5,427 4.3511 48,587 42,319 2,116.
Rental Cars 14,246 4.0012 56,984 49,633 496.
Total: 2,471,187 2,152,404 25,943.
Oil Filters Passenger Cars and
Light Pickups 1,783,695 2.113 3,745,828 17.5%14 3,090,308 1,846.15
Delivery Trucks 43,002 3.916 167,683 138,338 104.17
Tractor Trailers 10,751 3.318 35,837 29,565 89.19
Taxis 37,294 21.1 785,660 648,170 387.
Buses 5,427 5.020 27,135 22,386 17.
Rental Cars 14,246 3.313 47,487 39,177 23.
Total: 4,809,629 3,967,944 2,466.
Air Filters Passenger Cars and
Light Pickups 1,783,695 0.921 1,635,054 0.0%22 1,635,054 1,226.23
Delivery Trucks 43,002 1.5 66,374 66,374 207.24
Tractor Trailers 10,751 1.6 17,202 17,202 86.25
Taxis 37,294 5.3 196,415 196,415 147.
Buses 5,427 1.5 8,333 8,333 42.
Rental Cars 14,246 1.7 23,743 23,743 17.8
Total: 1,947,122 1,947,122 1,727.
Lead-Acids Passenger Cars and
Batteries Light Pickups2 1,783,695 0.2526 445,924 94.4%27 24,972 222.28
Delivery Trucks 43,002 0.25 10,751 602 5.
Tractor Trailers 10,751 0.25 2,688 151 4.29
Taxis 37,294 0.5 18,647 1,044 9.
Buses 5,427 0.5 2,714 152 4.
Rental Cars 14,246 0.25 3,562 199 2.
Total: 484,284 27,120 246.

Ch
ara
cte
rizatio
n o
f New
Yo
rk C
ity’s S
olid
Waste
Str
eam
Sp
ring 2
00
0
Notes
1 Number of vehicles is based on 1993 registration figures for New York City provided by the NYS Dept. of Motor Vehicles.
2 Figures for light pickup trucks, light trucks, and medium trucks are aggregated in DMV data. One-third are assumed to be light pickups. Of the remaining two-thirds, 75 percent
are assumed to be delivery trucks and 25 percent are assumed to be tractor trailers.
3 Based on passenger car mileage of 11,000 miles per year in New York City, provided by Geico Insurance, and 40,000 mile lifespan per tire, provided by the Scrap Tire
Management Council.
4 The 12.9% recycling rate is based on Franklin & Associates’ (U.S. EPA) “Characterization of Municipal Solid Waste in the U.S.: 1994 Update.”
5 Weight of 20 pounds per used car and light truck tire provided by National Tire Dealers and Retreaders Association.
6 Average mileage of 7,044 miles per year for delivery trucks provided by UPS; average annual mileage of 30,000 per year for local delivery trucks provided by Blue Ridge Farms,
Inc. Multiplier is based on average of figures, 18,522 miles per year. Assuming six tires per truck.
7 Average weight of used light delivery truck tires is estimated to be 40 pounds, based on information provided by the National Tire Dealers and Retreaders Association.
8 Average mileage for medium truck was not available. Annual replacement rate for tires is assumed to be 25 percent per year. Lifespan of a tractor trailer tire is 350,000 miles,
with several retreads.
9 Average weight of a used medium truck and bus tire is estimated to be 100 pounds, based on information provided by the National Tire Dealers and Retreaders Association.
10 Average New York City taxi mileage of 63,200 per year provided by New York City Taxi Commission.
11 The New York City Transit Authority leases 25,000 tires per year. Estimate includes figures for non-MTA buses, assuming 60,000 miles per year per bus.
12 According to Hertz Corporation, rental cars typically average 20,000 miles prior to being sold and generally are sold after six months of service.
13 Assuming filter change at each oil change, every 5,238 miles for passenger vehicles and 6,000 miles for rental cars, per data provided the American Petroleum Institute
14 Steel Recycling Institute.
15 Two sources (Allied Signal and Filter Recyclers) provided estimates of weight of used oil filters. An average weight of 1.2 pounds for spent oil filters from passenger vehicles is
used in this analysis.
16 Based on average of UPS estimates of oil filter change every 3,500 miles and Blue Ridge Farms estimates of oil change every 6,000 miles for local delivery trucks.
17 Average weight of spent medium-duty oil filter is 1.5 pounds based on figures provided by Allied Signal and Filter Recyclers.
18 Based on estimated mileage of 50,000 miles per year, provided by Blue Ridge Farms, Inc. and estimated filter change every 13,000 miles, based on average figures provided by
Allied Signal (11,000 miles) and Blue Ridge Farms (15,000 miles).
19 An average weight of 4.9 pounds for a spent heavy duty oil filter, based on estimates provided by Allied Signal and Filter Recyclers, is used in this analysis.
20 Based on total NYC bus fleet of 5,427 buses, average annual mileage for an MTA bus of 30,000 miles per year, and 6,000 miles between oil filter changes. Source: Fax from Joe
Smith, MTA to Susan Williams, Tellus Institute, 3/15/96.
21 Passenger car estimates are based on information provided by Jiffy Lube of air filter change every 12,000 miles. The tractor trailer multiplier of 1.6 was provided by Allen
Bricker of Baldwin Filters.
22 The Steel Recycling Institute indicated that steel from air filters generally is not recycled.
23 Based on estimated weight of 1.5 pounds for spent air filter provided by Purolator and Baldwin Filters.
24 Estimated weight of 6.25 pounds for spent medium-duty air filter is based on midpoint of estimates provided by Baldwin Filters and The Donaldson Company.
25 Estimated weight of 10 pounds for spent heavy-duty air filter is based on midpoint of estimates provides by Baldwin Filters and The Donaldson Company.
26 Lead-acid battery life of approximately four years in New York City, based on information provided by Battery Council International.
27 Based on average of recycling rates (1987-1994) in the National Recycling Rate Study conducted by Battery Council International.
28 Average standard car battery weight of 17.8 pounds provided by Battery Council International.
29 Average truck battery weight of 48.7 pounds provided by Battery Council International.
33

Characterization of New York City’s Solid Waste Stream Spring 2000
option to landfilling, for the purposes of this report is not considered recycling. Therefore, the
more conservative 12.9 percent rate was selected.
The 17.5 percent recycling rate for used oil filters was provided by the Steel Recycling Institute
(SRI). SRI also indicated that steel from spent vehicle air filters generally is not recovered. Thus,
the 0 percent recycling rate is used for air filters. The Battery Council International recommended
that this study use a recycling rate based on the average recycling rate between 1987 and 1994.
This average results in a 94.4 percent recycling rate for lead-acid batteries.
Quantity in the Waste Stream
The quantity of each product in the waste stream is the difference between the quantity of each
product generated each year and the quantity that is estimated to be recycled each year.
Weight
The total number of items in the waste stream does not take into account the difference in size
among products used in different classes of vehicles. This is accounted for by calculating the
weight of each product in the waste stream.
Weights for used tires were provided by the National Tire Dealers and Retreaders Association.
Weights for spent oil filters were provided by a manufacturer, Allied Signal, and Filter
Recyclers, an oil filter recycler outside of Springfield, Illinois.
Weights for spent air filters were provided by three manufacturers, Purolator, Baldwin Filters,
and The Donaldson Company. The manufacturers generally agreed that a weight of 1.5
pounds would be representative for spent oil filters from passenger vehicles and light trucks.
However, a broad range of weights were provided for both medium- and heavy-duty oil filters.
A representative from Donaldson estimated that spent medium-duty filters range in weight
from 4.5 to 12.5 pounds and heavy-duty filters range from 7.5 to 20 pounds. A Baldwin
representative stated that both medium- and heavy-duty filters range from 1 to 9.5 pounds.
Based on these figures, for the purposes of this analysis, light-duty filters are estimated to weigh
1.5 pounds, medium-duty filters are estimated to weigh 6.25 pounds and heavy-duty filters are
estimated to weigh 10 pounds. These figures represent the midpoints in the estimated ranges.
Weights for spent lead-acid batteries are more standard and are provided in the Battery
Council International study.
Methodology
The method used to calculate the number of each vehicle-associated product in the waste
stream is the same for each product and vehicle class. Using this method, the number of
vehicles is first multiplied by the multiplier to calculate the total generation of each product,
on an annual basis. This total then is adjusted to account for recycling and the resulting figure
is the quantity discarded in the New York City waste stream. Next, the weight of the discarded
products is calculated to determine the total weight of products entering the waste stream.
34

Characterization of New York City’s Solid Waste Stream Spring 2000
The example provided in Figure 2 details each
step in the methodology as applied to tires from
passenger vehicles. Each step shown in Figure 2
was followed for each vehicle class under each
product in Figure 1.
Results
The results of the methodology used in this
analysis to estimate the quantity of tires, oil filters,
air filters, and lead-acid batteries generated and
disposed in New York City each year are
summarized in Figure 3.
Because no actual data exist regarding the
number of vehicle-associated products generated
or disposed in New York City, estimates were
developed based on secondary factors, such as
type of vehicles and vehicle use. Data often were
gathered from several sources to form a single
assumption. While this may prove somewhat
confusing, given the broad range of sources that
provided input for this report, we can be
confident that the actual quantity generated
for each product is near the estimates provided
in this report.
The data and results presented here were derived
from the most up-to-date and accessible available
data available to the consultants at this time and
the estimates presented here are deemed to be
representative of annual quantities of vehicle-
associated products likely generated in New York
City in 1996. As recycling infrastructures and
disposal regulations continue to evolve, the estimates provided in this report may have to be
revised as new figures become available from relevant trade associations and manufacturers.
Tires
This study estimates total tire generation in the City at approximately 2.5 million total tires.
Assuming a fairly conservative recycling rate of 12.9 percent, 2.1 million tires will be discarded.
The total weight of tires in the New York waste stream is estimated at 25,943 tons.
The estimates derived in this analysis for scrap tire generation and disposal in New York City
are somewhat more conservative than previous estimates. One previous study prepared for
the New York City Department of Sanitation estimated total generation of passenger tire
35
Assumptions
• 1,783,695 registered passenger vehicles in
NYC in 1993.
• Average passenger vehicle in NYC is driven
11,000 miles per year.
• Average lifespan of a passenger vehicle tire is
40,000 miles.
• Recycling rate for tires is 12.9 percent.
• Used passenger tires weigh 20 pounds.
Calculations
• 1,783,695 vehicles x multiplier
[(11,000/40,000) x 4] = 1,962,065 used tires
in NYC each year.
• 1,962,065 used tires x 12.9% recycling rate =
1,708,958 tires discarded in New York City
each year.
• 1,708,958 discarded tires x 20 pounds per
tire = 34,179,160 pounds of tires discarded
per year.
• 34,179,160 pounds of discarded tires/2000
= 17,090 tons of used passenger tires
discarded each year in New York City.
Figure 2. Application of Methodology to Passenger Car Tires
Tires: 2,152,404 tires or 25,943 tons
Oil Filters: 3,967,944 filters or 2,466 tons
Air Filters: 1,974,716 filters or 1,864 tons
Lead-AcidBatteries: 27,120 batteries or 246 tons
Figure 3. Vehicle-Associated Products
Disposed in NYC Annually

Characterization of New York City’s Solid Waste Stream Spring 2000
equivalents in New York City to be 4.8 million.1
A passenger tire equivalent reflects the total
quantity of materials disposed, rather than the actual number of tires disposed, by converting
all tires to their equivalent number of 20 pound passenger tires. If the figures from this analysis
are converted to passenger tire equivalents, total generation is 3.0 million and disposal is
approximately 2.6 million passenger tire equivalents per year.
Oil Filters
Total oil filter generation in New York City is estimated to be approximately 7.7 million total oil
filters. The Steel Recycling Institute estimates a nationwide oil filter recycling rate of 17.5 percent.
This figure may be somewhat high for New York City, but a City-specific recycling rate could
not be identified. When the total generation is adjusted for recycling, the quantity of oil filters
in the waste stream is approximately 3.9 million filters. The total weight of oil filters in the
waste stream is 2,466 tons.
Air Filters
Generation of air filters from vehicles in New York City is estimated to be approximately 1.95
million filters. A representative from the Steel Recycling Institute indicated that steel from air
filters is not commonly recycled, so the figure for total generation also represents the number
of filters discarded, i.e., 1.95 million air filters. This translates to 1,727 tons of material in the
waste stream each year.
Lead-Acid Batteries
Total lead-acid battery generation in New York City is estimated to be approximately 484,284
lead-acid batteries per year. Most batteries are recycled because of land disposal restrictions,
the high value of lead, and a New York State surcharge placed on the item at the point of
purchase. Surcharges are refunded if a used battery is turned in at or soon following the
purchase. The U.S. recycling rate for lead-acid batteries, according to the Battery Council
International, is 94.4 percent, based on an average recycling rate for 1987 through 1994. After
adjusting for recycling, an estimated 27,120 lead-acid batteries are disposed in New York City,
contributing 246 tons of material to the waste stream.
Discussion
Vehicle-associated products (tires, oil filters, air filters, and lead-acid batteries) contribute
approximately 30,500 tons of material to the New York City waste stream each year. This equates
to approximately 0.5 percent of the total annual New York City waste stream of 6.5 million tons.
Surcharges placed on lead-acid batteries to encourage collection and recycling, because of
concern about lead in the batteries, appears to have been successful in limiting the quantity of
batteries disposed. Additionally, while this report uses a fairly conservative recycling rate of
12.9 percent for used tires, it can be expected that as the recycling infrastructure for tires continues
to develop, the recycling rate will increase and the quantity of tires disposed will decrease.
36

Characterization of New York City’s Solid Waste Stream Spring 2000
The total number of oil filters generated and disposed in New York City is greater than figures
for any other vehicle-related product, although the total weight is notably less than that for
used tires. At present, State and City regulations ban land disposal of used motor oil, but allow
land disposal of used oil filters. Despite the value of steel and used oil in used oil filters, a
strong infrastructure has not yet been developed to transport filters to a recycler or to separate
the components of oil filters for recycling. As the infrastructure for collecting used oil filters
develops, used air filters might also be included in this system to capture any steel components
and other components such as the paper filter which might have a high Btu value.
Additionally, the quantity of vehicle-associated products in the waste stream may continue to
decrease as consumers are encouraged switch to longer-life products (e.g., new types of oil
filters that only need to be changed on an annual basis) and other products, such as synthetic
motor oil, that will increase the life of oil filters. Higher mileage tires and longer life batteries
also are beginning to develop a significant market share, which may help to reduce the
quantity of these items in the waste stream.
DOS’s recently established Special Waste Program may be useful in assessing the diversion
potential and costs of achieving diversion of the items in the category, such as oil filters and
lead-acid batteries, that are designated as special wastes. Expanded collection services and
targeted waste prevention and recycling education could help to eliminate or divert a portion
of the approximately 30,000 tons of automovite products currently generated as wastes in
New York City.
The data used for this report was the most current information available to the consultant.
Data may be need to be updated in the future to reflect changing recycling markets for vehicle-
associated products and to reflect changes in the lifespan of these products. The manufacturers
and trade associations listed in this report may be contacted to obtain updated information.
1 Recycling Research Institute, “Report on Scrap Tire Management and Disposal in New York City,” 1991.
APPENDIX 7
New York City Waste Stream Composition Analysis:
Motor Oil
Introduction
This analysis provides estimates of the quantity of used motor oil managed and discarded in
New York City each year. The exact quantities of used motor oil managed or disposed in New
York City are not available; therefore, estimates were developed based on the number of
vehicles in New York City, the number of oil changes estimated for each vehicle type, and the
number of quarts of oil each engine will hold.
37

Characterization of New York City’s Solid Waste Stream Spring 2000
The assumptions used in this analysis were gathered from a wide range of sources, including
industry representatives, the New York State Department of Environmental Conservation, and
the New York State Department of Transportation. The following section describes the
methodology used in this study, as well as the assumptions and calculations used. The final
section provides a discussion of the findings.
Methodology
The results of this analysis are based on the average number of oil changes for specific types of
vehicles in New York City and the capacity, on average, for oil of each type of vehicle. These
figures are then combined for each type of vehicle to estimate the total gallons of motor oil
used each year in New York City.
Once the estimate for total gallons of motor oil has been developed, this figure is then adjusted
to account for motor oil consumed in the general operation of the engine. The American
Petroleum Institute estimates that 30 percent of the oil put in the engine is consumed before
the next oil change.1 Of the remainder, 55 percent is assumed to be managed in an accepted
form, either recycling or permitted disposal, and 15 percent is assumed to be illegally disposed
by “do-it-yourselfers.”2
Assumptions and Calculations
The calculations used to estimate the total quantity oil used in New York City are presented in
Exhibit 1 and the accompanying assumptions are provided as notes beneath Exhibit 1. Exhibit
2 presents the calculations used to estimate the quantity of that oil that is consumed and the
quantities that are managed and dumped.
Exhibit 1. Estimates for Total Motor Oil Use
Annual Number of Multiplier Capacity Generation
Vehicle Type Vehicles (1993)3 (Changes/Year)4 (in Quarts) (Gallons)
Passenger Cars and
Light Pickups5 1,783,695 2.16 4 3,745,828
Delivery Trucks 43,002 3.97 8 ,335,366
Tractor Trailers 10,751 3.38 25 ,223,979
Taxis 37,294 10.59 4 ,392,830
Buses 5,427 5.010 25 ,169,594
Rental Cars 14,246 6.711 4 ,047,487
Total 4,915,083
38

Characterization of New York City’s Solid Waste Stream Spring 2000
Exhibit 2. Disposition of Used Oil in New York City12
Passenger Cars and Small Disposition All Vehicles (Gallons) Trucks (Gallons)
Total Generation 4,915,083 3,745,828
30 Percent Consumed 1,474,575 1,123,748
55 Percent Managed 2,703,296 2,060,205
15 Percent Disposed 737,262 561,874
Results
Exhibit 1 estimates the total quantity of used motor oil generated each year in New York City
to be approximately 4,915,083 gallons (17,203 tons). As shown in Exhibit 2, based on the
estimated percentages discussed above, overall, 737,262 gallons of motor oil will be disposed
improperly in New York City each year. This equates to 2,580 tons of used motor oil illegally
disposed. Another 2.7 million gallons (9,450 tons) will be either recycled or acceptably disposed.
The third column in Exhibit 2 shows the quantity of used motor oil generated, consumed,
managed, and disposed from passenger cars and small trucks. Overall, in New York City,
3,745,828 gallons (13,110 tons) of used motor oil will be generated by passenger cars and small
trucks. Of this total, 2.0 million gallons (7,000 tons) will be managed in an acceptable manner,
while 561,874 gallons or 1,967 tons will be illegally disposed in the City’s sewers and garbage.
Discussion
The analysis of the quantity of used motor oil generated in New York City each year is limited
in that many of the estimates are based on projected intervals between oil changes based on
educated estimates from industry representatives. This interval will fluctuate over time and among
drivers, but the projected intervals used here allow for fairly conservative, realistic estimates.
Data are not available on the actual disposition of used oil sent to permitted management
facilities; therefore, no estimates are provided regarding the percent that is recycled and the
percent that is disposed. The American Petroleum Institute estimates that approximately 30
percent of used oil generated by “do-it-yourselfers” is properly collected and recycled. The exact
quantity of used oil generated by commercial establishments that is recycled versus properly
disposed is not available, however industry experts indicate that this percentage is fairly high.
In addition, much of the oil that is “consumed” in normal engine use actually will be deposited
on roadways and enter the environment as non-point source run-off. It is not possible,
however, to estimate the exact quantities that enter the environment in this manner. As shown
above, however, an estimated 561,874 gallons of oil each year will be disposed illegally in the
City, much of which will enter the City’s waste stream and sewer systems or be introduced
directly into the environment. For each passenger car and small truck in New York City, over
one-third of a gallon of oil will be illegally disposed each year in the City.
39

Characterization of New York City’s Solid Waste Stream Spring 2000
The data and results presented here were derived from the most and accessible available data
available to the consultants at this time and the estimates presented here are deemed to be
representative of annual quantities of used motor oil likely generated in New York City in 1996.
As recycling infrastructures and disposal regulations continue to evolve, the estimates provided
in this report may have to be revised as new figures become available from relevant trade asso-
ciations and manufacturers. Nevertheless, the findings indicate that efforts to promote recy-
cling of used motor oil can divert significant quantities of waste oil from improper disposal.
1 Personal communication, Jeanne Carlson, SAIC, with Brad Jones, American Petroleum Institute, 10/29/96.2 Estimates are based on figures developed for New York City by the New York City Department of Environmental Protection from
figures originally prepared by the New York State Department of Environmental Conservation.3 Number of vehicles is based on 1993 registrations for New York City provided by the NYS Dept. of Motor Vehicles.4 Based on average miles per year divided by estimated interval between oil changes.5 NYS DMV figures for light pickup trucks, light trucks, and medium trucks are aggregated. One-third are assumed to be light
pickups. Of the remaining two-thirds, 75 percent are assumed to be delivery trucks and 25 percent are assumed to be tractor
trailers.6 Based on average New York City passenger car mileage of 11,000 miles and oil change every 5,238 miles. Oil change interval,
provided by Brad Jones, American Petroleum Institute, is based on annual oil filter sales.7 Based on average of UPS estimates of oil change every 3,5000 miles and Blue Ridge Farms estimates of oil change every 6,000
miles for local delivery trucks and estimated annual mileage of 18,500 miles.8 Based on estimated annual mileage of 50,000 miles, provided by Blue Ridge Farms, Inc. and estimated oil change every 13,000
miles, based on average figures provided by Allied Signal (11,000 miles) and Blue Ridge Farms (15,000 miles).9 Based on average annual taxi mileage of 62,500 miles and oil change every 6,000 miles, per figures provided by the New York
City Taxi Commission.10 Based on total NYC bus fleet of 5,427 buses, average annual mileage for an MTA bus of 30,000 miles, and 6,000 miles between
oil changes.11 According to Hertz Corporation, rental cars typically average 20,000 miles prior to being sold and generally are sold after six
months of service. Interval of oil change every 6,000 miles provided by Brad Jones, American Petroleum Institute.12 See Footnote #2.
APPENDIX 8
New York City Waste Composition Analysis:
Disposable Razors
Introduction
This analysis estimates the quantity, in tons, of disposable razors in the New York City waste
stream. Disposable razors include all one-piece units with a single blade or twin blade. They are
made primarily of polystyrene with metal blades. The figures in this analysis include residential
use, as well as commercial and institutional use. Hospitals and nursing homes purchase razors
in institutional packs for use by patients. Prisons also purchase razors for inmates.
The exact quantity razors disposed in New York City is not available; therefore, estimates were
developed based on data obtained from manufacturers, retail outlets in New York City, and
industry associations.
Methodology
40

Characterization of New York City’s Solid Waste Stream Spring 2000
The model used is this analysis incorporates information provided by a leading manufacturer of
disposable razors. Company sales data, combined with market share information, were used to
generate total figures for New York City.
Assumptions
• One disposable razor weighs 0.19 oz.1
• Packaging from one razor weighs 0.04 oz.
• One disposable razor head from a system razor weighs 0.055 oz.
• Packaging from one blade weighs 0.098 oz.
• One major manufacturer’s sales data from 1995 and estimated market share for 1994
can be used to extrapolate total sales of 12,500,000 wet shave razors in NYC.2
• t is assumed that a “steady-state” exists, i.e., units purchased equals units consumed.
• The recycling rate for razors is assumed to be 0 percent.
Calculations
• 12,500,000 total wet shave razors sold annually in NYC.
• 12,500,000 razors x 0.23 oz. per razor = 2,875,000 ounces divided by 16 = 179,687.5
pounds of razors.
• 179,687.5 pounds of razors divided by 2000 pounds = 89.84 tons of razors
Results
• Approximately 12,500,000 wet shave razors are generated in New York City each year.
• This contributes 89.84 tons to the NYC waste stream.
Discussion
Market share data used in this analysis include both disposable and nondisposable razors
(one-piece and system (disposable head) razors). Because it was not possible to determine the
percentage of the total representing reusable blades, the total was calculated using the weight
for disposable razors. The actual total may be less because reusable blades and their packaging
are lighter than disposable razors. In addition, the analysis is based on the rough estimates
from only one company. Results are based on one manufacturer’s average unit weight for a
one-piece razor. Razor weights of competitors’ products may vary considerably, thus altering
total figures. The steady-state assumption may overestimate disposal, as well, since sales in
New York City does not necessarily result in disposal in New York City.
41

Characterization of New York City’s Solid Waste Stream Spring 2000
Although it is difficult to determine the overall decrease in waste resulting from a shift to reusable
razors, it is possible to estimate that for each individual switch from a disposable razor to a
reusable razor, the waste stream would be reduced by 0.177 ounces.
1 Average weight of one company’s disposable razor product line.2 The figure includes all wet-shave razors (disposable and nondisposable).
APPENDIX 9
New York City Waste Composition Analysis:
Shaving Cream Cans
Introduction
This analysis estimates the quantity, in tons, of aerosol shaving cream cans in the New York City
waste stream. Aerosol shaving cream cans include both men’s and women’s shaving creams.
The exact quantity of shaving cream cans disposed in New York City is not available; therefore,
estimates were developed based on data obtained from manufacturers, retail outlets in New
York City, and industry associations.
Methodology
The model used is this analysis incorporates information provided by leading manufacturers of
shaving cream. Retail outlet sales data were used to generate total figures for New York City.
Assumptions
• In New England/Metro New York food and drug stores, 14,139,210 shaving cream
cans are sold annually (This figure does not include discount stores).1
• These sales represent approximately 90 percent of total sales in this area.2
• Assume that 15 percent of the sales are from New England, while the remaining
85 percent is New York City.3
• An average empty shaving cream container weighs 125.7 grams or 4.4 ounces.4
• The recycling rate for shaving cream cans in New York City is assumed to be 5 percent,
based on the recycling rate for aerosol cans.5
Calculations
• 14,139,210 x 85 percent = 12,018,328.5 shaving cream cans
42
Characterization of New York City’s Solid Waste Stream Spring 2000
• 12,018,325.5 shaving cream cans + 10 percent (additional sales) = 13,220,160
shaving cream cans.
• 13,220,160 shaving cream cans x 4.4 ounces = 58,168,707.7 ounces divided by 16 =
3,635,544 pounds divided by 2000 = 1,817.8 tons of shaving cream cans
• 1,817.8 x 5 percent recycling rate = 1,726.9 tons of shaving cream cans discarded.
Results
• Approximately 135,220,161 shaving cream cans are generated in NYC each year.
• This equals 1,817.8 tons of shaving cream cans generated in NYC.
• Accounting for recycling, this contributes 1,726.9 tons of shaving cream cans to the
NYC waste stream.
Discussion
The results are based on an overall sales figure for New England/Metro New York food and
drug retail outlets, based on regional A.C. Neilson data. Assumptions were made in an attempt
to determine figures for New York City. It does not incorporate figures from discount stores or
other outlets for shaving cream; therefore, the estimates may be lower than actual quantities in
the waste stream.
1 A.C. Neilson Company, as provided by James Kruk, Consumer Health Care Group of Pfizer, Inc., 7/15/96.2 James Kruk, Consumer Health Care Group of Pfizer, Inc., 10/28/96.3 Ibid.4 Jackie Boutan, S.C. Johnson & Sons, 7/25/96.5 Personal communication, Jeanne Carlson, SAIC with David Kleckner, NYC Department of Sanitation, 11/1/96.
APPENDIX 10
New York City Waste Composition Analysis:
Toothbrushes
Introduction
This analysis estimates the quantity, in tons, of toothbrushes and their packaging in the New York
City waste stream. Toothbrushes typically are sold individually packaged in a clear, rigid plastic
container, wrapped in cellophane; a paperboard box wrapped in cellophane; or in a paper-
board and bubblepack (semi-rigid, clear plastic) package. Because the packaging represents a
substantial waste item relative to the actual product, it is included in the following analysis.
43

Characterization of New York City’s Solid Waste Stream Spring 2000
Methodology
The model used for this analysis applies the American Dental Association’s recommended
lifespan of a toothbrush. The estimated number of toothbrushes used by each resident annually
is multiplied by the population of New York City to determine the number of toothbrushes
generated in New York City.
Assumptions
• The American Dental Association recommends changing a toothbrush every
3-4 months or when the bristles are worn.1
• 7.3 million people living in NYC in 1990.2
• Approximately 75 percent of toothbrushes are sold in some type of paperboard
and plastic packaging, and 25 percent are sold in rigid plastic packaging.3
• An average toothbrush weighs 0.45 ounces.4
• Rigid plastic packaging from one toothbrush weighs 0.51 ounces; paperboard and
plastic packaging weighs an average of 0.22 ounces.5
• The recycling rate for toothbrushes is assumed to be 0 percent.
Calculations
• 7.3 million residents x 3 to 4 toothbrushes = 21.9 to 29.2 million toothbrushes.
• 21.9 to 29.2 million toothbrushes x 0.45 ounces = 9,855,000 to 13,140,000 ounces.
• 9,855,000 to 13,140,000 ounces divided by 16 = 615,937.5 to 821,250 pounds divided
by 2000 = 308.0 to 410.6 tons of toothbrushes.
• 21.9 to 29.2 million toothbrushes x 75 percent = 16,425,000 to 21,900,000 paperboard
and plastic toothbrush packages.
• 16,425,000 to 21,900,000 toothbrush packages x 0.22 ounces = 3,613,500 to 4,818,000
ounces divided by 16 = 225,843.8 to 301,125 pounds divided by 2000 = 112.9 to
150.6 tons of paperboard and plastic toothbrush packaging.
• 21.9 to 29.2 million toothbrushes x 25 percent = 5,475,000 to 7,300,000 rigid plastic
toothbrush packages.
• 5,475,000 to 7,300,000 toothbrush packages x 0.51 ounces = 2,792,250 to 3,723,000
ounces divided by 16 = 174,515.6 to 232,687.5 pounds divided by 2000 = 87.3 to
116.3 tons of rigid plastic toothbrush packaging.
Results
• 21.9 to 29.2 toothbrushes with packages will be in the NYC waste stream in 1995.
44

Characterization of New York City’s Solid Waste Stream Spring 2000
• This contributed 308.0 to 410.6 tons of toothbrushes and 200.2 to 266.9 tons of
packaging to the NYC waste stream.
• The total waste stream contribution by toothbrushes and their packaging was 508 to
677.5 tons.
Discussion
This method of analysis was based on a recommended toothbrush lifespan rather than actual
lifespan, which does not account for variations in purchasing and use habits. However, the
figures presented are deemed to be the most accurate estimates of the quantity of toothbrushes
and their packaging found in the New York City waste stream each year.
1 “Caring For Your Teeth and Gums,” American Dental Association, 1993.2 New York City Department of City Planning, 1990 Census data.3 Field research conducted by SAIC staff.4 Field research conducted by SAIC staff.5
Field research conducted by SAIC staff.
APPENDIX 11
New York City Waste Stream Composition Analysis:
Disposable Diapers
Introduction
This analysis estimates the quantity, in tons, of disposable diapers in the New York City waste
stream. Disposable diapers refers to both infant diapers and adult incontinence products used
in home, commercial, and institutional settings. The materials portion of the diapers includes
wood pulp, plastics (including the super-absorbent materials now present in most diapers), and
tissue paper. EPA’s Characterization of Municipal Solid Waste in the United States: 1995 Update
lists the recycling rate for disposable diapers as 0 percent. Nationwide, disposable diapers
comprise approximately 1.9 percent of the total MSW waste stream.1
The exact quantity of disposable diapers disposed in New York City is not available; therefore,
estimates were developed based on data obtained from previously conducted studies.
Methodology
Two models are used to determine the amount of disposable diapers in the New York City
waste stream. For Model #1, the estimates presented were derived from national disposal
figures and recycling rates for disposable diapers. The national estimates are presented in EPA’s
Characterization of Municipal Solid Waste in the United States: 1995 Update and are based on
45

Characterization of New York City’s Solid Waste Stream Spring 2000
data collected by Franklin & Associates. The methodology used by Franklin & Associates to
determine national disposal figures is a “materials flow methodology.” It is based on production
data (by weight) for materials and products in the waste stream, with adjustments for imports,
exports, and product lifespans. Generation was estimated using data on sales of the products
along with information on average weights and composition. The total weights are adjusted
for urine and feces contained within discarded diapers.
The ratio of U.S. population to New York City population is applied to the national estimates of
the quantity of disposable diapers disposed to generate an estimate for New York City. This
estimate is then adjusted to account for recycling.
Model #2 uses percentages of the New York City waste stream determined by a waste sort
conducted in 1990, actual residential and institutional curbside collection figures, and recycling
tonnages provided by processors in the New York City area. A recycling rate is calculated
based on these figures.
Model #1
Assumptions
• 248.7 million people in the U.S. in 1990.
• 7.3 million people living in New York City in 1990.2
• 2,980,000 tons of disposable diapers generated in the U.S. municipal waste stream in 1994.3
• The recycling rate for disposable diapers is assumed to be 0 percent.4
Calculations
• 248.7 million people in the U.S. divided by 7.3 million people living in New York City =
2.9 percent of the total population lives in New York City.
• 2,980,000 tons of disposable diapers generated in the U.S. waste stream x 2.9 percent
(NYC population share) = 86,420 tons of disposable diapers generated in the New York
City waste stream in 1994.
• 0 percent recycling rate x 86,420 tons of disposable diapers generated in New York City
= 86,420 tons of disposable diapers disposed in the New York City waste stream in 1994.
Results
• A total of approximately 86,420 tons of old disposable diapers are generated and
discarded in New York City each year.
46

Characterization of New York City’s Solid Waste Stream Spring 2000
Model #2
Assumptions5
• The total New York City residential and institutional waste stream, minus street
sweepings and empty lot materials, is 3,536,145 tons per year.
• Disposable diapers represent 3.4 percent of this total.
• The recycling rate for disposable diapers in New York City is assumed to be 0 percent.
Calculations
• 3,536,145 tons x 3.4 percent = 120,229 tons of diapers per year disposed in NYC.
Results
• A total of approximately 120,229 tons of disposable diapers per year are generated and
discarded in New York City.
Discussion
The estimates in Model #1, regarding the quantity of disposable diapers discarded in the
New York City waste stream each year are based on EPA’s national waste characterization data.
This includes residential, institutional, and commercial data. Where previously conducted,
up-to-date studies exist, the consultant deemed it more reasonable and cost-effective to modify
that data to New York City rather than duplicate a previous effort.
Model #2 estimates are based on residential and institutional total waste figures, and percentages
of residential waste collection. Institutional wastes are estimated to be less than ten percent
of the total residential and institutional waste stream; therefore, applying percentages of the
residential waste stream to a total including both residential and institutional waste does not
affect the outcome significantly.
Totals from Models #1 and #2 may not be comparable because Model #1 is based on
residential, institutional, and commercial waste generation, while Model #2 is based only on
residential and institutional waste generation.
The data used for this report were the most current available to the consultant and are deemed
to be representative of the annual quantities of disposable diapers found in the New York City
waste stream each year.
1 U.S. EPA, Characterization of Municipal Solid Waste in the United States: 1995 Update, Tables 16 and 17.2 New York City Department of Planning, 1995 census data.3 U.S. EPA, Characterization of Municipal Solid Waste in the United States: 1995 Update, Table 15.4 Ibid, Table 16.5 Information provided by NYC Department of Sanitation, Bureau of Waste Prevention, Reuse and Recycling, 11/17/96.
47

Characterization of New York City’s Solid Waste Stream Spring 2000
APPENDIX 12
New York City Waste Stream Composition Analysis:
Non-Deposit Beverage Containers
Introduction
This analysis estimates the quantity and weight of non-deposit beverage containers in the
New York City waste stream. The analysis includes select flavored beverages, including ready-
to-drink iced tea1 and fruit beverages2 (including ready-to-drink fruit juices and fruit drinks)3,
sports drinks4, bottled water5, and wine and liquor. The estimates in this report do not could
include milk of any kind, frozen juice concentrates, or water that is bottled in HDPE gallon
containers or larger.
The 1995 Update to EPA’s Characterization of Municipal Solid Waste in the United States estimates
that glass bottles, aluminum cans, and plastic bottles, excluding beer and soft drink bottles,
contribute approximately 4.3 percent of the total weight to the municipal solid waste stream.
The EPA document also indicates that the national recycling rate is 27.3 percent for all containers.
The reported average total recycling rate for all glass containers, aluminum beverage containers,
and green PET containers, not including deposit bottles, is 29.3 percent in New York City.
However, this figure includes all non-beverage glass containers, as well. For this reason, this
report uses the national figure of 27.3 percent, except for aseptic containers, which are known
to have a recycling rate of 0 percent in New York City. Published recycling rates for beer and
soft drink containers will be higher, between 30 and 50 percent, because of the influence of
container deposit legislation in eleven states.
The exact quantities of non-deposit beverage containers disposed in New York City are not
available; therefore, estimates were developed, primarily based on data provided by
representatives from the beverage industry, container and packaging manufacturers, and
recycling associations.
The following sections present the methodology used for each beverage category, the
accompanying assumptions, the calculations from which results were derived, and the results
pertaining to the number of containers generated in New York City. The final section presents
a summary and discussion of the results in each of the previous sections as well as conclusions.
“Ready-to-Drink Iced Teas”
Methodology
The model used for ready-to-drink (RTD) iced teas is based on per capita consumption for the
Northeast region, which includes New York, in combination with population figures for New
York City. For this analysis, tourists and commuters have been included in the NYC population
figure because it can be assumed that they also consume significant quantities of beverages
while in the City. RTD teas are packaged primarily in glass bottles and aluminum cans, with a
48

Characterization of New York City’s Solid Waste Stream Spring 2000
small percentage packaged in PET plastic bottles and other containers. All uncited beverage
container weights were determined through primary research conducted by the contractor.
Assumptions
• The annual per capita consumption of RTD teas in the Northeast region was 2.6 gallons
(332.8 fluid ounces) for 1995.6
• The population of New York City (resident population, commuters and tourists) is
8.5 million.
• Single serve RTD iced teas are packaged in glass containers (66.4 percent); aluminum
cans (28.7 percent); PET plastic bottles (2.6 percent); and others (2.3%).7
• The typical container holds 25.6 fluid ounces of product.8
• The 16 to 17.5 fluid ounce glass containers weigh between 8 to 12 ounces, net
product.9/10 This analysis uses 9 ounces per bottle to calculate the total weight of bottles
in the waste stream.
• PET beverage containers typically weigh between 0.8 ounces to 1.4 ounces. This
analysis uses a midpoint of 1.1 ounces.
• RTD iced tea aluminum containers weigh up to 1.08 ounces (Arizona Iced Tea 24-fluid
ounce can); typical 12-fluid ounce aluminum containers weigh 0.58 ounces. This
analysis uses a midpoint weight of 0.83 ounces.
• The recycling rate for this category is 27.3 percent.
Calculations
• 332.8 ounces x 8.5 million people
= 2,828,800,000 ounces of RTD
teas consumed in NYC in 1995.
• 2,828,800,000 ounces divided
by 25.6 ounces = 110,500,000
containers.
• Exhibit 1 provides the remainder
of the calculations used to
determine the number and type
of RTD iced tea containers in the
waste stream and the weight of
these containers, including after
adjusting for recycling.
Results
• A total of 110,500,000 RTD iced teas containers were consumed in New York City in 1995.
49
Total Containers: After Recycling 110,500,000 (27.3% recycling rate)
80,333,500 containters(includes 2.3% “other”)
Glass (66.4 percent of total) Glass73,372,000 containers 53,341,444 containersWeight (total x 9 ounces/16/2000) 15,002.3 tons20,635.9 tons
Plastic (2.6 percent of total) Plastic2,873,000 containers 2,088,671 containersWeight (total x 1.1 ounces/16/200) 71.8 tons98.8 tons
Aluminum (28.7 percent of total) Aluminum31,713,500 containers 23,055,714.5 containersWeight (total x 0.83 ounces/16/200) 598 tons822.6 tons
Exhibit 1. Calculations for Ready-to-Drink Teas
Container Estimates

Characterization of New York City’s Solid Waste Stream Spring 2000
• Adjusting for recycling, 80,333,500 containers were disposed in New York City in 1995.
Of this total, 53,341,444 were glass containers; 2,088,671 were PET plastic; and
23,055,714.5 were aluminum. In addition, 1,847,671 containers are considered “other.”
• Adjusting for recycling, 15,672.1 total tons of RTD tea containers were discarded in New
York City in 1995 (not including the small percentage of other containers for which no
weight could be determined). Of this figure, 15,002.3 tons were glass; 71.8 tons were
plastic; and 598 tons were aluminum.
Fruit Beverages
Methodology
The model used for fruit beverages uses data based on per capita consumption for the
Northeast region, which includes New York, in combination with population figures for New
York City. For this analysis, tourists and commuters have been included in the NYC population
figure because it can be assumed that they also consume significant quantities of beverages
while in the City. Fruit beverages typically are served in glass, steel, plastic, or aseptic
containers. Approximately 53 percent of the fruit beverages sold are juices, while the
remaining 47 percent are fruit drinks. This does not include any frozen concentrates.
Assumptions
• The annual per capita consumption of all fruit beverages in the Northeast region was
17 gallons (2,176 ounces) for 1995. Without frozen concentrates, consumption is
14.6 gallons per capita (1,868.8 ounces).11
• The population of the United States is 248.7 million people.12
• The population of New York City (resident population, commuters and tourists) is
8.5 million.
• 8.41 million units of fruit beverages were sold in the U.S. in 1995.13
• Fruit beverages are packaged in glass containers (38 percent); steel cans (11 percent;
plastic bottles (16 percent); and aseptic packages (35 percent).14
• The average weight of a glass container is 9 ounces; a steel container is 4 ounces;
a plastic container is 1.7 ounces; and an aseptic container is 0.53 ounces.15
• This analysis uses a recycling rate of 27.3 percent for all containers, except aseptic
containers. This rate is based on figures published in EPA’s Characterization of Municipal
Solid Waste in the United States: 1995 Update. Published recycling rates for beer and
soft drink containers will be higher, between 30 and 50 percent, because of the
influence of container deposit legislation in eleven states.
• The recycling rate for aseptic containers in NYC is 0 percent.
50

Characterization of New York City’s Solid Waste Stream Spring 2000
Calculations
• 1,868.8 ounces x 8.5 million
people = 15,884,800,000 ounces
of fruit beverages consumed in
NYC in 1995.
• 8,410,000,000 units of fruit
beverages sold in the U.S.
divided by 248,000,000
(population of the U.S.) = 33.9
units sold per person in the U.S.
• 33.9 units per person x
8.5 million people in NYC =
288,000,000 units sold in NYC.
• 15,884,800,000 ounces divided
by 288 million units = 55.2
ounces per unit average.
• Exhibit 2 provides the remainder
of the calculations used to
determine the number and type
of fruit beverage containers in
the waste stream and the weight
of these containers, including after adjusting for recycling.
Results
• A total of 288,000,000 fruit beverage containers were consumed in New York City in 1995.
• Adjusting for recycling, 236,894,400 containers were disposed in New York City in 1995.
Of this total, 79,562,880 were glass containers; 23,031,360 were steel cans, 33,500,160
were plastic; and 100,800,000 were aseptic.
• Adjusting for recycling, 28,705.2 total tons of fruit beverage containers were discarded
in New York City in 1995.
Sports Drinks
Methodology
The model used for sports drinks uses data based on per capita consumption for the Northeast
region, which includes New York, in combination with population figures for New York City.
For this analysis, tourists and commuters have been included in the NYC population figure
because it can be assumed that they also consume significant quantities of beverages while in
the City. Sports drinks typically are served in glass or plastic containers.
51
Total Containers: After Recycling 288,000,000 236,894,400
Glass Glass (38 percent of total) (27.3% recycling rate)109,440,000 containers 79,562,880 containersWeight (total x 9 ounces/16/2000) 22,377 tons30,780 tons
Steel Steel(11 percent of total) (27.3% recycling rate)31,680,,000 containers 23,031,360 containersWeight (total x 4 ounces/16/2000) 2,879 tons3,969 tons
Plastic Plastic(16 percent of total) (27.3% recycling rate)46,080,000 containers 33,500,160 containersWeight (total x 1.7 ounces/16/2000) 1779.7 tons2,448 tons
Aseptic Aseptic(35 percent of total) (0% recycling rate)100,800,000 containers 100,800,00 containersWeight (total x 0.53 ounces/16/2000) 1,669.5 tons1,669.5 tons
Exhibit 2. Calculations for Fruit Beverage
Container Estimates

Characterization of New York City’s Solid Waste Stream Spring 2000
Assumptions
• The annual per capita consumption of sports drinks in the northeast region was
1.0 gallon (128 ounces) for 1995.16
• The population of New York City (resident population, commuters and tourists) is
8.5 million.
• 95 percent of sports drinks are packaged in plastic bottles and 5 percent are packaged
in glass bottles.17
• The average unit size of all sports drinks is 24 fluid ounces.18
• The typical glass sports drink container holds 16 fluid ounces of product. These bottles
weigh 8 ounces.
• This analysis assumes that 60 percent of sports drinks served in plastic are served in
20 fluid ounce PET plastic containers and that 40 percent are served in 32 fluid ounce
PET plastic containers.
• PET plastic sports drink containers
range from 1.3 to 1.9 ounces. This
analysis uses a weighted average of
1.54 ounces per container.
• The recycling rate for this category
is 27.3 percent.
Calculations
• 128 ounces per capita consumption
x 8.5 million (total New York City
population) = 1,088,000,000
ounces of sports drinks consumed
in New York City during 1995.
• Exhibit 3 provides the remainder of
the calculations used to determine
the number sports drink containers
in the waste stream and the weight
of these containers, including after
adjusting for recycling.
Results
• A total of 47,328,000 sports drink
bottles were consumed in New
York City in 1995. Of this total,
43,928,000 were plastic and
3,400,000 were glass.
52
Exhibit 3. Calculations for Sports Drink
Container Estimates
Total Consumption
• 128 x 8.5 million = 1,088,000,000.
Plastic Bottles
Total Bottles
• 1,088 million x 95 percent = 1,033,600,000 ounces
consumed.
• ((1,033.6 x 60%)/20) + (1,033.6 x 40%)/32) =
43,928,000 total plastic bottles.
• 43,928,000 – 27.3% = 31,935,656 total plastic bottles
after recycling.
Weight
• 43,928,000 plastic bottles x 1.54 ounces = 47,903,484
ounces of bottles.
• 47,903,484/16/2000 = 1,497 tons of plastic bottles.
• 1,497 – 27.3% = 1,088 tons discarded after recycling.
Glass Bottles
Total Bottles
• 1,088 million x 5 percent = 54,400,000 ounces
consumed.
• (54,400,000 / 16) = 3,400,000 total glass bottles.
• 3,400,000 – 27.3% = 2,471,800 total glass bottles
discarded after recycling.
Weight
• 3,400,000 glass bottles x 8 ounces = 27,200,000
ounces of bottles.
• 27,200,000/16/2000 = 850 tons of glass bottles.
• 850 tons – 27.3% = 618 tons discarded after recycling.

Characterization of New York City’s Solid Waste Stream Spring 2000
• Adjusting for recycling, 34,407,456 total sports drinks containers were disposed in New
York City in 1995. Of this total 31,935,656 were plastic containers and 2,471,800 were
glass containers.
• Adjusting for recycling, a total of 1,706.3 tons of sports drinks were discarded in New York
City in 1995. Of this total, 1,088.3 tons of plastic bottles and 618 tons of glass bottles.
Bottled Water
Methodology
The model used for non-sparkling bottled water uses data based on per capita consumption
for the Northeast region, which includes New York, in combination with population figures for
New York City. For this analysis, tourists and commuters have been included in the NYC
population figure because it can be assumed that they also consumer significant quantities of
beverages while in the City. Bottled waters typically are served in PET plastic containers.
Several manufacturers were contacted; however, none could provide the exact mix of containers
sizes. Therefore, the authors of this report conducted field research to estimate the average
size and weight of a container.
Assumptions
• The annual per capita consumption
of bottled water in the Northeast
region was 11.0 gallons (1,408 fluid
ounces) for 1995. This includes
only non-sparkling bottled water
served in PET plastic and glass
bottles.19
• Approximately 85 percent of
bottles are plastic and 15 percent
are glass.20
• This analysis assumes that 50 per-
cent of bottled water served in
plastic bottles is served in 0.5 liter
(16.9 fluid ounce) containers, and
50 percent is served in 1.5 liter
(50.7 fluid ounce) containers.
• The PET beverage containers
typically weigh between 0.80
ounces for a 0.5 liter container to
1.4 ounces for a 1.5 liter container.
This analysis uses an average of
1.1 ounces to calculate the total
weight of disposed bottles.
53
Exhibit 4. Calculations for Bottled Water
Container Estimates
Total Consumption
• 1,,408 ounces x 8.5 million = 11,968,000,000.
Total Plastic Bottles
• 11,968 million x 85 percent = 10,172,800,000 ounces.
• ((10,172.8 million x 0.5)/16.9) + (10,172.8 million x
0.5)/50.7) = 130,420,512.8 plastic bottles.
• 130,420,512.8 plastic bottles – 27.3 percent recycling
= 94,815,712.8 plastic bottles discarded after recycling.
Weight of Plastic Bottles
• 130,420,512.8 x 1.1 = 143,462,564.1 ounces of bottles.
• 143,462,564.1/16/2000 = 4,483.2 tons of plastic bottles.
• 4,483.2 – 27.3% = 3,259.3 tons of plastic bottles after
recycling.
Total Glass Bottles
• 11,968 million x 15 percent = 1,795,200,000 ounces.
• 1,795,200,000 divided by 20 fluid ounces = 89,760,000
bottles.
• 89,760,000 bottles – 27.3% = 65,255,520 bottles
discarded after recycling.
Weight of Plastic Bottles
• 89,760,000 bottles x 9 ounces = 807,840,000 ounces
of bottles.
• 807,840,000/16/2000 = 25,245 tons of glass bottles.
• 25,245 tons - 27.3% = 18,353 tons of glass bottles.

Characterization of New York City’s Solid Waste Stream Spring 2000
• A glass bottle’s average capacity is 20 ounces and average weight is 9 ounces.21
• The recycling rate for PET and glass bottles is 23.7 percent.
Calculations
• 1,408 ounces per capita consumption x 8.5 million (total New York City population) =
11,968,000,000 ounces of bottled water consumed in New York City during 1995.
• Exhibit 4 provides the remainder of the calculations used to determine the number
of bottled water containers in the waste stream and the weight of these containers,
including after adjusting for recycling.
Results
• A total of 220,180,512.8 bottled water containers were consumed in New York City
in 1995.
• Adjusting for recycling, 160,071,232.8 total bottled water containers were disposed
in New York City in 1995.
• Adjusting for recycling, a total of 21,612 tons of water bottles were discarded in
New York City in 1995.
Wine/Liquor
The model used for wine and liquor bottles uses data based on per capita consumption in the
Northeast region in combination with population figures to NYC. For this analysis, tourists and
commuters have been included in the NYC population figure because it can be assumed that
they also consumer significant quantities of alcoholic beverages while in New York City.
Assumptions
• The annual per capita wine consumption of wine in the Northeast region was 2.2 gal-
lons (281.6 fluid ounces) for 1995.22
• A 1.5 liter wine bottle weighs approximately 24 to 28 ounces; a 3 liter jug weighs 32,75
to 35.25 ounces; and a 750 ml bottle (industry typical) weighs 15-17 oz.23 This analysis
uses the average for the industry standard 750 ml glass bottle (16 ounces or 1 pound)
to calculate the total quantity of bottles and the total weight of bottles in the New York
City waste stream.
• The recycling rate for this category is 27.3 percent.
• The annual per capita consumption liquor in the Northeast region was 1.4 gallons
(179.2 fluid ounces) for 1995.
• A 200 ml glass liquor bottle weighs 7.25 oz; a 350 ml glass liquor bottle weighs 11.5 oz;
a 750 ml glass liquor bottle weighs 17 oz; a 1 liter liquor bottle weighs 18 oz; and a
1.75 liter bottle weighs 28 oz.24 No data were available regarding the quantity of liquor
54

Characterization of New York City’s Solid Waste Stream Spring 2000
packaged in the various size bottles. Therefore, this analysis uses the standard 750 ml
glass bottle to calculate the total quantity of bottles and the total weight of bottles in the
New York City waste stream.
• The recycling rate for this category is 27.3 percent.
Calculations
• 281.6 ounces per capita
consumption of wine x 8.5 million
(total New York City population)
= 2,393,600,000 ounces of wine
consumed in New York City
during 1995.
• 179.2 ounces per capita
consumption of liquor x 8.5 million
(total New York City population)
= 1,523,200,000 ounces of liquor
consumed in New York City
during 1995.
• Exhibit 5 provides the remainder of
the calculations used to determine
the number of wine and liquor
containers in the waste stream
and the weight of these containers,
including after adjusting for recycling.
Results
• A total of 94,381,244 wine bottles
and 60,060,791 liquor bottles were
distributed in New York City in
1995, for an overall total of
154,442,035 containers.
• Adjusting for recycling, 112,279,360 wine and liquor bottles were disposed in New York
City in 1995.
• Adjusting for recycling, a total of 34,308 tons of glass wine bottles and 21,832 tons
of liquor bottles were discarded in New York City in 1995, contributing an overall total
of 56,139.7 tons of glass to the New York City waste stream.
Discussion and Conclusions
Exhibit 6 presents summary data for each type of non-deposit bottle, including total generation,
recycling, quantity disposed, and weight entering the waste stream. The results of this analysis
55
Exhibit 5. Calculations for Wine and Liquor
Container Estimates
Wine Bottles
Total Consumption
• 281.6 ounces x 8.5 million = 2,393,600,000.
Total Bottles
• 2,393 million / 25.36 = 94,381,244 total wine bottles.
• 94,381,244 – 27.3 percent = 68,615,164 total wine
bottles after recycling.
Weight
• 94,381,244 x 1 pound = 94,381,244 pounds of bottles.
• 94,381,244/2000 = 47,190.6 tons of bottles.
• 47,190.6 – 27.3% = 34,308 tons of wine bottles after
recycling.
Liquor Bottles
Total Consumption
• 179.2 ounces x 8.5 million = 1,523,200,000. ounces
Total Bottles
• 1,523 million / 25.36 = 60,060,791 total liquor bottles.
• 60,060,791 – 27.3 percent = 43,664,195 total liquor
bottles after recycling.
Weight
• 60,060,791 x 1 pound = 60,060,791 pounds
• 60,060,791/2000 = 30,030.4 tons of bottles.
• 30,030.4 – 27.3% = 21,832.1 tons of liquor bottles
after recycling.

Characterization of New York City’s Solid Waste Stream Spring 2000
were derived using the most current numbers available to the consultant, and they are deemed
to be representative of annual quantities of waste likely generated in New York City as residential
and commercial waste. Data in this report may be updated by applying recent beverage market
growth factors and changes in per capita consumption among different types of beverages.
Exhibit 6. Summary of Results
Total Number
Total Container Recycling Rate of Containers Weight of Discarded
Beverage Generation (%) Discarded Containers (Tons)
Ready-to-Drink Teas 110,500,00025 — 80,333,500 15,672
Glass 73,372,000 27.3 53,341,444 15,002
Plastic 2,873,000 27.3 2,088,671 72
Aluminum 31,713,500 27.3 23,055,714 598
Fruit Beverages 288,000,000 — 236,894,400 28,7052
Glass 109,440,000 27.3 79,562,880 22,377
Steel 31,680,000 27.3 23,031,360 2,879
Plastic 46,080,000 27.3 33,500,100 1,780
Aseptic 100,800,000 0.0 100,800,000 1,670
Sports Drinks 47,828,000 — 34,407,450 1,706
Plastic 43,928,000 27.3 31,935,650 1,088
Glass 3,400,000 27.3 2,471,800 618
Bottled Water 220,180,513 — 160,071,233 21,612
Plastic 130,420,513 27.3 94,815,713 3,259
Glass 89,760,000 27.3 65,255,520 18,353
Wine (Glass) 94,381,244 27.3 68,615,164 34,308
Liquor (Glass) 60,060,791 27.3 43,664,195 21,832
Totals 818,409,595 — 622,138,271 123,835
1 For example, AriZona Iced Tea, Lipton Original, Nestea Cool, and Snapple teas.2 For example, Fruitopia, After the Fall, VeryFine, Ocean Spray, Snapple juices, Hi-C, and Hawaiian Punch.3 Together, ready-to-drink iced teas and fruit beverages comprise the growing segment of “select beverages” or “New Age”
beverages.4 For example, Gatorade and Powerade.5 For example, Evian, Arrowhead, Poland Springs.6 Beverage Market Index 1996, Beverage World, vol. 115, no. 1614, May 1996.7 Beverage World, March 1996, p. 80.8 Personal communication, Victor Bell, SAIC, with Pat Franklin, Container Recycling Institute, 1/23/97.9 Personal communication, Nancy Greenberg, NYC DOS, with Jeff Wolf, Owens-Brockway Glass Container, 6/24/96.
10 Personal communication, Nancy Greenberg, NYC DOS, with Heather Mrazik, Glenshaw Glass Co., 7/2/96.11 Beverage Market Index 1996, Beverage World, vol. 115, no. 1614, May 1996.12 U.S. Bureau of Census, 1990 Data.13 Personal communication, Victor Bell, SAIC, with Pat Franklin, Container Recycling Institute, 1/23/97.14 Ibid.15 Ibid.
56

Characterization of New York City’s Solid Waste Stream Spring 2000
16 Beverage Market Index 1996, Beverage World, vol. 115, no. 1614, May 1996.17 Personal communication, Victor Bell, SAIC, with Pat Franklin, Container Recycling Institute, 1/23/97.18 Ibid.19 Beverage Market Index 1996, Beverage World, vol. 115, no. 1614, May 1996.20 Personal communication, Victor Bell, SAIC, with Pat Franklin, Container Recycling Institute, 1/23/97.21 Ibid.22 Beverage Market Index 1996, Beverage World, vol. 115, no. 1614, May 1996.23 Personal communication, Nancy Greenberg, NYC DOS, with Alyssa Marrazza, Anchor Glass Container Corporation, 6/24/96.24 Data provided by Glenshaw Glass Co., 7/2/96.25 The individual container figures do not add up to the category total because a small percentage of other containers is included
in the total. The column totals do not include other containers.
APPENDIX 13
New York City Waste Stream Composition Analysis:
Clear HDPE Jugs
Introduction
This analysis estimates the quantity, in tons, of clear HDPE jugs in the New York City waste
stream. HDPE jugs refer to clear, high-density polyethylene (HDPE) jugs used in home,
commercial, and institutional settings for milk, water, and orange juice. EPA’s Characterization
of Municipal Solid Waste in the United States: 1995 Update lists the recycling rate for HDPE jugs
as 29.8 percent. Nationwide, HDPE jugs comprise approximately 0.3 percent of the total
MSW waste stream.1
The exact quantity of HDPE jugs disposed in New York City is not available; therefore, estimates
were developed based on data obtained from previously conducted studies.
Methodology
The estimates presented in this study were derived from national disposal figures and recycling
rates for HDPE jugs. The national estimates are presented in EPA’s Characterization of
Municipal Solid Waste in the United States: 1995 Update and are based on data collected by
Franklin & Associates. The methodology used by Franklin & Associates to determine national
disposal figures is a “materials flow methodology.” It is based on production data (by weight)
for materials and products in the waste stream, with adjustments for imports, exports, and
product lifespans.
The ratio of U.S. population to New York City population is applied to the national estimates of
the quantity of HDPE jugs disposed to generate an estimate for New York City. This estimate is
then adjusted to account for recycling.
57

Characterization of New York City’s Solid Waste Stream Spring 2000
Assumptions
• 248.7 million people in the U.S. in 1990.
• 7.3 million people living in New York City in 1990.2
• 570,000 tons of HDPE jugs generated in the U.S. municipal waste stream in 1994.3
• The recycling rate for HDPE jugs is assumed to be 29.8 percent.4
Calculations
• 248.7 million people in the U.S. divided by 7.3 million people living in New York City
= 2.9 percent of the total population lives in New York City.
• 570,000 tons of HDPE jugs generated in the U.S. waste stream x 2.9 percent
(NYC population share) = 16,530 tons of HDPE jugs generated in the New York City
waste stream in 1994.
• 29.8 percent recycling rate x 16,530 tons of HDPE jugs generated in New York City
= 11,604 tons of HDPE jugs disposed in the New York City waste stream in 1994.
Results
• A total of approximately 16,530 tons of old HDPE jugs are generated in New York City
each year.
• Accounting for recycling, these items contribute 11,604 tons per year to the New York
City waste stream.
Discussion
The estimates regarding the quantity of HDPE jugs discarded in the New York City waste
stream each year are based on EPA’s national waste characterization data. Other estimates in
this study have been developed from original research by the consultant. However, in certain
cases, such as this, where previously conducted, up-to-date studies exist, the consultant
deemed it more reasonable and cost-effective to modify that data to New York City rather than
duplicate a previous effort. The data used for this report were the most current available to
the consultant and are deemed to be representative of the annual quantities of HDPE jugs
found in the New York City waste stream each year.
1 U.S. EPA, Characterization of Municipal Solid Waste in the United States: 1995 Update, Table 23.2 New York City Department of Planning, 1995 census data.3 U.S. EPA, Characterization of Municipal Solid Waste in the United States: 1995 Update, Table 18.4 Ibid, Table 21.
58

Characterization of New York City’s Solid Waste Stream Spring 2000
APPENDIX 14
New York City Waste Stream Composition Analysis:
Milk Cartons
Introduction
This analysis estimates the quantity, in tons, of milk cartons in the New York City waste stream.
Milk cartons refers to noncorrugated, paperboard cartons, coated with a layer of wax or
plastic used for milk and some juices in home, commercial, and institutional settings. EPA’s
Characterization of Municipal Solid Waste in the United States: 1995 Update lists the recycling rate
for milk cartons as 0 percent. Nationwide, milk cartons comprise approximately 0.3 percent of
the total MSW waste stream.1
The exact quantity of milk cartons disposed in New York City is not available; therefore,
estimates were developed based on data obtained from previously conducted studies.
Methodology
The estimates presented in this study were derived from national disposal figures and recycling
rates for milk cartons. The national estimates are presented in EPA’s Characterization of Municipal
Solid Waste in the United States: 1995 Update and are based on data collected by Franklin &
Associates. The methodology used by Franklin & Associates to determine national disposal figures
is a “materials flow methodology.” It is based on production data (by weight) for materials and
products in the waste stream, with adjustments for imports, exports, and product lifespans.
The ratio of U.S. population to New York City population is applied to the national estimates of
the quantity of milk cartons disposed to generate an estimate for New York City. This estimate
is then adjusted to account for recycling.
Assumptions
• 248.7 million people in the U.S. in 1990.
• 7.3 million people living in New York City in 1990.2
• 520,000 tons of milk cartons generated in the U.S. municipal waste stream in 1994.3
• The recycling rate for milk cartons is assumed to be 0 percent.4
Calculations
• 248.7 million people in the U.S. divided by 7.3 million people living in New York City =
2.9 percent of the total population lives in New York City.
• 520,000 tons of milk cartons generated in the U.S. waste stream x 2.9 percent
(NYC population share) = 15,080 tons of milk cartons generated in the New York City
waste stream in 1994.
59

Characterization of New York City’s Solid Waste Stream Spring 2000
• 0 percent recycling rate x 15,080 tons of milk cartons generated in New York City =
15,080 tons of milk cartons disposed in the New York City waste stream in 1994.
Results
• A total of approximately 15,080 tons of milk cartons are generated and discarded in
New York City each year.
Discussion
The estimates regarding the quantity of milk cartons discarded in the New York City waste
stream each year are based on EPA’s national waste characterization data. Where previously
conducted, up-to-date studies exist, the consultant deemed it more reasonable and cost-effective
to modify that data to New York City rather than duplicate a previous effort. The data used for
this report were the most current available to the consultant and are deemed to be representative
of the annual quantities of milk cartons found in the New York City waste stream each year.
1 U.S. EPA, Characterization of Municipal Solid Waste in the United States: 1995 Update, Tables 21 and 23.2 New York City Department of Planning, 1995 census data.3 U.S. EPA, Characterization of Municipal Solid Waste in the United States: 1995 Update, Table 18.4 Ibid, Table 21.
APPENDIX 15
New York City Waste Stream Composition Analysis:
Aerosol Cans
Introduction
This study provides estimates for the quantity, in tons, of aerosol cans in the New York City
waste stream. Aerosol cans are steel cans that contain some type of propellant to evacuate a
product. Chlorofluorocarbons (CFCs) were once used for this purpose, but have not been
used as propellants in aerosol cans since 1978.1 Currently, substances such as propane are used
as propellants.
Products commonly sold in aerosol cans include pest control products, such as bug sprays;
spray paints and finishes; cooking oil; spray cleaners, such as oven cleaners, disinfectants, wood
polishes, and foam cleansers; air fresheners; deodorants; and shaving cream (see separate
report for information about shaving cream cans).
The recycling rate for steel is 58.9 %, although it is difficult to determine the portion of this figure
that represents aerosol cans. More than 3,700 recycling programs across the U.S. include
aerosol cans.2 New York City collects aerosol cans in the Bronx and Staten Island. This report
60

Characterization of New York City’s Solid Waste Stream Spring 2000
assumes a 5 percent recycling rate for aerosol cans in New York City. The Steel Recycling
Institute (SRI) reports that collecting empty steel aerosol cans requires no further collection or
processing equipment, and can add as much as three to five percent to a recycling program’s
total steel diversion rate.3
Methodology
Two methodologies were used in this analysis. Model #1 is based on statistics provided by the
Steel Recycling Institute on annual per capita usage rates. Model #2 is based on manufacturing
figures for the United States and uses population statistics to derive the annual generation rates.
Assumptions
• Three billion aerosol cans are produced annually in the U.S.4
• 248.7 million people live in the U.S.; 2.9% of these, or 7.3 million, live in
New York City in 2.8 million households.5
• Annual U.S. per capita usage of aerosols is 11 cans.6
• The recycling rate is assumed to be 5% in New York City.7
• The average weight of an empty aerosol can is 3.6 ounces.8
Calculations
Model #1
• 11 aerosols per person per year x 7.3 million people in New York City = 80.3 million
aerosol cans.
• 80.3 million aerosol cans x 0.225 pounds per can (3.6 oz.) = 18,067,500 pounds divided
by 2000 = 9,033.75 tons of aerosol cans.
• 9,033.75 tons x 5 percent recycling rate = 8,582.1 tons of aerosol cans
Model #2
• 3 billion aerosol cans (total U.S. production) x 2.9% (percentage of New York City
population) = 87 million aerosol cans.
• 87 million aerosol cans x 0.225 pounds per can = 19,575,000 pounds divided by
2000 = 9,787.50 tons of aerosol cans.
• 9,787.50 tons x 5 percent recycling rate = 9,298.1 tons of aerosol cans.
Results
• Based on both models, the total number of aerosol cans generated in New York City
ranges from 80.3 million to 87 million.
61

Characterization of New York City’s Solid Waste Stream Spring 2000
• Based on both models, the total quantity of aerosol cans generated in New York City
ranges from 9,033.75 tons to 9,787.50 tons.
• Based on both models, the total quantity of aerosol cans disposed in New York City
ranges from 8,582.1 tons to 9,298.1 tons.
Discussion and Conclusions
Using both models provides two estimates that are relatively similar. This indicates that the
methods used provide a reasonable estimate of the quantity of aerosol cans in New York City’s
waste stream.
1 The Recycling Magnet, Volume 7, No. 3, Spring 1996, published by The Steel Recycling Institute.2 Ibid.3 Ibid.4 Ibid.5 NYC Department of City Planning, 1990 Census Data.6 Personal Communication, Nancy Greenberg, NYC DOS, with Mary Beth Rizzuto, The Steel Recycling Institute (SRI).7 Personal communication, Jeanne Carlson, SAIC, with David Kleckner, NYC Department of Sanitation, 11/1/96.8 Personal communication, Jeanne Carlson, SAIC, with representative of The Steel Recycling Institute, 10/24/96.
APPENDIX 16
New York City Waste Composition Analysis:
Bag-in-Boxes
Introduction
This analysis looks at the number of bag-in-boxes used in New York City annually. Bag-in-boxes
are composed of a durable cardboard box containing an inner plastic bag of soft drink syrup,
juice, or tea concentrate. The bags typically hold five gallons of liquid. Each box is hooked to
a line that mixes the liquid with water or carbonated water, generating 3,840 ounces, or 30
gallons, of finished product. In many applications, the bag-in-boxes have replaced reusable
steel canisters as a means of dispensing beverage concentrates. The bag-in-boxes are lighter
than the steel canisters. For this reason they are less expensive to transport, easier to manage,
and they reduce the number of injuries associated with transport and installation of beverage
systems. In addition, they take up less storage space in restaurants and have a more efficient
delivery system.
Industry representatives indicate that the bag-in-boxes make better use of the product since
they are easier to empty completely than the canisters. Only a few teaspoons of liquid remain
in the bag when properly used.
62

Characterization of New York City’s Solid Waste Stream Spring 2000
The exact number of bag-n-boxes in the NYC waste stream is not known, however, the following
analysis represents a conservative estimate of that number.
Methodology
The model used for this analysis is based on data provided by representatives of the two largest
manufacturers of soft drinks in the U.S.: Coca-Cola, Inc. and Pepsico., Inc. These two companies
represent the majority of the market share for fountain beverages in New York City.
Assumptions
• The bag-in-boxes have a one-time use.
• A fully evacuated 5-gallon bag-in-box weighs 2.5 lbs.; a full bag-in-box weighs 55-60 lbs.
• Approximately 1,000 per day are shipped into New York City by Coca-Cola Beverage
Service (or 300,000 per year).1
• Coca-Cola represents 70-80 percent of the New York City market, including its fast food
chain customers. For this analysis, 70 percent will be used.
• 70 percent of Coca-Cola’s business is bag-in-boxes; the rest is the steel canisters.2
• Pepsi has not more than 20 percent of the total market share.3 (Coca-Cola has a greater
percentage of the market share because they service the larger fast food chains.)
• Other soft drink companies may represent up to 10 percent of the market in New York City.
• The majority of Pepsi’s business in NYC is bag-in-boxes, not steel canisters. For the
purposes of this analysis, 70 percent will be used.
• A ratio of 70 percent bag-in-box to 30 percent steel canister also will be applied to other
soft drink sales in New York City.
• The national recycling rate for corrugated boxes is 55.3%,4 but for this analysis it is
assumed that the recycling rate for bag-in-boxes is half this (27.6%) due to the difficulty
in recycling the boxes (each has a plastic liner that must be removed and the boxes are
difficult to flatten).
Calculations
• 300,000 bag-in-boxes per year = 70 percent of Coke’s fountain sales, which equal
70 percent of fountain sales in NYC.
• 300,000 divided by 70 percent (percent of Coke’s fountain sales that is bag-in-box) =
428,571 “bag- in-box equivalents” sold by Coke in NYC.
• 428,571 divided by 70 percent (Coke’s market share in NYC) = 535,714 “bag-in-box”
equivalents sold overall in NYC.
• 535,714 x 30 percent (market share of Pepsi and other soft drinks) = 160,714
“bag-in-box equivalents”
63

Characterization of New York City’s Solid Waste Stream Spring 2000
• 160,714 x 70 percent (percent of Pepsi and other soft drinks’ fountain sales that is
bag-in-box) = 112,500 bag-in-boxes.
• 300,000 Coke bag-in-boxes plus 112,500 Pepsi and other soft drink bag-in-boxes =
412,500 bag-in- boxes in NYC each year.
• 412,500 x 2.5 pounds divided by 2000 = 516 tons of bag-in-boxes generated each
year in NYC.
• 516 tons x 27.6 percent recycling rate = 42 tons recycled; therefore 374 tons are
discarded in the NYC waste stream.
Results
• 412,500 bag-in-boxes are generated in NYC each year. This equals 516 tons of bag-in-boxes.
• After recycling, 374 tons of bag-in-boxes are discarded in the NYC waste stream each year.
Discussion and Conclusions
This analysis is based on rough estimates made by representatives of Coco-Cola and Pepsi-Cola.
These data are not typically compiled by the companies or their bottlers; therefore the figures
presented may not accurately represent the actual quantity of bag-in-boxes generated in New
York City. However, these figures are considered a relatively reliable estimate.
To determine the recycling rate for bag-in-boxes, SAIC adjusted the national recycling rate for
corrugated boxes to take into consideration the unique qualities of a bag-in-box. It has an inner
plastic lining that must be removed through a small hole before recycling the cardboard box.
In addition, the box is very sturdy in its construction, making it difficult to break down. For
these reasons, many businesses indicate that they discard the boxes rather than taking the time
to prepare them for recycling collection.
A representative of Pepsi indicated that Pepsi suppliers will take back the bag-in-boxes when
making deliveries just as they take back the steel canisters. The bag-in-boxes are then returned
to the bottling facility for recycling. Coca-Cola may offer a similar service. Many of the small
businesses in New York City may not be aware of this service, as many continue to discard the
boxes. Recycling rates for this material could increase if more businesses were made aware of
the suppliers’ willingness to remove the boxes for each customer.
1 Personal communication, Jeanne Carlson, SAIC, with Gino Concepcione, Coca-Cola Bev Serve, NY, 9/23/96.2 Personal communication, Victor Bell, SAIC, with Jeff Foote, Coca-Cola, Inc,. Packaging Division, 10/22/96.3 Personal communication, Jeanne Carlson, SAIC, with Peter Wilcox, Pepsi-Cola, NY, 9/30/96.4 U.S. EPA’s Characterization of Municipal Solid Waste in the United States: 1995 Update.
64

Characterization of New York City’s Solid Waste Stream Spring 2000
APPENDIX 17
New York City Waste Stream Composition Analysis:
Folding Cartons
Introduction
This analysis estimates the quantity, in tons, of folding cartons in the New York City waste
stream. Folding cartons refers to noncorrugated, paperboard boxes, such as cereal boxes and
frozen food boxes, used in home, commercial, and institutional settings. EPA’s Characterization
of Municipal Solid Waste in the United States: 1995 Update lists the recycling rate for folding
cartons as 18.7 percent. Nationwide, folding cartons comprise approximately 2.6 percent of
the total MSW waste stream.1
The exact quantity of folding cartons disposed in New York City is not available; therefore,
estimates were developed based on data obtained from previously conducted studies.
Methodology
The estimates presented in this study were derived from national disposal figures and recycling
rates for folding cartons. The national estimates are presented in EPA’s Characterization of
Municipal Solid Waste in the United States: 1995 Update and are based on data collected by
Franklin & Associates. The ratio of U.S. population to New York City population is applied to
the national estimates of the quantity of folding cartons disposed to generate an estimate for
New York City. This estimate is then adjusted to account for recycling.
Assumptions
• 248.7 million people in the U.S. in 1990.
• 7.3 million people living in New York City in 1990.2
• 5,140,000 tons of folding cartons generated in the U.S. municipal waste stream in 1994.3
• The recycling rate for folding cartons is assumed to be 18.7 percent.4
Calculations
• 248.7 million people in the U.S. divided by 7.3 million people living in New York City
= 2.9 percent of the total population lives in New York City.
• 5,140,000 tons of folding cartons generated in the U.S. waste stream x 2.9 percent
(NYC population share) = 149,060 tons of folding cartons generated in the New York
City waste stream in 1994.
• 18.7 percent recycling rate x 149,060 tons of folding cartons generated in New York City
= 121,185.8 tons of folding cartons disposed in the New York City waste stream in 1994.
65

Characterization of New York City’s Solid Waste Stream Spring 2000
Results
• A total of approximately 149,060 tons of old folding cartons are generated in
New York City each year.
• Accounting for recycling, these items contribute 121,185.8 tons per year to the
New York City waste stream.
Discussion
The estimates regarding the quantity of folding cartons discarded in the New York City waste
stream each year are based on EPA’s national waste characterization data. Where previously
conducted, up-to-date studies exist, the consultant deemed it more reasonable and cost-
effective to modify that data to New York City rather than duplicate a previous effort. The data
used for this report were the most current available to the consultant and are deemed to be
representative of the annual quantities of folding cartons found in the New York City waste
stream each year.
1 U.S. EPA, Characterization of Municipal Solid Waste in the United States: 1995 Update, Tables 21 and 23.2 New York City Department of Planning, 1995 census data.3 U.S. EPA, Characterization of Municipal Solid Waste in the United States: 1995 Update, Table 18.4 Ibid, Table 21.
APPENDIX 18
New York City Waste Stream Composition Analysis:
Office Paper
Introduction
This analysis estimates the quantity, in tons, of used office paper in the New York City waste
stream. Office paper includes high grade papers such as copier paper, computer printout,
stationery, and other similar paper. These papers are almost entirely made of uncoated
chemical pulp, although some amounts or groundwood are used. Chemical pulps are
prepared by a chemical process, which removes much more lignin, therefore producing a
higher quality paper.
Office-type papers are generated at locations other than offices as well, including homes and
institutions. Other kinds of papers (e.g., newspapers, magazines, and packaging) that are
generated in offices are accounted for in other categories. EPA’s Characterization of Municipal
Solid Waste in the United States: 1995 Update lists the recycling rate for office paper as
42.6 percent. Nationwide, office paper comprises approximately 2.4 percent of the total
MSW waste stream.1
66

Characterization of New York City’s Solid Waste Stream Spring 2000
The exact quantity of office paper disposed in New York City is not available; therefore,
estimates had to be developed based on data obtained from previously conducted studies.
Methodology
Two models are used to determine the amount of food waste in the New York City waste
stream. For Model #1, the estimates presented were derived from national disposal figures and
recycling rates for office paper. The national estimates are presented in EPA’s Characterization
of Municipal Solid Waste in the United States: 1995 Update and are based on data collected by
Franklin & Associates. The methodology used by Franklin & Associates to determine national
disposal figures is a “materials flow methodology.” It is based on production data (by weight)
for materials and products in the waste stream, with adjustments for imports, exports, and
product lifespans.
The ratio of U.S. population to New York City population is applied to the national estimates of
the quantity of office paper disposed to generate an estimate for New York City. Populations of
New York City was applied in this calculation because no figures were available to determine
the number of office workers in the City. Using this figure would have provided a more
accurate figure, since offices generate the majority of office paper. This estimate is then
adjusted to account for recycling.
Model #2 uses percentages of the New York City waste stream determined by a waste sort
conducted in 1990, actual residential and institutional curbside collection figures, and recycling
tonnages provided by processors in the New York City area. A recycling rate is calculated
based on these figures.
Model #1
Assumptions
• 248.7 million people in the U.S. in 1990.
• 7.3 million people living in New York City in 1990.2
• 6,760,000 tons of office paper generated in the U.S. municipal waste stream in 1994.3
• The recycling rate for office paper is assumed to be 42.6 percent.4
Calculations
• 248.7 million people in the U.S. divided by 7.3 million people living in New York City =
2.9 percent of the total population lives in New York City.
• 6,760,000 tons of office paper generated in the U.S. waste stream x 2.9 percent (NYC
population share) = 196,040 tons of office paper generated in the New York City waste
stream in 1994.
67

Characterization of New York City’s Solid Waste Stream Spring 2000
• 42.6 percent recycling rate x 196,040 tons of office paper generated in New York City =
112,527 tons of office paper disposed in the New York City waste stream in 1994.
Results
• A total of approximately 196,040 tons of office paper are generated in New York City
each year.
• Accounting for recycling, office paper contributes 112,527 tons a year to the New York
City waste stream.
Model #2
Assumptions5
• The total New York City residential and institutional waste stream, minus street
sweepings and empty lot materials, is 3,536,145 tons per year.
• Office paper represents 0.8 percent of this total.
• 4,500 tons of office paper are recycled in New York City; therefore, the recycling rate
for office paper in New York City is assumed to be 13.7 percent.
Calculations
• 3,536,145 tons x 0.8 percent = 28,289 tons of office paper per year disposed in NYC.
• 28,289 tons disposed + 4,500 tons recovered = 32,789 tons of office paper generated
per year in New York City.
Results
• A total of approximately 32,789 tons of office paper per year are generated in
New York City.
• Accounting for recycling, 28,289 tons of office paper per year are discarded in
New York City.
Discussion
The estimates in Model #1, regarding the quantity of office paper discarded in the New York
City waste stream each year are based on EPA’s national waste characterization data. This
includes residential, institutional, and commercial data. Where previously conducted, up-to-
date studies exist, the consultant deemed it more reasonable and cost-effective to modify that
data to New York City rather than duplicate a previous effort.
These estimates may overestimate the quantity discarded because the figures are based on
industry production data and may not accurately reflect storage of used office paper in files or
68

Characterization of New York City’s Solid Waste Stream Spring 2000
archives. However, one reviewer believed that estimates may be lower than actual figures
because of the large number of banks, insurance companies, and other offices located in
New York City. These facilities generate large quantities of office paper and may not be
representative of the national average.
Model #2 estimates are based on residential and institutional total waste figures, and percentages
of residential waste collection. Institutional wastes are estimated to be less than ten percent of
the total residential and institutional waste stream; therefore, applying percentages of the
residential waste stream to a total including both residential and institutional waste does not
affect the outcome significantly.
The results of Model #2 may be significantly lower than those of Model #1 because Model #2
does not include figures for commercial office paper generation, which accounts for the
majority of office paper generation. Therefore, the results of Model #1 may represent a more
accurate estimate.
The data used for this report were the most current available to the consultant and are deemed
to be representative of the annual quantities of office paper found in the New York City waste
stream each year.
1 U.S. EPA, Characterization of Municipal Solid Waste in the United States: 1995 Update, Tables 16 and 17.2 New York City Department of Planning, 1995 census data.3 U.S. EPA, Characterization of Municipal Solid Waste in the United States: 1995 Update, Table 15.4 Ibid, Table 16.5 Information provided by NYC Department of Sanitation, Bureau of Waste Prevention, Reuse and Recycling, 11/17/96.
APPENDIX 19
New York City Waste Stream Composition Analysis:
Newspapers
Introduction
This analysis estimates the quantity, in tons, of old newspapers in the New York City waste
stream. The newspaper category consists of standard newsprint and coated, i.e., glossy,
groundwood inserts. Approximately 81 percent of the total material in this category is standard
newsprint and 19 percent is coated groundwood. EPA’s Characterization of Municipal Solid
Waste in the United States: 1995 Update lists the recycling rate for newspapers as 45.3 percent.
Nationwide, old newspapers comprise approximately 4.6 percent of the total MSW waste
stream and 4.6 percent of the total after recycling.1
The exact quantity of old newspapers disposed in New York City is not available; therefore,
estimates had to be developed based on data obtained from previously conducted studies.
69
Characterization of New York City’s Solid Waste Stream Spring 2000
Methodology
Two models are used to determine the amount of newspapers in the New York City waste
stream. For Model #1, the estimates for newspapers are derived from national disposal figures
and recycling rates for newspapers. The national estimates are presented in EPA’s
Characterization of Municipal Solid Waste in the United States: 1995 Update and are based on
data collected by Franklin & Associates. The methodology used by Franklin & Associates to
determine national disposal figures is a “materials flow methodology.” It is based on production
data (by weight) for materials and products in the waste stream, with adjustments for imports,
exports, and product lifespans.
The ratio of U.S. population to New York City commuter and tourist population is applied to
the national estimates of the quantity of newspapers disposed to generate an estimate for New
York City. This estimate is then adjusted to account for recycling.
Model #2 uses percentages of the New York City waste stream determined by a waste sort
conducted in 1990, actual residential and institutional curbside collection figures, and recycling
tonnages provided by processors in the New York City area. A recycling rate is calculated
based on these figures.
Model #1
Assumptions
• 248.7 million people in the U.S. in 1990.
• 8.2 million people visited and commuted to New York City daily in 1990.2
• 13,540,000 tons of old newspapers generated in the U.S. municipal waste stream in 1994.3
• The recycling rate for old newspapers is assumed to be 45.3 percent.4
Calculations
• 248.7 million people in the U.S. divided by 8.2 million people living in New York City
= 3.3 percent of the total population.
• 13,540,000 tons of newspapers generated in the U.S. waste stream x 3.3 percent
(NYC population share) = 446,820 tons of newspaper generated in the New York City
waste stream in 1994.
• 45.3 percent recycling rate x 446,820 tons of newspaper generated in New York City
= 244,410.5 tons of newspaper disposed in the New York City waste stream in 1994.
Results
• A total of approximately 446,820 tons of old newspapers are generated in New York
City each year.
70

Characterization of New York City’s Solid Waste Stream Spring 2000
• Accounting for recycling, old newspapers contribute 244,410.5 tons per year to the
New York City waste stream.
Model #2
Assumptions5
• The total New York City residential and institutional waste stream, minus street
sweepings and empty lot materials, is 3,536,145 tons per year.
• Newspapers represent 9.2 percent of this total.
• 187,023 tons of newspapers are recycled in New York City; therefore, the recycling rate
for newspapers in New York City is assumed to be 36.5 percent.
Calculations
• 3,536,145 tons x 9.2 percent = 325,325 tons of newspapers per year disposed in NYC.
• 325,325 tons disposed + 187,023 tons recovered = 512,348 tons of newspapers
generated per year in New York City.
Results
• A total of approximately 512,348 tons of newspapers per year are generated in
New York City.
• Accounting for recycling, 325,325 tons of newspapers per year are discarded in
New York City.
Discussion
Estimates in Model #1, regarding the quantity of old newspapers discarded in the New York
City waste stream each year are based on EPA’s national waste characterization data. This
includes residential, institutional, and commercial data. Where previously conducted,
up-to-date studies exist, the consultant deemed it more reasonable and cost-effective to modify
that data to New York City rather than duplicate a previous effort.
Model #2 estimates are based on residential and institutional total waste figures, and percentages
of residential waste collection. Institutional wastes are estimated to be less than ten percent of
the total residential and institutional waste stream; therefore, applying percentages of the
residential waste stream to a total including both residential and institutional waste does not
affect the outcome significantly.
Totals from Models #1 and #2 may not be comparable because Model #1 is based on
residential, institutional, and commercial waste generation, while Model #2 is based only on
residential and institutional waste generation.
71

Characterization of New York City’s Solid Waste Stream Spring 2000
The estimates presented for newspaper are based on the most current data available to the
consultant and are deemed to be representative of the annual quantities of newspapers found
in the New York City waste stream each year.
1 U.S. EPA, Characterization of Municipal Solid Waste in the United States: 1995 Update, Tables 16 and 17.2 New York City Department of Planning, 1995 census data.3 U.S. EPA, Characterization of Municipal Solid Waste in the United States: 1995 Update, Table 15.4 Ibid, Table 16.5 Information provided by NYC Department of Sanitation, Bureau of Waste Prevention, Reuse and Recycling, 11/17/96.
APPENDIX 20
New York City Waste Stream Composition Analysis:
Magazines
Introduction
This analysis estimates the quantity, in tons, of used magazines in the New York City waste
stream. Magazines are predominately made of coated groundwood, but some uncoated
groundwood and chemical pulps also are used. Groundwood papers are made primarily from
pulp prepared by a mechanical process. This mechanical process does not remove all of the
lignin found in pulp, which is the substance the leads to yellowing and deterioration of paper.
Therefore groundwood is used in such applications as newspaper, magazines, and paperback
books that are not produced for longevity. Chemical pulps are prepared by a chemical
process, which removes much more lignin, therefore producing a higher quality paper. Most
magazine stock also is coated with a clay material, giving it a glossy finish. EPA’s
Characterization of Municipal Solid Waste in the United States: 1995 Update lists the recycling rate
for magazines as 30.1 percent, although recovery of magazines is not well documented.
Nationwide, magazines comprise approximately 0.9 percent of the total MSW waste stream.1
The exact quantity of magazines disposed in New York City is not available; therefore, estimates
had to be developed based on data obtained from previously conducted studies.
Methodology
Two models are used to determine the amount of magazines in the New York City waste stream.
For Model #1, the estimates presented were derived from national disposal figures and
recycling rates for magazines. The national estimates are presented in EPA’s Characterization
of Municipal Solid Waste in the United States: 1995 Update and are based on data collected by
Franklin & Associates. The methodology used by Franklin & Associates to determine national
disposal figures is a “materials flow methodology.” It is based on production data (by weight)
for materials and products in the waste stream, with adjustments for imports, exports, and
product lifespans.
72

Characterization of New York City’s Solid Waste Stream Spring 2000
The ratio of U.S. population to New York City population is applied to the national estimates of
the quantity of magazines disposed to generate an estimate for New York City. This estimate is
then adjusted to account for recycling.
Model #2 uses percentages of the New York City waste stream determined by a waste sort
conducted in 1990, actual residential and institutional curbside collection figures, and recycling
tonnages provided by processors in the New York City area. A recycling rate is calculated
based on these figures.
Model #1
Assumptions
• 248.7 million people in the U.S. in 1990.
• 7.3 million people living in New York City in 1990.2
• 2,160,000 tons of magazines generated in the U.S. municipal waste stream in 1994.3
• The recycling rate for magazines is 30.1 percent.4
Calculations
• 248.7 million people in the U.S. divided by 7.3 million people living in New York City =
2.9 percent of the total population lives in New York City.
• 2,160,000 tons of magazines generated in the U.S. waste stream x 2.9 percent (NYC
population share) = 62,640 tons of magazines generated in the New York City waste
stream in 1994.
• 30.1 percent recycling rate x 62,640 tons of magazines generated in New York City =
43,785 tons of magazines disposed in the New York City waste stream in 1994.
Results
• A total of approximately 62,640 tons of old magazines are generated in New York City
each year.
• Accounting for recycling, magazines contribute 43,785 tons a year to the New York City
waste stream.
Model #2
Assumptions5
• The total New York City residential and institutional waste stream, minus street
sweepings and empty lot materials, is 3,536,145 tons per year.
• Magazines represent 2.7 percent of this total.
73

Characterization of New York City’s Solid Waste Stream Spring 2000
• 5,935 tons of magazines are recycled in New York City; therefore, the recycling rate for
magazines in New York City is assumed to be 5.9 percent.
Calculations
• 3,536,145 tons x 2.7 percent = 95,476 tons of magazines per year disposed in NYC.
• 95,476 tons disposed + 5,935 tons recovered = 101,411 tons of magazines generated
per year in New York City.
Results
• A total of approximately 101,411 tons of magazines per year are generated in
New York City.
• Accounting for recycling, 95,476 tons of magazines per year are discarded in
New York City.
Discussion
The estimates in Model #1, regarding the quantity of magazines discarded in the New York City
waste stream each year are based on EPA’s national waste characterization data. This includes
residential, institutional, and commercial data. Where previously conducted, up-to-date studies
exist, the consultant deemed it more reasonable and cost-effective to modify that data to New
York City rather than duplicate a previous effort.
The estimates presented for magazines may slightly overestimate the quantity discarded
because the figures are based on industry production data and may not accurately reflect
resale, donation, or storage of used magazines.
Model #2 estimates are based on residential and institutional total waste figures, and percentages
of residential waste collection. Institutional wastes are estimated to be less than ten percent of
the total residential and institutional waste stream; therefore, applying percentages of the
residential waste stream to a total including both residential and institutional waste does not
affect the outcome significantly.
Totals from Models #1 and #2 may not be comparable because Model #1 is based on
residential, institutional, and commercial waste generation, while Model #2 is based only on
residential and institutional waste generation. In addition, differences may result from the
significant difference in the recycling rate used in each model. The data used for this report
were the most current available to the consultant and are deemed to be representative of the
annual quantities of magazines found in the New York City waste stream each year.
1 U.S. EPA, Characterization of Municipal Solid Waste in the United States: 1995 Update, Tables 16 and 17.2 New York City Department of Planning, 1995 census data.3 U.S. EPA, Characterization of Municipal Solid Waste in the United States: 1995 Update, Table 15.4 Ibid, Table 16.5 Information provided by NYC Department of Sanitation, Bureau of Waste Prevention, Reuse and Recycling, 11/17/96.
74

Characterization of New York City’s Solid Waste Stream Spring 2000
APPENDIX 21
New York City Waste Stream Composition Analysis:
Books
Introduction
This analysis estimates the quantity, in tons, of used books in the New York City waste stream.
Books refers to all hard and soft cover books made of both groundwood and chemical pulp.
Groundwood papers are similar to newsprint in that they are made primarily from pulp
prepared by a mechanical process. Groundwood paper is of a lower quality since much of the
lignin that causes yellowing and deterioration is not removed from the pulp. It is used for books
such as paperback novels, which are not produced for long life. Chemical pulp is prepared by
a chemical process, removing more of the lignin from the pulp. Chemical pulp is used for hard
and soft cover books that are produced for longer life. U.S. EPA’s Characterization of Municipal
Solid Waste in the United States: 1995 Update lists the recycling rate for books as 19.3 percent.
Nationwide, books comprise approximately 0.6 percent of the total MSW waste stream.1
The exact quantity of books disposed in New York City is not available; therefore, estimates
were developed based on data obtained from previously conducted studies.
Methodology
Two models are used to determine the amount of books in the New York City waste stream.
For Model #1, the estimates presented were derived from national disposal figures and recycling
rates for books. The national estimates are presented in EPA’s Characterization of Municipal Solid
Waste in the United States: 1995 Update and are based on data collected by Franklin & Associates.
The methodology used by Franklin & Associates to determine national disposal figures is a
“materials flow methodology.” It is based on production data (by weight) for materials and
products in the waste stream, with adjustments for imports, exports, and product lifespans.
The ratio of U.S. population to New York City population is applied to the national estimates of
the quantity of books disposed to generate an estimate for New York City. This estimate is then
adjusted to account for recycling.
Model #2 uses percentages of the New York City waste stream determined by a waste sort
conducted in 1990, actual residential and institutional curbside collection figures, and recycling
tonnages provided by processors in the New York City area. A recycling rate is calculated
based on these figures.
Model #1
Assumptions
• 248.7 million people in the U.S. in 1990.
• 7.3 million people living in New York City in 1990.2
75

Characterization of New York City’s Solid Waste Stream Spring 2000
• 1,140,000 tons of books generated in the U.S. municipal waste stream in 1994.3
• The national recycling rate for books is assumed to be 19.3 percent.4
Calculations
• 248.7 million people in the U.S. divided by 7.3 million people living in New York City
= 2.9 percent of the total population lives in New York City.
• 1,140,000 tons of books generated in the U.S. waste stream x 2.9 percent (NYC population
share) = 33,060 tons of books generated in the New York City waste stream in 1994.
• 19.3 percent recycling rate x 33,060 tons of books generated in New York City
= 26,679 tons of books disposed in the New York City waste stream in 1994.
Results
• A total of approximately 33,060 tons of books are generated in New York City each year.
• Accounting for recycling, these items contribute 26,679 tons per year to the New York
City waste stream.
Model #2
Assumptions5
• The total New York City residential and institutional waste stream, minus street
sweepings and empty lot materials, is 3,536,145 tons per year.
• Books represent 0.8 percent of this total.
• 1,169 tons of books are recycled in New York City; therefore, the recycling rate for
books in New York City is assumed to be 4.0 percent.
Calculations
• 3,536,145 tons x 0.8 percent = 28,289 tons of books per year disposed in NYC.
• 28,289 tons disposed + 1,169 tons recovered = 29,458 tons of books generated per
year in New York City.
Results
• A total of approximately 29,458 tons of books per year are generated in New York City.
• Accounting for recycling, 28,289 tons of books per year are discarded in New York City.
Discussion
The estimates in Model #1, regarding the quantity of books discarded in the New York City
waste stream each year are based on EPA’s national waste characterization data. This includes
76
Characterization of New York City’s Solid Waste Stream Spring 2000
residential, institutional, and commercial data. Where previously conducted, up-to-date studies
exist, the consultant deemed it more reasonable and cost-effective to modify that data to New
York City rather than duplicate a previous effort. The estimates in Model #1 may slightly
overestimate the quantity discarded because the figures are based on industry production data
and may not accurately reflect resale, donation, or storage of used books.
Model #2 estimates are based on residential and institutional total waste figures, and
percentages of residential waste collection. Institutional wastes are estimated to be less than
ten percent of the total residential and institutional waste stream; therefore, applying
percentages of the residential waste stream to a total including both residential and institutional
waste does not affect the outcome significantly.
Totals from Models #1 and #2 may not be comparable because Model #1 is based on
residential, institutional, and commercial waste generation, while Model #2 is based only on
residential and institutional waste generation.
The data used for this report were the most current available to the consultant and are deemed
to be representative of the annual quantities of books found in the New York City waste stream
each year.
1 U.S. EPA, Characterization of Municipal Solid Waste in the United States: 1995 Update, Tables 16 and 17.2 New York City Department of Planning, 1995 census data.3 U.S. EPA, Characterization of Municipal Solid Waste in the United States: 1995 Update, Table 15.4 Ibid, Table 16.5 Information provided by NYC Department of Sanitation, Bureau of Waste Prevention, Reuse and Recycling, 11/17/96.
APPENDIX 22
New York City Waste Stream Composition Analysis:
Telephone Directories
Introduction
This analysis estimates the number and tonnage of telephone directories, both white and
yellow pages, in the New York City waste stream. An average New York City telephone directory
weighs approximately 1.4 pounds and certain editions such as the Manhattan Consumer Yellow
Pages can weigh more than four pounds. Additionally, the life span of a telephone directory is
only approximately one year. Hence, as new telephone directories are issued, a substantial
number will be discarded at one time.
The New York City Department of Sanitation has included telephone directories in its curbside
recycling programs in all five boroughs. They are made of groundwood, a paper similar to
77

Characterization of New York City’s Solid Waste Stream Spring 2000
newsprint in brightness and quality, made primarily from pulp prepared by a mechanical
process. When recycled, telephone directories can be transformed into a variety of products,
including coreboard, roll cores, animal bedding, compost, boxboard, cellulose insulation,
padded envelopes, bedpans, wallboard, packaging material, paper towels and tissue.
NYNEX, the official publisher of telephone directories in New York State, has taken several
innovative steps to reduce the size and weight of its telephone directories. NYNEX has reduced
the weight of the paper it uses, trimmed the borders by 1/16th of an inch, and introduced
several layout changes that reduce the overall size of the telephone directories.
The exact quantity and tonnage of old telephone directories in the New York City waste stream
is not known. However, NYNEX has provided detailed information to help estimate the total
quantity. In addition, EPA’s Characterization of Municipal Solid Waste in the United States: 1995
Update lists the recycling rate for telephone directories as 10.6 percent. However, NYNEX
representatives indicate that figures for New York State and New York City are higher and
estimate that 15 percent of telephone directories are recycled in New York City. Nationwide,
telephone directories comprise approximately 0.2 percent of the total MSW waste stream.1
Methodology
Two models are presented to estimate the quantity of used telephone directories in the New
York City waste stream. Model #1 is based on national disposal figures and recycling rates for
telephone directories. The national estimates are presented in EPA’s Characterization of
Municipal Solid Waste in the United States: 1995 Update and are based on data collected by
Franklin & Associates. The methodology used by Franklin & Associates to determine national
disposal figures is a “materials flow methodology.” It is based on production data (by weight)
for materials and products in the waste stream, with adjustments for imports, exports, and
product lifespans. The ratio of U.S. population to New York City population is applied to the
national estimates of the quantity of used telephone directories to generate an estimate for
New York City. This estimate is then adjusted to account for recycling.
Model #2 is based on data provided by NYNEX. NYNEX distributes approximately 95 percent
of the telephone directories in the five boroughs of New York City. The information provided in
Exhibit 1, regarding the number distributed and weight of the various telephone directories
distributed in New York, was provided by NYNEX. Only one other publisher distributes a small
number of telephone directories to parts of Queens and Brooklyn.
Model #1
Assumptions
• 248.7 million people in the U.S. in 1990.
• 7.3 million people living in New York City in 1990.2
• 470,000 tons of telephone directories generated in the U.S. municipal waste stream in
1994.3
78

Characterization of New York City’s Solid Waste Stream Spring 2000
• The recycling rate for telephone directories is assumed to be 15 percent.4
Calculations
• 248.7 million people in the U.S. divided by 7.3 million people living in New York City
= 2.9 percent of the total population lives in New York City.
• 470,000 tons of telephone directories generated in the U.S. waste stream x 2.9 percent
(NYC population share) = 13,630 tons of telephone directories generated in the
New York City waste stream in 1994.
• 15 percent recycling rate x 13,630 tons of telephone directories generated in New York
City = 11,585.5 tons of telephone directories disposed in the New York City waste
stream in 1994.
Results
• A total of approximately 13,630 tons of old telephone directories are generated in New
York City each year.
• Accounting for recycling, these items contribute 11,585.5 tons per year to the New York
City waste stream.
Model #2
Assumptions
• Data regarding the quantity of telephone directories distributed in New York City and
the weight of each directory are presented in Exhibit 1 under Calculations.
• NYNEX distributes 95 percent of the telephone directories in New York City.
• The recycling rate for telephone directories in New York City is approximately 15%5
Calculations
• Exhibit 1 presents the weight of each NYNEX directory distributed in New York City, the
number of copies distributed and the total weight, in tons, of each directory. The total
tonnage is derived by multiplying the weight of an individual directory by the number
of directories distributed and then dividing by 2,000 pounds.
• 9,124,628 NYNEX directories + 5 percent non-NYNEX directories = 9,580,859 total
telephone directories distributed in New York City each year.
• 15 percent recycling rate x 90,580,589 directories distributed in New York City =
8,143,730 directories discarded annually in New York City.
• 12,890.8 tons of NYNEX directories distributed annually + 5 percent non-NYNEX
directories = 13,539.8 tons of telephone directories distributed in New York City
each year.
79
Characterization of New York City’s Solid Waste Stream Spring 2000
• 15 percent recycling rate x 13,539.8 tons of telephone directories generated in
New York City = 11,508.8 tons of telephone directories in the NYC waste stream.
Results
• A total of 9,580,859 telephone directories are distributed in New York City each year.
• Accounting for recycling, these directories contribute 11,508.8 tons a year to the New
York City waste stream.
Discussion
Model #1
The estimates regarding the quantity of telephone directories discarded in the New York City
waste stream each year are based on EPA’s national waste characterization data. Where
previously conducted, up-to-date studies exist, the consultant deemed it more reasonable and
cost-effective to modify that data to New York City rather than duplicate a previous effort.
The estimates presented for telephone directories may slightly overestimate the quantity
discarded because the figures are based on industry production data from the Yellow Pages
Publishers Association and may not accurately reflect storage of used telephone directories.
However, the data used for this report were the most current available to the consultant and
are deemed to be representative of the annual quantities of telephone directories found in the
New York City waste stream each year.
Model #2
The estimates regarding the number of used telephone directories discarded in the New York
City waste stream each year are based primarily on weight and distribution data provided by
NYNEX, which holds 95 percent of the telephone directory market in New York City. Similar
data the company holding the remaining 5 percent of the market were not available.
Therefore, the number and weight of directories distributed by other companies were estimat-
ed based on the figures provided by NYNEX, adjusting for the estimated 5 percent of the mar-
ket that is not handled by NYNEX. The figure may be slightly high because the 5 percent of
additional books may have a slightly lower average weight.
A total of 9,580,859 telephone directories are distributed in New York City. On a per capita
basis, this equates to 1.31 directories or approximately 1.8 pounds of directories per person
per year, assuming a New York City population of 7.3 million.
Based on the available data, the consultant is confident that the range of telephone directories
estimated to be in the New York City waste stream, 11,508.8 to 11,585.5 tons, accurately
reflects the actual quantity of telephone directories discarded in New York City each year.
80

Characterization of New York City’s Solid Waste Stream Spring 2000
Exhibit 1: NYNEX Directories Distributed in New York City6
Directory Title Weight of Directory Number of Copies Total Weight (in pounds) Distributed (in tons)
NY B-to-B 3.82 264,638 505.5
Manhattan Consumer YP 4.56 1,109,103 2,528.8
Tribeca/Lower Manhattan 0.66 60,522 20.0
Yorkville/Up. E. Side 0.55 163,232 44.9
Greenwich Village 0.72 115,196 41.5
Beekman Place 0.65 73,044 23.7
Gramercy Park 0.64 113,816 36.4
Upper West Side 0.61 189,772 57.9
East Harlem (bilingual) 1.24 126,269 78.3
Wash. Heights (bilingual) 1.03 79,364 40.9
Manhattan WP 3.94 1,079,892 2,127.4
Bronx Combined 3.38 499,290 843.8
Bronx City Island 0.62 62,045 19.2
Riverdale 0.64 44,922 14.4
Brooklyn WP 2.90 989,657 1,435.0
Brooklyn YP 2.94 987,886 1452.2
Sheepshead Bay 0.94 105,208 49.4
Bensonhurst 1.07 118,610 63.5
Midwood 0.62 61,886 19.2
Canarsie 0.63 73,768 23.2
Brooklyn Heights 0.99 93,647 46.4
Queens YP 3.38 911,478 1,540.4
Queens WP 3.02 913,059 1,378.7
Maspeth 0.70 67,118 23.5
Astoria 0.80 69,393 27.8
Forest Hills 0.76 71,302 27.1
N. Flushing 0.98 112,698 55.2
S. Flushing 0.70 59,309 20.8
Richmond Hill 0.78 89,788 35.0
Bayside 0.75 67,205 25.2
Staten Island 2.70 182,595 246.5
Eltingville 0.46 47,734 11.0
Castleton 0.41 36,603 7.5
New Dorp 0.42 38,910 8.2
Totals (or Average) 1.4 Av. 9,124,628 12,890.8
1 U.S. EPA, Characterization of Municipal Solid Waste in the United States: 1995 Update, Table 17.2 New York City Department of Planning, 1995 census data.3 U.S. EPA, Characterization of Municipal Solid Waste in the United States: 1995 Update, Table 15.
81

Characterization of New York City’s Solid Waste Stream Spring 2000
4 Personal communication, Jeanne Carlson, SAIC, with John Halenar, NYNEX, 11/15/96.5 Personal communication, Nancy Greenberg, NYC DOS with John Halenar, NYNEX, 7/31/96.6 Data provided by John Halenar, NYNEX. Figures are the most recent available, in most cases from 1995, with the exception of
the Manhattan and Bronx directories, which are for 1996, since these directories already have been delivered this year.
APPENDIX 23
New York City Waste Stream Composition Analysis:
Third-Class Mail
Introduction
This analysis estimates the quantity, in tons, of third-class mail in the New York City waste
stream. Third-class mail includes catalogs and other direct bulk mailings. Both groundwood
and chemical pulps are used in these varied items. EPA’s Characterization of Municipal Solid
Waste in the United States: 1995 Update lists the recycling rate for third-class mail as 13.9 percent.
Nationwide, third-class mail comprises approximately 2.1 percent of the total MSW waste stream.1
The exact quantity of third-class mail disposed in New York City is not available; therefore,
estimates had to be developed based on data obtained from previously conducted studies.
Methodology
Two models are presented to estimate the quantity of third-class mail in the New York City waste
stream. Model #1 is derived from national disposal figures and recycling rates for third-class
mail. The national estimates are presented in EPA’s Characterization of Municipal Solid Waste
in the United States: 1995 Update and are based on data collected by Franklin & Associates.
The methodology used by Franklin & Associates to determine national disposal figures is a
“materials flow methodology.” It is based on production data (by weight) for materials and
products in the waste stream, with adjustments for imports, exports, and product lifespans.
The ratio of U.S. population to New York City population is applied to the national estimates of
the quantity of third-class mail disposed to generate an estimate for New York City. This
estimate is then adjusted to account for recycling.
Model #2 uses U.S. Postal Service estimates for direct mail received per year. This per capita
figure is multiplied by the population of New York City. The estimate is then adjusted to
account for recycling using data collected by Franklin & Associates.
Model #1
Assumptions
• 248.7 million people in the U.S. in 1990.
82

Characterization of New York City’s Solid Waste Stream Spring 2000
• 7.3 million people living in New York City in 1990.2
• 4,400,000 tons of third-class mail generated in the U.S. municipal waste stream in 1994.3
This includes catalogs and other direct bulk mailings.
• The recycling rate for third-class mail is assumed to be 13.9 percent.4
Calculations
• 248.7 million people in the U.S. divided by 7.3 million people living in New York City
= 2.9 percent of the total population lives in New York City.
• 4,400,000 tons of third-class mail generated in the U.S. waste stream x 2.9 percent
(NYC population share) = 127,600 tons of third-class mail generated in the New York
City waste stream in 1994.
• 13.9 percent recycling rate x 127,600 tons of third-class mail generated in New York City
= 109,864 tons of third-class mail disposed in the New York City waste stream in 1994.
Results
• A total of approximately 127,600 tons of third-class mail are generated in New York City
each year.
• Accounting for recycling, these items contribute 109,864 tons per year to the New York
City waste stream.
Model #2
Assumptions
• The average resident of the U.S. receives 31.04 pounds of direct mail per year.5 This
includes business-to-business mailings, and mailings addressed to “occupant” or
“resident,” as well as mailings directly addressed to individuals.
• In the absence of New York City-specific information, it is assumed that New York City
residents received the average amount of direct mail.
• 7.3 million people living in New York City in 1990.6
• The recycling rate for third-class mail is assumed to be 13.9 percent.7
Calculations
• 7.3 million people living in New York City x 31.04 pounds (divided by 2000 pounds) =
113,296 tons of third-class mail generated in the New York City waste stream.
• 13.9 percent recycling rate x 113,296 tons of third-class mail generated in New York City
= 97,548 tons of third-class mail disposed in the New York City waste stream.
83

Characterization of New York City’s Solid Waste Stream Spring 2000
Results
• A total of approximately 113,296 tons of third-class mail are generated in New York City
each year.
• Accounting for recycling, third-class mail contributes approximately 97,548 tons per year
to the New York City waste stream.
Discussion
The estimates regarding the quantity of third-class mail discarded in the New York City
waste stream each year are based on EPA’s national waste characterization data and figures
developed by the U.S. Postal Service. Both estimates include mailings received and discarded
at residential, commercial, and institutional locations. Where previously conducted, up-to-date
studies exist, the consultant deemed it more reasonable and cost-effective to modify that data
to New York City rather than duplicate a previous effort. The data used for this report were the
most current available to the consultant and are deemed to be representative of the annual
quantities of third-class mail found in the New York City waste stream each year.
1 U.S. EPA, Characterization of Municipal Solid Waste in the United States: 1995 Update, Table 17.2 New York City Department of Planning, 1995 census data.3 U.S. EPA, Characterization of Municipal Solid Waste in the United States: 1995 Update, Table 15.4 Ibid, Table 16.5 New York City Department of Sanitation, Bureau of Waste Prevention, Reuse and Recycling, Evaluating New York City’s Waste
Prevention Programs, First Year Annual Report, August 1996.6 New York City Department of Planning, 1995 census data.7 U.S. EPA, Characterization of Municipal Solid Waste in the United States: 1995 Update, Table 13.
APPENDIX 24
New York City Waste Stream Composition Analysis:
Paper Towels
Introduction
This analysis estimates the quantity, in tons, of paper towels in the New York City waste stream.
Paper towels include facial and sanitary tissues and napkins, as well as toweling. EPA’s
Characterization of Municipal Solid Waste in the United States: 1995 Update lists the recycling rate
for paper towels as 0 percent. Nationwide, paper towels comprise approximately 1.8 percent
of the total MSW waste stream.1
The exact quantity of paper towels disposed in New York City is not available; therefore,
estimates had to be developed based on data obtained from previously conducted studies.
84

Characterization of New York City’s Solid Waste Stream Spring 2000
Methodology
The estimates presented in this study were derived from national disposal figures and recycling
rates for paper towels. The national estimates are presented in EPA’s Characterization of
Municipal Solid Waste in the United States: 1995 Update and are based on data collected by
Franklin & Associates. The methodology used by Franklin & Associates to determine national
disposal figures is a “materials flow methodology.” It is based on production data (by weight)
for materials and products in the waste stream, with adjustments for imports, exports, and
product lifespans.
The ratio of U.S. population to New York City population is applied to the national estimates of
the quantity of paper towels disposed to generate an estimate for New York City. This estimate
is then adjusted to account for recycling.
Assumptions
• 248.7 million people in the U.S. in 1990.
• 7.3 million people living in New York City in 1990.2
• 2,860,000 tons of paper towels generated in the U.S. municipal waste stream in 1994.3
• The recycling rate for paper towels is assumed to be 0 percent.4
Calculations
• 248.7 million people in the U.S. divided by 7.3 million people living in New York City
= 2.9 percent of the total population lives in New York City.
• 2,860,000 tons of paper towels generated in the U.S. waste stream x 2.9 percent
(NYC population share) = 82,940 tons of paper towels generated in the New York City
waste stream in 1994.
• 0 percent recycling rate x 82,940 tons of paper towels generated in New York City =
82,940 tons of paper towels disposed in the New York City waste stream in 1994.
Results
• A total of approximately 82,940 tons of old paper towels are generated and discarded
in New York City each year.
Discussion
The estimates regarding the quantity of paper towels discarded in the New York City waste
stream each year are based on EPA’s national waste characterization data. Where previously
conducted, up-to-date studies exist, the consultant deemed it more reasonable and cost-
effective to modify that data to New York City rather than duplicate a previous effort.
85

Characterization of New York City’s Solid Waste Stream Spring 2000
The estimates presented for paper towels do not make a distinction between commercial-type,
kraft towels, and the type of toweling more commonly used in residential applications. In
addition, the estimates include several types of tissue paper besides paper toweling. No figures
are available for the specific types of toweling and tissue products. However, the data used
for this report were the most current available to the consultant and are deemed to be
representative of the annual quantities of paper towels found in the New York City waste
stream each year.
1 U.S. EPA, Characterization of Municipal Solid Waste in the United States: 1995 Update, Table 17.2 New York City Department of Planning, 1995 census data.3 U.S. EPA, Characterization of Municipal Solid Waste in the United States: 1995 Update, Table 15.4 Ibid, Table 16.
APPENDIX 25
New York City Waste Stream Composition Analysis:
Paper Plates and Cups
Introduction
This analysis estimates the quantity, in tons, of used paper plates and cups in the New York City
waste stream. Paper plates and cups include paper plates, cups, bowls and other food service
products used in homes, in commercial establishments, such as restaurants, and in institutional
settings, such as schools. EPA’s Characterization of Municipal Solid Waste in the United States:
1995 Update lists the recycling rate for paper plates and cups as 0.0 percent. Nationwide,
paper plates and cups comprise approximately 0.4 percent of the total MSW waste stream.1
The exact quantity of paper plates and cups disposed in New York City is not available; therefore,
estimates had to be developed based on data obtained from previously conducted studies.
Methodology
The estimates presented in this study were derived from national disposal figures and recycling
rates for paper plates and cups. The national estimates are presented in EPA’s Characterization
of Municipal Solid Waste in the United States: 1995 Update and are based on data collected by
Franklin & Associates. The methodology used by Franklin & Associates to determine national
disposal figures is a “materials flow methodology.” It is based on production data (by weight)
for materials and products in the waste stream, with adjustments for imports, exports, and
product lifespans.
The ratio of U.S. population to New York City population is applied to the national estimates of
the quantity of paper plates and cups disposed to generate an estimate for New York City. This
estimate is then adjusted to account for recycling.
86

Characterization of New York City’s Solid Waste Stream Spring 2000
Assumptions
• 248.7 million people in the U.S. in 1990.
• 7.3 million people living in New York City in 1990.2
• 870,000 tons of paper plates and cups generated in the U.S. municipal waste stream
in 1994.3
• The recycling rate for paper plates and cups is assumed to be 0.0 percent.4
Calculations
• 248.7 million people in the U.S. divided by 7.3 million people living in New York City
= 2.9 percent of the total population lives in New York City.
• 870,000 tons of paper plates and cups generated in the U.S. waste stream x 2.9 percent
(NYC population share) = 25,230 tons of paper plates and cups generated in the
New York City waste stream in 1994.
• 0 percent recycling rate x 25,230 tons of paper plates and cups generated in
New York City = 25,230 tons of paper plates and cups disposed in the New York City
waste stream in 1994.
Results
• A total of approximately 25,230 tons of old paper plates and cups are generated and
discarded in New York City each year.
Discussion
The estimates regarding the quantity of paper plates and cups discarded in the New York City
waste stream each year are based on EPA’s national waste characterization data. Where
previously conducted, up-to-date studies exist, the consultant deemed it more reasonable and
cost-effective to modify that data to New York City rather than duplicate a previous effort.
The estimates presented for paper plates and cups may slightly overestimate the quantity
discarded because the figures are based on industry production data and may not accurately
reflect storage of paper plates and cups. However, the data used for this report were the most
current available to the consultant and are deemed to be representative of the annual
quantities of paper plates and cups found in the New York City waste stream each year.
1 U.S. EPA, Characterization of Municipal Solid Waste in the United States: 1995 Update, Table 17.2 New York City Department of Planning, 1995 census data.3 U.S. EPA, Characterization of Municipal Solid Waste in the United States: 1995 Update, Table 15.4 U.S. EPA, Characterization of Municipal Solid Waste in the United States: 1995 Update, Table 16.
87

Characterization of New York City’s Solid Waste Stream Spring 2000
APPENDIX 26
New York City Waste Composition Analysis:
Polybags from Dry Cleaners
Introduction
This analysis estimates the number of plastic “polybags” generated by dry cleaners in New York
City each year. Polybags are used to protect clothes once they have been dry cleaned. These
bags are made of low density polyethylene (LDPE) plastic, which generally is classified as film
for recycling purposes. Many dry cleaners across the country have begun collecting polybags
for recycling. Another option for protecting clothing is the use of reusable cleaner bags.
Methodology
The data used in this analysis is based on a survey of dry cleaners in New York City conducted
by the NYC Department of Sanitation. The survey developed annual usage of polybags by dry
cleaning establishments in the City based on annual usage of polybags at selected dry cleaners.
The data was subsequently analyzed used by The Tellus Institute to determine the number of
polybags reused each year in the by dry cleaning establishments in New York City.1 This
analysis is based primarily on the Tellus Institute study.
Assumptions
• 2,237 dry cleaners in New York City.
• 1,851 polybags bought per month by average dry cleaner (from 1993 DOS survey).
• An average polybag weighs 0.9 ounces.
• 4 percent of all NYC dry cleaners offer reusable bags for customers.
• 30 percent of polybags were prevented in stores offering reusable bags.
• A recycling rate of 0 percent recycling rate in New York City is assumed.
Calculations
• 2,237 dry cleaners in New York City x 1,851 polybags per month per dry cleaner x
12 = 49,688,244 polybags generated in New York City each year.
• 49,688,244 polybags x 0.9 ounces = 44,719,420 ounces divided by 32,000 ounces/
ton = 1,397 tons of polybags
• 1,397 tons divided 2,237 dry cleaners = 0.624 tons/store/year.
• 30 percent x 0.624 tons/store/year = 0.187 tons prevented in a store offering reusable
bags
• 4 percent of stores x 2,237 dry cleaners = 89 stores offering reusable bags.
88

Characterization of New York City’s Solid Waste Stream Spring 2000
• 0.187 tons prevented per store x 89 stores offering reusable bags = 17 tons prevented
in New York City
Results
• Approximately 49,688,244 polybags were generated in New York City in 1993.
• This contributed 1,397 tons to the NYC waste stream.
• The reusable bag program prevented an additional 17 tons of polybags from entering
the waste stream.
Discussion and Conclusions
The Textile Care Allied Trade Association provides polybag recycling services for participating
dry cleaners, but recycling rates were not available from the association. Therefore, the
estimates of polybags discarded may overestimate actual discards because the calculations in
this report used a recycling rate of 0 percent.
The estimates developed in this analysis are based on survey data collected in 1993 from 1,700
dry cleaners in New York City. These dry cleaners are members of the Neighborhood Cleaners
Association and represent more than half of the dry cleaners in New York City. More than 100
dry cleaners returned the survey and fifty additional responses were obtained during site visits.
These 100 respondents may not provide a representative sampling of all dry cleaners’ activities.
The willingness to participate in the survey may indicate a disproportionate willingness to
participate in other programs, such as a reusable bag program, within this group of dry cleaners.
Therefore, the estimated percentage of dry cleaners participating in the reusable bag program
may be high. Although the estimates are based on responses from only 6.7 percent of the dry
cleaners in the City, because no actual data exist regarding the number of polybags discarded
in New York City, the estimates provided in this report may be the most reasonable to date.
1 New York City Department of Sanitation, Bureau of Waste Prevention, Reuse and Recycling, Evaluating New York City’s Waste
Prevention Programs, First Year Annual Report, DRAFT, August 1996.
APPENDIX 27
New York City Waste Composition Analysis:
Hangers from Dry Cleaners
Introduction
This analysis estimates the number of metal hangers generated by dry cleaners in New York
City each year. Metal hangers primarily are made of steel, although some may have a
paperboard tube for the bottom of the hanger and on some, paper may cover the open center
89

Characterization of New York City’s Solid Waste Stream Spring 2000
part of the hanger. This analysis is limited to steel hangers generated by dry cleaners, and does
not include steel, wood, or plastic hangers that may be purchased separately by consumers for
use in households.
Methodology
The data used in this analysis is based on a survey of dry cleaners in New York City conducted
by the NYC Department of Sanitation. The survey developed annual usage of hangers by dry
cleaning establishments in the City based on annual usage of hangers at selected dry cleaners.
The data was subsequently used by The Tellus Institute to determine the number of hangers
reused each year by dry cleaning establishments in New York City. This analysis is based
primarily on the Tellus Institute work.
Assumptions
• 2,237 dry cleaners in New York City.
• 2,761 hangers bought per month by average dry cleaner (from DOS survey).
• An average steel hanger weighs 1.1 ounces.
• 89 percent of all NYC dry cleaners accept hangers back from customers.
• An estimated 340 hangers are returned to each accepting store each month.
• 0 percent recycling rate for hangers in New York City.
• All returned hangers are reused.
Calculations
• 2,237 dry cleaners in New York City x 2,761 hangers per month per dry cleaner x 12 =
74,116,284 new hangers bought in New York City each year.
• 2,237 dry cleaners in New York City x 89 percent accepting hangers x 340 hangers
returned to store x 12 = 8,122,944 hangers returned to dry cleaners each year.
• 74,116,284 new hangers x 1.1 ounces = 81,527,912 ounces of hangers divided by
32,000 ounces/ton = 2,548 tons of new hangers
• 8,122,994 returned hangers x 1.1 ounces = 8,935,293 ounces of returned hangers divided
by 32,000 ounces/ton = 279 tons of reused hangers not entering the waste stream.
• 2,548 tons of new hangers - 279 tons of hangers returned to dry cleaners = 2,269 tons
of hangers disposed in New York City’s waste stream.
Results
• Approximately 74,116,284 hangers are purchased by dry cleaners in New York City
each year.
90

Characterization of New York City’s Solid Waste Stream Spring 2000
• Approximately 8,122,944 of these hangers are returned to dry cleaners.
• The remainder of the hangers contribute 2,269 tons to New York City’s waste stream.
Discussion and Conclusions
Since hangers (or scrap metal of any kind) are part of recycling collection programs in 800,000
households in Staten Island, the Bronx and parts of Brooklyn, the 0 percent recycling rate used
for this calculation may be lower than actual recycling rates. However, an actual recycling rate
is not available and the rate may be only slightly greater than 1 percent. Based on actual
recycling rates, the total amount disposed may be slightly less than presented in this calculation.
The estimates developed in this analysis are based on survey data collected in 1993 from 1,700
dry cleaners in New York City. These dry cleaners are members of the Neighborhood Cleaners
Association and represent more than half of the dry cleaners in New York City. More than 100
dry cleaners returned the survey and fifty additional responses were obtained during site visits.
These 100 respondents may not provide a representative sampling of all dry cleaners’ activities.
Although the estimates are based on responses from only 6.7 percent of the dry cleaners in the
City, because no actual data exist regarding the number of hangers discarded in New York City,
the estimates provided in this report may be the most reasonable to date.
APPENDIX 28
New York City Waste Stream Composition Analysis:
Household Batteries
Introduction
Overall, consumer dry cell batteries only account for 0.09 percent of the municipal solid waste
disposed annually in the United States.1 There are eight types of dry cell batteries commonly
used by households. These batteries and the applications with which they are commonly
associated are listed in Exhibit 1 and discussed in greater detail below.2 Alkaline batteries,
which contain zinc and an alkaline electrolyte solution, constitute nearly 70 percent of the
overall battery waste stream, by weight. Zinc carbon batteries are a distant second, constituting
about 21.6 percent of the waste stream by weight. The zinc carbon batteries contain manganese,
zinc, and ammonium chloride. Both alkaline and zinc carbon batteries may contain small
amounts of mercury. Nickel cadmium batteries represent approximately 8 percent of the bat-
tery waste stream, by weight, but account for a substantial portion of the cadmium found in the
municipal solid waste stream as a whole. The button cell batteries, including zinc air, silver
oxide, and mercuric oxide each contribute less than one percent to the total battery waste
stream, but may contain significant quantities of heavy metals relative to their size.
91

Characterization of New York City’s Solid Waste Stream Spring 2000
The greatest concern related to batteries in the
waste stream is the impact of batteries on the
toxicity of the New York City waste stream rather
than the actual quantity of batteries discarded.
Batteries contain a range of heavy metals,
including cadmium, mercury, nickel, silver and
zinc. Several of these metals (i.e., mercury,
cadmium) are considered toxic to humans and
constitute hazardous waste in some instances
when disposed.
Efforts to reduce the toxicity of household
batteries have been numerous in the past few
years. For example, manufacturers have
voluntarily reduced, then eliminated, the use of mercury in alkaline batteries. The Mercury-
Containing and Rechargeable Battery Management Act of 1996 was enacted, which is intended
to “phase out the use of mercury in batteries and provide for the efficient and cost-effective
collection and recycling or proper disposal of used nickel-cadmium batteries, small sealed
lead-acid batteries, and other regulated batteries.” This piece of legislation has banned the
manufacture and sale of mercuric oxide button batteries in the U.S.
The exact quantities of consumer batteries disposed in New York City are not available;
therefore, estimates were developed, primarily based on industry sales data and per capita use.
The assumptions for each product were gathered from a wide range of sources, including
existing battery studies, national trade associations, and product manufacturers. The following
section describes the methodology used in this study, as well as the assumptions and
calculations used. The final section provides a discussion of the findings. The remainder of
this section discusses in more detail the attributes of common household batteries.
Alkaline Batteries
Alkaline batteries are the most commonly used household batteries, comprising approximately
63 percent of consumer battery sales in 1992. Alkaline batteries are constructed with a
manganese dioxide cathode, a zinc anode and an alkaline solution, usually potassium hydroxide,
as the electrolyte. Alkaline batteries typically contain small concentrations of mercury to increase
shelf life. New York State Law (Chapter 304, Laws of 1991) sets a standard of 0.025 percent
(250 ppm) mercury by weight for new (non-button or coin sized) batteries and 25 mg total
mercury for button or coin sized batteries. All of the major manufacturers of batteries now are
introducing mercury-free alkaline batteries.
Zinc-Carbon Batteries
Zinc-carbon batteries, the second most common type of household battery, comprise
approximately 20 percent of consumer battery sales nationally in 1992. These batteries use a
manganese dioxide cathode and a zinc anode with ammonium chloride as an electrolyte.
92
• Alkaline (Manganese) – flashlights, radios,
toys, calculators
• Zinc-Carbon – flashlights, radios, toys,
calculators
• Nickel Cadmium – portable rechargeable
products (e.g., power tools, video cameras,
cellular phones, radio-controlled toys)
• Zinc Air – hearing aids, cameras,
microphones, pagers
• Silver Oxide – calculators, watches
• Mercuric Oxide – hearing aids, cameras,
microphones, pagers
• Lithium – computers, cameras
Exhibit 1. Common Household Batteries

Characterization of New York City’s Solid Waste Stream Spring 2000
Zinc-carbon batteries also may contain small amounts of mercury to prolong shelf life and
decrease the potential for formation of hydrogen gas by the other battery components. New
York State law requires that these batteries meet a maximum mercury content of 1 ppm. Given
this low threshold, most zinc-carbon batteries now are manufactured without mercury.
Nickel-Cadmium Batteries
Nickel-cadmium, or NiCad, batteries accounted for over 9 percent of consumer sales in 1992,
nationally. NiCads represent the principal rechargeable consumer batteries in use today. These
batteries are manufactured with a nickel cathode, a cadmium anode, and an alkaline solution
such as potassium hydroxide for the electrolyte. Cadmium represents up to 20 percent of the
battery, by weight.
Zinc Air Batteries
Zinc air batteries are taking over the market share being lost by mercuric oxide batteries
(see below regarding mercuric oxide batteries). In 1992, they accounted for over 3 percent
of all domestic battery sales, and could account for 4 percent by 1996. Zinc air batteries are
manufactured with oxygen as the cathode, zinc as the anode, and an alkaline solution such as
potassium hydroxide as the electrolyte. Atmospheric air, which passes through holes in the
casing, provides oxygen for the cathode. Zinc air batteries have a longer shelf life than the
other common types of button batteries, silver oxide and mercuric oxide.
Silver Oxide Batteries
Silver oxide batteries, which accounted for approximately 2.5 percent of consumer battery sales
in 1992, use a silver oxide cathode, a zinc anode, and an alkaline solution, usually potassium
hydroxide or sodium hydroxide, as the electrolyte. Silver oxide batteries are most commonly
button cell batteries and contain approximately one percent (10,000 ppm) mercury by weight.
Mercuric Oxide Batteries
In 1992, mercuric oxide batteries accounted for 1.2 percent of all battery sales in the United
States, but sales of mercuric oxide batteries have been steadily declining and in 1996, they were
banned from use in the U.S. These batteries are manufactured with a mercuric oxide cathode,
a zinc anode, and an alkaline solution, such as potassium hydroxide or sodium hydroxide, as the
electrolyte. These button cell batteries are composed of about one third mercury.
Lithium Batteries
In 1992, lithium batteries accounted for 0.23 percent of total consumer battery sales; however,
their market share is expected to increase significantly during the next decade due to their
performance characteristics and low cost. These batteries use a lithium anode and manganese
dioxide or polycarbonmonofluoride cathode. A variety of non-aqueous organic or inorganic
solvents are used for the electrolyte. These batteries generally come in a battery pack
consisting of two batteries.
93

Characterization of New York City’s Solid Waste Stream Spring 2000
Methodology
This analysis uses two separate methodologies to estimate the quantity of batteries disposed in
New York City each year. Model #1 develops a range of disposal based on estimates by the
U.S. Environmental Protection Agency and the Arizona Garbage Project on the number of
batteries disposed each year by individuals and households, respectively, in the United States.
Model #2 uses total consumer battery sales, based on U.S. Department of Commerce data,
and assumes that all batteries have a lifespan of approximately one year.3 New York City sales
figures are estimated from national sales figures based on New York City representing three
percent of the population of the United States.
Model #1
Assumptions
• There are 7.3 million residents and 2.8 million households in NYC.4
• Each U.S. household discards 1.7 pounds of batteries per year.5
• Each individual in the U.S. discards 1.16 pounds of batteries per year.6
• Recycling rate for household batteries is 1.3 percent.7
Calculations
• 1.7 pounds of batteries per household per year x 2,800,000 households in NYC =
4,760,000 pounds of batteries generated in New York City per year.
• 4,760,000 pounds divided by 2,000 = 2,380 tons of household batteries generated per
year in New York City.
• 1.16 pounds of batteries per year per individual x 7,400,000 (New York City population)
= 8,584,000 pounds of batteries generated in New York City per year.
• 8,584,000 pounds divided by 2,000 = 4,292 tons of household batteries generated per
year in New York City.
• 1.3 percent recycling rate x 2,380 tons and 4,292 tons = 2,070.6 tons to 3,734 tons of
household batteries discarded.
Results
• New York City residents generate between 2,380 tons to 4,292 tons of household
batteries each year.
• Accounting for recycling, New York City residents discard between 2,070.6 tons and
3,734 tons of household batteries each year.
94

Characterization of New York City’s Solid Waste Stream Spring 2000
Table 1. Dry Cell Battery Sales in the United States and New York City9
1991 Sales Weight NYC (3% 1992 Sales Weight NYC (3%Battery Type ($ millions) (pounds) of Total) ($ millions) (pounds) of Total)
Alkaline
D 229 68,511,762 2,055,353 228 68,212,584 2,046,378
C 332 46,896,080 1,406,882 336 48,935,040 1,468,051
AA 1,187 59,122,096 1,773,663 1,289 664,202,512 1,926,075
AAA 166 4,174,236 125,227 181 4,551,426 136,543
9V 159 16,101,294 483,039 166 16,810,156 504,305
Subtotal 2,063 194,805,468 5,844,164 2,200 202,711,718 6,081,352
Zinc-Carbon
D 173 34,094,148 1,022,824 164 32,320,464 969,614
C 156 14,438,424 433,153 154 14,253,316 427,599
AA 292 10,895,104 326,853 296 11,044,352 331,331
9V 70 5,376,140 161,284 69 5,299,338 158,980
Subtotal 691 64,803,816 1,944,114 683 62,917,470 1,887,524
Mercuric Oxide 45 155,430 4,663 43 148,522 4,456
Silver Oxide 87 176,088 5,283 89 180,136 5,404
Zinc-Air 94 322,608 9,678 117 401,544 12,046
Sealed Nickel Cadmium
D 44 6,062,650 181,880 44 6,096,200 182,886
C 52 6,055,342 181,660 55 6,401,010 192,030
AA 162 8,027,613 240,828 179 8,872,123 266,164
AAA 18 440,697 13,221 20 495,442 14,863
9V 25 2,072,928 62,188 27 2,191,943 65,758
Subtotal 302 22,659,229 679,777 326 24,056,717 721,702
Lithium 7 428,736 12,862 8 489,984 14,700
Totals 3,289 283,351,375 8,500,541 3,466 290,906,091 8,727,183
Model #2
Assumptions
• 250 million people in the U.S.
• 7.4 million people living in New York City.
• In 1991, 283 million pounds (141,500 tons) of consumer batteries were purchased in
the U.S. In 1992, 291 million pounds (145,000 tons) were purchased.8 Table 1
summarizes sales of dry cell batteries in the U.S. and in New York City for 1991 and
1992 (the most recent years for which data are available).
95

Characterization of New York City’s Solid Waste Stream Spring 2000
• In general, batteries have a life span of less than one year.
• Recycling rate for dry cell household batteries is 1.3 percent.
Calculations
• 250 million people in the U.S. divided by 7.4 million people living in New York City =
three percent (3%) of the total population lives in New York City.
• Three percent (NYC population share) of 283,351,375 pounds of batteries sold in U.S.
in 1991 = 8,500,541 pounds of batteries sold in New York City in 1991.
• 8,500,541 pounds of batteries sold in New York City in 1991 divided by 2000 =
4,250.3 tons of batteries generated in New York City in 1991.
• Three percent (NYC population share) of 290,906,091 pounds of batteries sold in U.S.
in 1992 = 8,727,183 pounds of batteries sold in New York City in 1992.
• 8,727,183 pounds of batteries sold in New York City in 1992 divided by 2000 =
4,363.6 tons of batteries generated in New York City in 1992.
• 1.3 percent recycling rate x 4,250.3 tons of batteries in 1991 = 3,697.5 tons of
batteries discarded.
• 1.3 percent recycling rate x 4,363.6 tons of batteries in 1992 = 3,796.7 tons of
batteries discarded.
Results
• In 1991, approximately 4,250 tons of household batteries were generated and
3,697.5 tons were discarded in New York City.
• In 1992, approximately 4,364 tons of household batteries were generated and
3,796.7 tons were discarded in New York City.
Discussion and Conclusions
The first model used in this analysis estimates that between 2,070.6 tons to 3,734 tons of
household batteries are disposed in New York City each year. This model used two different
estimates of quantities of batteries disposed by households and individuals, developed by the
Arizona Garbage Project and the U.S. EPA, respectively. The model based on annual
generation of batteries by households estimates 4,292 tons per household. This estimate is
much closer to the results derived by the second model, which is based on annual sales of
batteries. The second model estimates 4,250 tons generated and 3,697.5 tons discarded in
1991, and 4,364 tons generated and 3,796.7 tons discarded in 1992. Given the similarity
of these results, we can assume that the average annual disposal of household batteries in
New York City lies between 3,697.5 to 3,796.7 tons per year.
These estimates use a recycling rate for household batteries of 1.3 percent. However, for future
studies it is important to note that this rate may become more significant as a result of the
96

Characterization of New York City’s Solid Waste Stream Spring 2000
Mercury-Containing and Rechargeable Battery Management Act of 1996. The law standardizes
recycling labeling for rechargeable batteries that are consistent with international labeling
standards and mandates collection and recycling of rechargeable nickel-cadmium batteries.
In addition, products with rechargeable cells must be “easily removable,” which is consistent
with New York State’s 1991 law.10 Furthermore, the NiCd battery industry has been establishing
programs for the recovery and recycling of NiCd batteries, facilitated by passage of U.S. EPA’s
recent “Universal Waste” rule exempting NiCad batteries sent for recycling from regulation as
hazardous waste.
New York City’s Pilot Special Waste Collection Program also may contribute to a decrease in
batteries disposed. The program is designed to divert several special wastes, such as batteries,
fluorescent tubes, and latex paint, from the waste stream for recycling. The program has only
recently been initiated and is expected to increase in effectiveness in the next few years.
The data used for this report was the most current information available to the consultant.
Updated battery sales data, which appears to provide the most reliable data on household
battery generation, will be available in 1997 from the U.S. Department of Commerce, Bureau
of the Census.11
1 Council of State Governments. “Getting a Charge Out of the Waste Stream.” 1992. p.68,71.2 Background battery information taken from New York State Department of Environmental Conservation, “Report on Dry Cell
Batteries in New York State,” December 1992.3 Personal communication, Nancy Greenberg, NYC DOS, with Charlie Monahan, Panasonic, 7/11/96.4 1990 Census data, NYC Planning.5 The Garbage Project, Sources and Fate of Heavy Metals in MSW Landfills: Lead, Zinc, Cadmium, and Mercury, University of Arizona, 1989.6 Miller, Chaz. “Household Batteries.” Waste Age. April, 1994.7 The recycling rate was calculated based on information from the Portable Rechargeable Battery Association indicating that 15
percent of all NiCd batteries were recycled in 1995, and estimates that NiCd batteries represent 9 percent of battery sales. NiCd
batteries are the only type of household batteries recycled in significant quantities. 8 Recoverable Resources/Boro Bronx 2000, Inc., “Getting a Charge Out of the Waste Stream,” 1992, p.68. Data from U.S.
Department of Commerce do not include institutions and commercial/industrial users.9 U.S. data taken from “Getting a Charge Out of the Waste Stream,” p.70.
10 Woods, Randy. “Battery Recycling Law Launches RBRC Program.” Recycling Times. May 28, 1996.11 Department of Commerce data may be ordered by calling 301-457-4797.
APPENDIX 29
New York City Waste Stream Composition Analysis:
Thermostats
Introduction
This analysis estimates the quantity, in tons, of used thermostats in the New York City waste
stream, as well as the quantity of mercury they may contribute to the waste stream. Thermostats
are present in residential, institutional, and commercial settings. Three general types are
97

Characterization of New York City’s Solid Waste Stream Spring 2000
removed from service. These are: 1) the nonprogrammable electromechanical thermostat
(rectangular or round) common to many older homes and businesses, 2) the programmable
electromechanical thermostat, and 3) the programmable electronic thermostat that allows
various settings and does not contain mercury.
Thermostats are generally composed of plastic, metal, and a small amount of mercury in
certain models. Thermostats have a very long lifespan, ranging from 15 to 20 years for some of
the more complex, electronic models, to 20 to 40 years for the older, electromechanical
models. The thermostat market in the New York City area is a mature one, consisting of mostly
replacement sales for retrofitting.
Honeywell, a major manufacturer of thermostats, has had a pilot mercury recycling program with
Minnesota wholesalers. Honeywell’s market research shows that most servicing utilities and
contractors do not recycle thermostats that are removed or replaced, in part because of the
difficulty presented in consolidating, manifesting, and transporting thermostats containing
mercury. Many are left with the homeowner to save or discard. Con Edison in the New York
City area indicates that it has recently implemented a policy where the installer leaves the old
thermostat with the homeowner or building supervisor, rather than collecting it. This reduces
the burden on Con Edison to consolidate, manifest, and transport thermostats containing mercury.
The exact quantity of thermostats disposed in New York City is not available; therefore,
estimates were developed based on data obtained from industry representatives.
Methodology
The estimates presented in this study were derived from figures provided by major manufacturers
and installers of thermostats. A ratio of households to thermostats collected in Minnesota’s
highly successful pilot recycling program is used, with the number of New York City households,
to determine the number of thermostats potentially generated in NYC. Honeywell
representatives indicate that the recycling rate in the pilot program is fairly high. The small
quantity of thermostats not captured in the Minnesota recycling program are either discarded,
stored by the homeowner (which is a common practice), or reused by the contractor as a
temporary unit. Because thermostats are not recycled in New York City, it can be assumed that
the number per household recovered for recycling in Minnesota would be discarded in NYC.
Assumptions
• A typical nonprogrammable electromechanical thermostat weighs 4/10 lb. or 6.4 oz.
• A typical programmable electromechanical thermostat weighs 9/10 lbs. or 14.4 oz.
• A typical programmable electronic thermostat weighs 1.1 lbs. or 17.6 oz.1
• These three types are purchased at a ratio of 60% nonprogrammable
electromechanical, 25% programmable electromechanical, and 15% electronic.2
• The weighted average weight of a thermostat is 10.08 oz.3
• The average mercury bulb in a thermostat contains 3 grams of mercury.4
98

Characterization of New York City’s Solid Waste Stream Spring 2000
• Most thermostats contain one mercury bulb.5
• The number of households in the State of Minnesota equals 1,848,445.
• The number of households in New York City equals 2,992,169.6
• The number of thermostats and bulbs collected in the Minnesota Thermostat recycling
program was 13,293 in 1995 and 11,961 in 1996. The average for the two years is
12,627 thermostats/bulbs.7
Calculations
• The ratio of households to thermostats collected in Minnesota = 1,848,445 divided by
12,627 = 146.39.
• 2,992,169 (the number of households in NYC) divided by 146.39 = 20,440 thermostats
• 20,440 x 10.08 oz. = 206,035.2 oz. or 6.4 tons of thermostats
• 20,440 x 85% (thermostats with mercury) = 17,374 thermostats
• 17,374 x 3 grams = 52,122 grams or 114 pounds of mercury in the 6.4 tons of
discarded thermostats.
Results
• A total of approximately 6.4 tons of thermostats are generated and discarded in New
York City each year.
• These thermostats contribute 114 pounds of mercury to the New York City waste stream.
Discussion
Since no data for New York City were available, results from a pilot project in Minnesota were
used. This report assumes that the number of thermostats discarded per household is fairly
standard across regions of the U.S. Therefore, it is possible to use figures from Minnesota to
calculate numbers for New York City.
Recycling of thermostats should expand considerably over the next few years throughout the
U.S. and in New York City as a result of both industry initiatives, such as pilot programs begun
by Honeywell, and community programs, such as New York City’s Pilot Special Waste
Collection Program.
Although thermostats contribute an extremely small quantity to the overall solid waste stream,
the main concern regarding thermostats is the contribution of mercury. Each thermostat
contains approximately three grams of mercury, which may potentially lead to environmental
contamination if not properly managed in the solid waste stream.
1 All thermostat weights were from a personal communication, Jeanne Carlson, SAIC, with Greg Swain, Honeywell Inc., 11/26/96.2 Personal communication, Jeanne Carlson, SAIC, with Nancy Jansen, Honeywell Inc., Home and Building Control, 1/28/97.
99

Characterization of New York City’s Solid Waste Stream Spring 2000
3 Ibid.4 Ibid.5 Ibid.6 Household data is from the U.S. Bureau of Census, 1990 data.7 Personal communication, Jeanne Carlson, SAIC, with Nancy Jansen, Honeywell Inc., Home and Building Control, 1/28/97.
APPENDIX 30
New York City Waste Stream Composition Analysis:
Latex Paint
Introduction
This analysis estimates the quantity, in gallons, of unused latex paint entering the New York City
waste stream. Over 500 million gallons of architectural paint are sold in the U.S. each year. Of
this, approximately 468 million gallons are latex-based paints. Latex-based paints generally are
used in architectural applications, such as home and office building painting, and are purchased
by a wide range of consumers, including homeowners, contractors, and government agencies.
Latex-based paint is a general term used for water-based emulsion paints made with synthetic
binders, such as 100 percent acrylic, vinyl acrylic, terpolymer or styrene acrylic; a stable
emulsion of polymers and pigment in water.1
An average of two gallons of household paint is sold for each person in the United States each
year.2 Often, used paints and paint thinners are poured into drains, which can disrupt microbes
in the sewer system, causing less effective and more costly sewage treatment. Paints also contain
toxic chemicals that can pollute the air and enter ground water, harming fish and wildlife and
contaminating the food chain.
The U.S. does not consider latex formulations hazardous under the Resource Conservation
and Recovery Act (RCRA). Three states - California, Minnesota, and Washington - currently
require special disposal methods for latex paint, but in other locations, it can be dried by
adding absorbent material, such as cat-box filler, and disposed of in the regular trash. Empty
metal paint cans can then be recycled. Paints ends up constituting 40 to 70 percent of house-
hold hazardous waste collected by local and state governments, although the majority of this
is latex paint, which is not technically considered hazardous.3
Methodology
This analysis uses two models to estimate the quantity of unused latex paint that might enter the
New York City waste stream. Model #1 uses Department of Commerce data for the quantity of
latex paint shipped in the United States in 1994, applies a ratio of the New York City to U.S.
population to determine the percent that can be expected to be shipped to New York City, and
then assumes a percent unused to determine the quantity disposed.
100

Characterization of New York City’s Solid Waste Stream Spring 2000
Model #2 adapts figures from a study commissioned in early 1995 by the National Paint and
Coatings Association (NPCA) on leftover paint. This survey asked 1,000 consumers nationwide
whether they had unwanted leftover paint stored in their homes. Of the 749 respondents,
29 percent said that they had some leftover paint they no longer wanted. The average amount
of leftover, unwanted products found in these households was a total of .375 gallons. This
figure includes an array of products, including paint, paint thinners, stain, aerosol spray paint,
polyurethane/varnish, and clear sealer. According to the study, unused paint alone accounted
for less than a third of a gallon per household on average. Based on these findings, the second
model assumes that 29 percent of New York City households will generate approximately
two-tenths of a gallon of unused latex paint each year.
Calculations
Model #1
Assumptions
• 468,000,000 gallons of latex paint shipped in U.S.4
• 7.3 million people living in New York City in 1990.5
• 1.0 percent of latex paint shipped is unused.6
• 0.5 percent recycling rate for latex paint in New York City.
• 1 gallon of latex paint weighs 8.34 pounds.
Calculations
• 248.7 million people in the U.S. divided by 7.3 million people living in New York City
= 2.9 percent of the total population lives in New York City.
• 468,000,000 gallons of latex paint x 2.9 percent = 13,572,000 gallons of latex paint
shipped to New York City, annually.
• 13,572,000 gallons of latex paint x 1.0 percent assumed unused = 135,720 gallons of
unused latex paint in New York City, annually.
• 135,720 gallons of unused paint x 0.5 percent recycled/reused = 135,041 gallons of
unused latex paint generated in New York City, annually.
• 135,041 gallons x 8.34 divided by 2000 = 563.1 tons of unused latex paint generated
in New York City, annually.
Model #2
Assumptions
• 2.8 million households in New York City.7
101

Characterization of New York City’s Solid Waste Stream Spring 2000
• 29 percent of households have two-tenths of a gallon of unused latex paint.8
• 0.5 percent recycling rate for latex paint in New York City.
• 1 gallon of latex paint weighs 8.34 pounds.
Calculations
• 2,800,000 x 29 percent = 812,000 households in New York City with unused latex paint.
• 812,000 x 0.2 gallons per household = 162,400 gallons of unused latex paint in New
York City.
• 162,400 x 0.5 percent recycled/reused = 161,588 gallons of unused latex paint
generated in New York City, annually.
• 161,588 gallons x 8.34 divided by 2000 = 673.8 tons of unused latex paint generated in
New York City, annually.
Results
• Approximately 563 tons to 674 tons of unused paint are generated in New York City, annually.
Discussion
The two models used in this study generate similar results so it can reasonably be assumed that
the actual quantity of used latex paint generated in New York City, on an annual basis, falls in
this range.
Figures from the NPCA national survey show that Americans do tend to accumulate unused
paint. Only 29 percent of the survey respondents said that they dispose of the paint within the
first 12 months after purchase, and more than 67 percent said they keep it for more than
12 months. Other studies have shown that, on average, households keep paint about 4.6 years
before they are through with it.9 This study assumes a steady-state system of accumulation and
disposal, i.e., that as paint is accumulated by households in the city an equivalent quantity will
be disposed each year by the same or other households.
It should be noted that this study only addresses the quantity of unused latex paint that may
be discarded. This paint will most likely be contained in steel or HDPE plastic containers. The
City’s collection program for unused latex paint should address these containers, as well.
The data used for this report was the most current information available to the consultant.
Updated paint sales data may be obtained from the U.S. Department of Commerce, Bureau
of the Census.10
1 National Paint and Coatings Association.2 Ibid.
102

Characterization of New York City’s Solid Waste Stream Spring 2000
3 Ibid.4 1994 U.S. Department of Commerce.5 New York City Department of Planning, 1995 census data.6 Figures were not available regarding the actual quantity of paint not used. Therefore, a conservative estimate of 1 percent is
used for this analysis.7 Ibid.8 Adapted from National Paint and Coatings Association Study, 1995.9 National Paint and Coatings Association.
10 Department of Commerce data may be ordered by calling 301-457-4797.
APPENDIX 31
New York City Waste Stream Composition Analysis:
Fluorescent Tubes and Ballasts
Introduction
This analysis estimates the quantity of fluorescent tubes and ballasts found in the New York City
waste stream. Fluorescent tubes generally come in four or eight foot lengths. They are tubes
of thin glass coated on the inside with fluorescent materials that convert ultraviolet light
generated by an electric discharge into a visible wavelength. Fluorescent tubes contain small
amounts of mercury, cadmium and antimony and are sealed on the ends with aluminum fittings.
There are two common types of fluorescent tubes used in industrial and household settings,
known as T-12s and T-8s. The 40-watt T-12 fluorescent tubes have dominated the market for
decades; however, the smaller-diameter T-8 tubes are gaining popularity because they can
increase lumens per watt to over 100, as opposed to the current standard of 60 lumens per watt.
This study does not consider the smaller compact fluorescents, which can replace incandescent
bulbs in many settings, and could be included in future household collection programs.
Fluorescent tubes generated by businesses that are conditionally exempt small quantity
hazardous waste generators can be disposed with municipal solid waste, but the preferred
management method is recycling so that the hazardous components can be managed correctly
and the recyclable components can be recovered. Most standard fluorescent lamps are
manufactured from a soda-lime glass tube. The end-caps are usually aluminum and the wires,
or electrodes, are made of tungsten. The inside of a standard cool white fluorescent lamp is a
white coating typically called a phosphor and is usually a calcium chloro-fluoro-phosphate,
with small amounts of antimony and manganese tightly bound in the phosphor matrix. The
amounts of these components vary according to the color of the lamp. A standard four-foot
lamp has approximately 6 grams of phosphor coating its inside length. Mercury is also present
in small amounts in all fluorescent lamps. A standard four-foot lamp contains approximately
50 milligrams or less of mercury.1
Ballasts are auxiliary units used in conjunction with fluorescent tubes that provide the starting
voltages required for the fluorescent tubes to generate electricity and light. Typically, one ballast
103

Characterization of New York City’s Solid Waste Stream Spring 2000
is required for every four feet of lamp. Ballasts may be either electronic or magnetic. Magnetic
ballasts still are more common but electronic ballasts are approximately 10 to 15 percent more
energy efficient.
Ballasts manufactured prior to 1979 contain PCBs, which were used as an insulating material.
After 1979, ballasts were manufactured using di(2-ethylhexyl)phthalate (DEHP) as an insulating
material. While safer than PCBs, DEHP is a suspected human carcinogen. The preferred
method of ballast management is incineration of the PCB/DEHP portion and recycling the copper,
steel, and aluminum components. Ballasts generated by businesses that are conditionally
exempt small quantity hazardous waste generators can be disposed in municipal or hazardous
waste landfills or incinerated, depending on PCB levels, but these methods are not recommended
given their environmental and potential liability costs. Ballasts exhibiting evidence of leaking
fluids (leakers) cannot be recycled. Leakers are regulated under the Toxic Substances Control
Act (TSCA), as are ballasts that contain greater than 50 ppm PCBs or fail the Toxicity
Characteristic Leaching Procedure (TCLP) test.
The exact quantities of fluorescent bulbs and ballasts disposed in New York City are not
available; therefore, estimates were developed based on industry sales data, per capita use,
estimated life spans, and respective recycling rates.
The assumptions for each product were gathered from a wide range of sources, including
national trade associations, product manufacturers, and recyclers. The following section
describes the methodology used in this study, as well as the assumptions and calculations used.
The final section provides a discussion of the findings.
Fluorescent Tubes
Methodology
Two models were used to calculate the number of fluorescent bulbs disposed in New York City
each year. Model #1 applies the ratio of New York City population (7.3 million) and total U.S.
population (248.7 million) to the total fluorescent light bulb sales data for the United States.
In 1991, 500-550 million fluorescent lamps were purchased in the United States. Mercury
Technologies International (MTI), one of the largest recyclers of fluorescent tubes in the U.S.,
states that “each year 500-550 million mercury containing fluorescent tubes are thrown in the
trash in the United States.”2
Fluorescent tubes have a lifespan of approximately five years, so for the purpose of this report
we have assumed that tubes bought in 1991 will be disposed in 1996. The National Electrical
Manufacturers Association (NEMA) provided this figure and recommended this approach.
NEMA also pointed out that the fluorescent lamp industry is not a fast-growing industry and
that in 1994, 570 million tubes were sold in the United States, only a slight increase over the
figures for 1991.3
Model #2 uses a multiplier provided by Philips Lighting Company that assumes that on
average, each resident uses 2.1 tubes per year.4
104

Characterization of New York City’s Solid Waste Stream Spring 2000
Model #1
Assumptions
• 248.7 million people in the U.S.
• 7.3 million people living in New York City.5
• 500-550 million tubes were bought in 1991.6
• Fluorescent tubes have a lifespan of five years.
• The national recycling rate for all fluorescent tubes is approximately 14 to 18 percent.7
• The recycling rate in New York City for all fluorescent tubes is approximately one percent.8
• At the time of this report, the residential recycling rate for fluorescent tubes is 0 percent
due to the absence of a residential fluorescent tube collection program.
• The quantity of material reclaimed from each lamp during recycling is usually as high
99.9 percent.9
• 80 percent of all fluorescent tubes are used in the commercial/industrial sector and
20 percent are from the residential sector. Of the 20 percent from the residential sector,
the majority are sold in hardware and home stores.10
• The average weight of a four foot fluorescent lamp is 10 ounces.
Calculations
• 248.7 million people in the U.S. divided by 7.3 million people living in New York City =
2.9 percent of the total population lives in New York City.
• 2.9 percent (NYC population share) of 500 to 550 million tubes bought in the U.S. =
15 to 16.5 million purchased in New York City in 1991.
• 80 percent of 15 to 16.5 million tubes = 12 to 13.2 million fluorescent tubes used in
commercial/industrial facilities in New York City.
• 20 percent of 15 to 16.5 million tubes = 3 to 3.3 million fluorescent tubes used by the
residential sector.
• One percent recycling rate for fluorescent tubes in the New York City commercial/
industrial sector multiplied by 12 to 13.2 million tubes generated = Between 11.9 to
13.1 million fluorescent tubes discarded.11
Results
• In 1996, approximately 15 to 16.5 million spent fluorescent tubes will be generated
in New York City. Of these, between 12 and 13.2 million fluorescent tubes will be
generated by commercial and industrial facilities and between 3 and 3.3 million
fluorescent tubes will be generated in the residential sector.
105

Characterization of New York City’s Solid Waste Stream Spring 2000
• Adjusting for recycling in the commercial/industrial sectors, between 14.9 and
16.4 million fluorescent tubes will be disposed in New York City in 1996.
• 14.9 to 16.4 million fluorescent tubes weigh approximately 4656.3 to 5125 tons
(3725 to 4100 tons commercial/industrial and 931.3 to 1025 tons residential) and
contain approximately 745 to 820 million milligrams of mercury.
Model #2
An alternative method of measuring the disposal of light bulbs in NYC was provided by Phillips
lighting. Philips reports a standard lighting industry formula that multiplies the population in
the selected region by 2.1 to arrive at the number of fluorescent tubes disposed of per year.12
Assumptions
• 248.7 million people in the U.S.
• 7.3 million people living in New York City.13
• Each resident uses 2.1 tubes per year.
Calculations
• 2.1 multiplied by NYC population of 7.3 million = 15,540,000 spent tubes generated
annually in NYC.
• 80 percent of 15.5 million tubes = 12,432,000 million fluorescent tubes used in
commercial/industrial facilities in New York City.
• 20 percent of 15.54 million tubes = 3.1 million fluorescent tubes used in the residential
sector.
• One percent recycling rate for fluorescent tubes in the New York City commercial/
industrial sector multiplied by 12,432,000 tubes generated = 12,307,608 fluorescent
tubes discarded.
Results
• In 1996, approximately 15.5 million spent fluorescent tubes will be generated in New
York City.
• Of these, approximately 12.4 million fluorescent tubes will be generated by commercial
and industrial facilities and 3.1 million fluorescent tubes will be generated by the
residential sector.
• Adjusting for recycling in the commercial/industrial sectors, approximately 12.3 million
fluorescent tubes will be disposed commercially in New York City in 1996, totaling
15.4 million tubes discarded.
106

Characterization of New York City’s Solid Waste Stream Spring 2000
• 15.4 million fluorescent tubes weigh approximately 4812.5 tons (3850 tons commercial/
industrial and 962.5 tons residential) and contain 770 million milligrams of mercury.
Ballasts
Methodology
Based on the assumption made by Philips Lighting that population is an indicator of fluorescent
lighting use, this analysis also uses population as an indicator of ballast use. Estimates are
based on industry information regarding the number of ballasts in use in the United States, and
the ratio of New York City’s population to that of the United States.14
Assumptions
• There are an estimated 400 million to 1.6 billion ballasts currently in service in the U.S.
This analysis assumes approximately one billion ballasts in the U.S.15
• Roughly, a 4-foot lamp with two bulbs will use one ballast and an eight foot lamp uses
two. A typical 100,000 square foot building contains 2,000 to 3,000 ballasts.16
• Ballasts last approximately 20 years, so 1/20th of the ballast stock can be assumed to be
discarded each year.
• The three largest ballast recyclers in the United States, together, recycle approximately
100 tons per day of ballasts.17
• An F40 ballast weighs 3.8 pounds and an F96 ballast weighs 6 pounds. F40 ballasts
are much more prevalent.
• 25 ballasts together contain approximately one pound of PCBs.18
• When ballasts are recycled, on average, 85 percent of original materials can be
reclaimed and recycled. Eighty percent of ballasts are metal.19
• In New York City, 172,500 ballasts are recycled each year.20
Calculations
• 248.7 million people in the U.S. divided by 7.3 million people living in New York City =
2.9 percent of the total population lives in New York City.
• Three percent (NYC population share) of one billion ballasts in the U.S. = 30 million
ballasts in use in New York City.
• 30 million ballasts divided by twenty year life span of ballast = 1.5 million spent ballasts
generated in New York City each year.
• 1.5 million spent ballasts minus 172,500 ballasts that are recycled = 1,327,500 ballasts
disposed in New York City each year.
107

Characterization of New York City’s Solid Waste Stream Spring 2000
• If 75% of these ballasts contain PCBs, 995,625 ballasts that contain PCBs are disposed in
New York City each year containing 19.9 tons of PCBs. 21
Results
• Approximately 1.5 million spent ballasts are generated in New York City each year con-
taining approximately 19.9 tons of PCBs.
• Of this, 1.3 million are disposed.
• 2,828 tons of ballasts are discarded in New York City each year.
Discussion
The results of the methodology used in this
analysis to estimate the quantity of fluorescent
tubes and ballasts generated and disposed in New
York City each year are summarized in Figure 3.
Because no actual data exist regarding the
number of fluorescent tubes and ballasts generated or disposed in New York City, estimates
had to be developed based on secondary factors, such as national sales figures and industry
estimates. New York City has a much different economic base and associated infrastructure
than most other areas in the United States that might result in there being more fluorescent
lighting per capita than other regions in the country. Given this, the estimates derived in this
analysis may prove somewhat conservative. However, we can be confident that the actual
quantity generated and disposed for each product is near the estimates provided in this report.
The data and results presented here were derived from the most up-to-date and accessible
data available to the consultants at this time and the estimates presented here are deemed to
be representative of annual quantities of fluorescent lamps and ballasts likely generated in New
York City in 1996. As recycling infrastructures and disposal regulations continue to evolve,
the estimates provided in this report may have to be revised as new figures become available
from recyclers and manufacturers.
Fluorescent Tubes
This analysis used two models to estimate the number of fluorescent lamps disposed in New
York City each year. The majority of these lamps will be 4-foot T-12s. The first model, using
annual sales data, estimated between 14.9 million and 16.4 million tubes will be disposed in
New York City each year. The second model, based on population, estimated that 15.4 million
tubes will be disposed in New York City. Since 15.4 million falls in the range provided by the
first model, we can be confident that the actual number of fluorescent tubes disposed in
New York City in 1996 will fall between 14.9 and 16.4 million tubes.
108
Fluorescent Lamps: 14.9 to 16.4 million
(4,656.3 to 5,125 tons)
Ballasts: 1.3 million ballasts (2,828 tons)
Figure 3. Fluorescent Tubes and Ballasts
Disposed in NYC, Annually

Characterization of New York City’s Solid Waste Stream Spring 2000
Approximately 931.3 to 1025 tubes are used in residential applications. Currently, a small
number of these are collected through New York City’s Special Waste program, and this is
expected to increase as the program becomes more established over the next few years.
Ballasts
This analysis used one model to estimate the number of ballasts disposed each year in New
York City. Given the apparent accuracy of estimating bulb disposal based on population, we
also used a population-based model to estimate ballast generation. This model, which assumes
a ballast life of 20 years, provided an estimate of 1.3 million ballasts disposed in New York City
each year. Information on quantities of ballasts recycled is sparse and it appears that both
ballast and fluorescent lamp recycling rates are lower in New York City than at the national
level. However, once new or more reliable data are available, the estimates here may need to
be updated.
1 Excerpt information from GE published in Potential Impacts of Environmental Regulations on Disposal of Lamps by PG & E
Commercial Customers, Pacific Gas and Electric, December 1990.2 Mercury Technologies Corporation, L.P. Company Profile, p. 13.3 Personal communication, Nancy Greenberg, NYC DOS with Rick Erdeim, Environmental Affairs, NEMA, 4/12/96 (Henceforth
NEMA).4 Philips Lighting Company. “Fluorescent Lamp Disposal Census.” 1995.5 New York City Department of Planning, 1995 census data.6 NEMA.7 In the U.S., between 75-100 million fluorescent tubes are recycled annually. The annual generation is approximately 550 million;
therefore the recycling rate is between 14 and 18 percent. Source: Leishman, David. “Conscientious Disposal.” C&D Debris
Recycling. Spring, 1996.8 Three of the primary fluorescent lamp recyclers in New York City combine for over 90 percent of the market for fluorescent tube
recycling. In 1995, Alta Resources Management Services Inc, Global Recycling, and America Lamp Recyclers, combined,
recycled between 83,429 and 162,357 fluorescent tubes. Based on the estimated generation rates provided in this study, this
equates to a recycling rate of approximately one percent.9 David Leishman. “Conscientious Disposal.” C&D Debris Recycling. Spring 1996.
10 NEMA.11 Assuming fluorescent tubes used in households are not recycled. 12 Phillips Lighting Company. “Fluorescent Lamp Disposal Census.” 1995.13 New York City Department of Planning, 1995 census data.14 Specifically, data provided by FulCircle Recyclers, Inc.15 Mitchell Dong, and Brin McCagg. “Consider Recycling as Disposal Option for PCB Ballasts.” NAILD News. November, 1993 and
Mitchell Dong and Brin McCagg. The Practical Guide to Ballast Disposal. FulCircle Recyclers, Inc. 1995.16 Ibid.17 Leishman, David. “Conscientious Disposal,” C&D Debris Recycling. Spring, 1996.18 The Practical Guide to Ballast Disposal. FulCircle Recyclers, Inc., 1995.19 Ibid.20 FulCircle Ballast Recyclers, Inc. reports that on a national level they recycle approximately 3 million ballasts each year. FulCircle
estimates that 5% or 150,000 of this total is generated in New York City. FulCircle estimates that they have 85 percent of the
recycling market in New York City. Therefore, approximately 172,500 ballasts are recycled in the City each year.21 In theory, all of the ballasts disposed of in 1995 would contain PCBs, because we are assuming a 20 year lifespan for one ballast.
However there is no way of knowing with certainty the actual percent containing PCBs. Using best professional knowledge we
therefore assumed 75% of the lamps disposed contain PCBs.
109

Characterization of New York City’s Solid Waste Stream Spring 2000
APPENDIX 32
New York City Waste Stream Composition Analysis:
Incandescent Bulbs
Introduction
This analysis provides estimates of the quantity of incandescent light bulbs found in the New
York City waste stream. In general, incandescent bulbs are distinguished from fluorescent tubes
in that light is produced by heating a filament that gives off light rather than converting
electricity into light via phosphorous materials. In addition, incandescent bulbs do not require
ballasts to regulate the flow of electricity, as do fluorescent tubes.
The glass bulb of most incandescent lamps is made with lime glass. However, some smaller,
higher wattage, or outdoor bulbs are made with low-expansion, heat-resistant lead and
borosilicate glasses. The filament is a coil of tungsten wire that is heated by an electric current
to produce light. The bulb is filled with an inert gas, usually nitrogen or nitrogen-argon. The
inert filling gas helps to redeposit tungsten particles back on the filament as it heats and
evaporates. Lead-in wires electrically connect the filament to the lamp base. These lead-in
wires may be nickel, copper, molybdenum or various other metals. The composite wire that is
sealed in the stem press is made of a nickel-iron core in a copper sleeve. Molybdenum wires
also are used as support wires for the filament. The inside of the bulb is coated with a specially
prepared kaolin clay.1
The exact quantities of incandescent bulbs disposed in New York City are not available; therefore,
estimates were developed based on industry sales data, per capita use, estimated life spans,
and respective recycling rates. The number of incandescent bulbs sold domestically by
manufactures was provided through census data published by the United States Department
of Commerce (DOC). The information was collected by the DOC in a survey of all known
manufacturers of electric lamps (bulbs only) in the United States. In 1993 this included
37 different companies. This analysis includes general lighting incandescent bulbs typically
used in household applications, and a wide array of other types of incandescent bulbs. General
lighting bulbs range from 15 to 200 watts and come in the familiar teardrop shape. They do
not include Christmas tree lamps and other specialty lamps that might occasionally be used in
household applications. Other types of bulbs include photoflash bulbs, flashlight bulbs, traffic
and street lighting, auto lights, radio panel lights, sunlamp bulbs, and several other types. The
figures used for this analysis are the most recent annual figures available to the consultant.
The assumptions used in this analysis were gathered from a wide range of sources, including
national trade associations and product manufacturers. The following section describes the
methodology used in this study, as well as the assumptions and calculations used. The final
section provides a discussion of the findings.
Methodology
The methodology used in this analysis assumes that, on a per capita basis, individuals living in
New York City will consume the same quantity of incandescent bulbs each year as individuals
110

Characterization of New York City’s Solid Waste Stream Spring 2000
residing in the rest of the U.S. Using this assumption we have taken the ratio of the population
of New York City to the population of the United States and applied this to the number of
incandescent bulbs shipped in the United States in 1993 and 1994 to develop an estimate of
the number of bulbs shipped to New York City in those years. The most recent year for which
population data are available for both the United States and New York City is 1990. We are
using 1990 population figures, assuming that the population of the United States and New York
City are growing at roughly the same rate, approximately one percent per year.2
Manufacturers were able to provide the weight of cases of various types of bulbs. However,
the manufacturers were not able to provide data about what percent of each type of bulb were
sold. Therefore, we are assuming that 70 percent of all bulbs are standard soft white bulbs;
25 percent are standard long life soft white bulbs; and 5 percent are smaller bent tip clear
candle lights.3 The estimates of the weight contribution to the waste stream of incandescent
bulbs are based on these assumptions.
In addition, this methodology assumes that, on average, the number of bulbs shipped in a year
is equal to the number of bulbs discarded in a year.
Assumptions
• 248.7 million people in the U.S. in 1990.
• 7.3 million people living in New York City in 1990.4
• 3,312,991,000 total lamps shipped domestically in 1993.5
• 3,293,504,000 total lamps shipped domestically in 1994.6
• 1,469,639,000 total “general lighting” lamps shipped domestically in 1993.7
• 1,379,759,000 total “general lighting” lamps shipped domestically in 1994.8
• ”General lighting” lamps include 15 to 150 watts, 100 to 130 volts, white lamps;
15 to 150 watts 100 to 130 volts, all other; above 150 watts, 100 to 130 volts; and
three-way, 100 to 130 volts.9
• One case (48 per case) of standard long life soft white bulbs weighs 4.0 lbs., net of
packaging; one case (48 per case) of standard soft white bulbs (A-19) weighs 4.19 lbs.,
net of packaging; and one case (12 per case) bent tip clear candle lights weighs
0.740 lbs., net of packaging.10
• The recycling rate for residentially generated incandescent lamps is assumed to be
0 percent in New York City.
Calculations
For bulbs sold in 1993:
• 248.7 million people in the U.S. divided by 7.3 million people living in New York City
= 2.9 percent of the total population lives in New York City.
111

Characterization of New York City’s Solid Waste Stream Spring 2000
• 2.9 percent (NYC population share) of the 3,312,991,000 incandescent lamps sold in
the U.S. in 1993 = 97,245,011 total incandescent lamps in New York City in 1993.
• 2.9 percent (NYC population share) of 1,469,639,000 “general lighting” incandescent
lamps sold in U.S. in 1993 = 43,137,775 general lighting incandescent lamps in New
York City in 1993.
• (97,245,011 total incandescent lamps in NYC in 1993 x 70 percent standard
incandescent bulbs divided by 48 bulbs per case x 4 pounds per case) + (97,245,011
total incandescent lamps x 25 percent long life bulbs divided by 48 bulbs per case x 4.19
pounds per case) + (97,245,011 total incandescent lamps x 5 percent candle tip bulbs
divided by 12 bulbs per case x 0.74 pounds per case) = 8,094,634 pounds.
• 8,094,634 pounds of total incandescent bulbs in New York City divided by 2,000 =
4,047.3 tons.
• (43,137,775 general lighting incandescent lamps in NYC in 1993 x 70 percent standard
incandescent bulbs divided by 48 bulbs per case x 4 pounds per case) + (43,137,775
general lighting incandescent lamps x 25 percent long life bulbs divided by 48 bulbs
per case x 4.19 pounds per case) + (43,137,775 general lighting incandescent lamps x
5 percent candle tip bulbs divided by 12 bulbs per case x 0.74 pounds per case) =
3,590,770 pounds.
• 3,590,770 pounds of general lighting lamps in New York City divided by 2,000 =
1,795.4 tons.
For bulbs sold in 1994:
• 2.9 percent (NYC population share) of 3,293,504,000 incandescent lamps sold in the
U.S. in 1994 = 96,673,016 total incandescent lamps in New York City in 1994.
• 2.9 percent (NYC population share) of 1,379,759,000 “general lighting” incandescent
lamps sold in the U.S. in 1994 = 40,499,561 “general lighting” incandescent lamps in
New York City in 1994.
• (96,673,016 total incandescent lamps in NYC in 1994 x 70 percent standard incandescent
bulbs divided by 48 bulbs per case x 4 pounds per case) + (96,673,016 total incandescent
lamps x 25 percent long life bulbs divided by 48 bulbs per case x 4.19 pounds per case)
+ (96,673,016 total incandescent lamps x 5 percent candle tip bulbs divided by 12 bulbs
per case x 0.74 pounds per case) = 8,047,022 pounds.
• 8,047,022 pounds of total incandescent bulbs in New York City divided by 2,000 =
4,023.5 tons.
• (40,499,561 general lighting incandescent lamps in NYC in 1994 x 70 percent standard
incandescent bulbs divided by 48 bulbs per case x 4 pounds per case) + (40,599,561
general lighting incandescent lamps x 25 percent long life bulbs divided by 48 bulbs
per case x 4.19 pounds per case) + (40,499,561 general lighting incandescent lamps x
5 percent candle tip bulbs divided by 12 bulbs per case x 0.74 pounds per case) =
3,371,167 pounds.
112

Characterization of New York City’s Solid Waste Stream Spring 2000
• 3,371,167 pounds of general lighting lamps in New York City divided by 2,000 =
1,685.6 tons.
Results
• In 1993, 97,245,011 total incandescent lamps were generated/discarded in NYC;
43,137,775 (44.3%) of those lamps were “general lighting” lamps.
• In 1993, incandescent lamps contributed a total of 4,047.3 tons to the New York City
waste stream, 1,795.4 tons of which are attributable to general lighting bulbs commonly
used in household applications.
• In 1994, 96,673,016 total incandescent lamps were generated/discarded in NYC;
40,499,561 (41.9%) of those lamps were “general lighting” lamps.
• In 1994, incandescent lamps contributed a total of 4,023.5 tons to the New York City
waste stream, 1,685.6 tons of which are attributable to general lighting bulbs commonly
used in household applications.
Discussion and Conclusions
The analysis of incandescent bulbs is limited in that total numbers are a measurement of the
number of bulbs shipped domestically each year and does not reflect bulbs that may be
stockpiled by retailers, wholesalers, or consumers. This analysis provides data from the most
recent two years for which data are available since the quantity shipped may fluctuate from
year to year.
The focus of this analysis is “general lighting” incandescent bulbs typically used in household
applications. The estimates for general lighting bulbs range from 40,499,561 to 43,137,775
lamps for New York City. While these figures are based on the number of bulbs shipped
domestically each year, it is assumed that the average lifespan of a general lighting bulb is not
longer than one year. General lighting incandescent bulbs typically constitute approximately
42 percent of the total quantity of incandescent bulbs shipped in a year.
The data used for this report were the most current information available to the consultant
and are deemed to be representative of annual quantities of incandescent bulbs found in the
New York City waste stream each year. Updated incandescent bulb sales data, which appears
to provide the most reliable data on incandescent bulb generation, should be available in 1997
from the U.S. Department of Commerce.11
1 Incandescent bulb information adapted from “Incandescent Lamps,” published by General Electric and personal communica-
tions between Nancy Greenberg, NYC DOS and General Electric personnel.2 Average population growth rate is based on yearly change in population from 1993 to 1996 as reported by the U.S. Department
of Commerce, Bureau of the Census.3 Field research conducted by SAIC staff.4 New York City Department of Planning, 1995 census data.5 United States Department of Commerce News, Industrial Report MQ36B (94)-1, Issued November 1994.6 United States Department of Commerce News, Industrial Report MQ36B (94)-4, Issued February 1995.7 United States Department of Commerce News, Industrial Report MQ36B (94)-1, Issued November 1994.
113

Characterization of New York City’s Solid Waste Stream Spring 2000
8 United States Department of Commerce News, Industrial Report MQ36B (94)-1, 2, 3, and 4.9 Ibid.
10 Personal communication, Nancy Greenberg, NYC DOS with representative of Philips Lighting, 6/21/96.11 Department of Commerce data may be ordered by calling 301-457-4797.
APPENDIX 33
New York City Waste Stream Composition Analysis:
Pallets and Wood Packaging
Introduction
This analysis estimates the quantity, in tons, of used pallets and wood packaging in the New
York City waste stream. Pallets and wood packaging includes wooden pallets and skids and
wooden crates used for shipping products. EPA’s Characterization of Municipal Solid Waste in
the United States: 1995 Update lists the recycling rate for pallets and wood packaging as 14.0
percent. Nationwide, pallets and wood packaging comprise approximately 5.5 percent of the
total MSW waste stream.1
The exact quantity of pallets and wood packaging disposed in New York City is not available;
therefore, estimates had to be developed based on data obtained from previously conducted
studies.
Methodology
The estimates presented in this study were derived from national disposal figures and recycling rates
for pallets and wood packaging. The national estimates are presented in EPA’s Characterization
of Municipal Solid Waste in the United States: 1995 Update and are based on data collected by
Franklin & Associates. The methodology used by Franklin & Associates to determine national
disposal figures is a “materials flow methodology.” It is based on production data (by weight)
for materials and products in the waste stream, with adjustments for imports, exports, and
product lifespans.
The ratio of U.S. population to New York City population is applied to the national estimates of
the quantity of pallets and wood packaging disposed to generate an estimate for New York City.
This estimate is then adjusted to account for recycling.
Assumptions
• 248.7 million people in the U.S. in 1990.
• 7.3 million people living in New York City in 1990.2
• 10,200,000 tons of pallets and wood packaging generated in the U.S. municipal waste
stream in 1994.3
114

Characterization of New York City’s Solid Waste Stream Spring 2000
• The recycling rate for pallets and wood packaging is assumed to be 14.0 percent.4
Calculations
• 248.7 million people in the U.S. divided by 7.3 million people living in New York City
= 2.9 percent of the total population lives in New York City.
• 10,200,000 tons of pallets and wood packaging generated in the U.S. waste stream x
2.9 percent (NYC population share) = 295,800 tons of pallets and wood packaging
generated in the New York City waste stream in 1994.
• 14.0 percent recycling rate x 295,800 tons of pallets and wood packaging generated
in New York City = 254,388 tons of pallets and wood packaging disposed in the
New York City waste stream in 1994.
Results
• A total of approximately 295,800 tons of old pallets and wood packaging are generated
in New York City each year.
• Accounting for recycling, these items contribute 254,388 tons a year to the New York
City waste stream.
Discussion
The estimates regarding the quantity of pallets and wood packaging discarded in the New York
City waste stream each year are based on EPA’s national waste characterization data. Where
previously conducted, up-to-date studies exist, the consultant deemed it more reasonable and
cost-effective to modify that data to New York City rather than duplicate a previous effort.
The estimates presented for pallets and wood packaging may slightly overestimate the quantity
discarded because the figures presented by Franklin & Associates are based on industry
production data from the Wooden Pallet and Container Association and may not accurately
reflect repair, reuse and storage of used pallets and wood packaging. However, the data used
for this report were the most current available to the consultant and are deemed to be
representative of the annual quantities of pallets and wood packaging found in the New York
City waste stream each year.
Wood waste is a problem waste for business and industry in New York City due to a limited
recycling infrastructure for wood. Much of the wood waste, in the form of pallets, could be
reused or recycled if a system for collection and exchange were established. In addition, fewer
pallets and other wood containers would be generated if the use of alternative reusable
packaging (e.g., plastic shipping crates) were encouraged.
1 U.S. EPA, Characterization of Municipal Solid Waste in the United States: 1995 Update, Tables 21 and 23.2 New York City Department of Planning, 1995 census data.3 U.S. EPA, Characterization of Municipal Solid Waste in the United States: 1995 Update, Table 18.4 U.S. EPA, Characterization of Municipal Solid Waste in the United States: 1995 Update, Table 21.
115

Characterization of New York City’s Solid Waste Stream Spring 2000
APPENDIX 34
New York City Waste Stream Composition Analysis:
Food Wastes
Introduction
This analysis estimates the quantity, in tons, of food waste in the New York City waste stream.
Food waste refers to uneaten food and food preparation wastes generated in home, commercial
(e.g., restaurants, fast food establishments), and institutional (e.g., school cafeterias, factory
lunchrooms) settings. EPA’s Characterization of Municipal Solid Waste in the United States: 1995
Update lists the recycling rate for food wastes as 3.4 percent. Nationwide, food waste
comprises approximately 6.7 percent of the total MSW waste stream.1
The exact quantity of food waste disposed in New York City is not available; therefore, estimates
were developed based on data obtained from previously conducted studies.
Methodology
Two models are used to determine the amount of food waste in the New York City waste
stream. For Model #1, the estimates presented were derived from national disposal figures and
recycling rates for food waste. The national estimates are presented in EPA’s Characterization of
Municipal Solid Waste in the United States: 1995 Update and are based on data collected by
Franklin & Associates. The methodology used by Franklin & Associates to determine national
disposal figures is a “materials flow methodology.” It is based on production data (by weight)
for materials and products in the waste stream, with adjustments for imports, exports, and
product lifespans.
The ratio of U.S. population to New York City population is applied to the national estimates of
the quantity of food waste disposed to generate an estimate for New York City. This estimate is
then adjusted to account for recycling.
Model #2 uses percentages of the New York City waste stream determined by a waste sort
conducted in 1990, actual residential and institutional curbside collection figures, and recycling
tonnages provided by processors in the New York City area. A recycling rate is calculated
based on these figures.
Model #1
Assumptions
• 248.7 million people in the U.S. in 1990.
• 7.3 million people living in New York City in 1990.2
• 14,070,000 tons of food waste generated in the U.S. municipal waste stream in 1994.3
• The national recycling rate for food waste is assumed to be 6.7 percent.4
116

Characterization of New York City’s Solid Waste Stream Spring 2000
Calculations
• 248.7 million people in the U.S. divided by 7.3 million people living in New York City
= 2.9 percent of the total population lives in New York City.
• 14,070,000 tons of food waste generated in the U.S. waste stream x 2.9 percent
(NYC population share) = 408,030 tons of food waste generated in the New York City
waste stream in 1994.
• 6.7 percent recycling rate x 408,030 tons of food waste generated in New York City
= 380,692 tons of food waste disposed in the New York City waste stream in 1994.
Results
• A total of approximately 408,030 tons of food waste are generated in New York City
each year.
• Accounting for recycling, food wastes contribute 380,692 tons per year to the
New York City waste stream.
Model #2
Assumptions5
• The total New York City residential and institutional waste stream, minus street
sweepings and empty lot materials, is 3,536,145 tons per year.
• Food wastes represent 12.7 percent of this total.
• The recycling rate for food wastes in New York City is assumed to be 0 percent.
Calculations
• 3,536,145 tons x 12.7 percent = 449,090 tons of food waste per year disposed in NYC.
Results
• A total of approximately 449,090 tons of food waste per year are generated and
discarded in New York City.
Discussion
The estimates in Model #1, regarding the quantity of food waste discarded in the New York
City waste stream each year are based on EPA’s national waste characterization data. This
includes residential, institutional, and commercial data. Where previously conducted, up-to-
date studies exist, the consultant deemed it more reasonable and cost-effective to modify that
data to New York City rather than duplicate a previous effort.
117

Characterization of New York City’s Solid Waste Stream Spring 2000
Model #2 estimates are based on residential and institutional total waste figures, and
percentages of residential waste collection. Institutional wastes are estimated to be less
than ten percent of the total residential and institutional waste stream; therefore, applying
percentages of the residential waste stream to a total including both residential and
institutional waste does not affect the outcome significantly.
Totals from Models #1 and #2 may not be comparable because Model #1 is based on
residential, institutional, and commercial waste generation, while Model #2 is based only on
residential and institutional waste generation.
The data used for this report were the most current available to the consultant and are
deemed to be representative of the annual quantities of food waste found in the New York City
waste stream each year.
1 U.S. EPA, Characterization of Municipal Solid Waste in the United States: 1995 Update, Tables 19 and 21.2 New York City Department of Planning, 1995 census data.3 U.S. EPA, Characterization of Municipal Solid Waste in the United States: 1995 Update, Table 18.4 Ibid, Table 19.5 Information provided by NYC Department of Sanitation, Bureau of Waste Prevention, Reuse and Recycling, 11/17/96.
APPENDIX 35
New York City Waste Stream Composition Analysis:
Plastic Wraps
Introduction
This analysis estimates the quantity, in tons, of plastic wraps in the New York City waste stream.
Plastic wraps refers to plastic films, cellophane, and other thin plastic sheeting used in packaging
in home, commercial, and institutional settings. EPA’s Characterization of Municipal Solid
Waste in the United States: 1995 Update lists the recycling rate for plastic wraps as 1.4 percent.
Nationwide, plastic wraps comprise approximately 1.3 percent of the total MSW waste stream.1
The exact quantity of plastic wraps disposed in New York City is not available; therefore,
estimates were developed based on data obtained from previously conducted studies.
Methodology
Two models are used to determine the amount of plastic wraps in the New York City waste stream.
For Model #1, the estimates presented were derived from national disposal figures and recycling
rates for plastic wraps. The national estimates are presented in EPA’s Characterization of Municipal
Solid Waste in the United States: 1995 Update and are based on data collected by Franklin &
Associates. The methodology used by Franklin & Associates to determine national disposal figures
118

Characterization of New York City’s Solid Waste Stream Spring 2000
is a “materials flow methodology.” It is based on production data (by weight) for materials and
products in the waste stream, with adjustments for imports, exports, and product lifespans.
The ratio of U.S. population to New York City population is applied to the national estimates of
the quantity of plastic wraps disposed to generate an estimate for New York City. This estimate
is then adjusted to account for recycling.
Model #2 uses percentages of the New York City waste stream determined by a waste sort
conducted in 1990, actual residential and institutional curbside collection figures, and recycling
tonnages provided by processors in the New York City area. A recycling rate is calculated
based on these figures.
Model #1
Assumptions
• 248.7 million people in the U.S. in 1990.
• 7.3 million people living in New York City in 1990.2
• 2,080,000 tons of plastic wraps generated in the U.S. municipal waste stream in 1994.3
• The recycling rate for plastic wraps is assumed to be 1.4 percent.4
Calculations
• 248.7 million people in the U.S. divided by 7.3 million people living in New York City
= 2.9 percent of the total population lives in New York City.
• 2,080,000 tons of plastic wraps generated in the U.S. waste stream x 2.9 percent
(NYC population share) = 60,320 tons of plastic wraps generated in the New York City
waste stream in 1994.
• 1.4 percent recycling rate x 60,320 tons of plastic wraps generated in New York City
= 59,475.5 tons of plastic wraps disposed in the New York City waste stream in 1994.
Results
• A total of approximately 60,320 tons of old plastic wraps are generated in
New York City each year.
• Accounting for recycling, these items contribute 59,475.5 tons per year to the
New York City waste stream.
Model #2
Assumptions5
• The total New York City residential and institutional waste stream, minus street
sweepings and empty lot materials, is 3,536,145 tons per year.
119

Characterization of New York City’s Solid Waste Stream Spring 2000
• Plastic wraps represent 4.8 percent of this total.
• 229 tons of plastic wraps are recycled in New York City; therefore, the recycling rate
for plastic wrap in New York City is assumed to be 0.13 percent.
Calculations
• 3,536,145 tons x 4.8 percent = 169,735 tons of plastic wraps per year disposed in NYC.
• 169,735 tons disposed + 229 tons recovered = 169,964 tons of plastic wraps generated
per year in New York City.
Results
• A total of approximately 3169,964 tons of plastic wraps per year are generated in New
York City.
• Accounting for recycling, 169,735 tons of plastic wraps per year are discarded in New
York City.
Discussion
The estimates in Model #1, regarding the quantity of plastic wraps discarded in the New York
City waste stream each year are based on EPA’s national waste characterization data. This
includes residential, institutional, and commercial data. Where previously conducted, up-to-
date studies exist, the consultant deemed it more reasonable and cost-effective to modify that
data to New York City rather than duplicate a previous effort.
Model #2 estimates are based on residential and institutional total waste figures, and percentages
of residential waste collection. Institutional wastes are estimated to be less than ten percent of
the total residential and institutional waste stream; therefore, applying percentages of the
residential waste stream to a total including both residential and institutional waste does not
affect the outcome significantly.
Totals from Models #1 and #2 may not be comparable because Model #1 is based on
residential, institutional, and commercial waste generation, while Model #2 is based only on
residential and institutional waste generation.
The data used for this report were the most current available to the consultant and are deemed
to be representative of the annual quantities of plastic wraps found in the New York City waste
stream each year.
1 U.S. EPA, Characterization of Municipal Solid Waste in the United States: 1995 Update, Tables 21 and 23.2 New York City Department of Planning, 1995 census data.3 U.S. EPA, Characterization of Municipal Solid Waste in the United States: 1995 Update, Table 18.4 Ibid, Table 21.5 Information provided by NYC Department of Sanitation, Bureau of Waste Prevention, Reuse and Recycling, 11/17/96.
120

Characterization of New York City’s Solid Waste Stream Spring 2000
APPENDIX 36
New York City Waste Stream Composition Analysis:
Paper and Plastic Grocery Bags
Introduction
This analysis estimates ranges of the quantity of paper and plastic grocery bags in the New York
City waste stream. The analyses are based on retail-food sales data and estimates of national
production of plastic and paper grocery bags. The exact number of grocery bags in the New
York City waste stream is not known, nor do data exist that would allow exact calculation of the
number of bags in the waste stream. The models used in this analysis were discussed with
various individuals involved in the bag industry who agreed that these models are probably the
most viable way of estimating the number of bags in the waste stream.1
This analysis is limited to grocery bags from retail food outlets, primarily because of the
significant variety of bags that exist for non-food retail outlets. Approximately 100 companies
manufacture grocery bags and an even greater number manufacture non-food retail bags. The
size, weight, and material of the non-food retail bags vary considerably among manufacturers,
rendering any estimates fairly meaningless in terms of material and volume. In most regions,
non-food retail bag distribution is approximately 25 percent less than that of retail food grocery
bag distribution, i.e., a ratio of three retail bags to every four grocery bags. In New York City,
however, with the unusually high number of retail outlets, Sonoco Products estimates that the
ratio of grocery bags to non-food retail bags will be approximately one to one. Using these
ratios, a total number of bags from non-food retail outlets could be estimated, but given the
variety of bag types, volume estimates would not be accurate. Additionally, a substantial
portion of the non-retail bags will be disposed of outside of New York City.
Methodology
Two models were used to estimate the number of grocery bags in the New York City waste stream.
Both methods rely on use of retail sales data from food stores. The first model assumes $8.69
retail food sales per grocery bag and a 75:25 ratio of plastic to paper bags.2 Representatives
from both paper and plastic bag manufacturers indicated that although paper bags can hold
more groceries, bags are packed in such a way that paper and plastic generally contain the
same quantity of products. A report prepared for NYC DOS notes that while more plastic bags
would theoretically be required for the same quantity of products, the more common practice
of double bagging paper bags may negate this effect. This same report indicated that paper
bags have 23.5 liters packing volume versus 17 liters packing volume for plastic bags.3 The
figures used in the first model were provided by Sonoco Products. Several other organizations
were contacted to obtain comparable figures, but no other similar data was identified. The
second model takes the ratio of retail sales from food stores in New York City to retail food sales
nationally (1994 figures) and uses this ratio to determine the ratio of grocery bags distributed
in New York City to the national figure. Both models are shown in Figure 1 [next page].
121

Characterization of New York City’s Solid Waste Stream Spring 2000
National estimates of grocery bag
production were provided by Sonoco
Products and the American Forest and Paper
Association. Sonoco and AF&PA provided
somewhat different estimates. Sonoco
provided a total number of bags distributed
nationwide (42 billion) and assumes a
ratio of 75:25 for plastic to paper. AF&PA
provided specific estimates for plastic
grocery bags (21.7 billion) and paper
grocery bags (10.4 billion). The results of
both of the models and the estimates derived using the two different data sets are provided
below. The figures below are adjusted for recovery of bags, assuming a 1.9 percent recovery
rate for plastic bags and a negligible 0.5 percent recovery rate for paper bags.4
Additionally, AF&PA provided figures for the weight of a thousand bags (paper - 118 lbs/1000
bags and plastic - 15 lbs/1000 bags). This figures were used to calculate the weight of the bags
distributed in New York City.
Models/Results
Model #1 – Bags per $X Retail Food Sales
Assumptions
• $8,124,000,000 retail food sales in New York City.5
• One bag per $8.69 retail food sales.
• 75:25 ratio of plastic to paper grocery bags.
• 1.9% recovery rate for plastic bags and 0.5% recovery rate for paper bags.
• 118 pounds per 1000 paper bags; 15 pounds per 1000 plastic bags.
Calculations
• $8,124,000,000 divided by $8.69 = Total Bags in NYC (TotBag)
• TotBag x 0.75 = Total Plastic Bags (TotPlas)
• TotBag x 0.25 = Total Paper Bags (TotPap)
• TotPlas - (TotPlas x .019) = Plastic Bags Discarded in NYC Waste Stream (DisPlas)
• TotPap - (TotPap x .005) = Paper Bags in Discarded in NYC Waste Stream (DisPap)
• ((DisPlas/1000) x 15)/2000 = Tons in Waste Stream
• ((DisPap/1000) x 118)/2000 = Tons in Waste Stream
122
Model 1: Number of Bags Per $ x Retail Food Sales
NYC Grocery Bags = NYC Retail Food Sales$8.69
Model 2: Ratio of Retail Sales to Bag Distribution
NYC Retail Food Sales = NYC Grocery Bags (X)Nat’l Ret. Food Sales Nat’l Grocery Bags
Figure 1. Grocery Bag Estimation Models
Characterization of New York City’s Solid Waste Stream Spring 2000
Results
(Total Generation)
• 934,867,664 total grocery bags in New York City.
• 701,150,748 plastic grocery bags in New York City.
• 233,716,916 paper grocery bags in New York City.
(With Recovery)
• 920,377,215 total bags discarded.
• 687,828,884 plastic grocery bags discarded.
• 232,548,331 paper grocery bags discarded.
• 5,159 tons per year of plastic bags in NYC waste stream.
• 13,720 tons per year of paper bags in NYC waste stream.
• 18,879 tons per year of grocery bags in NYC waste stream.
Model #2 – Ratio of Retail Food Sales to Bag Distribution
Version A: Sonoco Products Data
Assumptions
• $397,800,000,000 national retail food sales.6
• $8,124,000,000 retail food sales in New York City.
• 42 billion grocery bags produced nationally, annually.7
• 75:25 ratio of plastic to paper grocery bags.
• 1.9% recovery rate for plastic bags and 0.5% recovery rate for paper bags.
• 118 pounds per 1000 paper bags; 15 pounds per 1000 plastic bags.
Calculations
• 8,124,000,000 = X
397,800,000,000 42,000,000,000
X = Total Number of Bags in NYC
• Same calculations as previous model for ratio of paper to plastic, total discards,
and weight.
123

Characterization of New York City’s Solid Waste Stream Spring 2000
Results
(Total Generation)
• 857,737,557 total grocery bags in New York City
• 643,303,167 plastic grocery bags in New York City
• 214,434,389 paper grocery bags in New York City
(With Recovery)
• 844,514,796 total bags discarded.
• 631,080,407 plastic bags discarded.
• 213,362,217 paper bags discarded.
• 4,733 tons per year of plastic bags in NYC waste stream.
• 12,588 tons per year of paper bags in NYC waste stream.
• 17,321 tons per year of grocery bags in NYC waste stream.
Version B: AF&PA Data
Assumptions
• 21.7 billion plastic grocery bags produced nationally, annually.8
• 10.4 billion paper grocery bags produced nationally, annually.
• $397,800,000,000 national retail food sales.
• $8,124,000,000 retail food sales in New York City.
• 1.9% recovery rate for plastic bags and 0.5% recovery rate for paper bags.
Calculations
• 8,124,000,000 = X 397,800,000,000 32,100,000,000
X = Total Grocery Bags in NYC
• 8,124,000,000 = X 397,800,000,000 21,700,000,000
X = Total Plastic Grocery Bags in NYC
• 8,124,000,000 = X 397,800,000,000 10,400,000,000
X = Total Paper Grocery Bags in NYC
124

Characterization of New York City’s Solid Waste Stream Spring 2000
• Same calculations as previous models for total discards and weight.
Results
(Total Generation)
• 655,556,561 total grocery bags in New York City.
• 443,164,404 total plastic grocery bags in New York City.
• 212,392,157 total paper grocery bags in New York City.
(With Recovery)
• 646,074,477 total bags discarded.
• 434,744,281 plastic bags discarded.
• 211,330,196 paper bags discarded.
• 3,261 tons per year of plastic grocery bags in NYC waste stream.
• 12,468 tons per year of paper grocery bags in NYC waste stream.
• 15,729 tons of grocery bags per year in NYC waste stream.
Discussion
The results of the three models used in this analysis to estimate the quantity of paper and
plastic grocery bags in the New York City waste stream are summarized in Figure 2.
Figure 2. Summary of Results
Model Total Plastic Paper
Total Quantity of Bags Generated
Model 1 934,867,664 701,150,748 233,716,916
Model 2A 857,737,557 643,303,167 214,434,389
Model 2B 655,556,561 443,164,404 212,392,157
Quantity of Bags Discarded After Recovery
Model 1 920,377,215 687,828,884 232,548,331
Model 2A 844,442,624 631,080,407 213,362,217
Model 2B 646,074,477 434,744,280 221,330,196
Weight of Bags Discarded After Recovery (in Tons)
Model 1 18,879 5,159 13,720
Model 2A 17,321 4,733 12,588
Model 2B 15,729 3,261 12,468
125

Characterization of New York City’s Solid Waste Stream Spring 2000
Estimates for the total number of grocery bags from retail food stores in the New York City
waste stream, on an annual basis, ranges from 646.0 million to 920.3 million bags. Estimates of
the number of plastic bags in the waste stream ranges from 434.7 million to 687.8 million bags
per year. Estimates of the total number of paper bags in the waste stream ranges from 211.3
million to 232.5 million bags per year.
The low estimates are from estimates derived from Model 2B, using data provided by AF&PA,
while the high estimates are derived from Model 1, assuming one bag per $8.69 of retail food
sales. More confidence can most likely be placed on the Sonoco data (Model 2A) than the
AFPA data (Model 2B) because the AFPA data may be skewed to overestimate the number of
paper bags produced and underestimate the number of plastic bags produced. The ratio of
plastic to paper bags provided by AFPA (approximately 2:1) is much closer than the more com-
monly accepted 3:1 ratio.9
Estimates of the total weight of grocery bags from retail food outlets in the New York City waste
stream range from 13,800 to 16,756 tons per year. Estimates of the weight of plastic bags range
from 3,261 to 5,159 tons per year. Estimates of the weight of paper grocery bags in the City’s
waste stream range from 12,468 to 13,720 tons per year.
1 Notably, Bob Householder of Sonoco Products and Dave Stuck of AF&PA, both of whom provided insight, as well as data, for
this analysis.2 Personal communication, Colton Seale, SAIC with Bob Householder, Sonoco Products, 11/28/95.3 Graff, Robert. “A Comparison of the Environmental Effects of Kraft Paper and Polyethylene Grocery Bags.” Prepared for the City
of New York Department of Sanitation. August 23, 1989.4 The EPA Municipal Waste Characterization (Franklin and Associates, Characterization of Municipal Solid Waste in the United
States: 1994 Update, “Table 21: Recovery of Products in Municipal Solid Waste, 1960 to 1993,” November 1994.) indicates a
nationwide recovery rate of 1.9 percent for plastic bags and 15.9 percent for paper bags. A representative from the AFPA
indicated that although the nationwide recycling rate for paper bags is at least 15 percent because of their inclusion in curbside
recycling programs, the recycling rate is very low in New York City because paper bags have been excluded from curbside
programs and are not collected with corrugated cardboard. NYC DOS staff expressed a similar belief that the recycling rate
was negligible. Therefore, for paper bags a fairly negligible recycling rate of 0.5 percent is used in this analysis. The Franklin
recycling rate of 1.9 percent for plastic bags is used.5 Based on “Monthly Retail Trade Survey: Unpublished sales estimates of retail stores by kind of business for specified areas,”
U.S. Department of Commerce, Bureau of the Census, Services Division. Monthly average is based on receipts for September
1994, January 1995, March 1995, and July 1995. Note: Measures of sampling variability associated with these estimates are
relatively large.6 U.S. Department of Commerce, Bureau of Census, Retail Sales Division.7 Personal communication, Colton Seale, SAIC with Bob Householder, Sonoco Products, 11/28/95.8 Personal communication, Colton Seale, SAIC with Dave Stuck, AF&PA, 10/30/95.9 For a discussion of the ratio of plastic to paper bags, see A Comparison of the Environmental Effects of Kraft Paper and Polyethylene
Grocery Bags, prepared for the New York State Department of Sanitation Recycling Program by Robert Graff, 1989.
126

Characterization of New York City’s Solid Waste Stream Spring 2000
APPENDIX 37
New York City Waste Stream Composition Analysis:
Plastic Plates and Cups
Introduction
This analysis estimates the quantity, in tons, of used plastic plates and cups in the New York City
waste stream. Plastic plates and cups includes plastic plates, cups, glasses, dishes and bowls,
hinged containers, and other containers used in food service at home, in restaurants and other
commercial establishments, and in institutional settings such as schools. These items are made
of polystyrene resin. EPA’s Characterization of Municipal Solid Waste in the United States: 1995
Update lists the recycling rate for plastic plates and cups as 0.0 percent. Nationwide, plastic
plates and cups comprise approximately 0.2 percent of the total MSW waste stream.1
The exact quantity of plastic plates and cups disposed in New York City is not available; therefore,
estimates had to be developed based on data obtained from previously conducted studies.
Methodology
The estimates presented in this study were derived from national disposal figures and recycling
rates for plastic plates and cups. The national estimates are presented in EPA’s Characterization
of Municipal Solid Waste in the United States: 1995 Update and are based on data collected by
Franklin & Associates. The ratio of U.S. population to New York City population is applied to
the national estimates of the quantity of plastic plates and cups disposed to generate an estimate
for New York City. This estimate is then adjusted to account for recycling.
Assumptions
• 248.7 million people in the U.S. in 1990.
• 7.3 million people living in New York City in 1990.2
• 440,000 tons of plastic plates and cups generated in the U.S. municipal waste stream in 1994.3
• The recycling rate for plastic plates and cups is assumed to be 0.0 percent.4
Calculations
• 248.7 million people in the U.S. divided by 7.3 million people living in New York City
= 2.9 percent of the total population lives in New York City.
• 440,000 tons of plastic plates and cups generated in the U.S. waste stream x 2.9 percent
(NYC population share) = 12,760 tons of plastic plates and cups generated in the New
York City waste stream in 1994.
• 0.0 percent recycling rate x 12,760 tons of plastic plates and cups generated in
New York City = 12,760 tons of plastic plates and cups disposed in the New York City
waste stream in 1994.
127

Characterization of New York City’s Solid Waste Stream Spring 2000
Results
• A total of approximately 12,760 tons of old plastic plates and cups are generated and
discarded in New York City each year.
Discussion
The estimates regarding the quantity of plastic plates and cups discarded in the New York City
waste stream each year are based on EPA’s national waste characterization data. Where
previously conducted, up-to-date studies exist, the consultant deemed it more reasonable and
cost-effective to modify that data to New York City rather than duplicate a previous effort.
The estimates presented for plastic plates and cups may slightly overestimate the quantity
discarded because the figures are based on industry production data and may not accurately
reflect storage of plastic plates and cups. However, the data used for this report were the most
current available to the consultant and are deemed to be representative of the annual
quantities of plastic plates and cups found in the New York City waste stream each year.
1 U.S. EPA, Characterization of Municipal Solid Waste in the United States: 1995 Update, Table 17.2 New York City Department of Planning, 1995 census data.3 U.S. EPA, Characterization of Municipal Solid Waste in the United States: 1995 Update, Table 15.4 Ibid, Table 16.
APPENDIX 38
New York City Waste Composition Analysis:
Single-Use Cameras
Introduction
This analysis looks at the quantity of single-use cameras sold in New York City annually.
Single-use cameras are cameras made of a composite of plastic, paperboard, and electronic
components, each containing a AA-battery, a roll of film, and a flash mechanism (on flash
models). The camera is purchased as a single unit, then returned to a photofinishing facility
when all the pictures are taken. The photofinishing facility removes the film from the camera
and develops it. The facility has the option of discarding the camera, or returning it to the
manufacturer for recycling. Several large manufacturers, including Kodak, Fuji, and Konica,
have recycling programs for their single-use camera lines.
Manufacturers salvage over 80 percent of each camera body for reuse or recycling.
Cameras that are reused are dismantled, the AA battery is removed and donated to a nonprofit
organization (because it has only been used for a short period of time), and the body is
reassembled with a new roll of film, lens, and battery. Electronic flashboards in flash cameras
128

Characterization of New York City’s Solid Waste Stream Spring 2000
are marked (to indicate the number of times they have been reused) then reused in a new
camera. The outer paperboard package of each single-use camera contains 35 percent
post-consumer recycled content. Plastic camera bodies also are ground and recycled into
new parts and reusable totes used within the manufacturing facilities.
Kodak, Konica, and Fuji all participate in a recycle share program in which each company sorts
cameras returned to its respective facilities, then ships the other companies’ cameras to the
correct facility for recycling. Kodak has a recycling program for smaller photofinishing labs
where the lab receives 5 cents for every camera returned if the cameras are boxed separately.
Or the lab can send back cameras, film canisters, and other plastics collected together for
recycling. The latter program does not involve a 5 cent incentive. Larger labs can collect
cameras from any manufacturer in gaylord boxes and ship them to a Kodak reclamation center,
where Kodak will sort them and sent non-Kodak cameras to their manufacturers. Kodak will
provide the containers and pay for transportation, as well as provide information about
shipping companies to use. Other major manufacturers have similar programs for recycling.
The exact number of single-use cameras in the NYC waste stream is not known; however, the
following analysis represents a conservative estimate of that number.
Methodology
The model used for this analysis is based on data provided by trade associations and specific
manufacturers of single-use cameras. The ratio of U.S. population to New York City population
is applied to the national estimates of the quantity of single-use cameras purchased to generate
an estimate for New York City. This estimate is then adjusted for recycling.
Assumptions
• 53.9 million single-use cameras are sold annually in the U.S.1
• 248.7 million people in the U.S. in 1990.2
• 7.3 million people living in New York City in 1990.3
• 2.8 million households in New York City in 1990.4
• 7 percent of U.S. households purchase single-use cameras.5
• Those 7 percent purchase 1.8 cameras per quarter, or 7.2 cameras per year.6
• The recycling rate for single-use cameras is 77 percent.7
• SAIC assumes that the recycling rate applies to entire industry for several reasons;
Kodak represents the largest market share in single-use cameras, several other
manufacturers recycle their cameras, and Kodak has a shared program with several
other manufacturers to pass along cameras collected by Kodak to their original
manufacturers for recovery.
• 70 million cameras equals 10 million lbs. of cameras; therefore, an average single-use
camera weighs 0.14 lbs.8
129

Characterization of New York City’s Solid Waste Stream Spring 2000
Calculations
• 248.7 million people divided by 7.3 million people living in New York City = 2.9 percent
of the total U.S. population lives in New York City.
• 53.9 million single-use cameras x 2.9 percent (NYC population share = 1.56 million
single-use cameras.
• 2.8 million households x 7 percent = 196,000 households x 7.2 cameras per year
= 1.4 million cameras.
• Average of 1.56 million and 1.4 million = 1.48 million single-use cameras sold in
New York City annually.
• 1.48 million cameras x 0.14 lbs. per camera = 207,200 lbs. divided by 2000 =
103.6 tons of single- use cameras sold in New York City.
• 1.48 million cameras x 77 percent = 1.14 million cameras collected for recycling.
• 1.14 million cameras x 0.14 lbs. = 159,600 lbs. divided by 2000 = 79.8 tons of
cameras collected for recycling.
• 103.6 tons - 79.8 tons = 23.8 tons of cameras that are either discarded or reused by
camera reloaders.
Results
• 1.48 million cameras or 103.6 tons of cameras are sold in New York City annually.
• Accounting for recycling, 340,000 cameras or 23.8 tons of cameras are either discarded
or reused by camera reloaders.
Discussion and Conclusions
Because single-use cameras must be returned to a photo finisher for developing, they are only
discarded in the commercial waste stream, and not in the residential waste stream. It is difficult
to determine the actual number of cameras discarded in the New York City waste stream based
on sales figures. Cameras are often associated with traveling and tourism; people often buy
single-use cameras before leaving home for a trip to New York City, or they purchase a camera
in New York City and have the film developed when they return home. With millions of tourists
visiting New York City each year, these trends can make it difficult to determine quantities
discarded based on quantities sold.
Another difficulty in determining the number of cameras entering the waste stream is the lack
of tracking of cameras not returned to the manufacturer through an established recycling
program. These cameras may be discarded in the commercial waste stream by the photo
finisher or they may be reused by camera reloaders who load the used camera bodies with a
lesser quality film resell them either in the U.S. or overseas for a reduced price.
130

Characterization of New York City’s Solid Waste Stream Spring 2000
However, the data used for this report were the most current available to the consultant and
are deemed to be representative of the annual quantities of single-use cameras sold and
recycled in New York City each year.
The number of cameras entering the waste stream in New York City may be reduced by
encouraging consumers to return single-use cameras to photofinishing facilities that collect the
cameras for recycling. Consumers can ask the photo finisher about its recycling policy and
practices before bringing the camera to them, or a photo finisher may wish to advertise that it
collects cameras for recycling.
In addition, photo finishers may be encouraged through outreach programs to participate in
recycling programs sponsored by camera manufacturers. These programs are generally simple
to use and often the expenses for containers and shipping the cameras are paid for by the
manufacturer.
1 Photo Marketing Association International, 1994-95 PMA Industry Trends Report.2 U.S. Department of Census, 1990 data.3 NYC Department of Planning, 1995 census data.4 Ibid.5 Photo Marketing Association International, 1994 PMA U.S. Consumer Photo Buying Report.6 Ibid.7 Personal communication, Jeanne Carlson, SAIC with Sarah Fogler, Eastman Kodak Company, 11/21/96.8 Eastman Kodak Company Health, Safety and Environment 1995 Report.
APPENDIX 39
New York City Waste Stream Composition Analysis:
Toilets
Introduction
This analysis presents estimates of the number of toilets expected to be discarded in the New
York City waste stream in an average year. The New York City Department of Environmental
Protection (DEP) has implemented a proactive program to capture old toilets and divert them
from the waste stream for recycling. The data used for this analysis were collected by the
New York City DEP as part of their analysis during the development of the City’s toilet rebate
program.1 However, the estimates developed in this analysis are based on an average year in
which the toilet rebate program is not in effect.
The toilet rebate program was begun when new regulations were implemented that stipulate
that newly installed toilets cannot have a tank capacity of greater than 1.6 gallons. DEP
wanted to take advantage of this change in requirements as an opportunity to promote water
conservation by replacing the largest number of old toilets possible, since old toilets can no
131

Characterization of New York City’s Solid Waste Stream Spring 2000
longer be reused in new installation projects. Most toilets in operation have a tank capacity of
approximately three gallons and most toilets being discarded will have the larger tanks for
several years to come given the average 20 year lifespan for toilets.
Toilets consist primarily of two parts: a porcelain bowl and tank and a metal handle and flushing
system. A small number of specialty toilets are manufactured from fiberglass or other plastics,
but the vast majority of toilets in New York City are porcelain. When discarded toilets are
recovered prior to disposal, the metal component generally is removed and recycled. These
metal parts constitute approximately 10 percent of the weight of the toilet, or approximately
5.7 pounds. Recyclers and environmental agencies are working to fully develop a variety of
options to crush and reuse the porcelain parts of toilets in a variety of construction-related
applications, such as use as aggregate in sidewalk or roadbed repairs. Despite these advances
in recycling, it is not yet clear what percent of used toilets actually will be recycled. Therefore,
this analysis estimates the quantity of toilets discarded each year without adjusting for recycling
or reuse.
The following sections describe the methodology used in this study, as well as the assumptions
and calculations used. The final section provides a discussion of the findings.
Methodology
The model used in this analysis uses average replacement rates for toilets in combination with
the total number of toilets in New York City to determine how many toilets are disposed in a
year. In general, the replacement rates for toilets average one every twenty years. However,
during the life of the New York City toilet rebate program (1994-1997) significantly more old
toilets than normal will be discarded. The toilet rebate program will have replaced 1.2 million
toilets in a 2.5-3 year time period.2 This may have an impact on future toilet generation rates,
but this analysis assumes a fairly constant disposal rate for the future.
Assumptions
• Normal toilet replacement rates are one to two percent per year.3 This analysis uses
the average/median of 1.5.
• There are 3 to 4 million toilet fixtures in New York City.4
• One toilet weighs approximately 57 pounds.5
• The metal component of a toilet comprises 10 percent, or approximately 5.7 pounds,
of the total toilet weight.
Calculations
• 1.5 percent average annual replacement rate for toilets x 3 million fixtures in New York
City = 45,000 toilets discarded per year in New York City.
• 45,000 toilets discarded in New York City each year x 57 pound average weight per
toilet = 2,565,000 pounds.
132

Characterization of New York City’s Solid Waste Stream Spring 2000
• 2,565,000 pounds divided by 2,000 = 1,282.5 tons of discarded toilets per year in
New York City.
• 1,282.5 tons of toilets - 10 percent for extracted metal parts = 1,154.25 tons per year.
• 1.5 percent average annual replacement rate for toilets x 4 million fixtures in New
York City = 60,000 toilets discarded per year in New York City.
• 60,000 toilets discarded in New York City each year x 57 pound average weight per
toilet = 3,420,000 pounds.
• 3,420,000 pounds divided by 2,000 = 1,710 tons of discarded toilets per year in
New York City.
• 1,710 tons of toilets - 10 percent for extracted metal parts = 1,539 tons per year.
Results
• Approximately 45,000 to 60,000 toilets are discarded in New York City each year,
excluding the toilet rebate program.
• The total weight of these toilets will range from 1,282 to 1,710 tons per year.
• Excluding the metal parts, the weight of the toilets will range from 1,154 to 1,539 tons
per year.
Discussion
The estimates provided in this analysis will substantially underestimate the quantity of toilets
collected in New York City during the toilet rebate program years (1994 to 1997) since many
people who would not otherwise have replaced their toilets will take advantage of the rebate
program and replace older toilets with new, low-flow toilets. The estimates presented in this
analysis, 45,000 to 60,000 toilets per year, are deemed accurate for an average year, excluding
any rebate program and represent the best data available to the consultant at this time.
While exact estimates are not available regarding the number of additional toilets that will be
replaced because of the rebate program, NYC DEP estimates that the toilet rebate program will
have replaced 1.2 million toilets in a three year time period, or approximately 400,000 toilets a
year. This represents between 30 and 40 percent of all toilets in New York City. Assuming this
figure is correct, an additional 11,400 tons of material a year (10,260 tons excluding the metal
pieces) will have to be managed by New York City. It is not currently possible to determine
how the rebate program will affect future toilet discard rates, although it can be assumed that
the first few years after the program, lower discard rates could be expected.
1 Personal communication, Nancy Greenberg, NYC DOS with Warren Leibold, NYC DEP, 3/26/96.2 Personal communication, Nancy Greenberg, NYC DOS with Warren Leibold, NYC DEP, 3/26/96.3 Ibid.4 Ibid.5 Average of figures provided in 1993 Spring/Summer Sears Catalogue, pp. 591-594.
133

Characterization of New York City’s Solid Waste Stream Spring 2000
APPENDIX 40
New York City Waste Composition Analysis:
Writing Instruments
Introduction
This analysis estimates the quantity, in tons, of writing instruments in the New York City waste
stream. “Writing instruments” include ballpoint pens, roller pens, highlighting markers, and
mechanical pencils. They are composed primarily of polypropylene and polystyrene. The
figures in this analysis include residential use, as well as commercial and institutional use, of
writing instruments.
The exact quantity of writing instruments disposed in New York City is not available; therefore,
estimates were developed based on data obtained from manufacturers, retail outlets in New
York City, and industry associations.
Methodology
The model used is this analysis incorporates information provided by leading manufacturers of
writing instruments. Company sales data, combined with market share information, was used
to generate total figures for New York City.
Assumptions
• The average weight for one writing instrument is 6 grams or 0.21 ounces.1
• One major manufacturer’s sales data for 1995 and market share for 1994 can be used to
extrapolate total sales of writing instruments in New York City.2
• It is assumed that a “steady state” exists, i.e., units purchased equals units consumed.
Calculations
• 157,500,000 total writing instruments were sold in NYC in 1995.
• 157,500,000 total instruments x 0.21 ounces = 33,075,000 total ounces divided by 16
= 2,067,187.5 pounds divided by 2000 = 1,033.59 tons of writing instruments.
Results
• Approximately 157,500,000 writing instruments were sold in New York City in 1995.
• This contributes 1,033.59 tons to the New York City waste stream.
Discussion
This analysis is based on data from one company. The average weight of a competitor’s
product may differ, altering the total figures. Additionally, market share data includes
134

Characterization of New York City’s Solid Waste Stream Spring 2000
disposable writing instruments, as well as refillable pens, and mechanical pencils. Market
share information for disposable writing instruments alone was not available.
The steady-state assumption may overestimate disposal since all sales in New York City do not
necessarily result in disposal of the unit in New York City. For example, a large percentage of
writing instruments are provided to consumers by commercial concerns such as hotels, and
souvenir shops. These are likely to be carried out of the City.
The figures also includes both refillable and nonrefillable writing instruments, making it
impossible to determine any reduction in waste that may be associated with switching to the
use of refillable writing instruments.
1 Average of one major manufacturer’s product mix.2 Market share is for “stationery products,” which includes ballpoint pens (refillable and nonrefillable), highlighting markers, roller
pens, and mechanical pencils.
APPENDIX 41
New York City Waste Stream Composition Analysis:
Trash Bags
Introduction
This analysis estimates the quantity, in tons, of trash bags in the New York City waste stream.
Trash bags refers to plastic bags made of LDPE, LLDPE, AND HDPE used in home, commercial,
and institutional settings. EPA’s Characterization of Municipal Solid Waste in the United States:
1995 Update lists the recycling rate for trash bags as 0 percent. Nationwide, trash bags comprise
approximately 0.6 percent of the total MSW waste stream.1
The exact quantity of trash bags disposed in New York City is not available; therefore, estimates
were developed based on data obtained from previously conducted studies.
Methodology
The estimates presented in this study were derived from national disposal figures and recycling
rates for trash bags. The national estimates are presented in EPA’s Characterization of Municipal
Solid Waste in the United States: 1995 Update and are based on data collected by Franklin &
Associates. The methodology used by Franklin & Associates to determine national disposal
figures is a “materials flow methodology.” It is based on production data (by weight) for
materials and products in the waste stream, with adjustments for imports, exports, and product
lifespans.
135

Characterization of New York City’s Solid Waste Stream Spring 2000
The ratio of U.S. population to New York City population is applied to the national estimates
of the quantity of trash bags disposed to generate an estimate for New York City. This estimate
is then adjusted to account for recycling.
Assumptions
• 248.7 million people in the U.S. in 1990.
• 7.3 million people living in New York City in 1990.2
• 910,000 tons of trash bags generated in the U.S. municipal waste stream in 1994.3
• The recycling rate for trash bags is assumed to be 0 percent.4
Calculations
• 248.7 million people in the U.S. divided by 7.3 million people living in New York City
= 2.9 percent of the total population lives in New York City.
• 910,000 tons of trash bags generated in the U.S. waste stream x 2.9 percent
(NYC population share) = 26,390 tons of trash bags generated in the New York City
waste stream in 1994.
• 0 percent recycling rate x 26,390 tons of trash bags generated in New York City =
26,390 tons of trash bags disposed in the New York City waste stream in 1994.
Results
• A total of approximately 26,390 tons of old trash bags are generated in New York City
each year.
• Accounting for recycling, these items contribute 26,390 tons per year to the New York
City waste stream.
Discussion
The estimates regarding the quantity of trash bags discarded in the New York City waste stream
each year are based on EPA’s national waste characterization data. Other estimates in this
study have been developed from original research by the consultant. However, in certain
cases, such as this, where previously conducted, up-to-date studies exist, the consultant
deemed it more reasonable and cost-effective to modify that data to New York City rather than
duplicate a previous effort. The data used for this report were the most current available to the
consultant and are deemed to be representative of the annual quantities of trash bags found in
the New York City waste stream each year.
1 U.S. EPA, Characterization of Municipal Solid Waste in the United States: 1995 Update, Tables 16 and 17.2 New York City Department of Planning, 1995 census data.3 U.S. EPA, Characterization of Municipal Solid Waste in the United States: 1995 Update, Table 18.4 Ibid, Table 21.
136