characteristics of fall chum salmon spawning habitat on a
TRANSCRIPT

Prepared in cooperation with the Alaska Department of Fish and Game
Characteristics of Fall Chum Salmon Spawning Habitat on a Mainstem River in Interior Alaska
By Sean E. Burril, Christian E. Zimmerman, and James E. Finn
Open-File Report 2010–1164 Prepared for Arctic-Yukon-Kuskokwim Sustainable Salmon Initiative Final Report, March 2010
U.S. Department of the Interior U.S. Geological Survey
U.S. Department of the Interior KEN SALAZAR, Secretary
U.S. Geological Survey Marcia K. McNutt, Director
U.S. Geological Survey, Reston, Virginia: 2010
For more information on the USGS—the Federal source for science about the Earth, its natural and living resources, natural hazards, and the environment, visit http://www.usgs.gov or call 1–888–ASK–USGS. For an overview of USGS information products, including maps, imagery, and publications, visit http://www.usgs.gov/pubprod To order this and other USGS information products, visit http://store.usgs.gov
Suggested citation: Burril, S.E., Zimmerman, C.E., and Finn, J.E., 2010, Characteristics of fall chum salmon spawning habitat on a mainstem river in Interior Alaska: U.S. Geological Survey Open-File Report 2010-1164, 20 p.
Any use of trade, product, or firm names is for descriptive purposes only and does not imply endorsement by the U.S. Government.
Although this report is in the public domain, permission must be secured from the individual copyright owners to reproduce any copyrighted material contained within this report.
iii
Contents Abstract ......................................................................................................................................................................... 1 Introduction.................................................................................................................................................................... 2 Description of Study Area .............................................................................................................................................. 2 Methods......................................................................................................................................................................... 4 Fall Chum Salmon Spawning Habitat ............................................................................................................................ 7
Pilot Study.................................................................................................................................................................. 7 Characteristics of Spawning Sites.............................................................................................................................. 7
Spawning in Mainstem Habitats ...................................................................................................................................16 Summary ......................................................................................................................................................................18 Acknowledgments ........................................................................................................................................................18 References Cited..........................................................................................................................................................18
Figures Figure 1. Map showing study sites of chum salmon spawning habitat, Tanana River, Alaska, 2007–09 ..................... 3 Figure 2. Schematic diagram of piezometer as used to measure vertical hydraulic gradient ....................................... 5 Figure 3. Photograph showing temperature data logger used to measure inter-gravel water temperature .................. 6 Figure 4. Graph showing daily air temperature at Delta Junction, Alaska. Data are from the National Weather Service Station PABI......................................................................................................................... 8 Figure 5. Graph showing water temperature profiles taken adjacent to spawning locations at 35 cm inter-gravel, Tanana River, Alaska, December 5, 2007–April 18, 2008 ............................................................................................. 8 Figure 6. Photographs of fine sediment deposition covering chum salmon spawning sites, Tanana River, Alaska .................................................................................................................................................... 9 Figure 7. Graph showing daily air temperature, Delta Junction, Alaska ..................................................................... 10 Figure 8. Graphs showing water temperature profiles for sites sampled along the mainstem Tanana River, Alaska .................................................................................................................................................. 11 Figure 9. Graphs showing water temperature profiles for sites sampled along the mainstem Tanana River, Alaska .................................................................................................................................................. 12 Figure 10. Graph showing vertical hydraulic gradient (VHG) adjacent to spawning sites 1–11, mainstem Tanana River, Alaska, December 5, 2007 (Site B) and November 16–18, 2008 ......................................................... 15 Figure 11. Graph showing accumulated thermal units (ATU) associated with sampling sites, Tanana River, Alaska, December 5, 2007–April 18, 2008 (sites A and B) and November 18, 2008–April 18, 2009 (sites 2–11) ....... 15 Figure 12. Graph showing simple linear regression of accumulated thermal units (ATU) and vertical hydraulic gradient (VHG) at sites sampled along the mainstem Tanana River, Alaska, December 5, 2007 through April 18, 2008 (closed circle) and November 16–19, 2008 through April 18, 2009 (open circle).................................. 16
Table Table 1. Location of sampling sites, vertical hydraulic gradient, tidbit data logger start and stop dates and associated surface and inter-gravel water temperature, and accumulated thermal units, Tanana River, Alaska ........ 13

iv
Conversion Factors and Abbreviations and Acronyms
Conversion Factors
SI to Inch/Pound
Multiply By To obtain
Length
centimeter (cm) 0.3937 inch (in.)
millimeter (mm) 0.03937 inch (in.)
kilometer (km) 0.6214 mile (mi)
Area
square kilometer (km2) 247.1 acre
square kilometer (km2) 0.3861 square mile (mi2)
Temperature in °Celsius (°C) may be converted to ° Fahrenheit (°F) as follows: °F=(1.8×°C)+32.
Abbreviations and Acronyms
ADFG Alaska Department of Fish and Game AWC Anadromous Waters Catalog ATU accumulated thermal units
Characteristics of Fall Chum Salmon Spawning Habitat on a Mainstem River in Interior Alaska
By Sean E. Burril, Christian E. Zimmerman, and James E. Finn
Abstract Chum salmon (Oncorhynchus keta) are the most abundant species of salmon spawning in the
Yukon River drainage system, and they support important personal use, subsistence, and commercial fisheries. Chum salmon returning to the Tanana River in Interior Alaska are a significant contribution to the overall abundance of Yukon River chum salmon and an improved understanding of habitat use is needed to improve conservation of this important resource. We characterized spawning habitat of chum salmon using the mainstem Tanana River as part of a larger study to document spawning distributions and habitat use in this river. Areas of spawning activity were located using radiotelemetry and aerial helicopter surveys. At 11 spawning sites in the mainstem Tanana River, we recorded inter-gravel and surface-water temperatures and vertical hydraulic gradient (an indication of the direction of water flux) in substrate adjacent to salmon redds. At all locations, vertical hydraulic gradient adjacent to redds was positive, indicating that water was upwelling through the gravel. Inter-gravel temperatures adjacent to redds generally were warmer than surface water at most locations and were more stable than surface-water temperature. Inter-gravel water temperature adjacent to redds ranged from 2.6 to 5.8 degrees Celsius, whereas surface-water temperature ranged from greater than 0 to 5.5 degrees Celsius. Some sites were affected more by extremes in air temperature than others. At these sites, inter-gravel water temperature profiles were variable (with ranges similar to those observed in surface water), suggesting that even though upwelling habitats provide a stable thermal incubation environment, eggs and embryos still may be affected by extremes in air temperature. Fine sand and silt covered redds at multiple sites and were evidence of increased river flow during the winter months, which may be a potential source of increased mortality during egg-to-fry development. This study provides documentation of spawning by fall chum salmon and is the first study to continuously measure inter-gravel water temperature at sites in the mainstem Tanana River.
1

Introduction In relation to the management of salmon, mainstem habitats of large rivers are primarily
considered migration corridors with little attention given to their possible role as spawning habitat. Headwater tributaries typically are the focus of salmon habitat protection and restoration, although issues concerning mainstem waterways focus on securing passage of migrating salmon. Mainstem habitats, however, have been shown to provide valuable spawning areas and contribute significantly to the overall production of some salmon populations (Wood and others, 1987; Eiler and others, 1988, 1992).
In Alaska, the regulatory protection of aquatic habitat is provided for water bodies listed in the Catalog of Waters Important for the Spawning Rearing or Migration of Anadromous Fishes, commonly referred to as the Anadromous Waters Catalog (AWC; http://www.sf.adfg.state.ak.us/SARR/awc/). Listing a water body in the AWC triggers a cascade of state and local habitat protection statutes, regulations, standards, and policies. Currently (2010), the mainstem Tanana River is classified as a migration corridor in the AWC. Previous studies using radiotelemetry indicate that a significant number of fall chum salmon (Oncorhynchus keta) returning to the Tanana River may be spawning in mainstem reaches (Barton, 1992; Cleary and Hamazaki, 2005), but no information is available concerning the distribution or characterization of possible mainstem spawning habitats in the Tanana River.
Many habitat characteristics influence the selection of spawning sites by fall chum salmon. Water flow through the substrate and associated water temperature (Geist and others, 2002; Maclean, 2003), substrate type (Chapman, 1988; Kondolf, 2000), and dissolved oxygen concentration (Peterson and Quinn, 1996; Maclean, 2003) are among the better-known factors influencing redd site selection by salmon. Generally, fall chum salmon are assumed to select upwelling habitats because of their warmer and stable water temperatures (Kogl, 1965; Leman, 1993; Maclean, 2003). Water temperature is a critical variable controlling the development and survival of salmonid embryos and alevins (Crisp, 1988, 1990). Warm water temperatures play an important role in providing potential sanctuary from lower temperature thresholds and freezing substrate as well as accelerating the developmental rate of embryos and increasing egg-to-smolt survival (Wangaard and Burger, 1983).
This study was a subcomponent of a larger project being conducted by the Alaska Department of Fish and Game (ADFG) to better define habitat use and distribution of fall chum salmon in the Tanana River for the purpose of refining entries in the AWC. The objectives of this study were to ground truth the presence of spawning habitat used by chum salmon in the mainstem of the Tanana River and describe the environmental characteristics associated with these habitats throughout the periods of spawning and incubation. We aimed to characterize mainstem-spawning habitats by (1) confirming active spawning areas, (2) recording surface and inter-gravel temperature throughout the incubation period, and (3) determining the relative source of water (upwelling or downwelling waters).
Description of Study Area The Tanana River is the second largest tributary of the Yukon River, flowing 700 km northwest
through a broad alluvial valley and draining an area of 155,250 km2. The Tanana River and its tributaries provide spawning habitat to an estimated mean of 143,000 fall chum salmon and these chum salmon support important personal use, subsistence, and commercial fisheries (Busher and Hamazaki, 2005). The area of interest for this study was the section of the Tanana River upstream of its confluence with the Salcha River to just upstream of the confluence of the Delta River (fig. 1).
2

Figure 1. Map showing study sites of chum salmon spawning habitat, Tanana River, Alaska, 2007–2009.
3

Methods Beginning in December 2007, we monitored and measured spawning habitat characteristics for
fall chum salmon on the Tanana River mainstem. Tanana River mainstem habitat as it pertains to this study is the main channel inclusive of all side channels. The 2007 field season focused on refining techniques of equipment installation and retrieval. Four sites where salmon were observed spawning and designated A–D were selected and monitoring equipment was installed December 4–5, 2007. Equipment retrieval occurred April 18, 2008. After feasibility was determined, a full sampling protocol began November 18, 2008, and ended April 18, 2009. General areas of spawning activity were located by ADFG using radiotelemetry. Aided by Global Positional System (GPS) locations from the telemetry study, sampling sites were selected by aerial helicopter surveys of open water habitat with signs of spawning salmon (that is, fish actively spawning and (or) carcasses). Overall, 15 sites were selected: 4 in 2007 and 11 in 2008. An aerial photograph was taken of each site before landing. Once on the ground, spawning sites were visually confirmed by presence of redds, active spawning, and identification of eggs at the substrate surface. Following spawning confirmation, details of the surrounding area were documented, including a series of photographs to create a panoramic view of each site, a sketched diagram with GPS coordinates, orientation of monitoring equipment, direction of magnetic north, and any landmarks that might aid in later equipment retrieval. In close proximity to redds at each site, the sampling protocol consisted of measuring vertical hydraulic gradient, recording inter-gravel and surface-water temperature profiles, and visually determining general substrate composition.
To characterize the degree of upwelling or downwelling of water through the substrate adjacent to redds, we used the methods of Baxter and others (2003) to measure vertical hydraulic gradient. We installed two piezometers into the substrate to a depth of 40 cm (fig. 2); 35–40 cm is a typical excavation depth for chum salmon redds (Bruya, 1981). Standpipes were attached to the piezometers and we waited about 10–15 minutes to allow any groundwater flow to stabilize.
We then measured and recorded the distance from the top of the standpipe to the water level outside the standpipe (outside distance) and the distance from the top of the standpipe to the water level inside the standpipe (inside distance) to the nearest millimeter using an electronic water level indicator (Solinst® Model 101M Mini Water Level Meter). Hydraulic gradient was calculated by subtracting the inside distance from the outside distance. A positive hydraulic gradient value indicates upwelling, a negative value indicates downwelling, and a zero indicates no vertical groundwater flow. Hydraulic gradient was measured when the piezometers were deployed and again prior to retrieval in the spring. After the first measurements were taken, standpipes were removed and replaced with rubber stoppers to prevent debris accumulation over the winter.
4

Figure 2. Schematic diagram of piezometer as used to measure vertical hydraulic gradient.
Substrate Surface
Water Surface Positive Hydraulic Gradient
Standpipe
40 cm Piezometer
5
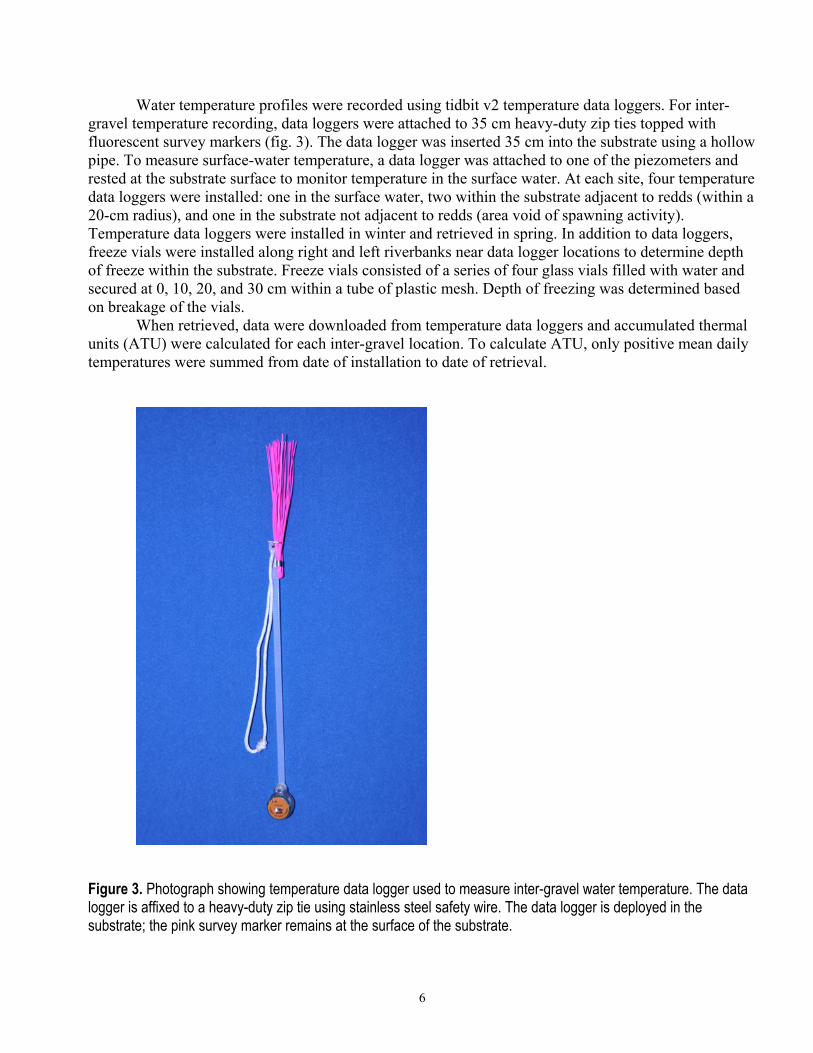
Water temperature profiles were recorded using tidbit v2 temperature data loggers. For inter-gravel temperature recording, data loggers were attached to 35 cm heavy-duty zip ties topped with fluorescent survey markers (fig. 3). The data logger was inserted 35 cm into the substrate using a hollow pipe. To measure surface-water temperature, a data logger was attached to one of the piezometers and rested at the substrate surface to monitor temperature in the surface water. At each site, four temperature data loggers were installed: one in the surface water, two within the substrate adjacent to redds (within a 20-cm radius), and one in the substrate not adjacent to redds (area void of spawning activity). Temperature data loggers were installed in winter and retrieved in spring. In addition to data loggers, freeze vials were installed along right and left riverbanks near data logger locations to determine depth of freeze within the substrate. Freeze vials consisted of a series of four glass vials filled with water and secured at 0, 10, 20, and 30 cm within a tube of plastic mesh. Depth of freezing was determined based on breakage of the vials.
When retrieved, data were downloaded from temperature data loggers and accumulated thermal units (ATU) were calculated for each inter-gravel location. To calculate ATU, only positive mean daily temperatures were summed from date of installation to date of retrieval.
Figure 3. Photograph showing temperature data logger used to measure inter-gravel water temperature. The data logger is affixed to a heavy-duty zip tie using stainless steel safety wire. The data logger is deployed in the substrate; the pink survey marker remains at the surface of the substrate.
6
Fall Chum Salmon Spawning Habitat
Pilot Study
Of the monitoring equipment installed in 2007, only equipment at sites A and B was recovered; ice cover and sedimentation at sites C and D made it impossible to recover equipment. Because of extremely cold air temperatures during December 2007, a reading of vertical hydraulic gradient was obtainable only at site B and ice build-up on equipment prevented further measurements of vertical hydraulic gradient at other sampling locations.
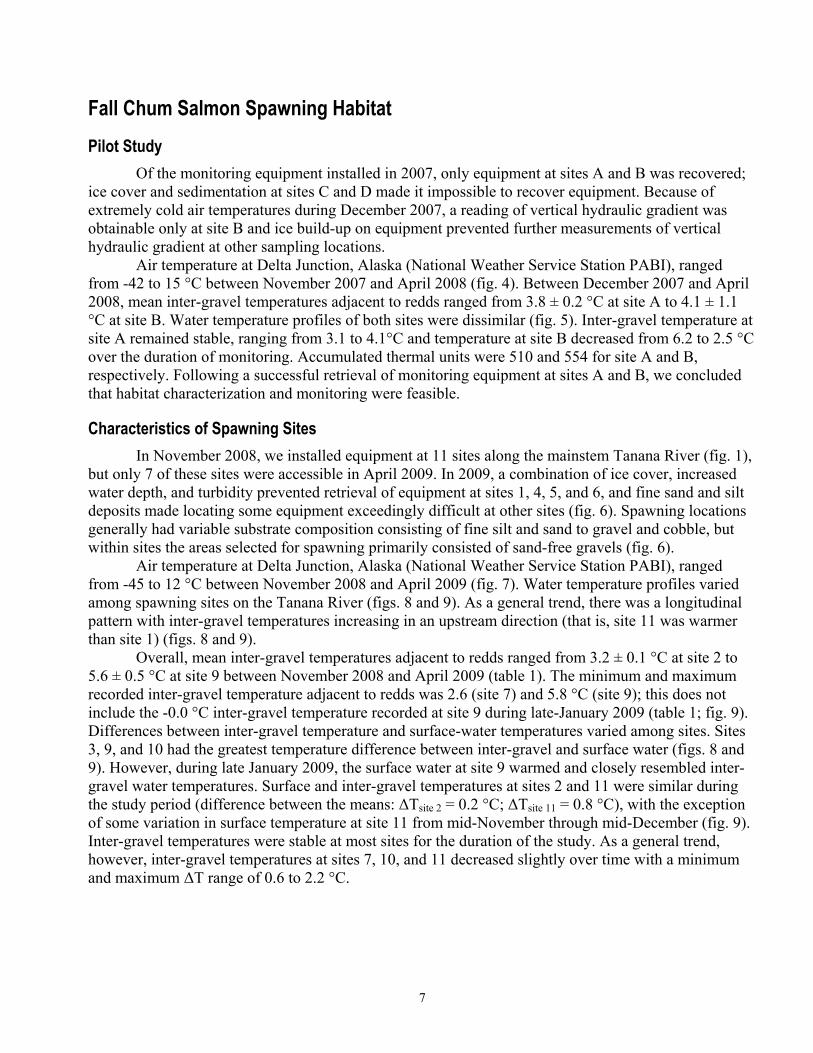
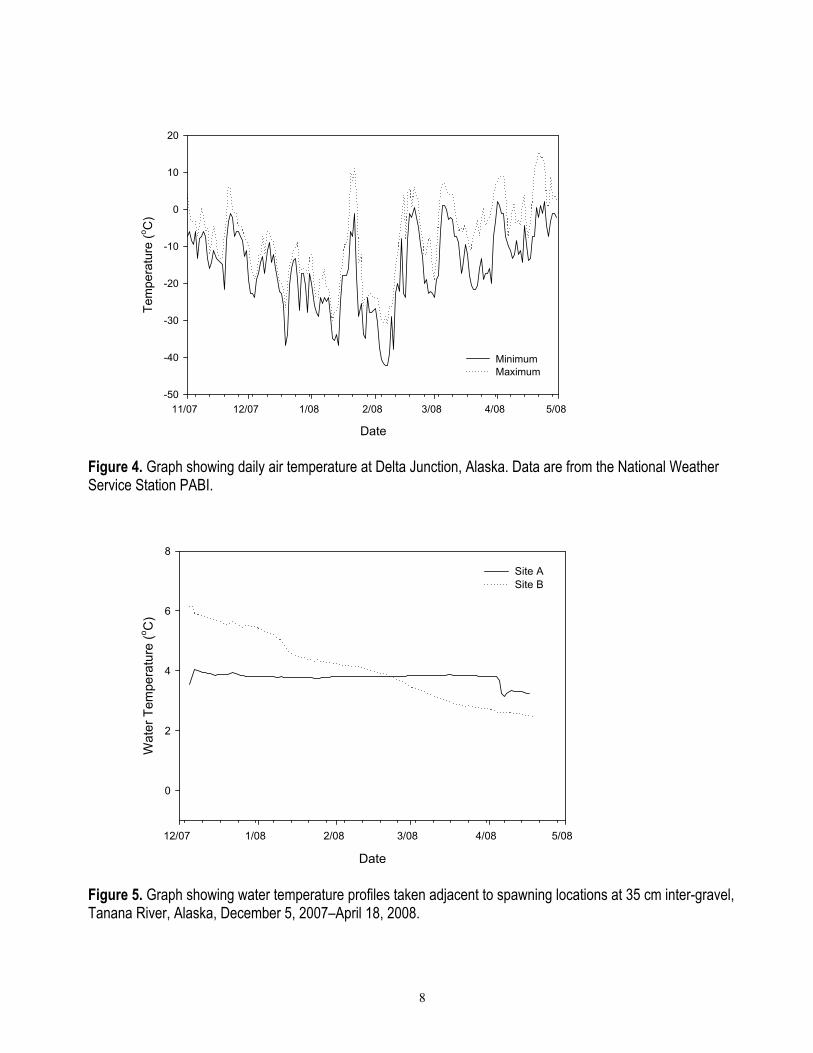
Air temperature at Delta Junction, Alaska (National Weather Service Station PABI), ranged from -42 to 15 °C between November 2007 and April 2008 (fig. 4). Between December 2007 and April 2008, mean inter-gravel temperatures adjacent to redds ranged from 3.8 ± 0.2 °C at site A to 4.1 ± 1.1 °C at site B. Water temperature profiles of both sites were dissimilar (fig. 5). Inter-gravel temperature at site A remained stable, ranging from 3.1 to 4.1°C and temperature at site B decreased from 6.2 to 2.5 °C over the duration of monitoring. Accumulated thermal units were 510 and 554 for site A and B, respectively. Following a successful retrieval of monitoring equipment at sites A and B, we concluded that habitat characterization and monitoring were feasible.
Characteristics of Spawning Sites
In November 2008, we installed equipment at 11 sites along the mainstem Tanana River (fig. 1), but only 7 of these sites were accessible in April 2009. In 2009, a combination of ice cover, increased water depth, and turbidity prevented retrieval of equipment at sites 1, 4, 5, and 6, and fine sand and silt deposits made locating some equipment exceedingly difficult at other sites (fig. 6). Spawning locations generally had variable substrate composition consisting of fine silt and sand to gravel and cobble, but within sites the areas selected for spawning primarily consisted of sand-free gravels (fig. 6).
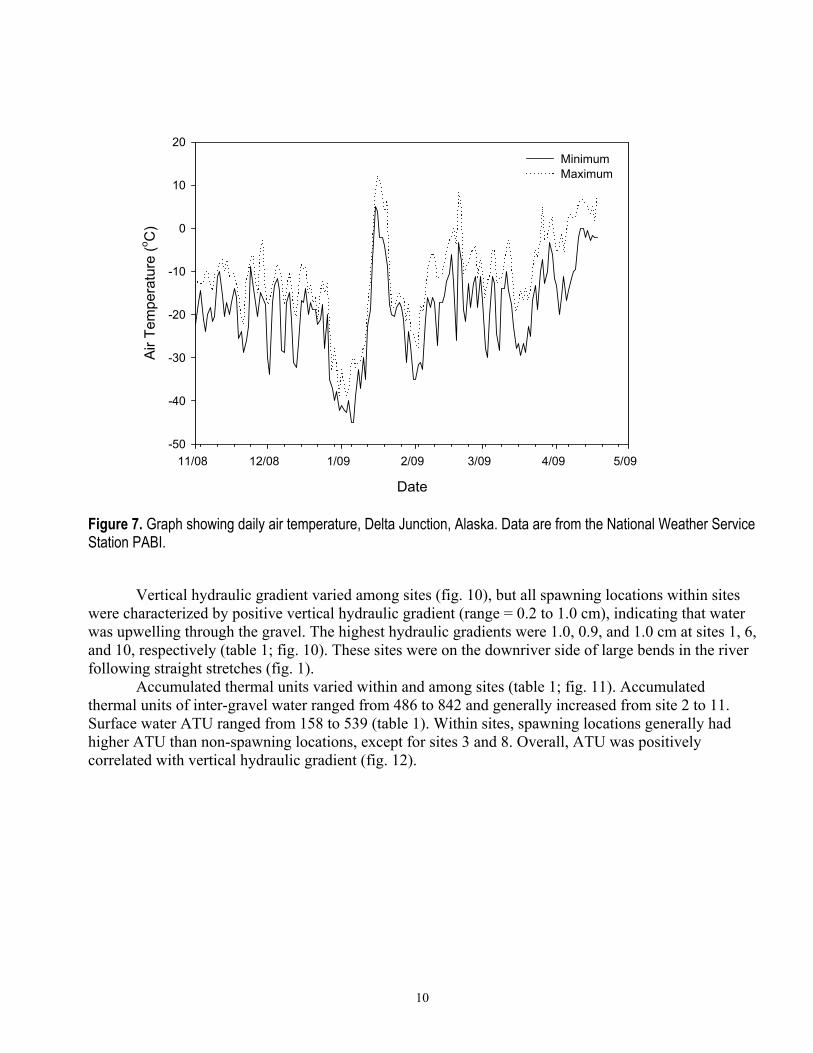
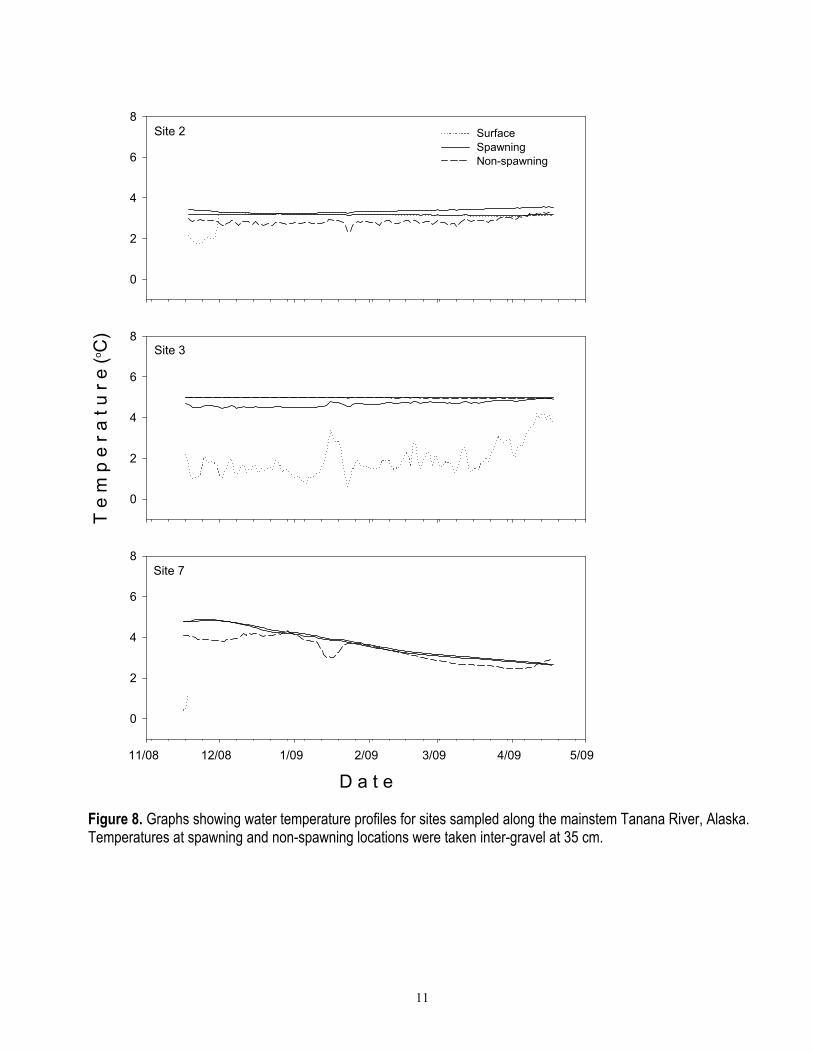
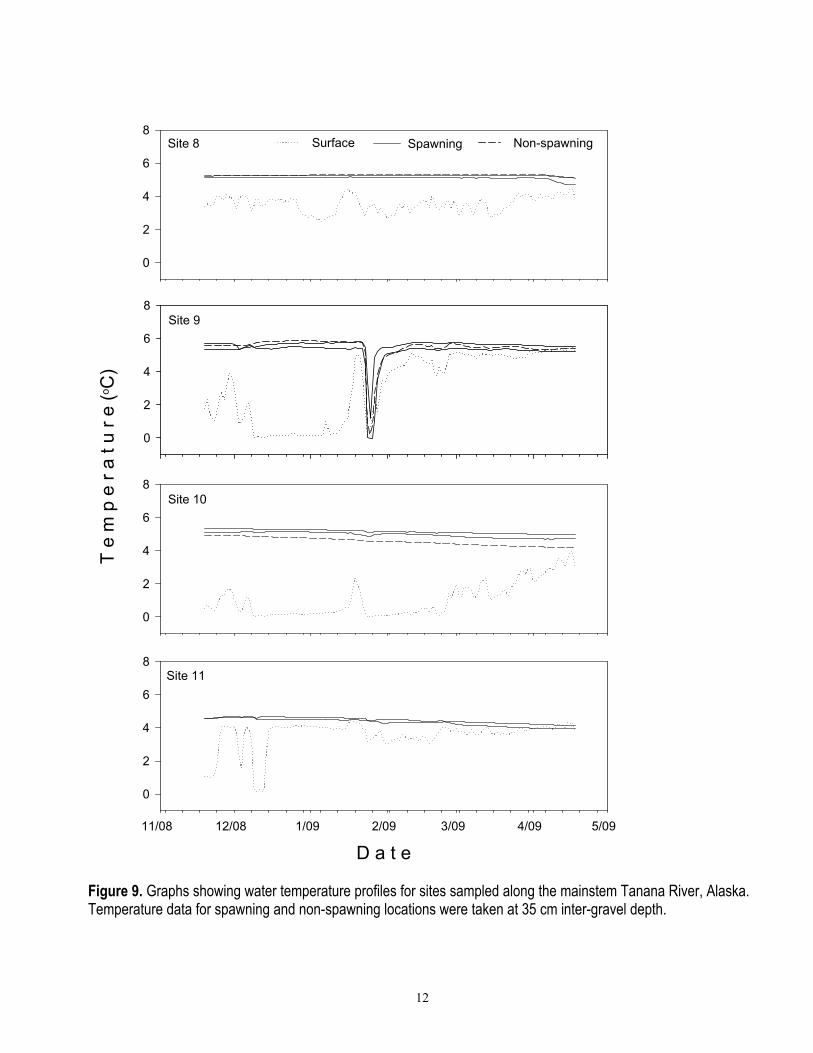
Air temperature at Delta Junction, Alaska (National Weather Service Station PABI), ranged from -45 to 12 °C between November 2008 and April 2009 (fig. 7). Water temperature profiles varied among spawning sites on the Tanana River (figs. 8 and 9). As a general trend, there was a longitudinal pattern with inter-gravel temperatures increasing in an upstream direction (that is, site 11 was warmer than site 1) (figs. 8 and 9).
Overall, mean inter-gravel temperatures adjacent to redds ranged from 3.2 ± 0.1 °C at site 2 to 5.6 ± 0.5 °C at site 9 between November 2008 and April 2009 (table 1). The minimum and maximum recorded inter-gravel temperature adjacent to redds was 2.6 (site 7) and 5.8 °C (site 9); this does not include the -0.0 °C inter-gravel temperature recorded at site 9 during late-January 2009 (table 1; fig. 9). Differences between inter-gravel temperature and surface-water temperatures varied among sites. Sites 3, 9, and 10 had the greatest temperature difference between inter-gravel and surface water (figs. 8 and 9). However, during late January 2009, the surface water at site 9 warmed and closely resembled inter-gravel water temperatures. Surface and inter-gravel temperatures at sites 2 and 11 were similar during the study period (difference between the means: ΔTsite 2 = 0.2 °C; ΔTsite 11 = 0.8 °C), with the exception of some variation in surface temperature at site 11 from mid-November through mid-December (fig. 9). Inter-gravel temperatures were stable at most sites for the duration of the study. As a general trend, however, inter-gravel temperatures at sites 7, 10, and 11 decreased slightly over time with a minimum and maximum ΔT range of 0.6 to 2.2 °C.
7
Date
11/07 12/07 1/08 2/08 3/08 4/08 5/08
Tem
pera
ture
(o C
)
-50
-40
-30
-20
-10
0
10
20
MinimumMaximum
Figure 4. Graph showing daily air temperature at Delta Junction, Alaska. Data are from the National Weather Service Station PABI.
Date
12/07 1/08 2/08 3/08 4/08 5/08
Wa
ter
Tem
pe
ratu
re (
oC
)
0
2
4
6
8
Site A Site B
Figure 5. Graph showing water temperature profiles taken adjacent to spawning locations at 35 cm inter-gravel, Tanana River, Alaska, December 5, 2007–April 18, 2008.
8

Figure 6. Photographs of fine sediment deposition covering chum salmon spawning sites, Tanana River, Alaska. The top photograph was taken in November 2008 and bottom photograph was taken in April 2009.
9
Date
11/08 12/08 1/09 2/09 3/09 4/09 5/09
Air
Tem
pera
ture
(oC
)
-50
-40
-30
-20
-10
0
10
20
MinimumMaximum
Figure 7. Graph showing daily air temperature, Delta Junction, Alaska. Data are from the National Weather Service Station PABI.
Vertical hydraulic gradient varied among sites (fig. 10), but all spawning locations within sites
were characterized by positive vertical hydraulic gradient (range = 0.2 to 1.0 cm), indicating that water was upwelling through the gravel. The highest hydraulic gradients were 1.0, 0.9, and 1.0 cm at sites 1, 6, and 10, respectively (table 1; fig. 10). These sites were on the downriver side of large bends in the river following straight stretches (fig. 1).
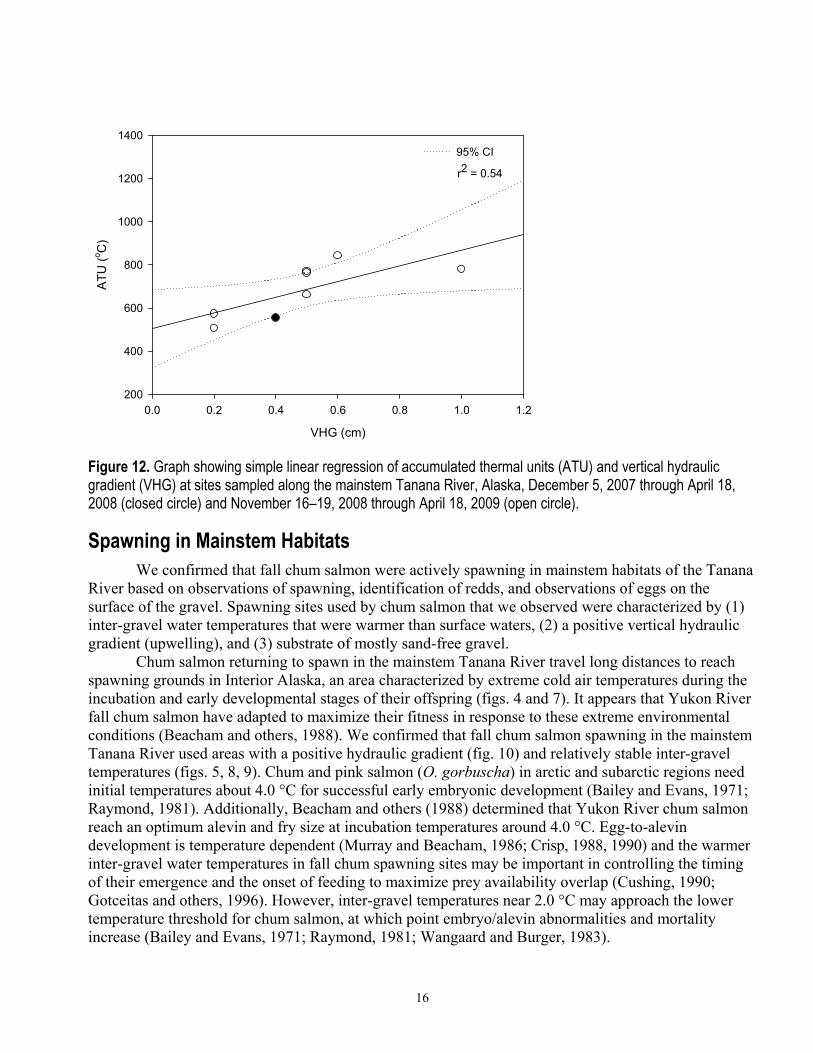
Accumulated thermal units varied within and among sites (table 1; fig. 11). Accumulated thermal units of inter-gravel water ranged from 486 to 842 and generally increased from site 2 to 11. Surface water ATU ranged from 158 to 539 (table 1). Within sites, spawning locations generally had higher ATU than non-spawning locations, except for sites 3 and 8. Overall, ATU was positively correlated with vertical hydraulic gradient (fig. 12).
10
Site 2
0
2
4
6
8SurfaceSpawningNon-spawning
Site 3
T e
m p
e r
a t
u r
e (o
C)
0
2
4
6
8
Site 7
D a t e
11/08 12/08 1/09 2/09 3/09 4/09 5/09
0
2
4
6
8
Figure 8. Graphs showing water temperature profiles for sites sampled along the mainstem Tanana River, Alaska. Temperatures at spawning and non-spawning locations were taken inter-gravel at 35 cm.
11
Site 8
0
2
4
6
8Spawning
Site 9
0
2
4
6
8
Non-spawning
Site 10
T e
m p
e r
a t
u r
e (o C
)
0
2
4
6
8
Surface
Site 11
D a t e
11/08 12/08 1/09 2/09 3/09 4/09 5/09
0
2
4
6
8
Figure 9. Graphs showing water temperature profiles for sites sampled along the mainstem Tanana River, Alaska. Temperature data for spawning and non-spawning locations were taken at 35 cm inter-gravel depth.
12

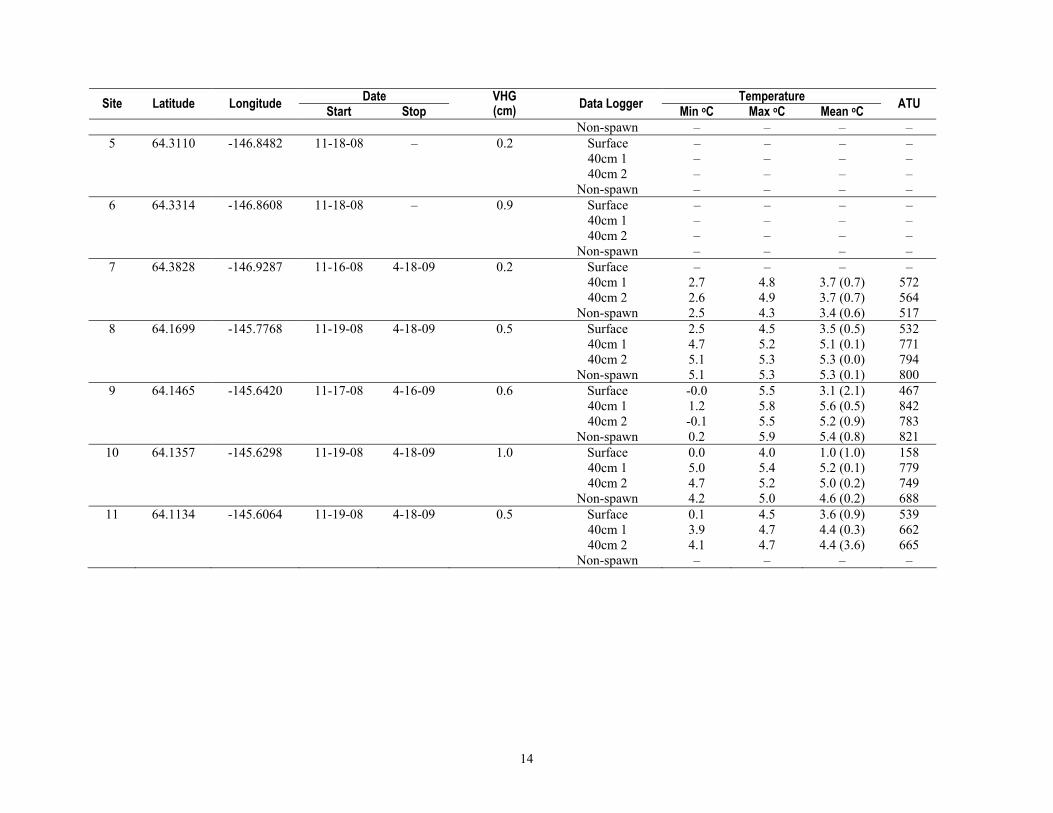
Table 1. Location of sampling sites, vertical hydraulic gradient, tidbit data logger start and stop dates and associated surface and inter-gravel water temperature, and accumulated thermal units, Tanana River, Alaska. [Values in parenthesis represent ± one standard deviation about the mean. ATU, accumulated thermal unit; VHG, vertical hydraulic gradient; oC , degrees Celsius; cm, centimeter; –, no data]
Date Temperature
Stop VHG (cm) Data Logger Site Latitude Longitude
Max oC Mean oC ATU
Start Min oC A 64.7294 -147.4072 12-05-07 4-18-08 – Surface – – – – 35cm 1 3.1 4.1 3.8 (0.2) 510 35cm 2 – – – – Non-spawn – – – –
B 64.5268 -147.0228 12-04-07 4-18-08 0.4 Surface – – – – 35cm 1 2.5 6.2 4.1 (1.1) 554 35cm 2 – – – – Non-spawn – – – –
C 64.3044 -146.7420 12-05-07 – – Surface – – – – 35cm 1 – – – – 35cm 2 – – – – Non-spawn – – – –
D 64.2691 -146.4145 12-05-07 – – Surface – – – – 35cm 1 – – – – 35cm 2 – – – – Non-spawn – – – –
1 64.2459 -146.1559 11-17-08 – 1.0 Surface – – – 40cm 1 – – – – 40cm 2 – – – – Non-spawn – – – –
2 64.2831 -146.4260 11-17-08 4-17-09 0.2 Surface 1.7 3.3 3.1 (0.3) 466 40cm 1 3.2 3.6 3.3 (0.1) 507 40cm 2 3.1 3.4 3.2 (0.1) 487 Non-spawn 2.3 3.3 2.8 (0.2) 432
3 64.2676 -146.6943 11-17-08 4-18-09 0.5 Surface 0.6 4.2 1.9 (0.8) 295 40cm 1 5.0 5.0 5.0 (0.0) 763 40cm 2 4.5 5.0 4.7 (0.1) 715 Non-spawn 5.0 5.0 5.0 (0.0) 760
4 64.2746 -146.7016 11-18-08 – 0.4 Surface – – – – 40cm 1 – – – – 40cm 2 – – – –
13
14
Date Temperature Site Latitude Longitude Start Stop
VHG (cm) Data Logger
Min oC Max oC Mean oC ATU
Non-spawn – – – – 5 64.3110 -146.8482 11-18-08 – 0.2 Surface – – – – 40cm 1 – – – – 40cm 2 – – – – Non-spawn – – – –
6 64.3314 -146.8608 11-18-08 – 0.9 Surface – – – – 40cm 1 – – – – 40cm 2 – – – – Non-spawn – – – –
7 64.3828 -146.9287 11-16-08 4-18-09 0.2 Surface – – – – 40cm 1 2.7 4.8 3.7 (0.7) 572 40cm 2 2.6 4.9 3.7 (0.7) 564 Non-spawn 2.5 4.3 3.4 (0.6) 517
8 64.1699 -145.7768 11-19-08 4-18-09 0.5 Surface 2.5 4.5 3.5 (0.5) 532 40cm 1 4.7 5.2 5.1 (0.1) 771 40cm 2 5.1 5.3 5.3 (0.0) 794 Non-spawn 5.1 5.3 5.3 (0.1) 800
9 64.1465 -145.6420 11-17-08 4-16-09 0.6 Surface -0.0 5.5 3.1 (2.1) 467 40cm 1 1.2 5.8 5.6 (0.5) 842 40cm 2 -0.1 5.5 5.2 (0.9) 783 Non-spawn 0.2 5.9 5.4 (0.8) 821
10 64.1357 -145.6298 11-19-08 4-18-09 1.0 Surface 0.0 4.0 1.0 (1.0) 158 40cm 1 5.0 5.4 5.2 (0.1) 779 40cm 2 4.7 5.2 5.0 (0.2) 749 Non-spawn 4.2 5.0 4.6 (0.2) 688
11 64.1134 -145.6064 11-19-08 4-18-09 0.5 Surface 0.1 4.5 3.6 (0.9) 539 40cm 1 3.9 4.7 4.4 (0.3) 662 40cm 2 4.1 4.7 4.4 (3.6) 665 Non-spawn – – – –

Site
B 1 2 3 4 5 6 7 8 9 10 11
VH
G (
cm)
0.0
0.2
0.4
0.6
0.8
1.0
1.2
Figure 10. Graph showing vertical hydraulic gradient (VHG) adjacent to spawning sites 1–11, mainstem Tanana River, Alaska, December 5, 2007 (Site B) and November 16–18, 2008.
Spawning Sites
Stie A Site B Site 2 Site 3 Site 7 Site 8 Site 9 Site 10 Site 11
AT
U (
o C)
0
200
400
600
800Surface Spawning Non-spawning
Figure 11. Graph showing accumulated thermal units (ATU) associated with sampling sites, Tanana River, Alaska, December 5, 2007–April 18, 2008 (sites A and B) and November 18, 2008–April 18, 2009 (sites 2–11). ATU data for spawning and non-spawning sites were taken at 35 cm inter-gravel depth.
15
VHG (cm)
0.0 0.2 0.4 0.6 0.8 1.0 1.2
AT
U (
o C)
200
400
600
800
1000
1200
1400
95% CI
r2 = 0.54
Figure 12. Graph showing simple linear regression of accumulated thermal units (ATU) and vertical hydraulic gradient (VHG) at sites sampled along the mainstem Tanana River, Alaska, December 5, 2007 through April 18, 2008 (closed circle) and November 16–19, 2008 through April 18, 2009 (open circle).
Spawning in Mainstem Habitats We confirmed that fall chum salmon were actively spawning in mainstem habitats of the Tanana
River based on observations of spawning, identification of redds, and observations of eggs on the surface of the gravel. Spawning sites used by chum salmon that we observed were characterized by (1) inter-gravel water temperatures that were warmer than surface waters, (2) a positive vertical hydraulic gradient (upwelling), and (3) substrate of mostly sand-free gravel.
Chum salmon returning to spawn in the mainstem Tanana River travel long distances to reach spawning grounds in Interior Alaska, an area characterized by extreme cold air temperatures during the incubation and early developmental stages of their offspring (figs. 4 and 7). It appears that Yukon River fall chum salmon have adapted to maximize their fitness in response to these extreme environmental conditions (Beacham and others, 1988). We confirmed that fall chum salmon spawning in the mainstem Tanana River used areas with a positive hydraulic gradient (fig. 10) and relatively stable inter-gravel temperatures (figs. 5, 8, 9). Chum and pink salmon (O. gorbuscha) in arctic and subarctic regions need initial temperatures about 4.0 °C for successful early embryonic development (Bailey and Evans, 1971; Raymond, 1981). Additionally, Beacham and others (1988) determined that Yukon River chum salmon reach an optimum alevin and fry size at incubation temperatures around 4.0 °C. Egg-to-alevin development is temperature dependent (Murray and Beacham, 1986; Crisp, 1988, 1990) and the warmer inter-gravel water temperatures in fall chum spawning sites may be important in controlling the timing of their emergence and the onset of feeding to maximize prey availability overlap (Cushing, 1990; Gotceitas and others, 1996). However, inter-gravel temperatures near 2.0 °C may approach the lower temperature threshold for chum salmon, at which point embryo/alevin abnormalities and mortality increase (Bailey and Evans, 1971; Raymond, 1981; Wangaard and Burger, 1983).
16

Thermal conditions varied among sites on the mainstem Tanana River (fig. 11). In a study on the effect of varying temperature on the incubation of chum salmon eggs from the Susitna River in Alaska, Waangard and Burger (1983) determined that chum salmon eggs required about 210 days and about 800 ATU from fertilization to complete yolk absorption at a constant incubation temperature of 4 °C. In the 152 days we recorded inter-gravel temperatures, ATU ranged from 486 to 842, indicating that a chum salmon spawning around early November 2008 would have more than the required ATU for emergence by early April 2009. The positive correlation with vertical hydraulic gradient and ATU (fig. 12) indicates that habitats with stronger rates of upwelling had generally warmer inter-gravel temperatures, and would provide enough ATU to allow fry to emerge in the fewest days post-fertilization.
The temperature anomaly recorded at site 9 during late January (fig. 9) is evidence that inter-gravel water is subject to fluctuations less than the thermal threshold for incubating eggs and alevins. The inter-gravel water at this site froze to a depth of at least 35 cm, which is below the average egg-pocket depth for chum salmon (Montgomery and others, 1996; DeVries, 1997). This may have been caused by extreme cold air temperatures freezing or blocking the surface water source resulting in arrested subsurface flows and subsequent freezing of inter-gravel water at the monitoring site (Mathew Schellekens, U.S. Geological Survey, personal commun.; fig. 7). This event further suggests that the upwelling source has a short subsurface path. Sources of upwelling vary in stability and associated inter-gravel temperature is dependent on the duration of time the water source has remained subsurface (Durst, 2001). Inter-gravel temperatures of 3.0 to 5.0 °C typically are associated with older sources of groundwater and often provide a more stable upwelling habitat on the mainstem Tanana River; colder temperatures typically are associated with groundwater of a shorter subsurface residence (Durst, 2001). There may be a survival trade-off between redd locations selected in habitats with groundwater upwelling from a short subsurface residence as opposed to older groundwater sources. Research on the Tanana River by Durst (2001) indicates that groundwater with a short subsurface residence is higher in dissolved oxygen than older groundwater. Multiple studies on spawning habitat selection indicate that dissolved oxygen concentration is an important factor influencing survival of eggs to fry (Wickett, 1954; Silver and others, 1963; Maclean, 2003).
During mid-January 2009, air temperatures along the Tanana River warmed enough to cause ice and snow melt (fig. 7); warming events like this may increase the rate of stream discharge and the potential for scour of egg pockets and sedimentation of redd surfaces (Lisle, 1989). In contrast, Lisle (1989) studied scour in habitats where flooding during winter months was common; on the Tanana River, scour is not likely because the sediment size of the surface layer is governed by flow forces during peak river flows, and winter flows are not likely to match summer levels. Deposition of fines, however, is a greater possibility. Redds at some of our spawning locations were covered by fine sand and silt in excess of 30 cm deep (fig. 6). These fines may act as a barrier to water flow and emerging fry and may have inhibited transport of dissolved oxygen to incubating embryos and alevins in areas with a low vertical hydraulic gradient.
17

Summary Observations of fall chum salmon spawning were at locations on the mainstem Tanana River at
upwelling areas with relatively stable inter-gravel temperatures, which provided the needed ATU for incubation and emergence. Within available upwelling habitats, there is likely a trade-off between stable environments with suboptimal physiochemical characteristics and less stable environments with optimum physiochemical characteristics. Salmon spawning in less stable environments may be subject to higher rates of egg and alevin mortality during years with extreme temperature anomalies. It is not known if Tanana River chum salmon are seeking optimum habitats, or if they are simply seeking acceptable ones. Upwelling habitats are used by fall chum salmon in the mainstem Tanana River and these locations are characterized by thermal profiles that provide adequate ATU for incubation and emergence.
Acknowledgments This project was funded by the Arctic-Yukon-Kuskowkim Sustainable Salmon Initiative, Alaska
Department of Fish and Game, Tanana Chiefs Conference, and the U.S. Geological Survey. We thank Richard Dricoll, Bonnie Borba, and staff with the Alaska Department of Fish and Game Fairbanks office for their help with logistics, locating spawning sites, and help in the field. In addition, we thank U.S. Geological Survey employees Vanessa von Biela, for her help with field work, and Matthew Schellekens and Jason Baker for help with equipment storage and local knowledge. Field transportation was efficient and safe thanks to Troy Cambier of Chena River Aviation. Timothy Brabets, Jason Mouw, Bonnie Borba, and Karen Oakley provided helpful comments on drafts of this report.
References Cited Bailey, J.E., and Evans, D.E., 1971, The low-temperature threshold for pink salmon eggs in relation to a
proposed hydroelectric installation: Fishery Bulletin, v. 69, p. 587-593. Barton, L.H, 1992, Tanana River, Alaska, fall chum salmon radiotelemetry study: Juneau, Alaska
Department of Fish and Game, Division of Commercial Fisheries, Fisheries Research Bulletin No. 92-01.
Baxter, C.V., Hauer, F.R., and Woessner, W.W., 2003, Measuring groundwater-streamwater exchange: new techniques for installing minipiezometers and estimating hydraulic conductivity: Transactions of the American Fisheries Society, v. 132, p. 493-502.
Beacham, T.D., Murray, C.B., and Withler, R.E., 1988, Age, morphology, developmental biology, and biochemical genetic variation of Yukon River fall chum salmon, Oncorhynchus keta, and comparisons with British Columbia populations: Fishery Bulletin, v. 86, p. 663-674.
Bruya, K.J., 1981, The use of different gravel depths to enhance the spawning of chum salmon, Oncorhynchus keta: Master’s thesis, University of Washington, 86 p.
Busher, W.H. and Hamazaki, T., 2005, Subsistence and personal use salmon harvests in the Alaska portion of the Yukon River drainage, 2003: Anchorage, Alaska Department of Fish and Game, Regional Information Report 3A04-33, 121 p.
Chapman, D.W., 1988, Critical review of variables used to define effects of fins in redds of large salmonids: Transactions of the American Fisheries Society, v. 117, p. 1-21.
Cleary, P.M. and Hamazaki, T., 2005, Fall chum salmon mark-recapture abundance estimation on the Tanana and Kantishna Rivers, 2004: Anchorage, Alaska Department of Fish and Game, Fisheries Data Series No. 05-76.
18
Crisp, D.T., 1988, Prediction, from temperature, of eyeing, hatching and ‘swim-up’ times for salmonid embryos: Freshwater Biology, v. 19, p. 41-48.
Crisp, D.T., 1990, Water temperature in a stream gravel bed and implications for salmonid incubation: Freshwater Biology, v. 23, p. 601-612.
Cushing, D.H., 1990, Plankton production and year-class strength in fish populations: an update of the match/mismatch hypothesis: Advancements in Marine Biology, v. 26, p. 249-293.
DeVries, P., 1997, Riverine salmonid egg burial depths—review of published data and implications for scour studies: Canadian Journal of Fisheries and Aquatic Sciences, v. 54, p. 1685-1698.
Durst, J.D., 2001, Fish habitats and use in the Tanana River floodplain near Big Delta, Alaska, 1999–2000: Alaska Department of Fish and Game, Habitat and Restoration Division, Juneau, Technical Report No. 01-05.
Eiler, J.H., Nelson, B.D., and Bradshaw, R. F., 1992, Riverine spawning by sockeye salmon in the Taku River, Alaska and British Columbia: Transactions of the American Fisheries Society, v. 121, p. 701-708.
Eiler, J.H., Nelson, B.D., Bradshaw, R.F., Greiner, J.R., and Lorenz J.M., 1988, Distribution, stock composition, and location and habitat type of spawning areas used by sockeye salmon on the Taku River: U.S. Department of Commerce, National Marine Fisheries Service, Northwest and Alaska Fisheries Center Processed Report 88-24.
Geist, D.R., Hanrahan, T.P., Arntzen, E.V., McMichael, G.A., Murray, C.J., and Chien, Yi-Ju, 2002, Physiochemical characteristics of the hyporheic zone affect redd site selection by chum salmon and fall Chinook salmon in the Columbia River: North American Journal of Fisheries Management, v. 22, p. 1077-1085.
Gotceitas, V., Puvanendran, V., Leader, L.L., and Brown J.A., 1996, An experimental investigation of the ‘match/mismatch’ hypothesis using larval Atlantic cod: Marine Ecology Progress Series, v. 130, p. 29-37.
Kogl, D.R., 1965, Springs and ground-water as factors affecting survival of chum salmon spawn in a sub-arctic stream: University of Alaska Fairbanks, Masters thesis, 59 p.
Kondolf, G.M., 2000, Assessing salmonid spawning gravel quality: Transactions of the American Fisheries Society, v. 129 p. 262-281.
Leman, V.N., 1993, Spawning sites of chum salmon, Oncorhynchus keta—Microhydrological regime and viability of progeny in redds (Kamchatka River basin): Journal of Ichthyology, v. 33, p. 104-117.
Lisle, T.E., 1989, Sediment transport and resulting deposition in spawning gravels, north coastal California: Water Resources Research, v. 25, p. 1303-1319.
Maclean, S.H., 2003, Influences of hydrological processes on the spatial and temporal variation in spawning habitat quality for two chum salmon stocks in interior Alaska: Masters thesis, University of Alaska Fairbanks, 93 p.
Montgomery, D.R., Buffington, J.M., Peterson, N.P., Schuett-Hames, D., and Quinn, T. P., 1996, Stream-bed scour, egg burial depths, and the influence of salmonid spawning on bed surface mobility and embryo survival: Canadian Journal of Fisheries and Aquatic Sciences, v. 53, p. 1061-1070.
Murray, C.B., and Beacham, T.D., 1986, The development of Chinook (Oncorhynchus tshawytscha) and chum salmon (Oncorhynchus keta) embryos and alevins under varying temperature regimes: Canadian Journal of Zoology, v. 65, p. 2672-2681.
Peterson, N.P., and Quinn, T.P., 1996, Spatial and temporal variation in dissolved oxygen in natural egg pockets of chum salmon, Oncorhynchus keta (Walbaum), in Kennedy Creek, Washington: Journal of Fish Biology, v. 48, p. 131-143.
19

20
Raymond, J.A., 1981, Incubation of fall chum salmon Oncorhynchus keta (Walbaum) at Clear Air Force Station, Alaska: Alaska Department of Fish and Game, Information Leaflet No. 189.
Silver, S.J., Warren, C.E., and Doudoroff, P., 1963, Influence of oxygen concentration and water movement on the growth of steelhead trout and coho salmon embryos: Transactions of the American Fisheries Society, v. 93, p. 342-356.
Wangaard, D.B., and Burger, C.V., 1983, Effects of various water temperature regimes on the egg and alevin incubation of Susitna River chum and Sockeye salmon: Anchorage, Alaska, U.S. Fish and Wildlife Service, National Fisheries Research Center.
Wickett, W.P., 1954, The oxygen supply to salmon in spawning beds: Journal of the Fisheries Research Board of Canada, v. 11, p. 933-953.
Wood, C.C., Riddel, B.E., and Rutherford, D.T., 1987, Alternative juvenile life histories of sockeye salmon (Oncorhynchus nerka) and their contribution to production in the Stikine River, northern British Columbia: Canadian Special Publication of Fisheries and Aquatic Science, v. 96, p. 12-24.