characteristics-based market adjustment for 2010
TRANSCRIPT

Executive Summary Report Characteristics-Based Market Adjustment for 2010 Assessment Roll
Area Name / Number: Capitol Hill / Area 13
Previous Physical Inspection: 2005
Improved Sales: Number of Sales: 223
Range of Sale Dates: 1/1/2008 - 1/1/2010
Sales – Average Improved Valuation Change Summary
Land Imps Total Sale Price** Ratio COV*
2009 Value $386,400 $367,100 $753,500
2010 Value $386,400 $367,000 $753,400 $820,700 91.8% 15.82%
Change $0 -$100 -$100
% Change 0.0% 0.0% 0.0%
*COV is a measure of uniformity; the lower the number the better the uniformity.
** Sales time adjusted to 1/1/10.
Sales used in this analysis: All sales of one to three unit residences on residential lots, short sales, financial
institution re-sales and foreclosure sales which were verified as, or appeared to be market sales were
considered for the analysis. Sales were time adjusted to 1/1/10. Individual sales that were excluded are listed
later in this report. Multi-parcel sales, multi-building sales, mobile home sales, and sales of new construction
where less than a 100% complete house was assessed for 2009 or any existing residence where the data for
2009 is significantly different from the data for 2010 due to remodeling were also excluded. In addition, the
summary above excludes sales of parcels that had improvement value of $25,000 or less posted for the 2009
Assessment Roll. This also excludes previously vacant and destroyed property partial value accounts.
Population - Improved Parcel Summary:
Land Imps Total
2009 Value $404,900 $367,200 $772,100
2010 Value $404,900 $367,200 $772,100
Percent Change 0.0% 0.0% 0.0%
Number of one to three unit residences in the Population: 4132
Summary of Findings: The analysis for this area consisted of a general review of applicable characteristics such
as grade, age, condition, stories, living area, views, waterfront, lot size, land problems and neighborhoods. The
analysis results showed that no further adjustment was necessary.
Exceptions may be found in the Improved Parcel Update section.
We recommend posting these values for the 2010 assessment roll.

Area 13 (Capitol Hill) 2010
2
Market Change of Average Sale Price in Area 13
From 1/1/08 to 1/1/10
$800,000
$850,000
$900,000
$950,000
$1,000,000
01
/01
/20
08
12
/31
/20
08
01
/01
/20
10
Market Change of Average Sales Price
from 1/1/2008 to 1/1/2010
Sale Date

Area 13 (Capitol Hill) 2010
3
Sales Sample Representation of Population - Year Built / Renovated
Sales Sample Population
Year Built/Ren Frequency % Sales Sample Year Built/Ren Frequency % Population
1910 54 24.22% 1910 1025 24.81%
1920 24 10.76% 1920 616 14.91%
1930 67 30.04% 1930 1237 29.94%
1940 6 2.69% 1940 167 4.04%
1950 3 1.35% 1950 129 3.12%
1960 5 2.24% 1960 107 2.59%
1970 7 3.14% 1970 73 1.77%
1980 4 1.79% 1980 106 2.57%
1990 11 4.93% 1990 210 5.08%
2000 12 5.38% 2000 190 4.60%
2009 30 13.45% 2009 272 6.58%
223 4132
0.00%
5.00%
10.00%
15.00%
20.00%
25.00%
30.00%
35.00%
1910 1920 1930 1940 1950 1960 1970 1980 1990 2000 2009
Year Built/Ren
% Sales Sample
% Population
Sales of new homes built over the last few years are over represented in this sample. This is a common
occurrence due to the fact that most new homes will sell shortly after completion. This over
representation was accounted for in the model building process.

Area 13 (Capitol Hill) 2010
4
Sales Sample Representation of Population - Above Grade Living Area
Sales Sample Population
AGLA Frequency % Sales Sample AGLA Frequency % Population
500 0 0.00% 500 2 0.05%
1000 17 7.62% 1000 218 5.28%
1500 45 20.18% 1500 850 20.57%
2000 74 33.18% 2000 1267 30.66%
3000 70 31.39% 3000 1332 32.24%
4000 12 5.38% 4000 326 7.89%
5000 2 0.90% 5000 77 1.86%
6000 1 0.45% 6000 26 0.63%
7000 1 0.45% 7000 20 0.48%
8000 1 0.45% 8000 8 0.19%
10000 0 0.00% 10000 4 0.10%
16000 0 0.00% 16000 2 0.05%
223 4132
0.00%
5.00%
10.00%
15.00%
20.00%
25.00%
30.00%
35.00%
500 1000 1500 2000 3000 4000 5000 6000 7000 8000 10000 16000
Above Grade Living Area
% Sales Sample
% Population
The sales sample frequency distribution follows the population distribution very closely with regard to
Above Grade Living Area. This distribution is ideal for both accurate analysis and appraisals.

Area 13 (Capitol Hill) 2010
5
Sales Sample Representation of Population - Grade
Sales Sample Population
Grade Frequency % Sales Sample Grade Frequency % Population
1 0 0.00% 1 0 0.00%
2 0 0.00% 2 0 0.00%
3 0 0.00% 3 0 0.00%
4 0 0.00% 4 0 0.00%
5 0 0.00% 5 2 0.05%
6 3 1.35% 6 63 1.52%
7 38 17.04% 7 772 18.68%
8 89 39.91% 8 1594 38.58%
9 61 27.35% 9 1033 25.00%
10 21 9.42% 10 447 10.82%
11 6 2.69% 11 154 3.73%
12 5 2.24% 12 46 1.11%
13 0 0.00% 13 21 0.51%
223 4132
0.00%
5.00%
10.00%
15.00%
20.00%
25.00%
30.00%
35.00%
40.00%
45.00%
1 2 3 4 5 6 7 8 9 10 11 12 13
Grade
% Sales Sample
% Population
The sales sample frequency distribution follows the population distribution very closely with regard to
Building Grade. This distribution is ideal for both accurate analysis and appraisals.

Area 13 (Capitol Hill) 2010
6

Area 13 (Capitol Hill) 2010
7
Annual Update Process Effective Date of Appraisal: January 1, 2010 Date of Appraisal Report: May 27, 2010 King County Revaluation Cycle King County’s revaluation plan as approved by the Washington State Department of Revenue is an annual revaluation cycle
with physical inspection of all properties at least once every six years. Physical inspection of properties meets the
requirements of RCW 84.41.041 and WAC 458-07-015. During the interval between each physical inspection, the annual
revaluation cycle requires the valuation of property be adjusted to current true and fair value based on appropriate statistical
data. Annually, approximately one-sixth of all residential properties are physically inspected and appraised with new land and
total property valuation models calibrated and specified using multiple regression analysis. These appraised values are the
basis for the annual updating of the remaining five-sixths.
Data Utilized
Available sales closed from 1/1/2008 through 1/1/2010 were considered in this analysis. The sales and population data were
extracted from the King County Assessor’s residential database.
Sales Screening for Improved Parcel Analysis
Improved residential sales removal occurred for parcels meeting the following criteria:
1. Vacant parcels
2. Mobile home parcels
3. Multi-parcel or multi-building sales
4. New construction where less than a 100% complete house was assessed for 2009
5. Existing residences where the data for 2009 is significantly different than the data for 2010 due to remodeling
6. Parcels with improvements value, but no building characteristics
7. Short sales, financial institution re-sales and foreclosure sales verified or appearing to be not at market
8. Others as identified in the sales deleted list
See the attached Improved Sales Used in this Annual Update Analysis and Improved Sales Removed from this Annual Update
Analysis at the end of this report for more detailed information.

Area 13 (Capitol Hill) 2010
8
Land Update
Analysis indicates land values are at or below current market levels as of 1/1/10. No additional adjustment to land value is
required.
2010 Land Value = 2009 Land Value x 1.0, with the result rounded down to the next $1,000.
Improved Parcel Update
The analysis for this area consisted of a general review of applicable characteristics such as grade, age, condition, stories,
living area, views, waterfront, lot size, land problems and neighborhoods. The analysis results showed that no further
adjustment was necessary.
With the exception of real property mobile home parcels & parcels with “accessory only” improvements, the total assessed
values on all improved parcels were based on the analysis of the 223 useable residential sales in the area.
Sales used in the valuation model were time adjusted to January 1, 2010. The chosen adjustment model was developed using
multiple regression. The 2009 assessment ratio (Assessed Value divided by Sale Price) was the dependent variable.
The derived adjustment formula is:
2010 Total Value = 2009 Total Value / 0.9249736 x .925*
The resulting total value is rounded down to the next $1,000, then:
2010 Improvements Value = 2010 Total Value minus 2010 Land Value
An explanatory adjustment table is included in this report.
* See Assessor’s instructions page 31.

Area 13 (Capitol Hill) 2010
9
Improved Parcel Update (continued)
Exceptions:
*If multiple houses exist on a parcel, the Total % Change indicated by the sales sample is used to arrive at new total
value (2009 Land Value + Previous Improvement Value) *1.0
*If a house and mobile home exist, the formula derived from the house is used to arrive at new total value.
*If “accessory improvements only”, the Total % Change as indicated by the sales sample is used to arrive at a new
total value. (2009 Land Value + Previous Improvement Value) *1.0
*If land value =< $1,000 no adjustment is applied.
*If improvements and accessories =< $1,000 no further adjustment applied.
* If adjusted land value falls < $1,000, then land value = $1,000 or previous, whichever is less.
* If adjusted improvement value falls < $1,000, then improvement value = $1,000 or previous, whichever is less.
*If vacant parcels (no improvement value) only the land adjustment applies.
*If a parcel is coded “non-perc” (sewer system=3), the land adjustment is applied.
*If a parcel is coded sewer system public restricted, or water district private restricted, or water district public
restricted, the land adjustment is applied.
*If an improvement is coded “% net condition” or is in “poor” condition, then the model adjustment is applied.
*Any properties excluded from the annual up-date process are noted in RealProperty.
Mobile Home Update
There were no mobile homes in this area.
Model Validation
The resulting assessment level is 91.8%. The standard statistical measures of valuation performance are all within the
IAAO recommended range of .90 to 1.10 and are presented both in the Executive Summary and in the Annual Update
Ratio Study Report (Before) and (After) included in this report.
Application of these recommended values for the 2010 assessment year (taxes payable in 2011) results in an average total
change from the 2009 assessments of 0%. This no change is due partly to market changes over time and the previous
assessment levels.
Note: Additional information may reside in the Assessor’s Real Property Database, Assessor’s procedures, Assessor’s
“field” maps, Revalue Plan, separate studies, and statutes
Ratio studies of assessments before and after this annual update are included later in this report.

Area 13 (Capitol Hill) 2010
10
Standard Area Adjustment
0.00%
Area 13 Annual Update Model Adjustments
2010 Total Value = 2009 Total Value + Overall +/- Characteristic Adjustments as Apply Below
Due to rounding of the coefficient values used to develop the percentages and further rounding of the
percentages in this table, the results you will obtain are an approximation of adjustment achieved in production,
which include an additional adjustment of 0.925.
Comments:
No adjustement required.

Area 13 (Capitol Hill) 2010
11
Area Sale Price changes (Relative to 1/1/2010 valuation date.)
In a changing market, recognition of a sales trend is required to accurately estimate value as of a certain date. Assessed
values are determined as of January 1 of a given year.
Market Adjustment to 1/1/2010
Sale Date
Downward Adjustment
(Factor) Equivalent Percent
1/1/2008 0.843 -15.7%
2/1/2008 0.849 -15.1%
3/1/2008 0.856 -14.4%
4/1/2008 0.862 -13.8%
5/1/2008 0.869 -13.1%
6/1/2008 0.875 -12.5%
7/1/2008 0.882 -11.8%
8/1/2008 0.889 -11.1%
9/1/2008 0.895 -10.5%
10/1/2008 0.902 -9.8%
11/1/2008 0.908 -9.2%
12/1/2008 0.915 -8.5%
1/1/2009 0.921 -7.9%
2/1/2009 0.928 -7.2%
3/1/2009 0.934 -6.6%
4/1/2009 0.941 -5.9%
5/1/2009 0.947 -5.3%
6/1/2009 0.954 -4.6%
7/1/2009 0.960 -4.0%
8/1/2009 0.967 -3.3%
9/1/2009 0.974 -2.6%
10/1/2009 0.980 -2.0%
11/1/2009 0.987 -1.3%
12/1/2009 0.993 -0.7%
1/1/2010 1.000 0.0%
The chart above shows the % adjustment required for sales to be representative of the assessment date of 1/1/10.
* The adjusted sale price has been rounded to the nearest $1000.
The time adjustment formula for Area 13 is (0.9249736 +0.0001990989 * Saleday)/0.9249736
SaleDay = SaleDate - 40179
Example:
Sales Price Sales Date
Adjustment
factor Adjusted Sales price*
Sale 1 $525,000 4/1/2008 0.862 $453,000
Sale 2 $475,000 10/1/2009 0.980 $466,000
Sale 3 $515,000 7/1/2009 0.960 $495,000

Area 13 (Capitol Hill) 2010
12
Annual Update Ratio Study Report (Before)
2009 Assessments
District/Team: Appr. Date: Date of Report: Sales Dates:
WC /Team 1
Area Appr ID: Property Type: Adjusted for time?:
Capitol Hill /13
SAMPLE STATISTICS
Sample size (n) 223
Mean Assessed Value 753,500
Mean Adj. Sales Price 820,700
Standard Deviation AV 462,768
Standard Deviation SP 495,719
ASSESSMENT LEVEL
Arithmetic Mean Ratio 0.925
Median Ratio 0.936
Weighted Mean Ratio 0.918
UNIFORMITY
Lowest ratio 0.607
Highest ratio: 1.328
Coefficient of Dispersion 12.43%
Standard Deviation 0.146
Coefficient of Variation 15.82%
Price Related Differential (PRD) 1.007
RELIABILITY COMMENTS:
95% Confidence: Median
Lower limit 0.906
Upper limit 0.954
95% Confidence: Mean
Lower limit 0.906
Upper limit 0.944
SAMPLE SIZE EVALUATION
N (population size) 4132
B (acceptable error - in decimal) 0.05
S (estimated from this sample) 0.146
Recommended minimum: 34
Actual sample size: 223
Conclusion: OK
NORMALITY
Binomial Test
# ratios below mean: 106
# ratios above mean: 117
z: 0.737
Conclusion: Normal*
*i.e. no evidence of non-normality
01/01/2009 05/27/2010 1/2008 - 12/2009
RPAN 1 to 3 Unit Residences YES
Ratio Frequency
0 0 0 0 0
17
29
47
36
19
5
1 0 0 0
69
0
10
20
30
40
50
60
70
80
0.200.30
0.400.50
0.600.70
0.800.90
1.001.10
1.201.30
1.401.50
1.60
Ratio
Fre
qu
en
cy
1 to 3 Unit Residences throughout area 13
Sales Prices are adjusted for time to the Assessment
Date of 1/1/2010

Area 13 (Capitol Hill) 2010
13
Annual Update Ratio Study Report (After)
2010 Assessments
District/Team: Appr. Date: Date of Report: Sales Dates:
WC /Team 1
Area Appr ID: Property Type: Adjusted for time?:
Capitol Hill /13
SAMPLE STATISTICS
Sample size (n) 223
Mean Assessed Value 753,400
Mean Sales Price 820,700
Standard Deviation AV 462,771
Standard Deviation SP 495,719
ASSESSMENT LEVEL
Arithmetic Mean Ratio 0.925
Median Ratio 0.936
Weighted Mean Ratio 0.918
UNIFORMITY
Lowest ratio 0.607
Highest ratio: 1.328
Coefficient of Dispersion 12.43%
Standard Deviation 0.146
Coefficient of Variation 15.82%
Price Related Differential (PRD) 1.008
RELIABILITY COMMENTS:
95% Confidence: Median
Lower limit 0.906
Upper limit 0.954
95% Confidence: Mean
Lower limit 0.906
Upper limit 0.944
SAMPLE SIZE EVALUATION
N (population size) 4132
B (acceptable error - in decimal) 0.05
S (estimated from this sample) 0.146
Recommended minimum: 34
Actual sample size: 223
Conclusion: OK
NORMALITY
Binomial Test
# ratios below mean: 106
# ratios above mean: 117
z: 0.737
Conclusion: Normal*
*i.e. no evidence of non-normality
01/01/2010 05/27/2010 1/2008 - 12/2009
RPAN 1 to 3 Unit Residences YES
Ratio Frequency
0 0 0 0 0
17
29
47
36
19
5
1 0 0 0
69
0
10
20
30
40
50
60
70
80
0.200.30
0.400.50
0.600.70
0.800.90
1.001.10
1.201.30
1.401.50
1.60
Ratio
Fre
qu
en
cy
1 to 3 Unit Residences throughout area 13.
Assessment level and uniformity have not changed
from the previous year.
Sales Prices are adjusted for time to the
Assessement Date of 1/1/2010

Area 13 (Capitol Hill) 2010
14
Glossary for Improved Sales Condition: Relative to Age and Grade
1= Poor Many repairs needed. Showing serious deterioration
2= Fair Some repairs needed immediately. Much deferred maintenance.
3= Average Depending upon age of improvement; normal amount of upkeep for the age
of the home.
4= Good Condition above the norm for the age of the home. Indicates extra attention
and care has been taken to maintain
5= Very Good Excellent maintenance and updating on home. Not a total renovation.
Residential Building Grades
Grades 1 - 3 Falls short of minimum building standards. Normally cabin or inferior structure.
Grade 4 Generally older low quality construction. Does not meet code.
Grade 5 Lower construction costs and workmanship. Small, simple design.
Grade 6 Lowest grade currently meeting building codes. Low quality materials, simple
designs.
Grade 7 Average grade of construction and design. Commonly seen in plats and older
subdivisions.
Grade 8 Just above average in construction and design. Usually better materials in both
the exterior and interior finishes.
Grade 9 Better architectural design, with extra exterior and interior design and quality.
Grade 10 Homes of this quality generally have high quality features. Finish work is better,
and more design quality is seen in the floor plans and larger square footage.
Grade 11 Custom design and higher quality finish work, with added amenities of solid
woods, bathroom fixtures and more luxurious options.
Grade 12 Custom design and excellent builders. All materials are of the highest quality
and all conveniences are present.
Grade 13 Generally custom designed and built. Approaching the Mansion level. Large
amount of highest quality cabinet work, wood trim and marble; large entries.
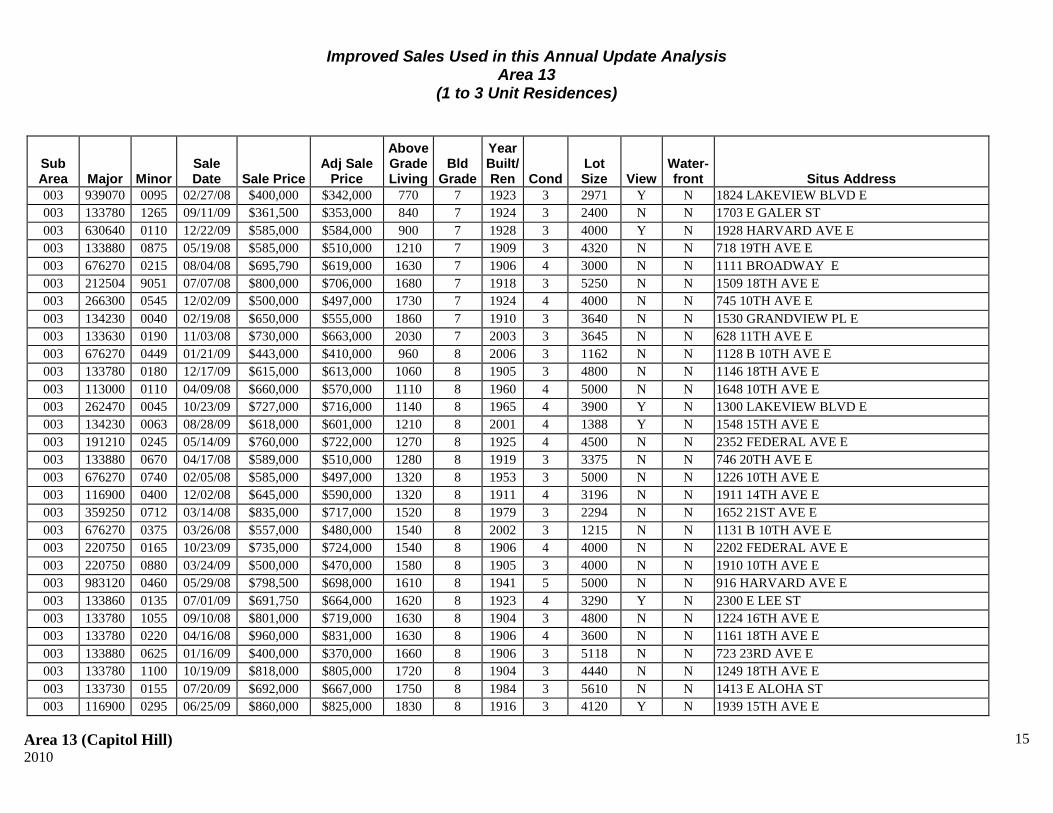
Improved Sales Used in this Annual Update Analysis Area 13
(1 to 3 Unit Residences)
Area 13 (Capitol Hill) 2010
15
Sub Area Major Minor
Sale Date Sale Price
Adj Sale Price
Above Grade Living
Bld Grade
Year Built/Ren Cond
Lot Size View
Water- front Situs Address
003 939070 0095 02/27/08 $400,000 $342,000 770 7 1923 3 2971 Y N 1824 LAKEVIEW BLVD E
003 133780 1265 09/11/09 $361,500 $353,000 840 7 1924 3 2400 N N 1703 E GALER ST
003 630640 0110 12/22/09 $585,000 $584,000 900 7 1928 3 4000 Y N 1928 HARVARD AVE E
003 133880 0875 05/19/08 $585,000 $510,000 1210 7 1909 3 4320 N N 718 19TH AVE E
003 676270 0215 08/04/08 $695,790 $619,000 1630 7 1906 4 3000 N N 1111 BROADWAY E
003 212504 9051 07/07/08 $800,000 $706,000 1680 7 1918 3 5250 N N 1509 18TH AVE E
003 266300 0545 12/02/09 $500,000 $497,000 1730 7 1924 4 4000 N N 745 10TH AVE E
003 134230 0040 02/19/08 $650,000 $555,000 1860 7 1910 3 3640 N N 1530 GRANDVIEW PL E
003 133630 0190 11/03/08 $730,000 $663,000 2030 7 2003 3 3645 N N 628 11TH AVE E
003 676270 0449 01/21/09 $443,000 $410,000 960 8 2006 3 1162 N N 1128 B 10TH AVE E
003 133780 0180 12/17/09 $615,000 $613,000 1060 8 1905 3 4800 N N 1146 18TH AVE E
003 113000 0110 04/09/08 $660,000 $570,000 1110 8 1960 4 5000 N N 1648 10TH AVE E
003 262470 0045 10/23/09 $727,000 $716,000 1140 8 1965 4 3900 Y N 1300 LAKEVIEW BLVD E
003 134230 0063 08/28/09 $618,000 $601,000 1210 8 2001 4 1388 Y N 1548 15TH AVE E
003 191210 0245 05/14/09 $760,000 $722,000 1270 8 1925 4 4500 N N 2352 FEDERAL AVE E
003 133880 0670 04/17/08 $589,000 $510,000 1280 8 1919 3 3375 N N 746 20TH AVE E
003 676270 0740 02/05/08 $585,000 $497,000 1320 8 1953 3 5000 N N 1226 10TH AVE E
003 116900 0400 12/02/08 $645,000 $590,000 1320 8 1911 4 3196 N N 1911 14TH AVE E
003 359250 0712 03/14/08 $835,000 $717,000 1520 8 1979 3 2294 N N 1652 21ST AVE E
003 676270 0375 03/26/08 $557,000 $480,000 1540 8 2002 3 1215 N N 1131 B 10TH AVE E
003 220750 0165 10/23/09 $735,000 $724,000 1540 8 1906 4 4000 N N 2202 FEDERAL AVE E
003 220750 0880 03/24/09 $500,000 $470,000 1580 8 1905 3 4000 N N 1910 10TH AVE E
003 983120 0460 05/29/08 $798,500 $698,000 1610 8 1941 5 5000 N N 916 HARVARD AVE E
003 133860 0135 07/01/09 $691,750 $664,000 1620 8 1923 4 3290 Y N 2300 E LEE ST
003 133780 1055 09/10/08 $801,000 $719,000 1630 8 1904 3 4800 N N 1224 16TH AVE E
003 133780 0220 04/16/08 $960,000 $831,000 1630 8 1906 4 3600 N N 1161 18TH AVE E
003 133880 0625 01/16/09 $400,000 $370,000 1660 8 1906 3 5118 N N 723 23RD AVE E
003 133780 1100 10/19/09 $818,000 $805,000 1720 8 1904 3 4440 N N 1249 18TH AVE E
003 133730 0155 07/20/09 $692,000 $667,000 1750 8 1984 3 5610 N N 1413 E ALOHA ST
003 116900 0295 06/25/09 $860,000 $825,000 1830 8 1916 3 4120 Y N 1939 15TH AVE E

Improved Sales Used in this Annual Update Analysis Area 13
(1 to 3 Unit Residences)
Area 13 (Capitol Hill) 2010
16
Sub Area Major Minor
Sale Date Sale Price
Adj Sale Price
Above Grade Living
Bld Grade
Year Built/Ren Cond
Lot Size View
Water- front Situs Address
003 867090 0135 02/24/09 $730,000 $681,000 1860 8 1919 5 3800 N N 1205 E BOSTON ST
003 133880 0310 02/07/08 $985,000 $838,000 1960 8 1926 5 3850 N N 2015 E PROSPECT ST
003 867090 0200 03/18/09 $650,000 $610,000 1990 8 1920 3 3900 Y N 1228 E CROCKETT ST
003 133880 0720 08/13/08 $783,000 $698,000 2000 8 1927 3 4600 N N 718 20TH AVE E
003 133930 0015 06/20/08 $775,000 $682,000 2030 8 1922 4 4337 N N 1210 19TH AVE E
003 212504 9053 01/26/09 $1,050,000 $973,000 2030 8 1916 3 4486 Y N 1527 E HOWE ST
003 133880 0935 09/24/08 $710,000 $639,000 2040 8 1906 3 4320 N N 719 20TH AVE E
003 134230 0160 11/23/09 $910,000 $902,000 2050 8 1905 4 4760 N N 1502 16TH AVE E
003 133860 0050 11/05/08 $965,000 $877,000 2060 8 1988 3 6258 Y N 1122 23RD AVE E
003 867090 0175 07/25/08 $915,000 $812,000 2080 8 1913 4 3800 N N 1311 E BOSTON ST
003 133880 0050 05/27/08 $789,000 $690,000 2160 8 1906 4 4320 N N 920 19TH AVE E
003 266300 0425 07/21/08 $620,000 $549,000 2190 8 2009 3 4000 N N 734 10TH AVE E
003 133780 0245 05/15/09 $1,260,000 $1,197,000 2270 8 1905 5 4800 N N 1139 18TH AVE E
003 133630 0195 01/09/08 $762,500 $644,000 2420 8 1906 4 5800 N N 634 11TH AVE E
003 133780 0725 08/13/08 $1,150,000 $1,025,000 2630 8 1907 3 4640 N N 1118 15TH AVE E
003 983120 0227 07/16/08 $550,000 $487,000 1120 9 2004 3 1439 Y N 747 B HARVARD AVE E
003 983120 0220 10/29/09 $645,000 $636,000 1280 9 2003 3 1438 N N 755 B HARVARD AVE E
003 983120 0235 08/11/09 $650,000 $630,000 1350 9 2008 3 1468 N N 737A HARVARD AVE E
003 133780 0975 07/23/09 $705,000 $680,000 1630 9 1905 3 4800 N N 1223 17TH AVE E
003 133860 0045 07/22/09 $725,000 $700,000 1720 9 1921 3 4381 Y N 1124 23RD AVE E
003 359250 0971 04/23/08 $799,950 $694,000 1740 9 1924 4 2944 N N 1623 21ST AVE E
003 674270 0300 06/29/09 $725,000 $696,000 1800 9 1932 4 4000 Y N 1980 HARVARD AVE E
003 133780 0060 12/09/09 $980,000 $975,000 1850 9 2000 3 4800 N N 1119 19TH AVE E
003 133680 1005 02/18/08 $1,200,000 $1,024,000 1890 9 1909 5 5400 N N 943 19TH AVE E
003 133680 1005 08/28/08 $1,171,000 $1,047,000 1890 9 1909 5 5400 N N 943 19TH AVE E
003 116900 0250 04/17/08 $1,300,000 $1,125,000 1940 9 1926 4 4223 Y N 1901 15TH AVE E
003 674270 0335 12/01/08 $805,000 $736,000 1980 9 1969 4 4000 Y N 2025 BROADWAY E
003 133780 0690 06/16/08 $970,000 $852,000 1990 9 1904 4 5220 N N 1508 E PROSPECT ST
003 133780 0390 12/11/09 $1,145,000 $1,140,000 2040 9 1904 4 4800 N N 1150 17TH AVE E
003 359250 0995 03/26/08 $888,000 $765,000 2060 9 1922 3 5035 N N 1645 21ST AVE E
003 133780 0655 07/22/08 $1,285,000 $1,139,000 2120 9 1987 3 4800 N N 1123 16TH AVE E

Improved Sales Used in this Annual Update Analysis Area 13
(1 to 3 Unit Residences)
Area 13 (Capitol Hill) 2010
17
Sub Area Major Minor
Sale Date Sale Price
Adj Sale Price
Above Grade Living
Bld Grade
Year Built/Ren Cond
Lot Size View
Water- front Situs Address
003 133880 0870 10/28/09 $770,000 $759,000 2150 9 1906 5 4320 N N 722 19TH AVE E
003 133830 0175 09/10/09 $1,310,000 $1,278,000 2150 9 1918 3 8640 Y N 1245 22ND AVE E
003 686170 0060 03/26/08 $929,940 $801,000 2280 9 1931 3 5000 N N 2216 13TH AVE E
003 359250 0825 11/13/08 $997,600 $909,000 2280 9 1911 4 6350 Y N 2206 E CRESCENT DR
003 133780 0995 06/23/09 $1,095,200 $1,050,000 2380 9 1904 5 4800 N N 1207 17TH AVE E
003 116900 0100 08/03/09 $1,240,000 $1,200,000 2380 9 1921 4 4680 Y N 1950 15TH AVE E
003 983120 0525 12/22/08 $920,000 $846,000 2390 9 1967 4 5000 N N 941 BROADWAY E
003 133680 0765 07/07/09 $921,500 $886,000 2420 9 1904 5 5760 N N 727 18TH AVE E
003 133330 0080 07/22/09 $1,100,000 $1,061,000 2430 9 1938 3 10020 Y N 1671 E BOSTON TER
003 133680 0490 08/10/09 $1,152,500 $1,117,000 2490 9 1906 5 6000 N N 927 17TH AVE E
003 133680 0185 09/09/08 $849,500 $762,000 2500 9 1905 4 5568 N N 716 15TH AVE E
003 133880 0975 10/12/09 $1,050,000 $1,032,000 2520 9 1907 5 5443 N N 751 20TH AVE E
003 191210 0005 12/08/09 $1,075,000 $1,069,000 2520 9 1924 4 3600 Y N 2357 11TH AVE E
003 133630 0090 09/08/09 $962,600 $939,000 2540 9 1928 4 6050 Y N 906 11TH AVE E
003 133680 0200 05/20/09 $750,000 $714,000 2580 9 1985 3 5760 N N 701 16TH AVE E
003 116900 0115 04/17/09 $1,100,000 $1,039,000 2620 9 1910 4 7020 Y N 1932 15TH AVE E
003 686170 0145 03/16/09 $1,300,000 $1,219,000 2670 9 1909 5 5000 N N 2222 12TH AVE E
003 191210 0345 08/10/09 $865,000 $838,000 2750 9 1996 3 6000 N N 1066 E MILLER ST
003 220750 0615 05/23/08 $1,192,000 $1,041,000 2800 9 1914 3 5950 N N 2115 12TH AVE E
003 133780 0840 03/17/09 $1,200,000 $1,125,000 2820 9 1906 5 4800 N N 1205 16TH AVE E
003 133680 0010 08/11/09 $925,000 $897,000 2910 9 1985 3 5800 N N 1024 15TH AVE E
003 133780 0785 06/09/09 $900,000 $860,000 3040 9 1906 4 4320 N N 1249 16TH AVE E
003 133680 0835 03/09/09 $1,400,000 $1,310,000 3340 9 1908 5 6000 N N 948 18TH AVE E
003 133680 0315 04/03/08 $1,350,000 $1,165,000 3470 9 1906 4 5760 N N 726 16TH AVE E
003 669950 0165 06/23/08 $1,825,000 $1,606,000 3630 9 1907 5 6400 N N 2320 BROADWAY E
003 220750 0855 05/27/08 $1,100,000 $962,000 1490 10 1999 3 4000 N N 1928 10TH AVE E
003 220750 0782 03/26/09 $750,000 $705,000 1910 10 1969 3 3920 N N 1064 E HOWE ST
003 359250 0675 09/25/08 $1,070,000 $963,000 2200 10 1925 5 3408 N N 1619 22ND AVE E
003 359250 0668 07/21/08 $1,025,000 $908,000 2280 10 1926 3 3792 N N 1615 22ND AVE E
003 212504 9135 02/11/08 $1,300,000 $1,107,000 2360 10 1932 3 7840 N N 1525 18TH AVE E
003 220750 0690 03/19/08 $1,685,000 $1,448,000 2410 10 2007 3 4760 N N 1930 11TH AVE E

Improved Sales Used in this Annual Update Analysis Area 13
(1 to 3 Unit Residences)
Area 13 (Capitol Hill) 2010
18
Sub Area Major Minor
Sale Date Sale Price
Adj Sale Price
Above Grade Living
Bld Grade
Year Built/Ren Cond
Lot Size View
Water- front Situs Address
003 220750 0435 01/27/09 $1,035,750 $960,000 2490 10 1907 3 4000 N N 2026 10TH AVE E
003 133730 0275 09/23/09 $975,000 $954,000 2510 10 1907 5 5664 N N 1007 15TH AVE E
003 133830 0055 03/19/08 $1,549,000 $1,331,000 2580 10 1996 3 4320 N N 1215 20TH AVE E
003 133880 0290 09/04/09 $1,445,000 $1,408,000 2780 10 1920 3 6900 N N 933 21ST AVE E
003 113000 0090 01/18/08 $2,100,000 $1,777,000 2960 10 1910 5 10300 N N 1643 FEDERAL AVE E
003 676270 0645 06/25/08 $2,170,000 $1,911,000 3040 10 1900 4 5700 N N 1236 FEDERAL AVE E
003 867090 0180 12/22/08 $955,000 $878,000 3060 10 1911 3 6270 Y N 1317 E BOSTON ST
003 339880 0035 05/15/08 $1,739,950 $1,517,000 3910 10 1911 4 12000 N N 1604 FEDERAL AVE E
003 674270 0120 09/18/09 $1,150,000 $1,124,000 2200 11 1989 3 3336 Y N 2234 HARVARD AVE E
003 686170 0085 04/09/08 $1,769,000 $1,528,000 2780 11 1911 4 5300 Y N 1215 E LYNN ST
003 134630 0004 03/04/08 $1,300,000 $1,113,000 2920 11 1978 4 6030 N N 1021 14TH AVE E
003 133680 0080 10/09/09 $1,650,000 $1,620,000 3220 11 2002 3 6200 N N 903 16TH AVE E
003 339880 0125 09/01/09 $2,750,000 $2,678,000 4570 11 2002 3 10545 N N 1515 FEDERAL AVE E
003 133680 0575 06/03/09 $1,836,000 $1,752,000 4820 11 1906 5 9199 N N 910 17TH AVE E
003 220750 0970 09/04/09 $2,375,000 $2,314,000 3600 12 1996 3 5138 Y N 1929 10TH AVE E
003 133830 0350 09/16/09 $2,300,000 $2,247,000 3850 12 1915 4 9108 N N 2105 E HIGHLAND DR
003 133830 0295 02/02/09 $4,100,000 $3,806,000 5630 12 2002 3 8640 N N 1121 22ND AVE E
003 133680 0455 08/18/09 $3,150,000 $3,058,000 6760 12 1906 3 12200 N N 904 16TH AVE E
003 113000 0025 05/05/09 $4,700,000 $4,456,000 7250 12 1909 5 32731 N N 1642 FEDERAL AVE E
004 501600 2300 10/13/08 $428,000 $387,000 580 6 1912 4 2500 Y N 441 26TH AVE E
004 501600 2045 07/27/09 $395,500 $382,000 700 6 1951 3 5000 N N 603 26TH AVE E
004 501500 1565 07/10/09 $645,000 $621,000 1240 6 1900 5 4000 N N 2504 E ROY ST
004 533220 0535 12/02/08 $595,000 $544,000 770 7 1977 3 4000 N N 2801 E ALOHA ST
004 501100 0190 08/11/08 $470,000 $419,000 840 7 1900 4 3465 N N 530 23RD AVE E
004 501500 0225 06/19/09 $538,750 $516,000 890 7 1905 4 4000 Y N 2411 E HELEN ST
004 533220 0575 09/09/09 $345,000 $337,000 1100 7 1906 4 5512 N N 2819 E VALLEY ST
004 501500 1040 11/20/08 $625,000 $570,000 1160 7 1963 3 4000 Y N 2425 E ALOHA ST
004 501600 1495 12/03/09 $500,000 $497,000 1230 7 1964 3 7500 N N 427 27TH AVE E
004 501600 2570 07/10/08 $435,000 $384,000 1420 7 1918 4 2500 N N 2317 E HARRISON ST
004 501500 1430 12/07/09 $620,000 $617,000 1420 7 1984 3 4000 N N 2712 E ROY ST
004 501600 1444 05/13/08 $450,000 $392,000 1760 7 2000 3 1354 N N 2618 E MADISON ST

Improved Sales Used in this Annual Update Analysis Area 13
(1 to 3 Unit Residences)
Area 13 (Capitol Hill) 2010
19
Sub Area Major Minor
Sale Date Sale Price
Adj Sale Price
Above Grade Living
Bld Grade
Year Built/Ren Cond
Lot Size View
Water- front Situs Address
004 501600 1446 07/30/08 $445,000 $395,000 1760 7 2000 3 1463 N N 2620 E MADISON ST
004 501500 0750 09/28/09 $425,000 $416,000 2320 7 2007 3 4000 Y N 2501 E WARD ST
004 501500 0750 12/01/09 $439,000 $436,000 2320 7 2007 3 4000 Y N 2501 E WARD ST
004 982870 2462 08/26/09 $415,000 $404,000 940 8 2009 3 1399 N N 228 A 24TH AVE E
004 982870 2461 10/07/09 $419,950 $412,000 1000 8 2009 3 1000 N N 226 A 24TH AVE E
004 501500 1560 12/11/08 $630,500 $578,000 1010 8 2008 3 4000 N N 2500 E ROY ST
004 533220 0510 09/04/08 $709,000 $635,000 1060 8 2007 3 5100 N N 815 29TH AVE E
004 501600 1065 12/16/09 $530,000 $528,000 1140 8 1988 3 2500 Y N 320 25TH AVE E
004 501500 0430 12/18/09 $450,000 $449,000 1160 8 1984 3 2800 N N 1001 26TH AVE E
004 501600 1340 10/14/09 $520,000 $511,000 1250 8 1988 3 2500 N N 402 26TH AVE E
004 501500 0945 08/19/09 $427,500 $415,000 1470 8 1906 3 3000 Y N 2311 E ALOHA ST
004 320430 0265 11/12/09 $720,000 $712,000 1580 8 2004 3 4920 Y N 1215 25TH AVE E
004 320430 0265 08/01/08 $925,000 $822,000 1580 8 2004 3 4920 Y N 1215 25TH AVE E
004 501600 3000 05/26/09 $600,700 $572,000 1600 8 1909 5 5000 N N 431 25TH AVE E
004 501600 1013 03/20/08 $542,500 $466,000 1609 8 1998 3 2011 N N 2530 E E MADISON ST
004 320430 0555 02/14/08 $690,000 $588,000 1610 8 1947 5 4000 Y N 1079 25TH AVE E
004 501500 1710 10/15/08 $750,000 $678,000 1700 8 1991 3 3400 N N 621 27TH AVE E
004 134430 0380 12/08/08 $430,000 $394,000 1800 8 1921 4 4200 N N 414 23RD AVE E
004 501600 1590 07/13/09 $580,000 $559,000 1890 8 1998 3 2500 Y N 444 26TH AVE E
004 501500 0168 01/13/09 $1,122,000 $1,037,000 2590 8 2008 3 4455 Y N 2468 E HELEN ST
004 501500 1695 04/18/08 $735,000 $636,000 910 9 2003 3 3500 Y N 2511 E ROY ST
004 501600 1050 06/04/08 $548,000 $480,000 1210 9 1994 3 2495 Y N 314 25TH AVE E
004 501500 1580 03/05/08 $800,000 $685,000 1250 9 1990 3 4000 Y N 2518 E ROY ST
004 501500 0450 04/28/08 $660,000 $573,000 1320 9 1979 3 4800 N N 2641 E HELEN ST
004 501600 1400 08/28/08 $560,000 $501,000 1670 9 2001 3 1294 N N 300 D 26TH AVE E
004 501600 2435 12/01/08 $1,250,000 $1,143,000 1960 9 2008 3 6400 Y N 315 25TH AVE E
004 533220 0610 05/08/08 $707,000 $615,000 2100 9 2000 3 4000 N N 2810 E ROY ST
004 501600 1095 05/23/08 $1,150,000 $1,004,000 2170 10 2008 3 5000 Y N 328 25TH AVE E
004 133880 1019 05/21/09 $950,000 $904,000 2790 10 2008 3 3850 N N 2303 E VALLEY ST
005 678820 0061 04/21/09 $520,000 $491,000 780 7 1923 3 2750 N N 2458 25TH AVE E
005 872210 0670 01/18/08 $500,000 $423,000 790 7 1927 3 3373 N N 2025 E HOWE ST

Improved Sales Used in this Annual Update Analysis Area 13
(1 to 3 Unit Residences)
Area 13 (Capitol Hill) 2010
20
Sub Area Major Minor
Sale Date Sale Price
Adj Sale Price
Above Grade Living
Bld Grade
Year Built/Ren Cond
Lot Size View
Water- front Situs Address
005 872210 0960 09/29/09 $500,000 $490,000 810 7 1928 4 2801 N N 2201 E BLAINE ST
005 872210 1025 07/22/09 $444,000 $428,000 990 7 1922 3 5089 N N 2247 E BLAINE ST
005 678820 1280 05/12/08 $520,000 $453,000 1070 7 1923 3 4000 N N 2532 E LYNN ST
005 678820 0745 12/08/09 $545,000 $542,000 1090 7 1922 4 4000 N N 2211 E CALHOUN ST
005 678820 0656 03/21/08 $615,500 $529,000 1110 7 1921 4 3800 N N 1912 E MCGRAW ST
005 678820 0620 08/03/09 $575,000 $556,000 1140 7 1924 4 3800 N N 1923 E CALHOUN ST
005 872210 0480 05/27/08 $525,000 $459,000 1300 7 1965 3 5773 N N 2021 E NEWTON ST
005 678820 0870 08/17/09 $605,000 $587,000 1390 7 1922 3 5000 N N 2415 E CALHOUN ST
005 195220 0365 09/09/08 $550,000 $493,000 1470 7 1951 3 12674 Y N 2403 BOYER AVE E
005 280410 0040 11/05/09 $571,000 $564,000 1600 7 1926 3 4000 N N 2220 E ROANOKE ST
005 872210 0025 09/11/09 $519,950 $507,000 1660 7 1921 3 4560 N N 2207 24TH AVE E
005 359250 0025 05/28/08 $742,100 $649,000 1710 7 1923 3 4800 N N 1730 26TH AVE E
005 678820 0781 07/29/08 $530,000 $471,000 1840 7 1924 4 4500 N N 2415 24TH AVE E
005 195970 3070 08/01/08 $550,000 $489,000 2160 7 1927 3 5500 Y N 3220 FUHRMAN AVE E
005 359250 0100 11/30/09 $700,000 $695,000 2350 7 1925 4 4578 N N 1727 26TH AVE E
005 372080 0051 05/04/09 $527,000 $500,000 960 8 1909 3 2900 Y N 1108 E EDGAR ST
005 195970 1975 07/09/08 $735,000 $649,000 1130 8 1923 4 4400 Y N 2817 BOYER AVE E
005 359300 0023 07/10/08 $699,950 $619,000 1178 8 1926 4 2994 N N 1603 BOYER AVE E
005 195220 0240 12/22/09 $900,000 $898,000 1270 8 1910 5 13241 Y N 2432 DELMAR DR E
005 872210 0915 07/24/09 $537,800 $519,000 1290 8 1925 4 3332 N N 2028 BOYER AVE E
005 196220 0460 09/17/08 $655,000 $589,000 1340 8 1922 4 6000 N N 867 E GWINN PL
005 678820 2245 07/10/08 $759,000 $671,000 1340 8 1927 5 4000 N N 1616 E MCGRAW ST
005 215890 0155 09/08/09 $570,000 $556,000 1360 8 1929 3 3440 N N 1956 20TH AVE E
005 880590 0950 08/10/09 $698,000 $676,000 1380 8 1925 3 4000 N N 2420 E MILLER ST
005 280460 0030 01/26/09 $775,500 $719,000 1500 8 1931 3 4132 N N 2512 E ROANOKE ST
005 872210 0590 06/26/09 $725,000 $696,000 1530 8 1925 4 4325 N N 1909 E LYNN ST
005 215890 0325 07/30/08 $895,000 $795,000 1550 8 1929 5 3520 N N 1955 20TH AVE E
005 678820 0530 05/26/09 $617,000 $588,000 1580 8 1930 4 4000 N N 1920 E CALHOUN ST
005 678820 1060 05/15/08 $732,000 $638,000 1600 8 1922 4 4000 N N 2518 E MCGRAW ST
005 880590 0895 05/28/09 $650,000 $619,000 1630 8 1925 4 5000 N N 2427 E LOUISA ST
005 678820 0340 04/10/09 $695,000 $655,000 1650 8 1925 4 4000 N N 2220 E CALHOUN ST

Improved Sales Used in this Annual Update Analysis Area 13
(1 to 3 Unit Residences)
Area 13 (Capitol Hill) 2010
21
Sub Area Major Minor
Sale Date Sale Price
Adj Sale Price
Above Grade Living
Bld Grade
Year Built/Ren Cond
Lot Size View
Water- front Situs Address
005 196220 0450 07/22/08 $650,000 $576,000 1670 8 1924 4 6000 N N 877 E GWINN PL
005 880590 0340 11/05/09 $542,000 $535,000 1740 8 1947 3 9020 N N 2564 W MONTLAKE PL E
005 872210 0815 04/28/08 $675,000 $586,000 1740 8 1926 4 3408 N N 1921 E BLAINE ST
005 871210 0145 02/19/08 $650,000 $555,000 1780 8 1911 4 5900 N N 2006 24TH AVE E
005 196220 0285 04/07/09 $590,000 $556,000 1830 8 1922 4 4545 Y N 3136 BROADWAY E
005 880590 0545 08/10/09 $694,000 $672,000 1860 8 1929 4 3200 N N 2509 20TH AVE E
005 195970 2990 01/02/08 $907,500 $765,000 1860 8 1928 5 5500 Y N 3106 FUHRMAN AVE E
005 872210 0440 06/22/09 $599,500 $575,000 1870 8 1912 3 4800 N N 1927 E LYNN ST
005 880590 0420 05/11/09 $760,000 $722,000 1890 8 1927 4 4500 N N 2026 E LOUISA ST
005 195970 2420 11/17/08 $580,000 $529,000 1900 8 1919 3 6000 N N 917 E ALLISON ST
005 872210 0310 11/24/08 $735,000 $671,000 1900 8 1926 4 2880 N N 2019 23RD AVE E
005 215890 0035 12/15/09 $730,000 $727,000 1950 8 1926 5 4000 N N 1957 BOYER AVE E
005 195970 0595 04/03/09 $725,530 $683,000 1960 8 1925 4 3500 Y N 2632 11TH AVE E
005 872210 0130 08/21/08 $765,000 $683,000 1980 8 1937 3 5803 Y N 2080 23RD AVE E
005 195220 0280 07/16/08 $860,500 $762,000 2030 8 1951 5 5675 Y N 1330 E INTERLAKEN BLVD
005 215890 0120 09/08/09 $730,000 $712,000 2100 8 1929 4 4320 N N 1904 21ST AVE E
005 872210 0482 11/25/09 $828,000 $821,000 2190 8 1915 5 5916 N N 2025 E NEWTON ST
005 871210 0245 05/19/09 $690,000 $656,000 2350 8 1911 4 4178 N N 2202 25TH AVE E
005 102800 0015 03/25/09 $630,000 $592,000 2450 8 1921 3 4626 N N 2109 BOYER AVE E
005 880590 0405 12/23/09 $1,112,450 $1,110,000 2580 8 1925 4 6000 N N 2008 E LOUISA ST
005 280410 0050 08/18/09 $700,000 $680,000 1290 9 1926 5 4000 N N 2404 E ROANOKE ST
005 215890 0145 09/24/08 $807,000 $726,000 1540 9 1928 4 3600 N N 2033 BOYER AVE E
005 678820 1990 10/28/09 $665,000 $656,000 1570 9 1930 4 4400 N N 1814 E LYNN ST
005 872210 0745 07/30/09 $755,000 $730,000 1580 9 1926 5 7252 N N 1950 E BLAINE ST
005 678820 2075 06/26/09 $705,000 $676,000 1730 9 1928 3 4500 N N 1621 E MCGRAW ST
005 196220 0485 07/31/09 $755,000 $730,000 1840 9 1923 5 5040 N N 843 E GWINN PL
005 196220 0047 03/27/08 $749,950 $646,000 1890 9 2005 3 2475 Y N 3138 FRANKLIN AVE E
005 195220 0480 12/28/09 $935,000 $934,000 1920 9 1929 4 6370 Y N 2330 14TH AVE E
005 196220 0065 01/07/08 $840,000 $709,000 2140 9 2007 3 2521 N N 3116 FRANKLIN AVE E
005 196220 0305 06/11/08 $925,000 $812,000 2160 9 1909 4 6000 Y N 812 E SHELBY ST
005 560500 0015 09/25/08 $1,650,000 $1,486,000 2380 9 1926 5 6050 Y N 1818 E SHELBY ST

Improved Sales Used in this Annual Update Analysis Area 13
(1 to 3 Unit Residences)
Area 13 (Capitol Hill) 2010
22
Sub Area Major Minor
Sale Date Sale Price
Adj Sale Price
Above Grade Living
Bld Grade
Year Built/Ren Cond
Lot Size View
Water- front Situs Address
005 195970 0740 07/23/08 $1,100,000 $975,000 2610 9 1909 4 5500 Y N 2716 10TH AVE E
005 560500 0460 06/02/08 $750,000 $657,000 2630 9 1915 3 5580 N N 2810 MONTLAKE BLVD NE
005 195220 0160 09/30/08 $970,000 $874,000 2180 10 2007 3 4500 Y N 2537 BOYER AVE E
005 195970 1765 04/21/08 $1,100,000 $953,000 2480 10 1909 5 5500 N N 2817 10TH AVE E
005 871210 0790 05/13/09 $750,000 $712,000 2550 10 1910 3 5055 N N 1824 24TH AVE E
005 195970 0745 06/19/08 $1,675,000 $1,473,000 3040 10 1909 5 5500 Y N 2712 10TH AVE E
005 560500 0543 08/10/09 $1,500,000 $1,454,000 3170 10 2005 3 5518 N N 2136 E HAMLIN ST

Improved Sales Removed from this Annual Update Analysis Area 13
(1 to 3 Unit Residences)
Area 13 (Capitol Hill) 2010
23
Sub Area Major Minor Sale Date Sale Price Comments
003 113000 0240 11/16/09 $1,435,000 DIAGNOSTIC OUTLIERS
003 116900 0125 6/10/09 $632,500 ESTATE ADMINISTRATOR, GUARDIAN, OR EXECUTOR
003 133680 0225 9/9/08 $1,007,500 ESTATE ADMINISTRATOR, GUARDIAN, OR EXECUTOR
003 133680 0505 5/29/09 $352,467 QUIT CLAIM DEED
003 133780 0245 7/29/08 $638,000 IMP. CHARACTERISTICS CHANGED SINCE SALE
003 133780 0255 10/16/08 $700,000 OBSOLESCENCE CODED
003 133780 0845 7/9/08 $1,250,000 IMP. CHARACTERISTICS CHANGED SINCE SALE
003 133830 0350 9/16/09 $2,300,000 RELOCATION - SALE TO SERVICE
003 133860 0135 1/14/09 $695,000 RELOCATION - SALE TO SERVICE
003 133860 0235 5/8/08 $1,750,000 OBSOLESCENCE CODED
003 133860 0255 3/16/09 $397,894 QUIT CLAIM DEED
003 133860 0305 6/3/08 $1,225,000 ESTATE ADMINISTRATOR, GUARDIAN, OR EXECUTOR
003 133880 0240 12/17/09 $415,000 QUIT CLAIM DEED
003 133880 0335 9/3/09 $1,650,000 DIAGNOSTIC OUTLIERS
003 133880 0460 7/25/08 $108,000 QUIT CLAIM DEED
003 191210 0090 4/2/09 $209,004 QUIT CLAIM DEED
003 191210 0090 8/19/08 $353,860 QUIT CLAIM DEED
003 191210 0585 12/22/08 $615,000 DIAGNOSTIC OUTLIERS
003 212504 9116 1/3/08 $110,000 DOR RATIO
003 216390 0105 2/4/09 $1,095,000 OBSOLESCENCE CODED
003 220750 0185 3/28/08 $560,000 PERCENT COMPLETE CODED
003 220750 0415 9/16/09 $307,824 QUIT CLAIM DEED
003 553510 0335 8/11/09 $699,950 BANKRUPTCY - RECEIVER OR TRUSTEE
003 630640 0135 3/16/09 $600,000 ESTATE ADMINISTRATOR, GUARDIAN, OR EXECUTOR
003 674270 0130 9/10/08 $1,495,682 ESTATE ADMINISTRATOR, GUARDIAN, OR EXECUTOR
003 674270 0340 5/4/09 $491,000 PREVIMP<=25K
003 674270 0345 6/1/09 $640,000 ESTATE ADMINISTRATOR, GUARDIAN, OR EXECUTOR
003 676270 0645 5/15/08 $2,170,000 RELOCATION - SALE TO SERVICE
003 795520 0035 11/3/09 $965,250 IMP COUNT > 1
003 867090 0150 8/12/09 $595,000 BANKRUPTCY - RECEIVER OR TRUSTEE
004 095800 0005 5/27/09 $420,000 BANKRUPTCY - RECEIVER OR TRUSTEE
004 134430 0375 7/15/09 $400,000 BANKRUPTCY - RECEIVER OR TRUSTEE
004 501500 1475 5/13/08 $775,000 UNFINISHED AREA CODED
004 501500 1560 2/12/08 $350,000 IMP. CHARACTERISTICS CHANGED SINCE SALE
004 501600 1165 7/24/09 $301,500 ESTATE ADMINISTRATOR, GUARDIAN, OR EXECUTOR
004 501600 1619 12/17/08 $364,900 BANKRUPTCY - RECEIVER OR TRUSTEE
004 533220 0505 10/20/08 $219,252 QUIT CLAIM DEED
004 982870 2905 10/29/08 $400,000 DOR RATIO
005 026000 0050 5/6/08 $890,000 OBSOLESCENCE CODED
005 195220 0175 11/11/09 $637,509 EXEMPT FROM EXCISE TAX
005 195220 0225 4/9/08 $572,000 ESTATE ADMINISTRATOR, GUARDIAN, OR EXECUTOR
005 195220 0300 11/20/08 $813,000 ESTATE ADMINISTRATOR, GUARDIAN, OR EXECUTOR
005 195970 2230 5/15/08 $256,323 QUIT CLAIM DEED
005 196220 0036 11/18/09 $469,285 EXEMPT FROM EXCISE TAX
005 196220 0395 5/21/09 $450,000 ESTATE ADMINISTRATOR, GUARDIAN, OR EXECUTOR

Improved Sales Removed from this Annual Update Analysis Area 13
(1 to 3 Unit Residences)
Area 13 (Capitol Hill) 2010
24
Sub Area Major Minor Sale Date Sale Price Comments
005 215890 0155 3/31/09 $456,000 GOVERNMENT AGENCY
005 215890 0180 7/14/09 $735,000 ACTIVE PERMIT BEFORE SALE>25K
005 359250 0330 4/15/09 $426,000 EXEMPT FROM EXCISE TAX
005 372080 0026 5/9/08 $350,000 DOR RATIO
005 372080 0055 11/5/08 $485,000 ESTATE ADMINISTRATOR, GUARDIAN, OR EXECUTOR
005 678820 0500 6/3/08 $542,500 TEAR DOWN
005 678820 0860 6/4/09 $650,000 ACTIVE PERMIT BEFORE SALE>25K
005 678820 1496 12/19/08 $247,596 QUIT CLAIM DEED
005 872210 0845 4/29/09 $521,000 BANKRUPTCY - RECEIVER OR TRUSTEE
005 872210 0870 1/27/09 $786,300 ESTATE ADMINISTRATOR, GUARDIAN, OR EXECUTOR
005 872210 0920 9/1/09 $517,000 BANKRUPTCY - RECEIVER OR TRUSTEE
005 880590 0150 7/14/09 $555,000 OBSOLESCENCE CODED

Vacant Sales Used in this Annual Update Analysis Area 13
Area 13 (Capitol Hill) 2010
25
Sub
Area Major Minor
Sale
Date
Sale
Price Lot Size View
Water-
front

Vacant Sales Removed from this Annual Update Analysis Area 13
Area 13 (Capitol Hill) 2010
26
Sub
Area Major Minor Sale Date Sale Price Comments
003 216390 1760 12/31/2008 10,000$ NO MARKET EXPOSURE
003 939070 0118 09/24/2009 300,000$ ESTATE ADMINISTRATOR, GUARDIAN, OR EXECUTOR;
003 948870 0175 08/26/2009 600,000$ ESTATE ADMINISTRATOR, GUARDIAN, OR EXECUTOR;
005 408880 1465 07/08/2008 1,000,000$ MULTI-PARCEL SALE;

Area 13 (Capitol Hill) 2010
27
Client and Intended Use of the Appraisal: This mass appraisal report is intended for use only by the King County Assessor and other agencies or
departments administering or confirming ad valorem property taxes. Use of this report by others is not
intended by the appraiser. The use of this appraisal, analyses and conclusions is limited to the
administration of ad valorem property taxes in accordance with Washington State law. As such it is
written in concise form to minimize paperwork. The assessor intends that this report conform to the
Uniform Standards of Professional Appraisal Practice (USPAP) requirements for a mass appraisal
report as stated in USPAP SR 6-8. To fully understand this report the reader may need to refer to the
Assessor’s Property Record Files, Assessors Real Property Data Base, separate studies, Assessor’s
Procedures, Assessor’s field maps, Revalue Plan and the statutes.
The purpose of this report is to explain and document the methods, data and analysis used in the
revaluation of King County. King County is on a six year physical inspection cycle with annual statistical
updates. The revaluation plan is approved by Washington State Department of Revenue. The
Revaluation Plan is subject to their periodic review.
Definition and date of value estimate:
Market Value The basis of all assessments is the true and fair value of property. True and fair value means market
value (Spokane etc. R. Company v. Spokane County, 75 Wash. 72 (1913); Mason County Overtaxed, Inc.
v. Mason County, 62 Wn. 2d (1963); AGO 57-58, No. 2, 1/8/57; AGO 65-66, No. 65, 12/31/65). The true
and fair value of a property in money for property tax valuation purposes is its “market value” or amount
of money a buyer willing but not obligated to buy would pay for it to a seller willing but not obligated to
sell. In arriving at a determination of such value, the assessing officer can consider only those factors
which can within reason be said to affect the price in negotiations between a willing purchaser and a
willing seller, and he must consider all of such factors. (AGO 65,66, No. 65, 12/31/65)
Retrospective market values are reported herein because the date of the report is subsequent to the
effective date of valuation. The analysis reflects market conditions that existed on the effective date of
appraisal.
Highest and Best Use
RCW 84.40.030 All property shall be valued at one hundred percent of its true and fair value in
money and assessed on the same basis unless specifically provided otherwise by law.
An assessment may not be determined by a method that assumes a land usage or highest and best
use not permitted, for that property being appraised, under existing zoning or land use planning
ordinances or statutes or other government restrictions.
WAC 458-07-030 (3) True and fair value -- Highest and best use. Unless specifically provided
otherwise by statute, all property shall be valued on the basis of its highest and best use for
assessment purposes. Highest and best use is the most profitable, likely use to which a property
can be put. It is the use which will yield the highest return on the owner's investment. Any
reasonable use to which the property may be put may be taken into consideration and if it is
peculiarly adapted to some particular use, that fact may be taken into consideration. Uses that
are within the realm of possibility, but not reasonably probable of occurrence, shall not be
considered in valuing property at its highest and best use.
If a property is particularly adapted to some particular use this fact may be taken into consideration in
estimating the highest and best use. (Sammish Gun Club v. Skagit County, 118 Wash. 578 (1922)) The
present use of the property may constitute its highest and best use. The appraiser shall, however,
consider the uses to which similar property similarly located is being put. (Finch v. Grays Harbor
County, 121 Wash. 486 (1922)) The fact that the owner of the property chooses to use it for less

Area 13 (Capitol Hill) 2010
28
productive purposes than similar land is being used shall be ignored in the highest and best use estimate.
(Sammish Gun Club v. Skagit County, 118 Wash. 578 (1922))
Where land has been classified or zoned as to its use, the county assessor may consider this fact, but he
shall not be bound to such zoning in exercising his judgment as to the highest and best use of the
property. (AGO 63-64, No. 107, 6/6/64)
Date of Value Estimate All property now existing, or that is hereafter created or brought into this state, shall be subject to
assessment and taxation for state, county, and other taxing district purposes, upon equalized valuations
thereof, fixed with reference thereto on the first day of January at twelve o'clock meridian in each year,
excepting such as is exempted from taxation by law. [1961 c 15 §84.36.005]
The county assessor is authorized to place any property that is increased in value due to construction or
alteration for which a building permit was issued, or should have been issued, under chapter 19.27,
19.27A, or 19.28 RCW or other laws providing for building permits on the assessment rolls for the
purposes of tax levy up to August 31st of each year. The assessed valuation of the property shall be
considered as of July 31st of that year. [1989 c 246 § 4]
Reference should be made to the property card or computer file as to when each property was valued.
Sales consummating before and after the appraisal date may be used and are analyzed as to their
indication of value at the date a valuation. If market conditions have changed then the appraisal will
state a logical cutoff date after which no market date is used as an indicator of value.
Property rights appraised:
Fee Simple
Wash Constitution Article 7 § 1 Taxation: All taxes shall be uniform upon the same class of
property within the territorial limits of the authority levying the tax and shall be levied and
collected for public purposes only. The word "property" as used herein shall mean and include
everything, whether tangible or intangible, subject to ownership. All real estate shall constitute
one class.
Trimble v. Seattle, 231 U.S. 683, 689, 58 L. Ed. 435, 34 S. Ct. 218 (1914) “the entire [fee]
estate is to be assessed and taxed as a unit”
Folsom v. Spokane County, 111 Wn. 2d 256 (1988) “the ultimate appraisal should endeavor to
arrive at the fair market value of the property as if it were an unencumbered fee”
The definition of fee simple estate as taken from The Third Edition of The Dictionary of Real Estate
Appraisal, published by the Appraisal Institute. “Absolute ownership unencumbered by any other
interest or estate, subject only to the limitations imposed by the governmental powers of taxation, eminent
domain, police power, and escheat.”
Assumptions and Limiting Conditions:
1. No opinion as to title is rendered. Data on ownership and legal description were obtained from
public records. Title is assumed to be marketable and free and clear of all liens and
encumbrances, easements and restrictions unless shown on maps or property record files. The
property is appraised assuming it to be under responsible ownership and competent management
and available for its highest and best use.
2. No engineering survey has been made by the appraiser. Except as specifically stated, data
relative to size and area were taken from sources considered reliable, and no encroachment of
real property improvements is assumed to exist.

Area 13 (Capitol Hill) 2010
29
3. No responsibility for hidden defects or conformity to specific governmental requirements, such as
fire, building and safety, earthquake, or occupancy codes, can be assumed without provision of
specific professional or governmental inspections.
4. Rental areas herein discussed have been calculated in accord with generally accepted industry
standards.
5. The projections included in this report are utilized to assist in the valuation process and are
based on current market conditions and anticipated short term supply demand factors. Therefore,
the projections are subject to changes in future conditions that cannot be accurately predicted by
the appraiser and could affect the future income or value projections.
6. The property is assumed uncontaminated unless the owner comes forward to the Assessor and
provides other information.
7. The appraiser is not qualified to detect the existence of potentially hazardous material which may
or may not be present on or near the property. The existence of such substances may have an
effect on the value of the property. No consideration has been given in this analysis to any
potential diminution in value should such hazardous materials be found (unless specifically
noted). We urge the taxpayer to retain an expert in the field and submit data affecting value to
the assessor.
8. No opinion is intended to be expressed for legal matters or that would require specialized
investigation or knowledge beyond that ordinarily employed by real estate appraisers, although
such matters may be discussed in the report.
9. Maps, plats and exhibits included herein are for illustration only, as an aid in visualizing matters
discussed within the report. They should not be considered as surveys or relied upon for any
other purpose.
10. The appraisal is the valuation of the fee simple interest. Unless shown on the Assessor’s parcel
maps, easements adversely affecting property value were not considered.
11. An attempt to segregate personal property from the real estate in this appraisal has been made.
12. Items which are considered to be “typical finish” and generally included in a real property
transfer, but are legally considered leasehold improvements are included in the valuation unless
otherwise noted.
13. The movable equipment and/or fixtures have not been appraised as part of the real estate. The
identifiable permanently fixed equipment has been appraised in accordance with RCW 84.04.090
and WAC 458-12-010.
14. I have considered the effect of value of those anticipated public and private improvements of
which I have common knowledge. I can make no special effort to contact the various
jurisdictions to determine the extent of their public improvements.
15. Exterior inspections were made of all properties in the physical inspection areas (outlined in the
body of the report) however; due to lack of access and time few received interior inspections.
Scope of Work Performed:
Research and analyses performed are identified in the body of the revaluation report. The assessor has
no access to title reports and other documents. Because of legal limitations we did not research such
items as easements, restrictions, encumbrances, leases, reservations, covenants, contracts, declarations
and special assessments. Disclosure of interior home features and, actual income and expenses by
property owners is not a requirement by law therefore attempts to obtain and analyze this information are
not always successful. The mass appraisal performed must be completed in the time limits indicated in
the Revaluation Plan and as budgeted. The scope of work performed and disclosure of research and
analyses not performed are identified throughout the body of the report.

Area 13 (Capitol Hill) 2010
30
CERTIFICATION: I certify that, to the best of my knowledge and belief:
The statements of fact contained in this report are true and correct
The report analyses, opinions, and conclusions are limited only by the reported assumptions and
limiting conditions and are my personal, impartial, and unbiased professional analyses, opinions,
and conclusions.
I have no present or prospective interest in the property that is the subject of this report and no
personal interest with respect to the parties involved.
I have no bias with respect to the property that is the subject of this report or to the parties
involved.
My engagement in this assignment was not contingent upon developing or reporting
predetermined results.
My compensation for completing this assignment is not contingent upon the development or
reporting of predetermined value or direction in value that favors the cause of the client, the
amount of the value opinion, the attainment of a stipulated result, or the occurrence of a
subsequent event directly related to the intended use of this appraisal.
My analyses, opinions, and conclusions were developed, and this report has been prepared, in
conformity with the Uniform Standards of Professional Appraisal Practice.
The area(s) physically inspected for purposes of this revaluation are outlined in the body of this
report.
The individuals listed below were part of the “appraisal team” and provided significant real
property appraisal assistance to the person signing this certification. Any services regarding the
subject area performed by the appraiser within the prior three years, as an appraiser or in any
other capacity is listed adjacent their name.
None
Any services regarding the subject area performed by me within the prior three years, as an
appraiser or in any other capacity is listed below:
To the best of my knowledge the following services were performed by me within the subject area in
the last three years:
Annual Up-Date Model Development and Report Preparation
Data Collection
Sales Verification
Appeals Response Preparation / Review

Area 13 (Capitol Hill) 2010
31
Department of Assessments King County Administration Bldg.
500 Fourth Avenue, ADM-AS-0708 Seattle, WA 98104-2384 (206) 296-5195 FAX (206) 296-0595
Email: [email protected]
As we start a new decade and prepare the 2010 revaluations for the 2011 Tax Roll, it is important for staff
to review our standards for completing our assessments for this year. As Deputy Assessors, first,
everyone works for the taxpayers of King County and we must do our work in the most fair and equitable
manner. Second, we will take pride in doing the best professional job possible. Third, we will treat all
taxpayers with respect and value their opinions.
To further those standards, all appraisers are directed to:
Use all appropriate mass appraisal techniques as stated in Washington State Laws, Washington
State Administrative Codes, 2010 Uniform Standards of Professional Appraisal Practice
(USPAP), and accepted International Association of Assessing Officers (IAAO) standards and
practices.
Work with your supervisor on the development of the annual valuation plan and develop the
scope of work for your portion of appraisal work assigned, including physical inspections and
statistical updates of properties;
Validate for correctness physical characteristics for all vacant and improved properties and,
where applicable, validate sales data for those properties;
Appraise land as if vacant and available for development to its highest and best use. The
improvements are to be valued at their contribution to the total in compliance with applicable
laws, codes and DOR guidelines. The Jurisdictional Exception is applied in cases where Federal,
State or local laws or regulations preclude compliance with USPAP;
Develop valuation models as delineated by the IAAO (Standard on Mass Appraisal of Real
Property, 2002; rev 2008). Apply models uniformly to sold and unsold properties, so that ratio
statistics can be accurately inferred to the entire population. Validate models as delineated by
IAAO in their Standard on Ratio Studies (approved July 2007).
All sales are to be time adjusted to 1/1/10 and models developed by appraisers will include an
administrative adjustment of .925 to reflect current economic factors that impact value and are
not indicated by time-adjusted sales data alone.
Prepare written reports in compliance with USPAP Standard 6 for Mass Appraisals. The
intended users of your appraisals and the written reports include the Assessor, the King County
Board of Equalization, the Washington State Board of Tax Appeals, the King County Prosecutor
and the Washington State Department of Revenue. The intended use of the appraisals and the
written reports is the administration of ad valorem property taxation.
Lloyd Hara
King County Assessor
Lloyd Hara Assessor