characterisation of var genes and of the pfemp-1 … table of contents list of abbreviations . vi...
TRANSCRIPT
Aus der Abteilung für Infektions und Tropenmedizin
an der Medizinischen Klinik und Poliklinik IV
des Klinikums der Ludwig-Maximilians-Universität München
Abteilungsdirektor: Prof. Dr. med. Thomas Löscher
Characterisation of var genes and of the
PfEMP-1 binding capacity to ICAM-1 of
Plasmodium falciparum isolates from Indonesia
Dissertation
zum Erwerb des Doktorgrades des Humanbiologi
an der Medizinischen Fakultät der
Ludwig-Maximilians-Universität zu München
vorgelegt von
Erma Sulistyaningsih
aus
Banyuwangi, Indonesia
2012
ii
Mit Genehmigung der Medizinischen Fakultät
der Universität München
Berichterstatter: Prof. Dr. med. Thomas Löscher
Mitberichterstatter:
Priv. Doz. Dr. Heinz Rinder
Priv. Doz. Dr. Sören Schubert
Mitbetreuung durch den
promovierten Mitarbeiter:
Dr. med Nicole Berens-Riha, MD, DTM&H, MSc
Dekan:
Prof. Dr. med. Dr. h.c. Maximilian Reiser, FACR, FRCR
Tag der mündlichen Prüfung:
13.09.2012

iii
TABLE OF CONTENTS
LIST OF ABBREVIATIONS ………………………………………………………………. vi
LIST OF TABLES …………………………………………………………………………... viii
LIST OF FIGURES …………………………………………………………………………. ix
1. INTRODUCTION ……………………………………………………………………….. 1
1.1 A perspective on malaria …………………………………………………………. 1
1.2 Plasmodium knowlesi ………………………………………………………………... 2
1.3 The global distribution of Plasmodium falciparum malaria ……………………... 4
1.4 Plasmodium falciparum life cycle ………………………………………………….. 5
1.5 Plasmodium falciparum erythrocyte membrane protein–1 (PfEMP-1) ................. 7
1.6 var gene family ……………………………………………………………………... 9
1.7 var gene diversity ………………………………………………………………….. 10
1.8 Regulation of var gene expression ……………………………………………….. 11
1.9 Antigenic variation and var gene switching …………………………………….. 13
1.10 Cytoadherence and its consequence on clinical manifestation ……………….. 14
1.11 Host receptors involved in cytoadherence …………………………………….. 15
1.12 The role of PfEMP-1 in cytoadherence ………………………………………….. 19
2. OBJECTIVES …………………………………………………………………………….. 23
3. MATERIALS AND METHODS ………………………………………………………... 25
3.1 Materials ……………………………………………………………………………. 24
3.1.1 Study Site ……………………………………………………………………. 25
3.1.2 Sample Collection …………………………………………………………... 25
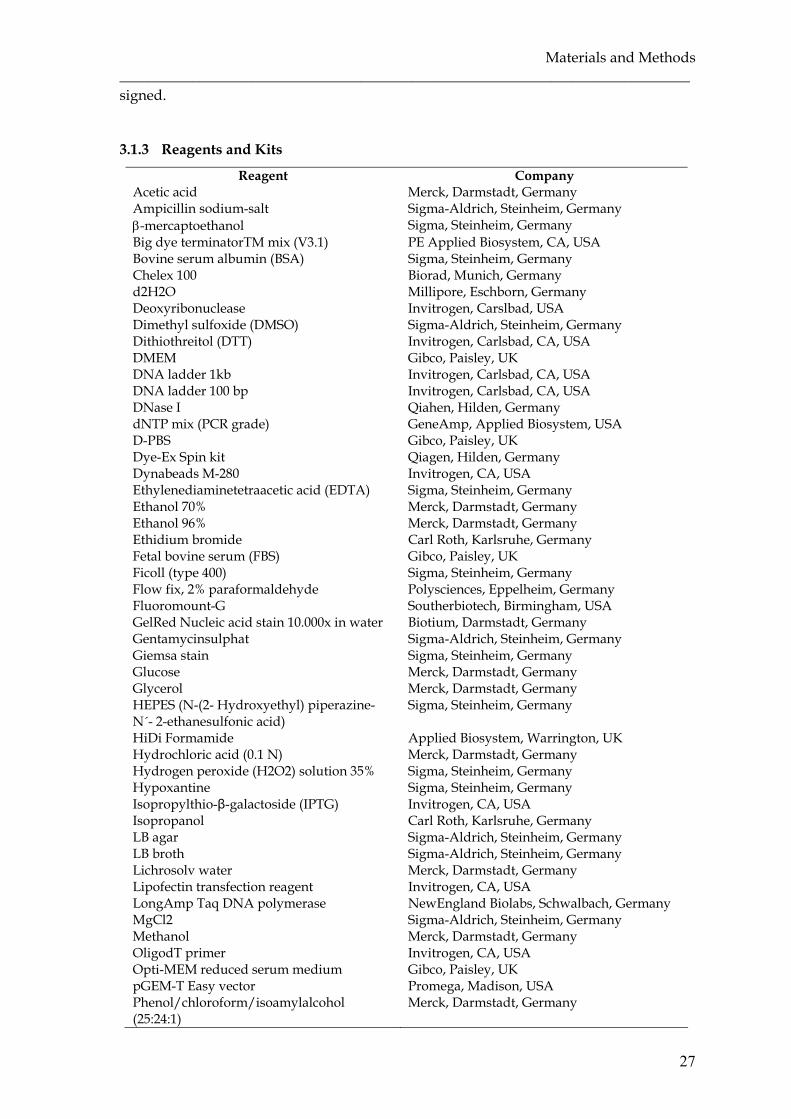
3.1.3 Reagents and Kits ………………………………………………………….. 27
3.1.4 Sundry Materials …………………………………………………………… 28
3.1.5 Buffers and Solutions ………………………………………………………. 28
3.1.6 Equipments …………………………………………………………………. 30
3.1.7 Softwares ……………………………………………………………………. 30
3.1.8 Culture medium ……………………………………………………………. 31
3.1.9 Bacterial strains ……………………………………………………………... 32
3.1.10 Mammalian cell line ………………………………………………………... 33
3.1.11 Plasmids ……………………………………………………………………... 33
3.1.12 Primers ………………………………………………………………………. 33
3.1.13 Antibodies ………………………………………………………………… 35

iv
3.2 Methods …………………………………………………………………………….. 36
3.2.1 Cultivation of fresh Plasmodium falciparum isolates from patients …….. 36
3.2.2 Microbiology techniques ………………………………………………… 37
3.2.2.1 Bacterial cultures ……………………...………………………….... 37
3.2.2.2 Preparation of bacterial stocks ……………………………………. 37
3.2.2.3 Preparation of chemically competent bacteria ………………….. 37
3.2.3 Molecular biology techniques ……………………………………………... 37
3.2.3.1 DNA extraction ……………………………………………………. 37
3.2.3.2 RNA extraction ……………………………………………………. 38
3.2.3.3 cDNA synthesis …………………………………………………… 39
3.2.3.4 Polymerase Chain Reaction (PCR) ………………………………. 39
3.2.3.5 DNA analysis and purification …………………………………... 41
3.2.3.6 DNA digestion using restriction enzymes ……………………… 43
3.2.3.7 Ligation …………………………………………………………….. 43
3.2.3.8 Transformation of plasmid into bacterial cells …………………. 43
3.2.3.9 Plasmid DNA isolation …………………………………………… 44
3.2.3.10 Sequencing ………………………………………………………… 44
3.2.3.11 Sequence analysis …………………………………………………. 45
3.2.4 Cell culture techniques …………………………………………………….. 46
3.2.4.1 Cultivation of mammalian cells ……………………..…………… 46
3.2.4.2 Freezing and thawing of mammalian cells ……………………… 46
3.2.4.3 Determination of cell viability ……………………..……………... 46
3.2.4.4 Transient transfection of adherent cells ……………………..…... 47
3.2.5 Immunofluorescence techniques ………………………………………….. 47
3.2.5.1 Immunofluorescence assay to test transfection efficiency and
expression of construct on the surface of COS-7 cells ……………
47
3.2.5.2 Immunofluorescence assay to assess the ICAM-1 binding of the
recombinant construct pDBLβ-C2 …………………………………
48
3.2.6 Statistical analysis ………………………………………………………….. 49
4. RESULTS …………………………………………………………………………………. 51
4.1 Characteristic of samples ………………………………………………………….. 51
4.2 Identification of Plasmodium species …………………………………………….. 51
4.3 Detection of human Plasmodium knowlesi case ………………………………….. 52
4.4 Genotyping of Plasmodium falciparum ……………………………………………. 53
v
4.5 Diversity of var genes ……………………………………………………………… 55
4.6 Determination of distribution motif in DBL1α …………………………………. 57
4.6.1 Classification of the DBL1α sequence tag ……………………………….. 57
4.6.2 Sequence distribution motif of DBL1α …………………………………… 58
4.6.3 Distribution motif in expressed var DBL1α sequence …………………... 60
4.7 Identification of conserved DBL domains ………………………………………. 61
4.8 Detection of var D-like gene ………………………………………………………. 62
4.9 Identification of DBLβ-C2 domain of PfEMP-1 ………………………………… 64
4.10 Binding capacity of PfEMP-1 DBLβ-C2 domain to ICAM-1 ………………….. 68
5. DISCUSSION ……………………………………………………………………………. 71
5.1 Human Plasmodium knowlesi cases ……………………………………………….. 71
5.2 Characteristic of malaria patients ………………………………………………... 72
5.3 Genotyping results ……..………………………………………………………….. 73
5.4 var gene diversity ………………………………………………………………….. 75
5.5 Distribution motif in DBL1α sequences from genomic DNA …………………. 76
5.6 Expressed var genes from clinical field isolates ………………….……………... 77
5.7 Conserved DBL domains …………...…………………………………………….. 80
5.8 Specific motif var D-like sequence ……………………………………………….. 81
5.9 PfEMP-1 DBLβ-C2 domain and its ICAM-1 binding capacity ………………... 82
6. SUMMARY ………………………………………………………………………………. 87
7. ZUSAMMENFASSUNG ………………………………………………………………... 91
REFERENCES ……………………………………………………………………………… 95
APPENDIX …………………………………………………………………………………. 117
ACKNOWLEDGEMENTS ………………………………………………………………... 123
CURRICULUM VITAE ……………………………………………………………………. 125
vi
LIST OF ABBREVIATIONS ACT Artemisinin-based Combination Therapy
ATS Acidic Terminal Sequence
BSA Bovine Serum Albumin
cDNA complementary DNA
CIDR Cysteine-rich Interdomain Regions
CR1 Complement Receptor 1
CSA Chondroitin sulphate A
DBL Duffy Binding-like
DMEM Dulbecco’s Modified Eagle Medium
DMSO Dimethyl Sulfoxide
dNTP Deoxynucleotide Triphosphates
DTT Dithiothreitol
EBA Erythrocytes Binding Antigen
EDTA Ethylenediaminetetraacetic Acid
ELAM Endothelial Leukocyte Adhesion Molecule
FBS Fetal Bovine Serum
GAG Glycosaminoglycan
GLRUP Glutamate-Rich Protein
HA Hyaluronic Acid
HB Homology Block
HS Heparan Sulphate
ICAM-1 Intercellular Adhesion Molecule-1
IE Infected Erythrocyte
IFNγ Interferon γ
IPTG Isopropylthio-β-galactoside
KAHRP Knob-associated Histidine-rich Protein
MOI Multiplicity of Infection
MSP Merozoite Surface Protein
NMR Nuclear Magnetic Resonance
NTS N-terminal Segment
PAM Pregnancy-associated Malaria
PCR Polymerase Chain Reaction
vii
PECAM-1 Platelet Endothelial Cell Adhesion Molecule-1
PEG Polyethylenglycol
PfAPI Plasmodium falciparum Annual Parasite Incidence
PfEMP-1 Plasmodium falciparum Erythrocyte Membrane Protein-1
PfPR Plasmodium falciparum Parasite Rate
PoLV Positions of Limited Variability
RFLP Restriction Fragment Length Polymorphism
RT-PCR Reverse Transcription- Polymerase Chain Reaction
TARE Telomere-associated Repeat Elements
TM Trans-membrane
TNF-α Tumor Necrosis Factor-α
TSP Thrombospondin
Ups Upstream promoter
VCAM-1 Vascular Cell Adhesion Molecule-1
viii
LIST OF TABLES Table 1.1 Host cell receptors and P. falciparum ligands involved in
cytoadherence ………………………………………………………………..
21
Table 4.1 Profile of malaria patients ………………………………………………….. 51
Table 4.2 Profile of Plasmodium knowlesi-positive patients …………………………. 53
Table 4.3 Genotyping results by MSP-1, MSP-2, and GLURP ……………………... 54
Table 4.4 Distribution motif of expressed var DBL1α sequences in severe cases ... 60
Table 4.5 Distribution of homology blocks (HB) among the proposed var D gene
using VarDom server ………………………………………………………..
63
Table 4.6 Position of cysteine residues within DBLβ-C2 domain of field isolates
corresponding to those of both PfEMP-1 DBL and EBA DBL …………..
65
Table 4.7 Sequence family classification of DBLβ-C2 domain from field isolates
using varDom server ………………………………………………………..
67
Table 4.8 Distribution of five major homology blocks (HB) in DBLβ domains of
field isolates using VarDom server ………………………………………..
68
Table 4.9 Binding capacity of DBLβ-C2 domain to ICAM-1 ……………………….. 70
ix
LIST OF FIGURES Figure 1.1 Zone where P. knowlesi malaria and the anopheline vectors may likely
cause infection in humans …………………………………………………
3
Figure 1.2 The spatial distribution of P. falciparum malaria PfPR2-10 prediction
stratified by endemicity class ……………………………………………..
4
Figure 1.3 Schematic representation of P. falciparum life cycle …………………….. 6
Figure 1.4 Schematic architecture of PfEMP-1 ………………………………………. 8
Figure 1.5 Genomic organization and the features of var genes …………………... 9
Figure 3.1 P. falciparum malaria endemicity class in Indonesia ……………………. 26
Figure 4.1 Amplification results using Pmk8 and Pmkr9 primers to detect P.
knowlesi case …………………………………………………………………
52
Figure 4.2 Multiple alignment of P. knowlesi ssRNA from Indonesia with other P.
knowlesi strains ……………………………………………………………...
53
Figure 4.3 Amplification results of universal primer αAF and αBR ……………… 55
Figure 4.4 Unrooted phylogram of DBL1α sequence tag from Indonesian field
isolates and other global isolates ………………………………………….
56
Figure 4.5 Distribution of DBL1α sequences into six sequence groups according
to the clinical presentation ………………………………………………...
58
Figure 4.6 Association of PoLV motifs with distinct sequence length
distributions ………………………………………………………………...
59
Figure 4.7 Distribution of PoLV1-4 motifs within isolates causing severe and
uncomplicated malaria …………………………………………………….
59
Figure 4.8 Amplification of genomic DNA by using UNIEBP primers …………... 61
Figure 4.9 Multiple aligment of specific var D-like sequences …………………….. 63
Figure 4.10 Amplification results using specific DBLβ-C2 primer from genomic
DNA of field isolates ……………………………………………………….
64
Figure 4.11 Characteristic of DBLβ-C2 sequences from field isolates ……………… 66
Figure 4.12 Immunofluorescence images from the staining of transfected COS-7
cells with an antibody against an epitope tag in the recombinant
protein ……………………………………………………………………….
69

x

1. INTRODUCTION
1.1 A perspective on malaria
Malaria is an infectious disease caused by protozoon parasites of the genus Plasmodium
and transmitted by the bite of an infectious female Anopheles mosquito. It is most
common in tropical climates, but also occurs in many sub-tropical regions. Malaria
infects vertebrates including humans, monkeys, birds, reptiles, and rodents. There are
four Plasmodium species causing a clinically relevant infection in humans: Plasmodium
falciparum, Plasmodium vivax, Plasmodium malariae and Plasmodium ovale. Recently, it has
been reported that Plasmodium knowlesi, a monkey malaria parasite in certain forest areas
of South-East Asia, infects humans more frequently than previously known (Singh et al.,
2004).
P. vivax is causing tertian malaria with almost 40% of the world’s population at risk.
Although often regarded as causing benign and self-limiting infection, there is
increasing evidence that overall burden, economic impact and severity of P. vivax
infection are underestimated (Mendis et al., 2001; Price et al., 2007). According to WHO,
there are 132-391 million clinical cases per year. In recent years, increasing numbers of
cerebral malaria and fatalities due to P. vivax mono-infection have been reported (Tjitra
et al., 2008; Tanwar, et al., 2011). P. ovale is a more infrequent cause of tertian malaria and
often presents with low grade parasitaemia. P. malariae infection is also a mild variant of
malaria but it can cause renal complications especially in children (Garcia, 2010). P.
falciparum causing malaria tropica, later abbreviated as “falciparum malaria”, causes the
most severe clinical symptoms and is potentially lethal in human due to a high
reproduction rate and the capability to invade erythrocytes of all ages, thus resulting in
very high parasitaemia. Furthermore, infected erythrocytes acquire the ability to adhere
to the endothelium of blood vessels causing obstruction of microcirculation, leading to
poor perfusion of host tissues, anaerobic metabolism and hypoxia resulting further in
multiple organ failure (Miller et al., 2002; Chenb et al., 2000).
Malaria cases present with a large range of disease manifestations ranging from
asymptomatic infection to severe malaria and death. Some factors are involved in the
clinical outcome, including host immunity, parasite virulence and geographical and
social factors. Host factors determining the clinical manifestation are age, immune status,
proinflammatory cytokines, nutrition and genetic background such as sickle cell trait,
thalassaemia and ovalocytosis. The known parasite factors involved are drug resistance,
multiplication rate, invasion pathways, cytoadherence, antigenic variation and malaria
Introduction ______________________________________________________________________________
2
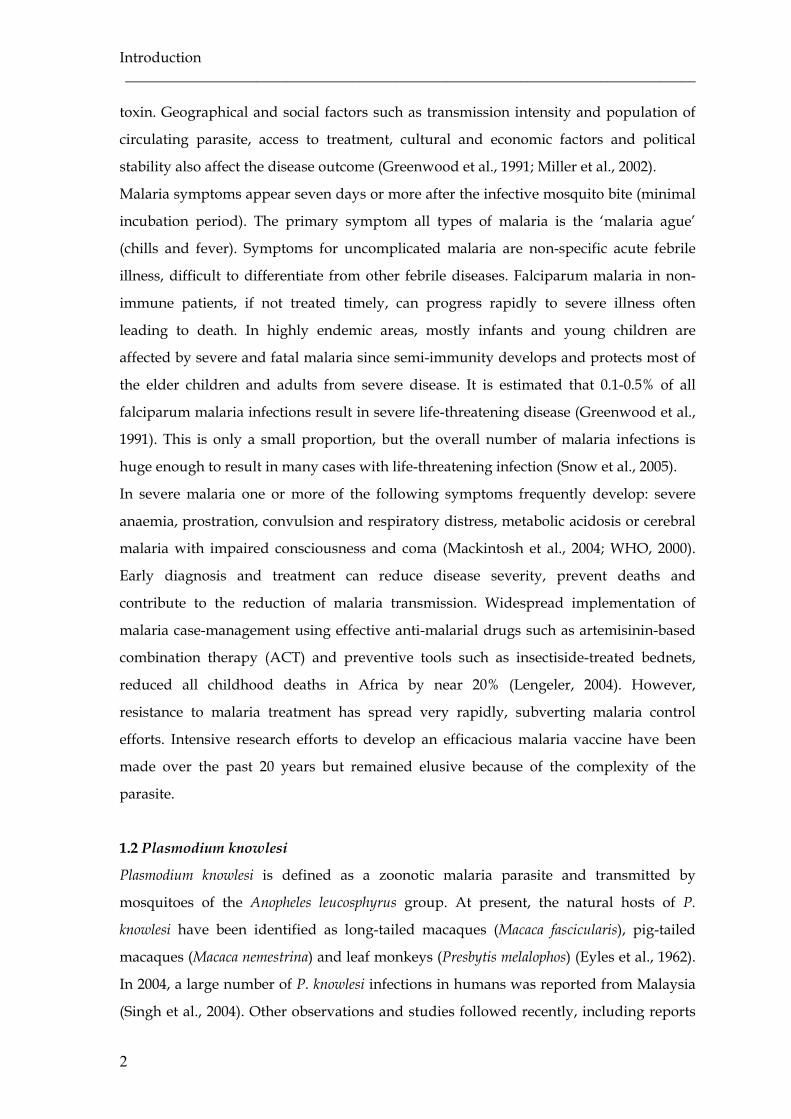
toxin. Geographical and social factors such as transmission intensity and population of
circulating parasite, access to treatment, cultural and economic factors and political
stability also affect the disease outcome (Greenwood et al., 1991; Miller et al., 2002).
Malaria symptoms appear seven days or more after the infective mosquito bite (minimal
incubation period). The primary symptom all types of malaria is the ‘malaria ague’
(chills and fever). Symptoms for uncomplicated malaria are non-specific acute febrile
illness, difficult to differentiate from other febrile diseases. Falciparum malaria in non-
immune patients, if not treated timely, can progress rapidly to severe illness often
leading to death. In highly endemic areas, mostly infants and young children are
affected by severe and fatal malaria since semi-immunity develops and protects most of
the elder children and adults from severe disease. It is estimated that 0.1-0.5% of all
falciparum malaria infections result in severe life-threatening disease (Greenwood et al.,
1991). This is only a small proportion, but the overall number of malaria infections is
huge enough to result in many cases with life-threatening infection (Snow et al., 2005).
In severe malaria one or more of the following symptoms frequently develop: severe
anaemia, prostration, convulsion and respiratory distress, metabolic acidosis or cerebral
malaria with impaired consciousness and coma (Mackintosh et al., 2004; WHO, 2000).
Early diagnosis and treatment can reduce disease severity, prevent deaths and
contribute to the reduction of malaria transmission. Widespread implementation of
malaria case-management using effective anti-malarial drugs such as artemisinin-based
combination therapy (ACT) and preventive tools such as insectiside-treated bednets,
reduced all childhood deaths in Africa by near 20% (Lengeler, 2004). However,
resistance to malaria treatment has spread very rapidly, subverting malaria control
efforts. Intensive research efforts to develop an efficacious malaria vaccine have been
made over the past 20 years but remained elusive because of the complexity of the
parasite.
1.2 Plasmodium knowlesi
Plasmodium knowlesi is defined as a zoonotic malaria parasite and transmitted by
mosquitoes of the Anopheles leucosphyrus group. At present, the natural hosts of P.
knowlesi have been identified as long-tailed macaques (Macaca fascicularis), pig-tailed
macaques (Macaca nemestrina) and leaf monkeys (Presbytis melalophos) (Eyles et al., 1962).
In 2004, a large number of P. knowlesi infections in humans was reported from Malaysia
(Singh et al., 2004). Other observations and studies followed recently, including reports

Introduction ______________________________________________________________________________
3
about human fatalities with P. knowlesi (Cox-Singha et al., 2008) and cases from Thailand
(Jongwutiwes et al., 2004), China (Zhu et al., 2006), Singapore (Ng et al., 2008), the
Philippines (Luchavez et al., 2008) and imported by tourists (USA, Finland, Sweden)
who had traveled to South-East Asian countries. These findings raised a legitimacy to
claim P. knowlesi as the fifth causative agent of malaria in humans.
Humans are susceptible to infections and can be infected anywhere within the range of
distribution of the specific vector if infected monkeys are present (Collins and Barnwell,
2009). The range of the A. leucosphyrus group overlaps with the long-tailed and pig-
tailed macaques. The known distributions of A. leucosphyrus group are: Southern
Thailand, Malaysia, Indonesia, Philippines (Manguin et al., 2008). They are also found in
Bangladesh, China, India, Myanmar, and Sri Lanka (Sallum et al., 2005). Long-tailed
macaques are widespread throughout the islands of Southeast Asia and mainland Asia
(Fittinghoff and Lindburg, 1980; Groves, 2001). Pig-tailed macaques have a wide range
throughout Southeast Asia as well (Groves, 2001; Choudhury, 2003). Therefore, naturally
acquired human P. knowlesi infections have been acquired within this range (Figure 1.1)
(Cox-Singhb and Singh, 2008). Regarding the large distribution of the vector (A.
leucosphyrus group) and the natural host of P. knowlesi (Macaca species) in Southeast
Asia, it was very likely to find P. knowlesi in Indonesia.
Figure 1.1. Zone where P. knowlesi malaria and the anopheline vectors may likely cause infection in humans. P. knowlesi is potentially distributed as far north as Taiwan, east as Sulawesi, south to Java in Indonesian archipelago and as far west as Myanmar and the eastern edge of India (Baird, 2009).
The prevalence of naturally acquired knowlesi malaria in humans may be
underestimated (Jongwutiwes et al., 2004). Misdiagnosis often occurs by microscopy
because the early blood stages of P. knowlesi morphologically resemble P. falciparum, the
mature trophozoites and schizonts may present characteristics of P. malariae. Therefore, a

Introduction ______________________________________________________________________________
4
patient infected by P. knowlesi is most likely, but not exclusively, to be diagnosed as
infected by P. malariae (White, 2008).
Several studies in describing the clinical feature of human P. knowlesi infection by human
volunteers challenged with P. knowlesi showed the infection as mild to severe malaria
with most attacks terminating spontaneously after two weeks (Coatney et al., 1971).
Another study reported initial fever up to 39oC but later fever raised up to 41oC, which
appeared daily (quotidian fever) until 10 days and finally diminished spontaneously.
Most cases had less than 1% parasitaemia, but one patient showed 12% parasitaemia
(Milam and Kusch, 1938). Of interest, African people seemed to be difficult to infect with
P. knowlesi, four of six challenged developed only very mild disease and the other two
none at all. P. knowlesi shares very similar Duffy-like receptors on erythrocytes as occurs
in P. vivax, thus the Duffy receptor negative phenotype probably protects humans
against infection by P. knowlesi (Chin et al., 1968; Baird, 2009).
1.3 The global distribution of Plasmodium falciparum malaria
Malaria is found in 108 countries of the world (WHO, 2010) and every year 500 million
cases of malaria and an estimated 1-3 million deaths is reported. In 2007, 2.37 billion
people lived in areas at any risk of P. falciparum transmission worldwide, 26% located in
Africa, 62% in South east Asian and Western Pacific region and the rest is located in
American, eastern Mediterranean and European regions (Guerra et al., 2008). Most
malaria cases and deaths occur in sub-Saharan Africa (Figure 1.2).
Figure 1.2. The spatial distribution of P. falciparum malaria PfPR2-10 prediction stratified by endemicity class. They are categorized as low risk (PfPR2-10 <5%), intermediate risk (5%<PfPR2-10<40%) and high risk (PfPR2-10 >40%) areas. The rest area is classified as unstable risk (medium grey area if PfAPI<0.1 per 1,000 pa) or no risk (light grey, if PfAPI=0 per 1,000 pa) (Hay et al., 2009).
Introduction ______________________________________________________________________________
5
In Indonesia, 132.8 million of 230 million people live in malaria endemic areas in 2010.
Of these, 70.3% lived in areas of unstable transmission. Among those living in stable
transmission, 93.39% were at low risk, 6.6% at intermediate risk and only 0.01% at high
risk of transmission (Elyazar et al., 2011). In 2009, 544 thousands confirmed malaria cases
with 900 deaths were reported according to WHO (SEARO-WHO, 2010).
The intensity of malaria transmission depends on factors related to the parasite, the
vector, the human host, and the environment. There are approximately 33 different
Anopheles vector species around the world. Some species are more significant than others
as vectors because of variations in susceptibility to the parasite or the propensity to bite
humans (Kiszewski et al., 2004). Human immunity is another important factor,
especially among adults in areas of moderate or intense transmission conditions.
Immunity is developed over years of exposure. Though it rarely results in sufficient
protection, meaning asymptomatic parasitaemia, like in high transmission areas,
frequent exposure does decrease the risk of severe malaria infection. For the children
until the age of 6 months, they develop only mild symptoms and low parasitaemia
(Snow et al., 1997) as the result of passive transfer of maternal antibodies and persistence
of haemoglobin F (Sehgal et al., 1989; Hogh et al., 1995). From around 6 months, children
become susceptible to severe disease and death. For this reason, most malaria deaths in
Africa occur in young children, whereas in areas with lower transmission and less
immunity, all age groups are at risk.
Transmission also depends on climatic and ecological factors. These factors are required
for the abundance and survival of the anopheline mosquitoes and for the development
of sporozoites within the vector. Beside the climatic conditions, transmission can be
influenced by human activities such as urbanization, mass population movement,
agricultures and malaria control program.
1.4 Plasmodium falciparum life cycle
The life cycle of P. falciparum includes sexual and asexual reproduction, involving both
human and Anopheles spp mosquito hosts. During the entire cycle, there are several
changes (Figure 1.3). When an infected female Anopheles mosquito injects saliva during
blood meal to prevent coagulation, it inoculates 1-100 infective sporozoites into the
blood stream, infecting the human (Rosenberg et al., 1990; Ponnudurai et al., 1991). The
blood and probably the lymphatic system transport the sporozoites into the liver where
Introduction ______________________________________________________________________________
6
5-10% successfully invade hepatocytes (Ferreira et al., 1986). They differentiate into
hepatic schizont in which around 30,000 daughter merozoites develop (Amino, 2006).
After 5-14 days the schizont ruptures and spreads thousands of merozoites into the
blood stream, they invade erythrocytes. The development from sporozoite injection to
hepatocyte rupture is called the exo-erythrocytic cycle. During this stage, the host stays
asymptomatic.
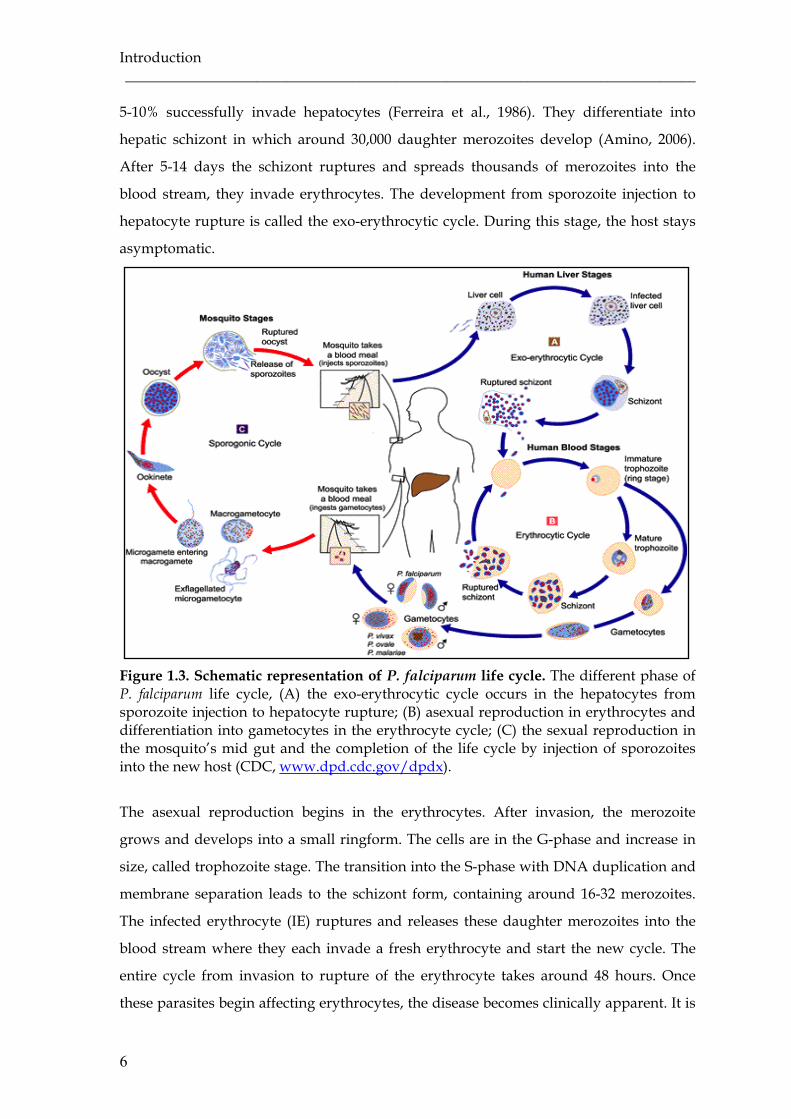
Figure 1.3. Schematic representation of P. falciparum life cycle. The different phase of P. falciparum life cycle, (A) the exo-erythrocytic cycle occurs in the hepatocytes from sporozoite injection to hepatocyte rupture; (B) asexual reproduction in erythrocytes and differentiation into gametocytes in the erythrocyte cycle; (C) the sexual reproduction in the mosquito’s mid gut and the completion of the life cycle by injection of sporozoites into the new host (CDC, www.dpd.cdc.gov/dpdx).
The asexual reproduction begins in the erythrocytes. After invasion, the merozoite
grows and develops into a small ringform. The cells are in the G-phase and increase in
size, called trophozoite stage. The transition into the S-phase with DNA duplication and
membrane separation leads to the schizont form, containing around 16-32 merozoites.
The infected erythrocyte (IE) ruptures and releases these daughter merozoites into the
blood stream where they each invade a fresh erythrocyte and start the new cycle. The
entire cycle from invasion to rupture of the erythrocyte takes around 48 hours. Once
these parasites begin affecting erythrocytes, the disease becomes clinically apparent. It is
Introduction ______________________________________________________________________________
7
thought that the intermittent release of merozoites causes the symptoms of malaria in the
host by stimulation of endogenous release of pyrogens. The majority of merozoites will
again infect erythrocytes and develop into schizonts. A small number will differentiate
into male and female gametocytes within erythrocytes. These sexual forms are
responsible for transmission of P. falciparum through ingestion by feeding mosquitoes.
When a female anopheline mosquito feeds on the blood of an infected person, it ingests
gametocytes. Inside the mosquito’s midgut, the female gametocytes develop into
macrogametes and the male gametocytes exflagellate and form microgametes which
fertilize the macrogametes by fusion, forming motile zygotes called ookinetes. The
diploid ookinetes cross the midgut membrane, undergo meiosis and adhere onto the
exterior site of the gut wall. Here, they undergo several rounds of mitosis to form oocyst
(sporogony). This step is called sporogonic cycle. Each oocyst releases thousands of
motile haploid sporozoites into the mosquito’s body cavity, from where they migrate
into the mosquito’s salivary glands. During the next blood meal, they are injected
together with the saliva into a new host and the cycle is completed.
1.5 Plasmodium falciparum erythrocyte membrane protein–1 (PfEMP-1)
During the erythrocytic cycle, P. falciparum expresses a large and highly polymorphic P.
falciparum erythrocyte membrane protein-1 (PfEMP-1), which is exported from the
parasite to the surface of infected erythrocyte approximately 18 hours post invasion
onwards. This protein has been linked to two key phenomena responsible for the
pathology associated with P. falciparum infection: cytoadherence of IE and
immunoregulatory effects on host immune cells through binding to other host receptor
and antigenic variation with consequent immune evasion.
PfEMP-1 is ~250 – 350 kDa in size and varies in domain composition and binding
specificity. The architecture of PfEMP-1 is complex. The extracellular part protrudes
from the erythrocyte membrane into the host’s blood plasma being the most variable
part of the protein. It contains an N-terminal segment (NTS) followed by a segment
composed of three binding domain types: Duffy binding-like (DBL) domain, cysteine-
rich interdomain regions (CIDR) and C2 domain. The NTS is semi-conserved and located
at the N-terminal end of PfEMP-1. It contains sequence features sufficient for transport
beyond the parasitophorous vacuole that surrounds the intraerythrocytic parasite (Hiller
et al., 2004; Marti et al., 2004). The DBL domain is an adhesive region that binds a variety
of different receptors. Based on conserved sequence stretches and conserved cysteine in
the sequences, the DBL domain is classified into six different types: α, β, γ, δ, ε and χ.

Introduction ______________________________________________________________________________
8
Further sequence analysis revealed that each DBL domain is divided into 10 semi-
conserved blocks (A-J) and 10 variable blocks (1-10). The semi-conserved blocks contain
a higher number of invariant or bio-chemically-conserved residues that are presumably
important for domain folding. The absolute number of cysteine residues differs
significantly between DBL domains of PfEMP-1. The CIDR domain consists of semi-
conserved stretch and is classified into three different types: α, β and γ. The last domain
type C2 involved in calcium-dependent phospholipid binding and membrane targeting
process such as sub-cellular localization (Smithb et al., 2000). The intracellular part or the
acidic terminal sequence (ATS) is rather conserved and may function as an anchor by
interaction with erythrocyte skeleton proteins (Oh et al., 2000) and additional parasite
proteins such as KAHRP (Rug M et al., 2006; Waller et al., 2002).
The PfEMP-1 proteins have related protein architecture, but the sequence, number,
location and type of domains differ significantly, usually they contain between two and
seven DBL domains and one and two CIDR domains (Figure 1.4). Thirty-one different
architectural types are described from the three sequenced parasite var repertoires
(Kraemer et al., 2007). Because the domain architecture is variable, PfEMP-1 domains are
identified by position in the protein and by type, for example DBL1α represents the first
domain after the NTS. Semi-conserved head structures like DBL1α–CIDR1α, DBL2β-C2
and DBLδ–CIDRβ make up a protein prototype and are found in nearly all PfEMP-1
molecules. By integration of additional domains, the flexibility of protein may increase
and provides an extra advantage, such as the ability to bind multiple receptors (Smithb et
al., 2000).
Figure 1.4. Schematic architecture of PfEMP-1. (a) A small PfEMP-1 protein consists of minimal arrangement i.e. the NTS domain followed by the semi-conserved DBL1α-CIDR1α and the ATS domain. (b) A larger variant of PfEMP-1 including the semi-conserved head structure DBL1α-CIDR1α, tandem association DBL2β-C2 and DBL5δ-CIDR2β and additional DBL and CIDR domain. The host cell receptors involved in binding are indicated at the respective PfEMP-1 binding-domain (Smith et al., 2001).
Introduction ______________________________________________________________________________
9
1.6 var gene family
PfEMP-1 is encoded by the highly divers var gene family consisting of approximately 60
genes per haploid genome. The var genes have two exons with a ~170 bp to 1.2 kb intron.
The first exon is highly polymorphic, encodes the extracellular part of protein and trans-
membrane (TM) domain and varies in size between 3.5 and 9.0 kb. The second exon, in
contrast, is relatively short, more conserved and encodes the intracellular acidic terminal
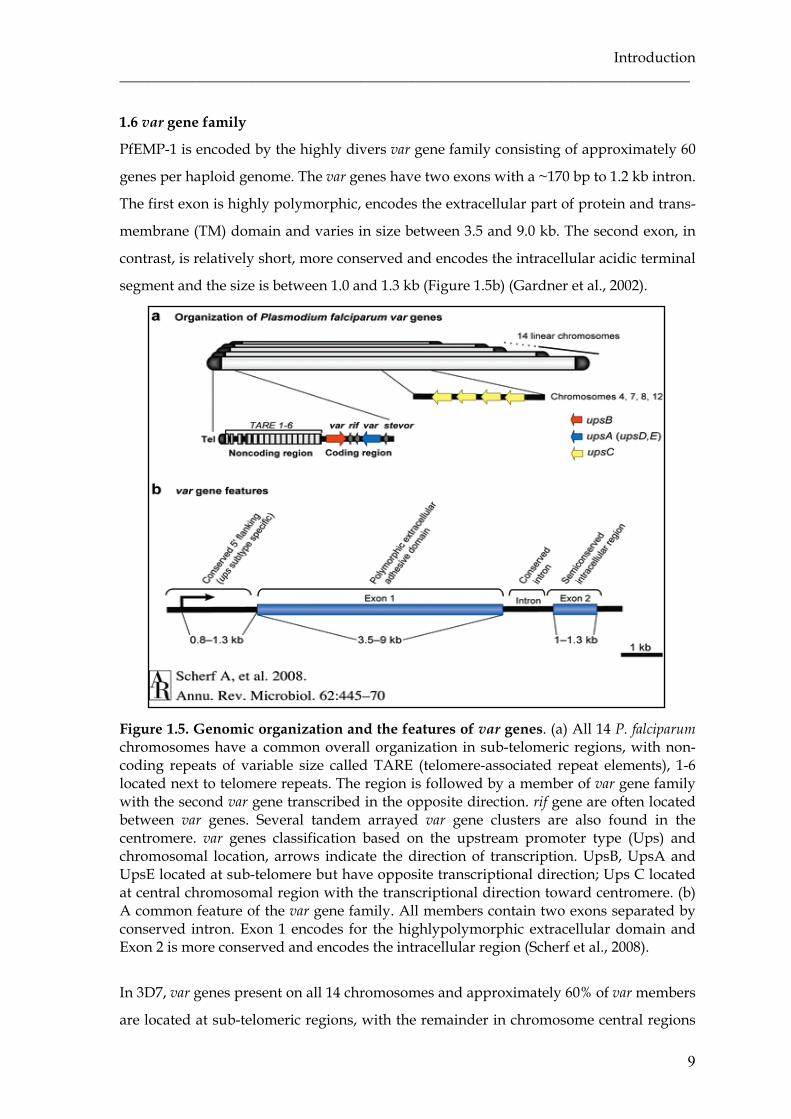
segment and the size is between 1.0 and 1.3 kb (Figure 1.5b) (Gardner et al., 2002).
Figure 1.5. Genomic organization and the features of var genes. (a) All 14 P. falciparum chromosomes have a common overall organization in sub-telomeric regions, with non-coding repeats of variable size called TARE (telomere-associated repeat elements), 1-6 located next to telomere repeats. The region is followed by a member of var gene family with the second var gene transcribed in the opposite direction. rif gene are often located between var genes. Several tandem arrayed var gene clusters are also found in the centromere. var genes classification based on the upstream promoter type (Ups) and chromosomal location, arrows indicate the direction of transcription. UpsB, UpsA and UpsE located at sub-telomere but have opposite transcriptional direction; Ups C located at central chromosomal region with the transcriptional direction toward centromere. (b) A common feature of the var gene family. All members contain two exons separated by conserved intron. Exon 1 encodes for the highlypolymorphic extracellular domain and Exon 2 is more conserved and encodes the intracellular region (Scherf et al., 2008).
In 3D7, var genes present on all 14 chromosomes and approximately 60% of var members
are located at sub-telomeric regions, with the remainder in chromosome central regions

Introduction ______________________________________________________________________________
10
(Gardner et al., 2002). One to three var genes exist at telomeres pointing in different
direction, either in tail-to-tail (most frequent), head-to-tail, or head-to-head orientation
relative to each other with one or more rif gene in between. The central var genes appear
single or in groups that are nearly always tandem arrayed in the head-to-tail orientation,
containing three to seven var genes (Figure 1.5a) (Kyes et al., 2007).
The chromosomal location and orientation of var genes are associated with particular
types of 5’-flanking regions called Ups. Based on the 5’-Ups type, domain structure of
the encoded protein and sequence similarities in coding and non-coding regions, var
genes can be classified into three major group: A, B and C (Gardner et al., 2002; Lavstsen
et al., 2003). UpsA type is located sub-telomeric and transcribed towards the telomere.
UpsB type is telomeric and transcribed towards the centromere, while UpsC type is
located in the center of chromosome (Figure 1.5a). There is also a subset of var genes, the
B/C group, which has UpsB-like promoters but present in central chromosomal regions
and B/A group which present in sub-telomeric chromosomal region but have gene
orientation to centromere (Lavstsen et al., 2003). This general gene organisation is
retained across the parasite isolate; it has been postulated to influence the functional and
antigenic specialization of PfEMP-1 proteins through gene recombination hierarchies
(Kraemer and Smith, 2003).
Apart from var groups A, B, and C, there are three unusual semi-conserved var genes;
var1CSA, var2CSA and type 3 var gene. According to their chromosomal location and
transcriptional direction, var1CSA and var2CSA belong to var group A, however both
have a distinct 5’-Ups, var1CSA has an UpsD, which is now grouped with UpsA
(Kraemer et al., 2007) and var2CSA has an UpsE. And type 3 var has UpsA. All three
genes are exceptionally conserved across parasite isolates and constitute possible gene
orthologs but they share little sequence identity with other members of the var gene
family, posing the hypothesis that these genes primarily undergo self-self recombination
(Kraemer and Smith, 2006).
1.7 var gene diversity
Since the var gene repertoire is around 60 copies per haploid genome, it is not surprising
that large sequence diversity exists between different isolates (Su et al., 1995). A study
using in situ-hybridization techniques found that genetically diverse parasites contained
essentially, although not completely, non-overlapping var gene repertoires, indicating
the extreme diversity of var genes (Freitas-Junior et al., 2000). Global sequence
Introduction ______________________________________________________________________________
11
comparisons have also demonstrated the immensity of var gene diversity with nearly no
overlaps among repertoires from different geographical origins (Barry et al., 2007) nor
between isolates (Kaestli et al., 2004; Bull et al., 2005). However, the mechanisms driving
var gene diversity remain only partially understood. Genetic diversity can be generated
by recombination and rearrangement during the sexual (meiotic) (Taylorb et al., 2000) or
asexual (mitotic) phase of the parasites life cycle (Duffy et al., 2009). A study analyzing
progeny clones from two genetic crosses supported the high rate of recombination in var
genes leading to a new var forms via gene conversion involving the nuclear structure as
the hot spots of recombination (Scherf et al., 2008). Another approach reported that sub-
telomeric var genes are in part responsible for var gene diversity by mechanism of
intragenic recombination and re-arrangement between two var genes (Taylorb et al.,
2000). Recombination preferentially occurs within genes which have a common genome
location and gene orientation, and is likely influenced by 5’-flanking regions and gene
coding similarity (Kyes et al., 2007). This recombination hierarchy may be shaping the
var gene repertoire and influencing the evolution of the gene family.
1.8 Regulation of var gene expression
Several important findings regarding var gene expression have been reported. First,
expression of var genes is stage specific and temporally regulated during parasite
development (Kyes et al., 2000). Second, telomeric as well as centromeric var genes
located on different chromosomes can be selected for expression. Third, the expression
of var genes is mutually exclusive, i.e. only one member of the var gene family is
expressed on the surface of an infected erythrocyte (Chen et al., 1998; Scherf et al., 1998).
The expression of PfEMP-1 is developmentally regulated as the protein appears on the
surface of the infected erythrocyte around 16-18 hours post invasion (Gardner et al.,
1996). The control of var gene transcription is stage-specific and tightly regulated. Two
opposing results from two different approaches were reported. Northern blot analysis
showed that the major var mRNA transcript encoding the PfEMP-1 was present at
maximum amount in late-ring stage (3-18 h post-erythrocyte invasion) declining until
barely detectable over the following 6 h by trophozoite stage, suggesting that the control
of var gene expression is maintained at the level of transcriptional initiation (Kyes et al.,
2000). In contrast were results from reverse transcription-PCR (RT-PCR) experiments
detecting mRNA transcripts within a single IE. Multiple var transcripts were present in
ring stages with one dominant transcript present in the trophozoite stage which implies
a post-transcriptional mechanism of control (Chen et al., 1998; Scherf et al., 1998). Of
Introduction ______________________________________________________________________________
12
interest, a repression of var gene transcription during intra-erythrocytic development of
the parasite occurs at different times depending on the chromosomal location of the var
gene. Sub-telomeric var genes are only expressed up to 18 hours post infection and
inhibition of sub-telomeric var gene transcription occurs between 4 and 8 hours before
transcription of centrally located var genes. This indicates that the structural differences
of the promoter types reflect functional and regulatory differences in transcriptional
repression (Voss et al., 2003).
var gene expression follows the rule of mutually exclusive expression, with only one
gene being expressed by an individual parasite at a given time (Scherf et al., 1998). The
mutually exclusive expression is not based on a negative feedback from the var protein
product itself but regulated at the level of transcription initiation level (Kyes et al., 2007)
and involves multiple layers of control including the epigenetic factors.
The first layer is the structure of the two transcriptionally active promoters of var genes;
one upstream of the first exon (5’ var promoter) encoding mRNA and the second within
an intron (var intron promoter) that leads to expression of sterile (non-coding) RNA and
has regulatory functions both as a silencer and in the recognition of var genes (Deitsch et
al., 2001; Frank et al., 2006; Dzikowski et al., 2007). The interaction between these two
promoters and the presence of sterile RNA (Calderwood et al., 2003; Kyes et al., 2003)
seems to play an important role in the silencing process of var genes.
The second layer is the epigenetic memory of var genes, i.e. once the transcriptional
status of an individual var gene has been established, the state (either active or silent)
tends to be maintained through multiple cell cycles with only rare switching (Horrocks
et al., 2004; Frank et al., 2007). Thus, the transcriptional state of each gene is
‘remembered’ from one cell cycle to the next and this memory is encoded into the
genome through a series of ‘marks’ placed at each gene. In addition, the particular
modification of histone including acetylation and methylation plays a significant role in
‘bookmarking’ either active or silent genes (Duraising et al., 2005, Freitas-Junior et al.,
2005; Comeaux and Duraising, 2007).
The third layer is the sub-nuclear organization, where the silent genes tend to localize
within regions of the nucleus that contain primarily condensed heterochromatin and
active transcription commonly takes place in euchromatic regions in which chromatin is
loose and open for transcription. Study using var-specific probes showed that all var
genes localize mostly at the nuclear periphery regardless of chromosomal location or
their activation state and var genes appear to move upon changes in their transcriptional
Introduction ______________________________________________________________________________
13
activity. A model was proposed that the telomeric clusters are located within
heterochromatin region of the nuclear periphery whereas upon activation it moves to
another location of the nuclear periphery where the chromatin is open for transcription
(Ralph et al., 2005).
1.9 Antigenic variation and var gene switching
P. falciparum is able to avoid clearance by the human immune system which depends on
its capacity to continuously alter the surface exposed antigenic proteins which are
vulnerable to antibody recognition and attack, this process is called antigenic variation
(Dzikowski and Deitsch, 2009). The antigenic variation mechanism is carried out by
successive switching of expression of var gene family members (Horrocks et al., 2004).
This allows parasites to modify the antigenic and functional properties of IE resulting in
modified adhesive phenotypes and possibly altered virulence. Moreover, antigenic
variation allows parasites to establish persistent chronic infections.
In vitro observation has shown that the rate of switching is an intrinsic property of each
var gene, different var genes switch on and off at different rates, and no preferential
switching between central or telomeric var gene occurs (Horrocks et al., 2004). However,
another study suggested that switching relies on an epigenetic process and correlates
with chromosomal location, and that in clonal parasite populations, central var genes
have extremely stable expression pattern and rarely undergo transcriptional switches in
the absence of selection. Sub-telomeric var genes on the other hand readily switched to
alternative var loci (Frank et al., 2007).
Parasites cultured in vitro switched spontaneously at a rate of 2% in the absence of
immune pressure (Roberts et al., 1992). If the in vivo switching rate would occur to the
same degree, the parasite would exhaust its variant repertoire, instead of new
repertoires of variant antigens becoming available for selection through recombination
events. Nevertheless, by combining new data derived from naive human hosts with a
simulation model, data suggest that during the acute stage of infection, switching rates
per generation is ∼18%, this is even much faster than initially thought (Gatton et al.,
2003), so it is likely that switching rate has a wide range.
The signals controlling the switching of expression within the parasite are unclearly
defined. Some evidences suggest that there is a communication between the host and the
parasite and the homologous anti-variant antibody acts as a signal from host to parasite
to induce switching (Brown, 1973).

Introduction ______________________________________________________________________________
14
1.10 Cytoadherence and its consequence on clinical manifestation
P. falciparum is able to modify both of the membrane, cytoplasma and the surface of the
infected erythrocytes (IE). By these modifications, the parasite is enabled to adhere to
other host cells during trophozoite and schizont stages, called cytoadherence (Moxon et
al., 2011). Three major types of cytoadherence have been described: sequestration if the
IE adhere to endothelial cells (Udeinya et al., 1981), rosetting if IE bind to uninfected
erythrocytes (Udomsangpetch et al., 1989) and auto-agglutination or clumping if the
activated platelets bind with IE, forming a large cluster of cells (Pain et al., 2001).
Sequestration
P. falciparum-infected erythrocytes are found to be sequestered in various organs
including brain, heart, lung, liver, kidney, sub-cutaneous tissues and placenta (Miller,
1969; Yamada et al., 1989). Through successive cycles of sequestration and
multiplication, parasites reach sufficient densities in micro-vascular beds to cause both
organ specific and systemic disease. While sequestration is essential for the parasite’s
survival by evasion of the spleen clearance mechanisms, it has severe consequences for
the host. Parasite’s sequestration will occlude the capillary blood vessels, leading to
hypoxia, metabolic acidosis and dysfunction of affected organs. Massive sequestration in
the brain is believed as the underlying cause of coma in cerebral malaria, involving the
role of host receptor intercellular adhesion molecule-1 (ICAM-1) (Chen et al., 2000). In
addition, binding of IE to syncytiotrophoblasts resulting in placental sequestration
occurs in pregnancy-associated malaria (PAM).
Rosetting
Another type of cytoadherence, the adhesion of IE to uninfected erythrocytes, is called
rosetting. Rosetting has been observed in the peripheral blood of patients with acute
severe malaria and in blood vessels during autopsy of malaria victims (Riganti et al.,
1990; Ho et al., 1991; Scholander et al., 1996). Some studies with largely different
geographical and epidemiological setting also reported an association between rosetting
forming capacity and disease severity (Carlson et al., 1990; Treutiger et al., 1992; Rowe et
al., 1995; Udomsangpetch et al., 1996; Newbold at al., 1997; Kun et al., 1998; Heddini et
al., 2001). Others reported that antibodies which disrupt rosettes are less common in
individuals with clinical disease (Carlson et al., 1990; Reeder et al., 1997) and serum from
severe malaria patients usually contains a low titer of anti-rosette antibodies, while

Introduction ______________________________________________________________________________
15
patients with uncomplicated malaria have a higher titer of anti-rosette antibodies
(Barragan et al., 1998; Treutiger et al., 1992).
Rosetting has a masking effect for IE. As the IE is in the middle and completely covered
by uninfected erythrocytes, no antibodies or immune systems can recognize and
eliminate the parasites. The aggregation of erythrocytes even enhances the negative
effect of sequestration, because constricted capillaries due to sequestered IE, may be
completely blocked by floating rosettes. In post-capillary venules, IE adhered to the
endothelium and the uninfected erythrocytes formed rosettes on top of the adherent
cells (Kaul et al., 1991), suggesting linked similar phenotypes between rosetting and
sequestration. Some erythrocyte-rosetting receptors are also expressed on the endothelial
cells, indicating a dual role in endothelial cytoadherence and rosetting (Vogt et al., 2003).
This phenomenon is observed in the peripheral blood of patients with severe malaria
and is thought to be an underlying cause of coma (Scholander et al., 1996).
Auto-agglutination and clumping
The ability of IE to adhere to neighbouring IE and thereby forming large aggregates
without involving any uninfected erythrocytes is termed as auto-agglutination. This
phenomenon is common in natural infections and a correlation with the disease severity
has been shown (Roberts et al., 2000). Clumping is another adhesive phenomenon
presented by IE, it is mediated by platelets and involved CD36 as a receptor adjoining IE
to form large clumps (Wahlgren et al., 1995; Pain et al., 2001). Platelets serve as a bridge
between CD36 and the surface of endothelial cells, providing receptors for adhesion to
microvasular beds that otherwise lack adhesion receptors (Wassmer et al., 2004).
However, not all CD36 binding isolates show this phenotype, indicating the involvement
of other receptors. A platelet-mediated clumping varies between parasite isolates. Some
studies reported a significant association of clumping with severe malaria (Pain et al.,
2001; Chotivanich et al., 2004; Wassmer et al., 2008).
1.11 Host receptors involved in cytoadherence
The affinity of P. falciparum for binding to endothelial cell receptors is diverse, as its role
in sequestration and also depends on the host receptor specificity. Infected erythrocytes
are able to bind to a range of host receptors with each parasite having the ability to bind
a subset of them only.
Numerous host receptors mediating binding to the IE have been identified. CD36
(Barnwell et al., 1985; Ockenhouse et al., 1989), thrombospondin (TSP) (Roberts et al.,

Introduction ______________________________________________________________________________
16
1985), intercellular adhesion molecule-1 (ICAM-1) (Berendt et al., 1989), platelet
endothelial cell adhesion molecule-1 (PECAM-1/CD31) (Treutiger et al., 1997), vascular
cell adhesion molecule-1 (VCAM-1), endothelial leukocyte adhesion molecule (ELAM)
(Ockenhouse et al., 1992), E-selectin (Ockenhouse et al., 1992) and P-selectin
(Udomsangpetch et al., 1997) are involved as receptors in the binding to endothelial
cells. Chondroitin sulfate A (CSA) (Robert et al., 1995; Rogerson et al., 1995), hyaluronic
acid (HA) (Beeson et al., 2000) and IgG (Flick et al., 2001) are the main receptors involved
in sequestration in placental malaria.
ICAM-1
ICAM-1 is an 80-114 kDa glycosylated variabel membrane glycoprotein consisting of five
Ig-like domains. It belongs to the immunoglobulin superfamily and is expressed on the
surface of a wide range of cell types including endothelial cells and leukocytes (van de
Stolpe and van der Saag, 1996; Ho et al., 2000). ICAM-1 is widely expressed on cerebral
endothelium and leukocytes, and up-regulated by pro-inflammatory cytokines such as
tumor necrosis factor (TNF-α). ICAM-1 has implicated to play a role in severe disease
because the adhesion to ICAM-1 tended to be higher in patients with cerebral malaria
(Newbold et al., 1997). In addition, there was a co-localization of ICAM-1 with parasite
sequestration in brain vessels in autopsy samples from cerebral malaria patients (Turner
et al., 1994). Further, up-regulation of ICAM-1 expression on endothelium during
malaria infection was observed (Turner et al., 1998).
A high frequency mutation in ICAM-1, called ICAM-1kilifi, was present in individuals
from East and West Africa but absent in Europeans (Fernandez-Reyes et al., 1997). The
studies on the effect of this mutation on susceptibility to severe malaria showed
conflicting results. A study in Kenyan children found that homozygotes for this
mutation were found to be at a two-fold higher risk of cerebral malaria than controls
(Fernandez-Reyes et al., 1997), but another study in West Africa (Gambia and Gabon)
reported the opposite association (Bellamy et al., 1998; Kun et al., 1999).
Using a genome-wide approach, it was shown that only some PfEMP-1 variants
containing the DBLβ-C2 domain are able to bind to ICAM-1 (Howell et al., 2008). The
low affinity of most malaria parasites for this receptor indicates that ICAM-1 only
mediates IE rolling on the endothelial lining; stable binding most likely occurs
synergistically with other receptors such as CD36 (McCormic et al., 1997).
Introduction ______________________________________________________________________________
17
CD36
CD36 is an 88-kDA glycoprotein scavenger receptor found on the surface of various cells
including platelets, macrophages, monocytes, leukocytes, dendritic cells, epithelial cells
and microvascular endothelial cells (Greenwalt et al., 1992). CD36 expression on cerebral
endothelium of cerebral malaria patients was very little, but there was ubiquitously on
lung, liver, kidney, skin and muscle vasculature (Turner et al., 1994; Turner et al., 1998).
In contrast with ICAM-1 expression, CD36 and TSP are not sensitive to IFNγ or TNFα
stimulation. Binding to CD36 and likewise to TSP seems to be a constitutive feature of
most adherent parasite (Ockenhouse et al., 1991; Newbold et al., 1997), although binding
to these receptors does not correlate with severity of disease (Turner et al., 1994;
Newbold et al., 1997).
Thrombospondin (TSP)
TSP is an adhesive glycoprotein released into plasma in response to platelet activation
by thrombin. IE bind to purified TSP in static assays and bind to endothelial cells via
TSP under flow conditions (Heddini et al., 2001; Roberts et al., 1985). A study
investigating the association of TSP binding with severe malaria found that although
most Kenyan field isolates adhered well to TSP in static assays, there was no correlation
with disease severity (Heddini et al., 2001).
P-selectin
P-selectin (CD62P) is a glycoprotein that express on activated platelets and endothelial
cells and is important for leukocyte trafficking. Studies in Thai field isolates showed that
P-selectin mediates rolling of IE on endothelial cells and facilitates adhesion to CD36
(Yipp et al., 2007; Udomsangpetch et al., 1997; Ho et al., 1998).
PECAM-1/CD31
PECAM-1/CD31 is widely expressed on endothelial cells, monocytes, platelets and
granulocytes. IE bind to PECAM-1 on endothelial cells, and the binding site has been
mapped to the first four immunoglobulin-like domains of PECAM-1. Parasite binding to
PECAM-1 is up-regulated by IFN-γ. Although PECAM-1 binding parasites were almost
as frequent as CD36-binding parasites in Kenyan isolates and parasites from patients
with severe manifestation had a greater tendency to bind PECAM-1, the correlation with
malaria severity was not significant (Heddini et al., 2001).

Introduction ______________________________________________________________________________
18
VCAM-1 (CD106)
VCAM-1 is a member of the immunoglobulin superfamily and expressed by cytokine-
activated endothelium. Thai field isolates were shown to bind and roll on VCAM-1, but
static adhesion did not occur. In African isolates, binding to VCAM-1 was extremely low
and not associated with disease severity (Newbold et al., 1997).
E-selectin (CD62E)
E-selectin is a glycoprotein expressed on endothelial cells at sites of inflammation. In
African isolates, E-selectin binding was extremely low and not associated with disease
severity. The role of E-selectin in cytoadherence is thus probably minor (Newbold et al.,
1997).
CSA and HA
CSA and HA are especially well expressed on the surface of syncytiotrophoblast layer of
the placenta. They mediate sequestration in pregnancy-associated malaria (PAM)
(Beeson et al., 2000; Beeson et al., 1999; Maubert et al., 2000). Further, parasite binding to
immunoglobulins may contribute to IE sequestration in the placenta. Immunglobulins
act as a bridge between PfEMP-1 and the placenta, thereby assisted by CSA in placental
adhesion (Flick, 2001; Rasti et al., 2006). Several studies have shown that parasite isolated
from infected placenta typically adhere to CSA and/or HA but not to endothelial
receptors such as ICAM-1 and CD36, and they do not form rosettes. Parasites isolated
from children or non-pregnant adults, showed little or no adherence to CSA (Beeson et
al., 1999).
A number of different erythrocyte surface ligands are described to be involved in
rosetting, including the blood group A and B antigens (Barragan et al., 2000),
complement receptor 1 (CR1) (Rowe et al., 1997), heparan sulphate (HS) (Rogerson et al.,
1994; Rowe et al., 1994; Vogt et al., 2004), CD36 and glycosaminoglycans (GAGs)
(Scholander et al., 1996; Chen et al., 1998; Handunnetti, 1989). All receptors are
glycosylated, indicating that it is crucial for the interaction.
A and B blood group antigens
The A and B blood group sugars are trisacharides attached to a variety of erythrocyte
glycoproteins and glycolipids, and are also found on platelets, leukocytes and
Introduction ______________________________________________________________________________
19
endothelial cells. All isolates tested showed a high preference for either A or B blood
group erythrocytes (Udomsangpetch et al., 1993). Further, individual with blood A
group antigen phenotype were more likely to suffer severe malarial disease and coma
than those of other blood group (Fischer and Boone, 1998). Human genetic studies
support a direct role of A- and B-mediated rosetting in the pathogenesis of severe
malaria, because blood group O reduces rosetting in field isolates and confers significant
protection against severe malaria (Rowe et al., 2007; Fry et al., 2008; Pathirana et al.,
2005).
Complement Receptor 1 (CD35)
CR1 is a complement regulatory protein and widely distributed on the surface of
erythrocytes, leukocytes and dendritic cells (Khera and Das, 2009). It is an important
rosetting receptor, since individual with CR1-deficiency was associated with protection
from severe malaria (Cockburn et al., 2004). Some parasites cultured in CR1-deficient
erythrocyte lose their capacity to form rosettes. Further, a monoclonal antibody against
CR1 reverses rosetting, and deletion mutant of CR1 reverses rosetting in both laboratory
and field strains (Rowe et al., 1997; Rowe et al., 2000).
Heparan Sulphate (HS) and Glycosaminoglycan (GAG)
Heparan sulphate (HS) and glycosaminoglycan (GAG) are involved in binding of
rosetting IE to endothelial cells (Chen et al., 1998). The rosettes of most wild isolates can
be disrupted by GAG, suggesting that malaria parasites use a GAG on the surface of
erythrocyte as a rosetting receptor (Rogerson et al., 1994). GAG disrupts rosettes of
FCR3S1 parasites and block rosette formation (Barragan et al., 1999). In a Kenyan field-
isolate study, binding of fluorescently labeled heparin was significantly higher in isolates
from patients with severe malaria than those from uncomplicated disease, supporting a
role of HS in severe malaria (Heddini et al., 2001).
1.12 The role of PfEMP-1 in cytoadherence
A lot of receptors have been described to be involved in cytoadherence in human hosts,
but only few molecules from parasites have been proposed to serve as ligands for
cellular adhesion. The best characterised molecule involved in cytoadherence is the
PfEMP-1. PfEMP-1 is deposited on the surface of IE on knob-like structure from
approximately 18 hours post invasion onwards. The interaction between PfEMP-1 with a
large number of different host receptors requires several binding domains in the PfEMP-
Introduction ______________________________________________________________________________
20
1 protein. The sequencing of var genes has enabled the mapping of specific receptor
binding sites within PfEMP-1. There are several binding sites for numerous host
receptors at the N-terminal of extracellular domain of PfEMP-1.
DBL1α
It is known that P. falciparum strain R29 binds CR1 on unifected erythrocytes via DBL1α
domain to form rosettes (Rowe et al., 1997; Chen et al., 1998). The DBL1α domain also
mediates heparin sulphate binding leading to sequestration. Binding residues for the
CR1 lie in the central region of R29-DBL1α between conserved cysteine C5 and C12.
A specific variant from a rosetting parasite clone binds to the blood group A trisacharide
via the DBL1α domain to form rosettes (Chena et al., 2000). Although the majority of var
genes appear to have a DBL1α domain, not all parasite isolates form rosettes or adhere
to the receptors involved. It is important to stress that not all expressed var genes have
the same binding properties and domain-specific binding varies considerably between
var genes.
CIDR1α
CIDR1α is the domain mediating binding to CD36. Binding to CD36 is interesting as it is
a feature of many parasite isolates (Ockenhouse et al., 1991, Newbold et al., 1997).
Sequence analysis from diverse parasites corresponding to the CD36 binding region
showed that CIDR1α sequences were not identical but displayed some homology,
presented by a conservation of cysteine residues at the end of the fragment (Baruch et al.,
1997).
An exception to CIDR1α-mediating binding to CD36 is an in vitro-selected CSA-binding
parasite isolate, which revealed CSA-binding through a CIDR1α domain. As a
consequence of binding to CSA through the same CIDR1α domain, CSA and CD36-
binding are mutually exclusive phenotypes (Gamain et al., 2002). In addition, CIDR1α
together with DBL2δ domains of specific PfEMP-1 variants are thought to have binding
capability to PECAM-1 (Chena et al., 2000).
DBLβ-C2
DBLβ-C2 is a PfEMP-1 domain mediating binding to ICAM-1. Binding residues for
ICAM-1 lie in the central and terminal region of DBLβ-C2 domain between conserved
cysteine C3 and C16 for ICAM-1 binding isolates ((Smitha et al., 2000; Mayor et al., 2005;
Introduction ______________________________________________________________________________
21
Springer et al., 2004). Alignment of ICAM-1 binding DBLβ-C2 domains from three
isolates (A4, A4tres and JDP8) revealed significant homology sharing 16 conserved
cysteine residues and a number of conserved hydrophobic amino acid residues,
indicating conservation of the structure as well as three-dimensional structure.
Furthermore, multiple sequence alignments of ICAM-1 binding and non binding DBL2β-
C2 domains suggested that the binding region for ICAM-1 is unlikely to lie in a linear
sequence stretch within DBL2β-C2 (Chattopadhyay et al., 2004).
DBLγ
Although DBLγ domain has been linked to CSA binding, many expressed DBLγ domains
do not bind CSA. One of the DBLγ domain binding CSA is expressed by the
FCR3varCSA gene (Buffet et al., 1999). The binding residues for CSA from FCR3varCSA
lie in the central region of DBLγ between cysteines 5 and 8 (Mayor et al., 2005). But,
among those domains that bind CSA there are varying amounts both of homology and
diversity in sequence without any clear conserved areas (Gamain et al., 2004). Of
interest, var2CSA gene which is dominantly transcribed in many placental isolates and
CSA-selected isolates, has an atypical structure lacking both DBLγ and CIDR1α domains
instead possessing three DBLχ-type and three DBLε-type domains (Salanti et al., 2003).
However, the role of var2CSA in CSA binding remains controversial, as the expression
analysis of membrane proteins in placental and CSA-binding isolates showed that
neither var2CSA nor FCR2varCSA were preferentially expressed on the surface of IE
(Fried et al., 2004).
Finally, the CD31/PECAM binding was reported to be mediated by CIDR1α, DBL2δ and
the DBL5δ domain.
The phenotype associations and both host receptors and P. falciparum ligands involved
are summarized in table 1.1.

Introduction ______________________________________________________________________________
22
Tabel 1.1. Host cell receptors and P. falciparum ligands involved in cytoadherence.
Host receptors Receptor location Parasite ligands
(domain)
Sequestration
TSP Endothelium, serum PfEMP-1
CD36 Endothelium, Erythrocyte PfEMP-1 (CIDR1α)
ICAM-1 (CD54) Endothelium PfEMP-1 (DBLβ-C2)
PECAM-1 (CD31) Endothelium, Monocyte PfEMP-1 (CIDR1α and
DBL2δ)
VCAM-1 (CD106) Endothelium ?
ELAM-1 (E-selectin = CD62E) Endothelium ?
P-selectin (CD62P) Endothelium, Platelet PfEMP-1
CSA Endothelium PfEMP-1 (DBL3γ, CIDR1α)
Rosetting
A and B blood group Erythrocyte PfEMP-1 (DBL1α)
CR1 (CD35) Erythrocyte PfEMP-1 (DBL1α)
CD36 Erythrocyte, Endothelium PfEMP-1 (CIDR1α)
HS Endothelial, aorta PfEMP-1 (DBL1α)
GAG Erythrocyte PfEMP-1 (DBL1α)
IgM and IgG Serum PfEMP-1 (CIDR1α, DBL2β)
Clumping
CD36 Platelet ?
gC1qR/HABP1/p32 Platelet, Endothelium ?
P-selectin Platelet ?

2. OBJECTIVES
1. Analysis of P. falciparum var gene sequences from Indonesian’s field isolates
Specific objectives of this topic:
- To assess the overall diversity of P. falciparum var genes from Indonesian’s field
isolates.
- To identify an association of restricted motifs in the DBL1α domain with clinical
outcome in malaria.
- To investigate a potential association of transcribed specific genotypes of var
genes with the manifestation of severe malaria.
2. Analysis of P. falciparum DBLβ-C2 domains
Specific objectives of this topic:
- To explore the P. falciparum DBLβ-C2 sequences from Indonesian’s field isolates.
- To construct recombinant pDBLβC2 domains from severe and uncomplicated
malaria patients and assess the binding capacity of recombinant pDBLβC2 with
ICAM-1.
3. Detection of human P. knowlesi infection
Specific objectives of this topic:
- To identify naturally acquired human infections of P. knowlesi from Indonesian
samples.
- To investigate whether the available specific primers are sensitive and specific to
diagnose P. knowlesi infection.

Objectives ______________________________________________________________________________
24

3. MATERIALS AND METHODS
3.1 Materials
3.1.1 Study Site
The study outlined in this thesis was carried out at the Saiful Anwar hospital, Malang,
East Java province and Pelaihari district, South Kalimantan province, Indonesia (Figure
3.1). The Saiful Anwar hospital serves as a referral hospital for the Eastern part of
Indonesia, an area of moderate to high malaria endemicity. Most of the inpatient malaria
cases in the Saiful Anwar hospital are imported cases from other areas such as Papua,
Kalimantan or Nusa Tenggara, and the majority of patients suffered from severe malaria.
Pelaihari district is located in South Kalimantan province, the region presents a range of
different endemicity and environments, including coastal and hilly area with swamps
and tropical climate. The climate is characterised by high temperature ranging between
15.6°C and 26.9°C and heavy rainfall ranging between 75 mm and 426 mm annually,
especially during October to May. Humidity ranges between 77% and 91%.
Figure 3.1. P. falciparum malaria endemicity class in Indonesia (Elyazar et al., 2011). The blue dot shows the hospital where severe malaria patients were recruited. The circled areas are originated location of the samples: South Kalimantan and Papua province, the areas of moderate to high malaria endemicity in Indonesia.
3.1.2 Sample collection
Blood samples were collected from P. falciparum malaria patients. Patients were
categorised as having either severe or uncomplicated malaria based on the clinical and
laboratorical criteria of WHO for malaria disease.

Materials and Methods ______________________________________________________________________________
26
Inclusion criteria :
1. Patients age > 3 years old
2. Patients body weight >13 kg
3. Uncomplicated P. falciparum malaria: symptomatic malaria without signs of
severity and/or evidence (clinical or laboratory) of vital organ dysfunction as
found in severe malaria.
• Parasite density <5%
• Axillary temperature ≥ 37.5°C or recorded history of fever within the
preceding 24 hrs
• Symptoms: headache, lassitude, fatigue, abdominal discomfort, and muscle
and joint aches, followed by fever, chills, perspiration, anorexia, vomiting and
worsening malaise.
4. Severe malaria: infection with P. falciparum with one or more of the following
clinical symptom or laboratory test:
• Coma (cerebral malaria) with abnormal behaviour, impairment of
consciousness, seizures, coma, or other neurologic abnormalities
• Prostration
• Acute pulmonary oedema or acute respiratory distress syndrome (ARDS)
• Circulatory collapse and shock, systolic blood pressure <70 mmHg in adult
and <50 mmHg in children
• Hepatic dysfuntion, clinical jaundice, bilirubin >3 mg%
• Haemoglobinuria
• Disseminated intravascular coagulation
• Metabolic acidosis
• Severe renal failure, creatinin >3mg%
• Severe anaemia, haematocrit < 15% or Hb < 6g/dl
• Hypoglycaemia, blood glucose < 40 mg/dl
• Hyperparasitaemia > 5%
5. Signed informed consent by the patient or the legal representative
Exclusion criteria:
1. Adequate anti-malarial treatment within previous 7 days
2. Mixed plasmodial infection
The study approved by Health Research Ethics Committee of the University of
Brawijaya, Indonesia. Malaria patients were enrolled only after informed consent was
Materials and Methods ______________________________________________________________________________
27
signed.
3.1.3 Reagents and Kits
Reagent Company Acetic acid Merck, Darmstadt, Germany Ampicillin sodium-salt Sigma-Aldrich, Steinheim, Germany β-mercaptoethanol Sigma, Steinheim, Germany Big dye terminatorTM mix (V3.1) PE Applied Biosystem, CA, USA Bovine serum albumin (BSA) Sigma, Steinheim, Germany Chelex 100 Biorad, Munich, Germany d2H2O Millipore, Eschborn, Germany Deoxyribonuclease Invitrogen, Carslbad, USA Dimethyl sulfoxide (DMSO) Sigma-Aldrich, Steinheim, Germany Dithiothreitol (DTT) Invitrogen, Carlsbad, CA, USA DMEM Gibco, Paisley, UK DNA ladder 1kb Invitrogen, Carlsbad, CA, USA DNA ladder 100 bp Invitrogen, Carlsbad, CA, USA DNase I Qiahen, Hilden, Germany dNTP mix (PCR grade) GeneAmp, Applied Biosystem, USA D-PBS Gibco, Paisley, UK Dye-Ex Spin kit Qiagen, Hilden, Germany Dynabeads M-280 Invitrogen, CA, USA Ethylenediaminetetraacetic acid (EDTA) Sigma, Steinheim, Germany Ethanol 70% Merck, Darmstadt, Germany Ethanol 96% Merck, Darmstadt, Germany Ethidium bromide Carl Roth, Karlsruhe, Germany Fetal bovine serum (FBS) Gibco, Paisley, UK Ficoll (type 400) Sigma, Steinheim, Germany Flow fix, 2% paraformaldehyde Polysciences, Eppelheim, Germany Fluoromount-G Southerbiotech, Birmingham, USA GelRed Nucleic acid stain 10.000x in water Biotium, Darmstadt, Germany Gentamycinsulphat Sigma-Aldrich, Steinheim, Germany Giemsa stain Sigma, Steinheim, Germany Glucose Merck, Darmstadt, Germany Glycerol Merck, Darmstadt, Germany HEPES (N-(2- Hydroxyethyl) piperazine-N´- 2-ethanesulfonic acid)
Sigma, Steinheim, Germany
HiDi Formamide Applied Biosystem, Warrington, UK Hydrochloric acid (0.1 N) Merck, Darmstadt, Germany Hydrogen peroxide (H2O2) solution 35% Sigma, Steinheim, Germany Hypoxantine Sigma, Steinheim, Germany Isopropylthio-β-galactoside (IPTG) Invitrogen, CA, USA Isopropanol Carl Roth, Karlsruhe, Germany LB agar Sigma-Aldrich, Steinheim, Germany LB broth Sigma-Aldrich, Steinheim, Germany Lichrosolv water Merck, Darmstadt, Germany Lipofectin transfection reagent Invitrogen, CA, USA LongAmp Taq DNA polymerase NewEngland Biolabs, Schwalbach, Germany MgCl2 Sigma-Aldrich, Steinheim, Germany Methanol Merck, Darmstadt, Germany OligodT primer Invitrogen, CA, USA Opti-MEM reduced serum medium Gibco, Paisley, UK pGEM-T Easy vector Promega, Madison, USA Phenol/chloroform/isoamylalcohol (25:24:1)
Merck, Darmstadt, Germany

Materials and Methods ______________________________________________________________________________
28
Plasmid mini kit Qiagen, Hilden, Germany Polyethylenglycol (PEG) 4000 Merck, Darmstadt, Germany Potassium acetate Sigma, Steinheim, Germany Qiamp DNA blood mini kit Qiagen, Hilden, Germany Qiamp RNA blood mini kit Qiagen, Hilden, Germany Qiashredder column kit Qiagen, Hilden, Germany QuickLyse miniprep kit Qiagen, Hilden, Germany Random hexamer primer p(dN)6 Invitrogen, CA, USA Restriction enzymes MBI Fermentas, St Leon-Rot, Germany Restriction enzymes NewEngland Biolabs, Schwalbach, Germany RNeasy mini kit Qiagen, Hilden, Germany RPMI 1640 Sigma-Aldrich, Steinheim, Germany SOC medium NewEngland Biolabs, Schwalbach, Germany SeaKem agarose Cambrex Bio Science Rockland, USA Sodium chloride (NaCl) Merck, Darmstadt, Germany Sodium hydroxide (NaOH) Merck, Darmstadt, Germany Superscript II reverse transcriptase Invitrogen, CA, USA T4 DNA ligase Invitrogen, CA, USA Taq DNA polymerase MP Biomedical, Germany Tris (2-hydroxymethyl-aminomethan) GE health care, Biosciences AB, Uppsala,
Sweden Triton-X Carl Roth, Karlsruhe, Germany Tryple express, stable trypsin Gibco, Paisley, UK Trypan blue Sigma Aldrich, Steinheim, Germany Tween 20 Merck, Hohenbrunn, Germany Ultrafree-DA extraction kit Millipore, Karlsruhe, Germany Whatman filter paper GE Health care, England X-gal (5-Bromo-4-Chloro-3-indolyl a-Dgalactopyranoside)
Invitrogen, CA, USA
3.1.4 Sundry Materials
Material Company Cell Culture well Corning, USA Coverslip EMS, USA Cryotube vials Nalge Nunc, Thermo scientific, Denmark Centrifuge tubes Corning, Mexico Filter units Millipore, Belford, USA Inoculation loop, sterile Greiner bio-one, Frickenhausen, Germany Microcentrifuge tubes Eppendorf, Hamburg, Germany Microscope slide Menzel-Gläser, Thermo scientific,
Braunschweig, Germany Needle B. Braun, Emmenbruecke, Germany Petridishes Nunc, Thermo scientific, Germany Pipette tips Kisker, Steinfurt, Germany Syringe B. Braun, Emmenbruecke, Germany Strypette Corning, USA Surgical scalpels Aesculap, B.Braun, Tuttlingen, Germany Tissue culture flasks TPP, Switzerland
3.1.5 Buffers and Solutions
Buffers and solutions used in molecular biology
Name Components 5x DNA Ligase reaction buffer 250 mM Tris-HCl pH 7.6

Materials and Methods ______________________________________________________________________________
29
(Supplied with T4 DNA Ligase) 50 mM 5 mM 5 mM 25 %
MgCl2
ATP DTT PEG 8000 Storage : -20oC
1x Tango buffer (Restriction enzyme buffer), Fermentas
33 mM 10 mM 66 mM 0.1 mg/ml
Tris-acetate pH 7.9 Mg acetate Potassium acetate BSA Storage: -20oC
1x NE Buffer 4 50 mM 20 mM 10 mM 1 mM
Potassium acetate Tris-acetate Mg acetate DTT pH 7.9 at 25oC Storage: -20oC
1x LongAmp Taq reaction buffer 60 mM 20 mM 2 mM 3% 0.06% 0.05%
Tris-SO4
(NH4)2SO4
MgSO4
Glycerol NP-40 Tween-20 Storage: -20oC
1x PCR buffer with Mg 10 mM 50 mM 1.5 mM 0.1% 0.2mg/ml
Tris-HCl KCl MgCl2
Triton X100 BSA Storage: -20oC
Buffer for plasmid preparation Solution I (resuspend buffer)
50 mM 25 mM 10 mM
Glucose Tris-HCl pH 8.0 EDTA pH 8.0 Storage : 2-8 oC
Solution II (lysis buffer) 1 % 0.2 N
SDS NaOH Storage : 15-25 oC
Solution III (neutralization buffer) 10 M 5 M
Potassium acetate pH 4.8 Acetic acid Storage : 15-25 oC
10x TAE (Tris-acetate-EDTA) buffer
0.4 M 0.2 M 10 mM
Tris Acetic acid EDTA pH 8.3 Storage : 20oC 10x TAE buffer was purchased from Carl Roth, Karlsruhe, Germany
10x TAE buffer light 0.4 M 1 mM
Tris-acetate EDTA pH 8.3 Storage : 20oC
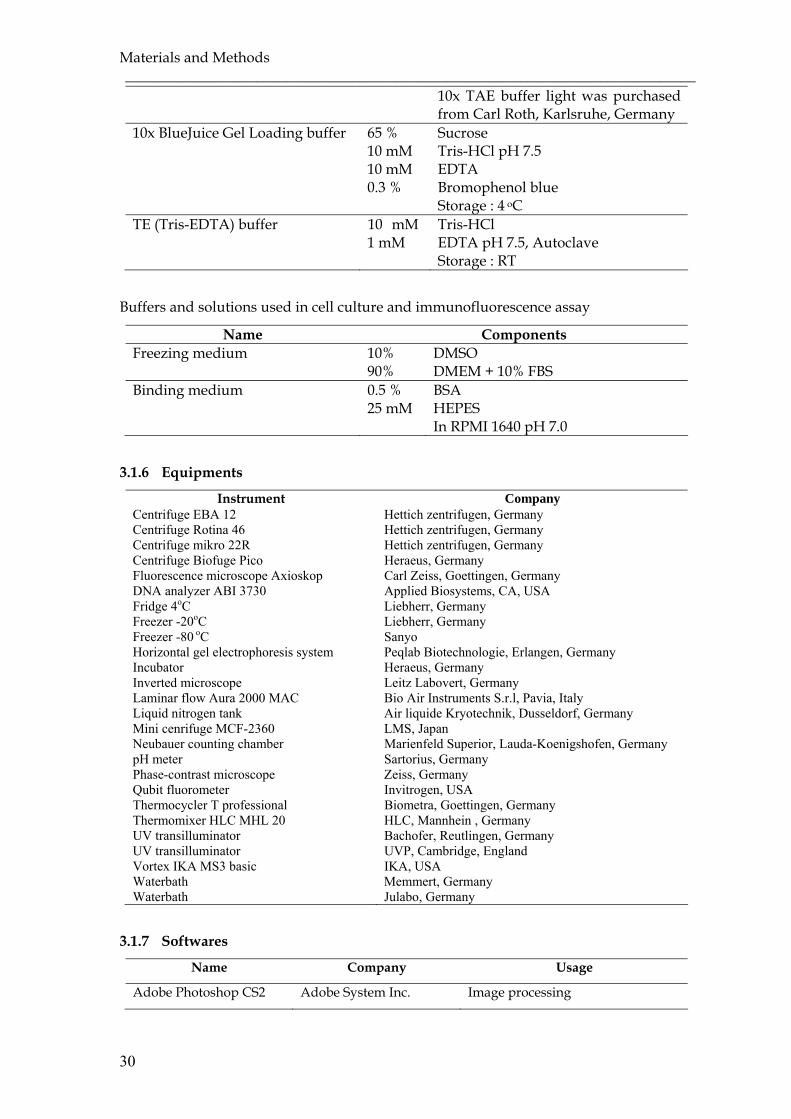
Materials and Methods ______________________________________________________________________________
30
10x TAE buffer light was purchased from Carl Roth, Karlsruhe, Germany
10x BlueJuice Gel Loading buffer 65 % 10 mM 10 mM 0.3 %
Sucrose Tris-HCl pH 7.5 EDTA Bromophenol blue Storage : 4 oC
TE (Tris-EDTA) buffer 10 mM 1 mM
Tris-HCl EDTA pH 7.5, Autoclave Storage : RT
Buffers and solutions used in cell culture and immunofluorescence assay
Name Components Freezing medium 10%
90% DMSO DMEM + 10% FBS
Binding medium 0.5 % 25 mM
BSA HEPES In RPMI 1640 pH 7.0
3.1.6 Equipments
Instrument Company Centrifuge EBA 12 Hettich zentrifugen, Germany Centrifuge Rotina 46 Hettich zentrifugen, Germany Centrifuge mikro 22R Hettich zentrifugen, Germany Centrifuge Biofuge Pico Heraeus, Germany Fluorescence microscope Axioskop Carl Zeiss, Goettingen, Germany DNA analyzer ABI 3730 Applied Biosystems, CA, USA Fridge 4oC Liebherr, Germany Freezer -20oC Liebherr, Germany Freezer -80 oC Sanyo Horizontal gel electrophoresis system Peqlab Biotechnologie, Erlangen, Germany Incubator Heraeus, Germany Inverted microscope Leitz Labovert, Germany Laminar flow Aura 2000 MAC Bio Air Instruments S.r.l, Pavia, Italy Liquid nitrogen tank Air liquide Kryotechnik, Dusseldorf, Germany Mini cenrifuge MCF-2360 LMS, Japan Neubauer counting chamber Marienfeld Superior, Lauda-Koenigshofen, Germany pH meter Sartorius, Germany Phase-contrast microscope Zeiss, Germany Qubit fluorometer Invitrogen, USA Thermocycler T professional Biometra, Goettingen, Germany Thermomixer HLC MHL 20 HLC, Mannhein , Germany UV transilluminator Bachofer, Reutlingen, Germany UV transilluminator UVP, Cambridge, England Vortex IKA MS3 basic IKA, USA Waterbath Memmert, Germany Waterbath Julabo, Germany
3.1.7 Softwares
Name Company Usage
Adobe Photoshop CS2 Adobe System Inc. Image processing
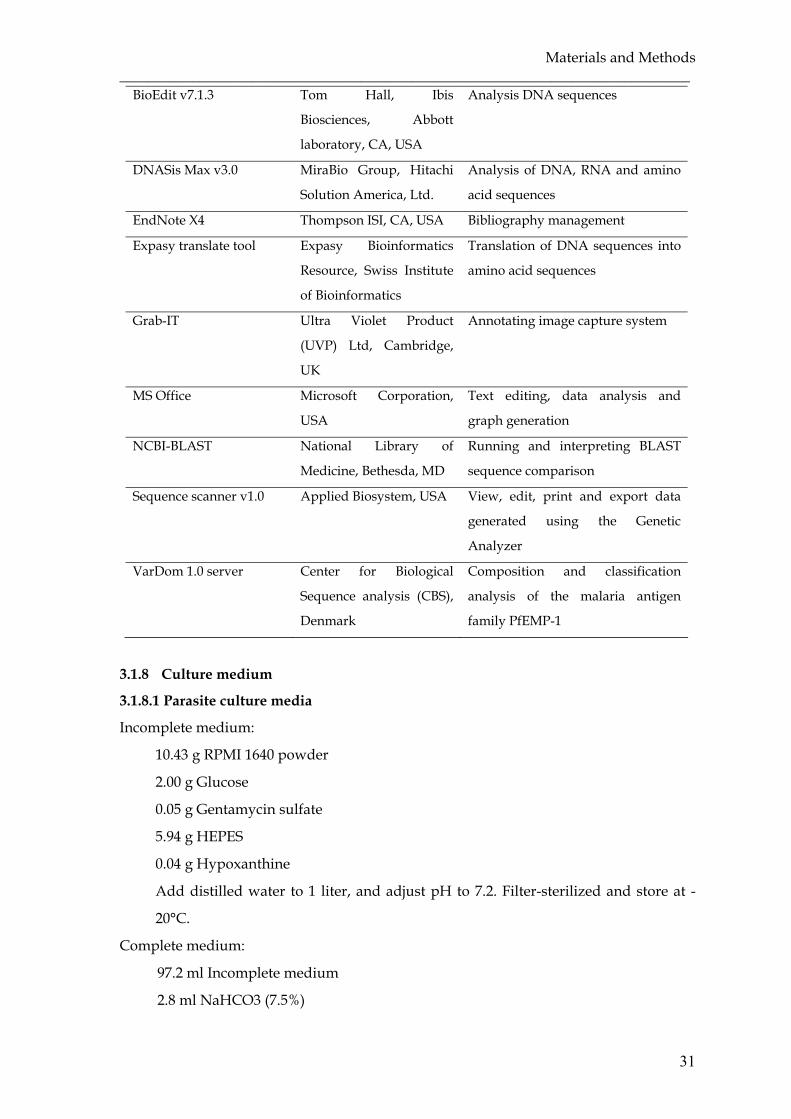
Materials and Methods ______________________________________________________________________________
31
BioEdit v7.1.3 Tom Hall, Ibis
Biosciences, Abbott
laboratory, CA, USA
Analysis DNA sequences
DNASis Max v3.0 MiraBio Group, Hitachi
Solution America, Ltd.
Analysis of DNA, RNA and amino
acid sequences
EndNote X4 Thompson ISI, CA, USA Bibliography management
Expasy translate tool Expasy Bioinformatics
Resource, Swiss Institute
of Bioinformatics
Translation of DNA sequences into
amino acid sequences
Grab-IT Ultra Violet Product
(UVP) Ltd, Cambridge,
UK
Annotating image capture system
MS Office Microsoft Corporation,
USA
Text editing, data analysis and
graph generation
NCBI-BLAST National Library of
Medicine, Bethesda, MD
Running and interpreting BLAST
sequence comparison
Sequence scanner v1.0 Applied Biosystem, USA View, edit, print and export data
generated using the Genetic
Analyzer
VarDom 1.0 server Center for Biological
Sequence analysis (CBS),
Denmark
Composition and classification
analysis of the malaria antigen
family PfEMP-1
3.1.8 Culture medium
3.1.8.1 Parasite culture media
Incomplete medium:
10.43 g RPMI 1640 powder
2.00 g Glucose
0.05 g Gentamycin sulfate
5.94 g HEPES
0.04 g Hypoxanthine
Add distilled water to 1 liter, and adjust pH to 7.2. Filter-sterilized and store at -
20°C.
Complete medium:
97.2 ml Incomplete medium
2.8 ml NaHCO3 (7.5%)
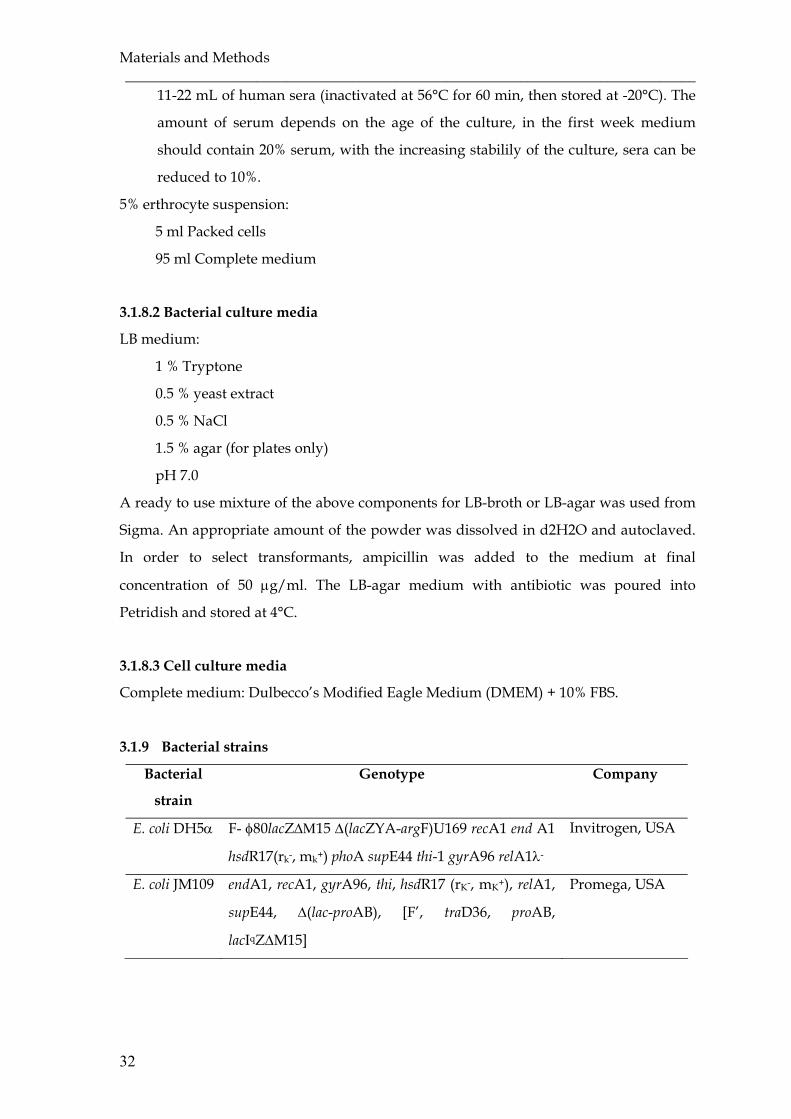
Materials and Methods ______________________________________________________________________________
32
11-22 mL of human sera (inactivated at 56°C for 60 min, then stored at -20°C). The
amount of serum depends on the age of the culture, in the first week medium
should contain 20% serum, with the increasing stabilily of the culture, sera can be
reduced to 10%.
5% erthrocyte suspension:
5 ml Packed cells
95 ml Complete medium
3.1.8.2 Bacterial culture media
LB medium:
1 % Tryptone
0.5 % yeast extract
0.5 % NaCl
1.5 % agar (for plates only)
pH 7.0
A ready to use mixture of the above components for LB-broth or LB-agar was used from
Sigma. An appropriate amount of the powder was dissolved in d2H2O and autoclaved.
In order to select transformants, ampicillin was added to the medium at final
concentration of 50 µg/ml. The LB-agar medium with antibiotic was poured into
Petridish and stored at 4°C.
3.1.8.3 Cell culture media
Complete medium: Dulbecco’s Modified Eagle Medium (DMEM) + 10% FBS.
3.1.9 Bacterial strains
Bacterial
strain
Genotype Company
E. coli DH5α F- φ80lacZ∆Μ15 ∆(lacZYA-argF)U169 recA1 end A1
hsdR17(rk-, mk+) phoA supE44 thi-1 gyrA96 relA1λ-
Invitrogen, USA
E. coli JM109 endA1, recA1, gyrA96, thi, hsdR17 (rK-, mK+), relA1,
supE44, ∆(lac-proAB), [F’, traD36, proAB,
lacIqZ∆M15]
Promega, USA

Materials and Methods ______________________________________________________________________________
33
3.1.10 Mammalian cell line
COS-7 cells are immortalised fibroblast-like kidney cells from African green monkeys.
This cell line is appropriate for transfection by vectors requiring expression of SV40 T
antigen. It contains T antigen, retains complete permissiveness for lytic growth of SV40,
supports the replication of ts A209 virus at 40°C and supports the replication of pure
populations of mutants with deletions in the early region. The line was derived from the
CV-1 cells (ATCC CCL 70) by transformation with an origin-defective mutant of SV40
which codes for wild type T antigen.
ATCC Number: CRL-1651
ECACC Number: 87021302
3.1.11 Plasmids
Name Company Usage
pGEM-T
Easy
Promega,
Madison, USA
Cloning vector with a single 3’-T overhangs at the
cloning site for direct cloning of PCR products. It has
α-peptide coding region of the enzyme β-
galactosidase within the cloning region to allow
identification of recombinant by blue/white
screening.
pUC19 Invitrogen, USA Cloning vector, used as transformation control.
pRE4 Prof. Gary Cohen
and Prof. Roselyn
Eisenberg,
University of
Pennsylvania,
USA
Expression vector contains a SV40 ori, a Rous
sarcoma virus LTR (RSV LTR) and the SV40polyA. It
has the HSV glycoprotein D (HSV gD) used as the
signal sequence and hydrophobic transmembrane to
target different regions of the malarial erythrocyte
binding proteins to the surface of mammalian cells.
3.1.12 Primers
Species-specific primers for Plasmodium spp.
1. rPLU5 5’-CCT GTT GTT GCC TTA AAC TTC-3’
2. rPLU6 5’-TTA AAA TTG TTG CAG TTA AAA CG-3’
3. rFAL1 5’-TTA AAC TGG TTT GGG AAA ACC AAA TAT ATT-3’
4. rFAL2 5’-ACA CAA TGA ACT CAA TCA TGA CTA CCC GTC-3’
5. rVIV1 5’-CGC TTC TAG CTT AAT CCA CAT AAC TGA TA-3’

Materials and Methods ______________________________________________________________________________
34
6. rVIV2 5’-ACT TCC AAG CCG AAG CAA AGA AAG TCC TTA-3’
7. rMAL1 5’-ATA ACA TAG TTG TAC GTT AAG AAT AAC CGC-3’
8. rMAL2 5’-AAA ATT CCC ATG CAT AAA AAA TTA TAC AAA-3’
9. rOVA1 5’-ATC TCT TTT GCT ATT TTT TAG TAT TGG AGA-3’
10. rOVA2 5’-GGA AAA GGA CAC ATT AAT TGT ATC CTA GTG-3’
11. Pmk8 5’-GTT AGC GAG AGC CAC AAA AAA GCG AAT-3’
12. Pmkr9 5’-ACT CAA AGT AAC AAA ATC TTC CGT A-3’
P. falciparum genotyping primers
13. M1-OF 5’-CTA GAA GCT TTA GAA GAT GCA GTA TTG-3’
14. M1-OR 5’-CTT AAA TAG TAT TCT AAT TCA AGT GGA TCA-3’
15. M1-KF 5’-AAA TGA AGA AGA AAT TAC TAC AAA AGG TGC-3’
16. M1-KR 5’-GCT TGC ATC AGC TGG AGG GCT TGG ACC AGA-3’
17. M1-MF 5’-AAA TGA AGG AAC AAG TCG AAC AGC TGT TAC-3’
18. M1-MR 5’-ATC TGA AGG ATT TGT ACG TCT TGA ATT ACC-3’
19. M1-RF 5’-TAA AGG ATG GAC CAA ATA CTC AAG TTG TTG-3’
20. M1-RR 5’-CAT CTG AAG GAT TTG CAG CAC CTG GAG ATC-3’
21. M2-OF 5’-ATG AAG GTA ATT AAA ACA TTG TCT ATT ATA-3’
22. M2-OR 5’-CTT TGT TAC CAT CGG TAC ATT CTT-3’
23. M2-ICF 5’-AGA AGT ATG GCA GAA AGT AAK CCT YCT ACT-3’
24. M2-ICR 5’-GAT TGT AAT TCG GGG GAT TCA GTT TGT TCG-3’
25. M2-FCF 5’-AAT ACT AAG AGT GTA GGT GCA RAT GCT CCA-3’
26. M2-FCR 5’-TTT TAT TTG GTGBCAT TGC CAG AAC TTG AAC-3’
27. G-OF 5’-TGA ATT TGA AGA TGT TCA CAC TGA AC-3’
28. G-OR 5’-GTG GAA TTG CTT TTT CTT CAA CAC TAA-3’
29. G-NF 5’-TGT TCA CAC TGA ACA ATT AGA TTT AGA TCA-3’
Universal var primer to amplify the DBL1α
30. αAF 5’-GCA CG(A/C) AGT TTT GC-3’
31. αBR 5’-GCC CAT TC(G/C) TCG AAC CA-3’
Specific primer for var D-like gene
32. var-DF 5’-AAT TCC T(C/G)A TGA (A/T)TT TAA (G/A)CG-3’
33. var-DR 5’-CAC ATA ACA T(T/C)C C(A/T)T TCC A-3’
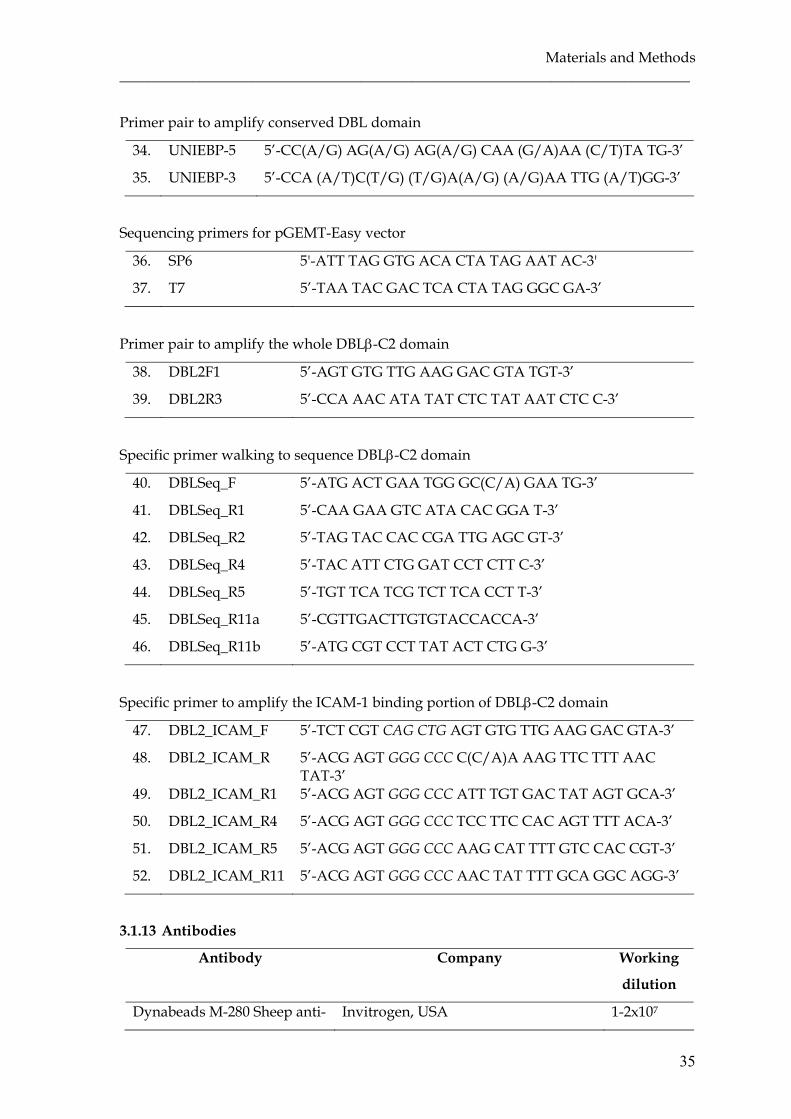
Materials and Methods ______________________________________________________________________________
35
Primer pair to amplify conserved DBL domain
34. UNIEBP-5 5’-CC(A/G) AG(A/G) AG(A/G) CAA (G/A)AA (C/T)TA TG-3’
35. UNIEBP-3 5’-CCA (A/T)C(T/G) (T/G)A(A/G) (A/G)AA TTG (A/T)GG-3’
Sequencing primers for pGEMT-Easy vector
36. SP6 5'-ATT TAG GTG ACA CTA TAG AAT AC-3'
37. T7 5’-TAA TAC GAC TCA CTA TAG GGC GA-3’
Primer pair to amplify the whole DBLβ-C2 domain
38. DBL2F1 5’-AGT GTG TTG AAG GAC GTA TGT-3’
39. DBL2R3 5’-CCA AAC ATA TAT CTC TAT AAT CTC C-3’
Specific primer walking to sequence DBLβ-C2 domain
40. DBLSeq_F 5’-ATG ACT GAA TGG GC(C/A) GAA TG-3’
41. DBLSeq_R1 5’-CAA GAA GTC ATA CAC GGA T-3’
42. DBLSeq_R2 5’-TAG TAC CAC CGA TTG AGC GT-3’
43. DBLSeq_R4 5’-TAC ATT CTG GAT CCT CTT C-3’
44. DBLSeq_R5 5’-TGT TCA TCG TCT TCA CCT T-3’
45. DBLSeq_R11a 5’-CGTTGACTTGTGTACCACCA-3’
46. DBLSeq_R11b 5’-ATG CGT CCT TAT ACT CTG G-3’
Specific primer to amplify the ICAM-1 binding portion of DBLβ-C2 domain
47. DBL2_ICAM_F 5’-TCT CGT CAG CTG AGT GTG TTG AAG GAC GTA-3’
48. DBL2_ICAM_R 5’-ACG AGT GGG CCC C(C/A)A AAG TTC TTT AAC TAT-3’
49. DBL2_ICAM_R1 5’-ACG AGT GGG CCC ATT TGT GAC TAT AGT GCA-3’
50. DBL2_ICAM_R4 5’-ACG AGT GGG CCC TCC TTC CAC AGT TTT ACA-3’
51. DBL2_ICAM_R5 5’-ACG AGT GGG CCC AAG CAT TTT GTC CAC CGT-3’
52. DBL2_ICAM_R11 5’-ACG AGT GGG CCC AAC TAT TTT GCA GGC AGG-3’
3.1.13 Antibodies
Antibody Company Working
dilution
Dynabeads M-280 Sheep anti- Invitrogen, USA 1-2x10⁷

Materials and Methods ______________________________________________________________________________
36
mouse IgG beads/ml
DL6 monoclonal antibodies
(mouse)
Prof. Gary Cohen and Prof. Roselyn
Eisenberg, University of Pennsylvania,
USA
1:2000
Fluorescein-conjugated goat
anti-mouse antibodies
Jackson ImmunoResearch, USA 1:100
ID3 monoclonal antibodies
(mouse)
Prof. Gary Cohen and Prof Roselyn
Eisenberg, University of Pennsylvania,
USA
1:2000
Mouse anti-human IgG Fc
gamma fragment antisera
Jackson ImmunoResearch, USA 0.1-1µg
Abs/beads
Recombinant human ICAM-
1/CD54 Fc chimera
R and D System, Wiesbaden, Germany 1.5-2x10⁶
beads
3.2 Methods
3.2.1 Cultivation of fresh Plasmodium falciparum isolates from patients
A sample of parasitized erythrocytes was collected from severe and asymptomatic or
uncomplicated malaria patients. Blood was collected into tube containing heparin and
saved at 4oC until processed. Blood were layered by Ficoll and separated by
centrifugation at 2000 rpm for 5 min. Erythrocytes were collected and washed three
times in RPMI 1640. The isolates were grown in complete medium and supplemented
with 5% erythrocyte suspension. Cultures were maintained at 37oC in an atmosphere of
94% nitrogen, 5% carbon dioxide and 1% oxygen, and the culture medium is changed
every day. The growth rate was monitored by microscopic examination of Giemsa-
stained smears.
Sorbitol-synchronization of P. falciparum culture
The parasite culture was harvested at the ring stage (10-12 h post invasion culture). The
culture was centrifuged at 1200 rpm for 2 min, the pellet were added with the same
volume of 5% sorbitol and incubated for 10 min at RT, with 2 or 3 times shaking. The
culture was centrifuged, washed 3 times in complete medium and diluted to 5%
erythrocyte suspension. The culture was counted and subcultured.

Materials and Methods ______________________________________________________________________________
37
3.2.2 Microbiology techniques
3.2.2.1 Bacterial cultures
The frozen cells from the glycerol stocks or resuspension of lyophilized cells were
streaked out on to LB-agar plates containing appropriate selective antibiotics and
incubated o/n (over-night) at 37°C to obtain single colonies. A single colony was then
inoculated in the LB medium containing appropriate antibiotic and incubated o/n at
37°C in a shaking incubator at 250 rpm. To prepare competent bacterial cells, LB agar
and medium without antibiotics were used.
3.2.2.2 Preparation of bacterial stocks
850 µl of an overnight bacterial culture was mixed with 150 µl sterilized glycerol and
store at -80oC for long term storage.
3.2.2.3 Preparation of chemically competent bacteria
A single bacterial colony was inoculated in 50-100 ml of LB medium and incubated at
37°C with shaking at 250 rpm. The culture was grown until the cell density reached an
OD600 of 0.4-0.5, it took for approximately 3-6 hours. In order to stop the bacterial
growth, the cultures were put on ice immediately. The cells were harvested by
centrifugation at 2500 xg for 15 min at 4°C and resuspended in 1/10 volume (5-10 ml) of
ice cold TSS and place on ice. The competent cells were aliquoted (50-100 µl vol.) and
stored at -80°C.
For some cloning experiments, highly efficient chemically competent E. coli DH5α cells
and E. coli JM109 cells were purchased from invitrogen and promega, respectively.
3.2.3 Molecular biology techniques
3.2.3.1 DNA extraction
DNA extraction from patients whole blood and P. falciparum culture
Genomic DNA was isolated from whole blood of malaria patients and parasite culture
by QIAamp DNA Blood mini kit (Qiagen) according the manufacture’s instruction. 200
µl of whole blood or of harvested uniformly ring-stage parasite culture by centrifugation
at 300 xg for 5 min was diluted with 200 µl PBS, then added with 20 µl proteinase-K. The
mixture were added with 200 µl buffer AL, vortexed for 15 s and incubated at 56oC for 10
min. The samples were precipitated with 200 µl ethanol 96-100% and applied to the
QIAamp Mini spin column to centrifuge at 8000 rpm for 1 min. Then added with 500 µl
buffer AW1 and centrifuged at 8000 rpm for 1 min. The procedure was continued by

Materials and Methods ______________________________________________________________________________
38
adding the sample with 500 µl buffer AW2 and centrifuged at full speed for 3 min.
Finally, the samples were dissolved by adding 200 µl buffer AE and centrifuging at 8000
rpm for 1 min. DNA was stored at -20oC.
DNA extraction from blood on filter paper
DNA extraction from blood on filter paper was conducted using Chelex boiling method.
Chelex was gently mixed by magnetic stirer for 10 min before used. The blood spot on
filter paper was cut for approximately 1 cm2 and put into 1.5 ml tube. The sample was
dissolved with 200 µl prepared Chelex and mixed well by vortexing for 30 sec. The
sample was cooked by heating at 100oC for 15 min and centrifuged at 12.000 rpm for 2-5
min. The supernatant was collected and centrifuged at 12.000 rpm for 2-5 min. 80-100 µl
of supernatant was collected and stored at -20oC.
3.2.3.2 RNA extraction
RNA extraction from patients whole blood and P. falciparum culture
Total RNA was isolated from whole blood and parasite culture using QIAamp RNA
blood mini kit according to the manufacturer’s protocol. 500 µl of whole blood or
harvested synchronized parasite culture by centrifugation at 300 xg for 5 min was mixed
with 5 volume of buffer EL and incubated on ice for 10-15 min. The sample was
centrifuged at 400 xg at 4oC for 10 min and the supernatant was discarded. The sample
was lysed again by adding 2 volume of buffer EL and centrifuged, and added 350 µl of
buffer RLT to the pellet before applied to the QIAshredder spin column and centrifuged
at maximum speed for 2 min. The sample was added with 1 volume of 70% ethanol and
applied to the QIAamp spin column and centrifuged for 15 sec at >10000 rpm. The
sample was washed with 700 µl buffer RW1 and added with 500 µl buffer RPE and
centrifuged for 15 sec >10000 rpm, and once again with 500 µl of buffer RPE, centrifuged
at maximum speed for 3 min. Finally RNA was diluted with 30-50 µl of RNase-free
water and centrifuged for 1 min at >10000 rpm. RNA was used immediately or stored at
-80oC.
RNA extraction from blood on filter paper
RNA was also extracted from dried blood on filter paper using RNeasy Mini Kit
(Qiagen). The blood spot was cut for approximately 0.3 cm2 and placed into the tube. 600
µl of RLT buffer was added and incubated in thermomixer at 1000 rpm 37oC for 30 min.
Materials and Methods ______________________________________________________________________________
39
The lysate was applied to the QIA shredder spin column and centrifuged at 13.000 rpm
for 2 min. 1 volume of 70% ethanol was added to the homogenized lysate and mixed
properly by pipetting. 700 µl of lysate was applied to the RNeasy spin column and
centrifuged for 15 sec at >10.000 rpm. The sample was washed by adding 350 µl of buffer
RW1 to the column and centrifuged for 15 sec at >10000 rpm. 10 µl DNase I stock
solution was mixed with 70 µl buffer RDD and the mix solution was applied to the spin
column membrane and incubated at RT for 15 min. The column was washed again with
350 µl buffer RW1 and centrifuged at >10000 rpm for 15 sec. The sample was added with
500 µl buffer RPE, centrifuged for 2 min at >10000 rpm and centrifuged once again at
maximum speed for 1 min. Finally diluted RNA by adding 30-50 µl of RNase-free water
directly to spin column membrane and centrifuging for 1 min at >10000 rpm. RNA was
used immediately or stored at -80oC.
3.2.3.3 cDNA synthesis
A complementary DNA (cDNA) is a DNA copy synthesized from RNA. cDNA synthesis
is used to determine the level of gene expression. cDNA is synthesized first using
oligodT or random primers in the present of four deoxynucleotide triphosphates (dNTP)
by using reverse transcriptase with RNA or mRNA as a template reaction, followed by
PCR.
RNA was treated with DNase I for 15 min at 37oC to avoid contamination with genomic
DNA. The mixture contained of 1ng-5µg total RNA, 1 µl of 500µg/ml OligodT primer
and 1 µl dNTP mix (10mM each) was heated to 65oC for 5 min and quick chilled on ice.
4µl of 5x first-strand buffer and 2 µl of 0.1 M DTT was added to the mixture and
incubated at 42oC for 2 min. The mixture was then reverse transcribed using 1 µl (200 U)
of Superscript II RT by incubating at 42oC for 50 min and the reaction were inactivated
by heating at 70oC for 15 min. The cDNA was used as a template for subsequent PCR
and stored at -20oC.
3.2.3.4 Polymerase Chain Reaction (PCR)
The PCR is a technique for amplifying a piece of DNA of interest in an exponential
manner. The amplification requires synthetic oligonucleotides, so called primers, which
flanking the target sequence to be amplified. These primers, under appropriate
conditions, anneal to the denatured target sequence and, in the presence of a heat stable
DNA polymerase enzyme and dNTPs, direct synthesis a complementary strand of the

Materials and Methods ______________________________________________________________________________
40
target sequence. As a template 1 µl cDNA (10-200 ng) or 1 µl genomic DNA (0.1-1 µg) or
0.5 ng plasmid DNA were used. The PCR reactions were prepared as follows:
PCR component Amount (µl)
20 µl per reaction
Final concentration
10x PCR buffer 2.0 1x
25 mM MgCl2 1.2 – 2.0 1.5 – 2.5 mM
10 mM dNTP mix 0.4 200 µM
10 µM forward primer 0.4 – 1.0 0.2 – 0.5 µM
10 µM reverse primer 0.4 – 1.0 0.2 – 0.5 µM
DNA template (0.5 ng/µl to 1 µg/µl) 1 - 5 N.A
DNA polymerase (5U/µl) 0.2 – 0.3 1 – 1.5 U
ddH2O Adjust to 20
Some reactions were also performed in 50 µl. And the cycle conditions were as follows:
Step Temperature (oC) Duration (min:sec) No. of cycles
Initial denaturation 94-95 4:00 1
Denaturation 94-95 0:45 - 0:60
Annealing 42-65 0:60
Extension 65-72 1:00 - 3:00
25 - 35
Final extension 65-72 10:00 1
The annealing temperatures are varied between 42 and 65oC depend on the length and
Tm (melting temperature) of the primer pairs, it should be 5oC below the lowest Tm of
the pair of primers. The extension temperatures depend on the DNA polymerase used,
and the duration of extension varied according to the length of the target sequence with
the rule of 1 min per 1000 bp fragment.
Plasmodium species-specific identification by PCR
Species-specific identification was conducted with nested PCR. All PCR amplifications
were carried out in a 20 µl reaction mixture:

Materials and Methods ______________________________________________________________________________
41
PCR component Amount (µl) Final concentration
10x PCR buffer + MgCl2 (1.5 mM) 2.0 1x
100 mM dNTP mix 0.1 500 µM
10 µM forward + reverse primer 0.5 0.25 µM/primer
DNA template (0.5ng/µl to 1 µg/µl) 1.0 N.A
DNA polymerase (5U/µl) (MP
Biomedical)
0.08 0.4 U
ddH2O Adjust to 20
The amplification was performed in a thermocycler (Biometra, Germany) as follows:
Step Temperature (oC) Duration (min:sec) No. of cycles
Initial denaturation 95 5:00 1
Denaturation 94 1:00
Annealing 58 2:00
Extension 72 2:00
25
Final extension 72 5:00 1
DNA of P. falciparum, P. malariae, P. vivax, P. ovale and P. knowlesi were included as
positive controls. One microliter of the nested 1 amplification product served as DNA
template of each of the 20 µl nested 2 amplification. Another components of the reaction
mixture were identical with nested 1. Nested 2 amplification conditions were identical to
those of nested 1 except for P. knowlesi which used the annealing temperature of 60oC
and 30 cycles.
3.2.3.5 DNA analysis and purification
Determination of DNA/RNA concentration
DNA concentration was measured using Qubit Fluorometer, fluorescence-based dyes
that bind specifically to DNA, RNA and protein. The purity of the sample was
determined by the OD260/280 ratio. The pure DNA sample should have a ratio between
1.8 and 2.0. Smaller ratios usually indicate contamination by protein or organic
chemicals.
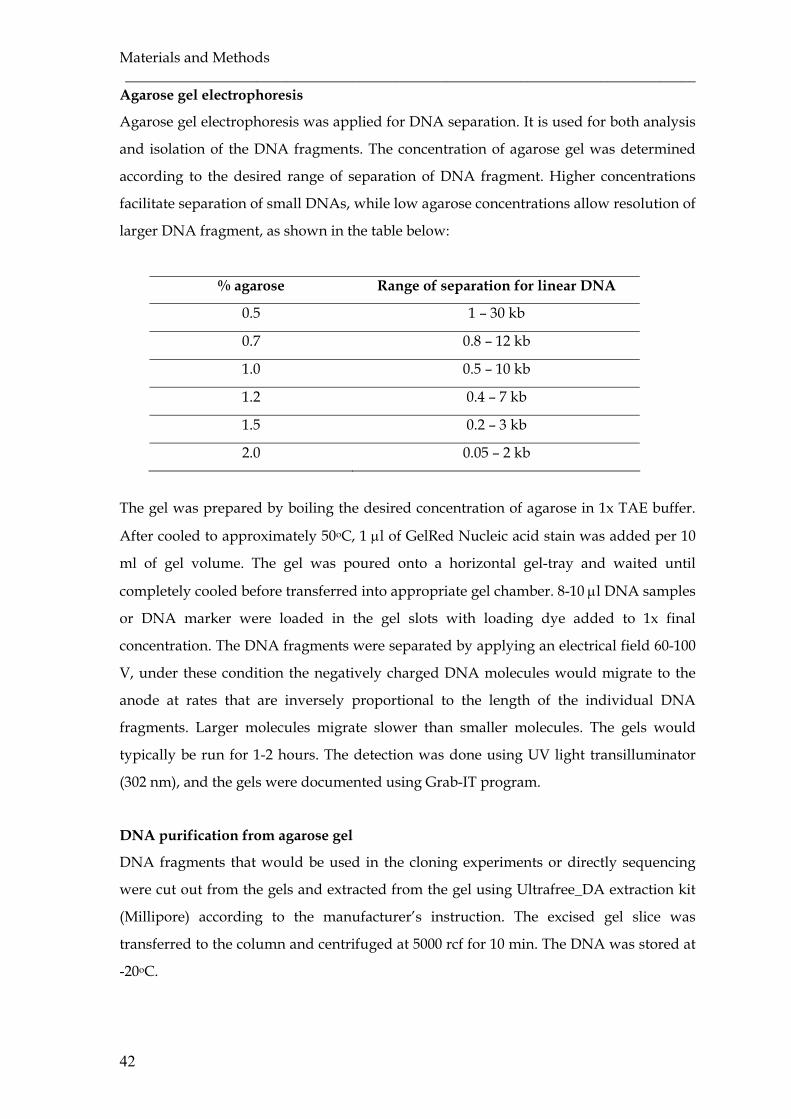
Materials and Methods ______________________________________________________________________________
42
Agarose gel electrophoresis
Agarose gel electrophoresis was applied for DNA separation. It is used for both analysis
and isolation of the DNA fragments. The concentration of agarose gel was determined
according to the desired range of separation of DNA fragment. Higher concentrations
facilitate separation of small DNAs, while low agarose concentrations allow resolution of
larger DNA fragment, as shown in the table below:
% agarose Range of separation for linear DNA
0.5 1 – 30 kb
0.7 0.8 – 12 kb
1.0 0.5 – 10 kb
1.2 0.4 – 7 kb
1.5 0.2 – 3 kb
2.0 0.05 – 2 kb
The gel was prepared by boiling the desired concentration of agarose in 1x TAE buffer.
After cooled to approximately 50oC, 1 µl of GelRed Nucleic acid stain was added per 10
ml of gel volume. The gel was poured onto a horizontal gel-tray and waited until
completely cooled before transferred into appropriate gel chamber. 8-10 µl DNA samples
or DNA marker were loaded in the gel slots with loading dye added to 1x final
concentration. The DNA fragments were separated by applying an electrical field 60-100
V, under these condition the negatively charged DNA molecules would migrate to the
anode at rates that are inversely proportional to the length of the individual DNA
fragments. Larger molecules migrate slower than smaller molecules. The gels would
typically be run for 1-2 hours. The detection was done using UV light transilluminator
(302 nm), and the gels were documented using Grab-IT program.
DNA purification from agarose gel
DNA fragments that would be used in the cloning experiments or directly sequencing
were cut out from the gels and extracted from the gel using Ultrafree_DA extraction kit
(Millipore) according to the manufacturer’s instruction. The excised gel slice was
transferred to the column and centrifuged at 5000 rcf for 10 min. The DNA was stored at
-20oC.
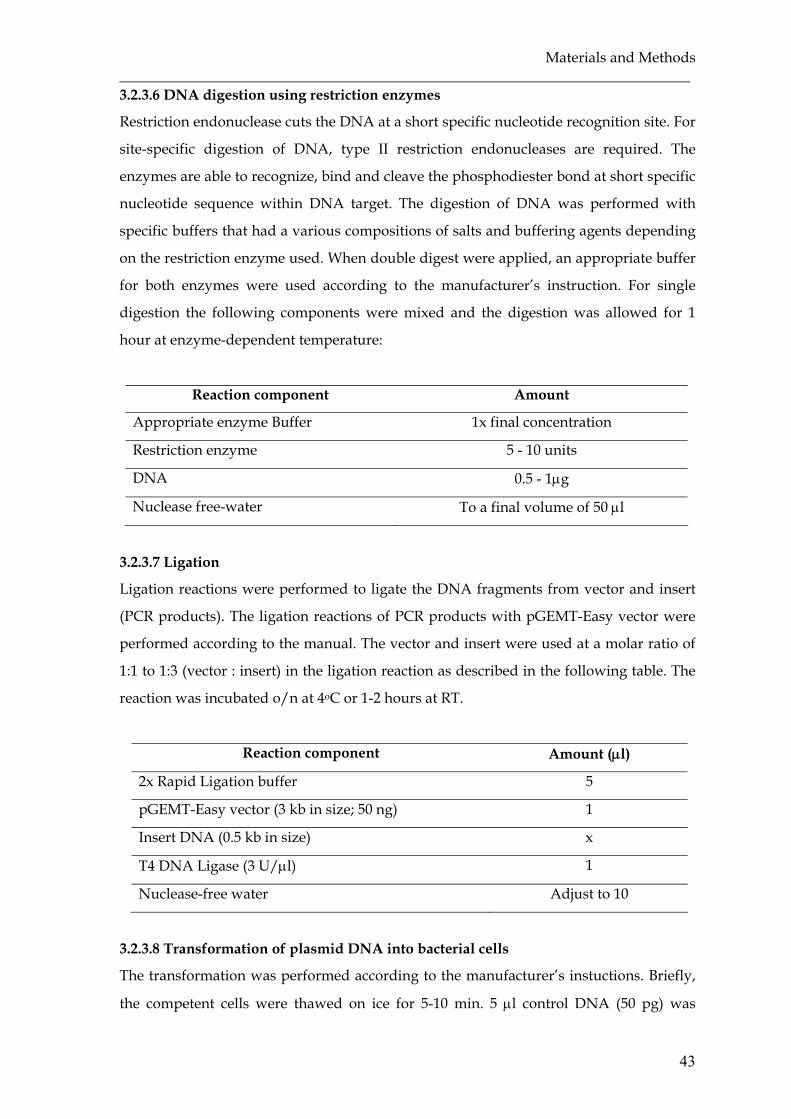
Materials and Methods ______________________________________________________________________________
43
3.2.3.6 DNA digestion using restriction enzymes
Restriction endonuclease cuts the DNA at a short specific nucleotide recognition site. For
site-specific digestion of DNA, type II restriction endonucleases are required. The
enzymes are able to recognize, bind and cleave the phosphodiester bond at short specific
nucleotide sequence within DNA target. The digestion of DNA was performed with
specific buffers that had a various compositions of salts and buffering agents depending
on the restriction enzyme used. When double digest were applied, an appropriate buffer
for both enzymes were used according to the manufacturer’s instruction. For single
digestion the following components were mixed and the digestion was allowed for 1
hour at enzyme-dependent temperature:
Reaction component Amount
Appropriate enzyme Buffer 1x final concentration
Restriction enzyme 5 - 10 units
DNA 0.5 - 1µg
Nuclease free-water To a final volume of 50 µl
3.2.3.7 Ligation
Ligation reactions were performed to ligate the DNA fragments from vector and insert
(PCR products). The ligation reactions of PCR products with pGEMT-Easy vector were
performed according to the manual. The vector and insert were used at a molar ratio of
1:1 to 1:3 (vector : insert) in the ligation reaction as described in the following table. The
reaction was incubated o/n at 4oC or 1-2 hours at RT.
Reaction component Amount (µl)
2x Rapid Ligation buffer 5
pGEMT-Easy vector (3 kb in size; 50 ng) 1
Insert DNA (0.5 kb in size) x
T4 DNA Ligase (3 U/µl) 1
Nuclease-free water Adjust to 10
3.2.3.8 Transformation of plasmid DNA into bacterial cells
The transformation was performed according to the manufacturer’s instuctions. Briefly,
the competent cells were thawed on ice for 5-10 min. 5 µl control DNA (50 pg) was

Materials and Methods ______________________________________________________________________________
44
pipetted in a pre-chilled tube containing 100 µl competent cells and 2-3 µl ligation
reaction in 50 µl competent cells, mixed by gentle flicking. The mixtures were incubated
on ice for 30 minutes, heat-shocked in 42°C water bath for 45 sec and immediately
chilled on ice for 2 min. The transformed cells were resuspended in pre-warmed SOC
medium to a volume of 1 ml. The cultures were incubated at 37°C with 250 rpm shaking
for 60-90 min, then 100-200 µl transformation reaction was plated on LB agar containing
ampicillin, IPTG and X-gal. The plates were incubated o/n at 37°C.
3.2.3.9 Plasmid DNA isolation
Plasmid DNA was isolated from bacteria using the alkaline lysis method (Sambrook,
1989). Some plasmid mini preparation kits (Qiagen plasmid mini kit) were also
purchased. The plasmid isolation was performed according to the manufacturer’s
instructions. A single white E. coli colony was inoculated into 3 ml of LB medium
containing selective antibiotic and incubated at 37°C with vigorous shaking for
approximately 8 hours. The starter cultures were diluted 1/500 to 1/1000 into 3 ml
selective LB medium and incubated at 37°C with vigorous shaking for 12-16 hours. The
cultures were harvested by centrifugation for 15 min at 8000 rpm and the supernatant
was discarded. The pellet was resuspended in 300 µl of P1 buffer and the cells were
lysed by adding 300 µl of P2 buffer and incubated at RT for 5 min. The lysate was
neutralized with 300 µl of P3 buffer and incubated on ice for 5 min. The reaction was
centrifuged at maximum speed for 10 min and the supernatant containing plasmid DNA
was applied to a Qiagen-tip. The Qiagen-tip was washed with the buffer QC and DNA
was eluted with the buffer QF. The DNA was precipitated with 0.7 volume of RT
isopropanol, mixed and centrifuged at >10.000 rpm for 30 min. The DNA pellet was
washed with 1 ml of 70% ethanol and centrifuged at 10.000 rpm for 10 min. The pellet
DNA was air-dried, dissolved in 50µl of TE buffer and stored at -20oC.
3.2.3.10 Sequencing
DNA sequencing was applied to confirm the identity of a clone and obtain the exact
sequence. For all sequencing, the Sanger chain termination method was used. The
sequencing was performed with a cycle-sequencing dye-dideoxy chain termination
protocol. The cycle sequencing reaction consists of successive rounds of denaturation,
annealing and extension in the presence of primer, DNA polymerase, dNTPs and dye-
labeled terminator dideoxy nucleotides (ddNTPs). For the cycle sequencing reaction, the

Materials and Methods ______________________________________________________________________________
45
following components were added:
Reaction component Amount (µl)
Sequencing buffer 1.5
BigDye terminator v3.1 0.5
Primer (10 µM) 1
PCR product or plasmid DNA 10-100 ng PCR product or 0.5-1.0 µg plasmid DNA
The reaction was performed in a thermocycler with the following program:
Step Temperature (oC) Duration (min:sec) No. of cycles
Denaturation 96 00:30
Annealing 50 00:15
Extension 60 04:00
25
After completed cycle sequencing, 15 µl ddH2O was added to reach a volume of 20 µl.
This mixture was cleaned-up using a DyeEx 2.0 spin column (DyeEx 2.0 spin kit, Qiagen)
and centrifuged at 2700 rpm for 3 min according to the manufacturer’s instructions. This
step efficiently removes the excess dye terminators from the completed DNA sequencing
reactions. The purified sequencing reaction was then precipitated with 3 volume of
ethanol 96% and twice with 2 volume of ethanol 70%. All precipitation reactions were
carried out by centrifugation at maximum speed (in g or rpm) for 3 min. After drying for
approximately 45 min, the samples were diluted with 12 µl HiDi Formamide plus 13 µl
Lichrosolv water and loaded in a 96-well sample plate of a DNA Analyzer (ABI 3730,
Applied Biosystems) for sequence analysis.
3.2.3.11 Sequence analysis
The nucleotide sequences were aligned using BioEdit program and DNASIS MAX
version 3.0 and analyzed for sequence similarities by NCBI BLAST
(http://www.ncbi.nlm.nih.gov/Blast.cgi). The nucleotide sequences were translated
into amino acid sequences using Expasy Translation Tool
(http://www.expasy.ch/tools/dna.html). The multiple sequences were aligned using
ClustalW alignment. Percentage sequence similarity test and phylogenetic tree analysis

Materials and Methods ______________________________________________________________________________
46
were carried out using the algorithm in DNASIS MAX version 3.0 based upon a
ClustalW alignment.
3.2.4 Cell culture techniques
3.2.4.1 Cultivation of mammalian cells
The mammalian cell line (COS-7 cells) were grown in Dulbecco’s Modified Eagle
Medium (DMEM) supplemented with 10% Fetal Bovine Serum (FBS) and incubated in a
37oC incubator containing a humidified atmosfer of 5% CO2. For harvesting the adherent
cells, the 80-100% confluent cultures were washed with D-PBS and treated with pre-
warmed Trypsin-EDTA for 5 min to detach the cells from the surface of culture flask and
separate the cells from each other. The activity of the trypsin was stopped by adding
complete medium (DMEM+10%FBS) and the cells suspension was either used for
subculturing or for the preparation of frozen stocks. The cell lines were propagated and
maintained by seeding at the density of 1-2 x 10⁴ viable cells/cm2 every 3-5 days
depending on the growth characteristic of the cells.
3.2.4.2 Freezing and thawing of mammalian cells
Mammalian cell lines can be maintained by storing them in liquid nitrogen. For
freezing, 80-100% confluent culture were pelleted by centrifugation at 100 x g for 5 min
and resuspended in chilled freezing medium containing complete medium and 10%
volume of DMSO to reach approximately 5 x 10⁶ viable cells/ml. The cells suspension
were transferred into cryo tubes and then put in a -80°C freezer to cool the cells about -
1°C/min. After 24 hrs, they can be stored in liquid nitrogen.
The frozen cells can be revived by proper thawing. For optimal recovery, rapid thawing
was important, therefore the cells were thawed rapidly in a 37°C waterbath and washed
with 10-20 ml D-PBS or culture medium and centrifuged at 1000 rpm for 5 min. The
pellet was resuspended in fresh pre-warmed DMEM supplemented with 10% FBS. The
cell lines were cultured for a minimum of 3 passages before used in other experiments.
3.2.4.3 Determination of cell viability
To determinate cell viability, we used trypan blue exclusion assay. Trypan blue stain
distinguishes viable cells from non-viable cells by their capability to absorb the dye,
viable cells actively exclude the trypan blue while non-viable cells absorb dye. For
counting the number of viable cells, the cell suspension was diluted with trypan blue at a
ratio of 1:1 to 1:9 (cell suspension:trypan blue) and the number of viable cells in a 4 x 1

Materials and Methods ______________________________________________________________________________
47
mm2 area (4 x 100 nl? µl? of diluted cell suspension) were counted with the help of a
Neubauer haemocytometer under a phase contrast microscope. The total number of
viable cell per ml of the cell suspension was calculated using the following formula:
3.2.4.4 Transient transfection of adherent cells
Transient transfections of adherent cells were performed by using a transfection reagent
(Lipofectin, Invitrogen). One day before transfection, COS-7 cells were plated into
coverslip in six-well plates with 2 ml DMEM supplemented with 10% FBS. The cells
were incubated for 16-24 hours in a humidified 5%-CO2 atmosphere at 37°C until 60-80%
of the well bottom was covered by cells. 3-5 µg of plasmid DNA was diluted with 100 µl
OPTI-MEM reduced serum and mixed with the dilution of 10 µl lipofectin in 100 µl
OPTI-MEM reduced serum, then incubated for 15 min at RT. Meanwhile, the cells were
washed once with 2 ml DMEM without serum. The DNA-complex were added with 800
µl OPTI-MEM without serum and added to the cells and incubated at 37°C in a CO2
incubator for 5-24 hours. The medium was replaced with 2 ml complete growth medium
(DMEM+10% FBS). The transfected cells were assayed for expression and binding
activity by immunofluorescence assay after 24-72 hours post transfection.
3.2.5 Immunofluorescence techniques
3.2.5.1 Immunofluorescence assay to test transfection efficiency and expression of
construct on the surface of COS-7 cells
The transfected COS-7 cells were washed twice with PBS and fixed in 2%
paraformaldehyde for 15 min in RT then washed again in PBS. The fixative cells were
stained with the primary antibody (ID3 or DL6) at a dilution of 1:2000 in PBS containing
0.1% BSA for 1 hour at RT. The cells were washed with PBS for 10 min and incubated
with fluorescein-conjugated goat anti-mouse antibodies (Jackson Immunoresearch
Laboratory) at a dilution of 1:100 in PBS containing 0.1% BSA for 1 hour. The cells were
washed again with PBS for 10 min, mounted with Fluoromount (Southern Biotechnology
Associates Inc) and air dried for 5 minutes before examination. The surface expression
was scored using a fluorescence microscope. The mAbs (ID3 or DL6) were tested against
untransfected COS-7 cells to check for the background fluorescence.

Materials and Methods ______________________________________________________________________________
48
3.2.5.2 Immunofluorescence assay to assess the ICAM-1 binding of the recombinant
construct pDBLβ-C2
Coating Dynabead M-280 sheep anti-mouse IgG with ICAM-1
Dynabeads M-280 sheep anti-mouse Ig G antibody (Invitrogen) were washed before use
to remove preservatives, facilitated by the use of a magnet as recommended by
manufacturer. The Dynabeads M-280 were resuspended thoroughly in the vial by
vortexing and transfered the required amount of resuspended beads into a new tube.
The tube was placed on the magnet for 2 min and pipetted off the supernatant. After
removing the tube from the magnet, the pellet was resuspended in an excess volume of
washing buffer (0.1% bovine serum albumin in PBS). The tube was placed again on the
magnet, pipetted off the supernatant and resuspended the washed beads in any
choosing volume of washing buffer with the final concentration of 1-2 x 10⁷ beads/ml.
Washed Sheep anti-mouse Ig G antibody-coated magnetic Dynabeads were incubated
with mouse anti-human IgG Fc gamma fragment antisera (Jackson ImmunoResearch) at
a concentration of 0.1-1.0µg antibody/107 beads. Beads were mixed by rotation for 3 h at
RT. The tube containing the mixture was placed on the magnet for 2 min and pipetted
off the supernatant, than removed from the magnet and washed with washing buffer.
The tube was placed again on the magnet, removed the supernatant and washed with
washing buffer. After coating with mouse anti-human IgG Fc gamma fragment antisera,
the beads were than coated with recombinant ICAM-1/Fc protein (R&D Systems) at
ratio of 1.0µg ICAM-1/107 beads (per 1 x 10⁶ cells), or mock treated for controls by
overnight incubation. The beads were washed with washing buffer and resuspended in
binding medium (0.5% bovine serum albumin, 25 mM HEPES in RPMI-1640 pH 7.0) at a
concentration of 3.7 x 10⁷ beads/ml and warmed to 37oC prior to adding the cells.
Assessing binding of recombinant construct pDBLβ-C2 with ICAM-1 coated beads
Binding of recombinant construct pDBLβ-C2 with ICAM-1 coated beads was tested at
pH 7.0. Two days (40-60 h) post-transfection, transfected COS-7 cells in coverslips were
transferred to an empty fresh well of six-well plate (Falcon) and overlaid with 40 µl of
binding medium (0.5% BSA, 25mM HEPES in RPMI 1640) containing 1.5 – 2.0 x 10⁶
beads of ICAM-1-coated or mock-coated. The cells were incubated in a humidified
container for 1 h at 37°C and filled with 10 ml of binding medium at the same pH used
during the incubation of beads and cells (pH 7.0). The coverslips were then flipped cell-
side down onto a stand and incubated for 5 – 10 min to allow unbound beads to settle by
Materials and Methods ______________________________________________________________________________
49
gravity. Coverslips were then returned to cell-side up and examined under phase
microscopy to determine the degree of beads association.
To prove that beads specifically associated with transfected cells, coverslips were fixed
in 2% paraformaldehyde (Polysciences) for 15 min at RT. The fixed coverslips were
processed for immunofluorescence as previously described (2.2.5.1) to analyze the
coincidence of recombinant protein expression and bead association.
Binding was expressed as a percentage of transfected cells containing five or more
ICAM-1 coated beads. Experiments were carried out in duplicate with a minimum of 50
transfected cells were analyzed for each construct. Standard deviation was calculated
using Microsoft excel (Springer et al., 2004).
3.2.6 Statistical analysis
Standard statistical analysis (eg. mean, median and standard deviation) was calculated
using the built in statistic functions of Microsoft Excel program. The differences between
sequence groups were analyzed using Fisher’s Exact and Chi-square tests. All tests were
two-tailed and results considered significant if p<0.05 meaning that there is a 95%
chance that the two groups being compared would be truly different if looking at the
entire population of parasites.

Materials and Methods ______________________________________________________________________________
50
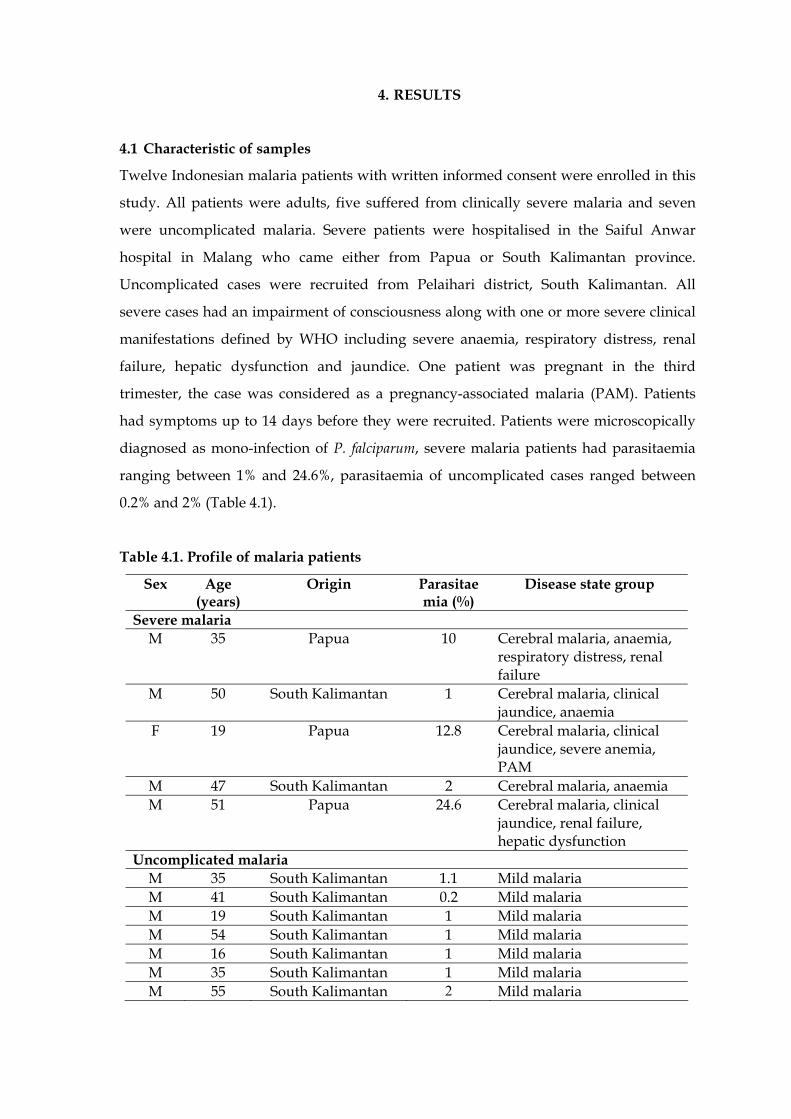
4. RESULTS
4.1 Characteristic of samples
Twelve Indonesian malaria patients with written informed consent were enrolled in this
study. All patients were adults, five suffered from clinically severe malaria and seven
were uncomplicated malaria. Severe patients were hospitalised in the Saiful Anwar
hospital in Malang who came either from Papua or South Kalimantan province.
Uncomplicated cases were recruited from Pelaihari district, South Kalimantan. All
severe cases had an impairment of consciousness along with one or more severe clinical
manifestations defined by WHO including severe anaemia, respiratory distress, renal
failure, hepatic dysfunction and jaundice. One patient was pregnant in the third
trimester, the case was considered as a pregnancy-associated malaria (PAM). Patients
had symptoms up to 14 days before they were recruited. Patients were microscopically
diagnosed as mono-infection of P. falciparum, severe malaria patients had parasitaemia
ranging between 1% and 24.6%, parasitaemia of uncomplicated cases ranged between
0.2% and 2% (Table 4.1).
Table 4.1. Profile of malaria patients
Sex Age (years)
Origin Parasitaemia (%)
Disease state group
Severe malaria M 35 Papua 10 Cerebral malaria, anaemia,
respiratory distress, renal failure
M 50 South Kalimantan 1 Cerebral malaria, clinical jaundice, anaemia
F 19 Papua 12.8 Cerebral malaria, clinical jaundice, severe anemia, PAM
M 47 South Kalimantan 2 Cerebral malaria, anaemia M 51 Papua 24.6 Cerebral malaria, clinical
jaundice, renal failure, hepatic dysfunction
Uncomplicated malaria M 35 South Kalimantan 1.1 Mild malaria M 41 South Kalimantan 0.2 Mild malaria M 19 South Kalimantan 1 Mild malaria M 54 South Kalimantan 1 Mild malaria M 16 South Kalimantan 1 Mild malaria M 35 South Kalimantan 1 Mild malaria M 55 South Kalimantan 2 Mild malaria

Results ________________________________________________________________________
52
4.2 Identification of Plasmodium species
In order to molecularly confirm mono-infection of P. falciparum, Plasmodium species-
specific PCR was conducted by using specific primers of five different Plasmodium spp
causing human malaria (3.1.12). Eight out of twelve patients were detected as mono-
infection with P. falciparum, three samples were mixed infection with P. falciparum, P.
vivax and P. knowlesi, and one sample was mixed infection of P. vivax and P. knowlesi.
Neither P. malariae nor P. ovale were detected in the samples. Due to the inclusion
criteria, we excluded the samples with mixed-infections. Only eight samples of P.
falciparum mono-infection were included in the further analysis.
4.3 Detection of human Plasmodium knowlesi case
Because of the origin of the samples, they were examined for P. knowlesi, the proposed
fifth humanpathogenic Plasmodium. Amplification by using specific primer Pmk8 and
Pmkr9 (3.1.12), designed for P. knowlesi-specific DNA sequences on the small subunit
ribosomal RNA (ssrRNA) gene, yielded a single band of 153 bp in four samples (Figure
4.1). All P. knowlesi-positive samples were mixed infection with P. vivax and/or P.
falciparum. None of them were positive in the P. malariae specific PCR. They had
clinically mild malaria with a low range of parasitaemia between 0.2% and 1% and were
microscopically diagnosed as mono-infection of P. falciparum (Table 4.2). P. knowlesi-
positive samples came from South Kalimantan province, the Indonesian part of Borneo,
none from Papua.
Figure 4.1. Amplification results using Pmk8 and Pmkr9 primers to detect P. knowlesi case. Four positive samples numbered as 1 to 4 generated a 153 bp band. M: marker 100 bp, C+: positive control, C-: negative control.
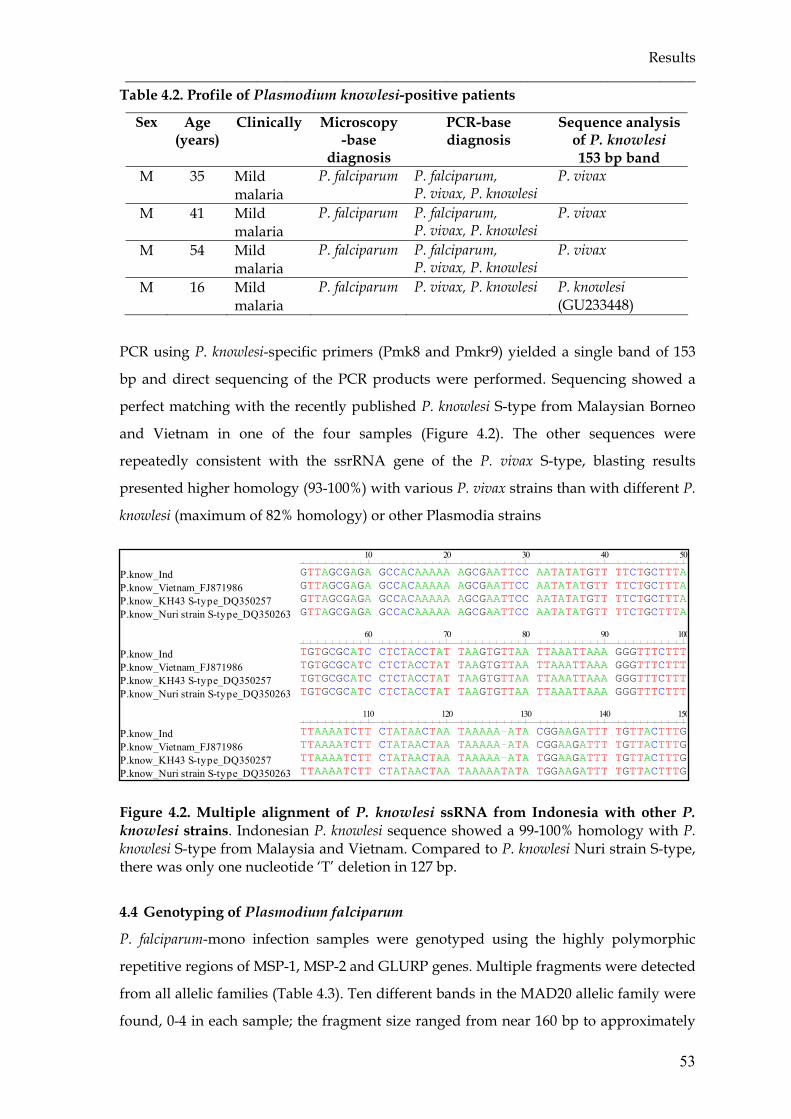
Results ______________________________________________________________________________
53
Table 4.2. Profile of Plasmodium knowlesi-positive patients
Sex Age (years)
Clinically Microscopy-base
diagnosis
PCR-base diagnosis
Sequence analysis of P. knowlesi 153 bp band
M 35 Mild malaria
P. falciparum P. falciparum, P. vivax, P. knowlesi
P. vivax
M 41 Mild malaria
P. falciparum P. falciparum, P. vivax, P. knowlesi
P. vivax
M 54 Mild malaria
P. falciparum P. falciparum, P. vivax, P. knowlesi
P. vivax
M 16 Mild malaria
P. falciparum P. vivax, P. knowlesi P. knowlesi (GU233448)
PCR using P. knowlesi-specific primers (Pmk8 and Pmkr9) yielded a single band of 153
bp and direct sequencing of the PCR products were performed. Sequencing showed a
perfect matching with the recently published P. knowlesi S-type from Malaysian Borneo
and Vietnam in one of the four samples (Figure 4.2). The other sequences were
repeatedly consistent with the ssrRNA gene of the P. vivax S-type, blasting results
presented higher homology (93-100%) with various P. vivax strains than with different P.
knowlesi (maximum of 82% homology) or other Plasmodia strains
Figure 4.2. Multiple alignment of P. knowlesi ssRNA from Indonesia with other P. knowlesi strains. Indonesian P. knowlesi sequence showed a 99-100% homology with P. knowlesi S-type from Malaysia and Vietnam. Compared to P. knowlesi Nuri strain S-type, there was only one nucleotide ‘T’ deletion in 127 bp.
4.4 Genotyping of Plasmodium falciparum
P. falciparum-mono infection samples were genotyped using the highly polymorphic
repetitive regions of MSP-1, MSP-2 and GLURP genes. Multiple fragments were detected
from all allelic families (Table 4.3). Ten different bands in the MAD20 allelic family were
found, 0-4 in each sample; the fragment size ranged from near 160 bp to approximately
P.know_IndP.know_Vietnam_FJ871986P.know_KH43 S-type_DQ350257P.know_Nuri strain S-type_DQ350263
P.know_IndP.know_Vietnam_FJ871986P.know_KH43 S-type_DQ350257P.know_Nuri strain S-type_DQ350263
P.know_IndP.know_Vietnam_FJ871986P.know_KH43 S-type_DQ350257P.know_Nuri strain S-type_DQ350263
10 20 30 40 50
GTTAGCGAGA GCCACAAAAA AGCGAATTCC AATATATGTT TTCTGCTTTAGTTAGCGAGA GCCACAAAAA AGCGAATTCC AATATATGTT TTCTGCTTTAGTTAGCGAGA GCCACAAAAA AGCGAATTCC AATATATGTT TTCTGCTTTAGTTAGCGAGA GCCACAAAAA AGCGAATTCC AATATATGTT TTCTGCTTTA
60 70 80 90 100
TGTGCGCATC CTCTACCTAT TAAGTGTTAA TTAAATTAAA GGGTTTCTTTTGTGCGCATC CTCTACCTAT TAAGTGTTAA TTAAATTAAA GGGTTTCTTTTGTGCGCATC CTCTACCTAT TAAGTGTTAA TTAAATTAAA GGGTTTCTTTTGTGCGCATC CTCTACCTAT TAAGTGTTAA TTAAATTAAA GGGTTTCTTT
110 120 130 140 150
TTAAAATCTT CTATAACTAA TAAAAA-ATA CGGAAGATTT TGTTACTTTGTTAAAATCTT CTATAACTAA TAAAAA-ATA CGGAAGATTT TGTTACTTTGTTAAAATCTT CTATAACTAA TAAAAA-ATA TGGAAGATTT TGTTACTTTGTTAAAATCTT CTATAACTAA TAAAAATATA TGGAAGATTT TGTTACTTTG
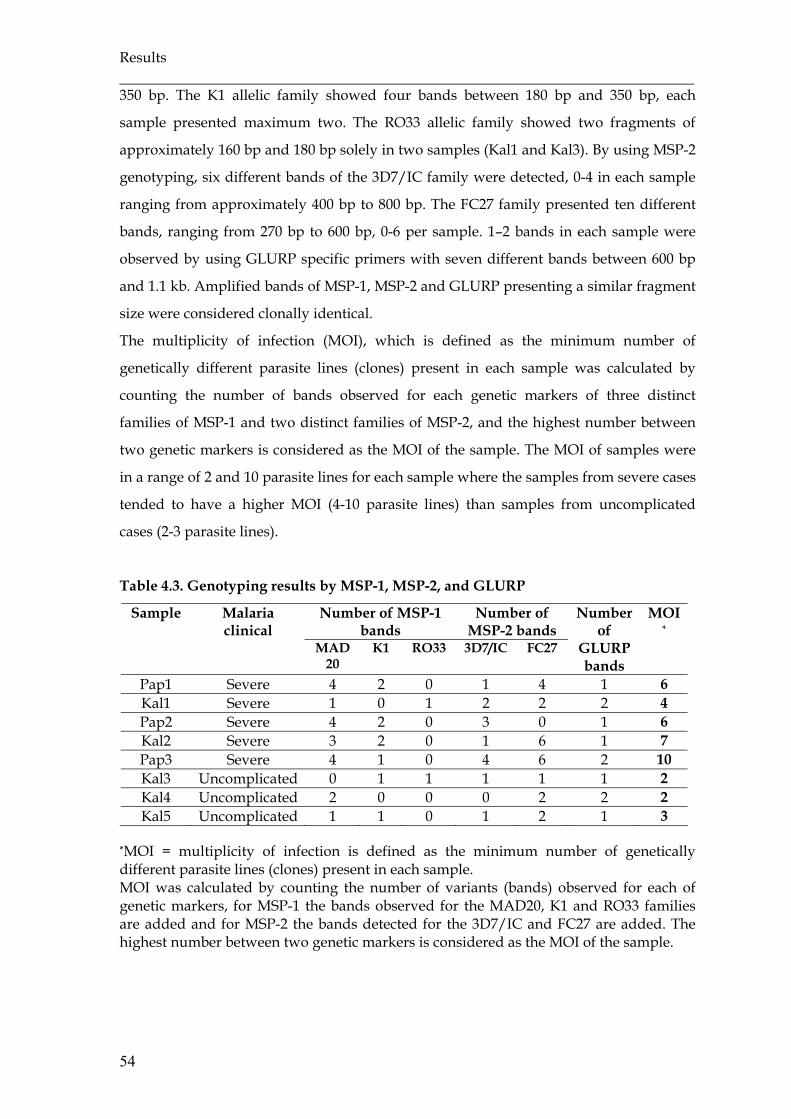
Results ________________________________________________________________________
54
350 bp. The K1 allelic family showed four bands between 180 bp and 350 bp, each
sample presented maximum two. The RO33 allelic family showed two fragments of
approximately 160 bp and 180 bp solely in two samples (Kal1 and Kal3). By using MSP-2
genotyping, six different bands of the 3D7/IC family were detected, 0-4 in each sample
ranging from approximately 400 bp to 800 bp. The FC27 family presented ten different
bands, ranging from 270 bp to 600 bp, 0-6 per sample. 1–2 bands in each sample were
observed by using GLURP specific primers with seven different bands between 600 bp
and 1.1 kb. Amplified bands of MSP-1, MSP-2 and GLURP presenting a similar fragment
size were considered clonally identical.
The multiplicity of infection (MOI), which is defined as the minimum number of
genetically different parasite lines (clones) present in each sample was calculated by
counting the number of bands observed for each genetic markers of three distinct
families of MSP-1 and two distinct families of MSP-2, and the highest number between
two genetic markers is considered as the MOI of the sample. The MOI of samples were
in a range of 2 and 10 parasite lines for each sample where the samples from severe cases
tended to have a higher MOI (4-10 parasite lines) than samples from uncomplicated
cases (2-3 parasite lines).
Table 4.3. Genotyping results by MSP-1, MSP-2, and GLURP
Number of MSP-1 bands
Number of MSP-2 bands
Sample Malaria clinical
MAD20
K1 RO33 3D7/IC FC27
Number of
GLURP bands
MOI*
Pap1 Severe 4 2 0 1 4 1 6 Kal1 Severe 1 0 1 2 2 2 4 Pap2 Severe 4 2 0 3 0 1 6 Kal2 Severe 3 2 0 1 6 1 7 Pap3 Severe 4 1 0 4 6 2 10 Kal3 Uncomplicated 0 1 1 1 1 1 2 Kal4 Uncomplicated 2 0 0 0 2 2 2 Kal5 Uncomplicated 1 1 0 1 2 1 3
*MOI = multiplicity of infection is defined as the minimum number of genetically different parasite lines (clones) present in each sample. MOI was calculated by counting the number of variants (bands) observed for each of genetic markers, for MSP-1 the bands observed for the MAD20, K1 and RO33 families are added and for MSP-2 the bands detected for the 3D7/IC and FC27 are added. The highest number between two genetic markers is considered as the MOI of the sample.
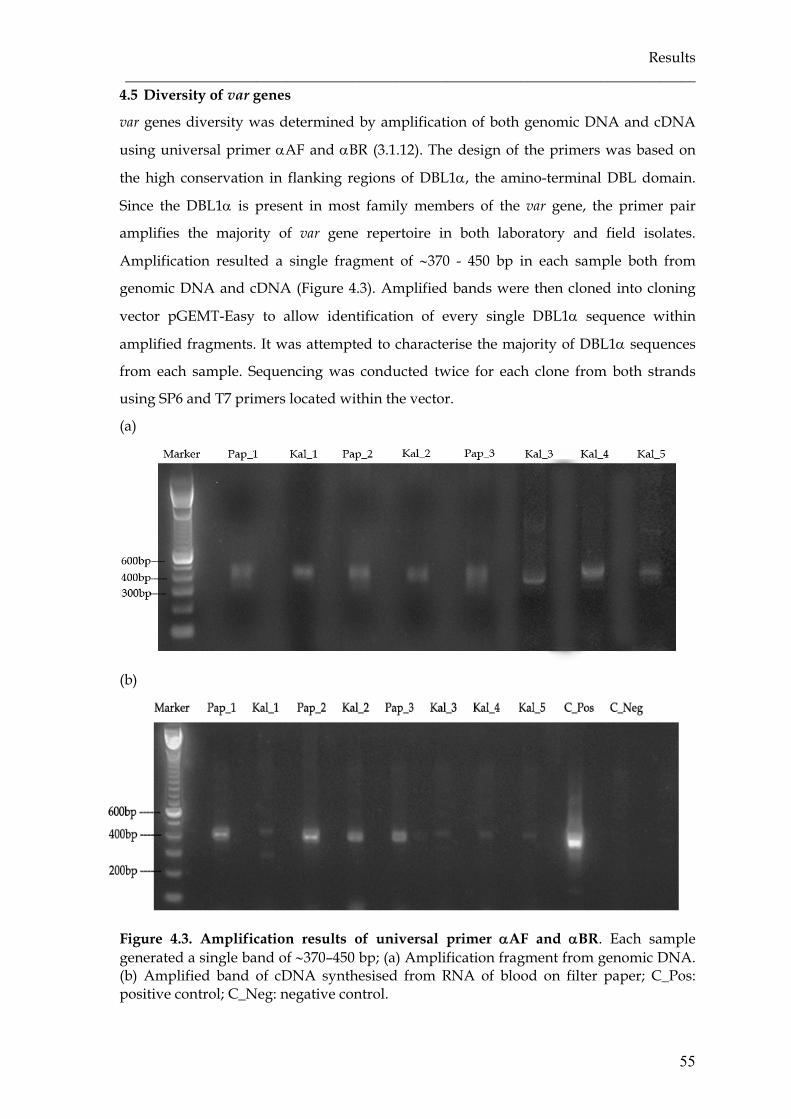
Results ______________________________________________________________________________
55
4.5 Diversity of var genes
var genes diversity was determined by amplification of both genomic DNA and cDNA
using universal primer αAF and αBR (3.1.12). The design of the primers was based on
the high conservation in flanking regions of DBL1α, the amino-terminal DBL domain.
Since the DBL1α is present in most family members of the var gene, the primer pair
amplifies the majority of var gene repertoire in both laboratory and field isolates.
Amplification resulted a single fragment of ∼370 - 450 bp in each sample both from
genomic DNA and cDNA (Figure 4.3). Amplified bands were then cloned into cloning
vector pGEMT-Easy to allow identification of every single DBL1α sequence within
amplified fragments. It was attempted to characterise the majority of DBL1α sequences
from each sample. Sequencing was conducted twice for each clone from both strands
using SP6 and T7 primers located within the vector.
(a)
(b)
Figure 4.3. Amplification results of universal primer αAF and αBR. Each sample generated a single band of ∼370–450 bp; (a) Amplification fragment from genomic DNA. (b) Amplified band of cDNA synthesised from RNA of blood on filter paper; C_Pos: positive control; C_Neg: negative control.

Results ________________________________________________________________________
56
Derived from eight field isolates, where three originated from Papua and five from
South Kalimantan province, seventy-one different sequences out of total 104 DBL1α
sequenced clones were identified with less than 95% sequence similarity. Twelve
different sequences derived from parasite cDNA of four severe and one of
uncomplicated malaria patients. Others were amplified from parasite genomic DNA of
all patients. On average, 8.9 different DBL1α sequences per isolate were discovered.
Figure 4.4. Unrooted phylogram of DBL1α sequence tag from Indonesian field isolates and other global isolates. Four pairs (Kal4.C62 - Kal5.C1; Kal4.B12 - Kal5.A4, Kal1.B7 - Kal5.C3; Pap2.A2 - Pap3.A11) of DBL1α sequences presented more than 95% similarity. Each pair was detected in two different isolates but originated from the same geographical area. Two sequences from Papua (Pap1.13 and Pap3.C8) showed more than 95% similarity with isolates from India and Solomon Islands.
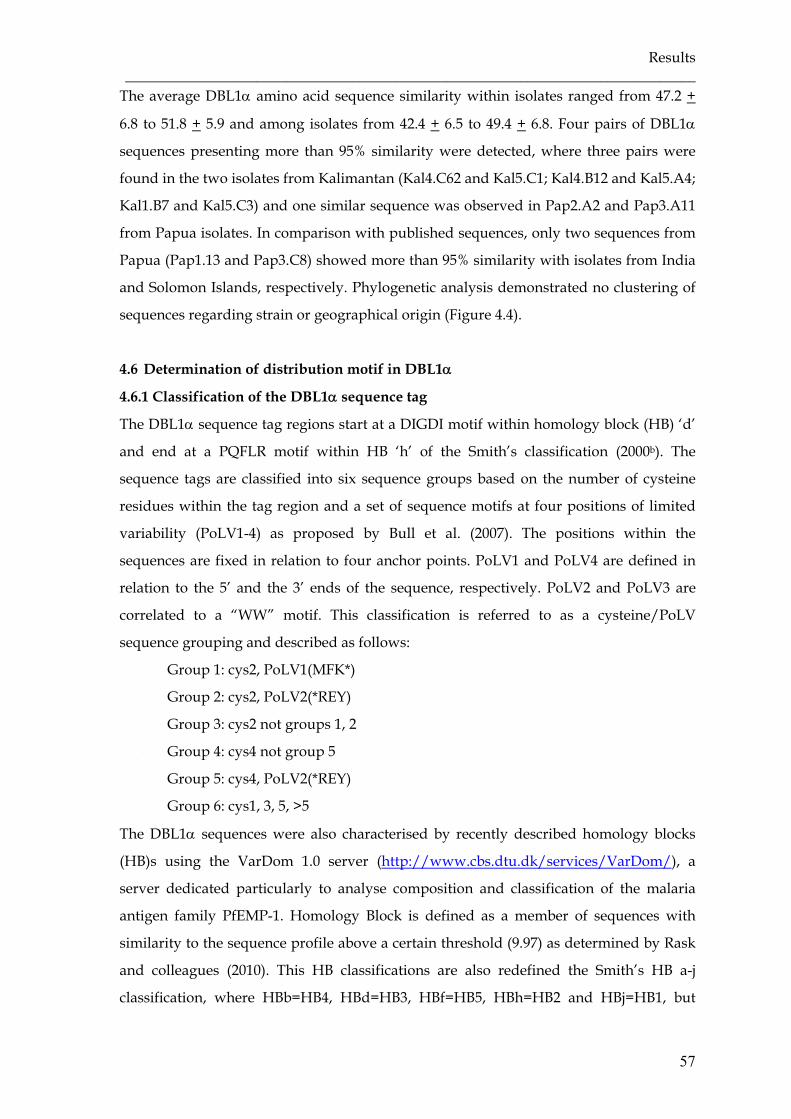
Results ______________________________________________________________________________
57
The average DBL1α amino acid sequence similarity within isolates ranged from 47.2 +
6.8 to 51.8 + 5.9 and among isolates from 42.4 + 6.5 to 49.4 + 6.8. Four pairs of DBL1α
sequences presenting more than 95% similarity were detected, where three pairs were
found in the two isolates from Kalimantan (Kal4.C62 and Kal5.C1; Kal4.B12 and Kal5.A4;
Kal1.B7 and Kal5.C3) and one similar sequence was observed in Pap2.A2 and Pap3.A11
from Papua isolates. In comparison with published sequences, only two sequences from
Papua (Pap1.13 and Pap3.C8) showed more than 95% similarity with isolates from India
and Solomon Islands, respectively. Phylogenetic analysis demonstrated no clustering of
sequences regarding strain or geographical origin (Figure 4.4).
4.6 Determination of distribution motif in DBL1α
4.6.1 Classification of the DBL1α sequence tag
The DBL1α sequence tag regions start at a DIGDI motif within homology block (HB) ‘d’
and end at a PQFLR motif within HB ‘h’ of the Smith’s classification (2000b). The
sequence tags are classified into six sequence groups based on the number of cysteine
residues within the tag region and a set of sequence motifs at four positions of limited
variability (PoLV1-4) as proposed by Bull et al. (2007). The positions within the
sequences are fixed in relation to four anchor points. PoLV1 and PoLV4 are defined in
relation to the 5’ and the 3’ ends of the sequence, respectively. PoLV2 and PoLV3 are
correlated to a “WW” motif. This classification is referred to as a cysteine/PoLV
sequence grouping and described as follows:
- Group 1: cys2, PoLV1(MFK*)
- Group 2: cys2, PoLV2(*REY)
- Group 3: cys2 not groups 1, 2
- Group 4: cys4 not group 5
- Group 5: cys4, PoLV2(*REY)
- Group 6: cys1, 3, 5, >5
The DBL1α sequences were also characterised by recently described homology blocks
(HB)s using the VarDom 1.0 server (http://www.cbs.dtu.dk/services/VarDom/), a
server dedicated particularly to analyse composition and classification of the malaria
antigen family PfEMP-1. Homology Block is defined as a member of sequences with
similarity to the sequence profile above a certain threshold (9.97) as determined by Rask
and colleagues (2010). This HB classifications are also redefined the Smith’s HB a-j
classification, where HBb=HB4, HBd=HB3, HBf=HB5, HBh=HB2 and HBj=HB1, but
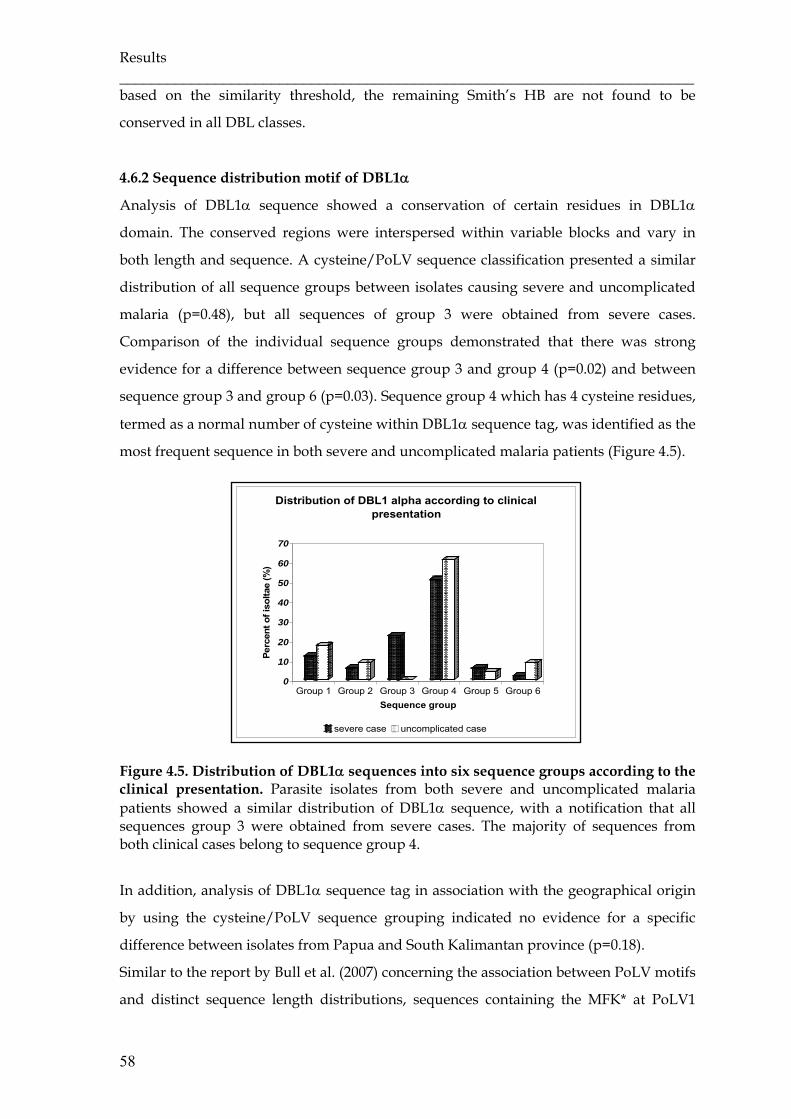
Results ________________________________________________________________________
58
based on the similarity threshold, the remaining Smith’s HB are not found to be
conserved in all DBL classes.
4.6.2 Sequence distribution motif of DBL1α
Analysis of DBL1α sequence showed a conservation of certain residues in DBL1α
domain. The conserved regions were interspersed within variable blocks and vary in
both length and sequence. A cysteine/PoLV sequence classification presented a similar
distribution of all sequence groups between isolates causing severe and uncomplicated
malaria (p=0.48), but all sequences of group 3 were obtained from severe cases.
Comparison of the individual sequence groups demonstrated that there was strong
evidence for a difference between sequence group 3 and group 4 (p=0.02) and between
sequence group 3 and group 6 (p=0.03). Sequence group 4 which has 4 cysteine residues,
termed as a normal number of cysteine within DBL1α sequence tag, was identified as the
most frequent sequence in both severe and uncomplicated malaria patients (Figure 4.5).
Figure 4.5. Distribution of DBL1α sequences into six sequence groups according to the clinical presentation. Parasite isolates from both severe and uncomplicated malaria patients showed a similar distribution of DBL1α sequence, with a notification that all sequences group 3 were obtained from severe cases. The majority of sequences from both clinical cases belong to sequence group 4.
In addition, analysis of DBL1α sequence tag in association with the geographical origin
by using the cysteine/PoLV sequence grouping indicated no evidence for a specific
difference between isolates from Papua and South Kalimantan province (p=0.18).
Similar to the report by Bull et al. (2007) concerning the association between PoLV motifs
and distinct sequence length distributions, sequences containing the MFK* at PoLV1
0
10
20
30
40
50
60
70
Perc
ent o
f iso
ltae
(%)
Group 1 Group 2 Group 3 Group 4 Group 5 Group 6Sequence group
Distribution of DBL1 alpha according to clinical presentation
severe case uncomplicated case

Results ______________________________________________________________________________
59
(group 1) or the *REY at PoLV2 (group 2 and 5) were associated with short sequences
(Figure 4.6).
Figure 4.6. Association of PoLV motifs with distinct sequence length distributions. Two PoLV motifs were independently associated with short sequence i.e. MFK* at PoLV1 for sequence group 1 and *REY at PoLV2 for sequence group 2 and 5.
(a) (b)
(c) (d)
Figure 4.7. Distribution of PoLV1-4 motifs within isolates causing severe and uncomplicated malaria. Each PoLV has one motif as a major motif that was observed in both severe and uncomplicated cases. Some motifs were detected solely in severe or uncomplicated malaria. (a) The most frequent motif of PoLV1 was LYLG. (b) In PoLV2 , LRED was the major motif. (c) Most PoLV3 motifs were KAIT. (d) Main motif in PoLV4 was PTYF.
0
5
10
15
20
25
Prop
ortio
n of
seq
uenc
es (%
)
LYLG
LFLG
LYS
GLY
RG
LYR
RLY
IRM
FKR
MFK
PLF
RG
LFY
GLY
GR
LFIG
LYLS
MFL
PLF
LGV
YLG
IFR
GIF
KP
PFY
GM
FLG
LYV
GLY
FGM
FKP
LYP
GM
FKS
Distribution of PoLV1
SEVERE UNCOMPLICATED
0
10
20
30
40
50
60
70
Prop
ortio
n of
seq
uenc
e (%
)
LRE
D
LRE
H
IRE
Y
LRE
Y
LRE
A
VR
EY
LRD
D
VG
EA
LRN
A
LRN
D
Distribution of PoLV2
SEVERE UNCOMPLICATED
0
10
20
30
40
50
Prop
ortio
n of
seq
uenc
es (%
)
KA
IT
KA
LT
YAIT
EA
IT
RAI
T
KAM
T
ES
IT
YAM
T
EA
LT
NA
LT
NA
MI
NAI
T
KA
MI
KA
II
Distribution of PoLV3
SEVERE UNCOMPLICATED
0
10
20
30
40
50
60
Prop
ortio
n of
seq
uenc
es (%
)
PTY
F
PTN
L
PTN
F
ITN
L
PTY
L
PTF
L
PTK
L
LTN
L
LTN
F
PAN
L
Distribution of PoLV4
SEVERE UNCOMPLICATED

Results ________________________________________________________________________
60
One motif in each PoLV was revealed as the major motif and observed in both severe
and uncomplicated cases, i.e. LYLG in PoLV1, LRED in PoLV2, KAIT in PoLV3 and
PTYF in PoLV4. Some motifs were detected solely in either severe or uncomplicated
malaria (Figure 4.7).
Analysis using varDom server showed that our DBL1α sequences stretched from the
most prevalent HB3 to HB2, including subdomain S2b and S2c. It showed a presence of
HB36 in all sequences containing 4 cysteine residues (cys4) but absence in all sequences
containing 2 cysteine residues (cys2) as described previously (Rask et al., 2010). HB60
was found in almost all cys2 sequences and in 11 of 51 (21.6%) cys4 sequences. The same
percentage of cys4 sequences presented also HB88 that were absent in cys2 sequences.
HBs 2, 3, 5, 14, 54, 60, 64, and 131 were found in both sequence types. HB36, HB79, and
HB88 could only be detected in cys4 sequences (Appendix 1 and 2).
4.6.3 Distribution motif in expressed var DBL1α sequence
Nine different DBL1α sequences amplified from cultured parasite cDNA of one severe
malaria case were identified. Four sequences showed similarities of 97-99%, differing
minimally in HB5 and 14 and might be considered as the same. var gene expression was
also investigated by RNA extraction of dried blood on filter paper. The sequences were
mostly similar to those derived from the genomic DNA of each isolate.
Analysis using a cysteine/PoLV classification of cultured parasite cDNA (Pap1) showed
sequence group 2 once, sequence group 3 five times and sequence group 4 three times
(Table 4.4). Meanwhile, two var gene sequences from blood filter paper of severe cases
belonged to sequence group 1 and two to sequence group 3. But, solely one case of
uncomplicated malaria showed a DBL1α sequence tag by amplification belonging to
sequence group 1. Amplification of two other uncomplicated cases yielded single bands
but sequencing results showed less than 12% similarity with DBL1α.
Tabel 4.4. Distribution motif of expressed var DBL1α sequences
Cysteine/PoLV grouping (cys2) Cysteine/PoLV grouping (cys4)
Cysteine/ PoLV
grouping (cys
others)
RNA Source
Group 1 (sequence)
Group 2 (sequence)
Group 3 (sequence)
Group 4 (sequence)
Group 5 (sequence)
Group 6 (sequence)
Filter paper
3 0 2 0 0 0
Culture 0 1 5 3 0 0
Results ______________________________________________________________________________
61
All expressed sequences extracted from filter paper of severe cases and two third
extracted from culture of severe patient consisted of only two cysteine residues as shown
in table 4.4, consistent with presence of HB 60 and absence of HB 36 (Appendix 2). Three
sequences derived from cDNA of the cultured parasites presented 4 cysteine residues
(cys4) and showed HB 36 in three sequences and HB60 in two sequences (Appendix 1).
4.7 Identification of conserved DBL domains
DBL domains were also identified from genomic DNA and cDNA by using degenerate
UNIEBP primers (3.1.12). The primers were designed for the relatively conserved motifs
of DBL domains. Amplification of genomic DNA resulted in multiple fragments ranging
from nearly 250 bp to 1 kb in all samples as presented in figure 4.8. Samples originating
from the same geographical area tended to present similar patterns of amplified bands
i.e. Pap1, Pap2 and Pap3 which came from Papua and Kal1, Kal2, Kal3, Kal4 and Kal5
which originated from South Kalimantan. Samples from South Kalimantan generated
more amplified fragments then those of from Papua. Sequencing of the 525 bp band
corresponded to a var gene coding for DBLγ isolated in Gabon, the 445 bp fragment
matched with a var gene coding for PfEMP-1 from an isolate associated with placental
malaria in Malawian women.
Figure 4.8. Amplification of genomic DNA by using UNIEBP primers. Each sample yielded multiple bands ranging from nearly 250 bp to 1 kb. Samples from the same geographical area tended to present similar pattern of amplified fragments.
Amplification of cDNA generated one to four bands ranging from 250 bp to
approximately 600 bp in four out of five severe malaria patients, and no band observed
from cDNA of uncomplicated cases although they had quantifiable RNA. Sequencing of
a 418 bp fragment matched with the Plasmodium falciparum eba-175 gene and a 316 bp
corresponded to DBL1α domain. A 486 bp band matched with the DBLγ domain isolated
Results ________________________________________________________________________
62
from placenta of Malawian women with PAM and var1CSA of 3D7. This band was only
found in a male patient from Papua (Pap3).
4.8 Detection of var D-like gene
To investigate the association of expressed specific motifs with severe malaria outcome,
var D-like specific primers (3.1.12) were designed based on the 525 bp fragment of the
PCR product that resulted from UNIEBP primers, as reported by Ariey and colleagues
(2001). Amplification using var D-like specific primers resulted in multiple fragments
from genomic DNA of all samples, but generated a single ∼237 bp fragment of expressed
sequences from four severe malaria patients only. Sequence identity to the previously
reported var D gene (AJ277137) (Ariey et al., 2001) was 29.0, 27.8, 27.0 and 19.3 % for var
D-like sequence of Kal2, Pap3, Pap1 and Pap2, respectively.
Our var D-like sequences showed 80-94% identity with the DBLγ fragment of PfEMP-1
from several isolates including 3D7, Malawian isolates from patients with pregnancy-
associated malaria (PAM), placental isolates from Gabon, Kenya and Malawi (Figure
4.9). However, further analysis showed three conserved motifs containing 6-10
nucleotides within all four of our sequences (Figure 4.9).

Results ______________________________________________________________________________
63
Figure 4.9. Multiple aligment of specific var D-like sequences. Specific primers designed for the Indonesian var-D like sequence resulted in sequences corresponding to different sequence types including the DBLγ domain of PfEMP-1 isolated from 3D7 [XM_001351285] and patients in association with PAM [AF547123]. Sequence identity of 29.0, 27.8, 27.0 and 19.3 % was shown for var D-like sequence of Kal2, Pap3, Pap1 and Pap2 respectively to the previously reported var D gene (AJ277137). Black boxes: conserved motifs containing of 6-10 nucleotides.
Analysis using varDom 1.0 server showed the conserved motif in HB3 and HB5, one
sequence shared HB86 with the previously reported var D gene (Table 4.5). Of interest,
HB86 was mainly found in DBLγ domain while the proposed var D gene (AJ277137) was
reported to correspond with DBLδ domain. Another sequence showed HB27 and HB98,
one other sequence presented HB82 and the rest showed only HB3.
Table 4.5. Distribution of homology blocks (HBs) among the proposed var D gene using VarDom server
Score S2b subdomain Sequence Score HB3 HB82 HB86 HB98 HB27 HB624
HB5
Pap1.var D-like - 26.5 - - - - 16.4 Pap2.var D-like 24.6 - - - - - - Pap3.var D-like 31.3 - - 30.1 14.7 - 22.5 Kal2.var D-like 35.5 - 32.0 - - 18.1 - AJ277137 (var D) 37.4 - 32.6 - - - 32.2

Results ________________________________________________________________________
64
4.9 Identification of DBLβ-C2 domain of PfEMP-1
Specific primer for the DBLβ-C2 sequence were designed according to several referred
sequences of the DBLβ-C2 domain (2.1.12): JDP8 (AY028643), isolate IT4/24/25 (IT-
ICAM var) (AY578326), clone A4 strain IT4/25/5 (L42244.1), clone A4tres isolate IT
(AF193424) and FCR3var CSA (AJ133811). After a series of PCR optimisation,
amplification of genomic DNA generated 1-2 fragments in most samples, except for
isolate Pap3 that presented additional bands of 500 bp and 600 bp, but all samples had a
band of nearly 1.7 kb. Two samples had a similar pattern of amplified fragments (Figure
4.10).
Figure 4.10. Amplification results using specific DBLβ-C2 primer from genomic DNA of field isolates. All samples had a band nearly 1.7 kb with one or two additional bands around 3 kb (Pap1, Kal1) or 600 bp and 500 bp (Pap3). Kal3 and Kal4 presented similar pattern of amplified band. A ∼1.7 kb fragment was used for cloning to identify the DBLβ-C2 sequences of field isolates.
Considering the length of DBLβ-C2 domain from referred sequences, we took the ∼1.7 kb
band and cloned them into a pGEMT-Easy vector. Four to seven clones for each sample
were sequenced twice from both strands using SP6 and T7 primers. Due to the length of
DBLβ-C2 sequences, we did primer walking by designing specific primers of the DBLβ-
C2 sequence of each sample in order to identify the inner part of the sequences (3.1.12).
Derived from eight field samples, ten different sequences out of thirty-seven sequenced
clones were identified (Figure 4.10). Each sample possessed one DBLβ-C2 sequence type,
except for Pap2 and Pap3 had two sequence types. Three DBLβ-C2 sequences from three
different samples (Kal1, Kal3, and Kal5) presented more than 99% sequence similarity,
all three samples were originated from the same geographical area but had different
clinical manifestations, Kal1 was from patient suffering from severe malaria but Kal3
and Kal5 from uncomplicated malaria patients. Nucleotide blasting using NCBI database

Results ______________________________________________________________________________
65
demonstrated 76–84% identity with DBLβ domain of PfEMP-1 from distinct P. falciparum
isolates except for Pap2 with 98% identity with PfEMP-1 of IT4/25/5 strain. The amino
acid blasting also showed 96% identity with the PfEMP-1 of IT4/25/5 strain for Pap2 but
a range of 44–53% identity with the PfEMP-1 proteins of several P. falciparum field
isolates.
Our DBLβ domains except Kal2.DBLβ shared many similar features including twelve
cysteine residues and blocks of highly conserved amino acids which are flanked by more
extensive polymorphic regions as previously described by Smithb and colleagues (2000).
Similar to the Smith’s description concerning the consensus feature of DBLβ and C2
domain, the DBLβ domain is followed by the C2 domain which varies in length,
containing four invariant cysteine residues (Figure 4.11). Twelve conserved cysteine
residues in DBLβ domain are numbered as C1-C12 and the C2 domain are C13–C16.
Multiple sequence alignment with other DBL domains both from PfEMP-1 DBL and EBA
DBL revealed that those 12 cysteine residues correspond to C1, C4, C5, C5a, C6, C6a, C7,
C7a, C8, C8a, C9 and C10, as the conserved cysteine residues are identified with an
Arabic numeral and a letter to indicate their position and to maintain the original
nomenclature for identifying cysteine (Table 4.6).
Tabel 4.6. Position of cysteine residues within DBLβ-C2 domain of field isolates corresponding to those of both PfEMP-1 DBL and EBA DBL.
Sequence Cysteine residues numbering DBL domain consensus for PfEMP-1 and EBA
C1 C4 C5 C5a C6 C6a C7 C7a C8 C8a C9 C10
DBLβ domain of field isolates
C1 C2 C3 C4 C5 C6 C7 C8 C9 C10 C11 C12
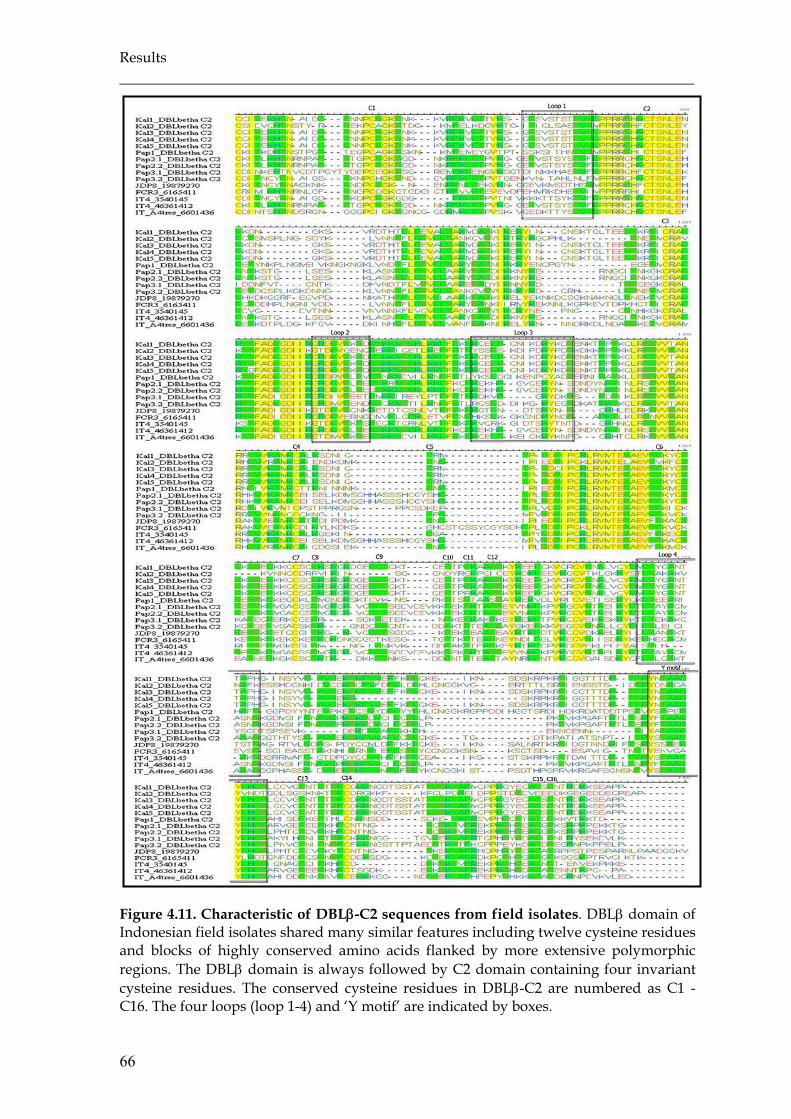
Results ________________________________________________________________________
66
Figure 4.11. Characteristic of DBLβ-C2 sequences from field isolates. DBLβ domain of Indonesian field isolates shared many similar features including twelve cysteine residues and blocks of highly conserved amino acids flanked by more extensive polymorphic regions. The DBLβ domain is always followed by C2 domain containing four invariant cysteine residues. The conserved cysteine residues in DBLβ-C2 are numbered as C1 - C16. The four loops (loop 1-4) and ‘Y motif’ are indicated by boxes.

Results ______________________________________________________________________________
67
Compared to another DBLβ-C2 sequences, Kal2.DBLβ-C2 sequence presented the most
different sequence feature, it lacked several conserved cysteine residues, including C6,
C8-C11 of DBLβ domain and C13, C15 and C16 of C2 domain. Despite many differences
with the consensus feature of DBLβ and C2 domain, Kal2.DBLβ-C2 sequence exhibited
the ‘Y motif’ within C2 domain which was reported to play an important role in binding
function of DBLβ-C2 domain. Some DBLβ-C2 sequences also revealed little differences
such as Kal3 had one more cysteine residue in between C5 and C6, Kal5 lacked of C11
and was substituted by arginine (R) and Pap1 had serine (S) to substitute C12. However,
all sequences (Kal3, Kal5 and Pap1) had the ‘Y motif’ within C2 domain (Figure 4.11).
For further confirmation, analysis by using varDom 1.0 server
(http://www.cbs.dtu.dk/services/VarDom/) was conducted. It was shown that all
sequences except for Kal2 were identified as DBLβ domain. Although Kal2 was not
identified as DBLβ domain, it remained to be classified as Duffy binding domain (Table
4.7). HB analysis for DBLβ domain demonstrated the presence of five major HBs (HB1-5)
in all sequences (Table 4.8), moreover HB53 in subdomain S1, HB146 in subdomain S2b,
HB59 in subdomain S3a and HB61 and HB62 in subdomain S3b appeared as HB
characteristics of DBLβ domain (Appendix 3).
Table 4.7. Sequence family classification of DBLβ-C2 domain from field isolates using varDom server
Score for sequence family classification DBLβ-C2 sequence Duffy-binding domain DBL β domain
Pap1 345.0 719.0 Kal1 393.1 858.0 Pap2.1 384.2 855.4 Pap2.2 384.1 855.6 Kal2 255.3 - Pap3.1 357.6 703.1 Pap3.2 368.6 823.7 Kal3 383.7 844.6 Kal4 377.3 784.7 Kal5 380.3 832.6
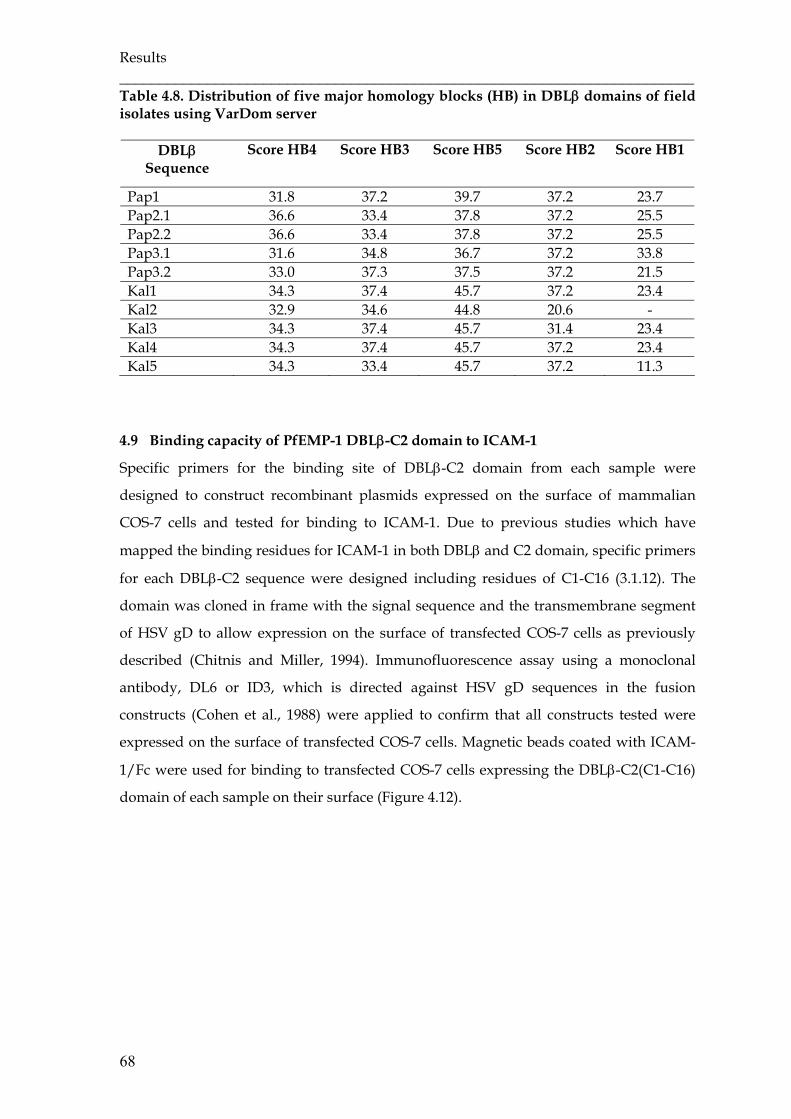
Results ________________________________________________________________________
68
Table 4.8. Distribution of five major homology blocks (HB) in DBLβ domains of field isolates using VarDom server
DBLβ Sequence
Score HB4 Score HB3 Score HB5 Score HB2 Score HB1
Pap1 31.8 37.2 39.7 37.2 23.7 Pap2.1 36.6 33.4 37.8 37.2 25.5 Pap2.2 36.6 33.4 37.8 37.2 25.5 Pap3.1 31.6 34.8 36.7 37.2 33.8 Pap3.2 33.0 37.3 37.5 37.2 21.5 Kal1 34.3 37.4 45.7 37.2 23.4 Kal2 32.9 34.6 44.8 20.6 - Kal3 34.3 37.4 45.7 31.4 23.4 Kal4 34.3 37.4 45.7 37.2 23.4 Kal5 34.3 33.4 45.7 37.2 11.3
4.9 Binding capacity of PfEMP-1 DBLβ-C2 domain to ICAM-1
Specific primers for the binding site of DBLβ-C2 domain from each sample were
designed to construct recombinant plasmids expressed on the surface of mammalian
COS-7 cells and tested for binding to ICAM-1. Due to previous studies which have
mapped the binding residues for ICAM-1 in both DBLβ and C2 domain, specific primers
for each DBLβ-C2 sequence were designed including residues of C1-C16 (3.1.12). The
domain was cloned in frame with the signal sequence and the transmembrane segment
of HSV gD to allow expression on the surface of transfected COS-7 cells as previously
described (Chitnis and Miller, 1994). Immunofluorescence assay using a monoclonal
antibody, DL6 or ID3, which is directed against HSV gD sequences in the fusion
constructs (Cohen et al., 1988) were applied to confirm that all constructs tested were
expressed on the surface of transfected COS-7 cells. Magnetic beads coated with ICAM-
1/Fc were used for binding to transfected COS-7 cells expressing the DBLβ-C2(C1-C16)
domain of each sample on their surface (Figure 4.12).
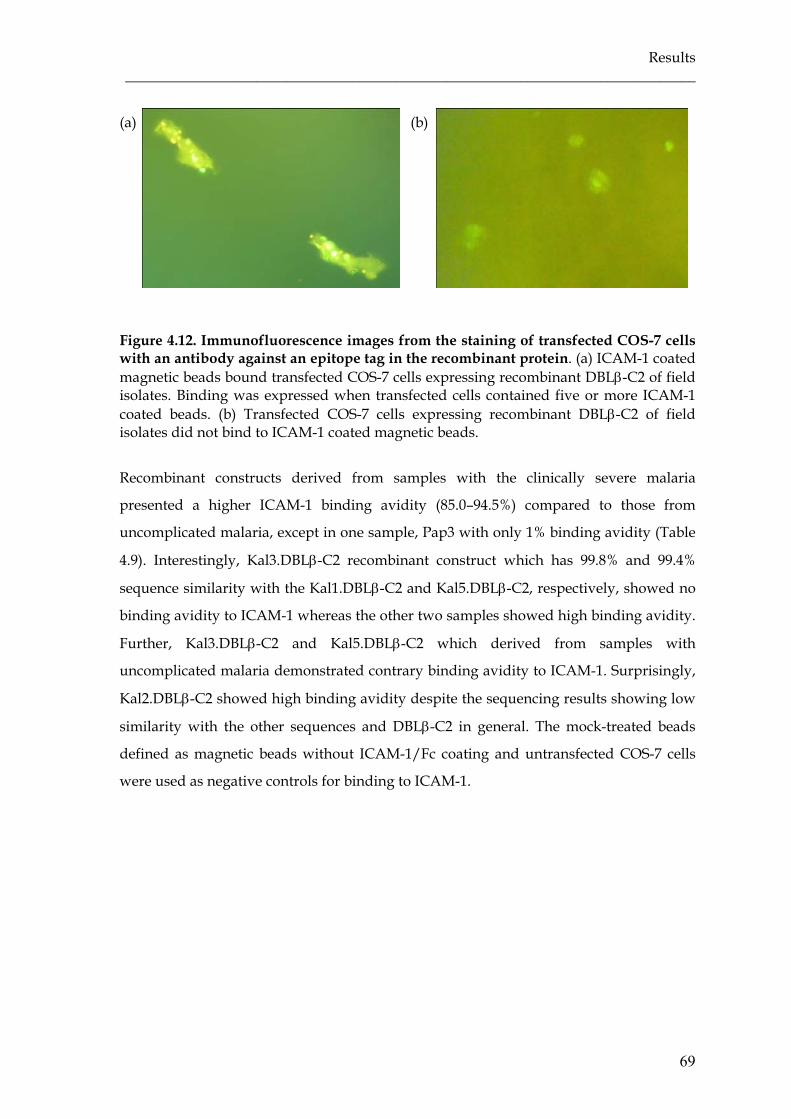
Results ______________________________________________________________________________
69
(a) (b)
Figure 4.12. Immunofluorescence images from the staining of transfected COS-7 cells with an antibody against an epitope tag in the recombinant protein. (a) ICAM-1 coated magnetic beads bound transfected COS-7 cells expressing recombinant DBLβ-C2 of field isolates. Binding was expressed when transfected cells contained five or more ICAM-1 coated beads. (b) Transfected COS-7 cells expressing recombinant DBLβ-C2 of field isolates did not bind to ICAM-1 coated magnetic beads.
Recombinant constructs derived from samples with the clinically severe malaria
presented a higher ICAM-1 binding avidity (85.0–94.5%) compared to those from
uncomplicated malaria, except in one sample, Pap3 with only 1% binding avidity (Table
4.9). Interestingly, Kal3.DBLβ-C2 recombinant construct which has 99.8% and 99.4%
sequence similarity with the Kal1.DBLβ-C2 and Kal5.DBLβ-C2, respectively, showed no
binding avidity to ICAM-1 whereas the other two samples showed high binding avidity.
Further, Kal3.DBLβ-C2 and Kal5.DBLβ-C2 which derived from samples with
uncomplicated malaria demonstrated contrary binding avidity to ICAM-1. Surprisingly,
Kal2.DBLβ-C2 showed high binding avidity despite the sequencing results showing low
similarity with the other sequences and DBLβ-C2 in general. The mock-treated beads
defined as magnetic beads without ICAM-1/Fc coating and untransfected COS-7 cells
were used as negative controls for binding to ICAM-1.
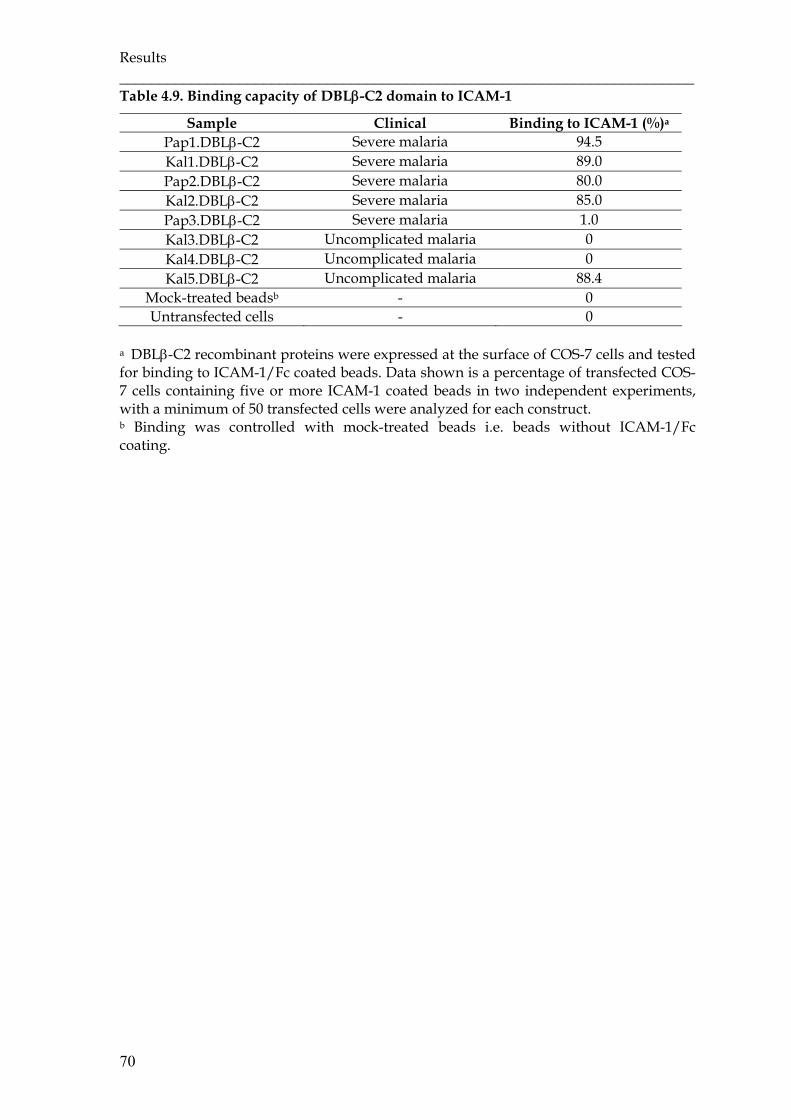
Results ________________________________________________________________________
70
Table 4.9. Binding capacity of DBLβ-C2 domain to ICAM-1
Sample Clinical Binding to ICAM-1 (%)a Pap1.DBLβ-C2 Severe malaria 94.5 Kal1.DBLβ-C2 Severe malaria 89.0 Pap2.DBLβ-C2 Severe malaria 80.0 Kal2.DBLβ-C2 Severe malaria 85.0 Pap3.DBLβ-C2 Severe malaria 1.0 Kal3.DBLβ-C2 Uncomplicated malaria 0 Kal4.DBLβ-C2 Uncomplicated malaria 0 Kal5.DBLβ-C2 Uncomplicated malaria 88.4
Mock-treated beadsb - 0 Untransfected cells - 0
a DBLβ-C2 recombinant proteins were expressed at the surface of COS-7 cells and tested for binding to ICAM-1/Fc coated beads. Data shown is a percentage of transfected COS-7 cells containing five or more ICAM-1 coated beads in two independent experiments, with a minimum of 50 transfected cells were analyzed for each construct. b Binding was controlled with mock-treated beads i.e. beads without ICAM-1/Fc coating.
5. DISCUSSION
5.1 Human Plasmodium knowlesi cases
The detection of P. knowlesi in this study broadens the geographic distribution of natural
P. knowlesi infection in humans. Although this is not surprising as there were previously
many human P. knowlesi infections reported in the Malaysian part of Borneo. All four P.
knowlesi infections were microscopically misdiagnosed as P. falciparum, as the early ring
stage of P. knowlesi is morphologically similar with the early ring stage of P. falciparum.
There was also a mixed infection with P. falciparum in three samples.
By using Pmk8 and Pmkr9, the sequencing results confirmed solely one out of four
positive samples by the PCR. A similar result was reported from Vietnam where only
two out of five positive samples with P. knowlesi by PCR were positive confirmed by
sequencing. The Pmk8 and Pmkr9 primers target the ssrRNA-S gene expressed during
the sexual stage. The sequence of the reverse primer Pmkr9 is found in P. vivax S-type
strains and other Plasmodium spp., especially related to P. vivax. The forward primer
Pmk8 on the other hand seemed to be more specific. Imwong and colleagues found that
these P. knowlesi primers (Pmk8 and Pmkr9) stochastically cross-react with P. vivax
genomic DNA resulting in false positive amplification when there is P. vivax genomic
DNA in the sample. All samples in this study were mixed infections with P. vivax, as
molecularly confirmed by PCR. Based on the results, it is recommended to confirm by
sequencing especially in cases of mixed infection. Furthermore, sequencing helps to
detect genetic variation of different Plasmodia species and populations from distinct
areas.
The patient infected with P. knowlesi had clinically mild malaria and was successfully
treated with chloroquine-primaquine. This is similar to the report by Putaporntip and
colleagues that all P. knowlesi-infected patients in Thailand had a low parasite density
and responded well to antimalarial drugs for either P. vivax (chloroquine-primaquine) or
P. falciparum (mefloquine-artesunate). However, Cox-Singh and colleagues reported four
fatal cases of P. knowlesi infection in Sarawak. All patients were relatively old (39-69
years old), presented with hyperparasitaemia and developed marked hepatorenal
dysfunctions defined as signs of severe P. falciparum malaria. It has been suggested that
the high parasite load and the compounding effect of 24 hours asexual replication cycle
lead to the fatal complication in P. knowlesi infection. A previous study demonstrated
that P. knowlesi is able to loose or increase its virulence during blood passages in human.

Discussion ________________________________________________________________________
72
Strain differences could also occur in wild populations and might effect human
differently (Coatney, 1971), resulting in a range of clinical manifestation from
uncomplicated to potentially life-threatening malaria.
Regarding the large distribution of the vector and the natural host of P. knowlesi, it is
very likely that P. knowlesi will be found in other parts of Indonesia. Since P. knowlesi is
only reliably diagnosable by molecular methods, further molecular and clinical studies
should be encouraged and new specific primer based on Indonesian P. knowlesi isolates
designed.
5.2 Characteristic of malaria patients
Malaria presents with a broad range of clinical manifestations from asymptomatic to
severe malaria leading to death. Once malaria takes a severe course, multiple organs are
affected. Our severe malaria patients were adult and had cerebral malaria along with
one or more of WHO-defined severe clinical manifestations including severe anaemia,
respiratory distress, renal failure, hepatic dysfunction and jaundice. The patients features
were similar to a large study in South-East Asia with predominantly adult patients and
strictly defined severe malaria where 54% of the 1050 patients had cerebral malaria,
37.1% renal impairment, 50.4% jaundice, 34.4% respiratory distress, 59.4% metabolic
acidosis and 18.4% severe anaemia (Dondorp et al., 2008). There are distinct patterns of
severe malaria according to malaria transmission intensity. In sub-Saharan Africa where
the transmission intensity tends to be high and stable, severe malaria is mainly a disease
for children under 5 years with cerebral malaria, severe anaemia or respiratory distress
(Marsh et al., 1995). Also in areas with moderate transmission, cerebral malaria in young
children is the most common presentation (Reybun et al., 2005; Snow et al., 1994).
Conversely, in areas with low transmission, such as South-East Asia, severe malaria
affects all age groups, but young adults are the most affected and commonly present
with multiple organ failure including cerebral malaria, renal failure, severe jaundice and
pulmonary oedema (White, 1987). Further, a study from a low transmission area in Asia
showed that age has a large effect on presented syndromes, with anaemia, respiratory
distress and convulsion being more common in children, whereas renal and hepatic
failures are more often found in adults (Dondorp, et al., 2008).
A number of age-specific rates of morbidity and mortality from epidemic falciparum
malaria in Asia have been described, adults seem consistently to be at higher risk of
severe disease (Dondorp et al., 2008; Mohanty et al., 2003; Greenberg and Lobel, 1990;
Baird et al., 1998; Schwartz et al., 2001). Our severe patients were people from Java who
Discussion ______________________________________________________________________________
73
are at little or no risk of malaria infection but they moved to either Papua or South
Kalimantan where malaria endemicity is higher. Those severe patients were considered
to be first exposed to malaria infection. Bairda and colleague (1998) reported an increased
risk of severe disease following primary exposure to P. falciparum with age among trans-
migrants moving from another part of Indonesia with lower risk of malaria infection to
Irian Jaya (now Indonesian Papua) with the highest malaria endemicity in Indonesia. An
intrinsic age-related difference in immune function is suggested leading to differences in
the balance between protective and harmful effects of host immune responses to P.
falciparum, profoundly affecting the course of infection.
Contrasting with most of our severe patients, the uncomplicated malaria patients were
residents of malaria endemic area. In an area with high transmission intensity, adults are
less affected to infection due to naturally acquired immunity that was developed during
the long-lived exposure to the parasites. Baird (1995) hypothesised that in malaria
endemic areas, naturally acquired immunity has dual aspects; an intermediate phase
referred as anti-disease or anti-toxic immunity which appears in young children exposed
to heavy infection, where the infected individual showing minimal or no signs of clinical
malaria even in the presence of high parasitaemia, and a true anti-parasite immunity
occurs in adults which preclude high-density parasitaemia and attendant disease. All of
our uncomplicated cases presented with mild malaria and low parasitaemia level,
indicating an existence of anti-parasite immunity.
5.3 Genotyping results
It was shown that infections in humans are frequently composed of a complex mixture
of parasite clones with different genetic and phenotypic characteristics (Ntoumi et al.,
1995; Conway and McBride, 1991; Greenwood et al., 1987). The number and relative ratio
of the various clones present at any time point vary substantially from individual to
individual. Analysis of the genetic characteristics of parasite populations using PCR und
subsequent RFLP provide the advantage of sensitivity and certain specificity. The single
copy genes MSP-1, MSP-2 and GLURP present large allelic polymorphisms, allowing
easy detection of parasite diversity. However, the approach using PCR commonly
underestimates the actual number of distinct alleles presents in the peripheral circulation
at the time of sampling due to some reasons: (1) distinct parasite clones carrying the
same allelic form are not differentiated, (2) alleles with identical size may present
sequence differences that are not distinguished (Miller et al., 1993), (3) alleles present at
very low density in a complex blood infection remain undetected (Kiwanuka, 2009).
Discussion ________________________________________________________________________
74
Genotyping resulted in multiple infections per patient shown as multiplicity of infection
(MOI). The MOI ranged from two to ten in each isolate, whereas samples from severe
patients had higher MOI than those from uncomplicated cases. The result was consistent
with a case series reported from India: mild cases had fewer clones compared to severe
cases (Ranjit et al., 2004; Ranjit et al., 2005). However, other data on the association of
MOI with disease severity showed conflicting results. Contrasting with our finding,
studies in Senegal (Robert et al., 1996) and Nigeria (Amodu et al., 2008) reported lower
MOI in severe malaria than in mild cases. But, reports from Madagascar (Durand et al.,
2008), Gabon (Mayengue et al., 2007) and Sudan (A-Elbasit et al., 2007) found no
association between the MOI and severity of malaria. The variability of the results
between studies may be in part due to differences in transmission levels according to
study sites, differences in genotyping methods and/or interpretation of data and
differences in sensitivity and accuracy used in different laboratories (Faernert et al., 2001;
Felger et al., 1999; Smith et al., 1999). One potential explanation for our results could be
that the higher the MOI the higher is the possibility of developing severe disease. The
probability of being infected with a drug-resistant strain, a more pathogenic strain or an
unknown strain to the host’s immune systeme is rising with rising MOI. Finally, it
should be noted that malaria outcome is certainly not only determined by parasite
characteristics, also host characteristics are involved. Several factors have been suggested
influence the MOI including the age of the host (Ntoumi et al., 1995), human genetic
polymorphisms (Ntoumi et al., 1997) and the levels of malaria endemicity and
transmission intensity (Arnot, 1998).
The study only focused on the association of MOI with levels of malaria endemicity and
transmission intensity. As predicted, samples from Papua had a higher MOI than those
from South Kalimantan. Papua province is a malaria stable transmission area and has
high endemicity class with PfPR2-10 > 40% (Elyazar et al., 2011). It has high malaria
transmission intensity where individuals receive more than one infection per year
(Karyana et al., 2008). In contrast, South Kalimantan province is a malaria stable
transmission area with moderate endemicity class, 5%< PfPR2-10 <40% (Elyazar et al.,
2011). Some studies reporting the relationship between the mean number of genotypes
per infected person and transmission intensity suggested that increase in transmission
level is generally associated with progressive increase in the average number of malaria
parasite clones per host (Appawu et al., 2004). This indicates that in areas with lower
transmission intensity infected persons should significantly have fewer parasite clones
(Paul et al., 1998; Paul et al., 1995). Furthermore, the antigenic and genetic repertoire of
Discussion ______________________________________________________________________________
75
P. falciparum populations is wider in high-transmission areas (Bendixen et al., 2001;
Hoffman et al., 2001; Faernert et al., 2009). Due to crossing and random mating between
gametes belonging to different parasite clones, intragenic recombination and
independent chromosome assortments during meiosis in the mosquito occur more
frequently (Babiker et al., 1994). This has important consequences for the global spread
of multigenic phenotypes such as vector competence, parasite virulence and anti-
malarial drug resistance (Paul et al., 1995).
5.4 var gene diversity
var gene diversity was determined by DBL1α region using αAF and αBR primers.
Although the var gene sequences have an extensively diverse organisation, the majority
of var genes contain the DBL1α region. The existence of homology blocks within this
region has enabled researchers to design primers that can be used to amplify a DBL1α
domain from the majority of samples (Taylora et al., 2000) including field isolates (Bull et
al., 2007).
In this study, the DBL1α region of P. falciparum field isolates derived from severe and
uncomplicated malaria patients from two different malaria endemic areas in Indonesia
was analysed. Consistent with previous studies on var gene diversity (Smith et al., 1995;
Smithb et al., 2000; Taylora et al., 2000; Ward et al., 1999), our results demonstrated
similar variability of DBL1α sequences within and between isolates. This implies that the
level of diversity represents the overall DBL1α heterogeneity that exists within each
isolate.
Barry and colleagues reported the global diversity in P. falciparum var genes from
different geographic regions. The diverse repertoire showed spatial structuring but
minimal overlap in the var gene repertoire among isolates from different regions,
indicating a global distribution of patterns (Barry et al., 2007). Our data demonstrated
little overlap of field isolates from geographically close regions; only four sequences
were shared each in two different isolates from the same geographical area. Comparison
with published sequences also presented minimal overlap among DBL1α sequences
from more different origins, concurred with previous studies that genetically diverse
parasites contained essentially non-overlapping var gene repertoires (Freitas-Junior et al.,
2000), indicating that var gene diversity on a global scale is immense.
Var sequence diversity is generated by frequent recombinations and rearrangements
within or between var genes, specifically through either reciprocal recombination or gene
Discussion ________________________________________________________________________
76
conversion (Taylorb et al; 2000; Freitas-Junior et al., 2000; Kyes et al., 2007). The
frequency of recombination between var genes depends upon chromosomal location,
gene orientation and homology in the gene flanking sequence (Ups). Var gene
recombination preferentially occurs within rather than between var groups, with the
exception of the semi-conserved var homologs (var1CSA, var2CSA and type 3 var) that
appear to recombine on their own (Kraemer et al., 2007). Further, recombination
processes can occur within each parasite genome as well as between two parasite
genomes during both meiosis (Freitas-Junior et al, 2000; Taylorb et al; 2000) and mitosis
(Duffy et al., 2009). This recombination hierarchy is globally maintaining the nature of
the distinct var gene groups.
However, selection is suggested to have a strong role in conserving var gene
organisation, indicated by appearance of common sequences among global isolates. As
var genes encode for variant target immunity and cytoadherence activity, the selective
forces to maintain both functions have been manifested in an apparent genetic grouping
of binding phenotypes to particular var gene sequences (Roberts et al., 1993).
5.5 Distribution motif in DBL1α sequences from genomic DNA
The DBL1α sequence tag was classified by using the cysteine/PoLV sequence grouping
and the new homology block defined by Rask et al (2010). The distribution of sequence
groups and HBs among isolates causing severe and uncomplicated malaria was similar,
indicating that DBL1α shares common sequences among different clinical categories.
According to the cysteine/PoLV sequence classification, the majority of sequences from
both clinical categories belonged to sequence group 4 having four cysteine residues
(cys4), referred as normal number of cysteine in DBL1α. Bull and colleagues (2007)
demonstrated that the majority of group B var genes, which are the most frequent
members of var genes, of group B/C and group C in laboratory isolates 3D7, HB3 and
IT4 belonged to sequence group 4. Almost all group A var genes lacking two cysteine
residues (cys2) are classified into sequence group 1-3, while sequence group 1 is
exclusively found in group A var gene and approximately 60% of group A var gene
belongs to sequence group 3, none of the cys2 type was found in group C var gene (Bull
et al., 2005). Interestingly, we observed that group 3 sequences were only found in
isolates having caused severe malaria. Although, we focused on DBL1α from genomic
DNA, the result still provides information on the potential expression of var genes,
where the parasite express a different var gene in every cycle through the switching

Discussion ______________________________________________________________________________
77
mechanism. Furthermore, studies on the association of expressed var gene with severe
malaria reported a tendency of DBL1α with reduced cysteine residues to be expressed in
severe malaria (Kirchgatter et al., 2002; Kyriacou et al., 2006).
Since we used the field isolates originated from two distinct geographical areas, we
further analyzed the distribution motif of DBL1α sequence tag in association with the
geographical origin. Concurred with a previous study which reported a similar
distribution of relative number of genomic sequences in each sequence group between
field isolates and laboratory isolate 3D7 (Bull et al., 2005), our result revealed a similar
sequence distribution between isolates, suggesting that although extremely diverse,
DBL1α shares common feature among different geographical origins.
By analyzing DBL1α sequence tags from three different continents, Bull et al. (2007)
demonstrated an association of specific features i.e. MFK* at PoLV1 (group 1) or the
*REY at PoLV2 (group 2 and 5) with short sequences. Our result showed similar
associations, indicating that the same structural features in DBL1α sequences are shared.
Homology block (HB) analysis by varDom server (Rask et al., 2010) showed that our
DBL1α sequences stretch from the most prevalent HB3 to HB2. Unfortunately, we could
not detect the HB17 and HB19 as HB characteristic for DBL1α due to the length of our
sequence, since HB17 and HB19 lie upstream of HB4. The difference between cys4 and
cys2 could only be detected by HB36 that was present in all cys4 but absent in all cys2
sequences, as described previously (Rask et al., 2010). The presence of HB79 and HB88 in
some cys4 sequences and absence in cys2 raising the possibility of those HBs for
differentiating cys4 from cys2.
5.6 Expressed var genes from clinical field isolates
Besides using genomic DNA, var sequence diversity was also analysed using RNA
transcripts extracted from dried blood on filter paper. This showed the expression of var
genotypes at the time of symptoms. cDNA sequences from all severe cases but solely one
of uncomplicated case could be generated. Interestingly, Maeno and colleagues (2008)
using transcripts from dried blood on filter paper reported that the positivity rate of
transcripts from asymptomatic patients was lower than from symptomatic cases.
Regular PCR is a stochastic process and primer bias is a major source of error in semi-
quantitative expression trials. Even after repeated several times, amplification of cDNA
from these two uncomplicated cases resulted in reproducible sequences with less than
12% similarity with DBLα and only short sequences matched with hypothetical or
Discussion ________________________________________________________________________
78
conserved proteins from Plasmodium. Although the universal primers αAF and αBR
have shown to have only a small degree of bias in their specificity and possess a wide
range in targeting var gene sequences, we could not excluded a primer bias as a cause of
the undesired result.
Previous studies showed contradictory data on the timing of var gene transcription,
reverse transcription-polymerase chain reaction (RT-PCR) data suggested that many var
gene types are transcribed in early ring stages and exclusively one major PfEMP-1-
encoding type is transcribed in later pigmented trophozoite stages (Chen et al., 1998;
Scherf et al., 1998), whereas northern blot data showed that almost all full-length var
transcripts encoding PfEMP-1 type were detected only in ring stages (Keys et al., 2003).
Others argue that a single full-length var gene is transcribed both in ring and trophozoite
stages in clonal parasites (Dahlback et al., 2007; Duffy et al., 2002; Noviyanti et al., 2001;
Peters et al., 2002). However, most agree that only one var gene is dominantly expressed
as a single PfEMP-1 in the late ring stage and mature trophozoite stage of parasite. The
presence of a dominant transcript is proposed due to higher level of that transcript and
rapid decay of low-level, spurious short- and sometimes full-length transcripts (Rowe et
al., 1997; Mok et al., 2007; Chen et al., 1998).
A study argued that RT-PCR of ring stages, as we did in this study, is the wrong method
to find the major var gene transcript present in a given parasite sample. In most cases,
mature forms of the parasite are not found in the peripheral circulation during infection
due to adhesion of the IEs to microvascular endothelium and sequestration in variety of
organs (Miller et al., 2002). This is the major question in studies of expression trials with
field isolates if the parasites in the peripheral blood adequately represent the sequestered
population. Ideally, studies addressing the relationship between var gene expression and
specific disease syndromes have to examine sequestered parasites, but these are only
accessible in post-mortem samples. Two studies indicated that the dominant parasite
genotype of sequestered parasites is usually the same as in the peripheral blood (Dembo
et al., 2006) and that the parasite genotype in cerebral malaria patients is homogeneously
distributed throughout the body (Montgomery et al., 2006). In addition, by performing
agglutination assays, Bull et al. (1998) observed a distinct parasite subset in peripheral
blood of children with severe malaria compared to children with mild malaria,
indicating the presence of virulent parasites in the periphery. Although these studies do
not explain if the var gene profile of the peripheral blood parasites reflects that of
sequestered population, they are consistent with the possibility that the peripheral blood
population could adequately reflect the sequestered parasite. However, theoretically the
Discussion ______________________________________________________________________________
79
ring stages have a higher relative level of the relevant PfEMP-1-encoding var transcripts,
but practically in several studies showed that pigmented trophozoites yield more RNA,
so both stages should be valid for investigating repertoires of var transcription by RT-
PCR (Kyes et al., 2003).
Observation of distribution motif in DBL1α showed a lack of two cysteine residues
(cys2) in all DBL1α expressed sequences from patients. It is likely that sequences lacking
two cysteine residues (cys2) are more frequently expressed than those with a normal
number of cysteine (cys4). All DBL1α expressed sequences from blood of severe patients
lacked of two cysteine residues. Unfortunately, sample size was too low to compare the
DBL1α expression with those from uncomplicated patients. However, some studies
comparing the expression between severe and uncomplicated case reported the
tendency of cys2 DBL1α to be expressed in severe patients (Kirchgatter and del Potillo,
2002; Bull et al., 2005; Kyriacou et al., 2006; Kraemer et al., 2007).
Several studies about a possible association of either var gene grouping or DBL1α motifs
with clinical malaria manifestations showed conflicting results. A study in Malian
children with cerebral malaria showed predominantly expressed cys2 (referred as
DBL1α1 type), characteristic of group A or B/A var gene, whereas a non-virulent form
with hyperparasitaemia showed predominantly expressed cys4 (referred as DBL1α0
type), characteristic of group B or C var gene (Kyriacou et al., 2006). Another study
using a selected 3D7 clone reported an association of up-regulation of group A var gene
and expression, which can be detected on the surface of IE carrying PfEMP-1 type, with
severe malaria (Jensen et al., 2004). Conversely, a study in Papua New Guinea showed
up-regulation of group B var gene in clinical disease (severe and mild) compared to
asymptomatic infection with predominantly expressed group C var gene (Kaestli et al.,
2006), but it should be noted that the severe disease in this study included a variety of
clinical syndromes and not strictly defined cerebral malaria. A study from Tanzania also
found an increased expression of both group A and B var genes in severe compared to
uncomplicated and asymptomatic patients (Rottmann et al., 2006). Another study in
Kenya did not find any association between expression of specific var gene groups and
disease manifestations (Bull et al., 2005). In this study, we did not directly detect the
upstream sequence (Ups) of expressed sequences to differentiate the var gene group, but
blasting results revealed that all expressed sequences had identity of 82-99% with the
UpsA var gene from distinct isolates, indicating group A var gene expression in all of our
samples (4 severe and 1 uncomplicated case).

Discussion ________________________________________________________________________
80
Investigation of DBL1α sequence from one synchronised P. falciparum culture showed
that both cys2 and cys4 sequences were expressed during trophozoite stage. Although a
study reported that trophozoite-parasitized erythrocytes could be the best source of
RNA to determine the dominantly transcribed and translated var gene (Blomqvist et al.,
2010), var gene expression changes may occur early in in vitro adapted cultures (Peters et
al., 2007; Southwell et al., 1989). Therefore, one can assume that results from the cultured
parasites might not represent the expression pattern in the patient.
5.7 Conserved DBL domains
To determine the association of specific sequences and clinical outcome of malaria, first
genomic DNA and cDNA was amplified with UNIEBP primers, and an internal specific
primer based on the amplified fragment was designed. The degenerated UNIEBP
primers were designed from conserved amino acid sequences PRRQKLC (Homology
block ‘B’ by Smith) and PQFLRW (Homology Block ‘H’ by Smith) in the DBL domain to
allow amplification of expressed DBL sequences. As predicted, multiple bands were
generated indicating the diversity of the parasite lines in each sample, as confirmed by
genotyping results. The number of observed bands probably underestimates the number
of amplifiable sequences due to overlapping of same size-products and the possibility of
preferential amplification of some sequences over others (Peterson et al., 1995).
The amplified sequences from the transcripts varied in number and length and were
identified as transcripts from the single copy gene eba-175 and from the var gene family.
As described previously (Peterson et al. 1995), both genes contain an adhesive DBL
domain. The eba-175 gene encodes for the erythrocytes binding antigen (EBA)-175
protein associated with erythrocyte invasion and the multi-copy var gene family encodes
for PfEMP-1 served as cytoadherence ligand and mediated cytoadhesion and
sequestration. Both proteins play important roles during the blood stage infection
(Howell et al., 2006; Michon et al., 2002). It is proposed that DBL domains of PfEMP-1
evolved from EBAs, because erythrocyte invasion is an essential property for survival
and transmission of all Plasmodium species and cytoadherence is a restricted property of
a subset of Plasmodium species such as P. falciparum, and P. reichenowi (Smithb et al.,
2000).
One of the amplified transcripts was a 486 bp band that matched well with sequences
from DBLγ domain of var1CSA 3D7 and DBLγ domain of placenta from Malawian
women with PAM. It can be assumed that both sequences correspond to each other as
Discussion ______________________________________________________________________________
81
placental isolates commonly express DBLγ containing subtypes of var genes with
homology to either 3D7var5.2 (varCOMMON) or FCR3varCSA (Winter et al., 2003). Though,
this 486 band was only found in a male patient from Papua (Pap3). The sequence is
probably a var1CSA-type gene (also defined as varCOMMON). var1CSA is highly conserved
between isolates, reported as constitutively transcribed in approximately 60% of malaria
infected children in Gabon (Winter et al., 2003) and in non-pregnant donors (Friedb and
Duffy, 2002), and can be detected by RT-PCR in many isolates independent from stage
and binding phenotype. It is therefore not a strict characteristic of isolates from pregnant
women or placental malaria (Winter et al., 2003; Kyes et al., 2003). In 3D7, var1CSA is
present on chromosome 5 (var5.2), it has an UpsA and is constitutively transcribed in the
opposite direction to most other var genes. It lacks a regulatory intron and an acidic
terminal segment (exon 2) and ends in telomeric repeat sequences (Rask et al., 2010).
var1CSA encodes a large, hypothetical PfEMP-1 of a structure similar to previous
placenta-binding PfEMP-1 but it is not present at the IE-surface possibly due to an
absence of a potential trans-membrane anchor sequence and the internal ATS domain.
The function of var1CSA for the parasite remains unclear. However the fact that some
isolates do not contain the var1CSA transcripts indicate that the gene is not essential for
the parasite survival (Winter et al., 2003).
5.8 Specific motif var D-like sequence
In a report concerning the association of a specific genotype with severe malaria, Ariey
and colleagues (2001) have designed a specific var D gene primer. It was based on a 520
bp band that resulted from amplification using UNIEBP primers and was observed in
most of the severe patients. By using similar methods, we designed a specific primer
targeting the var D-like gene. The amplified sequence corresponded partly to the var D
gene reported previously (Ariey et al., 2001) but closely matched with the DBLγ domain
of PfEMP-1 isolated from 3D7 and patients with PAM from various origins. According to
Ariey et al, the var D gene possessed characteristics of the DBLδ domain, while our
sequences corresponded to DBLγ domain of PfEMP-1. Further analysis found three
conserved sequence motifs containing 6-10 nucleotides within all proposed var D genes.
Analysis of homology blocks by using varDom server showed HB86 in the previously
described var D gene and in one of our sequences which is mostly found in the
subdomain S2 of DBLγ, while another var D-like sequences showed HB27 which is
largely found in DBLδ and HB98 which is observed in some of both DBLδ and DBLγ

Discussion ________________________________________________________________________
82
domains. One other sequence showed HB82 which is found in small number of DBLδ
and DBLγ domains, and one showed only HB3 which is found in all DBL domains. As
only HB3 to HB5 was covered, the origin of our sequences remains uncertain, either
DBLγ or DBLδ is possible. Rask and colleagues discussed the reminiscences of DBLγ and
DBLδ domains, which might explain the results (Rask et al., 2010).
Interestingly, Ariey and colleagues reported an absence of the gene from most laboratory
strains (FCR3, Palo Alto, FCC1, Tak9/100, Tak9/96, ItG2G1), while we observed a single
fragment of 240 bp from the laboratory strain K1, which has a 25,7% similarity with the
var D gene reported by Ariey (AJ277137).
In this study, the var D-like was found in genomic DNA but not in RNA transcripts of
uncomplicated malaria isolates. A low identity of our var D-like gene with previously
proposed var D gene made it difficult to refer those sequences as the var D gene.
However, the increased prevalence and programmed expression of those sequences
containing certain HBs solely in severe malaria implies its involvement in the
pathogenesis of malaria. Though, sample size in this study was too small to indicate
statistically valuable information.
5.9 PfEMP-1 DBLβ-C2 domain and its ICAM-1 binding capacity
In Plasmodium falciparum, DBL domains are present in both EBA used during erythrocyte
invasion and PfEMP-1 mediated cytoadherence. PfEMP-1 DBL domains diverged
significantly from the presumed ancestral EBA DBL domains and cluster into six distinct
sequence classes: α, β, γ, δ, ε, and X (Smithb et al., 2000). Whereas the EBA DBL domains
contain 12-13 invariant cysteine residues (Adams et al., 1992), the absolute number of
cysteine residues differs more significantly between PfEMP-1 DBL domains. However,
homology between EBA and PfEMP-1 DBL domains ends shortly after the 10th cysteine
residue and all the first 10 cysteine residues in EBA DBL can be identified in PfEMP-1
DBL domain (Smithb et al., 2000).
In this study, we identified the DBLβ-C2 domain of P. falciparum field isolates derived
from patients with severe and uncomplicated malaria. Similar to the previous reports
(Smitha et al., 2000; Chattopadhyay et al., 2004), multiple alignment analysis showed that
the DBLβ sequences share many similar features, including 12 conserved cysteine
residues (C1-C12) and blocks of strong amino acid conservation which are flanked by
more extensive polymorphic regions, where the sequences are followed by the C2
domain which varies in length, including four invariant cysteine residues (C13-C16). The
Discussion ______________________________________________________________________________
83
C2 domain is also characterized by the presence of the ‘Y motif’ which is suggested to
have an important role in binding function. The presence of conserved cysteines and
homology blocks in DBLβ-C2 domain suggested conserved structural features like
helices and loops, which in turn indicate a similar general architecture.
Expression of the DBLβ-C2 domain containing 16 conserved cysteine residues from
different P. falciparum field isolates on the surface of COS-7 cells and binding assays with
the ICAM-1 coated magnetic beads helped to identify the DBLβ-C2 domain as the
ICAM-1 binding site. Previous studies by using the A4tres isolate (Smitha et al, 2000) and
the JDP8 isolate (Chattopadhyay et al., 2004) showed that the ICAM-1 binding region lies
in the DBLβ-C2 domain with 16 conserved cysteine residues, indicating that both DBLβ
and C2 are required for ICAM-1 binding. However, not all DBLβ-C2 tandems bind
ICAM-1. Recombination of DBLβ and C2 domain of ICAM-1 binding and non-binding
isolates did not bind ICAM-1. Both DBLβ and C2 regions of ICAM-1 binding isolates
seem to contain contact residues required for ICAM-1 binding (Mayor et al., 2005).
Further, chimera containing the DBLβ and C2 domain from two different ICAM-1
binding isolates also did not bind ICAM-1, suggesting the functional interdependence
between two binding domains from the same protein (Springer et al., 2004). Truncated
analysis demonstrated that the critical ICAM-1 binding regions are located between a
conserved tryptophan (W) and the first half of the C2 domain including the ‘Y motif’
(Figure 4.10). However, the optimal binding activity is dependent upon residues in the
first part of DBLβ domain (Springer et al., 2004).
Multiple alignment of both ICAM-1 binding and non-binding DBLβ-C2 domains
revealed that there is no common sequences shared by ICAM-1 binding DBLβ-C2
domains or absent in non-binding DBLβC2 domains. It is therefore unlikely that the
ICAM-1 binding site lies in a linear sequence stretch within DBLβ-C2 domain
(Chattopadhyay et al., 2004). In addition, a neighbour-joining analysis indicated the
difficulties to strictly distinguish ICAM-1 binding from non-binding sequences by
traditional phylogenetic criteria because ICAM-1 binding sequences did not group
separately from non-binders (Howell et al., 2008).
The DBLβ-C2 domain use a common interaction site for ICAM-1 binding that maps to
the equivalent glycan binding region in the EBA-175 F2 DBL domain, which consists of
three distinct binding pockets referred to as glycan 5, glycan 1 and glycan 3, located at
flexible loops (Tolia et al., 2005). Homology modelling also suggested that the first part
Discussion ________________________________________________________________________
84
of C2 domain including ‘Y motif’ is actually part of the DBL domain, explaining the role
of ‘Y motif’ in ICAM-1 binding function (Tolia et al., 2005; Singh et al., 2006).
A study using high resolution conformation model for binding DBLβ-C2 domains and
ICAM-1 showed that there are four DBLβC2 loop regions contributing to the site of
ICAM-1 binding (Figure 4.10): loop 1 (E21 – V30), loop 2 (G112 – E120), loop 3 (K137 –
D125) and loop 4 (T283 – N293). Loop 1 is more important for the interaction between
DBLβ-C2 domain and ICAM-1 and the sequences might modulate the binding affinity in
different P. falciparum strains (Bertonati and Tramontano, 2007). Two studies observed
several conserved motifs in those loops such as threonin (T) residue in loop 1, a
conserved 3-amino acid motif in loop 3 (Oleinikov et al., 2009) and alanin (A) or leucine
(L) in loop 4 (Bertonati and Tramontano, 2007) from ICAM-1 binding sequences.
However, our results demonstrated no amino acid conservation in those loops from both
ICAM-1 binding and non-binding sequences, supporting previous reports that both
sequences share no common sequences (Chattopadhyay et al., 2004) Classical
phylogenetic criteria were not able to differentiate both sequences indicating no
possibilities to predict binding function from sequence criteria alone (Howell et al.,
2008). From a perspective of protein interaction, it is known that ligand interactions are
not significantly altered by substituting a single residue that participates in binding, as
long as the substitution fits into the structure without clashes and does not affect
structural integrity such as substitution in flexible loops (Weber, 1992). Mutagenesis
study by substituting a residue in a loop supported this theory and revealed that the loss
of binding to ICAM-1 is not due to one single substitution but a combinations of
substitutions (Howell et al., 2008; Oleinikov et al., 2009).
Our results showed that two sequences derived from two different samples with similar
clinical manifestations revealed converse ICAM-1 binding avidity although they were
99.8% identical. DBL-based primers used in this study, to obtain the DBLβ-C2 domain,
only amplify a portion of the entire DBL domain. When expressed as recombinant
proteins they might not fold properly and incorrect folding might affect the protein
function. Moreover, since every protein is unique, false negative binding activity could
not be excluded without direct proof of correct folding. We also observed that two
chimeras derived from patients with different clinical malaria manifestations had a
similar binding avidity to ICAM-1. But overall, DBLβ-C2 domains from severe patients
showed higher binding avidity to ICAM-1 than those from uncomplicated patients. This
observation is similar to previous studies (Newbold et al., 1997; Turner at al., 1994,

Discussion ______________________________________________________________________________
85
Turner et al., 1998) which reported the association of ICAM-1 binding capacity with
disease severity. In contrast, a study in Malawian children showed that binding capacity
to ICAM-1 was lowest in children with cerebral malaria (Rogerson et al., 1999). Studies
in Thai field isolates found no correlation between ICAM-1 binding and the severity of
disease (Udomsangpetch et al., 1996; Ockenhouse et al., 1991). However, the low affinity
of most malaria parasites for ICAM-1 indicates that ICAM-1 only mediates initial rolling
of IEs on the endothelial lining (Craig et al., 1997; Yipp et al., 2000). The binding to
ICAM-1 is also relatively weak and can not alone trigger massive sequestration. For
stable binding, other receptors such as CD36 and synergisms are most likely required
(McCormick et al., 1997). Thus, resolution of the association between ICAM-1 adhesion
and severe disease requires further examination of the adhesive performance of patient
isolates from different clinical manifestations with a bigger sample size.
ICAM-1 is a member of the immunoglobulin superfamily and contains five Ig-like
domains that are expressed on the surface of a wide range of cell types including
endothelial cells. The interaction site between PfEMP-1 and ICAM-1 has been mapped to
the three β strands, termed B, E and D (the BED side) of the N-terminal Ig-like domain
(Berendt et al., 1992; Ockenhouse et al., 1992; Tse et al., 2004). This site is distinct, but
shows some overlap with the binding site for lymphocyte function associated antigen 1
(LFA-1) and a high level of overlap with the fibrinogen binding site (Chakravorty and
Craig, 2005). Although different PfEMP-1 proteins appear to bind to a similar region of
ICAM-1, there are discrete variations in the specific contact residues, as it was shown to
affect ICAM-1 binding affinity under flow conditions. It indicates that the ICAM-1
binding ability has originated from a common variant, and differences in binding are
probably dictated by the high degree of DBLβ-C2 sequence variation in the PfEMP-1
(Cooke et al., 1994; Gray et al., 2003; Tse et al., 2004).

Discussion ________________________________________________________________________
86

6. SUMMARY
Malaria is a global health problem with hundreds of million people around the world
suffering from disease and estimated 1-3 millions deaths each year. There are four
Plasmodium species causing malaria in humans: Plasmodium falciparum, P. vivax, P. ovale
and P. malariae.,Recently, it has been reported that Plasmodium knowlesi, a monkey
Plasmodium species in South-East Asian countries, causes epidemiologically relevant
infections in humans, proposing P knowlesi as the fifth humanpathogen malaria species.
Microscopically, it is difficult to differentiate P. knowlesi from P. falciparum and/or P.
malariae.
P. falciparum causes the most severe clinical symptoms and is mainly responsible for
complicated and lethal disease due to malaria. Two characteristics of P. falciparum seem
to be relevant: (1) the capability to invade erythrocytes of all stages, thus resulting in
very high parasitaemia, (2) the ability of infected erythrocytes to adhere to the vascular
endothelium and other host cells (called cytoadherence). The latter might result in
obstruction of the microcirculation leading to poor perfusion of host tissues, hypoxia,
dysfunction of affected organs, resulting further in multiple organ failure. To avoid
clearance by the human immune system, P. falciparum continuously changes its antigenic
surface proteins which are susceptible to antibody recognition and attack. This
phenomenon is called antigenic variation. One of the proteins responsible for
cytoadherence and antigenic variation is P. falciparum erythrocyte membrane protein-1
(PfEMP-1). PfEMP-1 is a polymorphic protein that varies in domain composition and
binding specificity. It is encoded by the var gene family consisting of ~60 variable genes
per haploid genome. PfEMP-1 possesses an extra-cellular and intra-cellular part. The
extra-cellular part is highly polymorphic and contains NTS followed by three distinct
binding domains: DBL, CIDR and C2.
In this study, the P. falciparum var genes from Indonesian field isolates were
characterised and the binding capacity to ICAM-1, one of the most important host
receptors, were examined. One of the important questions was if any differences could
be observed between isolates from patients with severe and uncomplicated malaria,
according to the WHO criteria.
Twelve Indonesian malaria patients who were microscopically diagnosed as P.
falciparum, were enrolled in this study. Due to the detection of P. knowlesi infections in
several neighboring countries of Indonesia, all samples were examined for P. knowlesi by
PCR. Amplification using recently published primers Pmk8 and Pmkr9 generated a
Summary ________________________________________________________________________
88
single band of 153 bp in four samples from the South Kalimantan province, the
Indonesian part of Borneo. All P. knowlesi-positive samples were mixed infections with
P. vivax and/or P. falciparum and microscopically diagnosed as mono-infection of P.
falciparum. Direct sequencing confirmed solely one P. knowlesi infection out of four
positive samples by PCR. At the same time, it was found that the used primers
stochastically cross-react with P. vivax genomic DNA resulting in false positive
amplification when P. vivax genomic DNA is present. Hence, sequencing was
recommended for definite confirmation of P. knowlesi. Further studies on genetic
variation should be encouraged in order to design new specific primers based on
Indonesian P. knowlesi isolates.
For further investigations, 8 Indonesian samples with P. falciparum mono-infection were
included: 5 with severe and 3 with uncomplicated malaria. First, the diversity of P.
falciparum var genes was examined by using universal primers. To amplify the majority
of the var gene repertoire, primers were used binding to highly conserved regions in
DBL1α that are present in most of the var gene family members. We identified seventy-
one different sequences out of 104 DBL1α sequenced clones, resulting in an average of
8.9 different DBL1α sequences per isolate. The average DBL1α sequence similarity
within isolates was as high as among isolates, implying the overall DBL1α heterogeneity
that exists within each isolate. Little overlap of field isolates from geographically close
regions and among DBL1α sequences from more different origins occurred, indicating
that var gene diversity on a global scale is immense. Phylogenetic analysis demonstrated
no clustering of sequences regarding strain or geographical origin.
In order to identify an association of restricted motifs in DBL1α domain with malaria
clinical outcome, the DBL1α sequence was analysed by distribution of semi-conserved
features (cysteine/PoLV1-4 grouping) and classified into six sequence groups. Overall,
there was no evidence for a difference between DBL1α sequence motifs between severe
and uncomplicated malaria (p=0.48), indicating common sequences in DBL1α are shared
among different clinical categories. Interestingly, all sequences of group 3 containing
cys2 (meaning DBL1α lacked two cysteine residues) were obtained from severe cases.
Distribution of motifs in DBL1α showed cys2 type in all expressed sequences in vivo and
in two third of expressed sequences from culture, supporting previous reports that cys2
sequences are more frequently expressed than those with a normal number of cysteines
(cys4). Some studies comparing the expression between severe and uncomplicated cases
reported the propensity of cys2 DBL1α to be expressed in severe malaria patients. All

Summary ______________________________________________________________________________
89
DBL1α expressed sequences from blood of severely ill patients showed cys2 but sample
size was to small for comparison of the DBL1α expression in uncomplicated and severe
malaria.
Ariey and colleagues proposed a specific genotype called var D gene to be associated
with severe malaria. The proposed var D gene matched with the DBLδ domain. By using
a similar method, we designed a specific primer, targeting the ‘var D-like’ gene.
Amplification yielded multiple fragments from genomic DNA of all samples, but
generated a single ∼237 bp fragment of expressed sequences from four severe malaria
patients only. Sequences highly (80-94% identity) matched with the DBLγ domain of
PfEMP-1 from several isolates, sequence identity to the proposed var D gene was 29.0,
28, 27 and 19% for var D-like sequence of Kal2, Pap3, Pap1 and Pap2, respectively.
Interestingly, analysis by using varDom server presented homology block (HB)
characteristics of DBLγ and DBLδ. Prevalence and expression of those sequences solely
in severe malaria implies potential involvement in the pathogenesis of malaria.
However, sample size in this study was too small to indicate statistically valuable
information.
To further analyse the var gene and PfEMP-1, we explored the DBLβ domain. This
domain, in tandem with C2 domain binds ICAM-1 in some P. falciparum isolates. In this
study, the P. falciparum DBLβ-C2 sequence from Indonesian’s field isolates was
amplified. Specific primers for the DBLβ-C2 sequence were designed according to
several referred sequences of the DBLβ-C2 domain. The amplified ∼1.7 kb band was
cloned and sequenced. One to two different sequences in each sample were identified,
but three sequences from distinct samples of the same geographical origin presented
more than 99% sequence similarity. Blasting results corresponded to the DBLβ domain
of PfEMP-1 from various P. falciparum isolates. The DBLβ sequences shared many similar
features, including 12 conserved cysteine residues (C1-C12) and blocks of amino acid
conservations which are flanked by polymorphic regions. The DBLβ domain is followed
by the C2 domain that varies in length, including four invariant cysteine residues (C13-
C16). The C2 domain is also characterized by the presence of the ‘Y motif’ which is
suggested to have an important role in binding function.
The DBLβ-C2 domain with 16 conserved cysteine residues from eight P. falciparum field
isolates was expressed on the surface of COS-7 cells for binding assays with the ICAM-1
coated magnetic beads. Recombinant constructs derived from samples with clinically
severe malaria presented a higher ICAM-1 binding avidity compared to those from

Summary ________________________________________________________________________
90
uncomplicated malaria, supporting previous reports on the association of ICAM-1 with
severe malaria. However, resolution of the association between ICAM-1 adhesion and
severe disease requires further examination of the adhesive performance. Isolates from
patients with different clinical manifestations and much larger sample size are needed.
7. ZUSAMMENFASSUNG
Malaria ist ein globales Gesundheitsproblem mit mehreren hundert Millionen Menschen
auf der ganzen Welt, die jedes Jahr unter der Krankheit leiden, ca 1-3 Millionen der
Erkrankten versterben. Es gibt vier verschiedene Malariaerreger des Menschen:
Plasmodium falciparum, P. vivax, P. ovale und P. malariae. Erst vor kurzem wurde bekannt,
dass P. knowlesi, eine bei Makakken verbreitete Plasmodien Spezies, in Südostasien zu
epidemiologisch relevanten Infektionen und Erkrankungen beim Menschen führt und
daher mittlerweile auch als fünfter humanpathogener Malariaerreger bezeichnet wird.
Mikroskopisch ist P. knowlesi nicht sicher von P. falciparum und/oder P. malariae zu
unterscheiden.
P. falciparum verursacht die bei weitem schwersten Krankheitsverläufe und ist ganz
überwiegend für komplizierte Verläufe und Todesfälle verantwortlich. Hierfür scheinen
vor allem zwei Eigenschaften von P. falciparum bedeutsam zu sein: (1) die Fähigkeit der
Erreger alle Erythrozyten zu parasitieren und damit hohe Parasitämien verursachen zu
können, (2) die Bindung parasitierter Erythrozyten an Gefässendothelien und andere
Wirtszellen (Zytoadhärenz). Letzteres kann zur Obstruktion der Mikrozirkulation und
damit zu verminderter Organperfusion mit Hypoxie und Gewebsschädigung und
schliesslich zum Multiorganversagen führen. Um der menschlichen Immunabwehr zu
entgehen, ändert P. falciparum kontinuierlich seine Oberflächenantigene, die anfällig für
Antikörper-Erkennung und -angriff sind. Dieses Phänomen wird antigenische Variation
genannt. Eines der Proteine für Zytoadhärenz und antigenische Variation bei P.
falciparum ist das Erythrozytenmembranprotein-1 (PfEMP-1). PfEMP-1 ist polymorph
und variiert in Zusammensetzung und Bindungsspezifität. Es wird von der var-Gen-
Familie, bestehend aus ~60 variablen Genen pro haploidem Genom, kodiert. PfEMP-1
besitzt einen extrazellulären und einen intrazellulären Teil. Letzterer ist sehr polymorph
und enthält drei verschiedene Domänen: DBL, CIDR und C2.
In der vorliegenden Arbeit sollten die var-Gene von P. falciparum Patientenisolaten aus
Indonesien charakterisiert werden und deren Bindungskapazität an ICAM-1, einem der
wichtigsten Wirtsliganden der Zytoadhärenz untersucht werden. Eine der primären
Fragestellungen war, ob es hierbei Unterschiede zwischen Isolaten von Patienten gibt,
bei denen entsprechend den WHO-Kriterien eine komplizierte oder eine
unkomplizierter Malaria vorlag.
Zusammenfassung ________________________________________________________________________
92
Insgesamt standen 12 verschiedene Isolate von indonesischen Patienten zur Verfügung,
die mikroskopisch als P. falciparum diagnostiziert worden waren. Aufgrund des
Nachweises von P. knowlesi in mehreren indonesischen Nachbarländern wurden alle
Proben zunächst mittels PCR auf P. knowlesi untersucht. Die Amplifikation mittels
bereits veröffentlichter Primer (Pmk8 und Pmkr9) generierte eine einzelne Bande von
153 bp in vier Proben aus der Süd-Kalimantan Provinz, dem indonesischen Teil von
Borneo. Alle P. knowlesi-positiven Proben waren Mischinfektionen mit P. vivax und/oder
P. falciparum und mikroskopisch als Mono-Infektion mit P. falciparum diagnostiziert
worden. Die direkte Sequenzierung bestätigt lediglich eine P. knowlesi Infektion von vier
PCR-positiven Proben. Gleichzeitig wurde festgestellt, dass die verwendeten Primer mit
genomischer DNA von P. vivax stochastisch kreuzreagieren, was zu falsch positiven
Ergebnissen führte. Zur sicheren Bestätigung einer P. knowlesi Infektion ist daher eine
Sequenzierung empfehlenswert sowie weitergehende Untersuchungen zur genetischen
Variation der Spezies und zum Design neuer spezifischer Primer für indonesische P.
knowlesi Isolate.
Für die weiteren Untersuchungen standen somit 8 indonesische Feldisolate mit P.
falciparum-Monoinfektionen zur Verfügung; 5 mit komplizierter und 3 mit
unkomplizierter Erkrankung. Zunächst wurde die Diversität von P. falciparum var-Genen
mittels universeller Primer untersucht. Um die Mehrheit des var Gen-Repertoires zu
amplifizieren, werden Primer verwendet, die an hoch konservierte Regionen der DBL1α-
Domäne binden, welche in den meisten var Genen gefunden wird. Es konnten hierbei 71
verschiedene Sequenzen von 104 sequenzierten Klonen von DBL1α bei durchschnittlich
8,9 unterschiedlichen DBL1α Sequenzen pro Isolat identifiziert werden. Die
durchschnittliche DBL1α Sequenz-Ähnlichkeit innerhalb der Isolate war so hoch wie die
der Isolate untereinander, was für eine allgemeine DBL1α Heterogenität spricht. Es
zeigte sich keine Überschneidung bei Feldisolaten von geographisch benachbarten
Regionen oder bei DBL1α Sequenzen von unterschiedlicher Herkunft. Dies deutet auf
eine var Gen-Diversität auf globaler Ebene von immensem Ausmaß. Phylogenetische
Analysen zeigten kein Clustering bezüglich einzelner Parasitenstämme oder der
geographischen Herkunft.
Um eine Assoziation bestimmter Motive der DBL1α-Domäne mit dem klinischen Bild
der Malaria zu identifizieren, wurden die Sequenzen auf semi-konservierte
Verteilungsmuster (cysteine/PoLV1-4 Gruppierung) untersucht und in sechs Sequenz-
Gruppen klassifiziert. Insgesamt gab es keine Anzeichen für einen Unterschied von
Zusammenfassung ______________________________________________________________________________
93
DBL1α Sequenz-Motiven bei schwerer bzw. unkomplizierter Malaria (p = 0,48), die
Sequenz-Gruppen von DBL1α waren auf alle klinischen Kategorien verteilt.
Interessanterweise wurden alle Sequenzen der Gruppe 3 mit zwei Cysteinen in
schweren Fällen gefunden (Cys2, statt vier Cysteine, Cys4, es fehlen also zwei Cystein-
Reste).
Die Verteilung der Motive in DBL1α zeigte den Cys2 Typ in allen exprimierten
Sequenzen in vivo und in zwei Drittel der exprimierten Sequenzen aus der Kultur. Dies
bestätigte frühere Berichte, dass Cys2-haltige Sequenzen häufiger als Cys4-haltige
exprimiert werden. Einige Studien beobachteten eine erhöhte Expression von Cys2-
haltigen DBL1α Sequenzen bei schwerer Malaria im Vergleich zu leichten Fällen. Alle
hier untersuchten exprimierten DBL1α Sequenzen aus dem Blut schwer erkrankter
Patienten zeigte zwei Cysteinreste, aber die Stichprobengröße war zu klein für einen
Vergleich der Expression von DBL1α zwischen unkomplizierter und schwerer Malaria.
Ariey und Kollegen hatten die Expression eines bestimmten Genotypes, das so genannte
var D-Gen, in Verbindung mit schwerer Malaria gebracht. Das vorgeschlagene var D-
Gen stimmte mit der DBLδ Domain überein. Durch die Verwendung einer ähnlichen
Methode haben wir spezielle Primer für ein 'var D-ähnliches"-Gen konstruiert. Die
Amplifikation ergab mehrere Fragmente aus genomischer DNA von allen Proben,
erzeugte jedoch nur ein einzelnes Fragment von ca 237 Basenpaaren aus RNA von vier
Patienten mit schwerer Malaria. Die Sequenzen zeigte große Ähnlichkeit (80-94%) mit
der DBLγ Domain von PfEMP-1 unterschiedlicher Isolate. Die Sequenz-Identität mit dem
vorgeschlagenen var-D-Gen betrug jedoch nur 29, 28, 27 und 19% für die jeweiligen
Isolate. Eine Analyse unter Verwendung des varDom Servers zeigte interessanterweise
Homologie-Block (HB) Charakteristiken von DBLγ und DBLδ. Die Expression dieser
Sequenzen nur bei schwerer Malaria impliziert eine potentielle Beteiligung an der
Pathogenese der Malaria. Allerdings war die Stichprobengröße in dieser Studie zu klein
für eine statistisch valide Aussage.
Zur weiteren Analyse des var-Gens und PfEMP-1 wurde die DBLβ Domäne untersucht.
Diese Domäne kann im Tandem mit der C2-Domäne ICAM-1 binden. In dieser Studie
wurde die P. falciparum DBLβ-C2-Sequenz aus den indonesischen Feldisolaten
amplifiziert. Spezifische Primer für die DBLβ-C2-Sequenz wurden für die DBLβ-C2-
Domäne konstruiert und die ~1,7 kb-schwere amplifizierte Bande kloniert und
sequenziert. Ein bis zwei unterschiedliche Sequenzen wurden in jeder Probe
identifiziert, drei Sequenzen aus unterschiedlichen Proben derselben geographischen
Zusammenfassung ________________________________________________________________________
94
Herkunft zeigten mehr als 99% Übereinstimmung. Die Sequenzen korrespondierten mit
der DBLβ Domäne von PfEMP-1 verschiedener P. falciparum-Isolate. Die DBLβ
Sequenzen teilten viele Gemeinsamkeiten, einschließlich der 12 konservierten Cystein-
Reste (C1-C12) und der Aminosäuren-Blöcken, die von konservierten polymorphen
Regionen flankiert werden. Die nachfolgende C2-Domäne variiert in der Länge und
zeichnet sich durch vier Cysteinreste (C13-C16) und ein so genanntes "Y Motiv" aus, das
eine wichtige Rolle bei der Bindungsfunktion zu haben scheint.
Die DBLβ-C2-Domäne der acht verschiedenen P. falciparum Feldisolate wurde je mit 16
konservierten Cystein-Resten auf der Oberfläche von COS-7-Zellen für Bindungstests
mit ICAM-1 exprimiert. Die rekombinanten Konstrukte der Isolate mit klinisch schwerer
Malaria präsentierten eine höhere ICAM-1-Bindungsavidität im Vergleich zu denen mit
unkomplizierter Malaria, wie es aufgrund früherer Studien erwartet wurde. Eine
mögliche Assoziation der ICAM-1-Bindung mit schwerer Malaria erfordert jedoch
weitere Untersuchungen der Bindungskapazität an einem wesentlich größeren
Patientenkollektiv mit unterschiedlichen klinischen Manifestationen und idealerweise
aus verschiedenen Malariaregionen.

REFERENCES
A-Elbasit IE, ElGhazali G, A-Elgadir TME, Hamad AA, Babiker HA, et al. 2007. Allelic
polymorphism of MSP2 gene in severe P. falciparum malaria in an area of low and
seasonal transmission. Parasitology Research 102: 29–34.
Amino R, Thiberge S, Martin B, Celli S, Shorte S, Friscknecht F, Menard R. 2006.
Quantitative imaging of Plasmodium transmission from mosquito to mammal. Nat
Med 12 (2): 220-224.
Amodu OK, Oyedeji SI, Ntoumi F, Orimadegun AE, Gbadegesin RA, et al. 2008.
Complexity of the msp2 locus and the severity of childhood malaria, in
southwester Nigeria. Ann Trop Med Parasitol 102(2): 95–102.
Appawu M, Owusu-Agyei S, Dadzie S, Asoala V, Anto F, et al. 2004. Malaria
transmission dynamics at a site in northern Ghana proposed for testing malaria
vaccines. Trop Med Int Health 9: 164–170.
Appel RD, Bairoch A, Hochstrasser DF. 1994.�A new generation of information retrieval
tools for biologists: the example of the ExPASy WWW server.�Trends Biochem Sci
19: 258-260.
Ariey F, Hommel D, Scanf CL, Duchemin JB, Peneau C, et al. 2001. Association of severe
malaria with a specific Plasmodium falciparum genotype in French Guiana. J Infect
Dis 184: 237-241.
Arnot D. Unstable malaria in Sudan: the influence of the dry season. 1998. Clone
multiplicity of Plasmodium falciparum infections in individuals exposed to variable
levels of disease transmission. Trans R Soc Trop Med Hyg 92(6): 580-585.
Babiker HA, Ranford-Cartwright LC, Currie D, Charlwood JD, Billingsley P, Teuscher T,
Walliker D. 1994. Random mating in a natural population of the malaria parasite
Plasmodium falciparum. Parasitology 109(Pt4): 413-421.
Baird JK. Malaria Zoonoses. 2009. Travel Med and Infect Dis 7: 269-277.
Bairda JK. 1998. Age-dependent characteristics of protection vs. susceptibility to
Plasmodium falciparum. Ann Trop Med Parasitol 92(4): 367-390.
Baird JK. 1995. Host age as a determinant of naturally acquired immunity to Plasmodium
falciparum. Parasitol Today 11(3): 105-111.
Bairdb JK, Masbar S, Basri H, Tirtokusumo S, Subianto B, Hoffman SL. 1998. Age-
dependent susceptibility to severe disease with primary exposure to Plasmodium
falciparum. J Infect Dis 178(2): 592-595.
References ________________________________________________________________________
96
Barnwell JW, Asch AS, Nachman RL, Yamaya M, Aikawa M, Ingravallo P. 1989. A
human 88-kD membrane glycoprotein (CD36) functions in vitro as a receptor for a
cytoadherence ligand on Plasmodium falciparum-infected erythrocytes. J Clin Invest
84(3): 765-772.
Barnwell JW, Ockenhouse CF, Knowles DM 2nd. 1985. Monoclonal antibody OKM5
inhibits the in vitro binding of Plasmodium falciparum-infected erythrocytes to
monocytes, endothelial, and C32 melanoma cells. J Immunol 135(5): 3494-3497.
Barragan A, Kremsner PG, Wahlgren M, Carlson J. 2000. Blood group A antigen is a
coreceptor in Plasmodium falciparum rosetting. Infect Immun 68(5): 2971-2975.
Barragan A, Kremsner PG, Weiss W, Wahlgreen M, Carlson J. 1998. Age-related buildup
of humoral immunity against epitopes for rosette formation and agglutination in
African areas of malaria endemicity. Infect Immun 66(10): 4783-4787.
Barragan A, Spillmann D, Kremsner PG, Wahlgreen M, Carlson J. 1999. Plasmodium
falciparum: molecular background to strain-specific rosette disruption by
glycosaminoglycans and sulfated glycoconjugates. Exp Parasitol 91(2): 133-143.
Barry AE, Leliwa-Sytek A, Tavul L, Imrie H, Migot-Nabias F, Brown SM, McVea GAV,
Day KP. 2007. Population genomic of the immune evasion (var) genes of
Plasmodium falciparum. PLoS Pathog 3(3): e34.
Baruch DI, Ma XC, Singh HB, Bi X, Pasloske BL, Howard RJ. 1997. Identification of a
region of PfEMP1 that mediates adherence of Plasmodium falciparum infected
erythrocytes to CD36: conserved function with variant sequence. Blood 90(9): 3766-
3775.
Beeson JG, Brown GV, Molyneux ME, Mhango C, Dzinjalamala F, Rogerson SJ. 1999.
Plasmodium falciparum isolates from infected pregnant women and children are
associated with distinct adhesive and antigenic properties. J Infect Dis 180(2): 464-
472.
Beeson JG, Rogerson SJ, Cooke BM, Reder JC, Chai W, Lawson AM, Molyneux ME,
Brown GV. 2000. Adhesion of Plasmodium falciparum-infected erythrocytes to
hyaluronic acid in placental malaria. Nat Med 6(1): 86-90.
Bellamy R, Kwiatkowski D, Hill AV. 1998. Absence of an association between
intercellular adhesion molecule 1, complement receptor 1 and interleukin 1
receptor antagonist gene polymorphisms and severe malaria in a West African
population. Trans R Soc Trop Med Hyg 92(3): 312-316.
Bendixen M, Msangeni HA, Pederson BV, Shayo D, Bodker R. 2001. Diversity of
Plasmodium falciparum populations and complexity of infections in relation to
References ______________________________________________________________________________
97
transmission intensity and host age: a study from Usambara Mountains, Tanzania.
Trans Roy Soc Trop med Hyg 95: 143-148.
Berendt AR, McDowall A, Craig AG, Bates PA, Sternberg MJ, Marsh K, Newbold CI,
Hogg N. 1992. The binding site on ICAM-1 for Plasmodium falciparum-infected
erythrocytes overlaps, but is distinct from, the LFA-1-binding site. Cell 68(1): 71-81.
Berendt AR, Simmons DL, Tansey J, Newbold CI, Marsh K. 1989. Intercellular adhesion
molecule-1 is an endothelial cell adhesion receptor for Plasmodium falciparum.
Nature 341 (6237): 57-59.
Bertonati C, Tramontano A. 2007. A model of the complex between the PfEMP1 malaria
protein and the human ICAM-1 receptor. Protein 69(2): 215-222.
Blomqvist K, Normark J, Nilsson D, Ribacke U, Orikiriza J, et al. 2010. var gene
transcription dynamics in Plasmodium falciparum patient isolates. Mol Biochem
Parasitol 170(2): 74-83.
Brown KN. 1973. Antibody induced variation in malaria parasites. Nature 242(5392): 49-
50.
Buffet PA, Gamain B, Scheidig C, Baruch D, Smith JD, et al., 1999. Plasmodium falciparum
domain mediating adhesion to chondroitin sulfate A: a receptor for human
placental infection. Proc Natl Acad Sci 96(22): 12743-12748.
Bull PC, Berriman M, Keys S, Quail MA, Hall N, Kortok MM, Marsh K, Newbold CI.
2005. Plasmodium falciparum variant surface antigen expression pattern during
malaria. PLos Pathog 1: e26.
Bull PC, Kyes S, Buckee CO, Montgomery J, Kortok MM, Newbold CI, Marsh K. 2007.
An approach to classifying sequence tags sampled from Plasmodium falciparum var
genes. Mol Biochem Parasitol 154: 98-102.
Bull PC, Lowe BS, Kortok M, Molyneux CS, Newbold CI, Marsh K. 1998. Parasite
antigens on the infected red cell surface are targets for naturally acquired
immunity to malaria. Nat Med 4(3): 358-360.
Calderwood MS, Gannoun-Zaki L, Wellems TE, Deitsch KW. 2003. Plasmodium
falciparum var genes are regulated by two regions with separate promoters, one
upstream of the coding region and a second within the intron. J Biol Chem 278:
34125–34132.
Carlson J, Helmby H, Hill AV, Brewster D, Greenwood BM, Wahlgren M. 1990. Human
cerebral malaria: association with erythrocyte rosetting and lack of anti-rosetting
antibodies. Lancet 336(8729): 1457-1460.
Center for Disease Control and Prevention (CDC). DPDx. Plasmodium falciparum.
References ________________________________________________________________________
98
http://www.dpd.cdc.gov/dpdx/HTML/Malaria.htm
Chakravorty SJ, Craig A. 2005. The role of ICAM-1 in Plasmodium falciparum
cytoadherence. Eur J Cell Biol 84(1): 15-27.
Chattopadhyay R, Taneja T, Chakrabarti K, Pillai CR, Chitnis CE. 2004. Molecular
analysis of the cytoadherence phenotype of a Plasmodium falciparum field isolate
that binds intercellular adhesion molecule-1. Mol Biochem Parasitol 13(2): 255-265.
Chen Q, Barragan A, Fernandez V, Sundstrom A, Schlichtherle M, et al. 1998.
Identification of Plasmodium falciparum erythrocyte membrane protein 1(PfEMP1)
as resetting ligand of the malaria parasite P. falciparum. J Exp Med 187(1): 15-23.
Chena Q, Heddini A, Barragan A, Fernandez V, Pearce SF, Wahlgren M. 2000. The
semiconserved head structure of Plasmodium falciparum erythrocyte membrane
protein 1 mediates binding to multiple independent host receptors. J Exp Med
192(1): 1-10.
Chenb Q, Schlichtherle M, Wahlgren M. 2000. Molecular aspects of severe malaria. Clin
Microbiol Rev 13(3): 439-450.
Chitnis CE, Miller LH. 1994. Identification of the erythrocyte binding domains of
Plasmodium vivax and Plasmodium knowlesi proteins involved in erythrocyte
invasion. J Exp Med 180(2): 497-506.
Chin W, Contacos PG, Collins WE, Jeter MH, Alpert E. 1968. Experimental mosquito-
transmission of Plasmodium knowlesi to man and monkey. Am J Trop Med Hyg 17:
355-358.
Chookajorn T, Dzikowski R, Frank M, Li F, Jiwani AZ, et al. 2007. Epigenetic memory at
malaria virulence genes. Proc Natl Acad Sci 104: 899–902.
Chotivanich K, Sritabal J, Udomsangpetch R, Newton P, Stepniewska KA, et al. 2004.
Platelet-induced autoagglutination of Plasmodium falciparum-infected red blood
cells and disease severity in Thailand. J Infect Dis 189(6): 1052-1055.
Choudhury A. 2003. The pig-tailed macaque Macaca nemestrina in India- status and
conservation. Prim Cons 19: 91-98.
Clark I. 2002. Antitoxin approach to malaria. Lancet 1360(9349): 1983.
Coatney GR. The simian malarias: zoonoses, anthroponoses, or both? 1971. Am J Trop
Med Hyg 20(6): 795-803.
Coatney GR, Collins WE, Warren M, Contacos PG. 1971. The primate malarias.
Washington DC. US Goverment Printing Office. 366 p.
Cockburn IA, Mackinnon MJ, O'Donnell A, Allen SJ, Moulds JM, et al. 2004. A human
complement receptor 1 polymorphism that reduces Plasmodium falciparum rosetting

References ______________________________________________________________________________
99
confers protection against severe malaria. Proc Natl Acad Sci 101(1): 272-277.
Cohen GH, Wilcox WC, Sodora DL, Long D, Levin JZ, Eisenberg RJ. 1988. Expression of
Herpes Simplex Virus type 1 glycoprotein D deletion mutants in mammalian cells.
J Virol 62: 1932-1940.
Collins WE , Barnwell JW. 2009. Plasmodium knowlesi: finally being recognized. J Infect
Dis 199(8): 1107-1108.
Comeaux CA, Duraisingh MT. 2007. Unravelling a histone code for malaria virulence.
Mol Microbiol 66(6): 1291-1295.
Conway DJ, McBride JS. 1991. Population genetics of Plasmodium falciparum within a
malaria hyperendemic area. Parasitology 103: 7-16.
Cooke BM, Berendt AR, Craig AG, MacGregor J, Newbold CI, Nash GB. 1994. Rolling
and stationary cytoadhesion of red blood cells parasitized by Plasmodium
falciparum: separate roles for ICAM-1, CD36 and thrombospondin. Br J Haematol
7(1): 162-170.
Cox-Singh Ja, Davis TME, Lee KS, Shamsul SSG, Matusop A, et al. 2008. Plasmodium
knowlesi malaria in human is widely distributed and potentially life threatening.
Clin Infect Dis 46: 165-171.
Cox-Singh Jb, Singh B. 2008. Knowlesi malaria: newly emergent and of public health
importance? Trends in Parasitol 9: 406-410.
Craig AG, Pinches R, Khan S, Roberts DJ, Turner GD, Newbold CI, Berendt AR. 1997.
Failure to block adhesion of Plasmodium falciparum-infected erythrocytes to ICAM-1
with soluble ICAM-1. Infect Immun 65(11): 4580-4585.
Dahlback M, Lavstsen T, Salanti A, Hviid L, Arnot DE, Theander TG, Nielsen MA. 2007.
Changes in var gene mRNA levels during erythrocytic development in two
phenotypically distinct Plasmodium falciparum parasites. Malar J 6: 78.
Deitsch KW, Calderwood MS,Wellems TE. 2001. Malaria. Cooperative silencing elements
in var genes. Nature 412: 875–876.
Dembo EG, Phiri HT, Montgomery J, Molyneux ME, Rogerson SJ. 2006. Are Plasmodium
falciparum parasites present in peripheral blood genetically the same as those
sequestered in the tissues? Am J Trop Med Hyg 74(5): 730-732.
Dondorp AM, Lee SJ, Faiz MA, Mishra S, Price R, et al. 2008. The relationship between
age and the manifestations of and mortality associated with severe malaria. Clin
Infect Dis 47(2): 151-157.
Duffy MF, BrownGV, BasukiW, Rejany EO, Noviyanti R, Cowman AF, Reeder JC. 2002.
Transcription of multiple var genes by individual, trophozoite-stage Plasmodium

References ________________________________________________________________________
100
falciparum cells expressing a chondroitin sulphate A binding phenotype. Mol
Microbiol 43: 1285–1293.
Duffy MF, Byrne TJ, Carret C, Ivens A, Brown GV. 2009. Ectopic recombination of a
malaria var gene during mitosis associated with an altered var switch rate. J Mol
Biol 389 (3): 453-469.
Duraisingh MT, Voss TS, Marty AJ, Duffy MF, Good RT, et al. 2005. Heterochromatin
silencing and locus repositioning linked to regulation of virulence genes in
Plasmodium falciparum. Cell 121: 13–24.
Durand R, Ariey F, Cojean S, Fontanet A, Ranaivo L, et al. 2008. Analysis of circulating
populations of Plasmodium falciparum in mild and severe malaria in two different
epidemiological patterns in Madagascar. Trop Med Int Health 13(11): 1392-1399.
Dzikowski R, Deitsch KW. 2009. Genetics of antigenic variation in Plasmodium falciparum.
Curr Genet 55: 103–110.
Dzikowski R, Li F, Amulic B, Eisberg A, Frank M, et al. 2007. Mechanisms underlying
mutually exclusive expression of virulence genes by malaria parasites. EMBO Rep
8: 959–965.
Elyazar IRF, Gething PW, Patil AP, Rogayah H, Kusriastuti R, et al. 2011. Plasmodium
falciparum malaria endemicity in Indonesia in 2010. PLoS One 6(6): e21315.
Eyles DE. 1962. The malaria parasites of the pig-tailed macaque, Macaca nemestrina
(Linnaeus), in Malaya. Indian J Malariol 16: 285-298.
Faernert A, Arez AP, Babiker HA, Beck HP, Benito A, et al. 2001. Genotyping of
Plasmodium falciparum infections by PCR: A comparative multicentre study. Trans
R Soc Trop Med Hyg 95: 225-232.
Faernert A, Williams TN, Mwangi TW, Ehlin A, Fegan G, et al. 2009. Transmission-
dependent Tolerance to multiclonal Plasmodium falciparum Infection. J Infect Dis
200: 1166-1175.
Felger I, Smith T, Edoh D, Kitua A, Alonso P, Tanner M, Beck HP. 1999. Multiple
Plasmodium falciparum infections in Tanzanian infants. Trans R Soc Trop Med Hyg
93(Suppl 1): 29-34.
Fernandez-Reyes D, Craig AG, Kyes SA, Peshu N, Snow RW, Berendt AR, Marsh K,
Newbold CI. 1997. A high frequency African coding polymorphism in the N-
terminal domain of ICAM-1 predisposing to cerebral malaria in Kenya. Hum Mol
Genet 6(8): 1357-1360.
Ferreira A, Schofield L, Enea V, Schellekens H, van der Meide P, Collins WE,
Nussenzweig RS, Nussensweig V. 1986. Inhibition of development of

References ______________________________________________________________________________
101
exoerythrocytic forms of malaria parasites by gamma-interferon. Science 232
(4752): 881-884.
Fischer PR, Boone P. 1998. Short report: severe malaria associated with blood group. Am
J Trop Med Hyg 58(1): 122-123.
Fittinghoff Jr. NA, Lindburg DG. 1980. Riverine refuging in east Bornean Macaca
fascicularis. In: Lindburg DG, editor. The macaques: studies in ecology, behavior
and evolution. New York: Van Nostrand Reinhold : 182-214.
Flick K, Scholander C, Chen Q, Fernandez V, Pouvelle B, Gysin J, Walgren M. 2001. Role
of nonimmune IgG bound to PfEMP1 in placental malaria. Science 293(5537): 2098-
2100.
Frank M, Dzikowski R, Amulic B, Deitsch K. 2007. Variable switching rates of malaria
virulence genes are associated with chromosomal position. Mol Microbiol 64(6):
1486-1498.
Frank, M. and Deitsch, K. 2006. Activation, silencing and mutually exclusive expression
within the var gene family of Plasmodium falciparum. Int J Parasitol 36: 975-985.
Freitas-Junior LH, Bottius E, Pirrit LA, Deitsch KW, Scheidig C, et al. 2000. Frequent
ectopic recombination of virulence factor genes in telomeric chromosome clusters
of P. falciparum. Nature 407 (6807): 1018-1022.
Freitas-Junior LH, Hernandez-Rivas R, Ralph SA, Montiel-Condado D, Ruvalcaba-
Salazar OK, et al. 2005. Telomeric heterochromatin propagation and histone
acetylation control mutually exclusive expression of antigenic variation genes in
malaria parasites. Cell 121: 25–36.
Frieda M, Duffy PE. 2002. Analysis of CSA-binding parasites and antiadhesion
antibodies. Methods Mol Med 72: 555-560.
Friedb M, Duffy PE. 2002. Two DBLgamma subtypes are commonly expressed by
placental isolates of Plasmodium falciparum. Mol Biochem Parasitol 122(2):201-210.
Erratum in: Mol Biochem Parasitol 125(1-2): 217.
Fried M, Wendler JP, Mutabingwa TK, Duffy PE. 2004. Mass spectrometric analysis of
Plasmodium falciparum erythrocyte membrane protein-1 variants expressed by
placental malaria parasites. Proteomics 4(4): 1086-1093.
Fry AE, Griffiths MJ, Auburn S, Diakite M, Forton JT, et al., 2008. Common variation in
the ABO glycosyltransferase is associated with susceptibility to severe Plasmodium
falciparum malaria. Hum Mol Genet 17(4): 567-576.
Gamain B, Gratepanche S, Miller LH, Baruch DI. 2002. Molecular basis for the dichotomy
in Plasmodium falciparum adhesion to CD36 and chondroitin sulfate A. Proc Natl

References ________________________________________________________________________
102
Acad Sci 99(15): 10020-10024.
Gamain B, Smith JD, Avril M, Baruch DI, Scherf A, Gysin J, Miller LH. 2004.
Identification of a 67-amino-acid region of the Plasmodium falciparum variant
surface antigen that binds chondroitin sulphate A and elicits antibodies reactive
with the surface of placental isolates. Mol Microbiol 53(2): 445-455.
Garcia LS. 2010. Malaria. Clin Lab Med 30 (1): 93-129.
Gardner MJ, Hall N, Fung E, White O, Berriman M, et al. 2002. Genome sequence of the
human malaria parasite Plasmodium falciparum. Nature 419(6906): 498-511.
Gardner JP, Pinches RA, Roberts DJ, Newbold CI. 1996. Variant antigens and endothelial
receptor adhesion in Plasmodium falciparum. Proc Natl Acad Sci 93(8): 3503-3508.
Gatton ML, Peters JM, Fowler EV, Cheng Q. 2003. Switching rates of Plasmodium
falciparum var genes: faster than we thought?. Trends Parasitol 19(5): 202-208.
Gray C, McCormick C, Turner G, Craig A. 2003. ICAM-1 can play a major role in
mediating P. falciparum adhesion to endothelium under flow. Mol Biochem
Parasitol 128(2): 187-193.
Greenberg AE, Lobel HO. 1990. Mortality from Plasmodium falciparum malaria in
travelers from the United States, 1959 to 1987. Ann Intern Med 113(4): 326-327.
Greenwalt DE, Lipsky RH, Ockenhouse CF, Ikeda H, Tandon NN, Jamieson GA. 1992.
Membrane glycoprotein CD36: a review of its roles in adherence, signal
transduction, and transfusion medicine. Blood 80(5): 1105-1115.
Greenwood BM, Bradley AK, Greenwood AM, Byass P, Jammeh K, et al. 1987. Mortality
and morbidity from malaria among children in a rural area of the Gambia, West
Africa. Trans R Soc Trop Med Hyg 81: 478–486.
Greenwood B, Marsh K, Snow R. 1991. Why do some African children develop severe
malaria? Parasitol Today 7: 277-281.
Groves C. 2001. Primate taxonomy. Washington DC: Smithsonian Inst Pr : 350.
Guerra CA, Gikandi PW, Tatem AJ, Noor AM, Smith DL, Hay SI, Snow RW. 2008. The
limits and intensity of Plasmodium falciparum transmission: Implications for malaria
control and elimination worldwide. PLoS Medicine 5(2): e38.
Handunnetti SM, David PH, Perera KL, Mendis KN. 1989. Uninfected erythrocytes form
“rosettes” around Plasmodium falciparum infected erythrocytes. Am L Trop Med
Hyg 40(2): 115-118.
Hay SI, Guerra CA, Gething PW, Patil AP, Tatem AJ, et al. 2009. A world malaria map:
Plasmodium falciparum endemicity in 2007. PLoS Medicine 6(3): e1000048.

References ______________________________________________________________________________
103
Heddini A, Pettersson F, Kai O, Shafi J, Obiero J, et al. 2001. Fresh isolates from children
with severe Plasmodium falciparum malaria bind to multiple receptors. Infect Immun
69(9): 5849-5856.
Hiller NL, Bhattacharjee S, van Ooij C, Liolios K, Harrison T, Lopez-Estrano C, Haldar K.
2004. A host-targetting signal in virulence proteins reveals a secretome in malarial
infection. Sci 306 (5703): 1934-1937.
Ho M, Davis TM, Silamut K, Bunnag D, White NJ. 1991. Rosette formation of Plasmodium
falciparum-infected erythrocytes from patients with acute malaria. Infect Immun
59(6): 2135-2139.
Ho M, Hickey MJ, Murray AG, Andonegui G, Kubes P. 2000. Visualization of
Plasmodium falciparum-endothelium interactions in human microvasculature:
mimicry of leukocyte recruitment. J Exp Med 192(8): 1205-1211.
Ho M, Schollaardt T, Niu X, Looareesuwan S, Patel KD, Kubes P. 1998. Characterization
of Plasmodium falciparum-infected erythrocyte and P-selectin interaction under flow
conditions. Blood 91(12): 4803-4809.
Hoffman EH, Da Silveira LA, Tonhosolo R, Pereira FJ, Ribeiro WL, Tonon AP,
Kawamoto F, Ferreira MU. 2001. Geographical patterns of allelic diversity in the
Plasmodium falciparum malaria-vaccine candidate, merozoite surface protein-2. Ann
Trop Med Parasitol 95: 117-132.
Hogh B, Marbiah NT, Burghaus PA, Andersen PK. 1995. Relationship between
maternally derived anti-Plasmodium falciparum antibodies and risk of infection and
disease in infants living in an area of Liberia, West Africa, in which malaria is
highly endemic. Infect Immun 63(10): 4034-4038.
Horrocks P, Pinches R, Christodoulou Z, Kyes SA, Newbold CI. 2004. Variable var
transition rates underlie antigenic variation in malaria. Proc Natl Acad Sci 101(30):
11129-11134.
Howell DP, Levin EA, Springer AL, Kraemer SM, Phippard DJ, Schief WR, Smith JD.
2008. Mapping a common interaction site used by Plasmodium falciparum Duffy
binding-like domains to bind diverse host receptors. Mol Microbiol 67(1): 78-87.
Howell DPG, Samudrala R, Smith JD. 2006. Disguising itself-insight into Plasmodium
falciparum binding and immune evasion from the DBL crystal structure. Mol
Biochem Parsitol 148: 1-9.
Imwong M, Tanomsing N, Pukrittayakamee S, Day NPJ, White NJ, Snounou G. 2009.
Spurious amplification of Plasmodium vivax small-subunit RNA gene by use of
primers currently used to detect P. knowlesi. J Clin Microbiol 47 (12): 4173-4175.

References ________________________________________________________________________
104
Jensen AT, Magistrado P, Sharp S, Joergensen L, Lavstsen T, et al. 2004. Plasmodium
falciparum associated with severe childhood malaria preferentially expresses
PfEMP1 encoded by group A var genes. J Exp Med 199(9): 1179-1190.
Jongwutiwes S, Putaporntip C, Iwasaki T, Sata T, Kanbara H. 2004. Naturally acquired
Plasmodium knowlesi malaria in human, Thailand. Emerg Infect Dis 10 (12): 2211-
2213.
Kaestli M, Cockburn IA, Cortés A, Baea K, Rowe JA, Beck HP. 2006. Virulence of malaria
is associated with differential expression of Plasmodium falciparum var gene
subgroups in a case-control study. J Infect Dis 193(11): 1567-1574.
Kaestli M, Cortes A, Lagog M, Ott M, Beck HP. 2004. Longitudinal assessment of
Plasmodium falciparum var gene transcription in naturally infected asymptomatic
children in Papua New Guinea. J Infect Dis 189(10): 1942-1951.
Karyana M, Burdarm L, Yeung S, Kenangalem E, Wariker N, et al. 2008. Malaria
morbidity in Papua Indonesia, an area with multidrug resistant Plasmodium vivax
and Plasmodium falciparum. Malar J 7: 148.
Kaul DK, Roth EF Jr, Nagel RL, Howard RJ, Handunnetti SM. 1991. Rosetting of
Plasmodium falciparum-infected red blood cells with uninfected red blood cells
enhances microvascular obstruction under flow conditions. Blood 78(3): 812-819.
Khera R, Das N. 2009. Complement Receptor 1: disease associations and therapeutic
implications. Mol Immunol 46(5): 761-772.
Kirchgatter K, Mosbach R, del Portillo HA. 2000. Plasmodium falciparum: DBL-1 var
sequence analysis in field isolates from central Brazil. Exp Parasitol 95: 154-157.
Kirchgatter K, Portillo HA. 2002. Association of severe noncerebral Plasmodium
falciparum malaria in Brazil with expressed PfEMPI DBLI alpha sequences lacking
cysteine residues. Mol Med 8: 16-23.
Kiszewski A, Mellinger A, Spielman A, Malaney P, Sachs SE, Sachs J. 2004. A global
index representing the stability of malaria transmission. Am J Trop Med Hyg 70(5):
486-498.
Kiwanuka GN. 2009. Genetic diversity in Plasmodium falciparum merozoite surface
protein 1 and 2 coding genes and its implications in malaria epidemiology: a
review of published studies from 1997-2007. J Vector Borne Dis 46(1): 1-12.
Kraemer SM, Kyes SA, Agarwal G, Springer AL, Nelson SO, et al. 2007. Patterns of gene
recombination shape var gene repertoires in Plasmodium falciparum: comparisons of
geographically diverse isolates. BMC Genomics 8: 45.
Kraemer SM, Smith JD. 2006. A family affair: var genes, PfEMP1 binding, and malaria
References ______________________________________________________________________________
105
disease. Curr Opin Microbiol 9(4): 374-380.
Kraemer SM, Smith JD. 2003. Evidence for the importance of genetic structuring to the
structural and functional specialization of the Plasmodium falciparum var gene
family. Mol Microbiol 50(5): 1527-1538.
Kun JF, Klabunde J, Lell B, Luckner D, Alpers M, May J, Meyer C, Kremsner PG. 1999.
Association of the ICAM-1Kilifi mutation with protection against severe malaria in
Lambaréné, Gabon. Am J Trop Med Hyg 61(5): 776-779.
Kun JF, Schmidt-Ott RJ, Lehman LG, Lell B, Luckner D, Greve B, Matousek P, Kremsner
PG. 1998. Merozoite surface antigen 1 and 2 genotypes and rosetting of Plasmodium
falciparum in severe and mild malaria in Lambaréné, Gabon.Trans R Soc Trop Med
Hyg 92(1): 110-114.
Kyes S, Christodoulou Z, Pinches R, Kriek N, Horrocks P, Newbold C. 2007. Plasmodium
falciparum var gene expression in developmentally controlled at the level of RNA
polymerase II-mediated transcription initiation. Mol Microbiol 63: 1237-1247.
Kyes S, Christodoulou S, Raza A, Horrocks P, Pinches R, Rowe JA, Newbold CI. 2003. A
well-conserved Plasmodium falciparum var gene shows an unusual stage-specific
transcript pattern. Mol Microbiol 48(5): 1339-1348.
Kyes S, Horrocks P, Newbold C. 2001. Antigenic variation at the infected red cell surface
in malaria. Annu Rev Microbiol 55: 673-707.
Kyes S, Pinches R, Newbold C. 2000. A simple RNA analysis method shows var and rif
multigene family expression patterns in Plasmodium falciparum. Mol Biochem
Parasitol 105: 311-315.
Kyes S, Taylor H, Craig A, Marsh K, Newbold C. 1997. Genomic representation of var
gene sequences in Plasmodium falciparum field isolates from different geographic
regions. Mol Biochem Parasitol 87: 235-238.
Kyriacou HM, Stone GN, Challis RJ, Raza A, Lyke KE, Thera MA. 2006. Differential var
gene transcription in Plasmodium falciparum isolates from patients with cerebral
malaria compared to hyperparasitaemia. Mol Biochem Parasitol 150: 211-218.
Lavstsen T, Salanti A, Jensen ATR, Arnot DE, Theander TG. 2003. Sub-grouping of
Plasmodium falciparum 3D7 var genes based on sequence analysis of coding and
non-coding regions. Malar J 2: 27.
Lengeler C. 2004. Insecticide-treated bed nets and curtains for preventing malaria.
Cochrane Database Syst Rev 2: CD000363.
Luchaves J, Espino F, Curameng P, Espina R, Bell D, et al. 2008. Human Infections with
Plasmodium knowlesi, the Philippines. Emerg Infect Dis 14 (5): 811-813.

References ________________________________________________________________________
106
Mackintosh CL, Beeson JG, Marsh K. 2004. Clinical features and pathogenesis of severe
malaria. Trends Parasitol 20: 597-603.
Maeno Y, Nakazawa S, Dao LD, Yamamoto N, Giang ND, Hanh TV, Thuan LK,
Taniguchi K. 2008. A dried blood sample on filter paper is suitable for detecting
Plasmodium falciparum gametocytes by reverse transcription polymerase chain
reaction. Acta Trop 107: 121-127.
Manguin S, Garros C, Dusfour I, Harbach RE, Coosemans M. 2008. Bionomics, taxonomy
and distribution of the major malaria vector taxa of Anopheles subgenus Cellia in
Southeast Asia: an updated review. Infect Genet Evol 8(4): 489-503.
Marsh K, Forster D, Waruiru C, Mwangi I, Winstanley M, et al. 1995. Indivator of life-
threatening malaria in African children. N Eng J Med 332(21): 1399-1404.
Marti M, Good RT, Rug M, Knuepfer E, Cowman AF. 2004. Targetting malaria virulence
and remodeling proteins to the host erythrocyte. Science 306(5703): 1930-1933.
Maubert B, Fievet N, Tami G, Boudin C, Deloron P. 2000. Cytoadherence of Plasmodium
falciparum-infeted erythrocytes in human placenta. Parasit Immunol 22(4): 191-199.
Mayengue PI, Kalmbach Y, Issifou S, Kremsner PG & Ntoumi F. 2007. No variation in
the prevalence of point mutations in the Pfcrt and Pfmdr1 genes in isolates from
Gabonese patients with uncomplicated or severe Plasmodium falciparum malaria.
Parasitology Research 100: 487–493.
Mayor A, Bir N, Sawhney R, Singh A, Pattnaik P, Singh SK, Sharma A, Chitnis CE. 2005.
Receptor-binding residues lie in central regions of Duffy-binding-like domains
involved in red cell invasion and cytoadherence by malaria parasites. Blood 105:
2557-2563.
McCormick CJ, Craig A, Roberts D, Newbold CI, Berendt AR. 1997. Intercellular
adhesion molecule-1 and CD36 synergize to mediate adherence of Plasmodium
falciparum-infected erythrocytes to cultured human microvascular endothelial cells.
J Clin Invest 100(10): 2521-2529.
Mendis K, Sina BJ, Marchesini P, Carter R. 2001. The neglected burden of Plasmodium
vivax malaria. Am J Trop Med Hyg 64: 97-106.
Michon P, Stevens JR, Kaneko O, Adams JH. 2002. Evolutionary relationships of
conserved cysteine-rich motifs in adhesive molecules of malaria parasites. Mol Biol
Evol 19(7): 1128-1142.
Milam DF, Kusch E. 1938. Observations on Plasmodium knowlesi in general paresis. South
Med J 31: 947-949.
Miller LH. 1969. Distribution of mature trophozoites and schizonts of Plasmodium

References ______________________________________________________________________________
107
falciparum in the organs of Aotus trivirgatus, the night monkey. Am J Trop Med
Hyg 18 (6): 860-865.
Miller LH, Baruch DI, Marsh K, Doumbo OK. 2002. The pathogenic basis of malaria.
Nature 415(6872): 673-679.
Miller LH, Roberts T, Shahabuddin M, McCutchan T. 1993. Analysis of sequence
diversity in the Plasmodium falciparum merozoite surface protein-1 (MSP-1). Mol
Biochem Parasitol 59(1): 1–14.
Mok BW, Ribacke U, Winter G, Yip BH, Tan CS, et al. 2007. Comparative transcriptomal
analysis of isogenic Plasmodium falciparum clones of distinct antigenic and adhesive
phenotypes. Mol Biochem Parasitol 151: 184–192.
Mohanty S, Mishra SK, Pati SS, Pattnaik J, Das BS. 2003. Complications and mortality
patterns due to Plasmodium falciparum malaria in hospitalized adults and children,
Rourkela, Orissa, India. Trans R Soc Trop Med Hyg 97(1): 69-70.
Montgomery J, Milner DA Jr, Tse MT, Njobvu A, Kayira K, et al. 2006. Genetic analysis
of circulating and sequestered populations of Plasmodium falciparum in fatal
pediatric malaria. J Infect Dis 194(1): 115-122.
Moxon CA, Grau GE, Craig AG. 2011. Malaria: modification of the red blood cell and
consequences in the human host. Br J Haematol. doi: 10.1111/j.1365-
2141.2011.08755.x
Newbold C, Warn P, Black G, Berendt A, Craig A, et al. 1997. Receptor-specific adhesion
and clinical disease in Plasmodium falciparum. Am J Trop Med Hyg 57(4): 389-398.
Ng OT, Ooi EE, Lee CC, Lee PJ, Ng LC, et al. 2008. Naturally acquired human
Plasmodium knowlesi infection, Singapore. Emerg Infect Dis 14(5): 814-816.
Noviyanti R, Brown GV, Wickham ME, Duffy MF, Cowman AF, Reeder JC. 2001.
Multiple var gene transcripts are expressed in Plasmodium falciparum infected
erythrocytes selected for adhesion. Mol Biochem Parasitol 114: 227–237.
Ntoumi F, Contamin H, Rogier C, Bonnefoy S, Trape J-F, Mercereau-Puijalon O. 1995.
Age-dependent carriage of multiple Plasmodium falciparum MSP-2 alleles in
asymptlaria infections. Am J Trop Med Hyg 52: 81–88.
Ntoumi F, Mercereau-Puijalon O, Ossari S, Luty A, Reltien J, Georges A, Millet P. 1997.
Plasmodium falciparum: sickle-cell trait is associated with higher prevalence of
multiple infections in Gabonese children with asymptomatic infections. Exp
Parasitol 87(1): 39-46.
Ockenhouse CF, Ho FM, Tandon NN, Van Seventer GA, Shaw S, et al. 1991. Molecular
basis of sequestration in severe and uncomplicated Plasmodium falciparum malaria:
References ________________________________________________________________________
108
differential adhesion of infected erythrocytes to CD36 and ICAM-1. J Infect Dis
164(1): 163-169.
Ockenhouse CF, Magowan C, Chulay JD. 1989. Activation of monocytes and platelets by
monoclonal antibodies or malaria-infected erythrocytes binding to the CD36
surface receptor in vitro. J Clin Invest 84(2): 468-475.
Ockenhouse CF, Tegoshi T, Maeno Y, Benjamin C, Ho M, et al. 1992. Human vascular
endothelial cell adhesion receptors for Plasmodium falciparum-infected erythrocytes:
roles for endothelial leukocyte adhesion molecule 1 and vascular cell adhesion
molecule 1. J Exp Med 176(4): 1183-1189.
Oh SS, Voigt S, Fisher D, Yi SJ, LeRoy PJ, Derick LH, Liu S, Chishti AH. 2000. Plasmodium
falciparum erythrocyte membrane protein 1 is anchored to the actin-spectrin
junction and knob-associated histidine-rich protein in the erythrocyte skeleton. Mol
Biochem Parasitol 108(2): 237-247.
Oleinikov AV, Amos E, Frye IT, Rossnagle E, Mutabingwa TK, Fried M, Duffy PE. 2009.
High throughput functional assays of the variant antigen PfEMP1 reveal a single
domain in the 3D7 Plasmodium falciparum genome that binds ICAM1 with high
affinity and is targeted by naturally acquired neutralizing antibodies. PLoS Pathog
5(4): e1000386.
Pain A, Ferguson DJP, Kai O, Urban BC, Lowe B, Marsh K, Roberts DJ. 2001. Platelet-
mediated clumping of Plasmodium falciparum-infected erthrocytes is a common
adhesive phenotype and is associated with severe malaria. Proc Natl Acad Sci
98(4): 1805-1810.
Pathirana SL, Alles HK, Bandara S, Phone-Kyaw M, Perera MK, Wickremasinghe AR,
Mendis KN, Handunnetti SM. 2005. ABO-blood-group types and protection
against severe, Plasmodium falciparum malaria. Ann Trop Med Parasitol 99(2): 119-
124.
Paul REL, Hackford I, Brockman A, Muller-Graf C, Price R, et al. 1998. Transmission
Intensity and Plasmodium falciparum Diversity on the Northwestern Border of
Thailand. Am J Trop Med Hyg 58(2): 195-203.
Paul REL, Packer MJ, Walmsley M, Lagog M, Ranford-Cart-wright LC, Paru R, Day KP.
1995. Mating patterns in malaria parasite populations of Papua New Guinea.
Science 265: 1709-1711.
Peters JM, Fowler EV, Krause DR, Cheng Q, Gatton ML. 2007. Differential changes in
Plasmodium falciparum var transcription during adaptation to culture. J Infect Dis
195(5): 748-755.
References ______________________________________________________________________________
109
Peters J, Fowler E, Gatton M, Chen N, Saul A, Cheng Q. 2002. High diversity and rapid
changeover of expressed var genes during the acute phase of Plasmodium falciparum
infections in human volunteers. Proc Natl Acad Sci 99: 10689–10694.
Peterson DS, Miller LH, Wellems TE. 1995. Isolation of multiple sequences from the
Plasmodium falciparum genome that encode conserved domains homologous to
those in erythrocyte-binding proteins. Proc Natl Acad Sci 92: 7100-7104.
Ponnudurai T, Lensen AH, van Gemert GJ, Bolmer MG, Meuwissen JH. 1991. Feeding
behaviour and sporozoite ejection by infected Anopheles stephensi. Trans R Soc
Trop Med Hyg 85(2): 175-180.
Price RN, Tjitra E, Guerra CA, Yeung S, White NJ, Anstey NM. 2007. Vivax malaria:
neglected and not benign. Am J Trop Med Hyg 77: 79-87.
Ralph SA, Scheidig-Benatar C, Scherf A. 2005. Antigenic variation in Plasmodium
falciparum is associated with movement of var loci between subnuclear locations.
Proc Natl Acad Sci 102: 5414–5419.
Ranjit MR, Das A, Chhotray GP, Roth RN, Kar SK. 2004. The PfCRT (K76T) point
mutation in Plasmodium falciparum, and its usefulness for monitoring chloroquine
resistance. Ann Trop Med Parasitol 98(8): 879-882.
Ranjit MR, Das A, Das BP, Das BN, Dash BP, ChhotrayGP. 2005. Distribution of
Plasmodium falciparum genotypes in clinically mild and severe malaria cases in
Orissa, India. Trans R Soc Med Hyg 99: 389–395.
Rask TS, Hansen DA, Theander TG, Gorm Pederson A, Lavstsen T. 2010. Plasmodium
falciparum erythrocyte membrane protein 1 diversity in seven genomes-divide and
conquer. PLos Comput Biol 6(9). pii: e1000933.
Rasti N, Namusoke F, Chene A, Chen Q, Staalsoe T, et al. 2006. Nonimmune
immunoglobulin binding and multiple adhesion characterize Plasmodium
falciparum-infected erythrocytes of placental origin. Proc Natl Acad Sci 103: 13795-
13800.
Reeder, JC, Davern KM, Baird JK, Rogerson SJ, Brown GV. 1997. The age-specific
prevalence of Plasmodium falciparum in migrants to Irian Jaya is not attributable to
agglutinating antibody repertoire. Acta Trop 65(3): 163-173.
Reyburn H, Mbatia R, Drakeley C, Bruce J, Carneiro I, et al. 2005. Association of
transmission intensity and age with clinical manifestations and case fatality of
severe Plasmodium falciparum malaria. JAMA 293(12): 1461-1470.

References ________________________________________________________________________
110
Riganti M, Pongponratn E, Tegoshi T, Looareesuwan S, Punpoowong B, Aikawa M.
1990. Human cerebral malaria in Thailand: a clinico-pathological correlation.
Immunol Lett 25(1): 199-205.
Robert F, Ntoumi F, Angel G, Candito D, Rogier C, et al. 1996. Extensive genetic
diversity of Plasmodium falciparum isolates collected from patients with severe
malaria in Dakar, Senegal. Trans R Soc Trop Med Hyg 90(6): 704-711.
Robert C, Pouvelle B, Meyer P, Muanza K, Fujioka H, Aikawa M, Scherf A, Gysin J. 1995.
Chondroitin-4-sulphate (proteoglycan), a receptor for Plasmodium falciparum-
infected erythrocyte adherence on brain microvascular endothelial cells. Res
Immunol 146 (6): 383-393.
Roberts DJ, Biggs BA, Brown G, Newbold CI. 1993. Protection, pathogenesis and
phenotypic plasticity in Plasmodium falciparum malaria. Parasitol Today 9(8): 281-
286. Erratum in: Parasitol Today 9(11): 428.
Roberts DJ, Craig AG, Berendt AR, Pinches R, Nash G, Marsh K, Newbold CI. 1992.
Rapid switching to multiple antigenic and adhesive phenoypes in malaria. Nature
357: 689-692.
Roberts DJ, Pain A, Kai O, Kortok M, Marsh K. 2000. Autoagglutination of malaria-
infected red blood clles and malaria severity. Lancet 355(9213): 1427-1428.
Roberts DD, Sherwood JA, Spitalnik SL, Panton LJ, Howard RJ, et al. 985.
Thrombospondin binds falciparum malaria parasitized erythrocytes and may
mediate cytoadherence. Nature 318(6041): 64-66.
Rogerson SJ, Chaiyaroj SC, Ng K, Reeder JC, Brown GV. 1995. Chondroitin sulfate A is a
cell surface receptor for Plasmodium falciparum-infected erythrocytes. J Exp Med
182(1): 15-20.
Rogerson SJ, Reeder JC, al-Yaman F, Brown GV. 1994. Sulfated glycoconjugates as
disrupters of Plasmodium falciparum erythrocyte rosettes. Am J Trop Med Hyg 51(2):
198-203.
Rogerson SJ, Tembenu R, Dobano C, Plitt S, Taylor TE, Molyneux ME. 1999.
Cytoadherence characteristics of Plasmodium falciparum-infected erythrocytes from
Malawian children with severe and uncomplicated malaria. Am J Trop Med Hyg
61: 467-472.
Rosenberg R, Wirtz RA, Schneider I, Burge R. 1990. An estimation of the number of
malaria sporozoites ejected by a feeding mosquito. Trans R Soc Trop Med Hyg
84(2): 209-212.
Rottmann M, Lavstsen T, Mugasa JP, Kaestli M, Jensen AT, Müller D, Theander T, Beck
References ______________________________________________________________________________
111
HP. 2006. Differential expression of var gene groups is associated with morbidity
caused by Plasmodium falciparum infection in Tanzanian children. Infect Immun
74(7): 3904-3911.
Rowe A, Berendt AR, Marsh K, Newbold CI. 1994. Plasmodium falciparum: a family of
sulphated glycoconjugates disrupts erythrocyte rosettes. Exp Parasitol 79(4): 506-
516.
Rowe JA, Handel IG, Thera MA, Deans AM, Lyke KE, et al., 2007. Blood group O
protects against severe Plasmodium falciparum malaria through the mechanism of
reduced rosetting. Proc Natl Acad Sci 104(44): 17471-17476.
Rowe JA, Moulds JM, Newbold CI, Miller LH. 1997. P. falciparum rosetting mediated by a
parasite-variant erythrocyte membrane protein and complement-receptor 1. Nature
388(6639): 292-295.
Rowe A, Obeiro J, Newbold CI, Marsh K. 1995. Plasmodium falciparum rosetting is
associated with malaria severity in Kenya. Infect Immun 63(6): 2323-2326.
Rowe JA, Rogerson SJ, Raza A, Moulds JM, Kazatchkine MD, et al. 2000. Mapping of the
region of complement receptor (CR) 1 required for Plasmodium falciparum rosetting
and demonstration of the importance of CR1 in rosetting in field isolates. J
Immunol 165(11): 6341-6346.
Rug M, Prescott SW, Fernandez KM, Cooke BM, Cowman AF. 2006. The role of KAHRP
domains in knob formation and cytoadherence of P. falciparum-infected human
erythrocytes. Blood 108(1): 370-378.
Salanti A, Staalsoe T, Lavstsen T, Jensen AT, Sowa MP, Arnot DE, Hviid L, Theander TG.
2003. Selective upregulation of a single distinctly structured var gene in
chondroitin sulphate A-adhering Plasmodium falciparum involved in pregnancy-
associated malaria. Mol Microbiol 49(1): 179-191.
Sallum MA, Peyton EL, Wilkerson, RC. 2005. Six new species of the Anopheles
leucophyrus group, reinterpretation of An. elegans and vector implications. Med
Vet Entomol 19(2): 158-199.
Sambrook J, Fritsch EF, Maniatis T. 1989. Molecular cloning: a laboratory manual. Cold
Spring Harbor Laboratory, New York.
Scherf A, Hernandez-Rivaz R, Buffet P, Bottius E, Benatar C, Pouvelle B, Gysin J, Lanzer
M. 1998. Antigenic variation in malaria: in situ switching, relaxed and mutually
exclusive transcription of var gene during intraerythrocytic development in
Plasmodium falciparum. EMBO J 17 (18): 5418-5426.

References ________________________________________________________________________
112
Scherf A, Lopez-Rubio JJ, Riviere L. 2008. Antigenic variation in Plasmodium falciparum.
Annu Rev Microbiol 62: 445-470.
Scholander C, Treutiger CJ, Hultenby K, Wahlgren M. 1996. Novel fibrillar structure
confers adhesive property to malaria-infected erythrocytes. Nat Med 2(2): 204-208.
Schwartz E, Sadetzki S, Murad H, Raveh D. 2001. Age as a Risk Factor for Severe
Plasmodium falciparum Malaria in Nonimmune Patients. Clin Infect Dis 33: 1774-
1777.
Sehgal VM, Siddjiqui WA, Alpers MP. 1989. A seroepidemiological study to evaluate the
role of passive maternal immunity to malaria in infants. Trans R Soc Trop Med
Hyg 83 Suppl: 105-106.
Singh SK, Hora R, Belrhali H, Chitnis CE, Sharma A. 2006. Structural basis for Duffy
recognition by the malaria parasite Duffy-binding-like domain. Nature 439(7077):
741-744.
Singh B, Lee KS, Matusop A, Radhakrishnan A, Shamsul SSG, Cox-Singh J, Thomas A,
Conway DJ. 2004. A large focus of naturally acquired Plasmodium knowlesi
infections in human beings. Lancet 363: 10017-10024.
Smith JD, Chitnis CE, Craig AG, Roberts DJ, Hudson-Taylor DE, et al. 1995. Switches in
expression of Plasmodium falciparum var genes correlate with changes in antigenic
and cytoadherent phenotypes of infected erythrocytes. Cell 82: 101-110.
Smitha JD, Craig AG, Hudson-Taylor D, Keys S, Fagan T, et al. 2000. Identification of a
Plasmodium falciparum intercellular adhesion molecule-1 binding domain: A
parasite adhesion trait implicated in cerebral malaria. Proc Natl Acad Sci 97(4):
1766-1771.
Smith T, Felger I, Kitua A, Tanner M, Beck HP. 1999. Dynamics of multiple Plasmodium
falciparum infections in infants in a highly endemic area of Tanzania. Trans R Soc
Trop Med Hyg 93(Suppl 1): 35-39.
Smith JD, Gamain B, Baruch DI, Keys S. 2001. Decoding the language of var genes and
Plasmodium falciparum sequestration. Trends Parasitol 17(11): 538-545.
Smithb JD, Subramanian G, Gamain B, Baruch DI, Miller LH. 2000. Classification of
adhesive domains in the Plasmodium falciparum erythrocyte membrane protein I
family. Mol Biochem Parasitol 110: 293-310.
Snounou G. 2002. Genotyping of Plasmodium spp. Nested PCR. Methods Mol Med
72:103-116.
Snow RW, Bastos de Azevedo I, Lowe BS, Kabiru EW, Nevill CG, et al. 1994. Severe
childhood malaria in two areas of markedly different falciparum transmission in
References ______________________________________________________________________________
113
east Africa. Acta Trop 57(4): 289-300.
Snow RW, Guerra CA, Noor AM, Myint HY, Hay SI. 2005. The global distribution of
clinical episodes of Plasmodium falciparum malaria. Nature 434(7030): 214-217.
Snow RW, Omumbo JA, Lowe B, Molyneux CS, Obiero JO, et al., 1997. Relation between
severe malaria morbidity in children and level of Plasmodium falciparum
transmission in Africa. Lancet 349(9066): 1650-1654.
Southwell BR, Brwon GV, Forsyth KP, Smith T, Philip G, Anders R. 1989. Field
applications of agglutination and cytoadherence assays with Plasmodium falciparum
from Papua New Guinea. Trans Soc Trop Med Hyg 83(4): 464-469.
Springer AL, Smith LM, Mackay DQ, Nelson SO, Smith JD. 2004. Functional
interdependence of the DBLbeta domain and c2 region for binding of the
Plasmodium falciparum variant antigen to ICAM-1. Mol Biochem Parasitol 137: 55-
64.
Su XZ, Heatwole VM, Wertheimer SP, Guinet F, Herrfeldt A, Peterson DS, Ravetch JA,
Wellems TE. 1995. The large diverse gene family var encodes proteins involved in
cytoadherence and antigenic variation of Plasmodium falciparum-infected
erythrocytes. Cell 82: 89-100.
Tanwar GS, Khatri PC, Sengar GS, Kochar A, Kochar SK, et al. 2011. Clinical profiles of
13 children with Plasmodium vivax cerebral malaria. Ann Trop Paediatr 31(4): 351-
356.
Taylora HM, Kyes SA, Harris D, Kriek N, Newbold CI. 2000. A study of var gene
transcription in vitro using universal var gene primers. Mol Biochem Parasitol 105:
13-23.
Taylorb HM, Kyes SA, Newbold CI. 2000. Var gene diversity in Plasmodium falciparum is
generated by frequent recombination events. Mol Biochem Parasitol 110: 391-397.
Tjitra E, Anstey NM, Sugiarto P, Warikar N, Kenangalem E, Karyana M, Lampah DA,
Price RN. 2008. Multidrug-Resistant Plasmodium vivax Associated with Severe and
Fatal Malaria: A Prospective Study in Papua, Indonesia. PLoS Med 5(6): e128.
Tolia NH, Enemark EJ, Sim BK, Joshua-Tor L. 2005. Structural basis for the EBA-175
erythrocyte invasion pathway of the malaria parasite Plasmodium falciparum. Cell
122(2): 183-193. Erratum in: 122(3): 485.
Trager W, Jensen JB. 1976. Human malaria parasites in continuous culture. Science 193:
673-675.
References ________________________________________________________________________
114
Treutiger CJ, Heddini A, Fernandez V, Muller WA, Wahlgren M. 1997. PECAM-1/CD31,
an endothelial receptor for binding Plasmodium falciparum-infected erythrocytes.
Nat Med 3(12): 1405-1408.
Treutiger CJ, Hedlund I, Helmby H, Carlson J, Jepson A, et al. 1992. Rosette formation in
Plasmodium falciparum isolates and anti-rosette activity of sera from Gambians with
cerebral or uncomplicated malaria. Am J Trop Med Hyg 46(5): 503-510.
Tse MT, Chakrabarti K, Gray C, Chitnis CE, Craig A. 2004. Divergent binding sites on
intercellular adhesion molecule-1 (ICAM-1) for variant Plasmodium falciparum
isolates. Mol Microbiol 51(4): 1039-1049.
Turner GD, Ly VC, Nguyen TH, Tran TH, Nguyen HP, et al. 1998. Systemic endothelial
activation occurs in both mild and severe malaria. Correlating dermal
microvascular endothelial cell phenotype and soluble cell adhesion molecules with
disease severity. Am J Pathol 152(6): 1477-1487.
Turner GD, Morrison H, Jones M, Davis TM, Looareesuwan S, et al. 1994. An
immunohistochenical study of the pathology of fatal malaria. Evidence for
widespread endothelial activation and a potential role for intercellular adhesion
molecule-1 in cerebral sequestration. Am J Pathol 145(5): 1057-1069.
Udeinya IJ, Schmidt JA, Aikawa M, Miller LH, Green I. 1981. Falciparum malaria-
infected erythrocytes specifically bind to cultured human endothelial cells. Science
213(4507): 555-557.
Udomsangpetch R, Reinhardt PH, Schollaardt T, Eliot JF, Kubes P, Ho M. 1997.
Promiscuity of clinical Plasmodium falciparum isolates for multiple adhesion
molecules under flow conditions. J Immunol 158 (9): 4358-4364.
Udomsangpetch R, Taylor BJ, Looareesuwan S, White NJ, Elliott JF, Ho M. 1996.
Receptor specificity of clinical Plasmodium falciparum isolates: nonadherence to cell-
bound E-selectin and vascular cell adhesion molecule-1. Blood 88(7): 2754-2760.
Udomsangpetch R, Todd J, Carlson J, Greenwood BM. 1993. The effects of hemoglobin
genotype and ABO blood group on the formation of rosettes by Plasmodium
falciparum-infected red blood cells. Am J Trop Med Hyg 48(2): 149-153.
Udomsangpetch R, Wahlin B, Carlson J, Berzins K, Torii M, Aikawa M, Perlmann P,
Wahlgreen M. 1989. Plasmodium falciparum-infected erythrocytes form spontaneous
erythrocyte rosettes. J Exp Med 169(5): 1835-1840.
van de Stolpe A, van der Saag PT. 1996. Intercellular adhesion molecule-1. J Mol Med
(Berl) 74(1): 13-33.
Vogt, A. M., A. Barragan, Chen Q, Kironde F, Spillmann D, Wahlgreen M. 2003. Heparan

References ______________________________________________________________________________
115
sulfate on endothelial cells mediates the binding of Plasmodium falciparum-infected
erythrocytes via the DBL1alpha domain of PfEMP1. Blood 101(6): 2405-2411.
Vogt AM, Wnter G, Wahlgren M, Spillmann. 2004. Heparan sulphate identified on
human erythrocytes: a Plasmodium falciparum receptor. Biochem J 381(Pt3): 593-597.
Voss TS, Kaestli M, Vogel D, Bopp S, Beck HP. 2003. Identification of nuclear proteins
that interact differently with Plasmodium falciparum var gene promoters. Mol
Microbiol 48(6): 1593-1607.
Waller KL, Nunomura W, Cooke BM, Mohandas N, Coppel RL. 2002. Mapping the
domains of the cytoadherence ligand Plasmodium falciparum erythrocyte membrane
protein 1 (PfEMP1) that bind the knob-associated histidine-rich protein (KAHRP).
Mol Biochem Parasitol 119 (1): 125-129.
Wahlgren M, Abrams JS, Fernandez V, Bejarano MT, Azuma M, Torii M, Aikawa M,
Howard RJ. 1995. Adhesion of Plasmodium falciparum-infected erythrocytes to
human cells and secretion of cytokines (IL-1-beta, IL-1RA, IL-6, IL-8, IL-10, TGF
beta, TNF alpha, G-CSF, GM-CSF). Scand J Immunol 42(6): 626-636.
Ward CP, Clottey GT, Dorris M, Ji DD, Arnot DE. 1999. Analysis of Plasmodium
falciparum PfEMP-1/var genes suggest that recombination rearranges constrained
sequences. Mol Biochem Parasitol 102: 167-177.
Wassmer SC, Lépolard C, Traoré B, Pouvelle B, Gysin J, Grau GE. 2004. Platelets reorient
Plasmodium falciparum-infected erythrocyte cytoadhesion to activated endothelial
cells. J Infect Dis 189(2): 180-189.
Wassmer SC, Taylor T, Maclennan CA, Kanjala M, Mukaka M, Molyneux ME, Grau GE.
2008. Platelet-induced clumping of Plasmodium falciparum-infected erythrocytes
from Malawian patients with cerebral malaria-possible modulation in vivo by
thrombocytopenia. J Infect Dis 197(1): 72-78.
Weber G. 1992. Protein interactions. Weber G, ed. New York: Chapman and Hall.
White NJ. 2008. Plasmodium knowlesi: The fifth human malaria parasite. Clin Infect Dis 46:
172-173.
White NJ. 1987. Clinical and pathological aspects of severe malaria. Acta Leidensia. 56:
27-47.
WHO-SEARO. 2010. Malaria: Malaria Situation in SEAR Countries, Indonesia
http://www.searo.who.int/en/Section10/Section21/Section340_4022.htm
WHO. 2000. Communicable diseases cluster: Severe falciparum malaria. Trans R Soc
Trop Med Hyg 94 Suppl 1: S1-90.
Winter G, Chen Q, Flick K, Kremsner P, Fernandez V, Wahlgren M. 2003. The 3D7var5.2

References ________________________________________________________________________
116
(var COMMON) type var gene family is commonly expressed in non-placental
Plasmodium falciparum malaria. Mol Biochem Parasitol 127(2): 179-191.
Yamada M, Steketee R, Abramowsky C, Kida M, Wirima J, et al. 1989. Plasmodium
falciparum associated placental pathology: a light and electron microscopic and
immunohistologic study. Am J Trop Med Hyg 41(2): 161-168.
Yipp BG, Anand S, Schollaardt T, Patel KD, Looareesuwan S, Ho M. 2000. Synergism of
multiple adhesion molecules in mediating cytoadherence of Plasmodium
falciparum-infected erythrocytes to microvascular endothelial cells under flow.
Blood 96(6): 2292-2298.
Yipp BG, Hickey MJ, Andonegui G, Murray AG, Looareesuwan S, Kubes P, Ho M. 2007.
Differential roles of CD36, ICAM-1, and P-selectin in Plasmodium falciparum
cytoadherence in vivo. Microcirculation 14(6): 593-602.
Zhu HM, Li J, Zheng H. 2006. Human natural infection of Plasmodium knowlesi. Chinese
Journal of Parasitology and Parasitic Diseases 24 : 70-71.
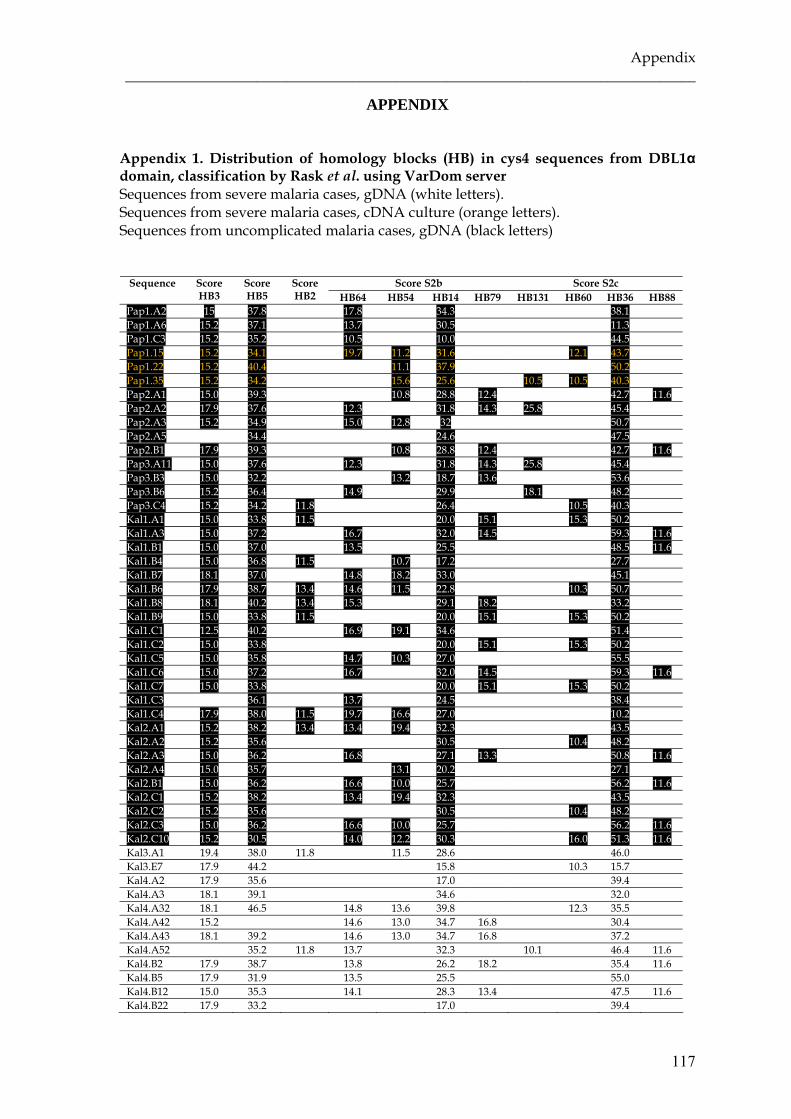
Appendix ______________________________________________________________________________
117
APPENDIX Appendix 1. Distribution of homology blocks (HB) in cys4 sequences from DBL1α domain, classification by Rask et al. using VarDom server Sequences from severe malaria cases, gDNA (white letters). Sequences from severe malaria cases, cDNA culture (orange letters). Sequences from uncomplicated malaria cases, gDNA (black letters)
Score S2b Score S2c Sequence Score HB3
Score HB5
Score HB2 HB64 HB54 HB14 HB79 HB131 HB60 HB36 HB88
Pap1.A2 15 37.8 17.8 34.3 38.1 Pap1.A6 15.2 37.1 13.7 30.5 11.3 Pap1.C3 15.2 35.2 10.5 10.0 44.5 Pap1.15 15.2 34.1 19.7 11.2 31.6 12.1 43.7 Pap1.22 15.2 40.4 11.1 37.9 50.2 Pap1.35 15.2 34.2 15.6 25.6 10.5 10.5 40.3 Pap2.A1 15.0 39.3 10.8 28.8 12.4 42.7 11.6 Pap2.A2 17.9 37.6 12.3 31.8 14.3 25.8 45.4 Pap2.A3 15.2 34.9 15.0 12.8 32 50.7 Pap2.A5 34.4 24.6 47.5 Pap2.B1 17.9 39.3 10.8 28.8 12.4 42.7 11.6 Pap3.A11 15.0 37.6 12.3 31.8 14.3 25.8 45.4 Pap3.B3 15.0 32.2 13.2 18.7 13.6 53.6 Pap3.B6 15.2 36.4 14.9 29.9 18.1 48.2 Pap3.C4 15.2 34.2 11.8 26.4 10.5 40.3 Kal1.A1 15.0 33.8 11.5 20.0 15.1 15.3 50.2 Kal1.A3 15.0 37.2 16.7 32.0 14.5 59.3 11.6 Kal1.B1 15.0 37.0 13.5 25.5 48.5 11.6 Kal1.B4 15.0 36.8 11.5 10.7 17.2 27.7 Kal1.B7 18.1 37.0 14.8 18.2 33.0 45.1 Kal1.B6 17.9 38.7 13.4 14.6 11.5 22.8 10.3 50.7 Kal1.B8 18.1 40.2 13.4 15.3 29.1 18.2 33.2 Kal1.B9 15.0 33.8 11.5 20.0 15.1 15.3 50.2 Kal1.C1 12.5 40.2 16.9 19.1 34.6 51.4 Kal1.C2 15.0 33.8 20.0 15.1 15.3 50.2 Kal1.C5 15.0 35.8 14.7 10.3 27.0 55.5 Kal1.C6 15.0 37.2 16.7 32.0 14.5 59.3 11.6 Kal1.C7 15.0 33.8 20.0 15.1 15.3 50.2 Kal1.C3 36.1 13.7 24.5 38.4 Kal1.C4 17.9 38.0 11.5 19.7 16.6 27.0 10.2 Kal2.A1 15.2 38.2 13.4 13.4 19.4 32.3 43.5 Kal2.A2 15.2 35.6 30.5 10.4 48.2 Kal2.A3 15.0 36.2 16.8 27.1 13.3 50.8 11.6 Kal2.A4 15.0 35.7 13.1 20.2 27.1 Kal2.B1 15.0 36.2 16.6 10.0 25.7 56.2 11.6 Kal2.C1 15.2 38.2 13.4 19.4 32.3 43.5 Kal2.C2 15.2 35.6 30.5 10.4 48.2 Kal2.C3 15.0 36.2 16.6 10.0 25.7 56.2 11.6 Kal2.C10 15.2 30.5 14.0 12.2 30.3 16.0 51.3 11.6 Kal3.A1 19.4 38.0 11.8 11.5 28.6 46.0 Kal3.E7 17.9 44.2 15.8 10.3 15.7 Kal4.A2 17.9 35.6 17.0 39.4 Kal4.A3 18.1 39.1 34.6 32.0 Kal4.A32 18.1 46.5 14.8 13.6 39.8 12.3 35.5 Kal4.A42 15.2 14.6 13.0 34.7 16.8 30.4 Kal4.A43 18.1 39.2 14.6 13.0 34.7 16.8 37.2 Kal4.A52 35.2 11.8 13.7 32.3 10.1 46.4 11.6 Kal4.B2 17.9 38.7 13.8 26.2 18.2 35.4 11.6 Kal4.B5 17.9 31.9 13.5 25.5 55.0 Kal4.B12 15.0 35.3 14.1 28.3 13.4 47.5 11.6 Kal4.B22 17.9 33.2 17.0 39.4

Appendix ________________________________________________________________________
118
Kal4.C1 18.1 38.4 11.8 34.4 12.9 37.0 11.6 Kal4.C22 15.0 32.4 14.1 28.3 13.4 47.5 11.6 Kal4.C42 17.9 37.6 12.4 29.5 16.0 32.1 Kal5.A4 15.0 35.3 14.1 28.3 13.4 47.5 11.6 Kal5.B2 15.0 35.1 29.3 21.2 45.3 Kal5.C3 15.2 37.0 13.4 14.8 18.2 33.0 45.1 Kal5.C4 15.0 35.3 10.2 17.9 32.3 20.1 Kal5.C5 12.5 37.1 15.3 28.4 11.5 43.1 Kal5.C6 15.0 35.3 10.2 17.9 32.3 20.1 Kal5.C7 15.0 35.3 10.2 17.9 26.3 20.1
Appendix 2. Distribution of homology blocks (HB) in cys2 sequences from DBLα domain (classification by Rask et al. using VarDom server) Sequences from severe malaria cases, gDNA (white letters). Sequences from severe malaria cases, cDNA culture (orange letters). Sequences from severe malaria cases, cDNA filter paper (yellow letters on red). Sequence from an uncomplicated case, cDNA filter paper (yellow letters on black). Sequences from uncomplicated malaria cases, gDNA (black letters)
Score S2b Score S2c Sequence Score HB3
Score HB5
Score HB2 HB64 HB54 HB14 HB79 HB131 HB60 HB36 HB88
Pap1.A3 15.2 29.9 27.8 38.1 Pap1.A4 15.2 36.7 11.8 30.7 48.2 Pap1.B3 15.0 33.0 27.4 41.5 Pap1.10 15.0 37.8 13.0 35.3 Pap1.11 15.2 35.9 12.7 26.6 33.9 Pap1.12 15.2 35.9 12.7 11.5 33.9 Pap1.14 15.2 35.9 12.7 26.6 33.9 Pap1.31 15.2 40.0 14.8 20.5 37.5 33.6 Pap1.32 15.2 36.3 11.8 12.7 26.6 33.9 Pap1.FP 35.9 11.6 26.6 33.9 Pap2.C1 19.2 36.8 17.5 17.6 29.6 21.6 Pap2.C2 18.1 36.4 11.2 26.1 18.2 47.7 Pap2.C3 19.4 36.4 13.4 11.2 26.1 18.2 47.7 Pap2.C4 19.4 33.1 11.1 35.4 Pap2.FP 15.0 36.3 13.4 25.5 35.9 Pap3.A1 15.0 38.2 21.8 44.8 Pap3.A2 15.0 40.3 24.4 19.4 Pap3.A8 15.0 29.5 13.3 34.2 Pap3.A9 15.0 29.5 13.4 13.3 34.2 Pap3.A10 15.0 29.5 13.3 34.2 Pap3.C8 15.0 40.1 11.1 28.0 42.7 Pap3.C9 15.0 40.1 11.1 28.0 42.7 Pap3.FP 40.1 18.8 11.1 28.0 42.7 Kal1.A2 15.0 34.8 11.5 39.2 Kal1.B3 18.1 38.4 15.4 19.5 30.2 37.1 Kal1.FP 37.4 19.1 Kal2.B2 15.0 35.1 13.4 29.2 44.4 Kal2.FP 37.4 14.5 27.3 43.5 Kal3.F7 17.9 37.0 22.7 39.1 Kal3.F10 17.9 38.6 24.6 40.8 Kal4.C62 17.9 34.5 15.5 35.2 Kal5.C1 15.0 34.5 13.4 15.5 43.7 Kal5.C2 15.0 37.4 27.3 43.7 Kal5.C8 15.0 37.4 27.3 43.7 Kal5.FP 15.0 36.3 13.4 25.5 35.9
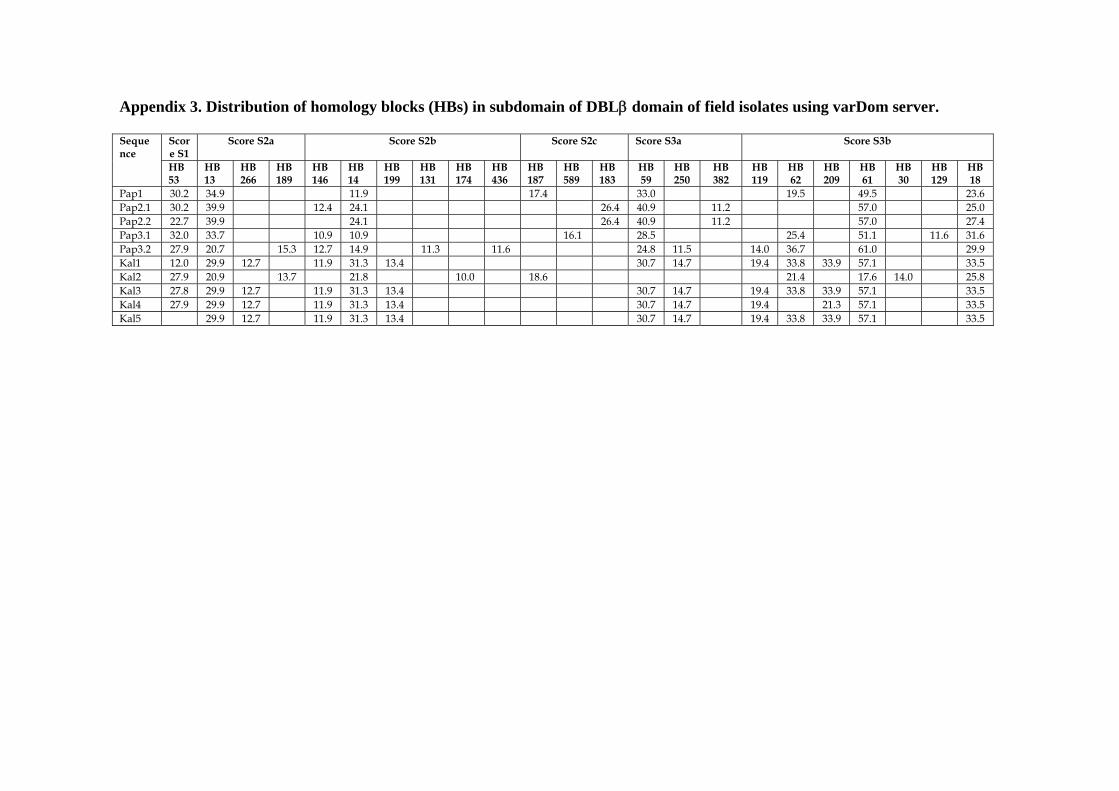
Appendix 3. Distribution of homology blocks (HBs) in subdomain of DBLβ domain of field isolates using varDom server.
Score S1
Score S2a Score S2b Score S2c Score S3a Score S3b Sequence
HB 53
HB 13
HB 266
HB 189
HB 146
HB 14
HB 199
HB 131
HB 174
HB 436
HB 187
HB 589
HB 183
HB 59
HB 250
HB 382
HB 119
HB 62
HB 209
HB 61
HB 30
HB 129
HB 18
Pap1 30.2 34.9 11.9 17.4 33.0 19.5 49.5 23.6 Pap2.1 30.2 39.9 12.4 24.1 26.4 40.9 11.2 57.0 25.0 Pap2.2 22.7 39.9 24.1 26.4 40.9 11.2 57.0 27.4 Pap3.1 32.0 33.7 10.9 10.9 16.1 28.5 25.4 51.1 11.6 31.6 Pap3.2 27.9 20.7 15.3 12.7 14.9 11.3 11.6 24.8 11.5 14.0 36.7 61.0 29.9 Kal1 12.0 29.9 12.7 11.9 31.3 13.4 30.7 14.7 19.4 33.8 33.9 57.1 33.5 Kal2 27.9 20.9 13.7 21.8 10.0 18.6 21.4 17.6 14.0 25.8 Kal3 27.8 29.9 12.7 11.9 31.3 13.4 30.7 14.7 19.4 33.8 33.9 57.1 33.5 Kal4 27.9 29.9 12.7 11.9 31.3 13.4 30.7 14.7 19.4 21.3 57.1 33.5 Kal5 29.9 12.7 11.9 31.3 13.4 30.7 14.7 19.4 33.8 33.9 57.1 33.5
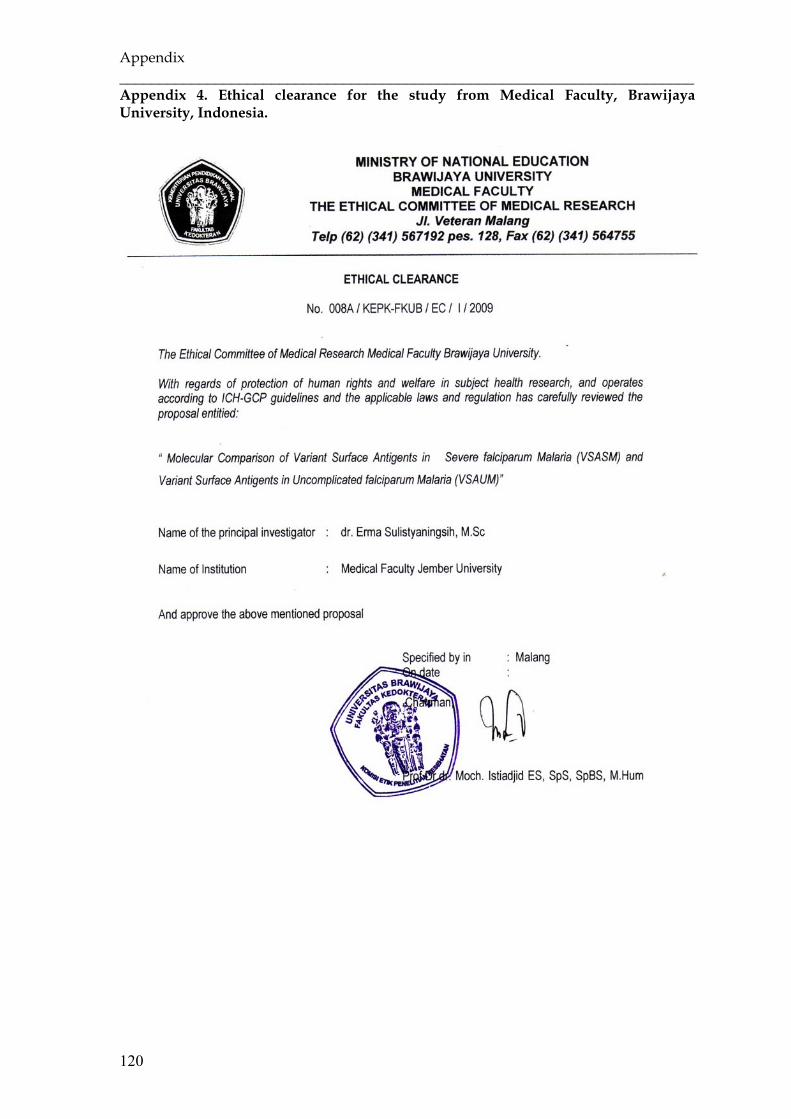
Appendix ________________________________________________________________________
120
Appendix 4. Ethical clearance for the study from Medical Faculty, Brawijaya University, Indonesia.
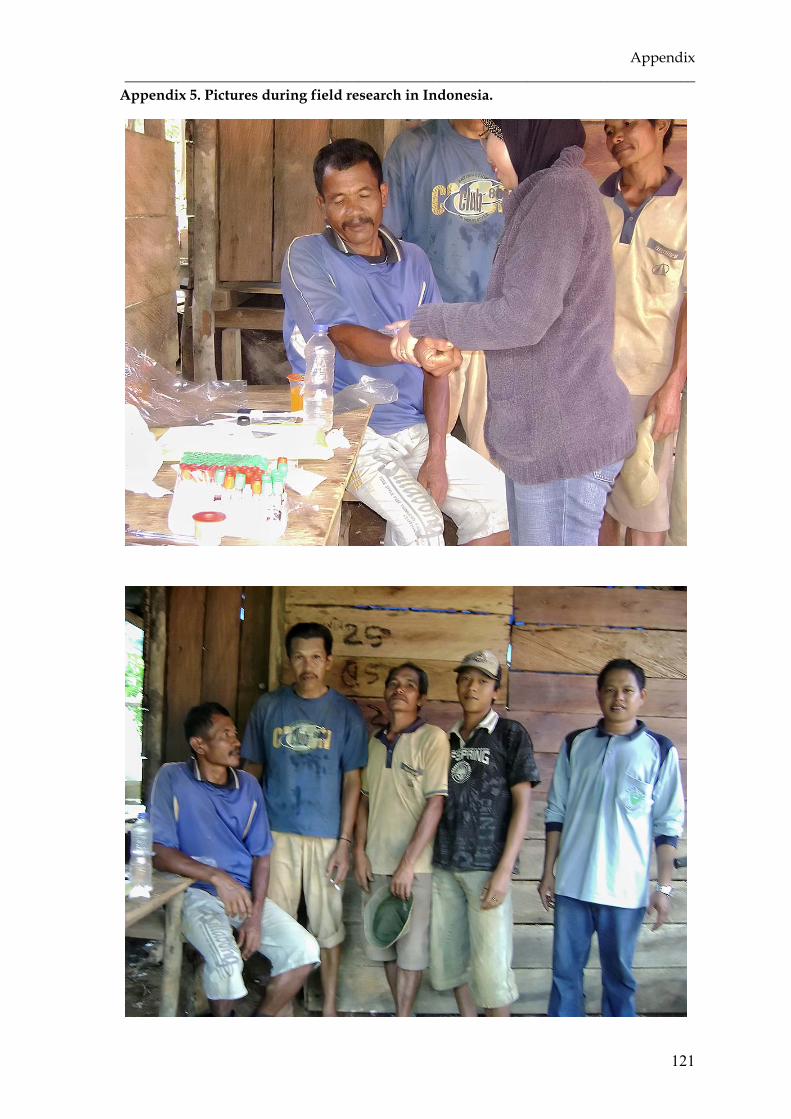
Appendix ______________________________________________________________________________
121
Appendix 5. Pictures during field research in Indonesia.

Appendix ________________________________________________________________________
122

ACKNOWLEDGEMENTS
I would like to take this opportunity to thank all those who in so many different ways
have contributed to this thesis work. In particular I would like to thank:
My supervisor, Prof. Dr. med. Thomas Loescher, for his guidance and support as well as
for making this work possible.
My co-supervisor, Dr. med Nicole Berens-Riha, for helping me in all ways. Your
continuous support and advice has been a great source of inspiration and help.
The Malaria Research group at Department of Infectious Diseases and Tropical Medicine
LMU, for their support and togetherness.
My home institution, the Medical Faculty University of Jember, for giving the
opportunity to gain my further study.
My collaborators, Dr. Loeki Enggar Fitri and all co-workers in Malang, Sigit MD and
team in Kalimantan who helped me to find the way to the jungle.
The patients who participated in this study. I hope that we have together put some
cobblestones in the road towards a healthier world.
My parents for all their support, love and understanding.
My deepest gratefulness goes to my beloved husband and best friend, Cahyo Wibowo,
for his endless love, support and being there for me whatever comes, and my children-
Amara, Naura and Aysel, for their unconditional love, to whom this thesis is dedicated.

Acknowledgements ________________________________________________________________________
124

CURRICULUM VITAE
1. Personal Data
Name : Erma Sulistyaningsih
Date of Birth : 22.02.1977
Place of Birth : Banyuwangi, Indonesia
Gender : Female
Marital status : Married, 3 daughters
Nationality : Indonesian
Home Address : Connollystr. 7 / K-21
80809 Munich
Work Address : Division of Infectious and Tropical Medicine
Medical Center of the University of Munich (LMU)
Leopoldstr. 5
80802 Munich
Phone +49-(0)89-2180-3517
Fax +49 (0)89-33-61-12
Email : [email protected]
2. Education
10.2008 – 09.2012 Doctorate University of Munich, Germany
Thesis: Characterisation of var genes and of
the PfEMP-1 binding capacity to ICAM-1 of
Plasmodium falciparum isolates from Indonesia
09.2004 – 06.2007 Master M.Sc in Biotechnology,
Gadjah Mada University (UGM), Indonesia
Thesis: Cloning of cDNA Encoding GRA1
Protein of Tachyzoites Toxoplasma gondii
Local Isolate
08.1998 – 10.2010 Medical
Doctor
MD – Brawijaya University, Malang,
Indonesia.
09.1994 – 08.1998 Bachelor Bachelor of Medicine and Bachelor of Surgery
in Brawijaya University, Malang, Indonesia.

Curriculum vitae ________________________________________________________________________
126
3. Working Experiences
10.2008 - present Research fellow, PhD Student
Division of Infectious Diseases and Tropical Medicine
Medical Center of the University of Munich (LMU),
Munich,Germany.
08.2006 – 10.2008 Lecturer in Biochemistry, Molecular Biology and Medical
Biology
Faculty of Medicine, University of Jember, Jember,
Indonesia.
09.2004 – 07.2007 Research fellow, Master Student
Biotechnology Research Center, Gadjah Mada
University, Yogyakarta, Indonesia.
12.2001 – 08.2004 Lecturer in Medical Physiology
Faculty of Medicine, University of Jember, Jember,
Indonesia.
4. Publications
- Sulistyaningsih E, Fitri LE, Loescher T, Berens-Riha N, 2010. Diagnostic
Difficulties with Plasmodium knowlesi Infection in Humans. Emerg Infect Dis
(EID) 16 (6): 1033-1034 . DOI: 10.3201/eid1606.100022
- Sulistyaningsih E, Loescher T, Fleischman E, Berens-Riha N, Malaria, 2009. P.
knowlesi in human in Indonesia: Kalimantan. Promed-mail
- Sulistyaningsih E, Artama IW, 2007, Synthesis and Amplification of cDNA
encoding GRA1 Protein of Tachyzoites Toxoplasma gondii Local Isolate,
Damianus, Unika Atma Jaya 6 (3) : 171-176.
- Sulistyaningsih E, 2007. PCR: New Age of Diagnosis and Management of
Infectious Diseases. Jurnal Biomedis-FK UNEJ 1 (1).
- Sulistyaningsih E, Moeljopawiro S, Soebandono J, Artama IW, 2005. Cloning of
cDNA Encoding GRA1 Protein of Tachyzoite Toxoplasma gondii Local Isolate.
Ind J Biotech 10 (1): 763-767.
5. Presentations (Oral and Poster Presentations)
15-16.03.2012 DTG (Deutschen Gesellschaft fuer Tropenmedizine und
International Gesundheit) – Tropical Medicine and Parasitology

Curriculum Vitae ______________________________________________________________________________
127
- Jahres Tagung, Heidelberg, Germany.
“DBL domain expression in Plasmodium falciparum from
Indonesia”
3-6.10.2011 7th European Congress on Tropical Medicine and International
Health, Barcelona, Spain.
“Expression of variant surface antigens in Indonesian Isolates
from severe and uncomplicated Plasmodium falciparum malaria
patients”
12-13.11.2010 8th Malaria Meeting, Swiss Tropical and Public Health Institute
(Swiss TPH), Basel, Swiss.
“Sequence diversity of Indonesian var genes of Plasmodium
falciparum isolates in severe and uncomplicated malaria”
11-12.05.2010 DoktaMed 2010, the annually meeting of departments and
students of Medical Faculty, LMU, Munich, Germany.
“Naturally Acquired Human Plasmodium knowlesi Infection
found in Indonesia”
03-05.05.2010 The sixth Annual BioMalPar Conference on the Biology and
Pathology of the Malaria Parasite, Heidelberg, Germany.
“Genetic Diversity of DBLα domain of P. falciparum var gene in
field Isolates from Indonesia”
06-07.11.2009 The Tropical Medicine 2009 Conference, the annually meeting of
the German Society of Tropical Medicine and International
Health (DTG), Munich, Germany
“Naturally Acquired Plasmodium knowlesi Infection in Human
beings, Indonesia”
5. Languages
Mother Tongue : Indonesian
Other languages : English : Good in writing and speaking
German : Working knowledge
Japanese : Basic knowledge
