development and characterisation of …
TRANSCRIPT
DEVELOPMENT AND CHARACTERISATION OF MICROSATELLITE
MARKERS FOR HELMETED GUINEA FOWL (NUMIDA MELEAGRIS) IN
GHANA
BY
PRINCESS KORKOR BOTCHWAY
THIS THESIS IS SUBMITTED TO THE UNIVERSITY OF GHANA, LEGON,
IN PARTIAL FULFILMENT OF THE REQUIREMENT FOR THE AWARD
OF MPHIL ANIMAL SCIENCE DEGREE
JULY, 2013
University of Ghana http://ugspace.ug.edu.gh

i
DECLARATION
I, Princess Korkor Botchway, author of this thesis entitled “Development and Characterisation
of Microsatellite Markers for Helmeted Guinea Fowl (Numida meleagris) in Ghana” hereby
solemnly declare that except for references to the work of other researchers, the work presented
in this thesis is entirely based on work undertaken by me in the Department of Animal Science
from August, 2012 to July, 2013. This work has not been submitted in whole or in part for any
degree of this university or elsewhere. Other persons’ views and ideas I have quoted and
referred to have been fully acknowledged.
.....................................
Princess Korkor Botchway
This work has been submitted for examination with our approval as supervisors:
.....................................
Dr. B.B. Kayang
(PRINCIPAL SUPPERVISOR)
..................................
Dr. F.Y. Obese
(CO-SUPPERVISOR)
University of Ghana http://ugspace.ug.edu.gh

ii
DEDICATION
With all the love I possess in my being I dedicate this dissertation to my family who devoted
their love, time and other resources to educate me and also to my teacher, the Late Mr.
Ampadu who inspired and motivated me to make it this far.
University of Ghana http://ugspace.ug.edu.gh

iii
ACKNOWLEDGEMENT
I am entirely grateful to the almighty God for his divine favour of life and also for making this
study a success. I acknowledge the support of my family who stood by me with alacrity
throughout the period of the project. I am also very grateful to my supervisors, Dr. B.B.
Kayang and Dr. F.Y. Obese, of the Department of Animal Science, University of Ghana,
Legon, for their expertise, patience, advice, constant encouragement, criticism and contribution
towards this study. I also thank all the Senior members of the Department of Animal Science
for their criticism and contribution towards making this work a success.
To Dr. Erasmus H. Owusu of the Department of Animal Biology and Conservation Science,
University of Ghana, Mr. Tiitoe Boon and staff of the Livestock and Poultry Research Center,
University of Ghana (Dr. A. Naazie, Mr. H. Manu, Mr. M. Bashiru and Mr. Alex Potir), I
appreciate your tremendous assistance during sample collection.
This work was made possible through the collaboration between the College of Agriculture &
Consumer Sciences of the University of Ghana and the Wildlife Research Center (WRC) of
Kyoto University. In light of this, I acknowledge the financial support of the Asian and African
Science Platform Program under the Japan Society for the Promotion of Science (JSPS)
through which I received vital technical training in Japan and carried out important laboratory
analyses. I particularly wish to express special thanks to Prof. M. Murayama, WRC of Kyoto
University, who was instrumental in securing funding from JSPS and who showed so much
interest in this study. I am also indebted to other members of WRC especially Dr. Azuza
Hyano and Mr. Christopher Adenyo (a PhD student), as well as Dr. Eiji Inoue of the Graduate
School of Science, Kyoto University for providing needed technical assistance while I was in
Japan. Finally, I wish to gratefully acknowledge the financial support of the A.G. Leventis
University of Ghana http://ugspace.ug.edu.gh

iv
Foundation Fellowship Scheme 2012/2013, University of Ghana, Legon that facilitated the
final write-up of this thesis.
University of Ghana http://ugspace.ug.edu.gh

v
TABLE OF CONTENTS
DECLARATION ...................................................................................................................... i
DEDICATION ........................................................................................................................ ii
ACKNOWLEDGEMENT ...................................................................................................... iii
TABLE OF CONTENTS ......................................................................................................... v
LIST OF TABLES ................................................................................................................ vii
LIST OF FIGURES .............................................................................................................. viii
LIST OF PLATES .................................................................................................................. ix
ABSTRACT ............................................................................................................................ x
LIST OF ABBREVIATIONS ................................................................................................ xii
CHAPTER ONE...................................................................................................................... 1
1.0 INTRODUCTION ..................................................................................................... 1
CHAPTER TWO ..................................................................................................................... 6
2.0 LITERATURE REVIEW ............................................................................................... 6
2.1 Guinea Fowl ............................................................................................................... 6
2.2 Genetic Markers ....................................................................................................... 12
2.3 Microsatellite Markers .............................................................................................. 17
CHAPTER THREE ............................................................................................................... 34
3.0 MATERIALS AND METHODS ............................................................................. 34
3.1 Sampling .................................................................................................................. 34
3.2 DNA Extraction and quality assessment .................................................................... 34
3.3 Marker Development ................................................................................................ 35
3.3.4 Library Screening .................................................................................................. 44
3.3.5 Primer Design ........................................................................................................ 44
3.3.6 Primer Optimisation ............................................................................................... 45
3.3.7 Genotyping ............................................................................................................ 46
3.3.8 Data Analysis......................................................................................................... 48
CHAPTER FOUR ................................................................................................................. 49
4.0 RESULTS ............................................................................................................... 49
4.1 Library development and screening........................................................................... 49
4.2 Primer Design ........................................................................................................... 50
4.3 Primer Testing .......................................................................................................... 51
4.4 Genotyping ............................................................................................................... 63
University of Ghana http://ugspace.ug.edu.gh
vi
4.5 Data Analysis ........................................................................................................... 66
CHAPTER FIVE ................................................................................................................... 73
5.0 DISCUSSION .............................................................................................................. 73
5.1 Efficiency of 454 sequencing for microsatellite development in guinea fowl ............. 73
5.2 Characteristics of guinea fowl microsatellite markers ................................................ 74
5.3 Allelic diversity of microsatellites in guinea fowl ..................................................... 78
CHAPTER SIX ..................................................................................................................... 82
6.0 GENERAL CONCLUSION AND RECOMMENDATIONS........................................ 82
6.1 Conclusion ................................................................................................................ 82
6.2 Recommendations .................................................................................................... 82
REFERENCES ...................................................................................................................... 84
APPENDICES ..................................................................................................................... 105
University of Ghana http://ugspace.ug.edu.gh
vii
LIST OF TABLES
Table 1: Characteristics of the main types of molecular markers. ........................................ 15
Table 2: Common classes of microsatellites ........................................................................ 18
Table 3: Categories of microsatellite repeats ....................................................................... 19
Table 4: Multiplex PCR and primer information for nine primers ....................................... 47
Table 5: Number of primers designed ................................................................................. 50
Table 6: PCR optimization at 55°C and 60°C ...................................................................... 52
Table 7: Primer sequence and amplification information for 154 designed microsatellite
primers ............................................................................................................................... 54
Table 8: Profile of 31 polymorphic loci ............................................................................... 68
Table 9: Informativeness of 31 guinea fowl polymorphic microsatellite loci ....................... 72
University of Ghana http://ugspace.ug.edu.gh

viii
LIST OF FIGURES
Figure 1: Schematic representation of traditional marker development ................................ 24
Figure 2: Schematic diagram of emulsion PCR process ....................................................... 26
Figure 3: Schematic diagram of bead deposition into PicoTiter Plate .................................. 27
Figure 4: Bench top Next-Generation Sequencer (Roche Genome sequencer junior) ........... 28
Figure 5: Primer design with bioinformatics........................................................................ 29
Figure 6: High sensitivity chip profile of sample before ligation ......................................... 38
Figure 7: High sensitivity chip profile of sample after ligation ............................................ 38
Figure 8: Rapid Library (RL) standard curve ....................................................................... 40
Figure 9: Distribution of microsatellites in five classes of repeats ....................................... 49
Figure 10: Characteristics of microsatellite repeats ............................................................. 51
Figure 11: Gel image showing PCR optimization results of four primers with DNA from
four individuals.. ................................................................................................................. 53
Figure 12: Electropherogram of locus GF75 showing three different genotypes for three
individuals... ....................................................................................................................... 64
Figure 13: Electropherogram of locus GF46 showing three similar genotypes for three
individuals.. ........................................................................................................................ 65
Figure 14: Characteristics of 31 polymorphic loci. .............................................................. 71
University of Ghana http://ugspace.ug.edu.gh

ix
LIST OF PLATES
Plate 1: Species of guinea fowl within the four genera……………………….………..……7
University of Ghana http://ugspace.ug.edu.gh
x
ABSTRACT
The indigenous guinea fowl plays a vital role in the agricultural industry as both its meat and
eggs are healthy, tasty and serve as an important protein source for consumers. However,
genetic progress on this bird has been partially hindered by the absence of polymorphic
markers, especially microsatellites. Therefore, this study developed for the first time original
microsatellite markers for this economically important species. The 454 sequencing technique
(next-generation sequencing), which is known to eliminate the time consuming cloning step in
the traditional microsatellite marker development method, was used in this study. A genomic
library was constructed from DNA extracted from the blood of a female guinea fowl, using the
next-generation sequencer. A total of 105,015 reads with an average read length of 393 bp
containing 1,234 possible microsatellite sites were obtained. One hundred and fifty four
primers were designed from the flanking regions of the microsatellites and tested at 55 °C and
60 °C in a polymerase chain reaction using DNA from four unrelated guinea fowls. One
hundred and twenty two of these primers showed clear amplification patterns. Polymorphism
of 38 of the optimized markers was tested with DNA samples from 32 unrelated individuals
and 31 of them were polymorphic. For the 31 polymorphic loci, the observed number of alleles
ranged from 2 to 9 (mean 3.39) with allele sizes ranging from 94 bp to 286 bp, while the
effective number of alleles ranged from 1.03 to 4.97 (mean 2.04). The observed (HO) and
expected heterozygosities (He) ranged from 0.033 to 1.000 (mean 0.396) and 0.033 to 0.799
(mean 0.419), respectively. Nine loci significantly deviated from Hardy-Weinberg Equilibrium
(p < 0.05) after Bonferroni correction. The mean fixation index (F) for all 31 loci was 0.052 (-1
to 0.71) while the average probability of identity (PI) was 0.43. Shannon’s Index ranged from
0.085 to 1.821 (mean 0.750). The polymorphism information content (PIC) of the 31 markers
averaged 0.3689 (0.0329 to 0.7735) with 29% of them being highly informative (PIC > 0.50),
35.5% being reasonably informative (0.50 > PIC > 0.25), and 35.5% being slightly
University of Ghana http://ugspace.ug.edu.gh

xi
informative (PIC < 0.25). The results of this study would serve as baseline information for
genetic diversity studies, genetic linkage mapping, quantitative trait loci analysis as well as
inform breeding strategies for the improvement and conservation in both domestic and wild
populations of the species.
University of Ghana http://ugspace.ug.edu.gh
xii
LIST OF ABBREVIATIONS
AFLP Amplified fragment length polymorphism
DNA Deoxyribonucleic acid
dNTP Deoxy nucleotide triophosphate
F Fixation index
He Expected heterozygosity
Ho Observed heterozygosity
HWE Hardy-Weinberg equilibrium
I Shannon’s Index
MPC Magnetic Particle Concentrator
mtDNA Mitochondrial DNA
Na Number of alleles
NAF Null allele frequency
Ne Effective number of alleles
PCR Polymerase chain reaction
PI Probability of identity
PIC Polymorphism information content
RAPD Random amplified polymorphic DNA
RFLP Restriction fragment length polymorphism
RFU Relative fluorescent unit
RL Rapid library
SNP Single nucleotide polymorphism
SSR Simple sequence repeat
University of Ghana http://ugspace.ug.edu.gh
1
CHAPTER ONE
1.0 INTRODUCTION
The successful domestication of animals has led to the development and testing of
several methods in the pursuit of improving animal productivity. Due to the fact that
animal genetic improvement is a continuous and complex process, the face of animal
breeding has been very dynamic over the past decades. Traditionally, the genetic
improvement of livestock breeds has been based on phenotypic selection. The 20th
century was therefore defined by the development of the quantitative theory and
methodology towards accurate selection and the prediction of genetic response
(Walsh, 2000; Van Marle-Köster et al., 2003). This resulted in the selection of some
economically important genetic traits in cattle, sheep, pigs and poultry (Van Marle-
Köster et al., 2003). In recent years, the demonstration of genetic polymorphism at the
DNA sequence level has listed several marker techniques with a range of applications.
This has resulted in the increased regard for the potential value of these markers in
animal breeding (Hines, 1999). These markers have been useful in studies including
kinship and population studies, gene duplication or deletion, construction of detailed
genetic maps of several organisms and the study of genetic variation within
populations of the same species (Santana et al., 2009). The utilization of marker-
based information for genetic improvement is based on the choice of marker system
for a given application. Several factors such as the degree of polymorphism,
dominance, technical know-how, possibility of automation, reproducibility of the
technique, and finally the expense involved have influenced the selection of markers
for different applications (Van Marle-Köster et al., 2003). Autosomal markers are the
most efficient markers for genetic diversity studies because they are easily
reproducible, co-dominant and highly polymorphic (FAO, 2007; FAO, 2011; Lenstra
University of Ghana http://ugspace.ug.edu.gh
2
et al., 2012). These markers have however been used in conjunction with
mitochondrial and Y-chromosomal DNA to establish breed relationships (FAO, 2007;
FAO, 2011).
Current global research efforts on animal genetic variation are geared towards
characterising the genetic structure of local populations to serve as the basis for
identifying unique populations or genotypes for conservation against future needs
(Kayang et al., 2010). This is particularly critical in an era of unnerving global
challenges such as population growth, climate change, emerging diseases and rising
consumer demands, which would likely require new genotypes in the future (Kayang
et al., 2010). Furthermore, it is easier to manage and improve genetic diversity of a
population or breed of farm animals but once diversity is lost, it is expensive and
difficult to make changes (Lenstra et al., 2012). Existing Animal genetic resources
thus represent a massive past investment which, if managed appropriately, can
provide insurance against an unknowable global future (FAO, 2007; FAO, 2011).
Microsatellite markers are among the key tools for the study of genetic structure of
populations (FAO, 2007; Kayang et al. 2010) and have been successfully isolated and
used for genetic studies in several valuable poultry and livestock species including
Japanese quail (Kayang et al., 2002), ducks (Abdelkrim et al., 2009), chicken
(Groenen et al., 2000; Osei-Amponsah et al., 2010), grasscutter (Adenyo et al., 2012)
and pigs (Rohrer et al., 1996). However, even though the guinea fowl also plays a
major role as an important protein source in food and income security, genetic studies
have been hampered by the absence of original microsatellite markers for the bird.
The guinea fowl is believed to have originated from the Guinea coast of Africa but is
common in the Western, Southern and Central parts of Africa, Europe and Asia. In
University of Ghana http://ugspace.ug.edu.gh
3
these areas, the commonest type of guinea fowl is the helmeted type which is the only
type that has been successfully domesticated (Ikani and Dafwang, 2004). Wild
populations of helmeted guinea fowls can still be found in certain areas but the
population of these birds continues to dwindle as a result of hunting and habitat
fragmentation (Church and Taylor, 1992). In Ghana, especially in the Guinea
savannah areas, helmeted guinea fowls can be found in many households where they
are raised for meat and eggs and therefore play an indispensable role in food security
for the people. All over the world, consumers are increasingly becoming health
conscious and tend to settle for food products that are low in calories. In this context,
the guinea fowl is becoming a substitute for other poultry meat because it is lean and
low in calories (Moreki, 2009). The tenderness and unique flavour of the meat of
young birds can substitute wild game birds including quails and partridges. Currently,
the guinea fowl is becoming popular not only because of its high nutritional qualities
and unique ornamental value but also because of its peculiar characteristics. The loud
and harsh cry, which though makes the bird irritably noisy, enables it to be used as an
“intruder alarm” or watch bird to alert owners to a vast array of issues including
strange people, animals and events (Ikani and Dafwang, 2004). Furthermore, guinea
fowls are natural insect eaters and can be used as biological control agents to eradicate
vast levels of insect infestations, especially in gardens or farms. In fact, Duffy et al.
(1992) have reported them as an effective control to reduce the deer tick (arachnid)
population, which is the vector of Lyme disease. Guinea fowls are also noted for their
resistance to most of the common poultry diseases and some toxins (Moreki, 2009)
and are therefore valuable models for disease research (Singh et al., 2010).
In light of the numerous values of the guinea fowl, there is the need to develop
genetic markers that will serve as a tool for the improvement of this valuable species.
University of Ghana http://ugspace.ug.edu.gh
4
1.1 Justification
A lot of progress has been made in the genetic analysis of several animal species
especially among birds in the Galliformes order. However, not much has been done in
the guinea fowl. Presently, genetic analysis of guinea fowl includes work done by
Sharma et al. (1998) who used Random Amplified Polymorphic DNA (RAPD)
markers to differentiate between three varieties of the species; Nahashon et al. (2008)
who cross-amplified chicken microsatellites in guinea fowl; and Kayang et al. (2010)
who studied genetic diversity of guinea fowls with autosomal microsatellite markers
developed from the Japanese quail. Most importantly, not much has been done
regarding the development of original microsatellite markers for guinea fowl.
Attempts to improvise by using markers from other birds in the same order as the
guinea fowl have not been entirely successful (Kayang et al., 2002; Nahashon et al.,
2008). Also attempts to develop these markers using the traditional method have
yielded limited success (B.B. Kayang, personal communication, June 9, 2013).
Although Kayang et al. (2010) were able to study the genetic diversity of guinea
fowls using autosomal microsatellites from the Japanese quail, it is relevant to
develop original microsatellite markers for the first time since this will help widen the
scope of study in guinea fowl. Furthermore, these markers are usually species-specific
and hence need to be developed for the first time when analysis of a new species is
started. With the advent of the next-generation sequencing technology, the time-
consuming traditional method of developing microsatellite markers is becoming less
attractive. This new technology has recently been successfully employed in the
development of microsatellite markers for grasscutter (Adenyo et al., 2012) and there
is every reason to believe that it will work well if applied to guinea fowl.
University of Ghana http://ugspace.ug.edu.gh
5
Guinea fowls are indispensable economically important species and therefore some
genetic analysis is required, to enable researchers discover the genetic capabilities of
this bird and also attribute some of their characteristics to the presence or absence of
certain genes in their genome. Also the data from this study will serve as a useful
resource base for animal breeders and conservationists interested in genetic
improvement and conservation of this valuable species.
1.2 Objective
The objective of this study was to develop and characterise original microsatellite
markers for guinea fowl using the next-generation sequencing technique.
University of Ghana http://ugspace.ug.edu.gh
6
CHAPTER TWO
2.0 LITERATURE REVIEW
2.1 Guinea Fowl
Guinea fowls are carinate birds (capable of flight), but are terrestrial and most likely
to run rather than fly when startled (Ayorinde, 2004). They are however very agile
flyers and can also hover (Adjetey, 2006). They belong to the family Phasianidae,
sub-family Numididae and order Galliformes. Other agriculturally important birds in
the order include turkeys, chickens and pheasants. Guinea fowls are native to West
Africa but are now kept in many parts of the world. Generally, the male guinea fowl
(cock) and female (hen) are not distinctly sexually dimorphic until they are about two
months of age (Moreki, 2009).
2.1.1 Types of guinea fowl
The guinea fowl comprises four genera, namely, Agelastes, Numida, Guttera and
Acryllium (Ayorinde, 2004). The Agelastes consists of the White-breasted guinea fowl
(meleagrides) and the Black guinea fowl (niger), whilst the Numida consists of the
Helmeted type (meleagris). On the other hand, the Guttera consists of the Plumed
(plumifera) and the Crested (pucherani) types, with the Vulturine type (vulturinum)
being found under the last genera Acryllium (Ayorinde, 2004).
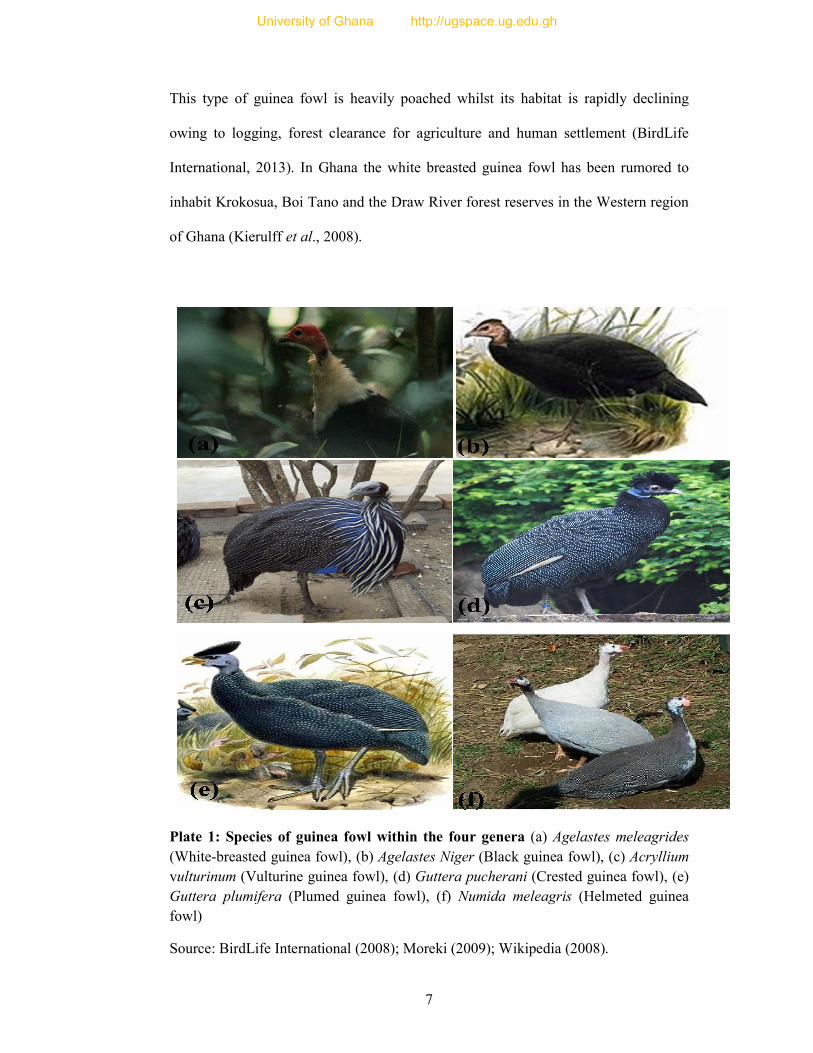
The White-breasted guinea fowl, Agelastes meleagrides (Plate 1a), is a medium-sized
terrestrial bird, up to 45 cm long with black plumage, a small featherless red head,
white breast, long black tail, greenish brown beak and greyish feet (BirdLife
International, 2013). It is distributed in the subtropical West African forests of Côte
d'Ivoire, Ghana, Guinea, Liberia and Sierra Leone (Francis et al., 1992). The White-
breasted guinea fowl however, has been identified by the International Union for
Conservation of Nature and Natural Resources (IUCN) as Vulnerable (IUCN, 2007).
University of Ghana http://ugspace.ug.edu.gh
7
This type of guinea fowl is heavily poached whilst its habitat is rapidly declining
owing to logging, forest clearance for agriculture and human settlement (BirdLife
International, 2013). In Ghana the white breasted guinea fowl has been rumored to
inhabit Krokosua, Boi Tano and the Draw River forest reserves in the Western region
of Ghana (Kierulff et al., 2008).
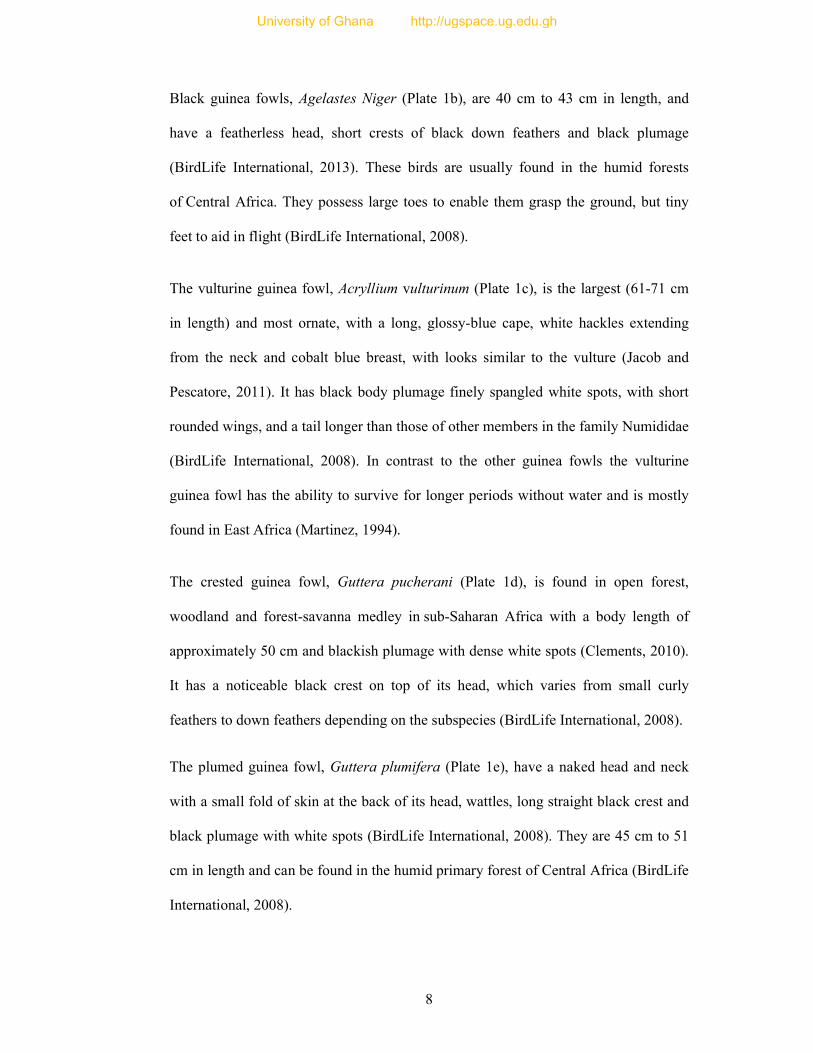
Plate 1: Species of guinea fowl within the four genera (a) Agelastes meleagrides
(White-breasted guinea fowl), (b) Agelastes Niger (Black guinea fowl), (c) Acryllium
vulturinum (Vulturine guinea fowl), (d) Guttera pucherani (Crested guinea fowl), (e)
Guttera plumifera (Plumed guinea fowl), (f) Numida meleagris (Helmeted guinea
fowl)
Source: BirdLife International (2008); Moreki (2009); Wikipedia (2008).
University of Ghana http://ugspace.ug.edu.gh
8
Black guinea fowls, Agelastes Niger (Plate 1b), are 40 cm to 43 cm in length, and
have a featherless head, short crests of black down feathers and black plumage
(BirdLife International, 2013). These birds are usually found in the humid forests
of Central Africa. They possess large toes to enable them grasp the ground, but tiny
feet to aid in flight (BirdLife International, 2008).
The vulturine guinea fowl, Acryllium vulturinum (Plate 1c), is the largest (61-71 cm
in length) and most ornate, with a long, glossy-blue cape, white hackles extending
from the neck and cobalt blue breast, with looks similar to the vulture (Jacob and
Pescatore, 2011). It has black body plumage finely spangled white spots, with short
rounded wings, and a tail longer than those of other members in the family Numididae
(BirdLife International, 2008). In contrast to the other guinea fowls the vulturine
guinea fowl has the ability to survive for longer periods without water and is mostly
found in East Africa (Martinez, 1994).
The crested guinea fowl, Guttera pucherani (Plate 1d), is found in open forest,
woodland and forest-savanna medley in sub-Saharan Africa with a body length of
approximately 50 cm and blackish plumage with dense white spots (Clements, 2010).
It has a noticeable black crest on top of its head, which varies from small curly
feathers to down feathers depending on the subspecies (BirdLife International, 2008).
The plumed guinea fowl, Guttera plumifera (Plate 1e), have a naked head and neck
with a small fold of skin at the back of its head, wattles, long straight black crest and
black plumage with white spots (BirdLife International, 2008). They are 45 cm to 51
cm in length and can be found in the humid primary forest of Central Africa (BirdLife
International, 2008).
University of Ghana http://ugspace.ug.edu.gh
9
The helmeted guinea fowl, Numida meleagris (Plate 1f), which is the focus of this
study, is naturally distributed in West Africa along with the other species except the
vulturine type (Awotwi, 1987; Ikani and Dafwang, 2004; Kayang et al., 2010). In
spite of its African origin, it is able to thrive in various climatic conditions and is
reared commercially in Europe, America and Asia (Dei and Karbo, 2004; Moreki,
2009). Helmeted guinea fowls are 53 cm to 63 cm in length and are characterized by a
bony helmet, naked grey neck and wattles on either side of the beak (Kumssa and
Bekelele, 2013). The helmeted type is the most common guinea fowl with varieties
including the white, pearl, royal purple, lavender, coral blue and dundotte (Dei and
Karbo, 2004; Moreki, 2009). There are nine subspecies of the helmeted guinea fowl.
This type of guinea fowl is the most wide spread and though it can still be found in
the wild, it has been domesticated and can even be kept as pets in certain areas. The
preferred habitat for the helmeted guinea fowl is the savannah, where they thrive best.
In Ghana, the Northern Savannah zone is the niche that accommodates the largest
population of helmeted guinea fowls. In Northern Ghana, helmeted guinea fowls have
a high cultural value and make up about 25% of the poultry population in the zone
(Kayang et al., 2010). In Nigeria, 25% of the entire poultry population is made up
helmeted guinea fowl (Ikani and Dafwang, 2004).
2.1.2 Important characteristics of helmeted guinea fowl and its production
in Ghana
Guinea fowl production is a substantial income generating venture especially if proper
management practices are observed (Teye and Gyawu, 2001). In Ghana guinea fowls
are mostly raised in the backyard system (as is the case in most developing countries)
where they may be fed by their owners, but are mainly allowed to scavange for food
during the day and return to their owner’s yard to roost at night (Teye and Gyawu,
University of Ghana http://ugspace.ug.edu.gh
10
2001; Ikani and Dafwang, 2004). Though this type of poultry keeping is not labour
intensive, it is economical in terms of feed cost. The demerits of this system are that
the birds are easily lost through thefts and predation and the eggs may also be lost
since the birds do not necessarily lay in the owner’s yard. Such losses may be colossal
and deprive the farmers of the full benefit of rearing these birds (Mallia, 1999; Teye
and Gyawu, 2001). According to Teye and Gyawu (2001) improved guinea fowls,
when kept in the intensive system, however, enables farmers to make more profit, as
they can monitor the eggs and the birds. Although the intensive system may improve
overall production in local guinea fowls, Agbolosu et al. (2012) reported that
generally, guinea fowl production is hampered by poor egg hatchability, male
infertility, high keet mortality, difficulty in sexing keets and slow growth rate.
Sexual dimorphism of guinea fowls is not very clear (Agbolosu et al., 2012), although
the cry of the cock (one syllabus cry) is distinct from that of the hen (two syllabus
cry) at nine weeks (Teye and Gyawu, 2002). Other methods of sex identification
including vent sexing, laparoscopy and polymerase chain reaction (PCR) have been
used to differentiate between the sexes. The PCR method of sexing has been reported
to be the most reliable as it deals with direct identification of the sex chromosomes or
genes (Itoh et al., 2001).
Generally guinea fowls are seasonal breeders, but have the potential to lay eggs all
through the year provided sufficient supplementary feeding and water are available
(Konlan et al., 2011). Hens can lay 12 to 15 eggs in a clutch (between 90- 120 eggs
per annum) which will take about 24 to 30 days to hatch into keets weighing 24 to 25
g each (Farrell, 2010). According to Teye et al. (2001) and Apiiga (2004), with good
feeding and management practices including health care and intensive selection, hens
University of Ghana http://ugspace.ug.edu.gh
11
can lay 150 to 220 eggs per annum with keet weight of 1.48 kg at 18 weeks (Moreki,
2009). Related studies by Agbolosu et al. (2012) also revealed a similar trend of
increasing guinea fowl performance with improved management practices.
Guinea fowl eggs are protected in hard shells and this helps to extend the shelf life by
reducing spoilage. The hard shells also facilitate transportation over long distances
and therefore reduce production losses (Moreki, 2009). Although the hens are bad
brooders, the eggs are hatched artificially using incubators or other good brooding
poultry species including chicken (Adjetey, 2006; Apiiga, 2007). Konlan et al.
(2011), in a study which involved increasing guinea fowl egg hatchability, reported a
69% rate with artificial incubation.
At six months, guinea fowls reach a slaughter weight of 1.5 kg to 2 kg but this relies
greatly on the geographical location and management system (Koney, 2004; Ikani and
Dafwang, 2004). Guinea fowl meat is a delicacy as it has a gamey taste and can be
used as a substitute for wild birds. Moreover, both the meat (134 kcal per 100 gram)
and eggs are healthier (lower cholesterol) compared to other poultry and are rich in
minerals (magnesium, calcium and iron), vitamins (E, B1 and B2) and high in
essential fatty acids (Moreki, 2009).
Guinea fowls are hardy and are tolerant to mycotoxin and aflatoxin (Moreki, 2009).
They are also resistant to most of the common poultry diseases, including coccidiosis,
Newcastle disease, fowlpox and gumboro. Furthermore, they also easily adapt to
harsh weather conditions as experienced in the tropics (Moreki, 2009; Singh et al.,
2010).
University of Ghana http://ugspace.ug.edu.gh
12
2.2 Genetic Markers
Genetic markers are DNA sequences linked to specific locations on chromosomes and
related to specific traits (Moore and Hansen, 2003). Although biochemical and
molecular markers are the two types of genetic markers, FAO (2011) insists on the
application of current advanced technologies because they are most informative. The
most advanced and current techniques are molecular genetic markers, which include
mitochondrial DNA (mtDNA) sequences (which are maternally inherited), Y-
chromosomal haplotype (which are paternal linked) and autosomal DNA which are
related more to phenotype (Lenstra et al., 2012).
2.2.1 Mitochondrial DNA and Y-chromosomal haplotype
The mtDNA are maternally inherited, circular DNA molecules located outside the
nucleus, and are capable of evolving 5 to 10 times more rapidly than nuclear
(autosomal) DNA, especially the displacement-loop (D-loop) region which is the
control region of mtDNA (Garrime, 2007) located in the non-coding region. Most
studies, however, emphasise on the highly polymorphic D-loop, but whole genome
sequences have been reported as informative (Achilli et al., 2008). mtDNA can easily
be isolated but rely on the recognition of nuclear mtDNA insertions (Hassanin et al.,
2010; Calvignac et al., 2011), especially when diverse species-specific primers are
used (Den Tex et al., 2010). The D-loop is usually used for intraspecies diversity
studies. The cytochrome b gene, on the other hand, is located within the coding region
and evolves slowly in terms of non-synonymous substitutions. It is usually applied in
interspecies genetic diversity studies (Mburu and Hanotte, 2005).
In contrast to mitochondrial DNA, Y-chromosome is paternally inherited and is a
large linear molecule located in the nucleus (Mburu and Hanotte, 2005). The Y-
University of Ghana http://ugspace.ug.edu.gh
13
chromosomal haplotypes have slow mutation rates and are powerful tools used to
trace gene flow by male introgression and thus identify paternal lineages in
populations (Petit et al., 2002).
2.2.2 Autosomal DNA
According to Baker (1980), initial genetic diversity studies relied on blood groups and
protein polymorphisms. Recently, autosomal DNA (Ellegren, 2004; Whittaker et al.,
2003) are the most used markers (Bruford et al., 2003; Schlötterer, 2004; Soller et
al., 2006). Autosomal markers include Amplified Fragment Length Polymorphism
(AFLP), Random Amplification of Polymorphic DNA (RAPD), Restriction Fragment
Length Polymorphism (RFLP), Single nucleotide polymorphism (SNP) and
microsatellite markers (FAO, 2007). Microsatellite markers or simple sequence
repeats (SSR) and SNPs are the most recent autosomal DNA markers, however
microsatellite markers have been identified as the most powerful markers (Tóth et al.,
2000; Ellegren, 2004; FAO, 2007; Tenva, 2009).
2.2.2.1 Amplified Fragment Length Polymorphism (AFLP)
According to FAO (2007), this technique involves the digestion of DNA with
restriction enzymes and the selective amplification of the digested fragments using a
PCR. The output is a significant number of informative markers which can be located
reliably in the genome allowing a quick scan of the entire genome. These markers are
biallelic (Vos et al., 1995), easily reproducible (Table 1) and are capable of estimating
relationships between breeds (Ajmone-Marsan et al., 2002; Negrini et al., 2006) and
related species (Buntjer et al., 2002). Although this technology yields a large amount
of information per run it is not possible to distinguish between heterozygotes and
homozygotes (dominant markers) and this makes the use of these markers technically
University of Ghana http://ugspace.ug.edu.gh
14
demanding and labour intensive (Vos et al., 1995; FAO, 2007). Genetic diversity
studies using AFLP have been reported in pigs (SanCristobal et al., 2006), goats
(Ajmone-Marsan et al., 2002; Negrini et al., 2006) and cattle (Buntjer et al., 2002).
2.2.2.2 Random Amplification of Polymorphic DNA (RAPD)
RAPD markers, first described by Williams et al. (1990), are detected using random
PCR primers. They are the most popular molecular tools capable of recognizing
polymorphisms in large portions of the genome based on minute quantities of DNA.
RAPD analysis is quick and simple, because a single RAPD primer can anneal to
various locations in a genome (multiple loci). Although results are sensitive to
laboratory conditions, this technique is fast and cost effective compared to RFLPs
(Table 1). Although RAPD are dominant markers (Table 1), they however have the
tendency to underestimate genetic variability and are not easily reproducible (Plotsky
et al., 1995). Sharma et al. (1998) estimated the intra and inter varietal genetic
variation in three varieties of guinea fowl (Lavender, Pearl and White) with RAPD
markers. The results showed a very low level of intra and inter varietal genetic
variation in the three guinea fowl varieties, implying low genetic variation between
the populations. The genetic homogeneity found in the study was attributed to the fact
that the guinea fowl populations were diluted, closed, reproduced from small number
of sires and subjected to similar type of selection programmes. The ability of RAPD
markers to underestimate genetic variability as reported by Plotsky et al. (1995) was
also indicated as a reason for the low genetic diversity realized in the above study.
University of Ghana http://ugspace.ug.edu.gh
15
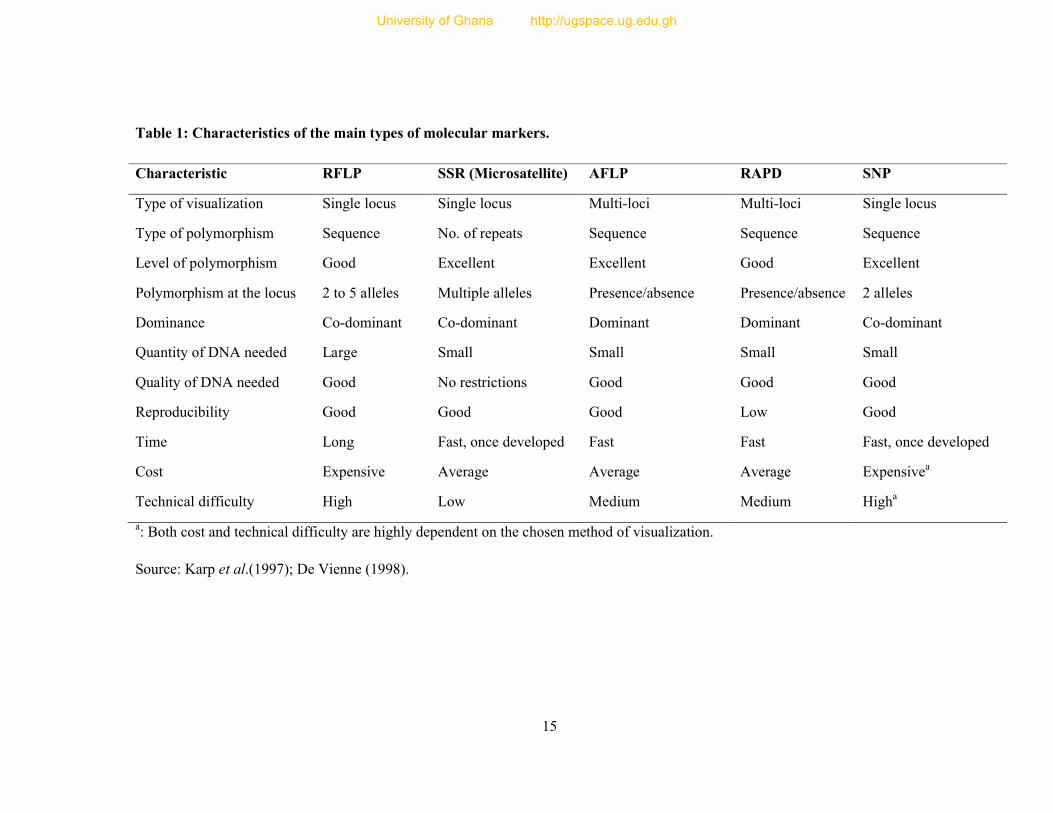
Table 1: Characteristics of the main types of molecular markers.
a: Both cost and technical difficulty are highly dependent on the chosen method of visualization.
Source: Karp et al.(1997); De Vienne (1998).
Characteristic RFLP SSR (Microsatellite) AFLP RAPD SNP
Type of visualization Single locus Single locus Multi-loci Multi-loci Single locus
Type of polymorphism Sequence No. of repeats Sequence Sequence Sequence
Level of polymorphism Good Excellent Excellent Good Excellent
Polymorphism at the locus 2 to 5 alleles Multiple alleles Presence/absence Presence/absence 2 alleles
Dominance Co-dominant Co-dominant Dominant Dominant Co-dominant
Quantity of DNA needed Large Small Small Small Small
Quality of DNA needed Good No restrictions Good Good Good
Reproducibility Good Good Good Low Good
Time Long Fast, once developed Fast Fast Fast, once developed
Cost Expensive Average Average Average Expensivea
Technical difficulty High Low Medium Medium Higha
University of Ghana http://ugspace.ug.edu.gh
16
2.2.2.3 Restriction Fragment Length Polymorphism (RFLP)
RFLPs were discovered in 1980 (Botstein et al., 1980; Schimenti, 1998). Similar to
AFLP markers, RFLP markers also rely on the use of restriction enzymes and occur
as variations in the length of DNA fragments, after restriction enzyme digestion at
precise restriction sites (FAO, 2007). The difference between RFLP and AFLP
markers is that the PCR is done prior to restriction enzyme digestion in RFLPs (FAO,
2007). The advantages of this technique include its ability to discriminate between
homozygotes and heterozygotes (co-dominant markers) (Table 1). They are also
stable markers and therefore produce reproducible results (Table 1). However,
although RLFPS are good markers, the methodology is long, labourious and demands
the use of DNA of both high quality and quantity. They are also non-informative and
therefore are unable to identify whole genome variation especially when inbreeding is
high (Tenva, 2009).
2.2.2.4 Single Nucleotide Polymorphism (SNP)
SNPs are single base or nucleotide (A, T, G or C) variations or alterations that occur
in DNA sequence (Vignal et al., 2002) and do not directly affect the phenotype of
organisms (FAO, 2007). They are abundant in genomes (mostly in non-coding
regions) and this makes them easy to find. Sachinandam et al. (2001) reported one
SNP per 1,000 bp in the human genome. Stoneking (2001) and Vignal et al. (2002)
have also reported that in most genomes SNPs occur as one SNP per 1,000 bp in both
coding and non-coding regions. Although SNPs are biallelic and stable with low
mutation rates, they are highly non-informative (Table 1), compared to microsatellites
(Tenva, 2009). Studies involving SNPs are costly and require high numbers of the
markers to provide little information (FAO, 2007).
University of Ghana http://ugspace.ug.edu.gh
17
2.3 Microsatellite Markers
Microsatellite markers are defined as a class of highly informative, repetitive DNA
sequences, based on nucleotide repeats (Griffiths et al., 2000; Gurdebecke and
Maelfait, 2002). According to Mburu and Hanotte (2005) microsatellites markers are
also referred to as short tandem repeats (STR), simple sequence tandem repeats
(SSTR), variable number tandem repeats (VNTR), simple sequence length
polymorphisms (SSLP), simple sequence repeats (SSR) and sequence tagged
microsatellites (STM). Two types of microsatellites have been described: the rare
Type I markers which characterise genes of specific functions and are informative in
gene mapping for evolutionary genome studies (Vignal et al., 2002) and Type II
markers which are of no known function but are more polymorphic than Type I
markers (Odeny, 2006).
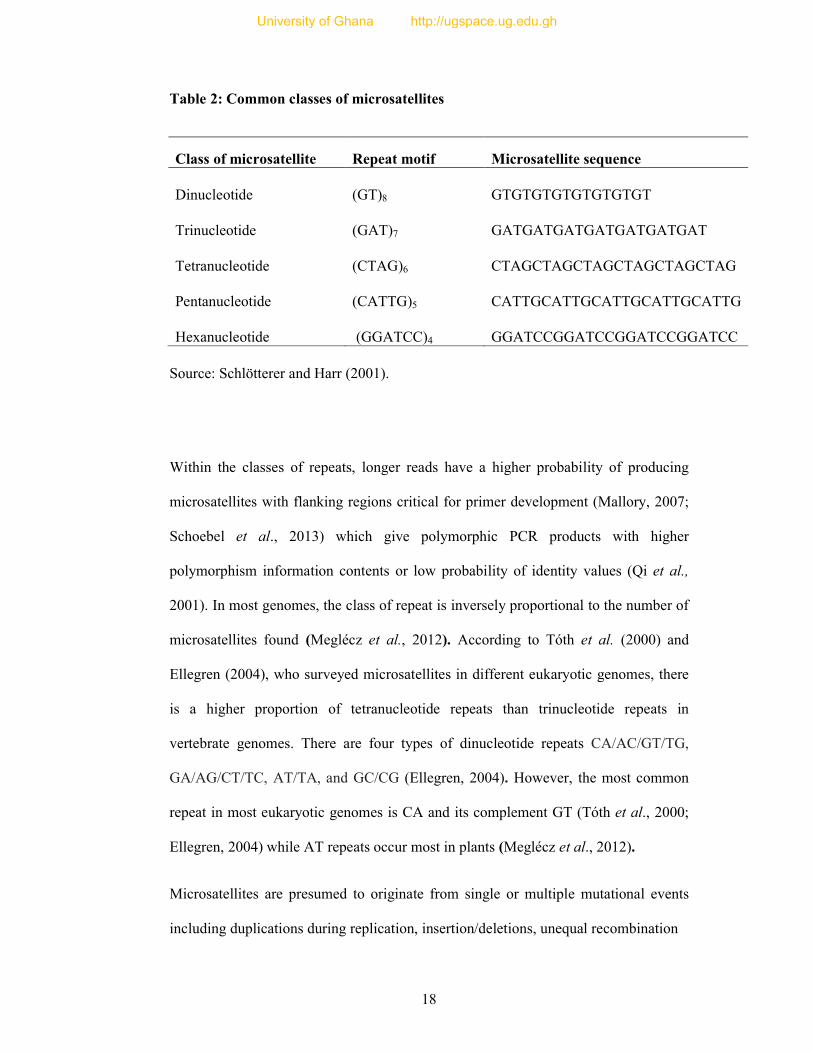
Microsatellites can range from between two to six base pairs in length (Wang et al.,
2010). The most popular class of microsatellites (Table 2) are dinucleotides (Ellegren,
2004; Adenyo et al., 2012), followed by tri-, tetra-, penta and hexanucleotide repeats
(Schlötterer and Harr, 2001). Dinucleotide microsatellites have been reported as the
most polymorphic and are known to be characterised by higher repeat numbers
(Ellegren, 2004; Li et al., 2004) with low repeat numbers being observed in
trinucleotide repeats (Tóth et al., 2000; Thiel et al., 2003). According to Tong et al.
(2009), dinucleotides occur more frequently in vertebrates whilst in plants the
commonest class of repeats are trinucleotides.
University of Ghana http://ugspace.ug.edu.gh
18
Table 2: Common classes of microsatellites
Class of microsatellite Repeat motif Microsatellite sequence
Dinucleotide (GT)8 GTGTGTGTGTGTGTGT
Trinucleotide (GAT)7 GATGATGATGATGATGATGAT
Tetranucleotide (CTAG)6 CTAGCTAGCTAGCTAGCTAGCTAG
Pentanucleotide (CATTG)5 CATTGCATTGCATTGCATTGCATTG
Hexanucleotide (GGATCC)4 GGATCCGGATCCGGATCCGGATCC
Source: Schlötterer and Harr (2001).
Within the classes of repeats, longer reads have a higher probability of producing
microsatellites with flanking regions critical for primer development (Mallory, 2007;
Schoebel et al., 2013) which give polymorphic PCR products with higher
polymorphism information contents or low probability of identity values (Qi et al.,
2001). In most genomes, the class of repeat is inversely proportional to the number of
microsatellites found (Meglécz et al., 2012). According to Tóth et al. (2000) and
Ellegren (2004), who surveyed microsatellites in different eukaryotic genomes, there
is a higher proportion of tetranucleotide repeats than trinucleotide repeats in
vertebrate genomes. There are four types of dinucleotide repeats CA/AC/GT/TG,
GA/AG/CT/TC, AT/TA, and GC/CG (Ellegren, 2004). However, the most common
repeat in most eukaryotic genomes is CA and its complement GT (Tóth et al., 2000;
Ellegren, 2004) while AT repeats occur most in plants (Meglécz et al., 2012).
Microsatellites are presumed to originate from single or multiple mutational events
including duplications during replication, insertion/deletions, unequal recombination
University of Ghana http://ugspace.ug.edu.gh
19
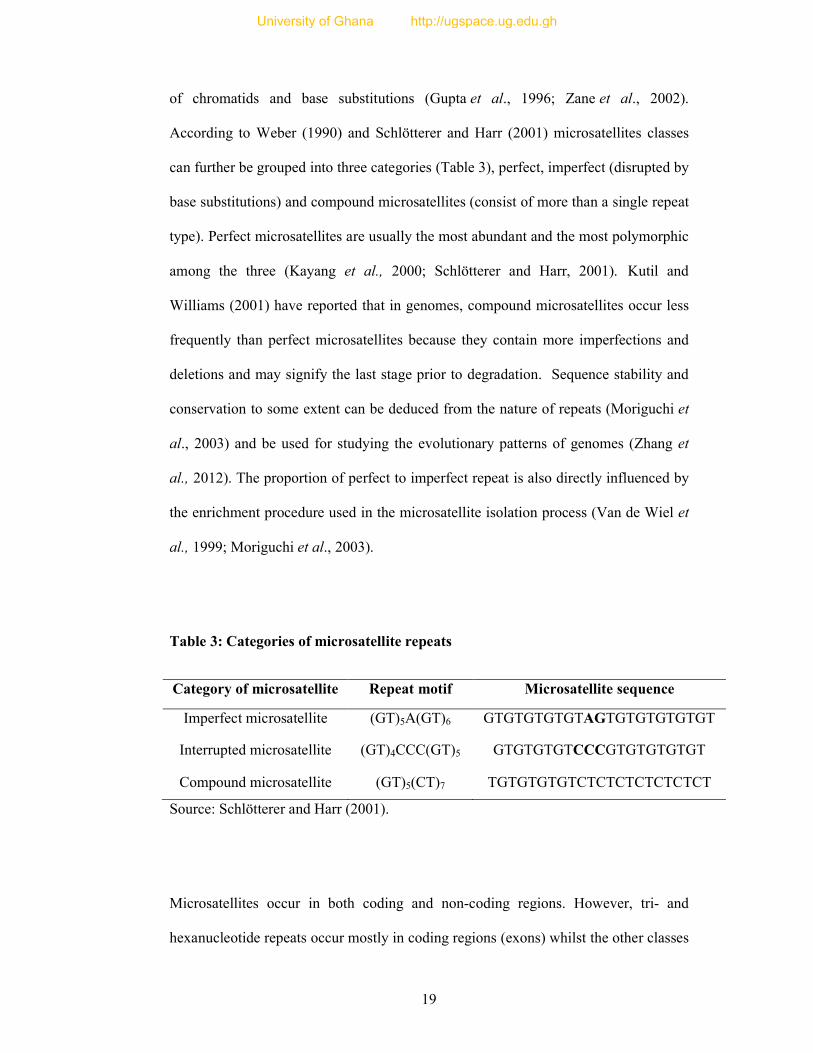
of chromatids and base substitutions (Gupta et al., 1996; Zane et al., 2002).
According to Weber (1990) and Schlötterer and Harr (2001) microsatellites classes
can further be grouped into three categories (Table 3), perfect, imperfect (disrupted by
base substitutions) and compound microsatellites (consist of more than a single repeat
type). Perfect microsatellites are usually the most abundant and the most polymorphic
among the three (Kayang et al., 2000; Schlötterer and Harr, 2001). Kutil and
Williams (2001) have reported that in genomes, compound microsatellites occur less
frequently than perfect microsatellites because they contain more imperfections and
deletions and may signify the last stage prior to degradation. Sequence stability and
conservation to some extent can be deduced from the nature of repeats (Moriguchi et
al., 2003) and be used for studying the evolutionary patterns of genomes (Zhang et
al., 2012). The proportion of perfect to imperfect repeat is also directly influenced by
the enrichment procedure used in the microsatellite isolation process (Van de Wiel et
al., 1999; Moriguchi et al., 2003).
Table 3: Categories of microsatellite repeats
Category of microsatellite Repeat motif Microsatellite sequence
Imperfect microsatellite (GT)5A(GT)6 GTGTGTGTGTAGTGTGTGTGTGT
Interrupted microsatellite (GT)4CCC(GT)5 GTGTGTGTCCCGTGTGTGTGT
Compound microsatellite (GT)5(CT)7 TGTGTGTGTCTCTCTCTCTCTCT
Source: Schlötterer and Harr (2001).
Microsatellites occur in both coding and non-coding regions. However, tri- and
hexanucleotide repeats occur mostly in coding regions (exons) whilst the other classes
University of Ghana http://ugspace.ug.edu.gh
20
of repeats occur in intergenic regions and introns (Tóth et al., 2000). Microsatellites
also belong to a class of genomic sequences called variable number of tandem repeat
(VNTR) elements (Buschiazzo and Gemmel, 2006), which are highly mutable, thus
their polymorphic nature evident in both prokaryotic and eukaryotic organisms (Katti
et al., 2001).
Research has shown that it is easier to identify and develop microsatellite markers if
the frequency of occurrence is high in an organism (Zane et al., 2002; Selkoe and
Toonen, 2006). Even though these sequences are common in eukaryotic and
prokaryotic genomes (Chambers and MacAvoy, 2000), they occur at low frequencies
in some species including corals, some insects, bats and birds (Neff and Gross, 2001;
Baums et al., 2005; Primmer et al., 1997). In a study by Abdelkrim et al. (2009) to
describe the use of genomic sequencing for the development of microsatellite markers
in Blue ducks, only 231 of a total of 17,215 microsatellite sequences, were di-, tri-
and tetranucleotide repeats. Santana et al. (2009) also reported that there were no
pentanucleotide repeats in a study involving microsatellite development for Sirex
noctilio (a pine-damaging wasp), and attributed this finding to the low abundance of
the markers in insects. In animals, there is a positive correlation between genome size
and microsatellite abundance (Hancock, 1996; Katti et al., 2001) while in plants, there
is a negative correlation (Morgante et al., 2002). Unlike human genomes, there are
limiting numbers of Poly-A tails in avian genomes due to the low abundance of
interspersed elements which aid in the transition of Poly-A tails into various repeats
(Primmer et al., 1997).
2.3.1 Merits of microsatellite markers
Microsatellites offer a variety of advantages in contrast to other molecular markers
(Table 1). Among all the marker types, microsatellites are the best markers for genetic
University of Ghana http://ugspace.ug.edu.gh
21
studies because they have higher heterozygosity or exhibit higher polymorphism
(Edwards et al., 1996; Liu and Cordes, 2004). Although SNPs, a new class of good
markers, have been developed, microsatellites remain the markers of choice for
various reasons (FAO, 2007). SNPs have rather low heterozygosity and therefore
more of these markers need to be typed to yield better results (FAO, 2007).
Microsatellite markers, on the other hand, are highly reproducible, can be amplified
easily by the polymerase chain reaction (PCR) using two unique sequences which are
complementary to the flanking regions as primers and require very little amount of
DNA as starting material (Liu and Cordes, 2004; Selkoe and Toonen, 2006). Due to
the species-specificity of microsatellites, issues with cross-contamination by non-
target DNA are reduced in contrast to techniques that employ universal primers (Liu
and Cordes, 2004). Microsatellite markers are also co-dominant, therefore the
heterozygote can easily be differentiated from the homozygote (Zane et al., 2002;
FAO, 2007). Finally, microsatellites have a high tendency to mutate (15 or more
alleles in any given population) increasing the ease of establishing allelic identity-by-
descent and linkage (FAO, 2007).
2.3.2 Limitations of Microsatellite Markers
Microsatellites, though versatile molecular markers, particularly for population
analysis, are not without limitations. Although it is possible to cross amplify
microsatellites in closely related species, the percentage of loci that successfully
amplify may decrease with increasing genetic distance (Jarne and Lagoda, 1996).
Null alleles may occur as a result of point mutations (Jarne and Lagoda, 1996; Dakin
and Avise, 2004). Sequence variation in flanking regions can result in poor primer
annealing, especially at the 3’ region, which is the starting point of sequence
University of Ghana http://ugspace.ug.edu.gh
22
extension (Jarne and Lagoda, 1996; Dakin and Avise, 2004). Due to the competitive
nature of PCR there may be bias amplification of certain allele sizes therefore
increasing the possibility of heterozygous individuals being scored for homozygotes
(partial null) (Dakin and Avise, 2004). Null alleles which are technical problems
complicate the elucidation of microsatellite allele frequencies and thus make
assessment of relatedness faulty (Dakin and Avise, 2004; Oddou-Muratorio et al.,
2008). Although null alleles change allele frequencies, random sampling (which is a
natural phenomenon) during mating may also alter allele frequencies so that an
excessive frequency of homozygotes results in a departure from Hardy-Weinberg
equilibrium expectations (Dakin and Avise, 2004). It is therefore important to
distinguish between them if excess homozygotes are observed.
Identification and development of microsatellite markers is quite challenging,
especially in organisms where little or no sequence data is available. In genomes with
low abundance of microsatellites such as birds, the degree of difficulty is elevated
(Primmer et al., 1997). Generally, the process could be expensive, time-consuming
and labour-intensive, requiring construction of a genomic library enriched for
repeated motifs, isolation and sequencing of candidate clones, primer design, PCR
amplification, and testing for polymorphisms in unrelated individuals (Queller et al.,
1993; Jarne and Lagoda, 1996; Santana et al., 2009).
2.3.3 Development of Microsatellite Markers
Among a number of available methods to identify microsatellites (Dutech et al.,
2007), the most commonly used methods are based on targeted enrichment of DNA
for microsatellites (Zane et al., 2002; Selkoe and Toonen, 2006), for example inter
simple sequence repeat PCR (ISSR-PCR) (Zietkiewicz et al., 1994). The genome
University of Ghana http://ugspace.ug.edu.gh
23
region between microsatellite loci is the ISSR. This has been improved by the
advancement of technology including the Next-Generation Sequencing technique
(Zane et al., 2002; Glenn and Schable, 2005).
2.3.3.1. Microsatellite isolation using traditional method
The traditional method of marker isolation (Figure 1) entails cloning of small genomic
DNA fragments from existing partial genomic libraries of the target species (Queller
et al., 1993; Jarne and Lagoda, 1996). In the absence of an existing library, one must
be constructed by extracting DNA from the species of interest. Enriched libraries have
been proposed to increase success rates of isolation (Karagyozov et al., 1993; Billotte
et al., 1999; Edwards et al., 1996). Prior to cloning, the library is fragmented and then
adaptors (double-stranded DNA segments, usually ≈10 – 12 bp long, that contain the
recognition site for a particular restriction enzyme) are attached to both ends of the
fragments. The fragments are cloned into vectors. Common vectors used in cloning
include plasmids, cosmid, lamda phage, bacterial artificial chromosomes (BAC) and
yeast artificial chromosomes (YAC) (Primrose and Twyman, 2006). The vectors are
then transformed into industrially produced competent bacterial cells and cultured on
media.
University of Ghana http://ugspace.ug.edu.gh

24
Figure 1: Schematic representation of traditional marker development
Source: Zane et al. (2002).
University of Ghana http://ugspace.ug.edu.gh
25
Clones containing fragments are screened through colony hybridisation with probes
(Powell et al., 1996; Chen et al., 1997) possibly bound to a nylon membrane (Stajner
et al., 2005) or biotinylated and bound to streptavidin-coated beads (Yaish and de la
Vega, 2003). Plasmids are then extracted and elctrophoresed by Sanger sequencing to
confirm microsatellite containing clones (Temnykh et al., 2001), followed by primer
design and optimisation.
This procedure is more efficient for species with abundant SSRs in contrast to
genomes with low frequency of SSR such as birds (Primmer et al., 1997; B.B.
Kayang, personal communication, June 19, 2013). Generally, the efficiency of this
method of marker development is low. Kayang et al. (2000) for instance, used this
method in Japanese quail, and found only 29.2% (372 of 1273 clones) recording a
positive signal for microsatellite after hybridization. The isolation process could also
be time-consuming (several months), technically demanding and considerably more
costly (Croooijimas et al., 1997; Santana et al., 2009; Andrés and Bogdanowicz,
2011; Blair et al., 2012).
2.3.3.2 Microsatellite isolation using 454 next-generation sequencing
(NGS) technique
The 454 next-generation sequencing technique combines three main molecular
techniques (PCR, Shotgun and Pyrosequencing Sequencing) to convert DNA from the
genome into sequence data (Margulies et al., 2005). The 454 sequencing method
involves three main steps, namely, DNA Rapid Library Preparation, Emulsion PCR
(emPCR) and Sequencing (Margulies et al., 2005). During the DNA library
preparation, pure genomic DNA is fragmented through a partial shearing process,
adapters ligated and the double strands separated into single strands.
University of Ghana http://ugspace.ug.edu.gh
26
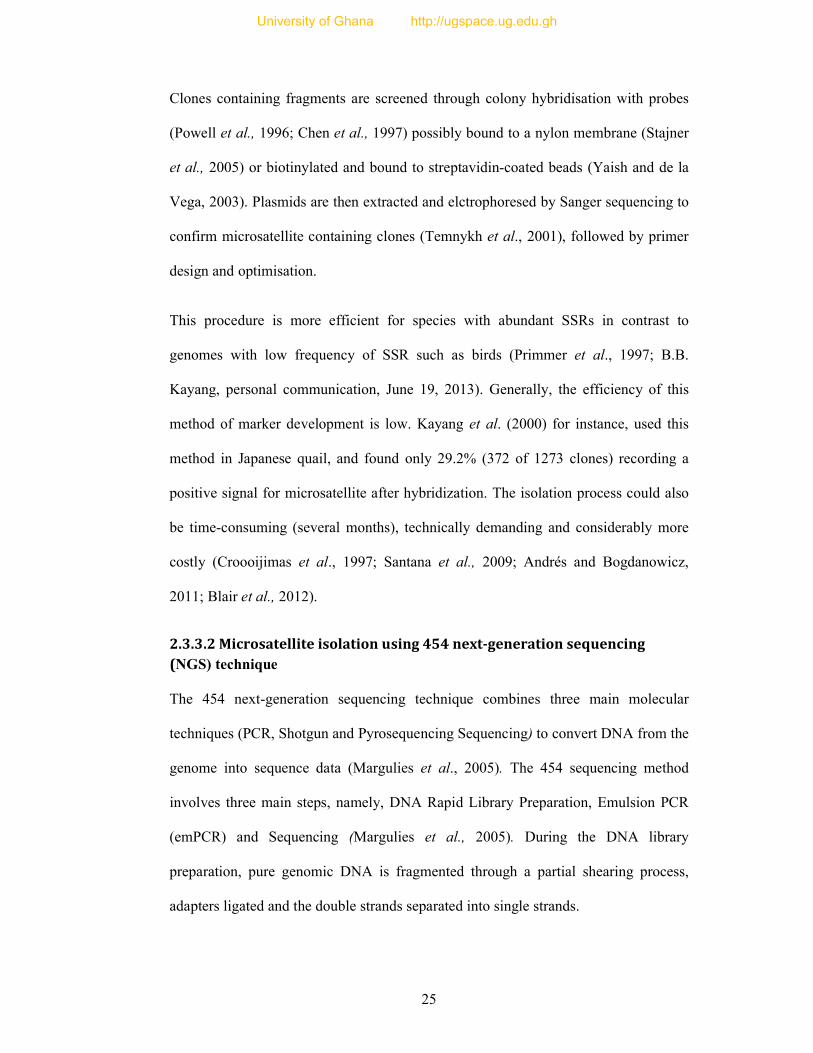
In an emPCR (Figure 2), the fragments are then cloned, mixed with DNA micro
capture beads and loaded into cylindrical wells which contain synthetic oil and
enzyme reagents in a water mixture (Margulies et al., 2005). The water mixture forms
droplets around the beads, (emulsion) with each droplet containing only one DNA
fragment. Enzymes cause the single and isolated DNA fragment in the droplets to be
amplified into millions of identical copies (≈ 10 million) of the fragments per bead
(Margulies et al., 2005).
Figure 2: Schematic diagram of emulsion PCR process
Source: Margulies et al. (2005)
University of Ghana http://ugspace.ug.edu.gh
27
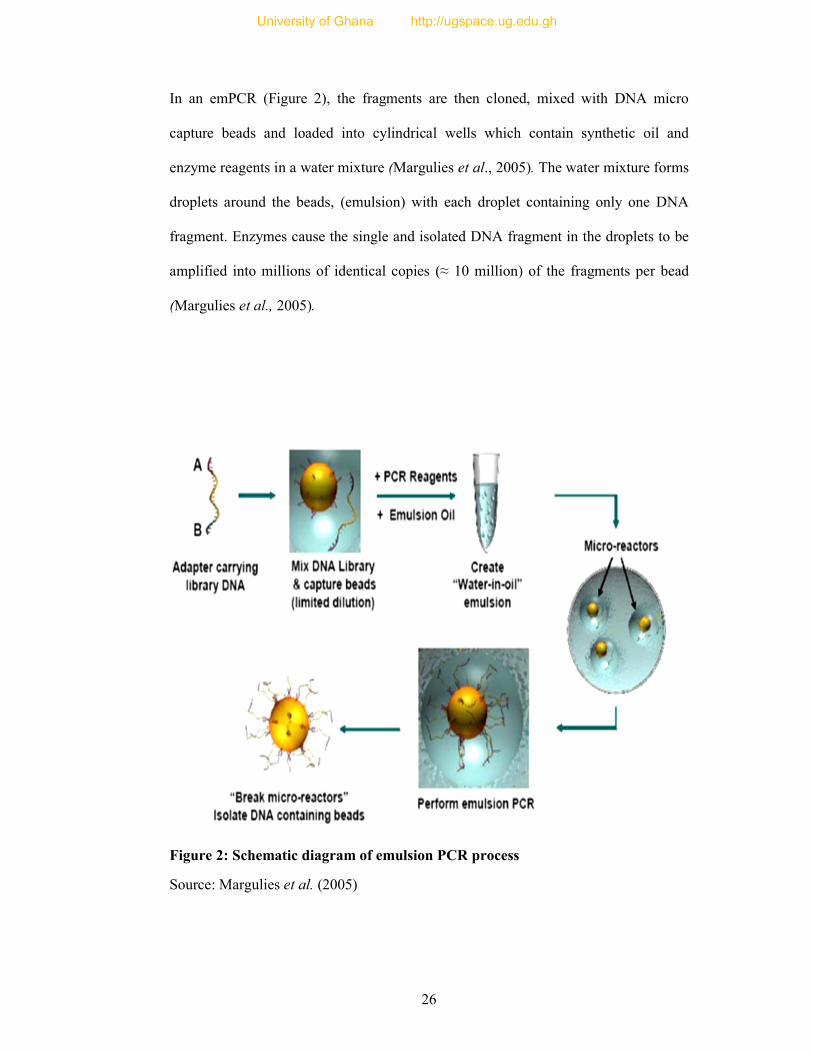
The DNA-capture beads are loaded onto a picoTiterplate with a pipette (Figure 3),
and placed into the genome sequencing system instrument (Figure 4). The instrument
washes the plate sequentially with various reagents, including the four nucleotides; A,
T, G and C (Margulies et al., 2005). Upon incorporation of the nucleotides, the bead-
bound enzymes contained in each plate well converts the chemicals generated into
light (which has an intensity directly proportional to the consecutive number of
complementary nucleotides on the single stranded DNA fragment) in a chemi-
luminescent signal which is detected by an in-built CCD camera (Margulies et al.,
2005). The signals are then analysed on the 454 sequencing system software to
generate billions of sequenced bases per hour from a single run and then primers are
designed with bioinformatics and subsequently optimized (Lim et al., 2004; Glenn
and Schable, 2005).
Figure 3: Schematic diagram of bead deposition into PicoTiter Plate
Source: Margulies et al. (2005).
University of Ghana http://ugspace.ug.edu.gh
28
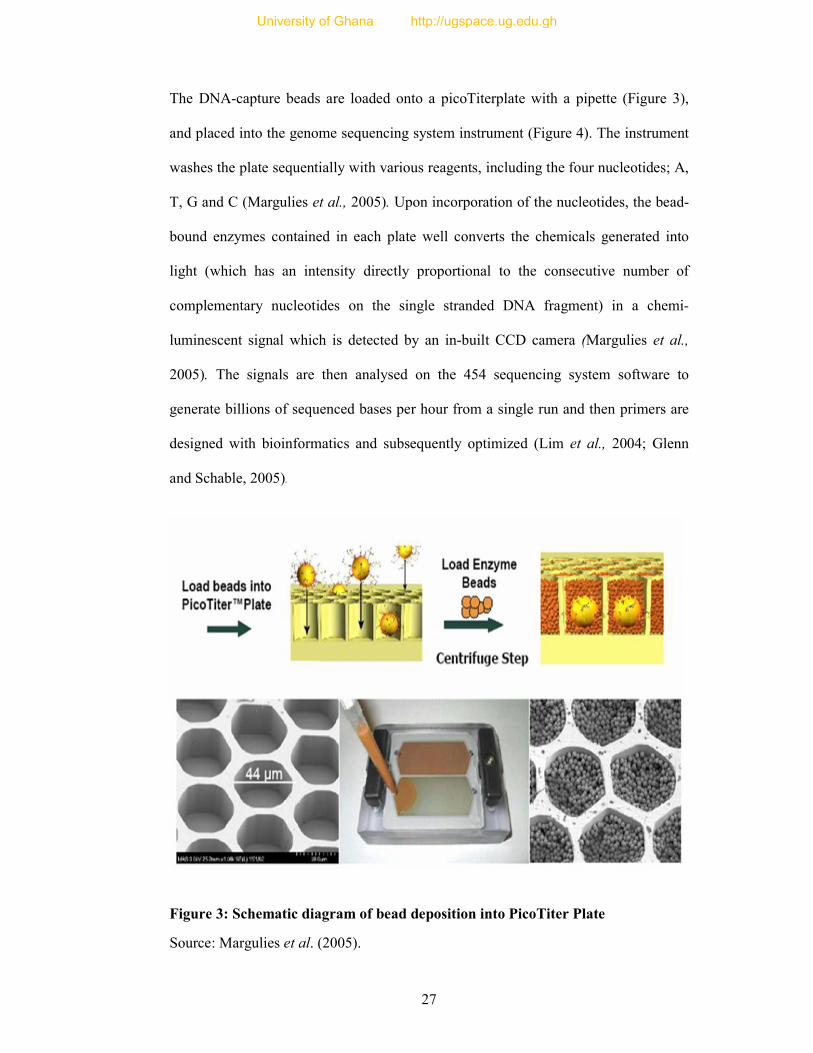
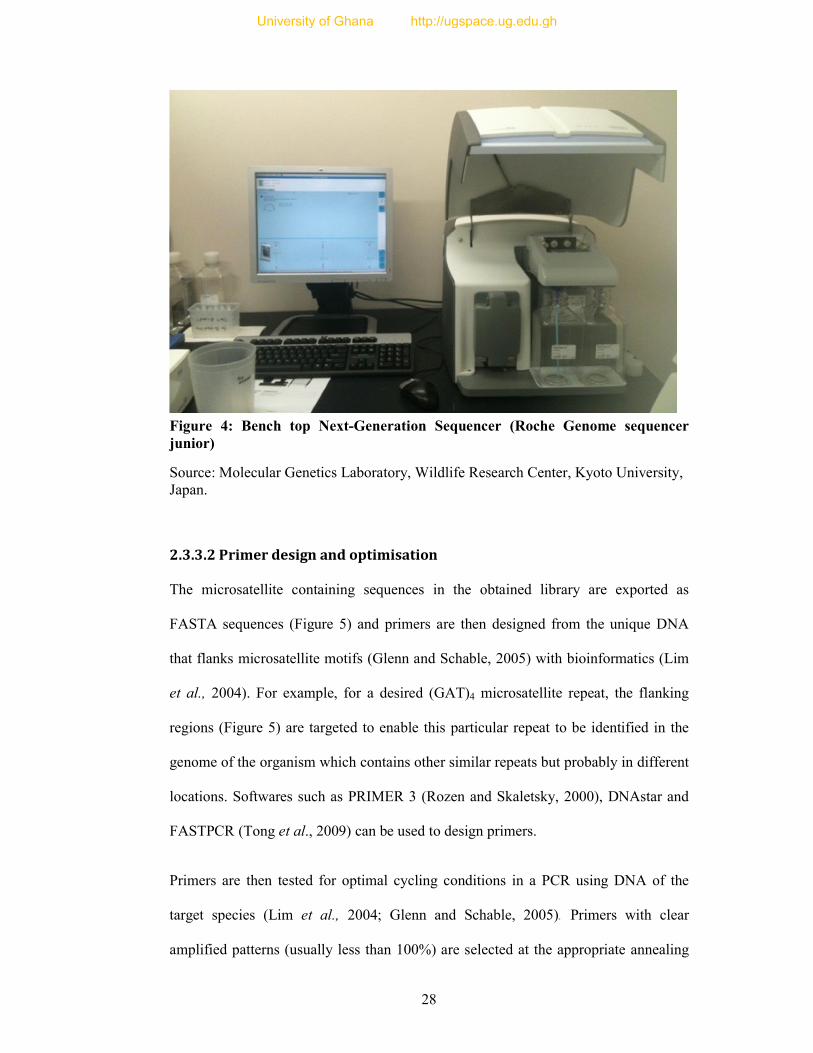
Figure 4: Bench top Next-Generation Sequencer (Roche Genome sequencer junior)
Source: Molecular Genetics Laboratory, Wildlife Research Center, Kyoto University, Japan.
2.3.3.2 Primer design and optimisation
The microsatellite containing sequences in the obtained library are exported as
FASTA sequences (Figure 5) and primers are then designed from the unique DNA
that flanks microsatellite motifs (Glenn and Schable, 2005) with bioinformatics (Lim
et al., 2004). For example, for a desired (GAT)4 microsatellite repeat, the flanking
regions (Figure 5) are targeted to enable this particular repeat to be identified in the
genome of the organism which contains other similar repeats but probably in different
locations. Softwares such as PRIMER 3 (Rozen and Skaletsky, 2000), DNAstar and
FASTPCR (Tong et al., 2009) can be used to design primers.
Primers are then tested for optimal cycling conditions in a PCR using DNA of the
target species (Lim et al., 2004; Glenn and Schable, 2005). Primers with clear
amplified patterns (usually less than 100%) are selected at the appropriate annealing
University of Ghana http://ugspace.ug.edu.gh

29
temperatures and used for subsequent analysis. For instance, in a study by Schoebel et
al. (2013), to develop microsatellite markers for the El Oro parakeet (an endangered
parrot species) and Blackcap (a songbird), 86% of 22 primers and 78% of 51 primers
respectively amplified successfully in a primer test. According to Mitsuhashi (1996),
the G-C content of primer sequence increases stability of the primers, therefore higher
melting temperatures will be required for primers in contrast to those with a higher
AT content and vice versa (www.premierbiosoft.com, accessed February 31, 2013).
Studies by Callen et al. (1993) and Smulders et al. (1997) have also shown that the
occurrence of null alleles could result in the failure of primers to amplify during
optimization.
Figure 5: Primer design with bioinformatics
2.3.4 Application of 454 sequencing in microsatellite marker
development
Microsatellite marker isolation with 454 sequencing is automated and this reduces the
chances of sample contamination and avoids the time consuming cloning step
Forward Primer =TGTATTTTAGTGCAGGTTCTGA
Reverse Primer = CTCAGTTCTATTCTGGTTGGA
University of Ghana http://ugspace.ug.edu.gh
30
involved in microsatellite isolation (Allentoft et al., 2008; Abdelkrim et al., 2009;
Santana et al., 2009).
Adenyo et al. (2012) developed 33 novel microsatellite markers, with number of
alleles ranging from 3 to 11 (mean = 6.4), for grasscutter, using the next-generation
sequencing technology. From the library screening, 156,966 reads were obtained
containing 95,805 microsatellite sites. Subsequently, the primers developed recorded
very low cumulative probability of identity (PI) for all loci (3.1 x 10⁻³³) which
indicates that they were highly informative. An and Lee (2012), also confirmed the
efficiency of 454 sequencing by using this technology to develop microsatellite
markers for Mytilus coruscus (a Korean mussel) and obtained a total of 176,327
unique sequences (mean length = 381 bp) containing 2,569 (1.45%) microsatellite
sites.
Due to the massive amounts of sequence data generated in a single run, the technique
can be applied to genomes where microsatellite frequencies are low (Abdelkrim et al.,
2009). The isolation procedure can be done in less than a week, since almost every
step is automated (C. Adenyo, personal communication, September 10, 2012).
Abdelkrim et al. (2009), also reported a total of 17,215 containing 231 (1.3%)
microsatellite sequences for Blue ducks with 454 sequencing and confirmed the
efficiency of the method. Carvalho et al. (2011) also reported a total of 145,071 reads
through the NGS, for the threatened Yarra pygmy perch (Nannoperca obscura),
containing 9,476 microsatellite sites, from which 858 primers were designed.
2.3.5 Measures of microsatellite variation
Good indicators of genetic variation within populations include the mean number of
alleles (average number of alleles observed) and the expected heterozygosities
University of Ghana http://ugspace.ug.edu.gh
31
(proportion of heterozygotes observed) detected in each population (FAO, 2007).
According to Powell et al. (1996) higher values of expected heterozygosity (also
known as diversity index) implies more allelic variation and is affected by the number
of alleles per locus.
The Hardy-Weinberg equilibrium (HWE) law states that in a large random mating
population, in the absence of migration, selection and mutation, gene and genotype
frequencies remain the same from generation to generation (Falconer and McKay,
1996). Conformity to HWE is the most commonly reported test in which observed and
expected genotype frequencies for an ideal population are compared (Selkoe and
Toonen, 2006). An excess of heterozygote (homozygote deficit) is recorded when
fewer homozygotes occur than expected under HWE, whilst a heterozygote deficit is
recorded when the opposite of this phenomenon is recorded. Biological factors
including selection against a particular allele or inbreeding (F statistic) can cause
significant heterozygote deficits (the most common direction of HWE) relative to
HWE (Selkoe and Toonen, 2006). On the other hand, when two genetically different
populations are consolidated into a sampling unit, a homozygote excess will be
observed under HWE (Wahlund effect) (Chakraborty et al., 1992; Nielsen et al., 2003;
Latip et al., 2010). In both cases, all loci, instead of just one or a few should be
affected by the deficit. Although null alleles are also the common causes of deviations
from HWE (Jarne and Lagoda, 1996; Dakin and Avise, 2004), only one few loci are
implicated by the deficit. Although software such as FreeNA (Chapuis and Estoup,
2007) and MICROCHECKER (Van Oosterhout et al., 2004) can be used to identify
null alleles, a more technical way to detect null alleles is to examine inheritance
patterns in a pedigree (Paetkau and Strobeck, 1995). According to a model study by
Chapuis and Estoup (2007) disregarding the existence of null alleles will only
University of Ghana http://ugspace.ug.edu.gh
32
considerably bias estimates of population differentiation if the frequency is between
5–8% across loci (Oddou-Muratorio et al., 2008). Dakin and Avise (2004) in another
model study reported a similar tolerable range of 5–8% and found a less than 5% risk
of falsely excluding an actual parent of a heterozygous offspring in parentage/
paternity analyses when such alleles are used. Therefore, failure to meet HWE
expectations is not a basis to reject a locus (Selkoe and Toonen, 2006).
The polymorphism information content (PIC) is a measure of genetic diversity that
refers to the ability of a marker to detect polymorphism within a population. PIC
depends on the number of observed alleles and their frequencies. Botstein et al.
(1980) classified PIC values into three groups: slightly informative (PIC < 0.25),
reasonably informative (0.50 > PIC > 0.25) and highly informative (PIC >0.5).
Preferably, microsatellite markers with PIC values higher than 0.70 are very
constructive in genetic linkage studies (Barker et al., 2001).
2.3.6 Microsatellite marker development in some birds
Microsatellites have been reported for several livestock species and poultry. In
turkeys, Reed et al. (2002) characterized 12 microsatellite loci and reported 7
polymorphic (out of 12 loci) with number of alleles ranging from 1 to 6 (average of
2.7) per locus.
In a similar study, Kayang et al. (2002), genotyped 20 unrelated quails with 100
Japanese quail microsatellite markers and found 98 to be polymorphic with 1 to 6
alleles per locus (average of 3.7 alleles). The allele sizes were between 87 bp and 298
bp (mean range 12.6) with the effective number of alleles ranging from 1.0 to 4.3
(mean 2.45). The observed and expected heterozygosities ranged from 0.00 to 0.95
(mean 0.423) and 0.00 to 0.77 (mean 0.527), respectively, with PIC values varying
University of Ghana http://ugspace.ug.edu.gh
33
between 0.000 and 0.729 (mean 0.4769). In conclusion, 59.2% (58/98) of the
polymorphic markers were highly informative (PIC > 0.50), 28.6% (28/98) were
reasonably informative (0.50 > PIC > 0.25), and 12.2% (12/98) were slightly
informative (PIC < 0.25).
Tang et al. (2003) characterized 70 of 94 microsatellites and used them to detect
polymorphisms in 17 unrelated ostrich individuals. Sixty-one of the markers were
polymorphic in the individuals tested.
A total of 35 primers were developed and used to detect polymorphisms in 31
unrelated Peking ducks (Huang et al., 2005). Twenty-eight loci were polymorphic
covering 117 alleles ranging from 2 to 14 (average of 4.18) per locus. The frequencies
of the 117 alleles ranged from 0.02 to 0.98. The observed heterozygosity ranged from
0.97 to 0.04 with a mean polymorphism information content (PIC) value of 0.42
(range of 0.04 to 0.88).
Kopps et al. (2013) designed 48 primers and screened for polymorphism in 15 Noisy
Miners. Fifteen polymorphic loci were reported in this study, with alleles ranging
between 3 to10 (average = 5.1). The study revealed that none of the 15 loci
conformed to Hardy-Weinberg expectations after sequential Bonferoni correction
(Rice, 1989).
University of Ghana http://ugspace.ug.edu.gh
34
CHAPTER THREE
3.0 MATERIALS AND METHODS
3.1 Sampling
A heparinised syringe was used to draw approximately 2 ml of blood from the wing
vein of one female guinea fowl [the heterogametic sex (ZW)] for microsatellite
marker development. Feather samples collected from 36 unrelated guinea fowls (18
males and 18 females) from the Northern and Upper West Regions of Ghana, Benin
and the Livestock and Poultry Research Centre (LIPREC) of the University of Ghana
(Appendix I) (Kayang et al., 2010) were used to test for marker polymorphism.
3.2 DNA Extraction and quality assessment
DNA was extracted from both blood and feather samples using the QIAGEN DNeasy
Blood and Tissue Kit (QIAGEN, Valencia, CA, USA) according to the manufacture’s
protocol (Appendix II). The DNA samples were then analysed on a 1.5% agarose gel
to check for the presence of DNA as well as the quality of the DNA samples. The gels
were prepared by melting 0.45 g of agarose powder in 30 ml TBE buffer in a
microwave. 5 µl of DNA was stained with 1 µl of loading dye containing gel red and
loaded onto the gel in an electrophoresis tank. A 100 bp molecular ladder (Thermo
Scientific, Wilmington, DE, USA) was used as size standard. The samples were run at
100 V for 30 minutes and the gels observed in a UV Transilluminator (Thermo
Scientific).
The concentrations of the DNA samples were checked using Nanodrop
Spectrophotometer (Thermo Scientific). A concentration of 394.9 ng/µl, was recorded
for the blood sample. This was within the range required by the Genome Sequencer
Junior for sequencing.
University of Ghana http://ugspace.ug.edu.gh
35
3.3 Marker Development
Pure DNA extracted from blood sample was processed and sequenced, adopting the
shotgun sequencing technique using the Roche 454 Genome Sequencer Junior (GS
Junior) with the Titanium Sequencing kit (Roche, Penzburg, Germany) (Margulies et
al., 2005).
3.3.1 DNA Rapid Library (RL) Preparation
The Individual Sample Cleanup method was used to prepare the library in this study.
The DNA sample used in library development was double stranded with optical
density of OD260/280 = 1.86. The DNA Rapid Library preparation involved the
following steps: DNA Fragmentation by Nebulisation, Fragment End Repair, AMPure
Bead Preparation, Adapter Ligation, Small Fragment Removal, Agilent Library
Assessment and Flourometer Library Quantitation.
3.3.1.1 DNA Fragmentation by Nebulisation
1.3 µl of the pure DNA sample (from blood) was diluted with TE buffer to a
concentration of 500 ng, the required concentration for library development with the
Genome Sequencer Junior. The sample was diluted again with TE buffer to top it up
to 100 µl. The 100 µl sample was pipetted into a nebulizer cap and after 500 µl of
nebulization buffer was added, the solution was mixed by pipetting up and down. The
nebulizer cap was connected to a nitrogen tank and 30 psi (2.4 bar) of nitrogen was
applied for 1 minute. 2.5 ml of PBI buffer was added, mixed and purified using the
QIAGEN MinElute PCR Purification kit (QIAGEN). The DNA was eluted with 17 µl
of TE buffer. 1 µl of the DNA was reserved for the bioanalyser step while the rest of
the 16 µl was transferred into a 200 µl PCR tube (Margulies et al., 2005).
University of Ghana http://ugspace.ug.edu.gh
36
3.3.1.2 Fragment End Repair
To repair the ends of the DNA fragments, a 9 µl volume PCR mix was prepared by
adding 2.5 µl RL 10x buffer, 2.5 µl RL ATP, 1 µl RL dNTP, 1 µl RL T4 polymerase,
1 µl RL PNK and 1 µl RL Taq Polymerase. The 9 µl mixture was added to the DNA
sample, vortexed for 5 seconds and centrifuged for 2 seconds in a mini centrifuge.
The PCR sample was run on a thermal cycler using the following cycling conditions:
25°C for 20 min., 72°C for 20 min. and then 4°C hold (Margulies et al., 2005).
3.3.1.3 AMPure Bead Preparation
125 µl of AMPure beads was pipetted into a 2 ml centrifuge tube and placed on a
Magnetic Particle Concentrator (MPC) to allow the beads to pellet on one side of the
tube. The supernatant was discarded and 73 µl of TE Buffer added and vortexed for 5
seconds. 500 µl of Sizing solution was added to the beads, vortexed for 5 seconds and
centrifuged in a mini centrifuge for 2 seconds. The beads were then kept on ice
(Margulies et al., 2005).
3.3.1.4 Adapter Ligation
1 µl of RL Adaptor was added to the reaction tube from the fragment end repair. 1 µl
of RL Ligase was also added, vortexed for 5 seconds, centrifuged for 2 seconds and
then incubated at 25°C for 10 minutes on a thermocycler (Thermo scientific)
(Margulies et al., 2005).
3.3.1.5 Small Fragment Removal
The sample was then added to the AMPure beads, vortexed for 5 seconds, centrifuged
for 2 seconds and incubated at room temperature for 5 minutes. It was then transferred
to the MPC to pellet the beads on the wall of the tube and the supernatant was once
again discarded. 100 µl and 500 µl, of TE Buffer and Sizing Solution respectively
University of Ghana http://ugspace.ug.edu.gh
37
were added, followed by vortexing for 5 seconds after every addition. The sample was
incubated at room temperature for 5 minutes and placed on the MPC to pellet the
beads. After the beads had pelleted, 100 µl of TE Buffer and 500 µl of Sizing Solution
was added again and then incubated and returned to the MPC. Still keeping the beads
on the MPC, the beads were washed twice with 1 µl of 70% ethanol, the tube air dried
at room temperature for 2 minutes, after which the tube was removed and used in the
library assessment step (Margulies et al., 2005).
3.3.1.6 Library Assessment
This was done using the Agilent Bioanalyser Method. In brief, 53 µl of TE Buffer was
added to the tube from the previous step, vortexed for 5 seconds and centrifuged for 2
seconds. The tube was placed on the MPC to pellet the beads to one side of the tube
and then 51 µl of the supernatant was transferred to a new labeled 2 ml tube, leaving
the beads behind. 1 µl of the DNA before ligation (Figure 6) and another 1 µl of DNA
after ligation (Figure 7) was loaded onto the Agilent Bioanalyser high sensitivity
DNA chip (Agilent Technologies, Santa Clara, CA, USA) and the two profiles were
compared after 30 minutes to assess the quality of the library. The following
characteristics were expected: an average fragment length between 600 to 900 bp and
a lower size cut-off <10% below 350 bp (Margulies et al., 2005).
University of Ghana http://ugspace.ug.edu.gh
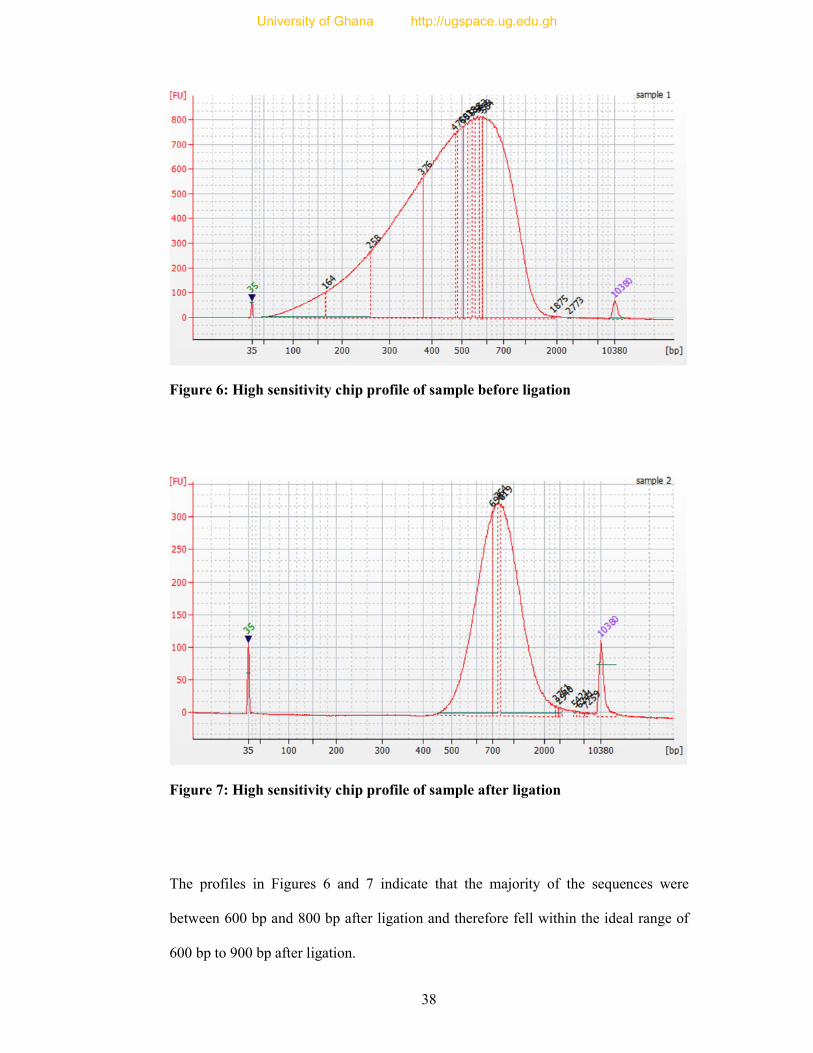
38
Figure 6: High sensitivity chip profile of sample before ligation
Figure 7: High sensitivity chip profile of sample after ligation
The profiles in Figures 6 and 7 indicate that the majority of the sequences were
between 600 bp and 800 bp after ligation and therefore fell within the ideal range of
600 bp to 900 bp after ligation.
University of Ghana http://ugspace.ug.edu.gh
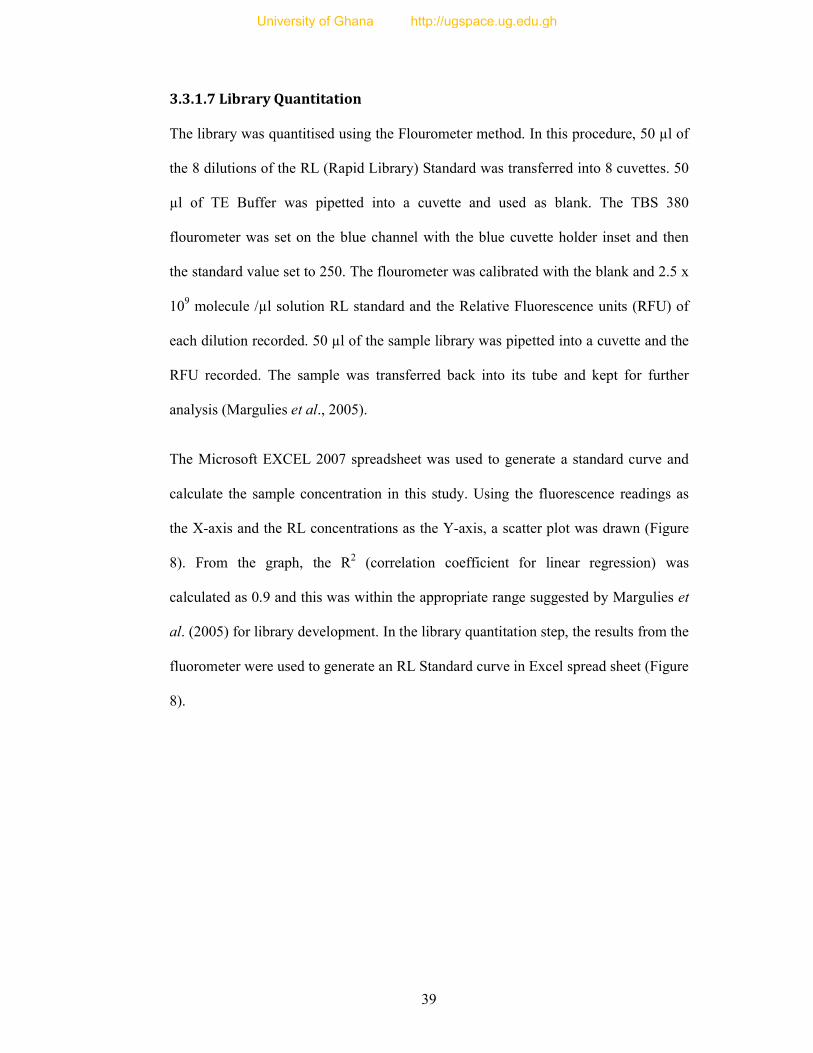
39
3.3.1.7 Library Quantitation
The library was quantitised using the Flourometer method. In this procedure, 50 µl of
the 8 dilutions of the RL (Rapid Library) Standard was transferred into 8 cuvettes. 50
µl of TE Buffer was pipetted into a cuvette and used as blank. The TBS 380
flourometer was set on the blue channel with the blue cuvette holder inset and then
the standard value set to 250. The flourometer was calibrated with the blank and 2.5 x
109 molecule /µl solution RL standard and the Relative Fluorescence units (RFU) of
each dilution recorded. 50 µl of the sample library was pipetted into a cuvette and the
RFU recorded. The sample was transferred back into its tube and kept for further
analysis (Margulies et al., 2005).
The Microsoft EXCEL 2007 spreadsheet was used to generate a standard curve and
calculate the sample concentration in this study. Using the fluorescence readings as
the X-axis and the RL concentrations as the Y-axis, a scatter plot was drawn (Figure
8). From the graph, the R2 (correlation coefficient for linear regression) was
calculated as 0.9 and this was within the appropriate range suggested by Margulies et
al. (2005) for library development. In the library quantitation step, the results from the
fluorometer were used to generate an RL Standard curve in Excel spread sheet (Figure
8).
University of Ghana http://ugspace.ug.edu.gh
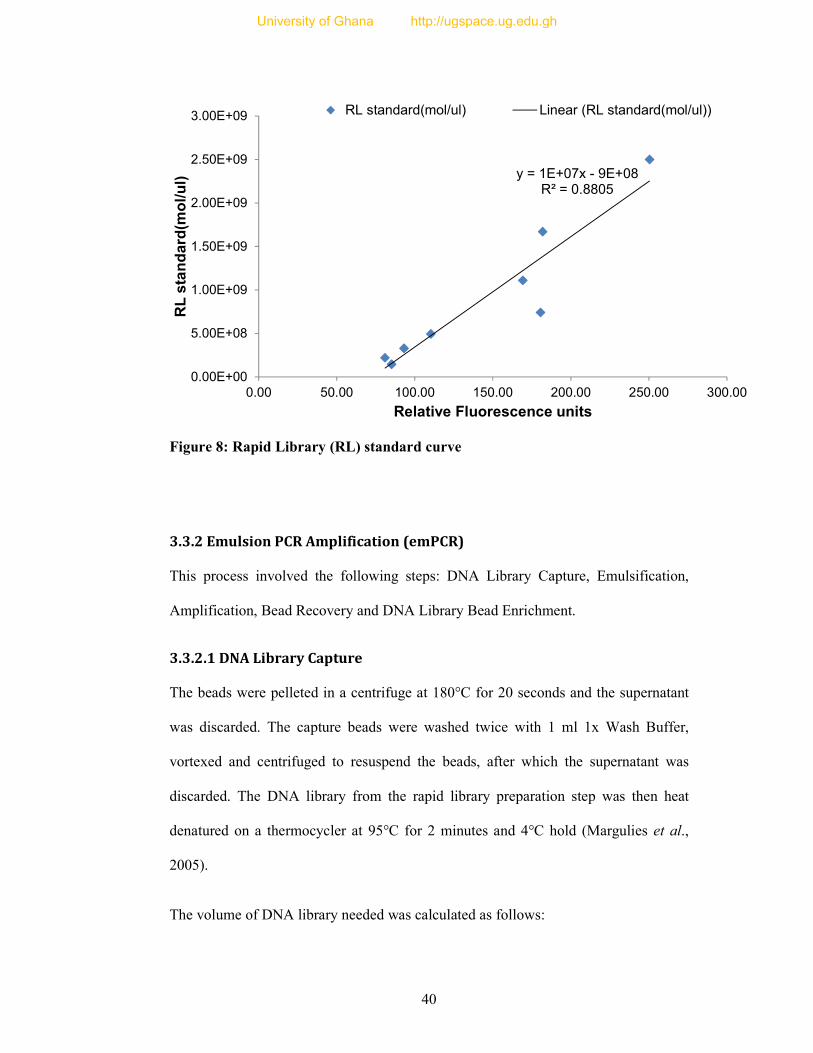
40
Figure 8: Rapid Library (RL) standard curve
3.3.2 Emulsion PCR Amplification (emPCR)
This process involved the following steps: DNA Library Capture, Emulsification,
Amplification, Bead Recovery and DNA Library Bead Enrichment.
3.3.2.1 DNA Library Capture
The beads were pelleted in a centrifuge at 180°C for 20 seconds and the supernatant
was discarded. The capture beads were washed twice with 1 ml 1x Wash Buffer,
vortexed and centrifuged to resuspend the beads, after which the supernatant was
discarded. The DNA library from the rapid library preparation step was then heat
denatured on a thermocycler at 95°C for 2 minutes and 4°C hold (Margulies et al.,
2005).
The volume of DNA library needed was calculated as follows:
y = 1E+07x - 9E+08R² = 0.8805
0.00E+00
5.00E+08
1.00E+09
1.50E+09
2.00E+09
2.50E+09
3.00E+09
0.00 50.00 100.00 150.00 200.00 250.00 300.00
RL
sta
nd
ard
(mo
l/u
l)
Relative Fluorescence units
RL standard(mol/ul) Linear (RL standard(mol/ul))
University of Ghana http://ugspace.ug.edu.gh
41
Volume of DNA library per tube =desired molecules per bead x 10 million beads
Library concentration (molecules/ µl)
=2 (standard) x 10 million beads
2 million molecules/ µl
=10 µl
Based on the calculation, 10 µl of the library was added to the washed Capture beads
and mixed for 5 seconds.
3.3.2.2 Emulsification
1,347 ml Live Amp Mix for Rapid and cDNA Rapid Libraries was prepared by
adding 410 µl of Molecular Biology Grade Water, 515 µl of Additive, 270 µl of Amp
Mix, 80 µl of Amp Primer, 70 µl of Enzyme Mix and 2 µl of PPiase to a 1.5 ml tube,
vortexed and stored on ice. 1.2 µl of the Live Amp Mix was added to the tube of
captured DNA library, vortexed and transferred into a Turrax stiring tube. The tube
was placed into an Ultra Turrax Tube Drive (UTTD) at 2000 rpm for 5 minutes
(Margulies et al., 2005).
3.3.2.3 Amplification
A Combitip was used to alliquote 100 µl of the emulsion into each well of a 96-well
plate. The plate was put into a thermocycler using the following cycling conditions: 4
minutes at 94°C, 50 cycles of 30 seconds at 94°C, 4.5 minutes at 58°C and 30 seconds
at 68°C, and a final hold at 10°C (Margulies et al., 2005).
3.3.2.4 Bead Recovery
In a hood, a 50 ml tube was connected to a vacuum and a transpette. The transpette
was dipped into the wells of the 96-well plate and the emulsion aspirated from each
well with the aid of the vacuum into the 50 ml tube. The transpette was turned upside
University of Ghana http://ugspace.ug.edu.gh

42
down to facilitate draining the emulsion into the collection tube. The wells were
rinsed twice with 100 µl of isopropanol per well and then the rinse aspirated into the
50 ml tube. About 5 ml of isopropanol was aspirated to collect any beads trapped in
the tubing (Margulies et al., 2005).
The 50 ml tube was then removed and the contents vortexed. Isopropanol was added
to a final volume of 35 ml, vortexed to resuspend the bead pellet and centrifuged at
930 x g for 5 minutes, after which the supernatant was discarded. 10 ml of Enhancing
Buffer was added, vortexed to resuspend the pellet and 40 ml isopropanol added to a
final volume of 40 ml. The sample was vortexed again and centrifuged at 930 x g for
5 minutes, after which supernatant was discarded. Absolute ethanol was added to
attain a final volume of 35 ml. After vortexing, the sample was centrifuged again at
930 x g for 5 minutes and the supernatant discarded. Enhancing Buffer was added to a
final volume of 35 ml and vortexed again. The sample was centrifuged at 930 x g for
5 minutes and the supernatant discarded leaving approximately 2 ml of Enhancing
Buffer. The DNA-bead-suspension was then transferred into a 1.7 ml micro-
centrifuge tube and the supernatant discarded after a process of ‘spin-rotate-spin’. The
50 ml tube was rinsed with 1 ml of Enhancing Buffer and the rinse added to the 1.7
ml tube and the process of ‘spin-rotate-spin’ was repeated and the supernatant
discarded. Then the 1.7 ml tube was rinsed thoroughly twice with 1 ml Enhancing
Buffer and the supernatant discarded after a process of ‘spin-rotate-spin’ (Margulies
et al., 2005).
3.3.2.5 DNA Library Bead Enrichment
A tube of brown Enrichment Beads was resuspended and placed in a Magnetic
Particle Concentrator (MPC) for 3 minutes to pellet the Enrichment Beads. The
supernatant was discarded. 500 µl of Enhancing Buffer was added, vortexed and the
University of Ghana http://ugspace.ug.edu.gh

43
tube placed on the MPC after which the supernatant was discarded. This was repeated
and the supernatant discarded. 80 µl of Enhancing Buffer was finally added, mixed
and the mixture added to the 1.7 ml tube of beads (from the Bead Wash Discovery
step) and mixed completely. The tube was placed in the MPC to pellet the beads for 3
to 5 minutes and the supernatant carefully discarded. The beads were washed again
with Enhancing Buffer, pelleted and the supernatant carefully discarded (Margulies et
al., 2005).
A 700 µl Melt Solution comprising 125 µl of NaOH and 9.875 ml of Molecular
Biology Grade Water was used to resuspend the beads. The tube was returned to the
MPC after vortexing for 5 seconds and the supernatant was transferred into a new 1.7
ml microcentrifuge tube. 700 µl of Melt Solution was again added to the beads,
vortexed and the supernatant transferred to the same new 1.7 ml tube. The enrichment
tube was then discarded. The supernatant was also discarded after a process of spin-
rotate-spin. 1 ml Annealing Buffer was added to the tube 10 times, each time the
supernatant was discarded after a process of spin-rotate-spin. Finally, 100 µl of
Annealing Buffer was used to resuspend the beads in the tube (Margulies et al.,
2005).
25 µl of Sequence Primer was added to the 1.7 ml tube, mixed and incubated for 5
minutes at 65°C and promptly cooled on ice for 2 minutes. 1 ml Annealing Buffer
was mixed with the bead pellet and then centrifuged briefly (“spin-rotate-spin”)
(Margulies et al., 2005). The amount of enriched beads was then evaluated by placing
the tube into the GS Junior Bead Counter (Roche) and the level and quality of the
emulsion accessed (Margulies et al., 2005).
University of Ghana http://ugspace.ug.edu.gh
44
3.3.3 Sequencing Method
The 175 µl of Packing Beads containing Polymerase, Polymerase Cofactor and Bead
Buffer was mixed with enriched DNA beads (from the emulsion PCR) and incubated
for 5 minutes at room temperature in a laboratory rotator. The Pico-Titer Plate was
assembled into the Bead Deposition Device (BDD) and the plate loaded by injection
with a pipette through the loading port on the BDD with four layers of beads. The
layers were 350 µl each of Enzyme beads (pre-layer), enriched DNA beads + Packing
Beads, Enzyme beads (Post-layer) and PPiase beads respectively. Centrifugal
sedimentation was used to settle the beads at the bottom of the Pico-Titer Plate at
4,013 rpm for 5, 10, 10 and 5 minutes, respectively, for the various layers. After each
sedimentation process, excess supernatant was discarded from the device using a
pipette. The instrument protocol was followed and all the parameters entered
manually. The number of nucleotide cycles used was 200. The BDD was removed
and only the Pico-Titer Plate was loaded onto the cartridge in the sequencer and run
for 9 hours to generate the sequence data of the library (Margulies et al., 2005).
3.3.4 Library Screening
FASTA sequences obtained in the library were screened for possible microsatellites.
Reads containing repeat motifs were screened and selected with
MSATCOMMANDER software (Faircloth, 2008). The microsatellites were classified
into di-, tri- and tetra-nucleotides, etc.
3.3.5 Primer Design
The PRIMER 3 software (Rozen and Skaletsky, 2000) was used to design 154 primer
pairs to flank the repeat motifs which comprised di-, tri- and tetra- nucleotides. The
primers were designed to meet the following criteria: primer length range of 18 to 25
bp, amplification product size of 100 –250 bp, GC content of 50%, optimal melting
University of Ghana http://ugspace.ug.edu.gh
45
temperature of 55 ºC (range 52 ºC–60 ºC), low levels of self- or pair-
complementarity and maximum end stability (ΔG) of 8.0 (Faircloth, 2008). The
primers were synthesized and used in subsequent tests.
The forward primers of 20 primer pairs were labeled with fluorescent dyes: FAM,
HEX and NED (Applied Biosystems, Foster City, CA). For all the remaining primers
(134), an M13 (-21) universal leading sequence (5-TGTAAAACGACGGCCAGT-3)
was added to the 5' end of each forward primer (Schuelke, 2000).
3.3.6 Primer Optimisation
One hundred and fifty two synthesised primer pairs were tested in a PCR at two
temperatures (55 ºC and 60˚C), to determine optimal cycling conditions using four
guinea fowl DNA samples collected from LIPREC. Owing to limitation of time and
resources, only two primer annealing temperatures were used as the basis for
determining the optimal cycling conditions.
A 10 µl volume PCR containing 20 ng of DNA, 0.75 U of LA-Taq DNA polymerase
(TaKaRa Biomedicals,Tokyo, Japan), PCR buffer, 400 µM of each dNTP and 0.4 µM
of forward and reverse primers was prepared for each primer pair. Cycling conditions
were as follows: initial denaturing at 95 ºC for 2 minutes, followed by 35 cycles of
denaturation at 95 ºC for 30 seconds, annealing at 55 ºC or 60 ºC for 30 seconds,
extension at 74 ºC for 1 minute, and a final extension of 74 ºC for 10 minutes. The
PCR products were analysed on 1.5% agarose gel electrophoresis and viewed in a UV
Transilluminator (Thermo Scientific). The appropriate annealing temperature (i.e. 55
ºC or 60 ˚C) was selected for each primer based on the quality of the bands in the
image. Primers that successfully amplified in at least two individual guinea fowl DNA
were selected for genotyping.
University of Ghana http://ugspace.ug.edu.gh
46
3.3.7 Genotyping
3.3.7.1 PCR
Polymorphism at each microsatellite locus was determined using DNA isolated from
the 32 unrelated guinea fowls. A 10 µl PCR was prepared containing 0.75 U of LA-
Taq DNA polymerase (TaKaRa), PCR buffer, 400 µM of each dNTP, 0.4 µM of
forward and reverse primers, 0.1 µg of T4 M13 universal tag sequence and 20 ng of
template DNA.
Also, three individual multiplex PCRs (Table 4) were prepared for HEX and FAM
fluorescently labeled primers based on the expected product sizes. Each 10 µl volume
contained 5 µl Master mix, 2x multiplex master mix (QIAGEN), 3 µl dH2O, 0.01 µM
of the forward primer, 0.15 µM of reverse primer and 20 ng of the genomic DNA.
General PCR conditions were initial denaturation of 95 ºC for 2 minutes, 35 cycles of
95 ºC for 30 seconds, 55 ºC or 60 ºC for 30 seconds, 74 ºC for 1 minute and a final
extension at 74 ºC for 10 minutes.
University of Ghana http://ugspace.ug.edu.gh
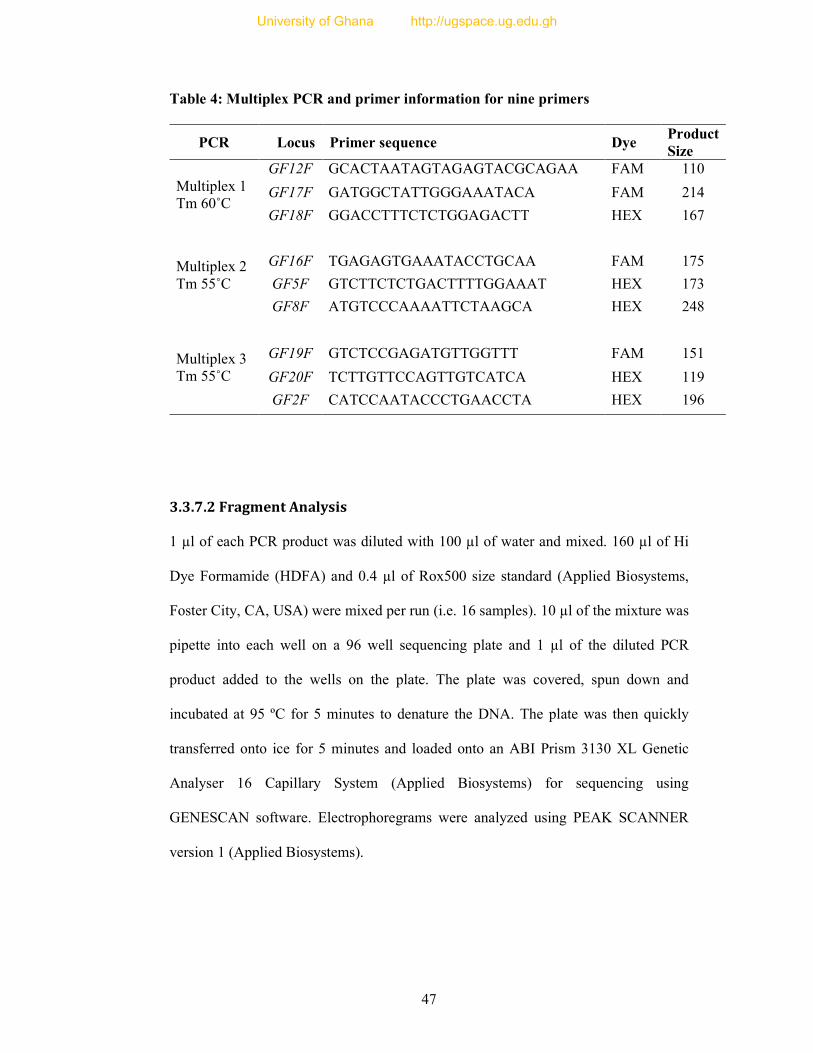
47
Table 4: Multiplex PCR and primer information for nine primers
PCR Locus Primer sequence Dye Product Size
Multiplex 1 Tm 60˚C
GF12F GCACTAATAGTAGAGTACGCAGAA FAM 110
GF17F GATGGCTATTGGGAAATACA FAM 214
GF18F GGACCTTTCTCTGGAGACTT HEX 167
Multiplex 2 Tm 55˚C
GF16F TGAGAGTGAAATACCTGCAA FAM 175
GF5F GTCTTCTCTGACTTTTGGAAAT HEX 173
GF8F ATGTCCCAAAATTCTAAGCA HEX 248
Multiplex 3 Tm 55˚C
GF19F GTCTCCGAGATGTTGGTTT FAM 151
GF20F TCTTGTTCCAGTTGTCATCA HEX 119
GF2F CATCCAATACCCTGAACCTA HEX 196
3.3.7.2 Fragment Analysis
1 µl of each PCR product was diluted with 100 µl of water and mixed. 160 µl of Hi
Dye Formamide (HDFA) and 0.4 µl of Rox500 size standard (Applied Biosystems,
Foster City, CA, USA) were mixed per run (i.e. 16 samples). 10 µl of the mixture was
pipette into each well on a 96 well sequencing plate and 1 µl of the diluted PCR
product added to the wells on the plate. The plate was covered, spun down and
incubated at 95 ºC for 5 minutes to denature the DNA. The plate was then quickly
transferred onto ice for 5 minutes and loaded onto an ABI Prism 3130 XL Genetic
Analyser 16 Capillary System (Applied Biosystems) for sequencing using
GENESCAN software. Electrophoregrams were analyzed using PEAK SCANNER
version 1 (Applied Biosystems).
University of Ghana http://ugspace.ug.edu.gh
48
3.3.8 Data Analysis
Population genetics parameters were estimated for all polymorphic loci with clear
electropherograms. The observed heterozygosity (Ho), expected heterozygosity (He),
number of alleles (Na), effective population size (Ne), probability of identity (PI),
Shannon’s informative index (I), fixation index (F) and deviations from Hardy-
Weinberg Equilibrium (HWE) were calculated using GENEALEX software version
6.41 (Peakall and Smouse, 2006). Null allele frequency (NAF) was determined for all
loci using FreeNA (Chapuis and Estoup, 2007). The polymorphism information
content (PIC) of the markers was calculated using Microsoft Office EXCEL 2007
based on the formula:
��� = 1 − �����
�
���
� −� � 2�����
�
�
�����
���
���
where: pi and pj are the frequencies of the i-th and j-th alleles of a given microsatellite
and n is the total number of alleles detected for that microsatellite (Botstein et al.,
1980).
University of Ghana http://ugspace.ug.edu.gh
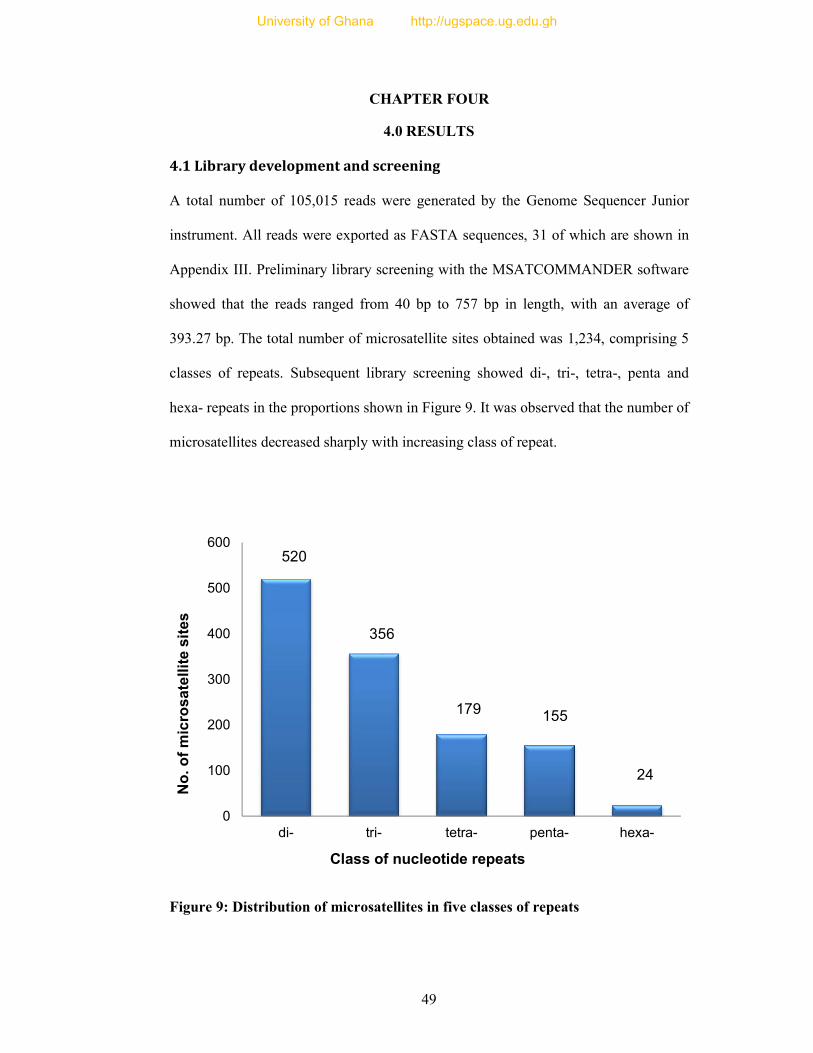
49
CHAPTER FOUR
4.0 RESULTS
4.1 Library development and screening
A total number of 105,015 reads were generated by the Genome Sequencer Junior
instrument. All reads were exported as FASTA sequences, 31 of which are shown in
Appendix III. Preliminary library screening with the MSATCOMMANDER software
showed that the reads ranged from 40 bp to 757 bp in length, with an average of
393.27 bp. The total number of microsatellite sites obtained was 1,234, comprising 5
classes of repeats. Subsequent library screening showed di-, tri-, tetra-, penta and
hexa- repeats in the proportions shown in Figure 9. It was observed that the number of
microsatellites decreased sharply with increasing class of repeat.
Figure 9: Distribution of microsatellites in five classes of repeats
520
356
179 155
24
0
100
200
300
400
500
600
di- tri- tetra- penta- hexa-
No
. o
f m
icro
sa
tellit
e s
ites
Class of nucleotide repeats
University of Ghana http://ugspace.ug.edu.gh
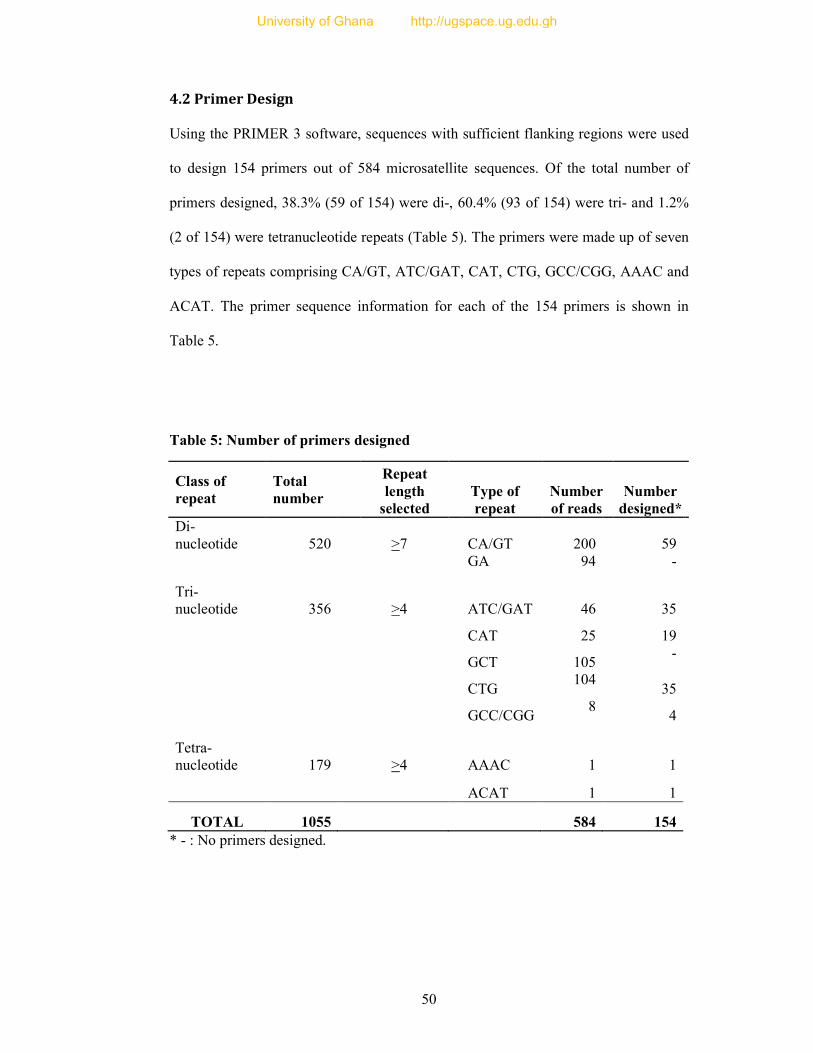
50
4.2 Primer Design
Using the PRIMER 3 software, sequences with sufficient flanking regions were used
to design 154 primers out of 584 microsatellite sequences. Of the total number of
primers designed, 38.3% (59 of 154) were di-, 60.4% (93 of 154) were tri- and 1.2%
(2 of 154) were tetranucleotide repeats (Table 5). The primers were made up of seven
types of repeats comprising CA/GT, ATC/GAT, CAT, CTG, GCC/CGG, AAAC and
ACAT. The primer sequence information for each of the 154 primers is shown in
Table 5.
Table 5: Number of primers designed
Class of repeat
Total number
Repeat length
selected Type of repeat
Number of reads
Number designed*
Di- nucleotide 520 >7 CA/GT 200 59
GA 94 -
Tri- nucleotide 356 >4 ATC/GAT 46 35
CAT 25 19
GCT 105
-
CTG 104
35
GCC/CGG 8
4
Tetra-nucleotide 179 >4 AAAC 1 1
ACAT 1 1
TOTAL 1055
584 154 * - : No primers designed.
University of Ghana http://ugspace.ug.edu.gh

51
Following the criteria described by Weber (1990) and Schlötterer and Harr (2001),
majority of the primers (142) were perfect repeats whilst the rest (loci GF1, GF3,
GF4, GF6, GF19, GF126, GF154, GF181, GF202, GF207, GF210 and GF214) were
imperfect repeats (Figure 10) with one or 2 nucleotide interruptions. No compound
repeats were designed in this study.
Figure 10: Characteristics of microsatellite repeats
4.3 Primer Testing
Out of a total of 152 primers tested, 122 primers (Table 6) showed clear, distinct
amplification patterns, an example of which is shown in Figure 11. Optimisation
could not be done for 30 primers, which included 16 di- and 14 trinucleotide repeats.
The annealing temperatures for each of the 122 primers are shown in Table 7. Of the
92%
8%
Perfect repeats
University of Ghana http://ugspace.ug.edu.gh
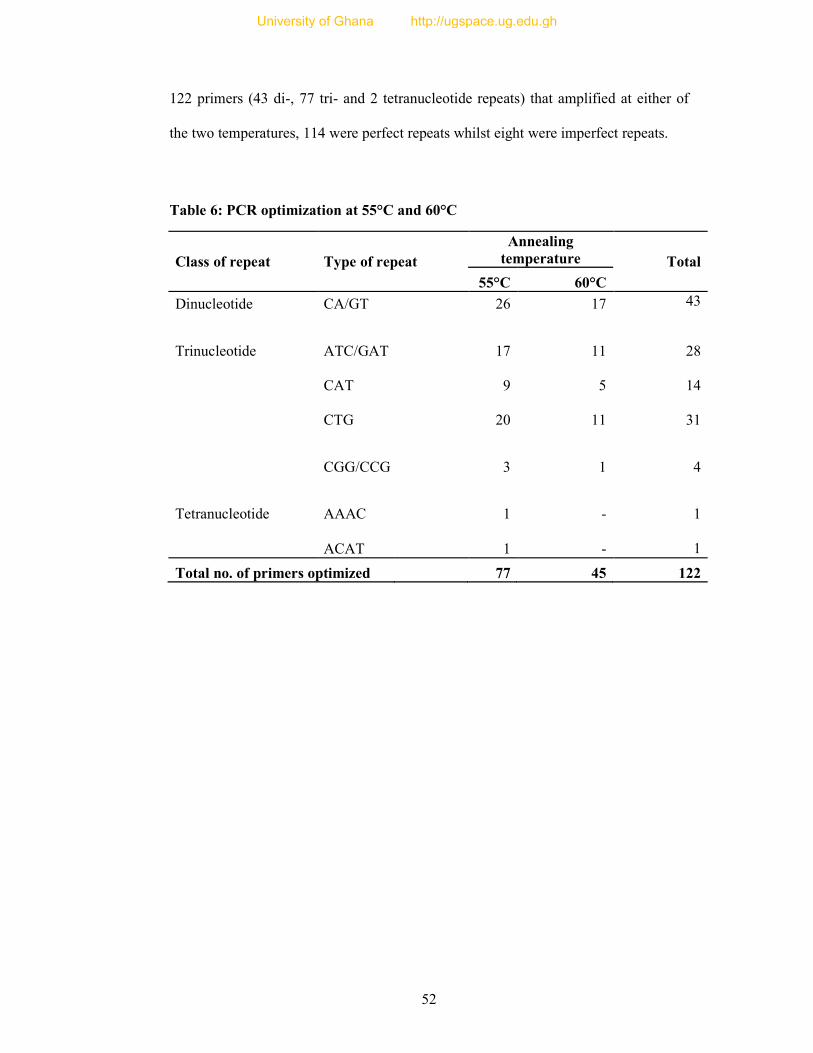
52
122 primers (43 di-, 77 tri- and 2 tetranucleotide repeats) that amplified at either of
the two temperatures, 114 were perfect repeats whilst eight were imperfect repeats.
Table 6: PCR optimization at 55°C and 60°C
Class of repeat Type of repeat
Annealing temperature Total
55°C 60°C
Dinucleotide CA/GT 26 17 43
Trinucleotide ATC/GAT 17 11
28
CAT 9 5
14
CTG 20 11
31
CGG/CCG 3 1
4
Tetranucleotide AAAC 1 -
1
ACAT 1 -
1
Total no. of primers optimized 77 45 122
University of Ghana http://ugspace.ug.edu.gh
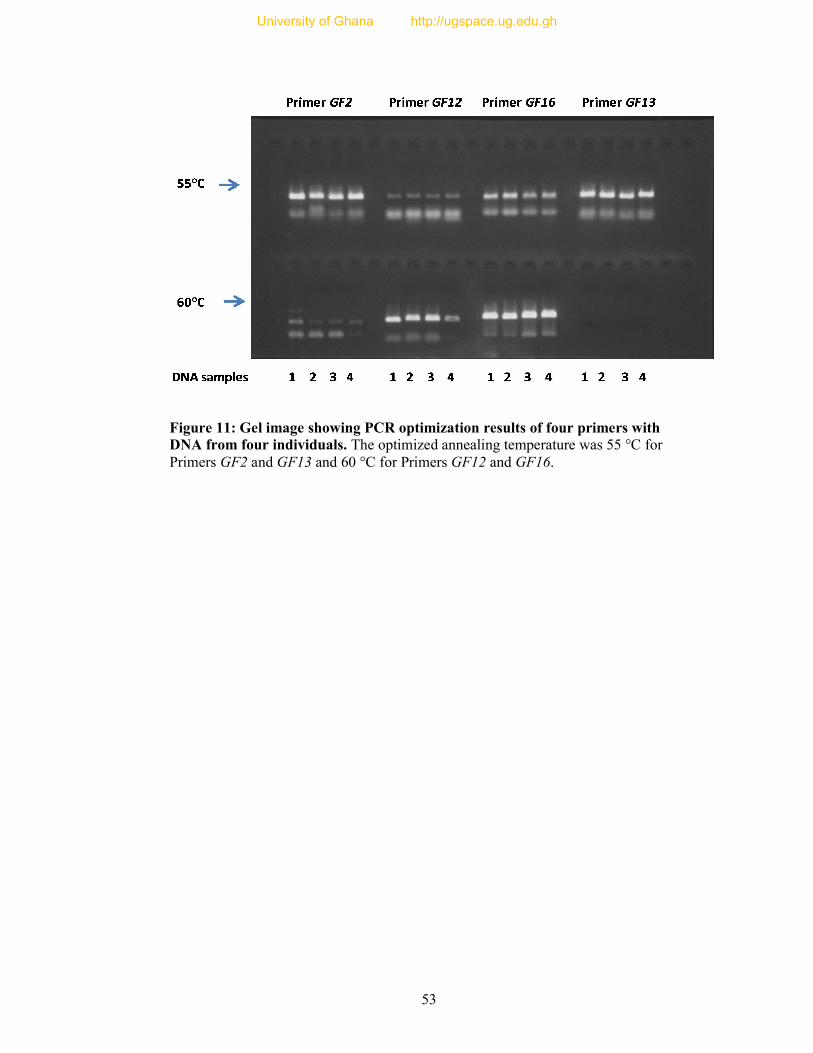
53
Figure 11: Gel image showing PCR optimization results of four primers with DNA from four individuals. The optimized annealing temperature was 55 °C for Primers GF2 and GF13 and 60 °C for Primers GF12 and GF16.
University of Ghana http://ugspace.ug.edu.gh
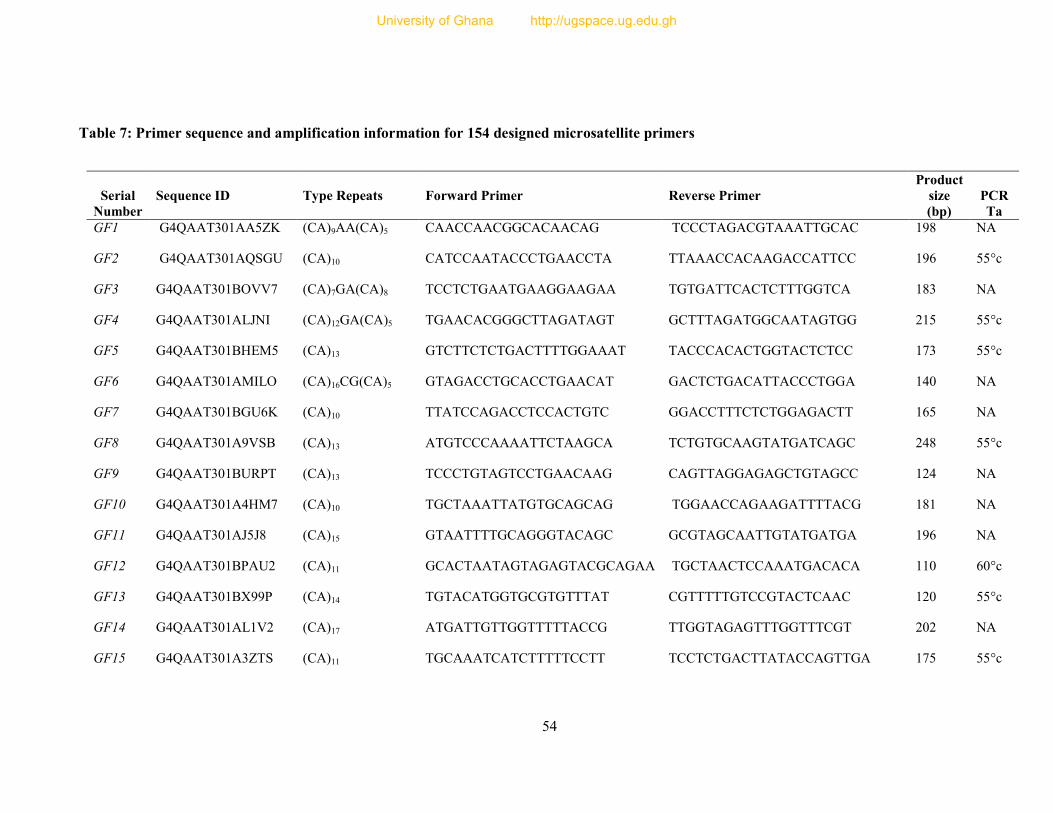
54
Table 7: Primer sequence and amplification information for 154 designed microsatellite primers
Serial Number
Sequence ID Type Repeats Forward Primer Reverse Primer Product
size (bp)
PCR Ta
GF1 G4QAAT301AA5ZK (CA)9AA(CA)5 CAACCAACGGCACAACAG TCCCTAGACGTAAATTGCAC 198 NA
GF2 G4QAAT301AQSGU (CA)10 CATCCAATACCCTGAACCTA TTAAACCACAAGACCATTCC 196 55°c
GF3 G4QAAT301BOVV7 (CA)7GA(CA)8 TCCTCTGAATGAAGGAAGAA TGTGATTCACTCTTTGGTCA 183 NA
GF4 G4QAAT301ALJNI (CA)12GA(CA)5 TGAACACGGGCTTAGATAGT GCTTTAGATGGCAATAGTGG 215 55°c
GF5 G4QAAT301BHEM5 (CA)13 GTCTTCTCTGACTTTTGGAAAT TACCCACACTGGTACTCTCC 173 55°c
GF6 G4QAAT301AMILO (CA)16CG(CA)5 GTAGACCTGCACCTGAACAT GACTCTGACATTACCCTGGA 140 NA
GF7 G4QAAT301BGU6K (CA)10 TTATCCAGACCTCCACTGTC GGACCTTTCTCTGGAGACTT 165 NA
GF8 G4QAAT301A9VSB (CA)13 ATGTCCCAAAATTCTAAGCA TCTGTGCAAGTATGATCAGC 248 55°c
GF9 G4QAAT301BURPT (CA)13 TCCCTGTAGTCCTGAACAAG CAGTTAGGAGAGCTGTAGCC 124 NA
GF10 G4QAAT301A4HM7 (CA)10 TGCTAAATTATGTGCAGCAG TGGAACCAGAAGATTTTACG 181 NA
GF11 G4QAAT301AJ5J8 (CA)15 GTAATTTTGCAGGGTACAGC GCGTAGCAATTGTATGATGA 196 NA
GF12 G4QAAT301BPAU2 (CA)11 GCACTAATAGTAGAGTACGCAGAA TGCTAACTCCAAATGACACA 110 60°c
GF13 G4QAAT301BX99P (CA)14 TGTACATGGTGCGTGTTTAT CGTTTTTGTCCGTACTCAAC 120 55°c
GF14 G4QAAT301AL1V2 (CA)17 ATGATTGTTGGTTTTTACCG TTGGTAGAGTTTGGTTTCGT 202 NA
GF15 G4QAAT301A3ZTS (CA)11 TGCAAATCATCTTTTTCCTT TCCTCTGACTTATACCAGTTGA 175 55°c
University of Ghana http://ugspace.ug.edu.gh
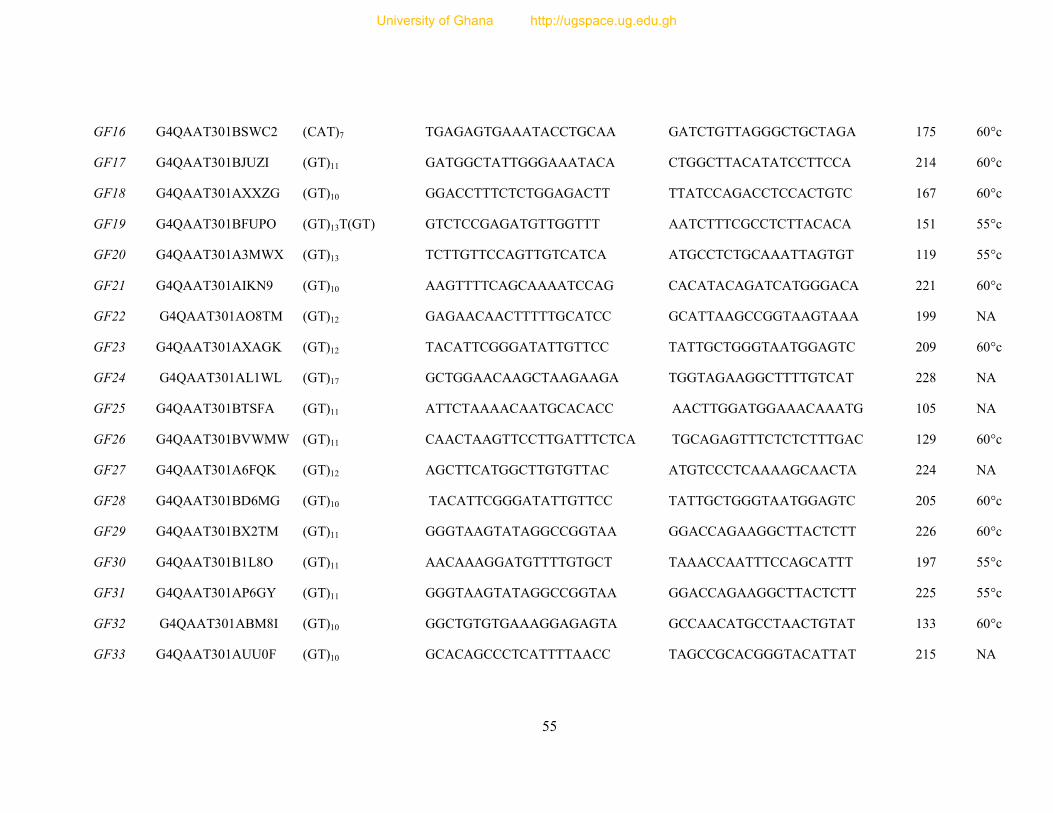
55
GF16 G4QAAT301BSWC2 (CAT)7 TGAGAGTGAAATACCTGCAA GATCTGTTAGGGCTGCTAGA 175 60°c
GF17 G4QAAT301BJUZI (GT)11 GATGGCTATTGGGAAATACA CTGGCTTACATATCCTTCCA 214 60°c
GF18 G4QAAT301AXXZG (GT)10 GGACCTTTCTCTGGAGACTT TTATCCAGACCTCCACTGTC 167 60°c
GF19 G4QAAT301BFUPO (GT)13T(GT) GTCTCCGAGATGTTGGTTT AATCTTTCGCCTCTTACACA 151 55°c
GF20 G4QAAT301A3MWX (GT)13 TCTTGTTCCAGTTGTCATCA ATGCCTCTGCAAATTAGTGT 119 55°c
GF21 G4QAAT301AIKN9 (GT)10 AAGTTTTCAGCAAAATCCAG CACATACAGATCATGGGACA 221 60°c
GF22 G4QAAT301AO8TM (GT)12 GAGAACAACTTTTTGCATCC GCATTAAGCCGGTAAGTAAA 199 NA
GF23 G4QAAT301AXAGK (GT)12 TACATTCGGGATATTGTTCC TATTGCTGGGTAATGGAGTC 209 60°c
GF24 G4QAAT301AL1WL (GT)17 GCTGGAACAAGCTAAGAAGA TGGTAGAAGGCTTTTGTCAT 228 NA
GF25 G4QAAT301BTSFA (GT)11 ATTCTAAAACAATGCACACC AACTTGGATGGAAACAAATG 105 NA
GF26 G4QAAT301BVWMW (GT)11 CAACTAAGTTCCTTGATTTCTCA TGCAGAGTTTCTCTCTTTGAC 129 60°c
GF27 G4QAAT301A6FQK (GT)12 AGCTTCATGGCTTGTGTTAC ATGTCCCTCAAAAGCAACTA 224 NA
GF28 G4QAAT301BD6MG (GT)10 TACATTCGGGATATTGTTCC TATTGCTGGGTAATGGAGTC 205 60°c
GF29 G4QAAT301BX2TM (GT)11 GGGTAAGTATAGGCCGGTAA GGACCAGAAGGCTTACTCTT 226 60°c
GF30 G4QAAT301B1L8O (GT)11 AACAAAGGATGTTTTGTGCT TAAACCAATTTCCAGCATTT 197 55°c
GF31 G4QAAT301AP6GY (GT)11 GGGTAAGTATAGGCCGGTAA GGACCAGAAGGCTTACTCTT 225 55°c
GF32 G4QAAT301ABM8I (GT)10 GGCTGTGTGAAAGGAGAGTA GCCAACATGCCTAACTGTAT 133 60°c
GF33 G4QAAT301AUU0F (GT)10 GCACAGCCCTCATTTTAACC TAGCCGCACGGGTACATTAT 215 NA
University of Ghana http://ugspace.ug.edu.gh

56
GF34 G4QAAT301AJLUV (GT)10 TCTTGTTCTCCATCAGCTCT CACAAAACACCTGCTCACTA 101 60°c
GF36 G4QAAT301BZQOR (CA)8 ACACACACACCTACCCTGAT GAGCTGCGTATGCACTGG 233 NA
GF37 G4QAAT301BB71Y (CA)8 TCTTCCTTCAGAGGTACCAA TGAAGACCATAGAAGCCTGT 212 60°c
GF38 G4QAAT301AJCIN (CA)8 TCAATAGCAAAAGCCCTTAC TGTGCACTGTTCGTCACTAT 211 60°c
GF39 G4QAAT301A8JVX (CA)8 AAAGCCAGGAGTCTCTCTCT CTGCAGCTGCTTGTACTATG 156 60°c
GF40 G4QAAT301BR98J (CA)9 ACTTCATGAGGTTCAAATGG TGGAATCTAGCTTGTTGGTT 248 55°c
GF41 G4QAAT301BTGIR (CA)9 CTCCTCAAAGCAAAGACAAG CTGTTAGCCTGCCTCTTTTA 127 55°c
GF42 G4QAAT301AERUM (CA)9 TTGACGTTTAAAGGAGAAGC GTTGAAATTGAGGTCAGAGC 249 55°c
GF43 G4QAAT301BEYNH (CA)9 TCTGAAGTATCTGCCCTGAG TTATCAAGTGAGCGATCAGA 120 55°c
GF44 G4QAAT301BD16B (CA)9 ATTCTCTGGAATGGGAATTT ATAGTGGCATGGTTCTCTTC 180 55°c
GF45 G4QAAT301AHKUC (CA)9 AAAATGTTGAGGAAGCAAGA AAGCTACTGCTCTGTGAAGG 248 55°c
GF46 G4QAAT301BYZHV (CA)8 AAAAAGAAAACATGGCAAAG TGAAGGGCCATAATTAAAGA 117 55°c
GF47 QAAT301A65VV (CA)8 TGCACACAAAATAATCCTGA CTGCAGTCTCTAGGGGTGTA 216 60°c
GF48 G4QAAT301APKOZ (CA)9 ACCTCTAAACACCCACACAC GCCAATTACCATGTTTCAGT 235 60°c
GF49 G4QAAT301APHK1 (CA)8 GCTGTCTCTGGAATCTAACG TGTATGTAAGGAGTATATTGGTATG 148 NA
GF50 G4QAAT301AI0Q1 (CA)8A(CA)2 TGCTAAATTATGTGCAGCAG CCAACCTAAGCCATACTAGG 157 60°c
GF51 G4QAAT301BHQ2V (ATC)4 AAAGCCAACTTCTCATCAAA AGCGCACATTTATTTCAGAT 180 60°c
GF52 G4QAAT301BQDGC (ATC)4 TGTGAACACGCACTATTGTT TTGTAGAACAGGCTGTAGGG 172 55°c
University of Ghana http://ugspace.ug.edu.gh
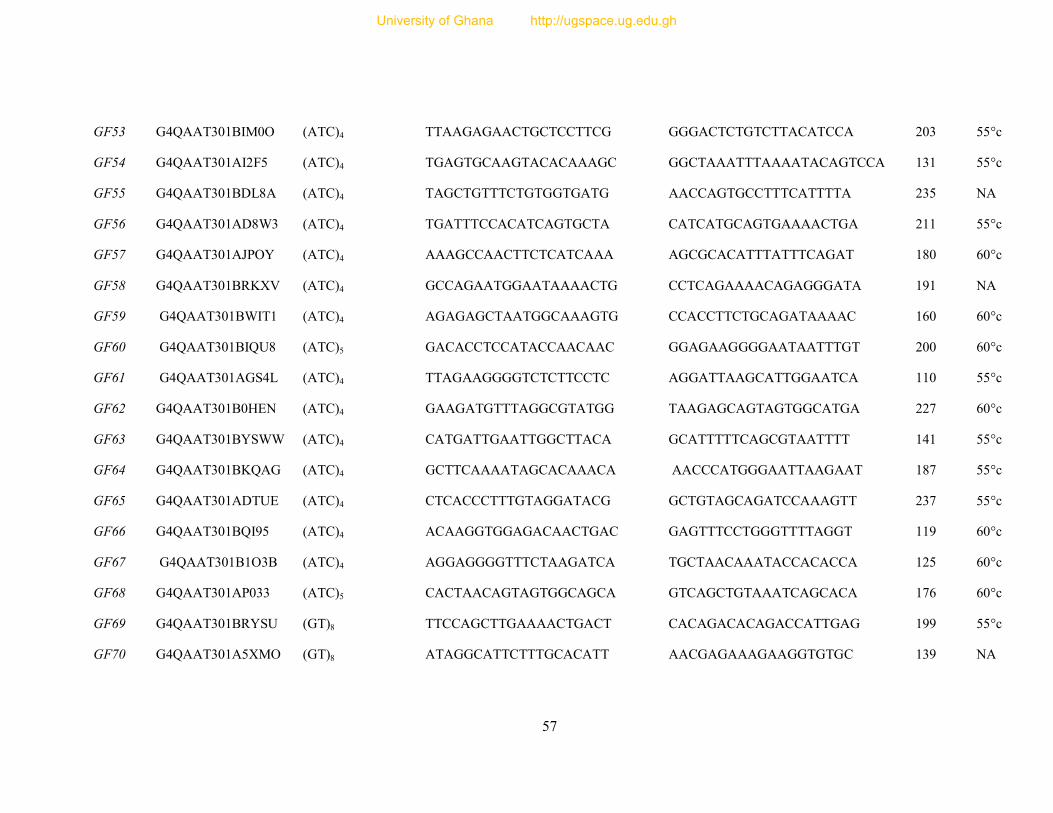
57
GF53 G4QAAT301BIM0O (ATC)4 TTAAGAGAACTGCTCCTTCG GGGACTCTGTCTTACATCCA 203 55°c
GF54 G4QAAT301AI2F5 (ATC)4 TGAGTGCAAGTACACAAAGC GGCTAAATTTAAAATACAGTCCA 131 55°c
GF55 G4QAAT301BDL8A (ATC)4 TAGCTGTTTCTGTGGTGATG AACCAGTGCCTTTCATTTTA 235 NA
GF56 G4QAAT301AD8W3 (ATC)4 TGATTTCCACATCAGTGCTA CATCATGCAGTGAAAACTGA 211 55°c
GF57 G4QAAT301AJPOY (ATC)4 AAAGCCAACTTCTCATCAAA AGCGCACATTTATTTCAGAT 180 60°c
GF58 G4QAAT301BRKXV (ATC)4 GCCAGAATGGAATAAAACTG CCTCAGAAAACAGAGGGATA 191 NA
GF59 G4QAAT301BWIT1 (ATC)4 AGAGAGCTAATGGCAAAGTG CCACCTTCTGCAGATAAAAC 160 60°c
GF60 G4QAAT301BIQU8 (ATC)5 GACACCTCCATACCAACAAC GGAGAAGGGGAATAATTTGT 200 60°c
GF61 G4QAAT301AGS4L (ATC)4 TTAGAAGGGGTCTCTTCCTC AGGATTAAGCATTGGAATCA 110 55°c
GF62 G4QAAT301B0HEN (ATC)4 GAAGATGTTTAGGCGTATGG TAAGAGCAGTAGTGGCATGA 227 60°c
GF63 G4QAAT301BYSWW (ATC)4 CATGATTGAATTGGCTTACA GCATTTTTCAGCGTAATTTT 141 55°c
GF64 G4QAAT301BKQAG (ATC)4 GCTTCAAAATAGCACAAACA AACCCATGGGAATTAAGAAT 187 55°c
GF65 G4QAAT301ADTUE (ATC)4 CTCACCCTTTGTAGGATACG GCTGTAGCAGATCCAAAGTT 237 55°c
GF66 G4QAAT301BQI95 (ATC)4 ACAAGGTGGAGACAACTGAC GAGTTTCCTGGGTTTTAGGT 119 60°c
GF67 G4QAAT301B1O3B (ATC)4 AGGAGGGGTTTCTAAGATCA TGCTAACAAATACCACACCA 125 60°c
GF68 G4QAAT301AP033 (ATC)5 CACTAACAGTAGTGGCAGCA GTCAGCTGTAAATCAGCACA 176 60°c
GF69 G4QAAT301BRYSU (GT)8 TTCCAGCTTGAAAACTGACT CACAGACACAGACCATTGAG 199 55°c
GF70 G4QAAT301A5XMO (GT)8 ATAGGCATTCTTTGCACATT AACGAGAAAGAAGGTGTGC 139 NA
University of Ghana http://ugspace.ug.edu.gh
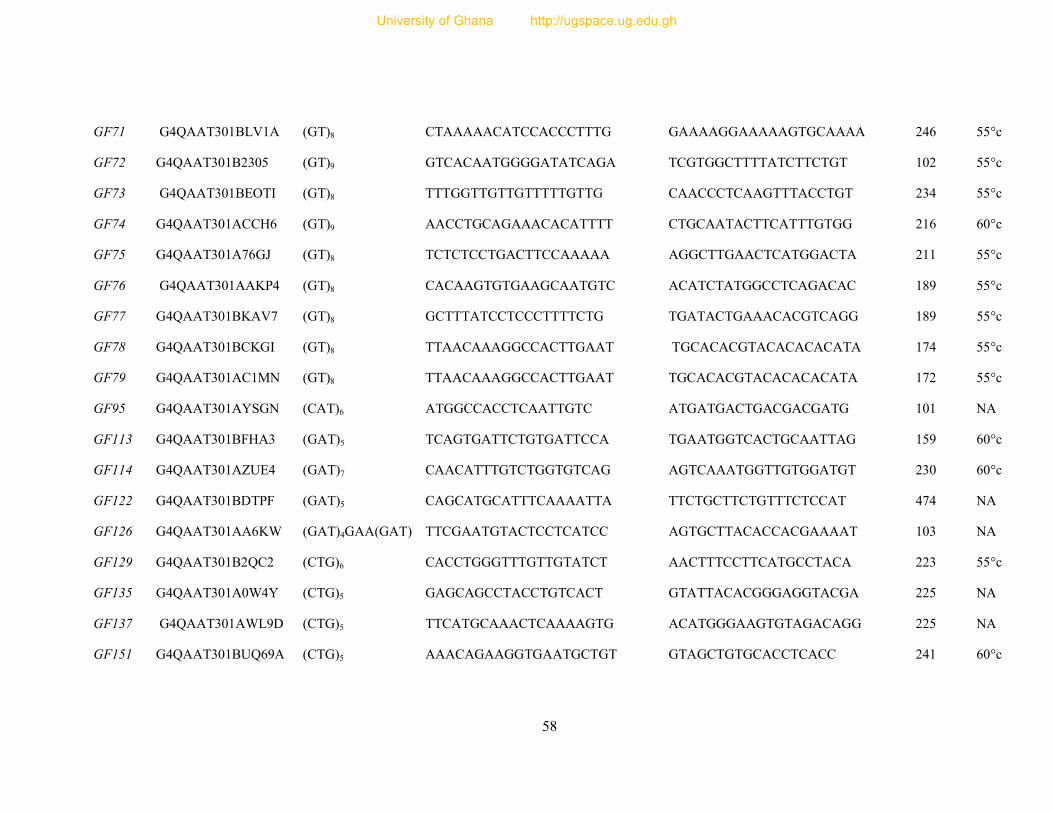
58
GF71 G4QAAT301BLV1A (GT)8 CTAAAAACATCCACCCTTTG GAAAAGGAAAAAGTGCAAAA 246 55°c
GF72 G4QAAT301B2305 (GT)9 GTCACAATGGGGATATCAGA TCGTGGCTTTTATCTTCTGT 102 55°c
GF73 G4QAAT301BEOTI (GT)8 TTTGGTTGTTGTTTTTGTTG CAACCCTCAAGTTTACCTGT 234 55°c
GF74 G4QAAT301ACCH6 (GT)9 AACCTGCAGAAACACATTTT CTGCAATACTTCATTTGTGG 216 60°c
GF75 G4QAAT301A76GJ (GT)8 TCTCTCCTGACTTCCAAAAA AGGCTTGAACTCATGGACTA 211 55°c
GF76 G4QAAT301AAKP4 (GT)8 CACAAGTGTGAAGCAATGTC ACATCTATGGCCTCAGACAC 189 55°c
GF77 G4QAAT301BKAV7 (GT)8 GCTTTATCCTCCCTTTTCTG TGATACTGAAACACGTCAGG 189 55°c
GF78 G4QAAT301BCKGI (GT)8 TTAACAAAGGCCACTTGAAT TGCACACGTACACACACATA 174 55°c
GF79 G4QAAT301AC1MN (GT)8 TTAACAAAGGCCACTTGAAT TGCACACGTACACACACATA 172 55°c
GF95 G4QAAT301AYSGN (CAT)6 ATGGCCACCTCAATTGTC ATGATGACTGACGACGATG 101 NA
GF113 G4QAAT301BFHA3 (GAT)5 TCAGTGATTCTGTGATTCCA TGAATGGTCACTGCAATTAG 159 60°c
GF114 G4QAAT301AZUE4 (GAT)7 CAACATTTGTCTGGTGTCAG AGTCAAATGGTTGTGGATGT 230 60°c
GF122 G4QAAT301BDTPF (GAT)5 CAGCATGCATTTCAAAATTA TTCTGCTTCTGTTTCTCCAT 474 NA
GF126 G4QAAT301AA6KW (GAT)4GAA(GAT) TTCGAATGTACTCCTCATCC AGTGCTTACACCACGAAAAT 103 NA
GF129 G4QAAT301B2QC2 (CTG)6 CACCTGGGTTTGTTGTATCT AACTTTCCTTCATGCCTACA 223 55°c
GF135 G4QAAT301A0W4Y (CTG)5 GAGCAGCCTACCTGTCACT GTATTACACGGGAGGTACGA 225 NA
GF137 G4QAAT301AWL9D (CTG)5 TTCATGCAAACTCAAAAGTG ACATGGGAAGTGTAGACAGG 225 NA
GF151 G4QAAT301BUQ69A (CTG)5 AAACAGAAGGTGAATGCTGT GTAGCTGTGCACCTCACC 241 60°c
University of Ghana http://ugspace.ug.edu.gh
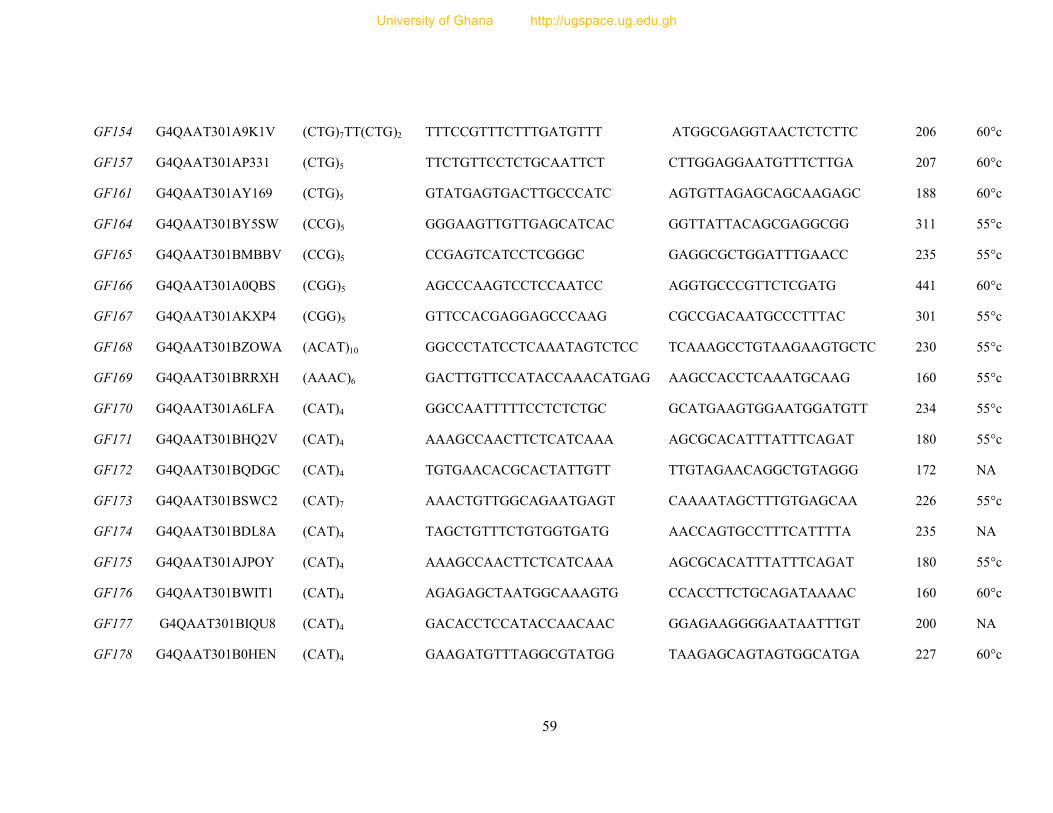
59
GF154 G4QAAT301A9K1V (CTG)7TT(CTG)2 TTTCCGTTTCTTTGATGTTT ATGGCGAGGTAACTCTCTTC 206 60°c
GF157 G4QAAT301AP331 (CTG)5 TTCTGTTCCTCTGCAATTCT CTTGGAGGAATGTTTCTTGA 207 60°c
GF161 G4QAAT301AY169 (CTG)5 GTATGAGTGACTTGCCCATC AGTGTTAGAGCAGCAAGAGC 188 60°c
GF164 G4QAAT301BY5SW (CCG)5 GGGAAGTTGTTGAGCATCAC GGTTATTACAGCGAGGCGG 311 55°c
GF165 G4QAAT301BMBBV (CCG)5 CCGAGTCATCCTCGGGC GAGGCGCTGGATTTGAACC 235 55°c
GF166 G4QAAT301A0QBS (CGG)5 AGCCCAAGTCCTCCAATCC AGGTGCCCGTTCTCGATG 441 60°c
GF167 G4QAAT301AKXP4 (CGG)5 GTTCCACGAGGAGCCCAAG CGCCGACAATGCCCTTTAC 301 55°c
GF168 G4QAAT301BZOWA (ACAT)10 GGCCCTATCCTCAAATAGTCTCC TCAAAGCCTGTAAGAAGTGCTC 230 55°c
GF169 G4QAAT301BRRXH (AAAC)6 GACTTGTTCCATACCAAACATGAG AAGCCACCTCAAATGCAAG 160 55°c
GF170 G4QAAT301A6LFA (CAT)4 GGCCAATTTTTCCTCTCTGC GCATGAAGTGGAATGGATGTT 234 55°c
GF171 G4QAAT301BHQ2V (CAT)4 AAAGCCAACTTCTCATCAAA AGCGCACATTTATTTCAGAT 180 55°c
GF172 G4QAAT301BQDGC (CAT)4 TGTGAACACGCACTATTGTT TTGTAGAACAGGCTGTAGGG 172 NA
GF173 G4QAAT301BSWC2 (CAT)7 AAACTGTTGGCAGAATGAGT CAAAATAGCTTTGTGAGCAA 226 55°c
GF174 G4QAAT301BDL8A (CAT)4 TAGCTGTTTCTGTGGTGATG AACCAGTGCCTTTCATTTTA 235 NA
GF175 G4QAAT301AJPOY (CAT)4 AAAGCCAACTTCTCATCAAA AGCGCACATTTATTTCAGAT 180 55°c
GF176 G4QAAT301BWIT1 (CAT)4 AGAGAGCTAATGGCAAAGTG CCACCTTCTGCAGATAAAAC 160 60°c
GF177 G4QAAT301BIQU8 (CAT)4 GACACCTCCATACCAACAAC GGAGAAGGGGAATAATTTGT 200 NA
GF178 G4QAAT301B0HEN (CAT)4 GAAGATGTTTAGGCGTATGG TAAGAGCAGTAGTGGCATGA 227 60°c
University of Ghana http://ugspace.ug.edu.gh
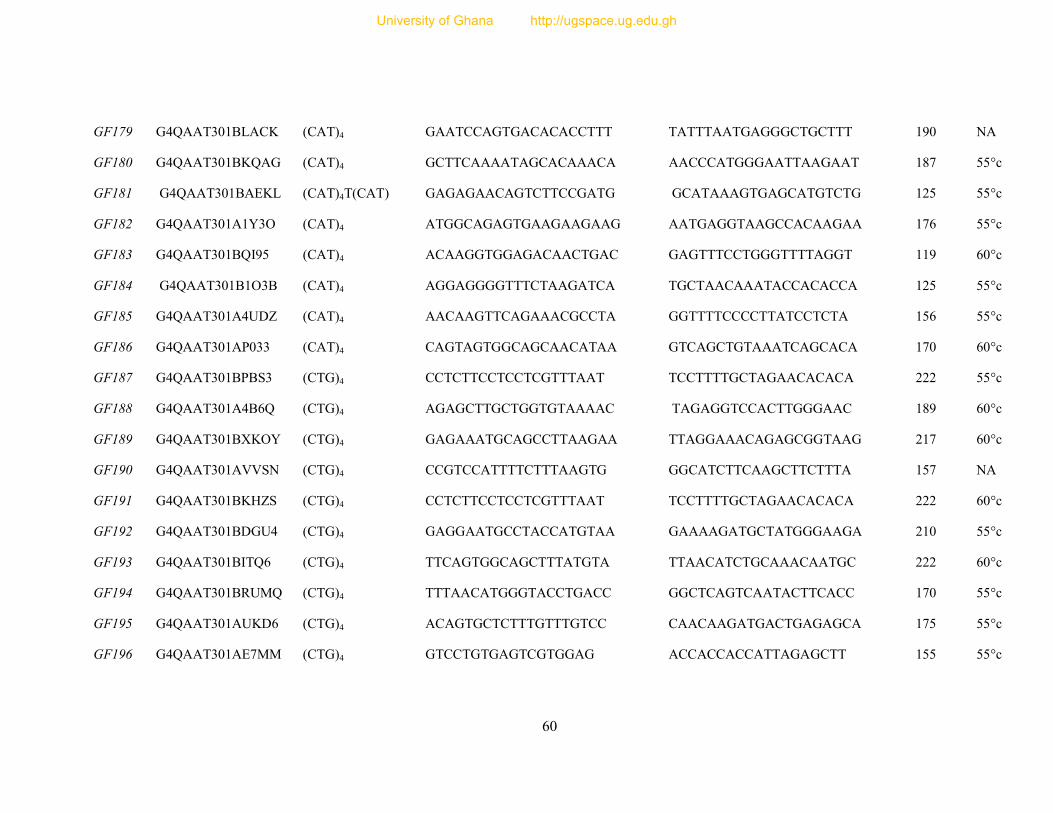
60
GF179 G4QAAT301BLACK (CAT)4 GAATCCAGTGACACACCTTT TATTTAATGAGGGCTGCTTT 190 NA
GF180 G4QAAT301BKQAG (CAT)4 GCTTCAAAATAGCACAAACA AACCCATGGGAATTAAGAAT 187 55°c
GF181 G4QAAT301BAEKL (CAT)4T(CAT) GAGAGAACAGTCTTCCGATG GCATAAAGTGAGCATGTCTG 125 55°c
GF182 G4QAAT301A1Y3O (CAT)4 ATGGCAGAGTGAAGAAGAAG AATGAGGTAAGCCACAAGAA 176 55°c
GF183 G4QAAT301BQI95 (CAT)4 ACAAGGTGGAGACAACTGAC GAGTTTCCTGGGTTTTAGGT 119 60°c
GF184 G4QAAT301B1O3B (CAT)4 AGGAGGGGTTTCTAAGATCA TGCTAACAAATACCACACCA 125 55°c
GF185 G4QAAT301A4UDZ (CAT)4 AACAAGTTCAGAAACGCCTA GGTTTTCCCCTTATCCTCTA 156 55°c
GF186 G4QAAT301AP033 (CAT)4 CAGTAGTGGCAGCAACATAA GTCAGCTGTAAATCAGCACA 170 60°c
GF187 G4QAAT301BPBS3 (CTG)4 CCTCTTCCTCCTCGTTTAAT TCCTTTTGCTAGAACACACA 222 55°c
GF188 G4QAAT301A4B6Q (CTG)4 AGAGCTTGCTGGTGTAAAAC TAGAGGTCCACTTGGGAAC 189 60°c
GF189 G4QAAT301BXKOY (CTG)4 GAGAAATGCAGCCTTAAGAA TTAGGAAACAGAGCGGTAAG 217 60°c
GF190 G4QAAT301AVVSN (CTG)4 CCGTCCATTTTCTTTAAGTG GGCATCTTCAAGCTTCTTTA 157 NA
GF191 G4QAAT301BKHZS (CTG)4 CCTCTTCCTCCTCGTTTAAT TCCTTTTGCTAGAACACACA 222 60°c
GF192 G4QAAT301BDGU4 (CTG)4 GAGGAATGCCTACCATGTAA GAAAAGATGCTATGGGAAGA 210 55°c
GF193 G4QAAT301BITQ6 (CTG)4 TTCAGTGGCAGCTTTATGTA TTAACATCTGCAAACAATGC 222 60°c
GF194 G4QAAT301BRUMQ (CTG)4 TTTAACATGGGTACCTGACC GGCTCAGTCAATACTTCACC 170 55°c
GF195 G4QAAT301AUKD6 (CTG)4 ACAGTGCTCTTTGTTTGTCC CAACAAGATGACTGAGAGCA 175 55°c
GF196 G4QAAT301AE7MM (CTG)4 GTCCTGTGAGTCGTGGAG ACCACCACCATTAGAGCTT 155 55°c
University of Ghana http://ugspace.ug.edu.gh
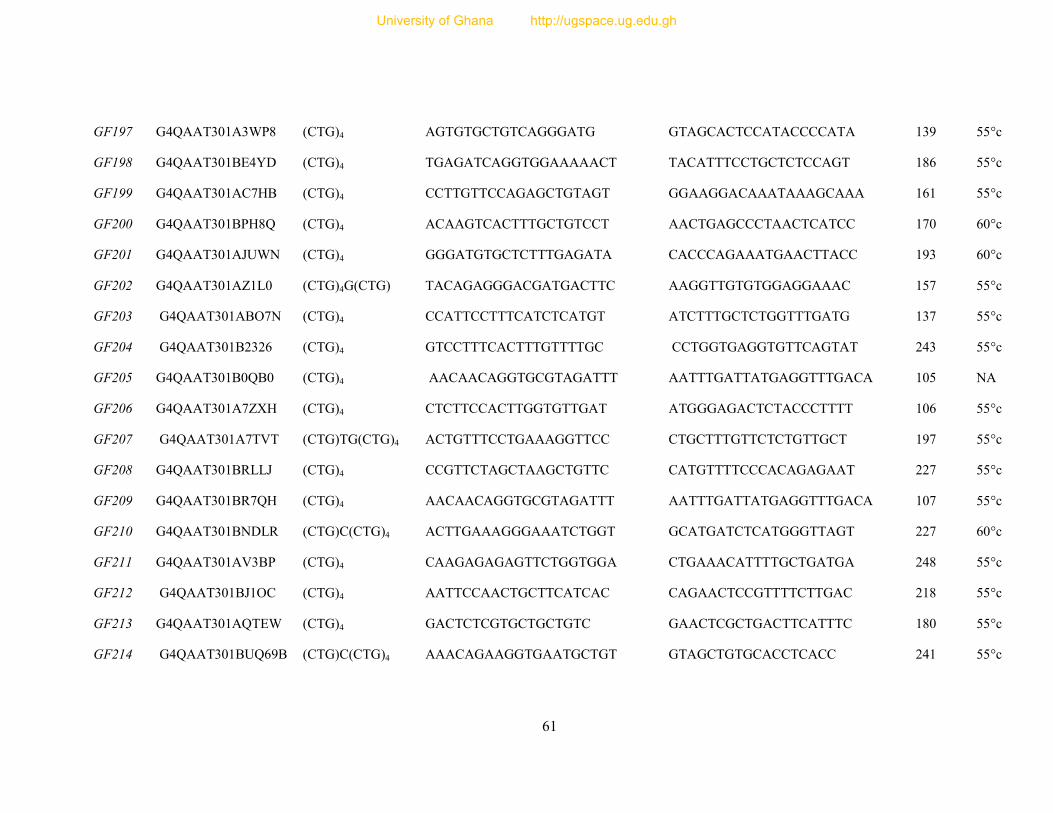
61
GF197 G4QAAT301A3WP8 (CTG)4 AGTGTGCTGTCAGGGATG GTAGCACTCCATACCCCATA 139 55°c
GF198 G4QAAT301BE4YD (CTG)4 TGAGATCAGGTGGAAAAACT TACATTTCCTGCTCTCCAGT 186 55°c
GF199 G4QAAT301AC7HB (CTG)4 CCTTGTTCCAGAGCTGTAGT GGAAGGACAAATAAAGCAAA 161 55°c
GF200 G4QAAT301BPH8Q (CTG)4 ACAAGTCACTTTGCTGTCCT AACTGAGCCCTAACTCATCC 170 60°c
GF201 G4QAAT301AJUWN (CTG)4 GGGATGTGCTCTTTGAGATA CACCCAGAAATGAACTTACC 193 60°c
GF202 G4QAAT301AZ1L0 (CTG)4G(CTG) TACAGAGGGACGATGACTTC AAGGTTGTGTGGAGGAAAC 157 55°c
GF203 G4QAAT301ABO7N (CTG)4 CCATTCCTTTCATCTCATGT ATCTTTGCTCTGGTTTGATG 137 55°c
GF204 G4QAAT301B2326 (CTG)4 GTCCTTTCACTTTGTTTTGC CCTGGTGAGGTGTTCAGTAT 243 55°c
GF205 G4QAAT301B0QB0 (CTG)4 AACAACAGGTGCGTAGATTT AATTTGATTATGAGGTTTGACA 105 NA
GF206 G4QAAT301A7ZXH (CTG)4 CTCTTCCACTTGGTGTTGAT ATGGGAGACTCTACCCTTTT 106 55°c
GF207 G4QAAT301A7TVT (CTG)TG(CTG)4 ACTGTTTCCTGAAAGGTTCC CTGCTTTGTTCTCTGTTGCT 197 55°c
GF208 G4QAAT301BRLLJ (CTG)4 CCGTTCTAGCTAAGCTGTTC CATGTTTTCCCACAGAGAAT 227 55°c
GF209 G4QAAT301BR7QH (CTG)4 AACAACAGGTGCGTAGATTT AATTTGATTATGAGGTTTGACA 107 55°c
GF210 G4QAAT301BNDLR (CTG)C(CTG)4 ACTTGAAAGGGAAATCTGGT GCATGATCTCATGGGTTAGT 227 60°c
GF211 G4QAAT301AV3BP (CTG)4 CAAGAGAGAGTTCTGGTGGA CTGAAACATTTTGCTGATGA 248 55°c
GF212 G4QAAT301BJ1OC (CTG)4 AATTCCAACTGCTTCATCAC CAGAACTCCGTTTTCTTGAC 218 55°c
GF213 G4QAAT301AQTEW (CTG)4 GACTCTCGTGCTGCTGTC GAACTCGCTGACTTCATTTC 180 55°c
GF214 G4QAAT301BUQ69B (CTG)C(CTG)4 AAACAGAAGGTGAATGCTGT GTAGCTGTGCACCTCACC 241 55°c
University of Ghana http://ugspace.ug.edu.gh
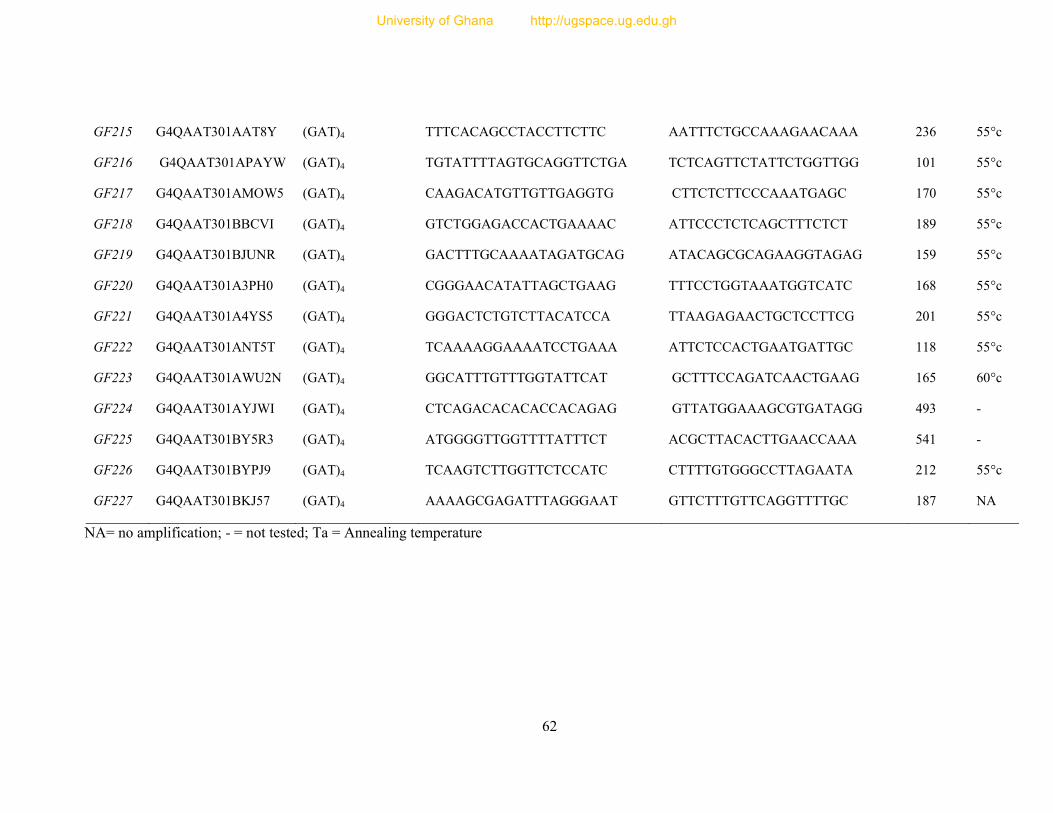
62
GF215 G4QAAT301AAT8Y (GAT)4 TTTCACAGCCTACCTTCTTC AATTTCTGCCAAAGAACAAA 236 55°c
GF216 G4QAAT301APAYW (GAT)4 TGTATTTTAGTGCAGGTTCTGA TCTCAGTTCTATTCTGGTTGG 101 55°c
GF217 G4QAAT301AMOW5 (GAT)4 CAAGACATGTTGTTGAGGTG CTTCTCTTCCCAAATGAGC 170 55°c
GF218 G4QAAT301BBCVI (GAT)4 GTCTGGAGACCACTGAAAAC ATTCCCTCTCAGCTTTCTCT 189 55°c
GF219 G4QAAT301BJUNR (GAT)4 GACTTTGCAAAATAGATGCAG ATACAGCGCAGAAGGTAGAG 159 55°c
GF220 G4QAAT301A3PH0 (GAT)4 CGGGAACATATTAGCTGAAG TTTCCTGGTAAATGGTCATC 168 55°c
GF221 G4QAAT301A4YS5 (GAT)4 GGGACTCTGTCTTACATCCA TTAAGAGAACTGCTCCTTCG 201 55°c
GF222 G4QAAT301ANT5T (GAT)4 TCAAAAGGAAAATCCTGAAA ATTCTCCACTGAATGATTGC 118 55°c
GF223 G4QAAT301AWU2N (GAT)4 GGCATTTGTTTGGTATTCAT GCTTTCCAGATCAACTGAAG 165 60°c
GF224 G4QAAT301AYJWI (GAT)4 CTCAGACACACACCACAGAG GTTATGGAAAGCGTGATAGG 493 -
GF225 G4QAAT301BY5R3 (GAT)4 ATGGGGTTGGTTTTATTTCT ACGCTTACACTTGAACCAAA 541 -
GF226 G4QAAT301BYPJ9 (GAT)4 TCAAGTCTTGGTTCTCCATC CTTTTGTGGGCCTTAGAATA 212 55°c
GF227 G4QAAT301BKJ57 (GAT)4 AAAAGCGAGATTTAGGGAAT GTTCTTTGTTCAGGTTTTGC 187 NA
NA= no amplification; - = not tested; Ta = Annealing temperature
University of Ghana http://ugspace.ug.edu.gh
63
4.4 Genotyping
The genotypes of 32 unrelated individuals at 38 selected loci indicated that 31 loci
were polymorphic while the remaining 7 loci were monomorphic. For instance, as
shown by the electropherogram in Figure 12, locus GF75 was polymorphic with two
alleles (232 bp and 236 bp) which were observed in the homozygous and
heterozygous states in the 32 birds. On the other hand, locus GF46 is an example of a
monomorphic marker occurring as one allele (131 bp) in all the 32 individuals
genotyped (Figure 13). Of the 31 polymorphic markers, 23 (74.2%) were di- repeats,
7 (22.6%) were tri- repeats and 1 (3.2%) was a tetranucleotide repeat. The genotypes
of all 38 loci are shown in Appendix IV.
University of Ghana http://ugspace.ug.edu.gh
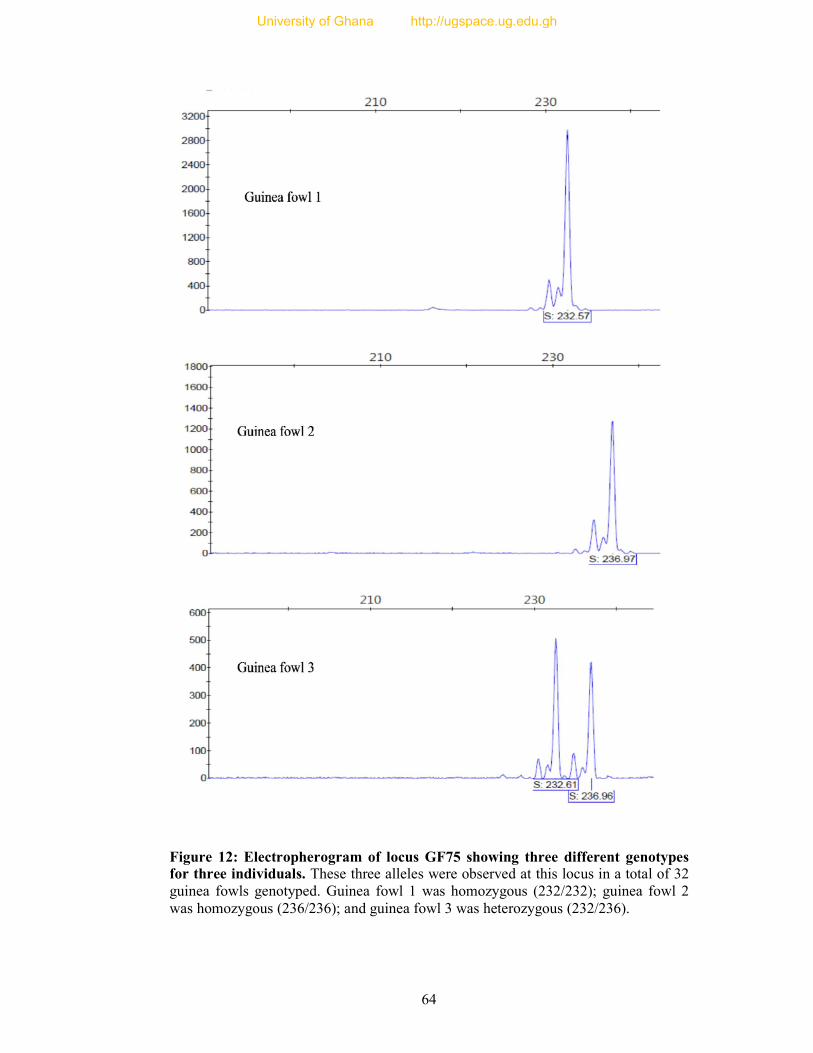
64
Figure 12: Electropherogram of locus GF75 showing three different genotypes for three individuals. These three alleles were observed at this locus in a total of 32 guinea fowls genotyped. Guinea fowl 1 was homozygous (232/232); guinea fowl 2 was homozygous (236/236); and guinea fowl 3 was heterozygous (232/236).
University of Ghana http://ugspace.ug.edu.gh
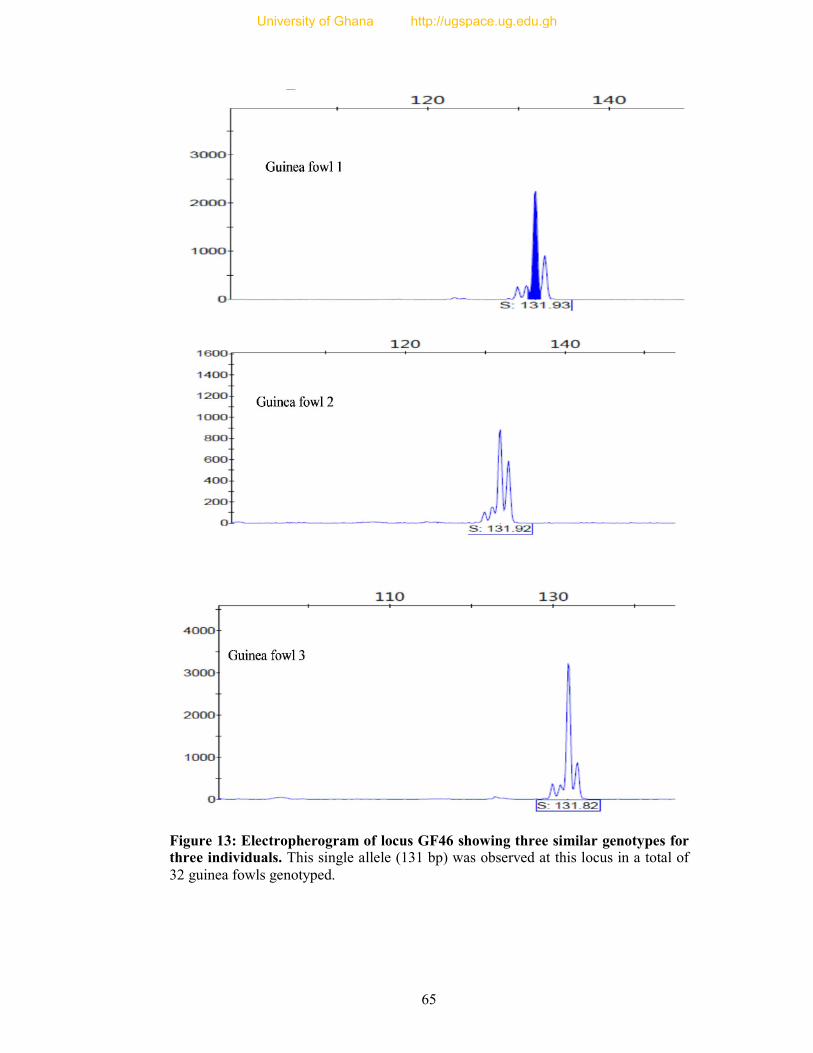
65
Figure 13: Electropherogram of locus GF46 showing three similar genotypes for three individuals. This single allele (131 bp) was observed at this locus in a total of 32 guinea fowls genotyped.
University of Ghana http://ugspace.ug.edu.gh
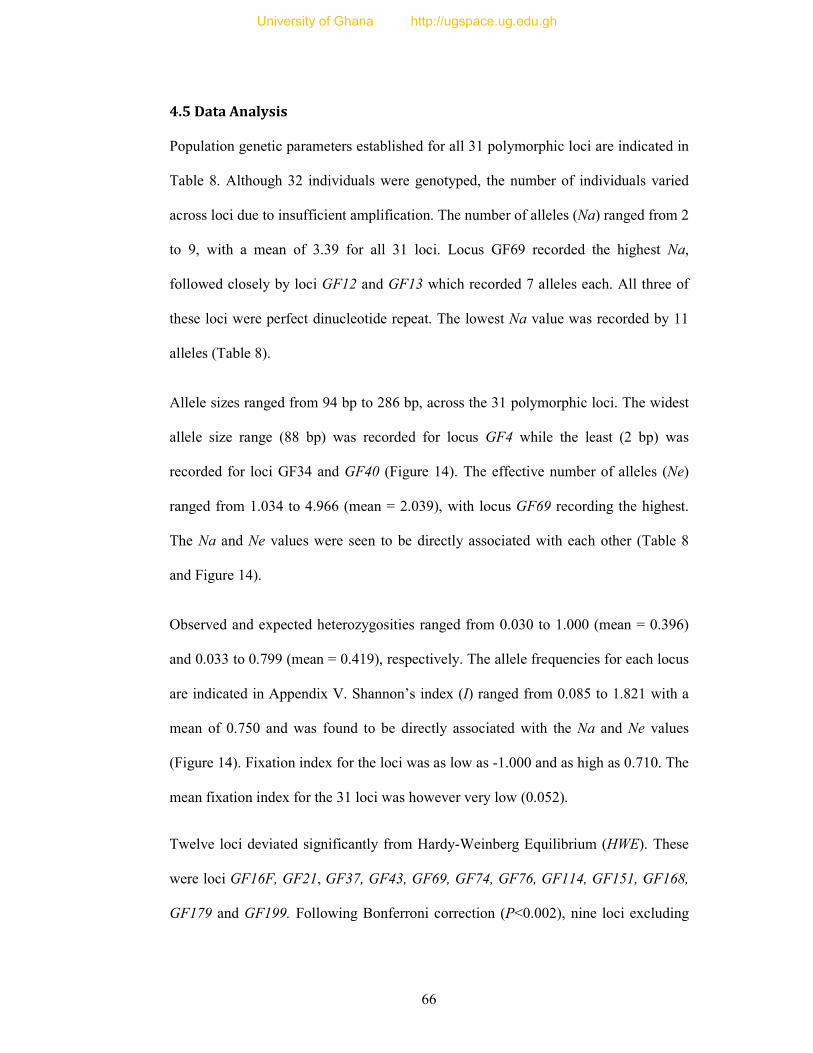
66
4.5 Data Analysis
Population genetic parameters established for all 31 polymorphic loci are indicated in
Table 8. Although 32 individuals were genotyped, the number of individuals varied
across loci due to insufficient amplification. The number of alleles (Na) ranged from 2
to 9, with a mean of 3.39 for all 31 loci. Locus GF69 recorded the highest Na,
followed closely by loci GF12 and GF13 which recorded 7 alleles each. All three of
these loci were perfect dinucleotide repeat. The lowest Na value was recorded by 11
alleles (Table 8).
Allele sizes ranged from 94 bp to 286 bp, across the 31 polymorphic loci. The widest
allele size range (88 bp) was recorded for locus GF4 while the least (2 bp) was
recorded for loci GF34 and GF40 (Figure 14). The effective number of alleles (Ne)
ranged from 1.034 to 4.966 (mean = 2.039), with locus GF69 recording the highest.
The Na and Ne values were seen to be directly associated with each other (Table 8
and Figure 14).
Observed and expected heterozygosities ranged from 0.030 to 1.000 (mean = 0.396)
and 0.033 to 0.799 (mean = 0.419), respectively. The allele frequencies for each locus
are indicated in Appendix V. Shannon’s index (I) ranged from 0.085 to 1.821 with a
mean of 0.750 and was found to be directly associated with the Na and Ne values
(Figure 14). Fixation index for the loci was as low as -1.000 and as high as 0.710. The
mean fixation index for the 31 loci was however very low (0.052).
Twelve loci deviated significantly from Hardy-Weinberg Equilibrium (HWE). These
were loci GF16F, GF21, GF37, GF43, GF69, GF74, GF76, GF114, GF151, GF168,
GF179 and GF199. Following Bonferroni correction (P<0.002), nine loci excluding
University of Ghana http://ugspace.ug.edu.gh
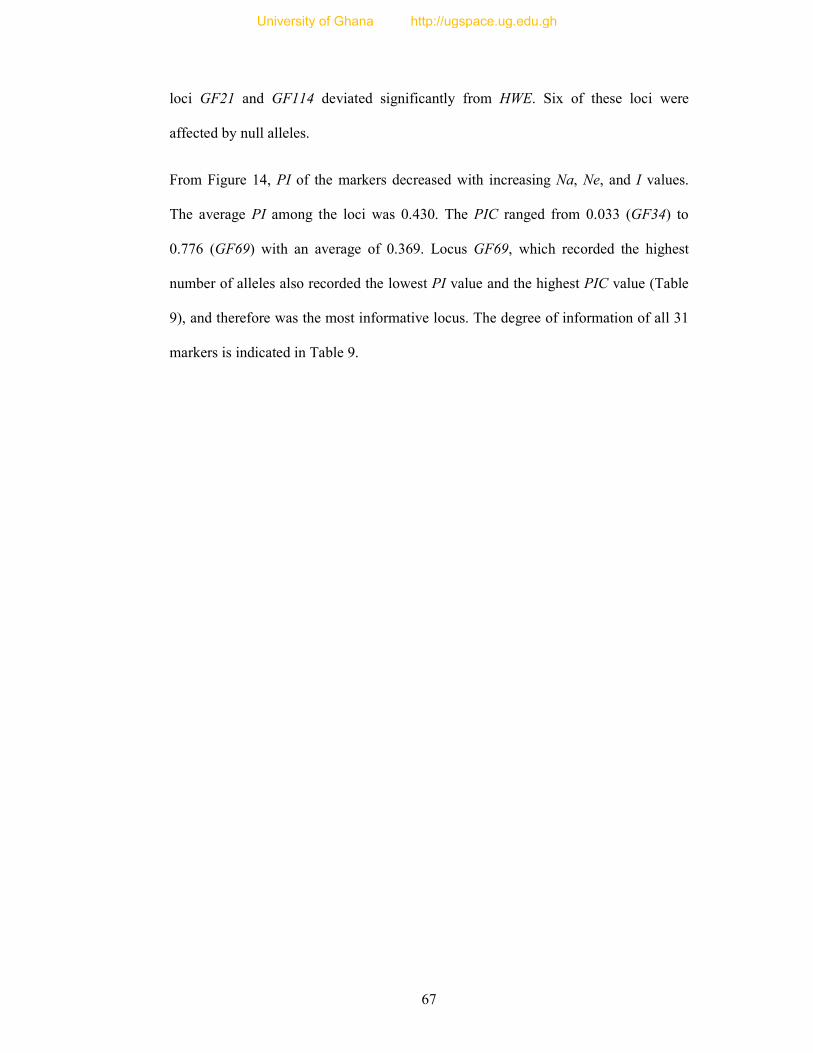
67
loci GF21 and GF114 deviated significantly from HWE. Six of these loci were
affected by null alleles.
From Figure 14, PI of the markers decreased with increasing Na, Ne, and I values.
The average PI among the loci was 0.430. The PIC ranged from 0.033 (GF34) to
0.776 (GF69) with an average of 0.369. Locus GF69, which recorded the highest
number of alleles also recorded the lowest PI value and the highest PIC value (Table
9), and therefore was the most informative locus. The degree of information of all 31
markers is indicated in Table 9.
University of Ghana http://ugspace.ug.edu.gh

68
Table 8: Profile of 31 polymorphic loci
Locus Repeat motif
Allele size
range (bp) N Na Ne Ho He F
HWE (P-
value) NAF I PI PIC
GF2 (CA)10 192-196 31 2 1.29 0.258 0.225 -0.148 0.409 0.000 0.385 0.630 0.200
GF4 (CA)12GA(CA)5 125-213 32 2 1.28 0.250 0.219 -0.143 0.419 0.000 0.377 0.630 0.195
GF5 (CA)13 164-168 32 3 2.48 0.750 0.597 -0.256 0.166 0.000 0.978 0.250 0.514
GF12 (CA)11 94-110 32 7 4.27 0.719 0.766 0.061 0.467 0.008 1.635 0.090 0.735
GF13 (CA)14 116-152 32 7 4.31 0.656 0.768 0.146 0.097 0.057 1.600 0.090 0.736
GF15 (CA)11 164-172 22 2 1.10 0.091 0.087 -0.048 0.823 0.000 0.185 0.840 0.082
GF16 (ATC)7 169-172 32 2 1.48 0.094 0.324 0.710 0.000* 0.199 0.505 0.510 0.271
GF17 (GT)11 206-214 32 3 2.18 0.531 0.542 0.019 0.179 0.035 0.883 0.290 0.457
GF19 (GT)13 142-147 31 2 1.93 0.548 0.481 -0.139 0.437 0.000 0.674 0.380 0.365
GF20 (GT)13 108-116 31 4 2.46 0.613 0.594 -0.032 0.413 0.021 1.035 0.230 0.525
GF21 (GT)10 242-246 26 3 1.26 0.192 0.208 0.075 0.021 0.000 0.410 0.640 0.192
University of Ghana http://ugspace.ug.edu.gh
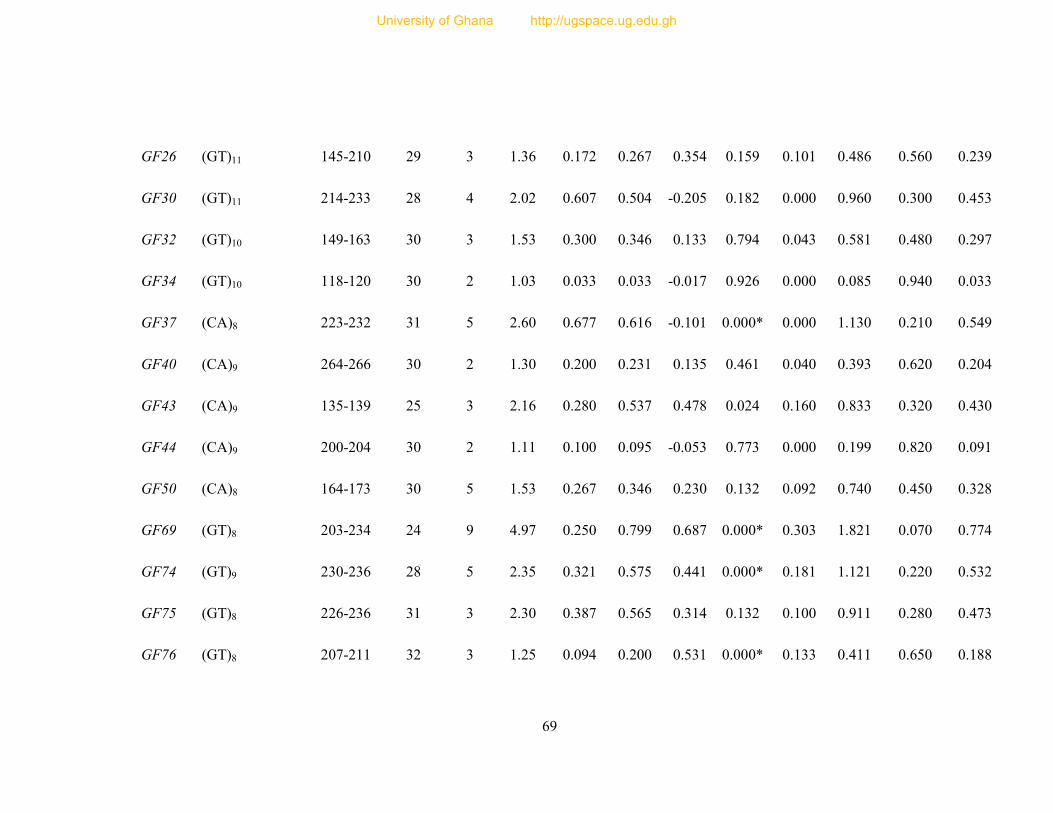
69
GF26 (GT)11 145-210 29 3 1.36 0.172 0.267 0.354 0.159 0.101 0.486 0.560 0.239
GF30 (GT)11 214-233 28 4 2.02 0.607 0.504 -0.205 0.182 0.000 0.960 0.300 0.453
GF32 (GT)10 149-163 30 3 1.53 0.300 0.346 0.133 0.794 0.043 0.581 0.480 0.297
GF34 (GT)10 118-120 30 2 1.03 0.033 0.033 -0.017 0.926 0.000 0.085 0.940 0.033
GF37 (CA)8 223-232 31 5 2.60 0.677 0.616 -0.101 0.000* 0.000 1.130 0.210 0.549
GF40 (CA)9 264-266 30 2 1.30 0.200 0.231 0.135 0.461 0.040 0.393 0.620 0.204
GF43 (CA)9 135-139 25 3 2.16 0.280 0.537 0.478 0.024 0.160 0.833 0.320 0.430
GF44 (CA)9 200-204 30 2 1.11 0.100 0.095 -0.053 0.773 0.000 0.199 0.820 0.091
GF50 (CA)8 164-173 30 5 1.53 0.267 0.346 0.230 0.132 0.092 0.740 0.450 0.328
GF69 (GT)8 203-234 24 9 4.97 0.250 0.799 0.687 0.000* 0.303 1.821 0.070 0.774
GF74 (GT)9 230-236 28 5 2.35 0.321 0.575 0.441 0.000* 0.181 1.121 0.220 0.532
GF75 (GT)8 226-236 31 3 2.30 0.387 0.565 0.314 0.132 0.100 0.911 0.280 0.473
GF76 (GT)8 207-211 32 3 1.25 0.094 0.200 0.531 0.000* 0.133 0.411 0.650 0.188
University of Ghana http://ugspace.ug.edu.gh
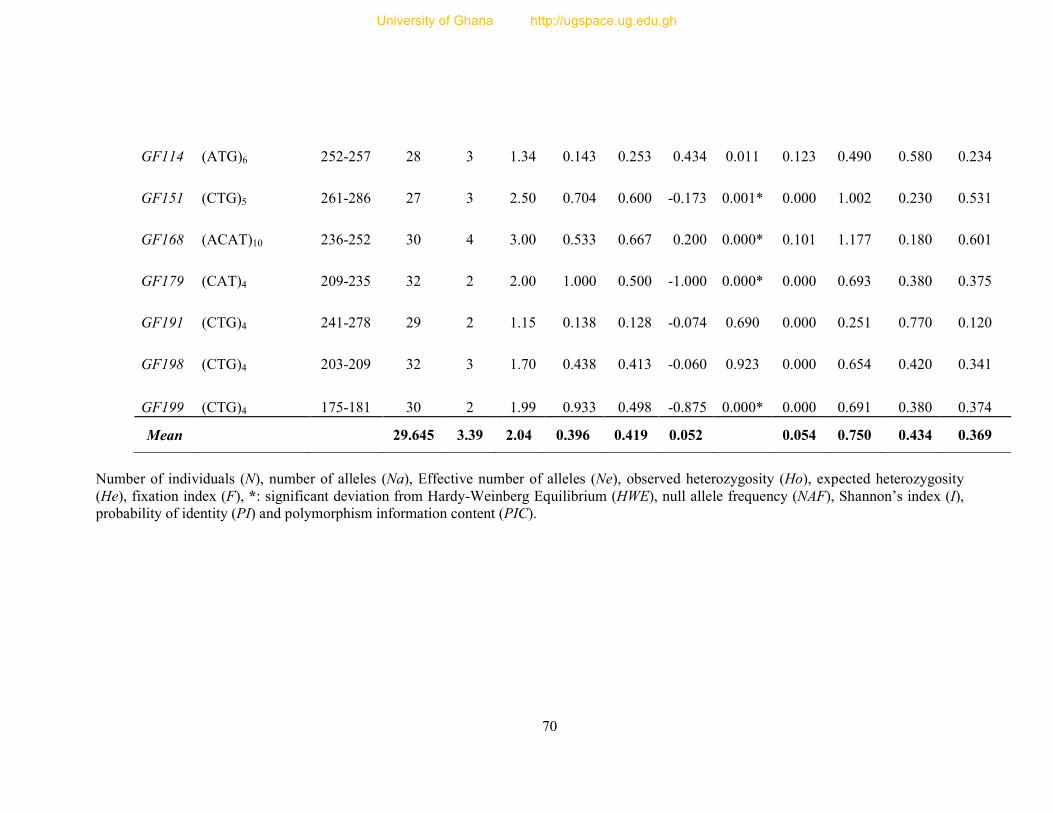
70
GF114 (ATG)6 252-257 28 3 1.34 0.143 0.253 0.434 0.011 0.123 0.490 0.580 0.234
GF151 (CTG)5 261-286 27 3 2.50 0.704 0.600 -0.173 0.001* 0.000 1.002 0.230 0.531
GF168 (ACAT)10 236-252 30 4 3.00 0.533 0.667 0.200 0.000* 0.101 1.177 0.180 0.601
GF179 (CAT)4 209-235 32 2 2.00 1.000 0.500 -1.000 0.000* 0.000 0.693 0.380 0.375
GF191 (CTG)4 241-278 29 2 1.15 0.138 0.128 -0.074 0.690 0.000 0.251 0.770 0.120
GF198 (CTG)4 203-209 32 3 1.70 0.438 0.413 -0.060 0.923 0.000 0.654 0.420 0.341
GF199 (CTG)4 175-181 30 2 1.99 0.933 0.498 -0.875 0.000* 0.000 0.691 0.380 0.374
Mean
29.645 3.39 2.04 0.396 0.419 0.052
0.054 0.750 0.434 0.369
Number of individuals (N), number of alleles (Na), Effective number of alleles (Ne), observed heterozygosity (Ho), expected heterozygosity (He), fixation index (F), *: significant deviation from Hardy-Weinberg Equilibrium (HWE), null allele frequency (NAF), Shannon’s index (I), probability of identity (PI) and polymorphism information content (PIC).
University of Ghana http://ugspace.ug.edu.gh
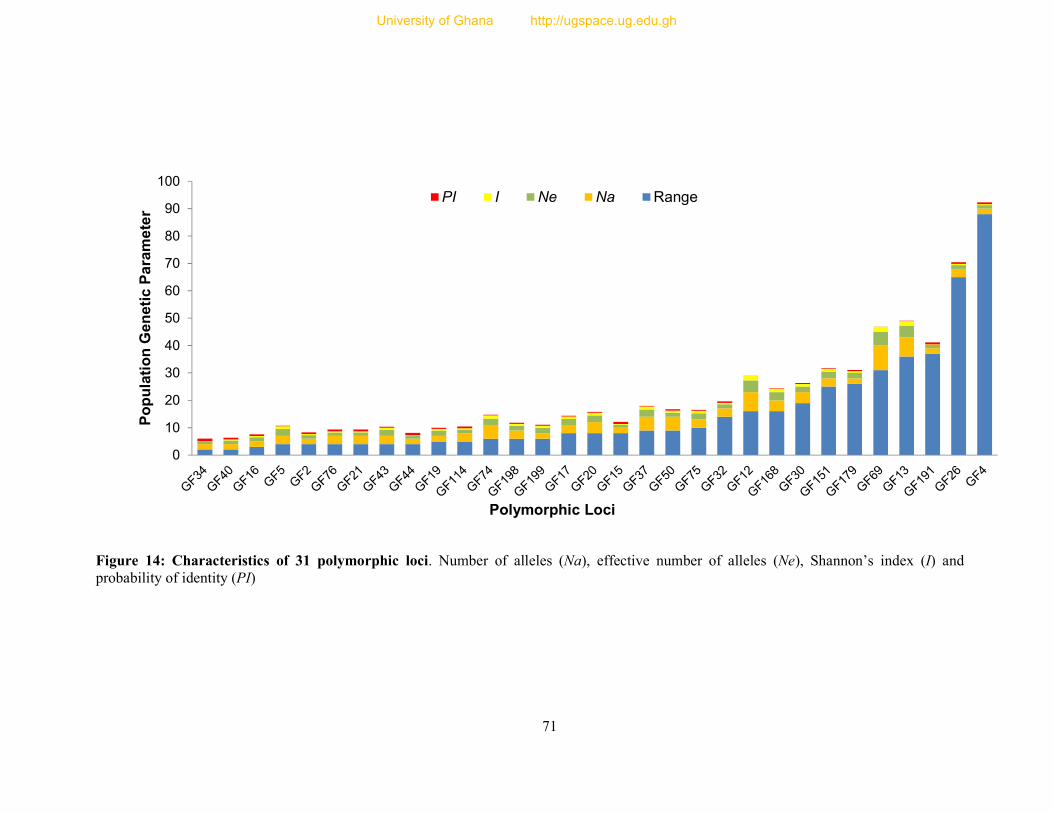
71
Figure 14: Characteristics of 31 polymorphic loci. Number of alleles (Na), effective number of alleles (Ne), Shannon’s index (I) and probability of identity (PI)
0
10
20
30
40
50
60
70
80
90
100
Po
pu
lati
on
Gen
eti
c P
ara
me
ter
Polymorphic Loci
PI I Ne Na Range
University of Ghana http://ugspace.ug.edu.gh
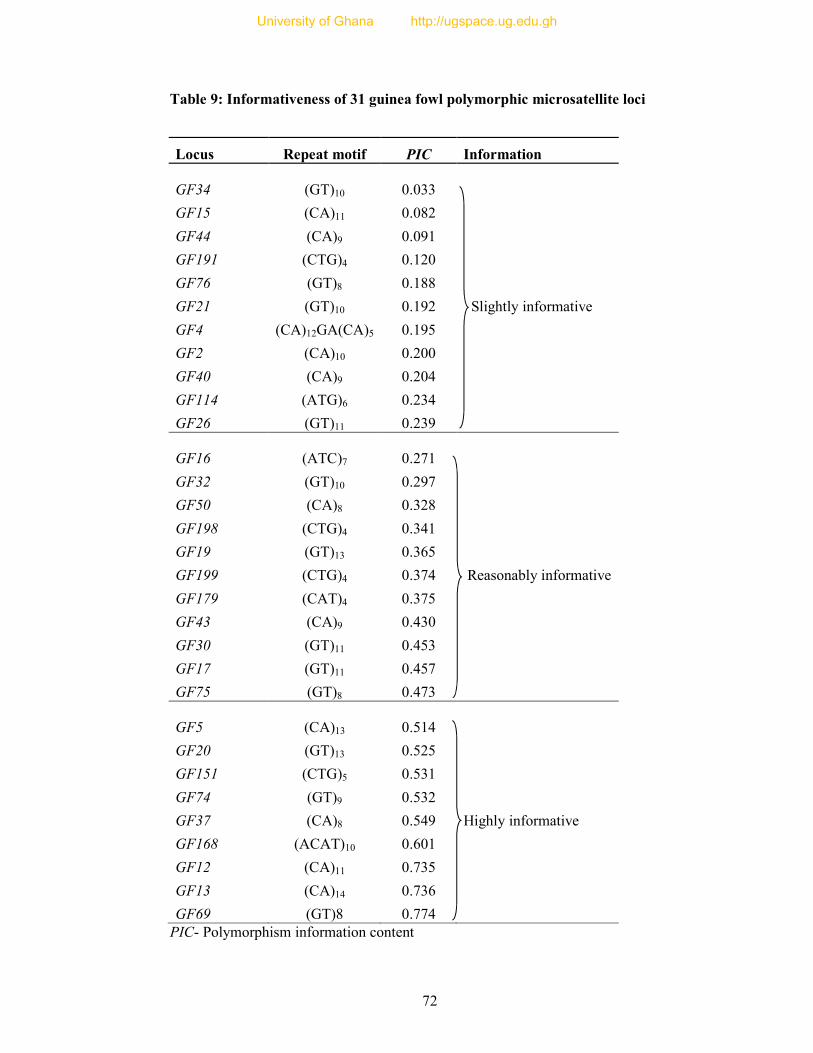
72
Table 9: Informativeness of 31 guinea fowl polymorphic microsatellite loci
Locus Repeat motif PIC Information
GF34 (GT)10
0.033
GF15 (CA)11 0.082
GF44 (CA)9 0.091
GF191 (CTG)4 0.120
GF76 (GT)8 0.188 GF21 (GT)10 0.192 Slightly informative
GF4 (CA)12GA(CA)5 0.195
GF2 (CA)10 0.200
GF40 (CA)9 0.204
GF114 (ATG)6 0.234
GF26 (GT)11 0.239
GF16 (ATC)7
0.271 GF32 (GT)10 0.297
GF50 (CA)8 0.328
GF198 (CTG)4 0.341
GF19 (GT)13 0.365
GF199 (CTG)4 0.374 Reasonably informative
GF179 (CAT)4 0.375
GF43 (CA)9 0.430
GF30 (GT)11 0.453
GF17 (GT)11 0.457
GF75 (GT)8 0.473
GF5 (CA)13
0.514
GF20 (GT)13 0.525
GF151 (CTG)5 0.531
GF74 (GT)9 0.532
GF37 (CA)8 0.549 Highly informative
GF168 (ACAT)10 0.601
GF12 (CA)11 0.735
GF13 (CA)14 0.736
GF69 (GT)8 0.774 PIC- Polymorphism information content
University of Ghana http://ugspace.ug.edu.gh
73
CHAPTER FIVE
5.0 DISCUSSION
5.1 Efficiency of 454 sequencing for microsatellite development in guinea
fowl
Microsatellites occur at low frequencies in some genomes including birds, thereby
increasing the difficulty of their identification and this has limited efforts by previous
researchers who unsuccessfully used the traditional method (B.B. Kayang, personal
communication, June 19, 2013). Regardless of the low occurrence of these markers in
birds, the Sequencing technique used in the present study, rapidly and cost-effectively
identified 105,015 reads containing 1,234 microsatellite sequences. Selkoe et al.
(2006) and Santana et al. (2009) also reported that the 454 sequencing technique
facilitated the identification of a higher number of microsatellite containing sequences
compared to the traditional method.
The isolation process in the present study was done within three days, compared to
the traditional method which could take several months, to generate just a few reads
or none at all. The efficiency of this technique (454 sequencing) for the development
of markers has been reported in several studies (Margulies et al., 2005; Allentoft et
al., 2008; Abdelkrim et al., 2009). On the other hand the use of traditional methods of
microsatellite development (eg. Cloning vectors combined with Sanger sequencing)
has been observed to be time-consuming, technically demanding and considerably
expensive (Crooijimas et al., 1997; Santana et al., 2009; Andrés and Bogdanowicz,
2011; Blair et al., 2012).
The total number of microsatellite sites found (1,234) in the guinea fowl, were low
considering the total number of reads (105,015) found in the library. The number of
University of Ghana http://ugspace.ug.edu.gh
74
microsatellites represented only 1.2% of the total number of reads. A value of 1.3%
(231 of 17,215) microsatellite sequences has also been reported for Blue ducks by
Abdelkrim et al. (2009). This low frequency can be attributed to the generally low
occurrence of microsatellites in birds. This was expected as Neff and Gross (2001),
Baums et al. (2005) and Primmer et al. (1997), reported that microsatellites tend to be
relatively rare, in some insects, birds, bats and corals. An investigation into the basis
for the low frequency of microsatellites in birds, revealed limiting numbers of Poly-A
tails in avian genomes due to the low abundance of interspersed elements which aid in
the transition of Poly-A tails into various repeats (Primmer et al., 1997). The limited
results obtained by previous researchers who used the traditional method, could thus
be attributed to the small percentage of microsatellite sites in the guinea fowl genome
as demonstrated in the present study.
5.2 Characteristics of guinea fowl microsatellite markers
The lower classes of repeats harboured more microsatellites, as indicated in Figure 9.
This is contrary to reports by Tóth et al. (2000) and Ellegren (2004), who reported a
higher proportion of tetra- than trinucleotide repeats in vertebrate genomes including
chicken, duck, fish and frogs. Furthermore, a higher proportion of microsatellites have
also been found in lower classes of repeats in the honey bee (Apis mellifera) (Meglécz
et al., 2012). Santana et al. (2009) also reported that there were no pentanucleotide
repeats in a study involving microsatellite development for Sirex noctilio (a pine-
damaging wasp), and attributed this finding to the low abundance of the markers in
insects. A similar reason could account for the low abundance of penta- and
hexanucleotide repeat classes in the present study.
University of Ghana http://ugspace.ug.edu.gh
75
Mallory (2007) and Schoebel et al. (2013), in similar studies of microsatellite marker
development, stated that the longer the read the higher the possibility of finding a
microsatellite with the flanking regions necessary for primer development. Due to this
finding, repeat lengths of at least four were selected for both tri- and tetranucleotide
repeats whilst lengths of at least seven were selected for dinucleotide repeats in the
present study. Qi et al. (2001), also reported that long repeats, produce polymorphic
PCR products with higher PIC values. Penta- and hexanucleotide repeats were
excluded from the primer design in the present study due to time constraints. Upon
specifying the repeat lengths, 584 selected microsatellite sites, made up of 9 repeat
types were classified into di (294), tri (288) and tetra (2). Dinucleotides still remained
the most common of the 3 classes of repeats (though followed closely by trinucleotide
repeats). A high number of dinucleotide repeats have also been observed in many
studies in insects, birds, mammals and fish (Primmer et al., 1997; Tóth et al., 2000;
Ellegren, 2004; Adenyo et al., 2012).
There was an apparent abundance of CA/GT microsatellite repeats which represented
34.2% (200 of the 584 total number of repeats found) and also among the dinucleotide
repeats in this study. This finding agrees with work done by Tóth et al. (2000),
Ellegren (2004) and Meglécz et al. (2012), who reported that CA/GT is the
commonest type of repeat in most genomes especially eukaryotes, whilst AT repeats
were more common in plants. However, considering the criteria by Ellegren (2004)
who reported on four possible types of dinucleotide repeats, there may still be two
more possible dinucleotide repeats that can be obtained from the library in this study
(i.e. AT/TA, and GC/CG). The next abundant nucleotide repeat after CA/GT was
GCT which represented 18% (105 of 584). This was followed closely by CTG which
represented 17.8% (104 of 584) of the total number of repeats. These two repeats
University of Ghana http://ugspace.ug.edu.gh
76
were also the most common of the trinucleotide repeats. Primmer et al. (1997) also
reported that trinucleotides are found in coding regions and were responsible for
certain neurological diseases in humans including Huntington’s disease (Sermon et
al., 2001). Furthermore, in agreement with the assertion of Tóth et al. (2000) that
CCG/GCC repeats were uncommon in the introns of vertebrates, only eight of this
type of repeat was found in the library in the present study. Although other
tetranucleotide repeat types may exist as shown in reports by Primmer et al. (1997),
Tóth et al. (2000) and Ellegren (2004), only two repeats (AAAC and ACAT) in the
proportions of 1:1 were found in the library in the present study.
Only 26.4% (154 of 584) primer pairs were designed (Table 5), due to cost
constraints. In general, since CA/GT repeats were the commonest repeats, a higher
number of primers (59 of 154) were designed for this repeat type (Table 5). Moreover,
according to Ellegren (2004) most polymorphic repeats are CA/GT repeats. Therefore
to save cost, primers were not designed for any other dinucleotide repeat even though
GA repeats (94) were also found. Among the trinucleotide repeats, 45.5% (70 of 154)
of the primers designed were of equal proportions of ATC/GAT and CTG repeat
primers.
The number of perfect repeats [142 out of 154 primers (92.2%)] was on the higher
side compared to the number of imperfect repeats 12 out of 154 primers7.8% (Figure
10). This was anticipated as Kutil and Williams (2001) reported that perfect repeats
are more persistent in genomes. The number of perfect repeats observed, was higher
than the 73% reported by Kayang et al. (2000) for quail. Although the number of
imperfect repeats found in this study was lower than the 20% found by Kayang et al.
(2000), the general trend of higher proportion of perfect repeats to imperfect repeats
University of Ghana http://ugspace.ug.edu.gh
77
was clear. The type of enrichment procedure has been reported by Van de Wiel et al.
(1999 to directly influence the nature of repeat (perfect, compound or imperfect). This
implies that the enrichment procedure used in this study was highly successful.
Notwithstanding the influence of the enrichment procedure on the nature of the
repeats, it is also highly possible that the high number of perfect repeats recorded in
this study could be due to the stability or conservation of the sequences (Moriguchi et
al., 2003).
Two primers (GF223 and GF224) were excluded from the primer test because the
expected product sizes were too large (493 and 541). Approximately 79.2% of the
primers (122 of 154) successfully amplified in at least one of the two temperatures
tested. This was lower than the 86% (n = 22) observed in the El Oro parakeet (an
endangered parrot species) and higher than the 78% (n = 51) observed in the blackcap
(a songbird), both in a study by Schoebel et al. (2013). Of these 152 markers that
were tested, 77 (50.7%) showed clearer bands at 55 ºC whilst 45 (29.6%) showed
clearer bands at 60 ºC making a total of 122 optimised primers. Of the 122 optimised
primers 6.6% (8 of 122) were imperfect repeats whilst 93.4% (114 of 122) were
perfect repeats. The remaining 30 of the 154 markers designed (19.7%) failed to
amplify at either 55 ºC or 60 ºC but it is possible they may amplify at other
temperatures. This variation may be due to the different nucleotide sequence
composition of the primers. Moreover, it has been established by Mitsuhashi (1996)
that the G-C content of primer sequence increases stability of the primers. A higher
melting temperature will therefore be required for such primers than those that have a
higher A-T content (www.premierbiosoft.com, accessed February 31, 2013). On the
other hand, a lower melting temperature will be required if the A-T content is high.
Studies by Smulders et al. (1997) have also shown that the occurrence of null alleles
University of Ghana http://ugspace.ug.edu.gh
78
could also result in the failure of primers to amplify during optimization. These occur
when the flanking sequences of microsatellites diverge or change. Deletion of
microsatellites at specific loci, according to Callen et al. (1993), may also cause null
alleles to occur.
5.3 Allelic diversity of microsatellites in guinea fowl
Thirty-one out of 38 loci (81.6%) were polymorphic when genotyped in 32 unrelated
guinea fowls in this study. This was similar to the 87.1 % (61 of 70 markers) reported
for ostrich. The value was higher than the 31.3 % (15 of 48 markers) reported for
Noicy miners (Kopps et al., 2013), but lower than the 90.3 % (28 of 31 markers)
reported by Huang et al. (2005) for ducks.
Dinucleotide microsatellites have been the favourite of many researchers because they
are known to be characterised by higher repeat numbers (Li et al., 2004) which makes
them the most polymorphic (Ellegren, 2004). In contrast, similar studies by Tóth et al.
(2000) reported trinucleotide repeats as the most abundant but had fewer repeat
numbers (Thiel et al., 2003). The high proportion of polymorphic dinucleotides was
obvious in this study and is in agreement with work by Ellegren (2004).
The allele size range of 94 to 286 bp is comparable to work done by Kayang et al.
(2002), who obtained 147 to 317 bp for quail microsatellites that cross amplified in
guinea fowl. However, it is probable that more polymorphic markers exist beyond the
allele size range found in the present study since Kayang et al. (2002) used more
markers (100), compared to the present study. Locus GF4 which was the only
imperfect polymorphic repeat [(CA)12GA(CA)5], recorded the widest allele size range
(125 to 213), as indicated in Figure 14. This was followed by locus GF26 (145 to
210), GF191 (241 to 278), GF13 (116 to152) and GF69 (203 to 234). This suggests
University of Ghana http://ugspace.ug.edu.gh
79
the ability of marker GF4 to amplify a wide array of alleles in diversity studies.
However, imperfect and compound repeats are known to be caused by mutations and
deletions (Kutil and Williams, 2001; Moriguchi et al., 2003) and this may account for
the wide range observed for this locus. Nevertheless, this result suggests that GF4
could be used for studying the evolutionary patterns of the guinea fowl genome
(Zhang et al., 2012).
The Na value of 2 to 9 (mean = 3.39) was similar to the 2 to 9 alleles (mean = 4.00)
reported by Croooijimas et al. (1997) in chicken, but higher than the 1 to 6 alleles
(mean = 3.7) obtained by Kayang et al. (2002) for quail. The 105 alleles observed in
the present study for the 31 loci was lower than the 117 different alleles reported by
Huang et al. (2005) for Peking ducks for 28 polymorphic loci. This may be due to a
lower genetic variation in guinea fowl compared to the Peking duck.
The mean Ne of 2.039 was also lower than that reported by Kayang et al. (2002) for
quail (2.45). The mean Ho (0.396) was lower than the mean He (0.419), indicating
some genetic diversity in guinea fowl. Furthermore, HWE tests showed that 12 loci
deviated from HWE with the P-values of loci GF21, GF35 and GF43 (0.021, 0.011
and 0.024 respectively) being significant (P<0.05). The P-values of loci GF16F,
GF37, GF69, GF74, GF76, GF151, GF168 GF179, and GF199 were highly
significant (P<0.001). Following Bonferroni correction (P<0.002; Rice, 1989), nine
loci deviated significantly from Hardy-Weinberg Equilibrium. This adjustment was
done in order to maintain a 5% error rate (0.05). The P-value used for Bonferroni
correction was calculated as the 0.05 divided by the number of comparisons (31
polymorphic markers). The deviation from HWE could be due to the small number of
individuals per population and the pooling of data from 3 different populations (Latip
University of Ghana http://ugspace.ug.edu.gh
80
et al., 2010). The presence of null alleles, in-breeding or homogeneity in all or either
one of the populations sampled could also account for this heterozygote deficiency
(Chakraborty et al., 1992; Dakin and Avise, 2004; Santana et al., 2009).
The null allele frequency was low, ranging from 0.008 to 0.303 for 16 affected loci.
The null allele frequency was less than 0.2 in all loci except locus GF69 (0.300),
which also recorded the highest number of alleles. The evidence of the presence of
null alleles in this study, though very low, could account for the heterozygote deficit
recorded after HWE tests (Dakin and Avise, 2004). Only a few loci deviated from
HWE therefore the heterozygous deficit could be as a result of the null alleles found in
the study as indicated by Jarne and Lagoda (1996), Dakin and Avise (2004), Chapuis
and Estoup (2007) and Oddou-Muratorio et al. (2008). The low mean value recorded
for F (0.052), implies that there were reduced levels of inbreeding although this value
could have been inflated by the presence of null alleles in the current study.
Evidently, the Na was directly associated with I (Figure 14) in all the loci indicating
the high diversity of the loci. The mean Shannon’s index (0.750) across all 31
polymorphic loci indicates that the markers are highly informative (I > 0.5). Another
index for measuring marker informativeness, polymorphism information content,
indicated a range of 0.033 to 0.774 with an average of 0.367. The average PIC of
0.367 recorded for guinea fowl in the present study was lower than the PIC of 0.477
recorded by Kayang et al. (2002) for Japanese quail and the 0.420 recorded by Huang
et al. (2005) for Peking ducks. The mean PIC (0.367) observed in the present study
was however higher than the mean PIC of 0.155 recorded by Kayang et al. (2002) for
11 Japanese quail polymorphic microsatellite markers that cross amplified in guinea
fowl. This implies a lower level of homogeneity in the guinea fowls sampled for the
present study. Consequently, based on the criteria by Botstein et al. (1980) and the
University of Ghana http://ugspace.ug.edu.gh
81
mean PIC value obtained from the current study, the markers can be described as
reasonably informative and therefore would be useful for gene mapping. Furthermore,
in the present study, 29% of the markers (9 of 31) were highly informative (PIC >
0.50), 35.5% (11 of 31) were reasonably informative (0.50 > PIC > 0.25), and 35.5%
(11 of 31) were slightly informative (PIC < 0.25). The percentage of markers (29%)
with high PIC in this study was lower than that for Japanese quail i.e. 59.2 % (58 of
98) found by Kayang et al. (2002). The percentage of slightly informative markers
recorded in the present study i.e. 35.5% was however higher than that recorded for
Japanese quail. Although, the average probability of identity among the loci was 0.43
and was higher than that recorded for grasscutter (3.1 x 10⁻³³) by Adenyo et al.
(2012), the markers can still be useful for diversity studies and individual
discrimination.
University of Ghana http://ugspace.ug.edu.gh
82
CHAPTER SIX
6.0 GENERAL CONCLUSION AND RECOMMENDATIONS
6.1 Conclusion
This study marks the first to utilize the Roche 454 sequencing technology in
microsatellite marker development for guinea fowl. The technology proved
efficient in facilitating the isolation of 122 microsatellite markers for guinea
fowl. The 122 microsatellite markers reported here are also the first original
microsatellite markers for the guinea fowl. Of these 122 markers, 31 original
polymorphic microsatellite markers have been developed and with moderately
high information content.
The microsatellite sequences obtained for the guinea fowl was low (1.2%) and
is a reflection of the generally low occurrence of microsatellites in birds.
The di- and trinucleotide class of repeats were more abundant than tetra-, penta
and hexanucleotide repeats, with CA/GT repeats being the most frequent.
A high number of perfect repeats were obtained compared to imperfect repeats,
a probable consequence of positive influence of the enrichment procedure and
stability or conservation of sequences.
6.2 Recommendations
The ability to perform effective genetic analyses is enhanced when researchers
are provided with the widest possible array of polymorphisms from which to
choose. Therefore, the remaining 84 optimsed primers should be characterized
using 32 unrelated individuals. During optimization, varied PCR conditions
other than 55 ºC and 60 ºC should be considered to increase success rate.
University of Ghana http://ugspace.ug.edu.gh
83
Even though null allele frequency was low in this study, affected primers could
be re-designed in an effort to recover normal inheritance pattern and sequence
them to confirm their detailed molecular basis. Furthermore, primers should be
designed and tested for the remaining 1,065 microsatellites sites obtained in the
study.
Genetic analysis should be done based on the microsatellites developed in the
study to uncover economic trait loci required for the improvement and
conservation of this valuable species.
The microsatellite markers developed in this study could be used to compare
the genetic structure of both domestic and feral populations of helmeted guinea
fowl for conservation purposes.
The possibility of cross-amplification for the other three genera of guinea fowl
using the polymorphic microsatellite markers developed in this study should be
analysed.
University of Ghana http://ugspace.ug.edu.gh
84
REFERENCES
Abdelkrim, J., Robertson, B.C., Stanton, J-A.L. and Gemmell N.J. 2009. Fast, cost-
effective development of species-specific microsatellite markers by genomic
sequencing. BioTechniques 46: 185-192.
Achilli, A., Olivieri, A., Pellecchia, M., Uboldi, C., Colli, L., Al-Zahery, N.,
Accetturo, M., Pala, M., Kashani, ,B.H., Perego, U.A., Battaglia, V., Fornarino,
S., Kalamati, J.,Houshmand, M., Negrini, R., Semino, O., Richards, M.,
Macaulay, V., Ferretti, L., Bandelt, H.J., Ajmone-Marsan, P. and Torroni, A.
2008. Mitochondrial Genomes of Extinct Aurochs Survive in Domestic Cattle.
Current Biology 18: 157–158.
Adenyo, C., Hayano, A., Inoue, E., Kayang, B.B. and Inoue-Murayama M. 2012.
Development of microsatellite markers for grasscutter (Thryonomis
swinderianus, Rodentia) using next-generation sequencing technology.
Conservation Genetic Resources 4: 1011-1014.
Adjetey, A. N. A. 2006. Comparative growth performance of growing indigenous
guinea fowl (Numida meleagris) from the Upper East, Upper West and Northern
regions of Ghana. BSc. Thesis. University for Development Studies, Department
of Animal Science, Tamale, Ghana.
Agbolosu, A.A., Teye, G.A., Adjetey, A.N.A., Addah, W. and Naandam, J. 2012.
Performance characteristics of growing indigenous guinea fowls from upper
east, upper west and Northern regions of Ghana. Agriculture and Biology
Journal of North America 10: 336-339.
University of Ghana http://ugspace.ug.edu.gh

85
Ajmone-Marsan, P., Negrini, R., Milanesi, E., Bozzi, R., Nijman, I.J., Buntjer, J.B.,
Valentini, A. and Lenstra, J.A. 2002. Genetic distances within and across cattle
breeds as indicated by biallelic AFLP markers. Animal Genetics 33: 280–286.
Allentoft, M.E., Schuster, S.C., Holdaway, R.N., Hale, M.L., McLay, E., Oskam, C.,
Gilbert, T.P., Spencer, P., Willerslev, E. and Bunce, M. 2008 Identification of
microsatellites from an extinct moa species using high-throughput (454)
sequence data. BioTechniques 46: 195-200.
An, H.S. and Lee, J.W. 2012. Development of Microsatellite Markers for the Korean
Mussel, Mytilus coruscus (Mytilidae) Using Next Generation Sequencing.
International Journal Molecular Science 13 (8): 10583–10593.
Andrés, J.A. and Bogdanowicz, S.M. 2011. Isolating Microsatellite Loci: Looking
Back, Looking Ahead. In: Molecular Methods for Evolutionary Genetics. Eds.
Orgogozo, V. and Rockman, M.V. Humana Press, Clifton, NJ, USA, 772: 211–
232.
Apiiga, S. Y. 2004. Guinea Fowl Production and Poverty Alleviation in the Upper
East Region: A Call for Presidential Special Initiative. Ministry of Food and
Agriculture, Bolgatanga.
Apiiga, S. Y. 2007. Improving Guinea Fowl Production in the Upper East Region.
The Savanna Farmer. July- December 2007, Vol. 8, No. 2.
Awotwi, E. K. 1987. A Review of Studies on Guinea Fowls in Ghana. Department of
Animal Science, University of Ghana, Legon. Legon Agricultural Research
Bulletin 2:1-4.
University of Ghana http://ugspace.ug.edu.gh
86
Ayorinde, K. L. 2004. The Spice of Life. 71st Inaugural Lecture, University of Ilorin,
Ilorin, Nigeria.
Baker, C.M. 1980. Chemical classification of cattle. 1. Breed groups. Animal Blood
Groups and Biochemical Genetics 11: 127–150.
Barker, J.S.F., Tan, S.G., Moore, S.S., Mukherjee, T.K., Matheson, J.L. and Selvaraj,
O.S. 2001. Genetic variation within and relationship among populations of Asian
goats (Capra Hircus). Journal of Animal and Breeding Genetics 118: 213-233.
Baums, I.B., Hughes, C.R. and Hellberg, M.E. 2005. Mendelian microsatellite loci for
the Caribbean coral Acropora palmata. Marine Ecology Progress Series 288:
115–127.
Billotte, N., Lagoda, P.J.L., Risterucci, A.-M. and Baurens, F.-C. 1999. Microsatellite
enriched libraries: applied methodology for the development of SSR markers in
tropical crops. Fruits 54: 277-288.
BirdLife International. 2008. IUCN Red List of Threatened Species.
<www.iucnredlist.org>. Downloaded on 11 July, 2012.
BirdLife International. 2013. IUCN Red List of Threatened Species.
<www.iucnredlist.org>. Downloaded on 11 July, 2012.
Blair, C., Jiménez-Arcos, V., la Cruz, F.M. and Murphy, R. 2012. Using next-
generation DNA sequencing for rapid microsatellite discovery in Mexican leaf-
toed geckos (Phyllodactylus tuberculosus), Conservation Genetic Resources 4:
807–810.
University of Ghana http://ugspace.ug.edu.gh
87
Botstein, D., White, R.L., Skolnick, M. and Davis, R.W. 1980. Construction of a
genetic linkage map in man using restriction fragment length polymorphisms.
American Journal Human Genetics 32: 314-331.
Bruford, M.W., Bradley, D.G. and Luikart, G. 2003. DNA markers reveal the
complexity of livestock domestication. Nature Reviews Genetics 4: 900–910.
Buntjer, J.B., Otsen, M., Nijman, I.J., Kuiper, M.T. and Lenstra, J.A. 2002. Phylogeny
of bovine species based on AFLP fingerprinting. Heredity 88: 46–51.
Buschiazzo, E. and Gemmel, N.J. 2006. The rise, fall and renaissance of
microsatellites in eukaryotic genomes. Bioessays 28: 1040-1050.
Callen, D.F., Thompson, A.D., Shen, Y., Philips, H.A., Richards, R.I., Mulley, J.C.
and Sutherland, G.R. 1993. Incidence and origin of “null” alleles in the (AC)n
microsatellite markers. American Journal Human Genetics. 52: 922-927.
Calvignac, S., Konecny, L., Malard, F. and Douady, C.J. 2011. Preventing the
pollution of mitochondrial data sets with nuclear mitochondrial paralogs
(numts). Mitochondrion 11: 246–54.
Carvalho, D.C., Rodrı´guez-Za´rate, C.J., Hammer, M.C.P. and Beheregaray, L.B.
2011. Development of 21 microsatellite markers for the threatened Yarra pygmy
perch (Nannoperca obscura) through 454 shot-gun pyrosequencing.
Conservation Genetic Resources doi: 10.1007/s12686-011-9413-8.
Chakraborty, R., De Andrade, M., Daiger, S.P. and Budowle, B.1992. Apparent
heterozygote deficiencies observed in DNA typing data and their implications
in forensic applications. Annals of Human Genetics 56: 45–57.
University of Ghana http://ugspace.ug.edu.gh

88
Chambers, G.K. and MacAvoy, E.S. 2000. Microsatellites: consensus and
controversy. Comparative Biochemistry and Physiology Part B: Biochemistry
and Molecular Biology 126: 455-476.
Chapuis, M-P. and Estoup A. 2007. Microsatellite null alleles and estimation of
population differentiation. Molecular Biology Evolution, 24: 621–631.
Chen, X., Temnykh, S., Xu, Y., Cho, Y.G. and McCouch, S.R. 1997. Development of
a microsatellite framework map providing genome-wide coverage in rice (Oryza
staiva L.). Theoritical Applied Genetics 95: 553-567.
Church, K.E. and Taylor, J.S. 1992. Management and research of northern bobwhite
Colinus virginianus in North America: An overview. Gibier Faune Sauvage 9:
787-796.
Clements, J.F. 2010. In: The Clements checklist of birds of the world. Sixth edition.
Cornell University Press, Ithaca. ISBN 978-0801445019.
Crooijmans, R.P.M.A., Dijkhof, R.J.M., Van der Poel, J.J. and Groenen, M.A.M.,
1997. New microsatellite markers in chicken optimized for automated fluorescent
genotyping, Journal of Animal Genetics 28: 427-437.
Dakin, E.E. and Avise, J.C. 2004. "Microsatellite null alleles in parentage analysis".
Journal of Heredity 93 (5): 504 – 509.
De Vienne, D. 1998. Les marqueurs moléculaires en génétique et biotechnologies
végétales. Paris. INRA Editions. 200 pp.
Dei, H. K and Karbo, N 2004. Improving smallholder guinea fowl production in
Ghana: A training Manual. Cyber Systems, Tamale, Ghana. 27pp.
University of Ghana http://ugspace.ug.edu.gh
89
Den Tex, R.J., Maldonado, J.E., Thorington, R. and Leonard, J.A. 2010. Nuclear
Copies of Mitochondrial Genes: Another Problem for Ancient DNA. Genetica
138: 979-84.
Duffy, D.C., Downer, R. and Brinkley, C. 1992. The effectiveness of Helmeted
Guinea fowl in the control of the deer tick, the vector of Lyme disease. The
Wilson Bulletin 164 (2): 342-45.
Dutech, C., Enjalbert, J., Fournier, E., Delmotte, F., Barrès, B., Carleir, J., Tharreau,
D. and Giraud, T. 2007. Challenges of microsatellite isolation in fungi. Fungal
Genetics Biology 44: 933-949.
Edwards K.J., Barker J.H.A, Daly A., Jones C. and Karp A. 1996. Microsatellite
libraries enriched for several microsatellite sequences in plants. Biotechniques
20: 758-759.
Ellegren, H. 2004. Microsatellites: simple sequences with complex evolution. Nature
Reviews Genetics Volume 5 doi: 10.1038/nrg1348
www.nature.com/reviews/genetics.
Faircloth, B.C. 2008. MSATCOMMANDER: Detection of microsatellite repeat
arrays and automated, locus-specific primer design. Molecular Ecology
Resources 8: 92–94.
Falconer, D.S and McKay, T.F.C. 1996. Introduction to Quantitative Genetics. Fourth
edition. Longman House, Hallow, UK. 464 pp.
FAO, 2007. The State of the World’s Animal Genetic Resources for Food and
Agriculture. FAO, Rome.
University of Ghana http://ugspace.ug.edu.gh
90
FAO, 2011. Draft Guidelines on Molecular Genetic Characterization of Animal
Genetic Resources. FAO, Rome.
Farrell, D. 2010. Guinea Fowl. www.PoultryHub.org.Australia. Friday, 20th August,
2010.
Francis, I. S., Penford, N., Gartshore, M. E. and Jaramillo, A. 1992. The
Whitebreasted Guineafowl Agelastes meleagrides in Taı¨ National Park, Coˆte
d’Ivoire. Bird Conservation International 2: 25–60.
Garrime, C. M. L. P. 2007. Genetic characterisation of indeginous goat populations of
Mozambique. MPhil Thesis, University of Pretoria, South Africa.
Glenn, T.C. and Schable, N.A. 2005. Isolating microsatellite DNA loci. Methods in
Enzymology 395: 202-222.
Griffiths, A.J.F., Jeffrey, H., Suzuki, D.T., Lewontin, R.C. and Gelbart, W.M.
2000. In: An Introduction to Genetic Analysis. Seventh edition. Eds: Griffith,
A.J.F., Miller, J.H., Suzuki, D.T., Lewontin, R.C. and Gelbart, W.M. New York:
WH Freeman and Company.
Groenen, M.A.M., Cheng, H., Bumstead, N., Benkel, B.F., Briles, W.E., Burke, T.,
Burt, D.W., Crittenden, L.B., Dodgson, J., Hillel, J., Lamont, S., Ponce de Leon,
A., Soller, M., Takahashi, H. and Vignal, A. 2000. A consensus map of the
chicken genome. Genome Research 10: 137-147.
Gupta, P.K., Balyan, H.S., Sharma, P.C. and Ramesh, B. 1996. Microsatellites in
plants: A new class of molecular markers. Current Science 70: 45-54.
University of Ghana http://ugspace.ug.edu.gh
91
Gurdebecke, S. and Maelfait, J. 2002. RAMS technique fails in developing
microsatellite markers. Proceedings of 20th European Colloquium of
Arachnology, Szombathely, Europe, 22-26 July, pp 49 -56.
Hancock, J. M. 1996. Simple sequences in a ‘minimal’ genome. Nature Genetics 14:
14–15.
Hassanin, A., Bonillo, C., Nguyen, B.X. and Cruaud, C. 2010. Comparisons between
mitochondrial genomes of domestic goat (Capra hircus) reveal the presence of
numts and multiple sequencing errors. Mitochondrial DNA 21: 68–76.
Hines, H.C., 1999. Blood groups and biochemical polymorphisms. In: Genetics of
cattle. Eds. Fries, R. and Ruvinsky, A., CABI Publishing, Wallingford, UK, pp
697.
Huang, Y., Tu, J., Cheng, X., Tang, B., Hu X., Liu, Z., Feng, J., Lou, Y., Lin, L., Xu,
K., Zhao, Y. and Li, N. 2005. Characterization of 35 novel microsatellite DNA
markers from the duck (Anas platyrhynchos) genome and cross-amplification in
other birds. Genetic Selection Evolution 37: 455–472.
Ikani, E.I. and Dafwang, I.I. 2004. The Production Of Guinea Fowl In Nigeria.
Extension Bulletin No. 207, Poultry Series No.8.
Itoh, Y., Suzuki, M Ogawa, A. Munechika, I., Murata, K. and Mizuno, S. 2001.
Identification of the sex of a wide range of carinatae birds by PCR using primer
sets selected from chicken EE0.6 and its related sequences. Journal of Heredity
92: 315–321.
IUCN, 2007. IUCN Red List of threatened species [http://www.iucnlist.org].
University of Ghana http://ugspace.ug.edu.gh
92
Jacob, J. and Pescatore, T. 2011. In: Keeping Guinea Fowls. Cooporative Extension
Service. University of Kentucky. College of Agriculture. Lexington, KY, 40546.
Jarne, P. and Lagoda, P.J.L. 1996. Microsatellites, from molecules to populations and
back. Trends in Ecology Evolution 11: 424-429.
Karagyozov, L., Kalcheva, I.D. and Chapman, V.M. 1993. Construction of random
small-insert genomic libraries highly enriched for simple sequence repeats.
Nucleic Acids Research 21: 3911- 3912.
Karp, A., Kresovich, S., Bhat, K.V., Ayad, W.G. and Hodgkin, T. 1997. Molecular
tools in plant genetic resources conservation: a guide to the technologies.
Technical Bulletin 2. Rome, International Plant Genetic Resources Institute
(IPGRI), 27 pp.
Katti, M.V., Ranjekar, P.K. and Gupta, V.S. 2001. Differential distribution of simple
sequence repeats in eukaryotic genome sequences. Molecular Biology Evolution
18: 1161-1167.
Kayang, B.B., Inoue- Murayama. M., Nomura, A., Kimura, K., Takahashi, H.,
Mizutani, M. and Ito, S. 2000. Fifty microsatellite markers for Japanese quail.
The Journal of Heredity 91: 502-505.
Kayang, B.B., Inoue-Murayama, M., Hoshi, T., Matsuo, K., Takahashi, H.,
Minezawa, M., Mizutani, M. and Ito, S. 2002 Microsatellite loci in Japanese
quail and cross-species amplification in Chicken and Guinea fowl. Genetics
Selection Evolution 34: 233-259.
Kayang, B.B., Youssao, I., Inoue, E., Naazie, A., Abe, H., Ito, S. and Inoue-
Murayama M. 2010. Genetic diversity of Helmeted guinea fowl (Numida
University of Ghana http://ugspace.ug.edu.gh

93
meleagris) based on microsatellite analysis. Journal Poultry Science 47: 120-
124.
Kierulff, M.C.M., Rylands, A.B. and de Oliveira, M.M. 2008. Agelastes meleagrides.
In: IUCN 2008. IUCN Red List of Threatened Species.
Koney, E.B.M. 2004. In: Poultry Health and Production. Second edition. Advent
press, Accra, Ghana. pp. 91- 94.
Konlan, S.P., Avornyo, E.K., Karbo, N. and Sulleyman, A. 2011. Increasing guinea
fowl eggs availability and hatchability in the dry season. Journal of World’s
Poultry Research 1(1): 1-3.
Kopps, A.M., McDonald, P. and Rollins, L.A. 2013. Isolation and characterisation of
polymorphic microsatellite loci for Noisy Miners Manorina melanocephala, with
successful cross-amplification in Bell Miners M. melanophrys. Conservation
Genetic Resources 5: 39–41.
Kumssa, T. and Bekele, A. 2013. Population status, feeding ecology and activity
pattern of helmeted guinea fowl (Numidia meleagris) in Abijata-Shalla Lakes
National Park African Journal of Environmental Science and Technology 7 (1):
49-55.
Kutil, BL and Williams, C.G. 2001. Triplet-repeat microsatellites shared among hard
and soft pines. Journal of Heredity 92: 327-332.
Latip, S. N. H., Muhamad, R., Manjeri, G. and Tan, S. G. 2003. Development of
microsatellite markers for Helopeltis theivora waterhouse (Hemiptera: Miridae).
African Journal of Biotechnology 9 (28): 4478-4481.
University of Ghana http://ugspace.ug.edu.gh

94
Lenstra, J.A., Groeneveld, L.F., Eding, H., Kantanen, J., Williams, J.L., Taberlet, P.,
Nicolazzi, E.L., Solkner, J., Simianer, H., Ciani, E., Garcia, J.F., Bruford, M.W.,
Ajmone-Marsan, P. and Weigend, S. 2012. Molecular Tools and Analytical
Approaches for the Characterisation of Farm Animal Genetic Diversity: Review.
Animal Genetics doi:10.1111/j.1365-2052.2011.02309x.
Li, Y.-C., Korol, A.B., Fahima, T. and Nevo, E. 2004. Microsatellites within genes:
structure, function, and evolution. Molecular Biology Evolution 21: 991-1007.
Lim, S., Notley-McRobb, L., Lim, M. and Carter, D.A. 2004. A comparison of the
nature and abundance of microsatellites in 14 fungal genomes. Fungal Genetic
Biology 41: 1025-1036.
Liu, Z.J. and Cordes, J.F. 2004. DNA marker technologies and their applications in
aquaculture genetics. Aquaculture 238: 1-37.
Mallia, J.D. 1999. Observations on family poultry units in parts of Central America
and sustainable development opportunities. Livestock Research for Rural
Development 11 (3). Accessed 10 May 2011 from
www.Irrd.org/irrd11/3/mal113.htm.
Mallory, A. 2007. Development and characterization of microsatellite markers for the
grain amaranths (Amaranthus spp. l.) MSc. Thesis, Brigham Young University,
Provo, Utah.
Margulies, M., Egholm, M., Altman, W.E., Attiya, S., Bader, J.S., Bemben, L.A.,
Berka, J., Braverman, M.S. Chen, Y.J., Chen, Z., Dewell, S.B., Du, L., Fierro,
J.M., Gomes, X.V., Godwin, B.C., He, W., Helgesen, S., Ho, C.H., Irzyk, G.P.,
Jando, S.C., Alenquer, M.L., Jarvie, T.P., Jirage, K.B., Kim, J.B., Knight, J.R.,
University of Ghana http://ugspace.ug.edu.gh
95
Lanza, J.R., Leamon, J.H., Lefkowitz, S.M., Lei, M., Li, J., Lohman, K.L., Lu,
H., Makhijani, V.B., McDade, K.E., McKenna, M.P., Myers, E.W., Nickerson,
E., Nobile, J.R., Plant, R., Puc, B.P., Ronan, M.T., Roth, G.T., Sarkis, G.J.,
Simons, J.F., Simpson, J.W., Srinivasan, M., Tartaro, K.R., Tomasz, A., Vogt,
K.A., Volkmer, G.A., Wang, S.H., Wang, Y., Weiner, M.P., Yu, P., Begley,
R.F. and Rothberg, J.M. 2005. Genome sequencing in microfabricated high-
density picolitre reactors. Nature 437: 376-80.
Martinez, I. 1994. Family Numididae (Guinea Fowl). In: Handbook of the Birds of
the World, Vol. 2; New World Vultures to Guinea Fowl. Eds: Hoyo, D., Elliott,
A. and Sargatal, J. Lynx Editions, Barcelona, pp. 554-570.
Meglécz, E., Pech, N., Gilles, A., Martin, J-F. and Gardner, M.G. 2012. A shot in the
genome: how accurately do shotgun 454 sequences represent a genome?
BioMed Central Research Notes 5: 259.
Mitsuhashi, M. 1996. Technical report: Part 2; Basic requirements for designing
optimal PCR primers. Journal Clinical Laboratory Analysis 10 (5): 285–93.
Moore, S.S. and Hansen, C. 2003 Genomics: delivering added value to the beef
industry? Outlook on Agriculture 32 (4): 247-252.
Moreki, J.C. 2009. Guinea Fowl Production. Reach Publishers, Wandsbeck, South
Africa, pp. 7-31.
Morgante, M., Hanafey, M. and Powell, W. 2002. Microsatellites are preferentially
associated with nonrepetitive DNA in plant genomes. Nature Genetics 30: 194–
200.
University of Ghana http://ugspace.ug.edu.gh

96
Moriguchi, Y, Iwata, H, Ujino-Ihara, T, Yoshimura, K, Taira, H. and Tsumura, Y.
2003. Development and characterization of microsatellite markers
for Cryptomeria japonica. Theoretical and Applied Genetics 106: 751-758.
Mburu, D. and Hanotte, O. 2005. A practical approach to microsatellite genotyping
with special reference to livestock population genetics. A manual prepared for
the IAEA/ILRI training course on molecular characterisation of small ruminant
genetic resources of Asia, October-December 2005, ILRI, Nairobi, Kenya.
Nahashon, S.N., Amenyenu, A., Harris, C. and Adefope, N. 2008. Chicken and Quail
microsatellite markers reveal polymorphisms in Guinea fowl. Journal of Poultry
Science 45: 249-258.
Neff, B.D. and Gross, M.R. 2001. Microsatellite evolution in vertebrates: Inference
from AC dinucleotide repeats. Journal of Evolution 55: 1717–1733.
Negrini, R., Milanesi, E., Bozzi, R., Pellecchia, M. and Ajmone-Marsan, P. 2006.
Tuscany autochthonous cattle breeds: an original genetic resource investigated
by AFLP markers. Journal of Animal Breeding and Genetics 123: 10–16.
Nielsen, E.E., Hansen, M.M., Ruzzante, D.E., Meldrup, D. and Grønkjær, P. 2003.
Evidence of a hybrid-zone in Atlantic cod (Gadus morhua) in the Baltic and the
Danish Belt Sea revealed by individual admixture analysis. Molecular Ecology
12: 1497-1508.
Oddou-Muratorio, S., Vendramin, G.G., Buiteveld, J. and Fady, B. 2008. Population
estimators or progeny tests: what is the best method to assess null allele
frequencies at SSR loci? Short Communication: Conservation Genetics. DOI
10.1007/s10592-008-9648-4.
University of Ghana http://ugspace.ug.edu.gh
97
Odeny, D.A. 2006. Microsatellite development and application in Pigeon pea
(Cajanus cajan (L.) Millsp.) PhD thesis. Rheinischen Friedrich-Willhelms-
Universität Bonn.
Osei-Amponsah, R., Kayang, B.B., Naazie, A., Osei, Y.D., Youssao, I.A.K., Yapi-
Gnaore, V.C., Tixier-Boichard, M., and Rognon, X. 2010. Genetic Diversity of
Forest and Savannah Chicken Populations of Ghana as Estimated by
Microsatellite Markers. Animal Science Journal 81: 297–303.
Paetkau, D. and Strobeck, C. 1995. The molecular-basis and evolutionary history of a
microsatellite null allele in bears. Molecular Ecology 4: 519–520.
Peakall, R. and Smouse, P.E. 2006. GenAlEx 6: Genetic Analysis in Excel Population
Genetic Software for Teaching and Research. Molecular Ecology Notes 6: 288 –
295.
Petit, E., Balloux, F. and Excoffier, L. 2002. Mammalian Population Genetics: Why
Not Y? Trends in Ecology in Ecology and Evolution 17: 28-33.
Plotsky, Y., Kaiser, M.G., Lamont, S.J. 1995. Genetic characterization of highly
inbred chicken lines by two DNA methods: DNA fingerprinting and polymerase
chain reaction using arbitrary primers. Animal Genetics 26: 163–170.
Powell, W., Machray, G.C. and Provan, J. 1996. Polymorphism revealed by simple
sequence repeats. Trends in Plant Science 1: 215-222.
PREMIER Biosoft International. PCR primer design
guidelines.http://www.premierbiosoft.com/tech_notes/PCR_Primer_Design
(accessed February 31, 2013)
University of Ghana http://ugspace.ug.edu.gh
98
Primmer, C.R., Raudsepp, T., Chowdhary, B.P., Møller, A.P. and Ellegren, H. 1997.
Low frequency of microsatellites in the avian genome. Genome Research 7:
471–482.
Primrose, S.B. and Twyman, R.M. 2006. Principles of Gene Manipulation and
Genomics seventh edition. Blackwell Publishing. United Kingdom, Britain, pp.
644.
Qi, X., Lindup, S., Pittaway, T.S., Allouis, S., Gale, M.D. and Devos, K.M. 2001.
Development of simple sequence repeat markers from bacterial artificial
chromosomes without subcloning. Biotechniques 31: 355-362.
Queller, D.C., Strassmann, J.E. and Hughes, C.R. 1993. Microsatellites and kinship.
Trends Ecology Evolution 8: 285-288.
Reed, K.M., Chaves, L.D. and Rowe, J.A. 2002. Twelve new turkey microsatellite
loci. Poultry Science 81: 1789-1791.
Rice, W.R. 1989. Analyzing tables of statistical tests. Evolution 43: 223–225.
Rohrer, G.A., Alexander, L.J., Hu, Z., Smith, T.P.L., Keele, J.W. and Beattie, C.W.
1996. A comprehensive map of the porcine genome. Genome Research 6: 371–
391.
Rozen, S. and Skaletsky, H.J. 2000. Primer 3 on the WWW for general users and for
biologist programmers. In: Bioinformatics Methods and Protocols; Methods in
Molecular Biology Eds: Krawetz, S. and Misener, S. Humana Press, Totowa,
New Jersey. pp. 365–386.
University of Ghana http://ugspace.ug.edu.gh
99
Sachidanandam, R., Weissman, D., Schmidt, S.C., Kakol, J.M., Stein, L.D., Marth,
G., Sherry, S., Mullikin, J.C., Mortimore, B.J., Willey, D.L., Hunt, S.E., Cole,
C.G., Coggill, P.C., Rice, C.M., Ning, Z., Rogers, J., Bentley, D.R., Kwok, P.Y.,
Mardis, E.R., Yeh, R.T., Schultz, B., Cook, L., Davenport, R., Dante, M.,
Fulton, L., Hillier, L., Waterston, R.H., McPherson, J.D., Gilman, B., Schaffner,
S., Van Etten, W.J., Reich, D., Higgins, J., Daly, M.J., Blumenstiel, B.,
Baldwin, J., Stange-Thomann, N., Zody, M.C., Linton, L., Lander, E.S.,
Altshuler, D. and International SNP Map Working Group. 2001. A map of
human genome sequence variation containing 1.42 million single nucleotide
polymorphisms. Nature 409: 928–933.
SanCristobal, M., Chevalet, C., Peleman, J., Heuven, H., Brugmans, B., van Schriek,
M., Joosten, R., Rattink, A.P., Harlizius, B., Groenen, M.A., Amigues, Y.,
Boscher, M.Y., Russell, G., Law, A., Davoli, R., Russo, V., Desautes, C.,
Alderson, L., Fimland, E., Bagga, M., Delgado, J.V., Vega-Pla, J.L., Martinez,
A.M., Ramos, M., Glodek, P., Meyer, J.N., Gandini, G., Matassino, D., Siggens,
K., Laval, G., Archibald, A., Milan, D., Hammond, K., Cardellino, R., Haley, C.
and Plastow, G. 2006. Genetic diversity in European pigs utilizing amplified
fragment length polymorphism markers. Animal Genetics 37: 232–238.
Santana, Q.C., Coetzee, M.P.C., Mlonyeni, E. T.S., Hammond, G.N.A., Wingfield,
M.J. and Wingfield, B.D. 2009. Microsatellite discovery by deep sequencing of
enriched genomic libraries. BioTechniques 46: 217-23.
Schimenti, J. 1998. Global analysis of gene function in mammals: integration of
physical, mutational and expression strategies. EJB Electronic Journal of
Biotechnology at http://www.ejbiotechnology.cl/content/vol1/issue1/full/5/.
University of Ghana http://ugspace.ug.edu.gh
100
Schlötterer, C. and Harr, B. 2001. Microsatellite Instability. Encyclopedia of life
sciences, Nature Publishing Group / www.els.net.
Schlötterer, C. 2004. The evolution of molecular markers; just a matter of fashion?
Nature Reviews Genetics 5: 63-69.
Schoebel, C.N., Brodbeck, S., Buehler, D., Cornejo, C., Gajurel, J., Hartikainen, H.,
Keller, D., Leys, M., Ricanov, S., Segelbacher, A.G., Werth, S. and Csencsics,
D. 2013. Lessons learned from microsatellite development for nonmodel
organisms using 454 pyrosequencing. Journal of Evolutionary Biology 26: 600–
611.
Schuelke, M. 2000. An economic method for the fluorescent labelling of PCR
fragments. National Biotechnology 18: 233-234.
Selkoe, K.A. and Toonen, R.J. 2006 Microsatellites for ecologists: a practical guide
to using and evaluating microsatellite markers. Ecology Letters 9: 615-629.
Sermon, K., Seneca, S., De Rycke, M., Goossens, V., Van de Velde, H., De Vos, A.,
Platteau, P., Lissens, W., Van Steirteghem, A. and Liebaers, I. 2001. PGD in the
lab for triplet repeat diseases-myotonic dystrophy, Huntingdon’s disease and
fragile-X syndrome. Molecular Cell Endocrinology 183: 77-85.
Sharma, D., Appa Rao, K.B.C., Singh, H.P. and Totey, S.M. 1998. Randomly
amplified polymorphic DNA (RAPD) for evaluating genetic relationships
among varieties of guinea fowl. Biomolecular Engineering 14 (4): 125–128.
Singh, S.K., Mehra, S., Kumar, V., Shukla, S.K., Tiwari, A., Mehra, M., Goyal, G.,
Mathew, J. and Sharma, D. 2010. Sequence variability in the BLB2 region
University of Ghana http://ugspace.ug.edu.gh
101
among guinea fowl and other poultry species. International Journal of Genetics
and Molecular Biology 2 (3): 48-51.
Smulders, M.J.M., Bredemeijer, G., Rus-Kortekaas, W., Arens, P. and Vosman, B.
1997. Use of short microsatellites from database sequences to generate
polymorphism among Lycopersicon esculentum cultivars and accessions of
other Lycopersicon species. Theoretical and Applied Genetics 97: 264-272.
Soller, M., Weigend, S., Romanov, M.N., Dekkers, J.C.M. and Lamont, S.J. 2006.
Strategies to assess structural variation in the chicken genome and its
associations with biodiversity and biological performance. Poultry Science 85:
2061–2078.
Stajner, N., Jakse, J., Kozjak, P. and Javornik, B. 2005. The isolation and
characterization of microsatellites in hop (Humulus lupulus L.). Plant Science
168: 213-221.
Stoneking, M. 2001. Single nucleotide polymorphisms: From the evolutionary past.
Nature 409: 821-822.
Tang, B., Huang, Y.H., Lin, L., Hu, X.X., Feng, J.D., Yao, P., Zhang, L. and Li, N.
2003. Isolation and characterization of 70 novel microsatellite markers from
ostrich (Struthio camelus) genome. Genome 46 (5): 833-840.
Temnykh, S., DeClerck, G., Lukashova, A., Lipovich, L., Cartinhour, S. and
McCouch, S. 2001. Computational and experimental analysis of microsatellites
in rice (Oryza sativa L.): frequency, length variation, transposon associations,
and genetic marker potential. Genetic Resources 11: 1441-1452.
University of Ghana http://ugspace.ug.edu.gh
102
Tenva, A. 2009. Molecular markers in animal genome analysis. Biotechnology in
Animal Husbandry 25 (5-6): 1267-1284.
Teye, G.A. and Gyawu, P. 2001. The benefits of intensive indigenous guinea fowl
production in Ghana. World Poultry- Elsevier 17 (9): 53-54.
Teye, G. A. and Gyawu, P. 2002. A Guide to Guinea Fowl Production in Ghana.
14pp.
Teye, G. A., Gyawu, P and Agbolosu, A. A (2001). Growth potential and carcass
yield of exotic and indigenous guinea fowls in Ghana. In: Development
Spectrum, an Inter-Faculty Journal of the University for Development Studies,
Tamale 1: 34-40.
Thiel, T., Michalek, W., Varshney, R.K. and Graner, A. 2003. Exploiting EST
databases for the development and characterization of gene-derived SSR-
markers in barley (Hordeum vulgare L.). Theoretical and Applied Genetics 106:
411-422.
Tong, J., Wang, D. and Cheng, L. 2009. In: Development of Microsatellite Markers
by Data Mining from DNA sequences data mining and knowledge discovery in
real life applications. Ed. Julio Ponce and Adem Karahoca. ISBN 978-3-
902613-53-0, pp. 438, I-Tech, Vienna, Austria.
Tóth, G., Gáspári, Z. and Jurka J. 2000. Microsatellites in different eukaryotic
genomes: survey and analysis. Genome Research 10: 967-981.
Van de Wiel, C., Arens, P. and Vosman, B. 1999. Microsatellite retrieval in lettuce
(Lactuca sativa L.) Genome 42: 139-149.
University of Ghana http://ugspace.ug.edu.gh
103
Van Marle-Köster, E., Hefer, C.A., Nel, L.H. and Groenen, M.A.M. 2003. Genetic
Diversity and Population Structure of Locally Adapted South African Chicken
Lines: Implications for Conservation. South African Journal of Animal Science
38 (4): 271.
Van Oosterhout, C., Hutchinson, W.F., Wills, D.P.M. and Shipley, P. 2004. Micro-
Checker: software for identifying and correcting genotyping errors in
microsatellite data. Molecular Ecology Notes 4: 535-538.
Vignal, A., Milan, D., SanCristobal, M. and Eggen, A. 2002. A review on SNP and
other types of molecular markers and their use in animal genetics. Genetic
Selection Evolution 34: 275-305.
Vos, P., Hogers, R., Bleeker, M., Reijans, M., van de Lee, T., Hornes, M., Frijters, A.,
Pot, J., Peleman, J. and Kuiper, M. 1995. AFLP: a new technique for DNA
fingerprinting. Nucleic Acids Research 23: 4407–1444.
Walsh, B. 2000. Minireview: Quantitative genetics in the age of genomics.
Theoretical Population Biology 59: 175-184.
Wang, Y., Wang, A. and Guo, G. 2010. Development and characterization of
polymorphic microsatellite markers for the Northern Quahog (Mercenaria
mercenaria). Journal of Shellfish Research 29 (1): 77-82.
Weber, J.L. 1990. Informativeness of human (dC-dA)n.(dG-dT)n polymorphisms,
Genomics 7: 524–530.
Whittaker, J. C., Harbord, R.H., Boxall, N., Mackay, I., Dawson, G. and Sibly, R.M.
2003. Likelihood-based estimation of microsatellite mutation rates. Genetics
164: 781–787.
University of Ghana http://ugspace.ug.edu.gh
104
Williams, J.G., Kubelik, A.R., Livak, K.J.C., Rafalski, J.A. and Tingey, M.S.V. 1990.
DNA polymorphisms amplified by arbitrary primers are useful as genetic
markers. Nucleic Acids Research 18 (22): 6531-6535.
Wikipedia (2008), Guineafowl. The free encyclopedia. Wikimedia, Foundation,
Incorporated, U.S. registered 501. www.wikipedia.org/wiki/guineafowl.
Yaish, M.W.F. and de la Vega, M.P. 2003. Isolation of (GA)n Microsatellite
Sequences and Description of a predicted MADS-box sequence isolated from
common bean (Phaseolus vulgaris L.). Genetics Molecular Biology 26: 337-
342.
Zane, L., Bargelloni, L. and Patarnello, T. 2002. Strategies for microsatellites
isolation: a review. Molecular Ecology 11:1-16.
Zhang, N., Qiu, Y., Huang, X., Chen, X., Wang, A. and Wang, Y. 2012.
Microsatellite Marker Development and Characterization in the Spotted
Babylon, Babylonia areolata (Link, 1807): Detection of Duplicated Loci at
High Frequency. International Journal of Aquaculture 2 (2) doi:
10.5376/ija.2012.02.0002.
Zietkiewicz, E., Rafalski, A. and Labuda, D. 1994. Genome fingerprinting by simple
sequence repeat (SSR)-anchored polymerase chain reaction amplification.
Genomics 20: 176-183.
University of Ghana http://ugspace.ug.edu.gh
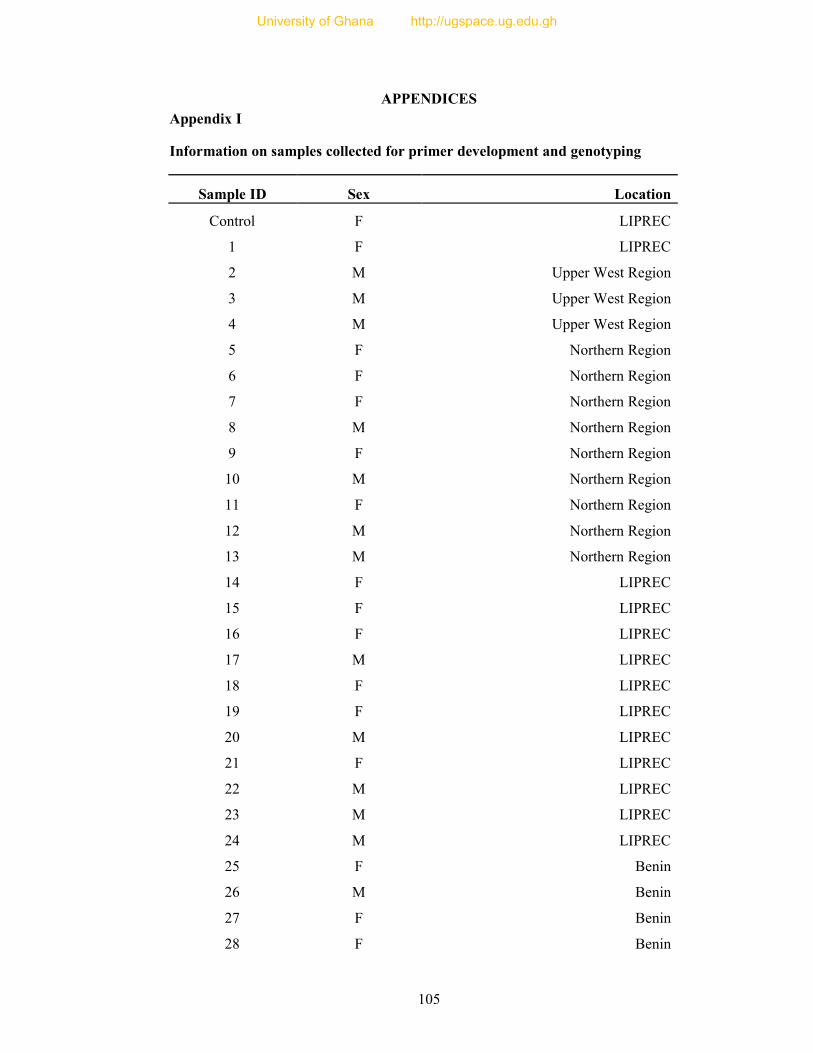
105
APPENDICES
Appendix I
Information on samples collected for primer development and genotyping
Sample ID Sex Location
Control F LIPREC
1 F LIPREC
2 M Upper West Region
3 M Upper West Region
4 M Upper West Region
5 F Northern Region
6 F Northern Region
7 F Northern Region
8 M Northern Region
9 F Northern Region
10 M Northern Region
11 F Northern Region
12 M Northern Region
13 M Northern Region
14 F LIPREC
15 F LIPREC
16 F LIPREC
17 M LIPREC
18 F LIPREC
19 F LIPREC
20 M LIPREC
21 F LIPREC
22 M LIPREC
23 M LIPREC
24 M LIPREC
25 F Benin
26 M Benin
27 F Benin
28 F Benin
University of Ghana http://ugspace.ug.edu.gh
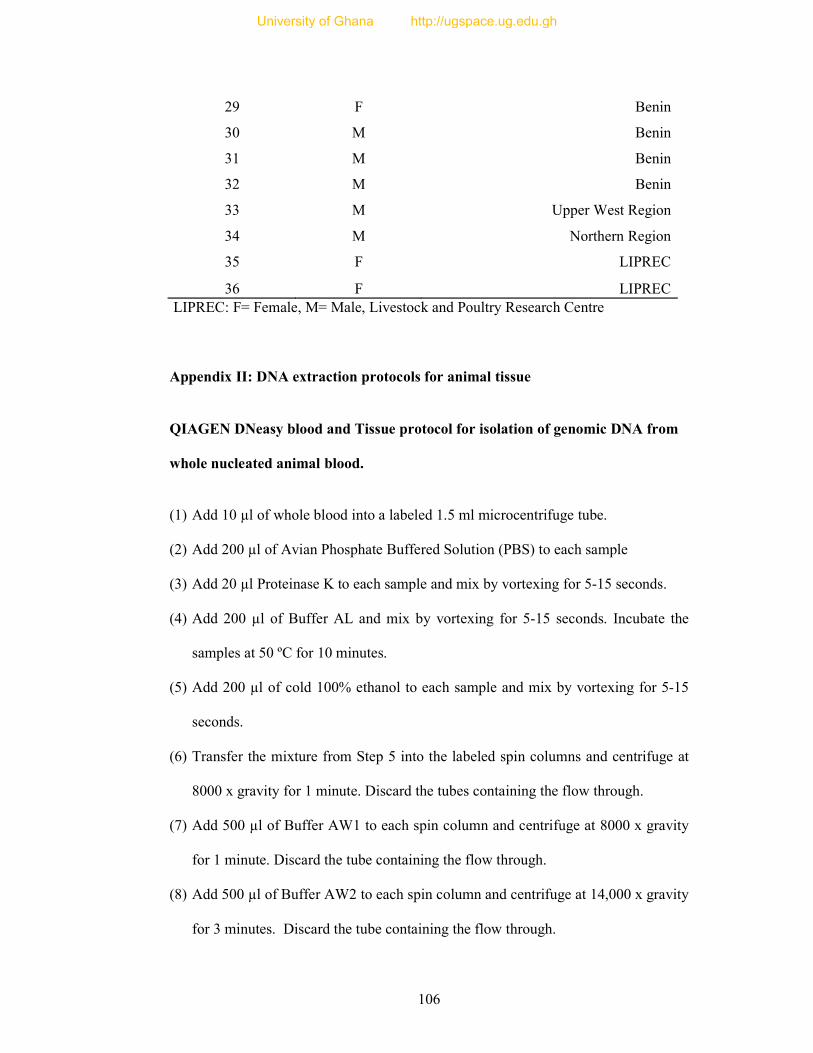
106
29 F Benin
30 M Benin
31 M Benin
32 M Benin
33 M Upper West Region
34 M Northern Region
35 F LIPREC
36 F LIPREC LIPREC: F= Female, M= Male, Livestock and Poultry Research Centre Appendix II: DNA extraction protocols for animal tissue
QIAGEN DNeasy blood and Tissue protocol for isolation of genomic DNA from
whole nucleated animal blood.
(1) Add 10 µl of whole blood into a labeled 1.5 ml microcentrifuge tube.
(2) Add 200 µl of Avian Phosphate Buffered Solution (PBS) to each sample
(3) Add 20 µl Proteinase K to each sample and mix by vortexing for 5-15 seconds.
(4) Add 200 µl of Buffer AL and mix by vortexing for 5-15 seconds. Incubate the
samples at 50 ºC for 10 minutes.
(5) Add 200 µl of cold 100% ethanol to each sample and mix by vortexing for 5-15
seconds.
(6) Transfer the mixture from Step 5 into the labeled spin columns and centrifuge at
8000 x gravity for 1 minute. Discard the tubes containing the flow through.
(7) Add 500 µl of Buffer AW1 to each spin column and centrifuge at 8000 x gravity
for 1 minute. Discard the tube containing the flow through.
(8) Add 500 µl of Buffer AW2 to each spin column and centrifuge at 14,000 x gravity
for 3 minutes. Discard the tube containing the flow through.
University of Ghana http://ugspace.ug.edu.gh
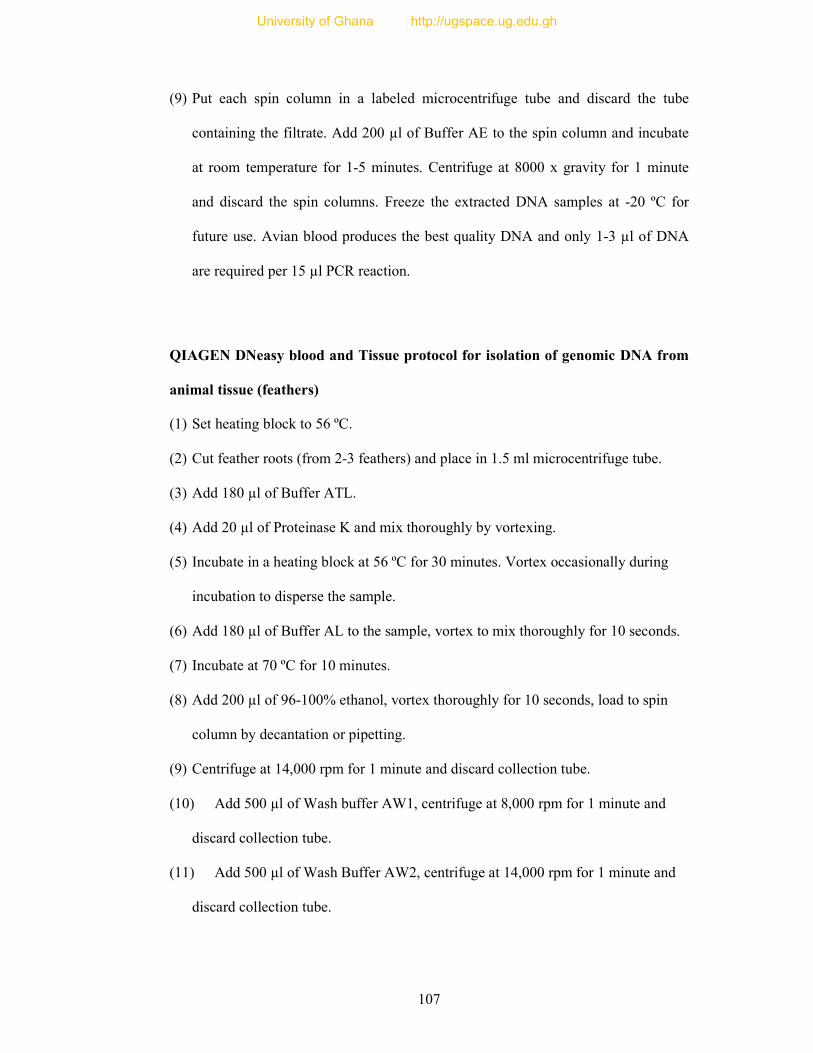
107
(9) Put each spin column in a labeled microcentrifuge tube and discard the tube
containing the filtrate. Add 200 µl of Buffer AE to the spin column and incubate
at room temperature for 1-5 minutes. Centrifuge at 8000 x gravity for 1 minute
and discard the spin columns. Freeze the extracted DNA samples at -20 ºC for
future use. Avian blood produces the best quality DNA and only 1-3 µl of DNA
are required per 15 µl PCR reaction.
QIAGEN DNeasy blood and Tissue protocol for isolation of genomic DNA from
animal tissue (feathers)
(1) Set heating block to 56 ºC.
(2) Cut feather roots (from 2-3 feathers) and place in 1.5 ml microcentrifuge tube.
(3) Add 180 µl of Buffer ATL.
(4) Add 20 µl of Proteinase K and mix thoroughly by vortexing.
(5) Incubate in a heating block at 56 ºC for 30 minutes. Vortex occasionally during
incubation to disperse the sample.
(6) Add 180 µl of Buffer AL to the sample, vortex to mix thoroughly for 10 seconds.
(7) Incubate at 70 ºC for 10 minutes.
(8) Add 200 µl of 96-100% ethanol, vortex thoroughly for 10 seconds, load to spin
column by decantation or pipetting.
(9) Centrifuge at 14,000 rpm for 1 minute and discard collection tube.
(10) Add 500 µl of Wash buffer AW1, centrifuge at 8,000 rpm for 1 minute and
discard collection tube.
(11) Add 500 µl of Wash Buffer AW2, centrifuge at 14,000 rpm for 1 minute and
discard collection tube.
University of Ghana http://ugspace.ug.edu.gh
108
(12) Place in a clean 1.5 ml microcentrifuge tube, add 50 µl Buffer AE and
incubate at 56 ºC for 5 minutes.
(13) Centrifuge at 8,000 rpm for 1 minute and store at 4 ºC.
Appendix III: FASTA sequences of sites containing 31 polymorphic
microsatellite
>G4QAAT301BPAU2 length=524 xy=0581_0428 region=1
run=R_2011_06_22_21_07_31_
GTTACATACAGTCTTATTAAGCACTAATAGTAGAGTACGCAGAAAAATTA
TATGATATACACACACACACACACACACACAAAGAAATTGATTTGAATA
ATCCCTTCCCATGTGTCATTTGGAGTTAGCAGTTACAATGTCATTGGGTAT
ATAGAATTCATTTAAAGAATGCTTCATTTCTCCCTAAACTAGTTATCCTTCT
GTCAATACAGTAATTTGTGAGGGCAAAGAAGCATTTAATTGTCTACAGGG
AAGAATTCTTTCTACAGAGTAACTGAAAAGGGCAGGAAAACGTGAATTTT
TATCAGCCAGGTCCATCAGCATTCAGAGATTTGTTTTCTTACTGTACTCTC
CACTTAGTTTATTAAATGACATTTTGTGTGATGGTTTAGCTAAGTTATTTTA
AAGCAGGCAACTTTTAACTTCTCTTTCAAAGAGAAATCAAAAAGAATCTG
AATTTAAGAAATAATGATGGAGCTAATAGTACATATGCACATTAGAGAGA
GAGAGGAAGAGAGAGAGAC
>G4QAAT301BHEM5 length=178 xy=0491_0719 region=1
run=R_2011_06_22_21_07_31_
TATAGTCTTCTCTGACTTTTGGAAATTTACTCAGAGAATGGTACACACACA
CACACACACACACACACAACAAAAGAAGTAAATGGTACATTATCTGCAT
GTCTAGTGTAATATTAGCCATCAAGATTGTTTTCCTAAGGGAAAGAAATTG
TTGTATGGAGAGTACCAGTGTGGGTAA
>G4QAAT301AQSGU length=517 xy=0188_0012 region=1
run=R_2011_06_22_21_07_31_
ACTGCACTTTTCTGTATCACCTTCTATGATACATACCCATTTCTCCTGTATT
TTTAAGGTTTAGCACACTGTGATAATTTCATAATGTATATCTTTGATAAAG
TAACTGATCTGGGGAAAAAGGAACATCCAATACCCTGAACCTACTTGGGT
TGCATCAACATATTTGATCAATCACTTGTAAAAATTGTTCATGAATATGGA
AGGATAGAAAAAAGAAGCCACACACACACACACACACAAAGTAACAAT
GGTATTGAAAATGGAGATTACAAACAAAGAGCGCTGCTAGAGCTCCTTGA
GGAATGGTCTTGTGGTTTAATGAGTATTTTCATTAATGATCTTTGACACAA
TAAGTAGGAATATGCTAATGAAATTTGTCACTGAAGCAAATCTCAGAGAC
University of Ghana http://ugspace.ug.edu.gh

109
GTTATCAATACCAAAGAAGATTAAGATAAACACAGAGGAAGCAATGGAT
GACCTTGAGAGCTTTCAATACAACTTAAATGAAATTCAGCAATAGGAAGA
AAAAGAAGGAAGAAA
>G4QAAT301ALJNI length=290 xy=0128_1068 region=1
run=R_2011_06_22_21_07_31_
TGCTGTAAACCCACTGGACTTCTCTTAGGTTCCCTTTTCACTTGAAAGAAT
GAACACGGGCTTAGATAGTGCCCTGCAAATAGGGTGTGTTCTGAAAACCA
CTTGAAAACACACATACACGTTCCCGGGTTTCGGCACCACTTGAAAGCAC
ACACACACACACACACACACAGACACACACACAATAGCAGCAAGAAAG
TCTTTTTTATTCAAAGGTATAGCACTACTTTTATAATTCTTGTTATCCACTA
TTGCCATCTAAAGCTTACTCCCTTAATGCTGATTGGATA
>G4QAAT301BX99P length=516 xy=0683_1771 region=1
run=R_2011_06_22_21_07_31_
CTTAACCTAATCTGTTTTTAAATATCACACCTAGATAGAGGTTAGTAGAAT
GCACTAGTGCAGTTACTTTAATAGTTCAGTGATCAGAAAGATTAAAGAAC
TATACCAGAAAGGAGAAAGATATCTCCCTCTCTGGTTCAACGCTATTGCA
GTAGGGATATTTTTCCCCAGGTCTTTTCTTACCAGCGGGACTGAAGGCATA
AAGACAACACATATTTGAATTCAAGTATCGATAAATAAATGAAGGAGAAT
TTTTGGATATACAACCATTTACCATTGAAGCTAGTTAAACAAGGTTACCAG
ACAGCCTACTAATAACCATAAGAAATTTTTAATAATTTTATTTTCAGAACT
GAGGCACACAATGAAAAACATGTAACTTAGTACATCTTTTTTTGTACATGG
TGCGTGTTTATCTGCAAGAATCGATAGTAACACCAGAGGGCACCATTCAA
CACACACACACACACACACACACACACAAACCCAGCCAGCTGTTGAGTA
CGGACAAAAACG
>G4QAAT301A3ZTS length=294 xy=0338_1678 region=1
run=R_2011_06_22_21_07_31_
ATGTATGCAATGAAGAGAGCTTCTTTAATAATTGCTTTTCAAAAAGAAATC
TTCACAAAACAGCATGCACATGTGCAAATACGTATTTATGCAAATCATCTT
TTTCCTTCTCTCTTTTTAACCCCTTCGGGCATTCTTGTATAAAACTTTTGCA
TCTCATTTTACCATGCATGTTCCAATCCACACAGCTATTTCTCTTAATCACG
CACACATACACACACACACACACACACACAAAAAGCTCAACTGGTATAA
GTCAGAGGAATGTTATGATTACTAATGATCTGTCATGTC
>G4QAAT301BB71Y length=481 xy=0432_0564 region=1
run=R_2011_06_22_21_07_31_
TTCTTCCTTCAGAGGTACCAACACCGCAGAGCCGTGCGTGCCCCCGCTCCC
TCAGACAAGTGTGCATTTCACATGCACACACACACACACACGTGTCCTCC
CGGCTGCACGCCCGCCCGCGACGGGCCCGGCCATCTGCGCCTTTATGCGC
ACAGAAAGGGAACGTATGGACAAAGGAGCCTACAGCGCCGGCACAGGCT
TCTATGGTCTTCAGAGGAGGGCTTTCCCATGTGACACGTCTTTAAGGAGCA
University of Ghana http://ugspace.ug.edu.gh
110
CTGTGTTACCAACAGCTGAAGGTATCTTCGATCCATGAGCTGGGAAGTGA
TGTCAGTGCGGGGCTGGGGGACGTTTCCACCCCGTTGGCACAGCCCGGCC
CGCTCACCCCACGCCTGCACTGCCCATCTCCCTCCGCTCCGCAGTTTTCTT
CTGTATATACAAAACGTGGGAGGTGAAGAGAAGAGCCCTTCGGGCTGAGC
AACGACTGCTGGCTCCTGTGTGTCCATCA
>G4QAAT301AI0Q1 length=390 xy=0099_2043 region=1
run=R_2011_06_22_21_07_31_
TCTTCCTATTGCAAGCGCCGGGCACTAAGCTTGTTACTGCACAGCACACAG
GTGAATTACGACTGGGGCGTGGGAAAGGATTTTCAAATTTCAGTGAGTTC
CCCATTCCTCTCTTTGGGATTGCTCCATTGTAAATTTTGCTAAAAGGACTT
GCACATTTGCCAAGGTACATATTTTATAATATCACCTACTCACTGCTAAAT
TATGTGCAGCAGTTAGGAAACATCTACTGTACCATATGTTAATTGGGATA
AAAACAAACACACACACACACACAACACAGAGATAACTTGAAAAACAA
ATTTTATGAAAGAAATACAGTTTCATAGAATCCTAGTATGGCTTAGGTTGG
AGGGACCGTAAAAATCTTCTGGTTCCAGCCCCCCTGCC
>G4QAAT301BR98J length=483 xy=0615_0321 region=1
run=R_2011_06_22_21_07_31_
GATTCGCTTTCTGGGCTCCAAGCACACATTGCCAGCTGATATACAATTTTT
CATCCACCTAGTCCTTCTGGGCAAGACTACTGTCAGTCAGTTCCTCACTCA
CTCTATACTGATATTGAGGATTGCCCCAACCCAGTTGTAGGGCCTTGCACT
CGACTTTGTTGAACTTCATGAGGTTCAAATGGGCAAACTTCTCAAGGCTGC
CAAGGTCCTTCTAGATGGCATCCCTTCCCTTCAGTGTGTTGACCATACCAT
TCAACTTGGTGTTGCCAGCAAACATGCTGAATGTGCCCCCCAATCCCTTTA
TCTATGTCATTGATAAAGATATTAAATAGTAATGGTCTCAATAATAGTGTA
ATTCATATTAAAAAACTCACACACACACACACACAAAACCAACAAGCTA
GATTCCAAGAAGTGTTATCATTATATTATGAAAATAACTCCATAACACTAC
AGAACGTGAGAATGCTAGTGAAAACG
>G4QAAT301BEYNH length=367 xy=0463_1371 region=1
run=R_2011_06_22_21_07_31_
TGGAGACCTCCTGTACCAGCCAAGAGCCTCAAGGTTGCATCCCTTCCATCC
TTTCCCACTCCCTTGTGGAACCCAGCAGTTTCCCAGGTGACTTAATGCACT
GCTTGATGACAGTACATTAATAAACAGAGATCTGCTGCCTGACAGGGACA
CAGCGCCTGCACTCTGCTAGCAGCTGCCAAGTGTTGTCAAGCAACTAACT
GCCTGTAATTGAGCTCTCTGAAGTATCTGCCCTGAGGTGAGCCACGGAGA
AATTTTACAAATGAAGATAATAGATGTTTATGTCACACACACACACACAC
ACGAGAAGCGGCAAGCTCTGATCGCTCACTTGATAAATCACCTTCAGCAG
TGGCTGACAACAGCT
>G4QAAT301BD16B length=481 xy=0453_0241 region=1
run=R_2011_06_22_21_07_31_
University of Ghana http://ugspace.ug.edu.gh
111
ATGAGGCACTCTGGCCTTAGTCATGGGAATACAGGAGTAGTGGGAATACA
AGGAGCTGAGAGCAGCTGACTCTACTCTTTTCAACAGGCCATTTGGAGAA
AAAATATATGTGACCCGACCCAAGTGCAGAGGAAGGGAAAGTAAACAAA
GCATAAGGGTAAATATATAGGTGGCTAGATGAAAGATGGTTTTGAGCTGA
GGCCAACATTAACTGTGAGGACTGAGTTAAAGTTCCACAAGTGACATTAG
TGATAATGTCAATTTTGCAAATTTCCCATTCTCTGGAATGGGAATTTTCCC
ATTCACTGAATCTGAGAACTTTAATCAGAATGGAAGAGTCAAAAAACTCT
TGAAAAAAAAAACATTTTTCTAAATGTAAAACTTTTTTCTTTTTGGTTTCA
CACACACACACACACAAAAAAAGAGGGTGAGGGAGGAAGAGAACCATG
CCACTATTATTTGATAATATATCAAAATAATC
>G4QAAT301BJUZI length=399 xy=0519_0524 region=1
run=R_2011_06_22_21_07_31_
AGTTAAAGCATATCAGATCGATTGCTGGTTTCCATAGAGAGTTAGATTTAT
TCTCTATGCATGCTACAGCATTGAGATCATATGTCCTCTCACTTTTAGCATT
TTTGAAATTTTGATTGCAAATGGAGTGTGGTGTCAGGGTTTTCCATTGACT
TTAACTGCTGACCTAAGAGATGGCTATTGGGAAATACAACCCAAATATAT
CTATGTATCTTTTGTCATTAGAATTTTGTTGTGTGTTTGTACTGCTGATAAG
CAGACCTGAGTGGCTTTCTTTGGCATGACCTGTGTGTGTGTGTGTGTGT
GTGTGCACATACATATGACTGTAGCTCTCCTTTGCTTGTTTATTGAGATTG
CAGCCAAGTTTGGAAGGATATGTAAGCCAGGGAAACTATGTAC
>G4QAAT301BFUPO length=429 xy=0473_1962 region=1
run=R_2011_06_22_21_07_31_
GAGATGTTAATTACTACTCTTACGAAAACGATGTAAATAGGGACTCAGGG
AAGCAGCGAGGGTTATTAAGGCGAGGAGGCTGTAATTGCCGTGGTGCCCC
TCCCTCCCCATCAGATCTCCGTGGAGGACCGGCCCATCCAGTTGTGTGTCC
TGGCCTTGGGTGTCACCTCGGGACCCTGCACCCGCAGCGGTGCGCGGCCC
GGAAGCGGAGCGAGCGTTGGCAAGCAAAGGGTTTTCCTTGGGGAGAGCCT
TTAGGGAGCTGCAAATGGAGTCTCCGAGATGTTGGTTTGTGTGTGTGTGT
GTGTGTGTGTGTGTTGTTGTTTAGTTTTAAATCATATCTTCGTATTTCATT
TAATAATGGATGAATGATCAGAACCCCGTGCTGGCGCGGAGCAGTGGGTT
GTGTAAGAGGCGAAAGATTCCAGCAAC
>G4QAAT301A3MWX length=421 xy=0334_1327 region=1
run=R_2011_06_22_21_07_31_
CCCATCAGCCGGGTTGATGATGAAGTTGTTAAGCAGTCTTGTTCCAGTTGT
CATCACAGTATATGCATGGTGAATAAGAAGTTTTCCTCTATAAAAATGTG
TGTGTGTGTGTGTGTGTGTGTGTATAATCAGCACACACTAATTTGCAGA
GGCATAGGTAGGTAAAAATAGAAATAATCGATAGGAAAGTATAGAAAGT
AGGTAATTTAGTAAAGAAAATAGCTGATGCACACACTAGGCTAGAAGGTG
TAGTATATAACTAATCTCCTGATGAAAACTTGTATTGTTCTATATTCTGTTG
TGCTAGATAATCTCAAAGATGTAGTTTTAGTTATCTACCTAAAACAGTACC
University of Ghana http://ugspace.ug.edu.gh
112
TTTTTACTTCTCGTGGAGAGGCTTTATATCTAGAAACTACCCTGTTCACTAT
GTCTTGACACTGGAGTA
>G4QAAT301BRYSU length=458 xy=0611_1884 region=1
run=R_2011_06_22_21_07_31_
TAAGAGGAGTACAAGCCTTTCTTAGGAAAATGCATGGATTTCCAGCTTGA
AAACTGACTGCTGATTTGTTTTGTGTGTGTGTGTGTGTTTCCTTTTCATTT
GACTGAAGCAGTGCTGCTTCACAGAATCATAGAATCATATTCATCATAGA
ATCATATTCATCATAGAATCATATTCATATGGAGGAAGATTCATCTACAGG
GCTCCTCTGGGGAGTGCTCAATGGTCTGTGTCTGTGGATTCAACCCTTCAT
GTGACCCAAAGTGCCTCCATCCATAGAAAAAGGAAAGTCTCTGCTGTCTG
GCAATGTACACACATCCAGTCTCATGGTGAGAGGGGAAAGCATCCTCTGA
GCCACGTATTTTGCTCATCCAAATCCCTGTTATCGAATTTGACATGTGCTT
ATCACAGCATGCACAAGAGCCCCTATGGGAAGAGATGGGATGTATGGGG
GTGAT
>G4QAAT301ACCH6 length=413 xy=0023_1980 region=1
run=R_2011_06_22_21_07_31_
TTTTGGGAATATGTTTAGGAAGTTTATTTAAACCTTCCTTGAGCTTCCAGA
AATGATTTTAAGCCATTCATGTGTAGGAATGTTTCTGAGTTCTGACAAAAG
TGAGAACAGTGTCATTCTGTATTGCTCAGAAGTACAACCAGTAACCCCAG
CTGGTGTAAGCACAGACATCTCCAGTGACTTTATAAACCTGCAGAAACAC
ATTTTTTGAAATTATGGAATAAACTGCTTTTCAAATGACAATGTTCTTTAA
AATTCAATAGTGCATGAAAAAGCTTGTGCTGTGATGATCATAAAAAACTG
AAATTTACAAAAATTTTTTTAGTAGTATAGTGTGTGTGTGTGTGTGTATA
TATATACACAGATATGTGTATGTACTCTTACCACAAATGAAGTATTGCAGT
ACACAGCTA
>G4QAAT301A76GJ length=490 xy=0386_0289 region=1
run=R_2011_06_22_21_07_31_
CAATTTCTGCAAAAACTTCCTAGAAATTCAAATAGATAACAAACATAATA
TATTTTACTGAGACAGAATCTCAGGTAGAGGTGTTCTAAAGCATGGCATG
GAAGTTTCCATCCTCTCTCCTGACTTCCAAAAATCGGACACTGATTTTTTG
ACTTAACCAGTCACCATCCCACTTGGCTTTCCTATCGTTTTCTCCTAGCTAG
TACTGTTAGCTGTGTGTGTGTGTGTGTTGGTGCTGTAAAATATACTGTAG
CTATGTGCAGCCAGACTTTTTCCCTCAGTATGATGAATAGAGGAGAGTAA
ATAGTCCATGAGTTCAAGCCTTAAATTCATAGCATAAGCTTCCATTGCCCA
GAGGTCTGTGAAAATTGTGCTGAATGCATCACAAACTGAGGAACTGGGGA
CTTATTATTTCTCTAATCTAAATTCCCTGTCAATTTTCTTGCATTCAATTCT
CTCTTTCCAGGTCTCTGAATGCCTGTATCTTCAA
>G4QAAT301AAKP4 length=530 xy=0003_1242 region=1
run=R_2011_06_22_21_07_31_
University of Ghana http://ugspace.ug.edu.gh
113
CATCTGAAGCGATGTCCTCCTTCCTGTCTAATCAACATTGCTGCTTCTTCAT
TTAGCACTACTTCAAAGTCACCACTGCTTTTACTATCCTTAAATTTAACTTC
ACAATACTAACTTATTTCCTGAAATATTCTAACTATTGTTTTTCTTAATAAT
ATTAAGTCTCTGGAAAAAATGATTTCTGCATGGAGTACAAAAACTATGAG
AAACATTTCCCAAACTGGAAACTAATGTCTTCTCTAAACTGGACCAATGG
AACTCCTAAGCAATTTTGTAGAACTAAGTCTGTACCACAGATCTCTTTTTC
ACAAGTGTGAAGCAATGTCGATTATTTGTGTGTGTGTGTGTGTGATTAC
AGTACTTTTTCTAGTCAAATAATGCAATTAAATACTTTTTTTTTTTTTGGTA
AGTCCTATACTCAAGACCCTTGTCTCTCAGCTTACCAAACAATGAAGATAG
TCCCTCTCCTAATTCAGTGTCTGAGGCCATAGATGTGAAATAGAATTACAT
CATCTAAATGTTTTTACTGC
>G4QAAT301AIKN9 length=453 xy=0094_1687 region=1
run=R_2011_06_22_21_07_31_
GATAAACTAAGTTTTCAGCAAAATCCAGCTCTTGTCATTCCTCTTGTGTGT
GTGTGTGTGTGTGTACGTATGTGTGTGTTGGTGTCACAGTTCATTCTGCTG
TTGCAATATAAATCCCTTGATGTTGGCTGTCCCATTTCTCTCTGCCCATGCA
CATCTTGACAAAAACAGCTTCAGACCTCTTGCTTCCGGGTACCACTAATAT
AAGCTGTCCCATGATCTGTATGTGCTAGGCCTGAGCTGCTGTACCCCCTGC
AGTCTCCTTAAAAATTCTCCCTTGTGGTACTTTCTACTGTTGATATAAATA
ATTCAGTTTTTTACAAACATATTTTATTAATGTAATTGTTTCTTTGTGCTCA
GCAGTTTTCAGGAAAAGGAATTCTGATCATGGGTCTTTGAAGTGGTGGTA
TTTTTTGGTAGTTACGTTTTACATAATCTGTTCTCCGCAATACC
>G4QAAT301BVWMW length=134 xy=0656_1382 region=1
run=R_2011_06_22_21_07_31_
CAACTAAGTTCCTTGATTTCTCAGAAATGTCAGATTTTTACTTGAGTGTTC
AGGATATATATGAATGTGTGTATATGTGTGTGTGTGTGTGTGTGTGTCA
GAGAGAAAGTCAAAGAGAGAAACTCTGCATTAGC
>G4QAAT301B1L8O length=548 xy=0721_1606 region=1
run=R_2011_06_22_21_07_31_
GTTCCCAAACAGTAAAACTCCCCCAGCAGCTCTCTCTTCAGCTGCAAACA
GCGAGCTTACATGCAGGGAGGGGGAAAAATGCAGCCACATTCCTTTCGCA
CTCCCACTCGCCTCTGAGGTTCTTCCACTTCCTTCCTATGGCTTTTTTTAGA
ACTGTAGTGTTTTTCTCACGTCCGGCAACAAAGGATGTTTTGTGCTGCTGC
CGAGGTTGTTGGTTTCTTTTTCTTTTTTTTTATTTTGTGTGTGTGTGTGTGT
GTGTGTTAACTTCAAATGCAGCTATCGTGTTTAGAAAATATCACTCTTGTT
TGTGTGGGAGCGCTAACTTTTTTGCTCTCCCGTACCTTACAGCATGATCAA
ATGCTGGAAATTGGTTTAGTTGGTTAAACTTCCCCCACCAGAGTCGACTAT
TTGTATTTTCCTGGAACCACCTTTATTACTTACAAAAACCACTGTGCTGCA
GCCCTAAAGGTAGAATGACATTCGGGAGCTTGAGGGGATTTCTCTGCCCT
ATTACTGAATGAGCAATGGCACCGCTCCAGAATTAGCGT
University of Ghana http://ugspace.ug.edu.gh
114
>G4QAAT301ABM8I length=170 xy=0015_2000 region=1
run=R_2011_06_22_21_07_31_
CATGTAGTCAGAGCAATCACAGTAGTGGTGGCTGTGTGAAAGGAGAGTAA
TTGCCTATGCAAATTAGACACACAATTACAAGCATTTGTGTGTGTGTGTG
TGTGTGTGAAGTATTTATGACTTAAAATGCGTAGTCCTTTTCATACAGTTA
GGCATGTTGGCAGTCTTCT
>G4QAAT301AJLUV length=438 xy=0106_0725 region=1
run=R_2011_06_22_21_07_31_
GTTTTGGTACGTGTGCGTAAATATAGAAGTGAGTTAAGCTGGCAAAAGTT
TCATGTGAATTTCTTGTTCTCCATCAGCTCTGTGTGTGTGTGTGTGTGTG
TGAGAGCATATACACATTTATTTTTTGGTCTGTATTGATGCTTAGTGAGCA
GGTGTTTTGTGGTTCGCGTCCCTAGGAATCATACTGCGCTGGCATGTATGA
GTAAGAGATGTAGGAACAGGAGATCACATCTTTCTTTGTGCTACATTTGA
GAAGGAGCTGACTAAATTTTTCTGTGCTGCATAGAATGCAAACTACTTTAA
AGTGGCATAAGTCTGAACAGCTTCTAGACAGGTACAAATATTGCTTTAAG
ATAGGTATGTCATCCATACCAGGCAGTGGTGCGTGTTCTCACACTACCTCT
GTACTTAATCCTTTGTCTCTCACATTGGTAATGT
>G4QAAT301BSWC2 length=467 xy=0622_0324 region=1
run=R_2011_06_22_21_07_31_
GAAACAAAACACAATTTAAAGGTGATTCTGAGAGTGAAATACCTGCAAGT
AGGATTTCATATTCAGTACGGATACAAAGCCCCCACACTGAGCCAGGTGC
CAGAGGAAACTGTTGGCAGAATGAGTGACACCTGACCATCATCATCATC
ATCATCATCCAAATTCATTTAGGGCGTTCCTCAGTCTAGCAGCCCTAACA
GATCGTCCATATATTCTTTCTATAAGTGCATATATTCATGTAAGTGTACAT
TCATGTATCTATATCTATATATGTAGGTATTCTCTGGACCACATTAGCCCA
AAAAAGCTATTTTGCTCACAAAGCTATTTTGCCCACAAGAGTGATCGTATG
ATTAATGGGTTCTCAGGGGAGGGTTTTGTCTTAATTGCTGCCCTGTTTGGT
GACACTGTGCAGGCGTTGTGCTCTGCTGTCTGCATGTCCAGGTGGGAAAA
AACAGCACAAGTGT
>G4QAAT301BLACK length=474 xy=0535_1554 region=1
run=R_2011_06_22_21_07_31_
AGCAGCAACCAATGCCTCACTGTGCTCACATCTATTGGATGGTCTCTACAA
ACATCCAGCGAGTCAGTGAATGTCAGTGGGTGCTGTTTTTCTGCATAGAG
GAATCCAGTGACACACCTTTGCTTCACATGCACTTGCACATCAGATGCCAT
TCTGTCAGATTGCCCCTCTGCTGCCATCTGTCACACGGTAACAACATGTAA
CTGGATGCTGGTGGGAAAGTACCTCTACTGCCCTACCATCATCATCATAA
AATACCAGGTTTTATTTCAAAGCAGCCCTCATTAAATAATTAATGTAGTTA
ATGTATAGAAAGTAACAGAACATTTTAATGTTAATGTTTTTTTACATTAAA
ACATTGAAAAAAGTAAGCAACAAAACCATAAAATTAGTAGAGTATGTGC
University of Ghana http://ugspace.ug.edu.gh
115
ATTCCTTGTTTTGTGAAACTAACACATCACTCTGGTTAGATGGCAGTGGCT
GCCATTCACAGTCCGCTCT
>G4QAAT301BKHZS length=418 xy=0526_1670 region=1
run=R_2011_06_22_21_07_31_
GATGAAAGTGCACAAAAGGAAATCAGTTTTGGTTCCAAAGAATCTGCGTG
ATGGGAAGCGTTAGTGTGGTGCCCAGAGGAGATAATGATGGAGGCTGCTG
ACTGCCTCTTCCTCCTCGTTTAATTTACAGTGGAAGTTACAAAGTGCATCT
TCTGCCTTGTGCAGTGCAGTGGGAAATGGTGAGTGTTGCAGGGAACCTCA
GTTGTCTTTGGCCAGGCTCACTCCCACAGGACCGCCTCAGTGGGGCCTTCC
AAGAGTGCTCCTGCTGCTGCTGCTACTTGTGATTGGTACTGAAATACCTT
GAACTGTGTGTTCTAGCAAAAGGAGCAGCATGCCTCCGAAGAGAAGTACT
CTGTTCTTGGAGGCTCCCACACCACGTTCCTGCTGCCTGCATTTCTGCCTG
CCGGACGTACAGCAC
>G4QAAT301BE4YD length=521 xy=0465_1347 region=1
run=R_2011_06_22_21_07_31_
ATTCCAAATCACTGTAAAAATGTAAGTGGGTACAACAGTAAGTACGGATC
CTATGTAATGAGATCAGGTGGAAAAACTGTACTTGTTTAAGAAAACAAAT
GAACTCCTGACTGCTGCTGCTGATGACTCAGAAAATGTGCCTGGCACGT
GAAGAACACTCAAATGAAGCCATTCCCCTCTCCACCTTCTGTAGTGAAAA
GCATAAAGGCTGGTGCTATGGTGACACTGGAGAGCAGGAAATGTATTTTG
GTATATTTCTGATCTGACTGGCTTCGTTCGTATCTTCTGGACATTTCCAGCA
AAGCTGGAGAAGAATCAGAGTCTTAAAACATCTGTTTTAAATAGTTGATC
GTTTTCATTTTTGTCTCAGAGATGCTTTAAACAAATGAGTAGTAAGGATGC
TGACACTAGGCTTATAATGCTGGGGTTAATTGTAAGGGTATTAAACATAT
ACAATTTTAATGTTAAGCCCCTAGGAGATGTTTTTAAAGAACAAATTAAC
ATATTCTAGACAGATCTGT
>G4QAAT301AC7HB length=459 xy=0033_1165 region=1
run=R_2011_06_22_21_07_31_
CTGATCTGCTGTTATCATCCTCTAAATTGATTAGGTGGGCATAGACTTCAC
TGGCTCCAATGGTGATCCCAGTTCACCAGATTCTCTTCACTACATCAGCCC
AGATGGGATAAACGAGCACTTGATTGCCATCTGGAGTGTGGGAAGTGTAG
TCCAGGATTATGACACGTATGTAAGAGGCTCTTAACTGTTGTAGCCCCCTC
TTAAAAATATTTCACAGTGGATTTATTGGTCAAGGCTAATGCCTTGTTCCA
GAGCTGTAGTATTTGGATGACTGAGGTGCTGCTGCTTTTCTTTGGGAGATC
CCTTCAGGAACTGCTGCTGCTGCTTCTTGCTTCTGGCACTGCCAAGAAAG
GCAATGACAATACTTTTTTAATTCACCATGTTTGCTTTATTTGTCCTTCCAG
ATCTTCCAGGGACCTTTATGGTCCTCAGTTACTCTGTAGTGCTGCTTTAGCT
>G4QAAT301BUQ69 length=452 xy=0643_0931 region=1
run=R_2011_06_22_21_07_31_
University of Ghana http://ugspace.ug.edu.gh
116
ATGGAGAGAGACAAAGTGCTGGGACCTTTGGTGTGTCCGTACTGCATCAG
GAGGTGCAGCTCCCAGAGCAGGCAGCCCAGCAGGAGGAGGACGGGCCGA
TGGATGAGAACGCAGTGGGGCAAAGTGCCCCCACAGTGCTGGAAAGAGA
AAGGGGTAAAAGGAGAGGAGTGGAGGGAAGGGAAGGGAAAGGAAAATG
AAACAGAAGGTGAATGCTGTATGTGCTGGTGCTGGCAGCTGTGGAGCTGC
TGCTGCTGCTGCGTGGCTGCTGGTTCCCCTTCCTCTGGGCGCAGCTGGGA
GCTTTTGTGGCTTTGGTGCCTGCAGTGCGGGTGGCATTTGTCCCGCCAGCC
GCCCGTCACCCTCCTGCAGCTTTTCCAGAGCCACGCTCGATGCCGGCCCTC
TGCCTGCTGCTGCTGTTCCAGGGTGAGGTGCACAGCTACAGCGACGTGCA
GGGG
>G4QAAT301AZUE4 length=501 xy=0291_0558 region=1
run=R_2011_06_22_21_07_31_
AAAAATAAGAGAAAACAACCCAAACTCCGGAGTTGCTTTGTTTGGTCCAT
TGGTAAGTGCAGTCATCTGGTTGTGTGACAGAATTCAACATTTGTCTGGTG
TCAGACTGTGATGTTAATTGTTGGTTTTAAAAGAGAAAAGATAAATGTTTG
CATCTGATGATGATGATGATGATGATAAAGACTGCTCGCAGGCTAATCA
TTCTTGGGGCTAGTAGGGGGGTATTAGTGAGTAGACTGCAGCATATTGGT
CCAAAGTACCTGAAACTGTCATTTATTTCTGGGTTCTGTGTACTACATCCA
CAACCATTTGACTGTCCTGTACAATGTGCTAGAATTCTCAAGCCTAATGTT
TTAAAAATCCCTTACTTCATCGCCACTAAAATCTCAGTTCAGTGCCACTAA
TTTAATAATTTGCTTGTGTGCTGCTGAACGCAGACATTGCCTCGTGCCAGA
ACAACTTCCAGCTCTTCCTCCTGCCTGGTGGCCAGACAGTAACTGG
>G4QAAT301BZOWA length=468 xy=0699_1848 region=1
run=R_2011_06_22_21_07_31_
CATATTCAATTTTCACAGTTTTTCACTACTACCTATATTTCATGCTAAGAAA
ATTTCTTTGCATGGATTCTAGAATTATCCGGATCAAACAAGATATAGAGAT
TCAGAACTGTCATATTTCCCATAAATACAGACTTACTTTCATGATATTCAG
CTCTACCATGGGAGAAAATCATCTTGGCCCTATCCTCAAATAGTCTCCTTT
TGTTCATCTCCATGTGGACTTTGTCAAATTCTTATATATTCTCCTTGCCTTT
TCAGTGGCAGTAACAGAATACATACATACATACATACATACATACATAC
ATACATACATATATATGATTGTTTTGGTTTTATTTAATTTTTTGTTTTAGTT
GGTCTAAACTAGGCAACAGAAGAGTATGAGAGCACTTCTTACAGGCTTTG
AATAATCAGAAGGCTGATGCATGTGAAGCAATGTTATGTGAAGTAGAAAC
TTAATTGGGT
University of Ghana http://ugspace.ug.edu.gh

117
Appendix IV: Genotypes of 38 polymorphic and monomorphic microsatellite loci using 32 unrelated guinea fowls
DNA
Sample GF12F GF17F GF16F GF5F GF19F GF20F GF2F GF4F GF13F GF15F GF37 GF50 GF69
1 104/104 214/214 172/172 166/166 147/147 110/116 192/196 213/213 116/116 164/172 2223/223 173/173 221/221
2 104/104 212/212 172/172 164/168 142/147 116/116 192/192 213/215 116/116 NA 223/227 NA 203/203
3 104/104 206/206 172/172 164/164 142/147 110/116 192/192 213/215 116/116 164/164 223/227 164/173 203/203
4 104/104 206/212 172/172 164/168 142/147 116/116 192/192 213/215 116/116 NA 227/227 173/173 203/203
5 104/110 206/212 172/172 164/168 142/142 108/116 192/192 213/213 126/126 164/164 223/223 173/173 209/234
6 110/110 206/212 172/172 164/166 NA NA NA 213/213 120/120 NA 223/227 169/173 203/203
7 102/104 206/212 172/172 164/166 142/142 110/110 192/192 213/213 120/124 164/164 223/227 166/173 212/220
8 102/104 206/206 172/172 164/166 142/142 108/116 192/192 213/213 126/`36 164/164 223/223 173/173 204/221
9 102/110 206/212 172/172 164/166 142/142 108/108 192/196 213/213 116/124 164/164 223/223 173/173 214/220
10 94/110 206/212 172/172 166/166 142/147 108/110 192/192 213/213 136/152 164/164 NA NA NA
11 104/104 212/212 172/172 164/166 142/142 108/116 192/192 213/213 116/116 164/172 223/223 173/173 220/220
12 94/110 206/212 172/172 164/166 142/142 108/116 192/192 213/213 120/136 164/164 223/223 173/173 214/214
University of Ghana http://ugspace.ug.edu.gh
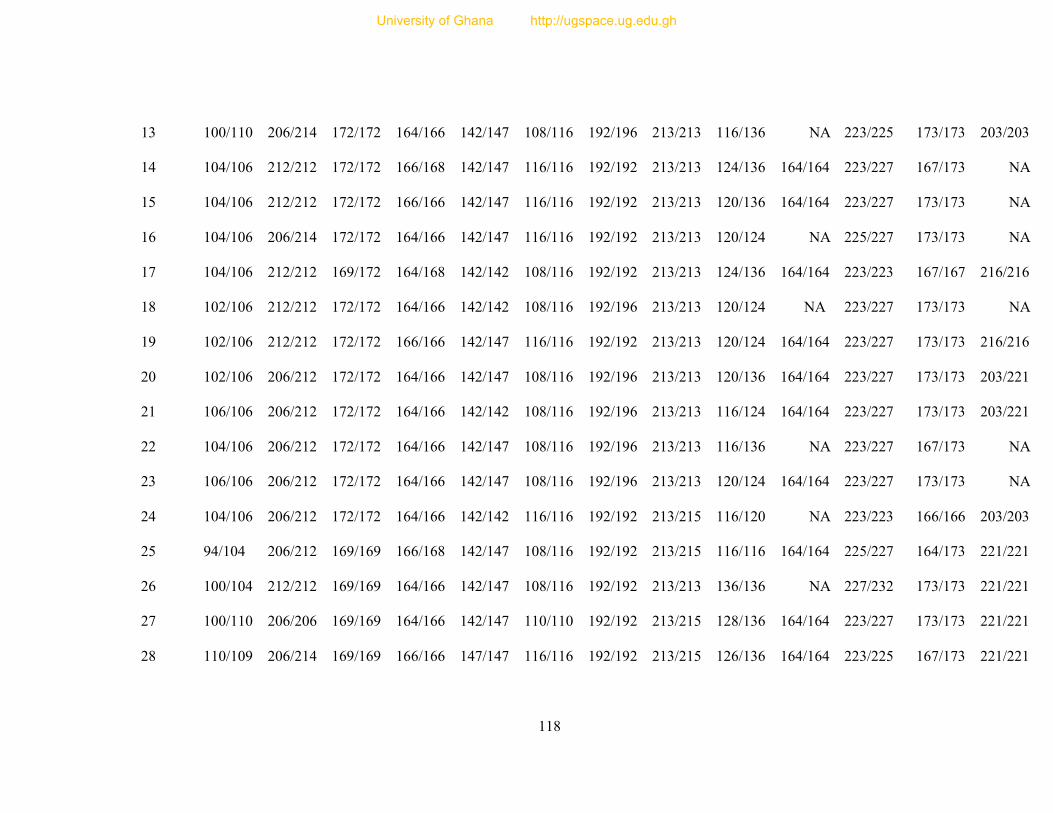
118
13 100/110 206/214 172/172 164/166 142/147 108/116 192/196 213/213 116/136 NA 223/225 173/173 203/203
14 104/106 212/212 172/172 166/168 142/147 116/116 192/192 213/213 124/136 164/164 223/227 167/173 NA
15 104/106 212/212 172/172 166/166 142/147 116/116 192/192 213/213 120/136 164/164 223/227 173/173 NA
16 104/106 206/214 172/172 164/166 142/147 116/116 192/192 213/213 120/124 NA 225/227 173/173 NA
17 104/106 212/212 169/172 164/168 142/142 108/116 192/192 213/213 124/136 164/164 223/223 167/167 216/216
18 102/106 212/212 172/172 164/166 142/142 108/116 192/196 213/213 120/124 NA 223/227 173/173 NA
19 102/106 212/212 172/172 166/166 142/147 116/116 192/192 213/213 120/124 164/164 223/227 173/173 216/216
20 102/106 206/212 172/172 164/166 142/147 108/116 192/196 213/213 120/136 164/164 223/227 173/173 203/221
21 106/106 206/212 172/172 164/166 142/142 108/116 192/196 213/213 116/124 164/164 223/227 173/173 203/221
22 104/106 206/212 172/172 164/166 142/147 108/116 192/196 213/213 116/136 NA 223/227 167/173 NA
23 106/106 206/212 172/172 164/166 142/147 108/116 192/196 213/213 120/124 164/164 223/227 173/173 NA
24 104/106 206/212 172/172 164/166 142/142 116/116 192/192 213/215 116/120 NA 223/223 166/166 203/203
25 94/104 206/212 169/169 166/168 142/147 108/116 192/192 213/215 116/116 164/164 225/227 164/173 221/221
26 100/104 212/212 169/169 164/166 142/147 108/116 192/192 213/213 136/136 NA 227/232 173/173 221/221
27 100/110 206/206 169/169 164/166 142/147 110/110 192/192 213/215 128/136 164/164 223/227 173/173 221/221
28 110/109 206/214 169/169 166/166 147/147 116/116 192/192 213/215 126/136 164/164 223/225 167/173 221/221
University of Ghana http://ugspace.ug.edu.gh
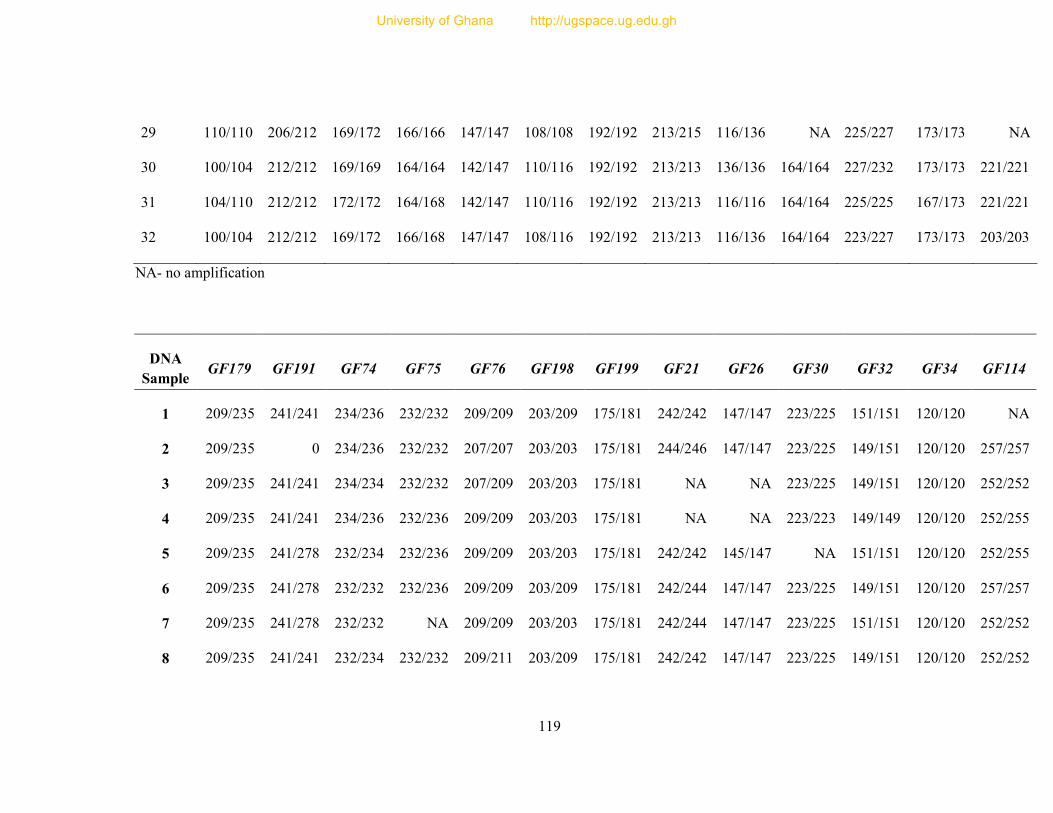
119
29 110/110 206/212 169/172 166/166 147/147 108/108 192/192 213/215 116/136 NA 225/227 173/173 NA
30 100/104 212/212 169/169 164/164 142/147 110/116 192/192 213/213 136/136 164/164 227/232 173/173 221/221
31 104/110 212/212 172/172 164/168 142/147 110/116 192/192 213/213 116/116 164/164 225/225 167/173 221/221
32 100/104 212/212 169/172 166/168 147/147 108/116 192/192 213/213 116/136 164/164 223/227 173/173 203/203
NA- no amplification
DNA
Sample GF179 GF191 GF74 GF75 GF76 GF198 GF199 GF21 GF26 GF30 GF32 GF34 GF114
1 209/235 241/241 234/236 232/232 209/209 203/209 175/181 242/242 147/147 223/225 151/151 120/120 NA
2 209/235 0 234/236 232/232 207/207 203/203 175/181 244/246 147/147 223/225 149/151 120/120 257/257
3 209/235 241/241 234/234 232/232 207/209 203/203 175/181 NA NA 223/225 149/151 120/120 252/252
4 209/235 241/241 234/236 232/236 209/209 203/203 175/181 NA NA 223/223 149/149 120/120 252/255
5 209/235 241/278 232/234 232/236 209/209 203/203 175/181 242/242 145/147 NA 151/151 120/120 252/255
6 209/235 241/278 232/232 232/236 209/209 203/209 175/181 242/244 147/147 223/225 149/151 120/120 257/257
7 209/235 241/278 232/232 NA 209/209 203/203 175/181 242/244 147/147 223/225 151/151 120/120 252/252
8 209/235 241/241 232/234 232/232 209/211 203/209 175/181 242/242 147/147 223/225 149/151 120/120 252/252
University of Ghana http://ugspace.ug.edu.gh
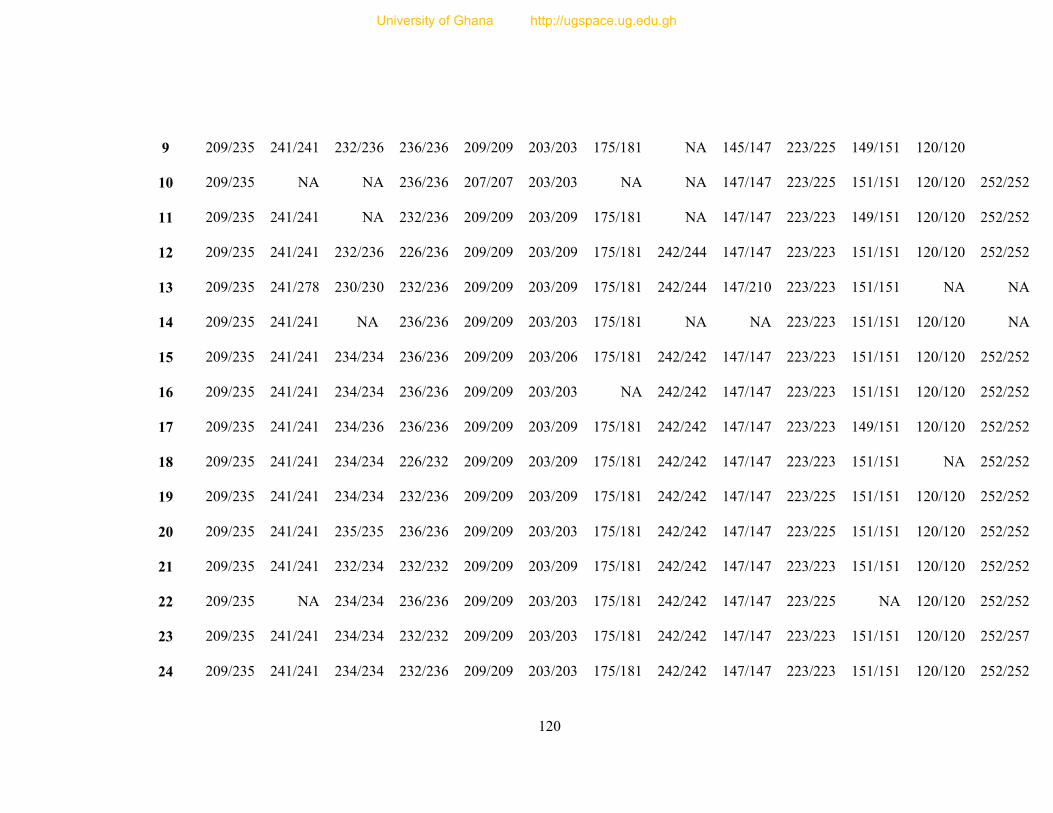
120
9 209/235 241/241 232/236 236/236 209/209 203/203 175/181 NA 145/147 223/225 149/151 120/120
10 209/235 NA NA 236/236 207/207 203/203 NA NA 147/147 223/225 151/151 120/120 252/252
11 209/235 241/241 NA 232/236 209/209 203/209 175/181 NA 147/147 223/223 149/151 120/120 252/252
12 209/235 241/241 232/236 226/236 209/209 203/209 175/181 242/244 147/147 223/223 151/151 120/120 252/252
13 209/235 241/278 230/230 232/236 209/209 203/209 175/181 242/244 147/210 223/223 151/151 NA NA
14 209/235 241/241 NA 236/236 209/209 203/203 175/181 NA NA 223/223 151/151 120/120 NA
15 209/235 241/241 234/234 236/236 209/209 203/206 175/181 242/242 147/147 223/223 151/151 120/120 252/252
16 209/235 241/241 234/234 236/236 209/209 203/203 NA 242/242 147/147 223/223 151/151 120/120 252/252
17 209/235 241/241 234/236 236/236 209/209 203/209 175/181 242/242 147/147 223/223 149/151 120/120 252/252
18 209/235 241/241 234/234 226/232 209/209 203/209 175/181 242/242 147/147 223/223 151/151 NA 252/252
19 209/235 241/241 234/234 232/236 209/209 203/209 175/181 242/242 147/147 223/225 151/151 120/120 252/252
20 209/235 241/241 235/235 236/236 209/209 203/203 175/181 242/242 147/147 223/225 151/151 120/120 252/252
21 209/235 241/241 232/234 232/232 209/209 203/209 175/181 242/242 147/147 223/223 151/151 120/120 252/252
22 209/235 NA 234/234 236/236 209/209 203/203 175/181 242/242 147/147 223/225 NA 120/120 252/252
23 209/235 241/241 234/234 232/232 209/209 203/203 175/181 242/242 147/147 223/223 151/151 120/120 252/257
24 209/235 241/241 234/234 232/236 209/209 203/203 175/181 242/242 147/147 223/223 151/151 120/120 252/252
University of Ghana http://ugspace.ug.edu.gh
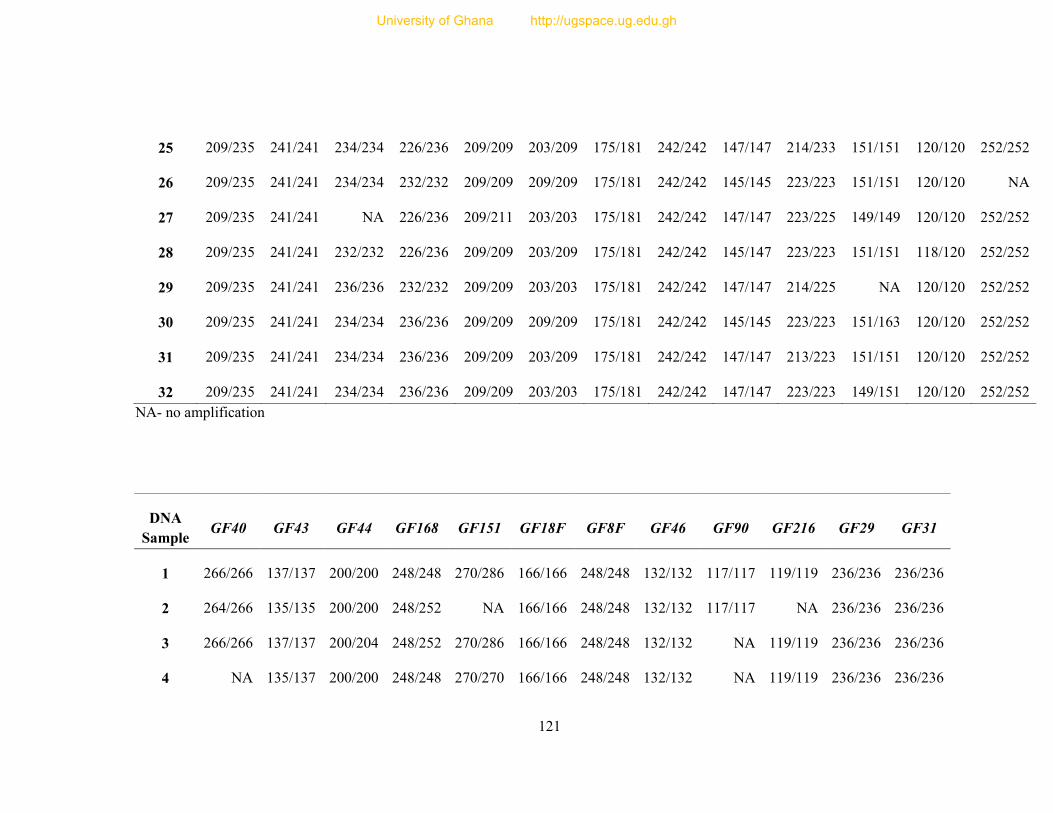
121
25 209/235 241/241 234/234 226/236 209/209 203/209 175/181 242/242 147/147 214/233 151/151 120/120 252/252
26 209/235 241/241 234/234 232/232 209/209 209/209 175/181 242/242 145/145 223/223 151/151 120/120 NA
27 209/235 241/241 NA 226/236 209/211 203/203 175/181 242/242 147/147 223/225 149/149 120/120 252/252
28 209/235 241/241 232/232 226/236 209/209 203/209 175/181 242/242 145/147 223/223 151/151 118/120 252/252
29 209/235 241/241 236/236 232/232 209/209 203/203 175/181 242/242 147/147 214/225 NA 120/120 252/252
30 209/235 241/241 234/234 236/236 209/209 209/209 175/181 242/242 145/145 223/223 151/163 120/120 252/252
31 209/235 241/241 234/234 236/236 209/209 203/209 175/181 242/242 147/147 213/223 151/151 120/120 252/252
32 209/235 241/241 234/234 236/236 209/209 203/203 175/181 242/242 147/147 223/223 149/151 120/120 252/252
NA- no amplification
DNA
Sample GF40 GF43 GF44 GF168 GF151 GF18F GF8F GF46 GF90 GF216 GF29 GF31
1 266/266 137/137 200/200 248/248 270/286 166/166 248/248 132/132 117/117 119/119 236/236 236/236
2 264/266 135/135 200/200 248/252 NA 166/166 248/248 132/132 117/117 NA 236/236 236/236
3 266/266 137/137 200/204 248/252 270/286 166/166 248/248 132/132 NA 119/119 236/236 236/236
4 NA 135/137 200/200 248/248 270/270 166/166 248/248 132/132 NA 119/119 236/236 236/236
University of Ghana http://ugspace.ug.edu.gh
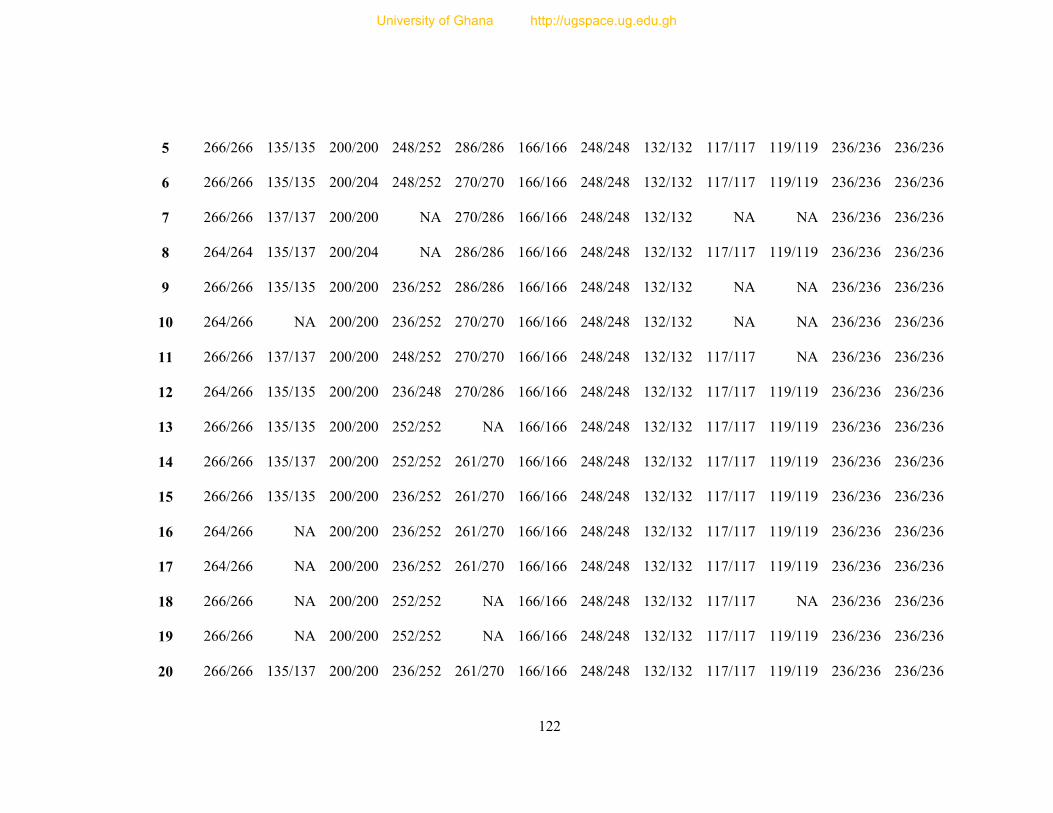
122
5 266/266 135/135 200/200 248/252 286/286 166/166 248/248 132/132 117/117 119/119 236/236 236/236
6 266/266 135/135 200/204 248/252 270/270 166/166 248/248 132/132 117/117 119/119 236/236 236/236
7 266/266 137/137 200/200 NA 270/286 166/166 248/248 132/132 NA NA 236/236 236/236
8 264/264 135/137 200/204 NA 286/286 166/166 248/248 132/132 117/117 119/119 236/236 236/236
9 266/266 135/135 200/200 236/252 286/286 166/166 248/248 132/132 NA NA 236/236 236/236
10 264/266 NA 200/200 236/252 270/270 166/166 248/248 132/132 NA NA 236/236 236/236
11 266/266 137/137 200/200 248/252 270/270 166/166 248/248 132/132 117/117 NA 236/236 236/236
12 264/266 135/135 200/200 236/248 270/286 166/166 248/248 132/132 117/117 119/119 236/236 236/236
13 266/266 135/135 200/200 252/252 NA 166/166 248/248 132/132 117/117 119/119 236/236 236/236
14 266/266 135/137 200/200 252/252 261/270 166/166 248/248 132/132 117/117 119/119 236/236 236/236
15 266/266 135/135 200/200 236/252 261/270 166/166 248/248 132/132 117/117 119/119 236/236 236/236
16 264/266 NA 200/200 236/252 261/270 166/166 248/248 132/132 117/117 119/119 236/236 236/236
17 264/266 NA 200/200 236/252 261/270 166/166 248/248 132/132 117/117 119/119 236/236 236/236
18 266/266 NA 200/200 252/252 NA 166/166 248/248 132/132 117/117 NA 236/236 236/236
19 266/266 NA 200/200 252/252 NA 166/166 248/248 132/132 117/117 119/119 236/236 236/236
20 266/266 135/137 200/200 236/252 261/270 166/166 248/248 132/132 117/117 119/119 236/236 236/236
University of Ghana http://ugspace.ug.edu.gh
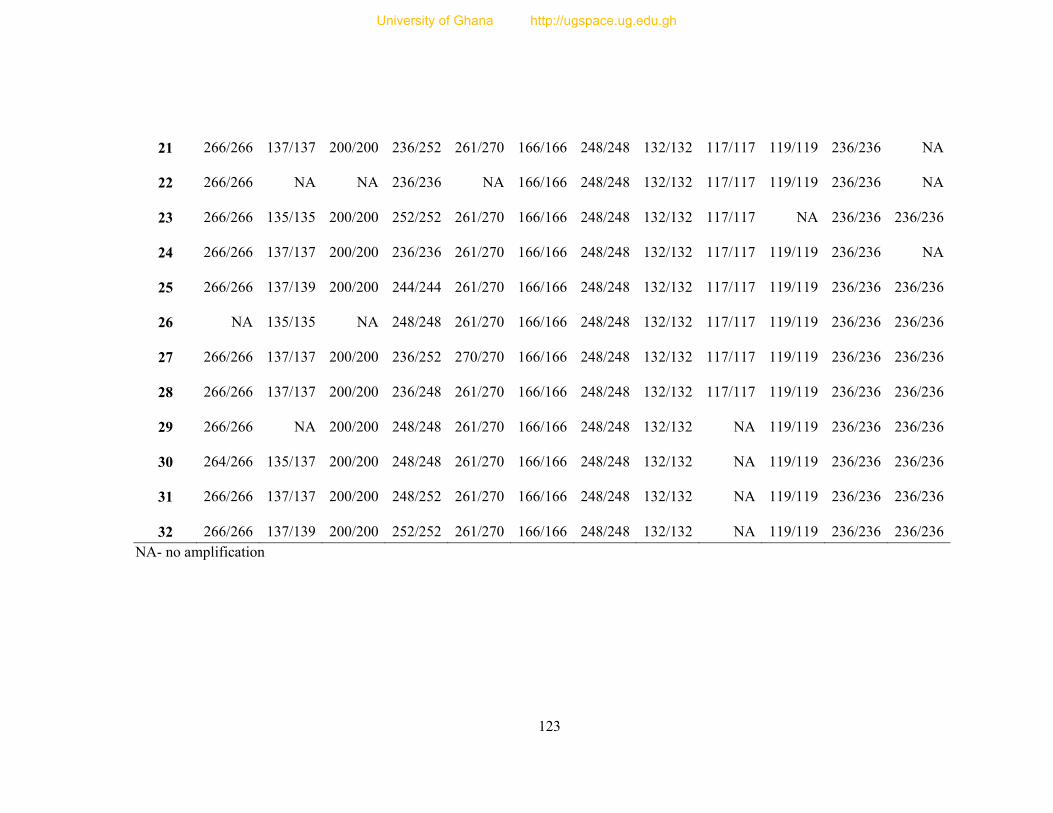
123
21 266/266 137/137 200/200 236/252 261/270 166/166 248/248 132/132 117/117 119/119 236/236 NA
22 266/266 NA NA 236/236 NA 166/166 248/248 132/132 117/117 119/119 236/236 NA
23 266/266 135/135 200/200 252/252 261/270 166/166 248/248 132/132 117/117 NA 236/236 236/236
24 266/266 137/137 200/200 236/236 261/270 166/166 248/248 132/132 117/117 119/119 236/236 NA
25 266/266 137/139 200/200 244/244 261/270 166/166 248/248 132/132 117/117 119/119 236/236 236/236
26 NA 135/135 NA 248/248 261/270 166/166 248/248 132/132 117/117 119/119 236/236 236/236
27 266/266 137/137 200/200 236/252 270/270 166/166 248/248 132/132 117/117 119/119 236/236 236/236
28 266/266 137/137 200/200 236/248 261/270 166/166 248/248 132/132 117/117 119/119 236/236 236/236
29 266/266 NA 200/200 248/248 261/270 166/166 248/248 132/132 NA 119/119 236/236 236/236
30 264/266 135/137 200/200 248/248 261/270 166/166 248/248 132/132 NA 119/119 236/236 236/236
31 266/266 137/137 200/200 248/252 261/270 166/166 248/248 132/132 NA 119/119 236/236 236/236
32 266/266 137/139 200/200 252/252 261/270 166/166 248/248 132/132 NA 119/119 236/236 236/236
NA- no amplification
University of Ghana http://ugspace.ug.edu.gh
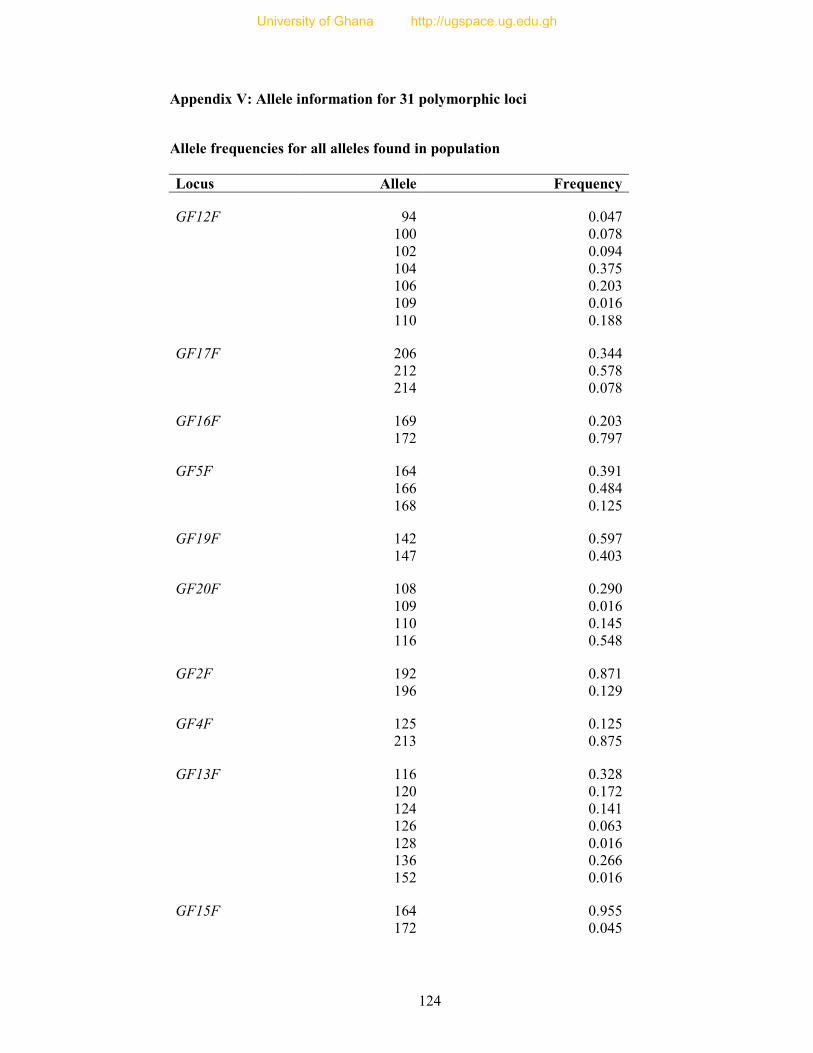
124
Appendix V: Allele information for 31 polymorphic loci
Allele frequencies for all alleles found in population
Locus Allele Frequency
GF12F 94 0.047 100 0.078 102 0.094 104 0.375
106 0.203 109 0.016 110 0.188
GF17F 206 0.344
212 0.578 214 0.078
GF16F 169 0.203 172 0.797
GF5F 164 0.391 166 0.484 168 0.125
GF19F 142 0.597 147 0.403
GF20F 108 0.290 109 0.016
110 0.145 116 0.548
GF2F 192 0.871 196 0.129
GF4F 125 0.125 213 0.875
GF13F 116 0.328 120 0.172
124 0.141 126 0.063 128 0.016
136 0.266 152 0.016
GF15F 164 0.955 172 0.045
University of Ghana http://ugspace.ug.edu.gh
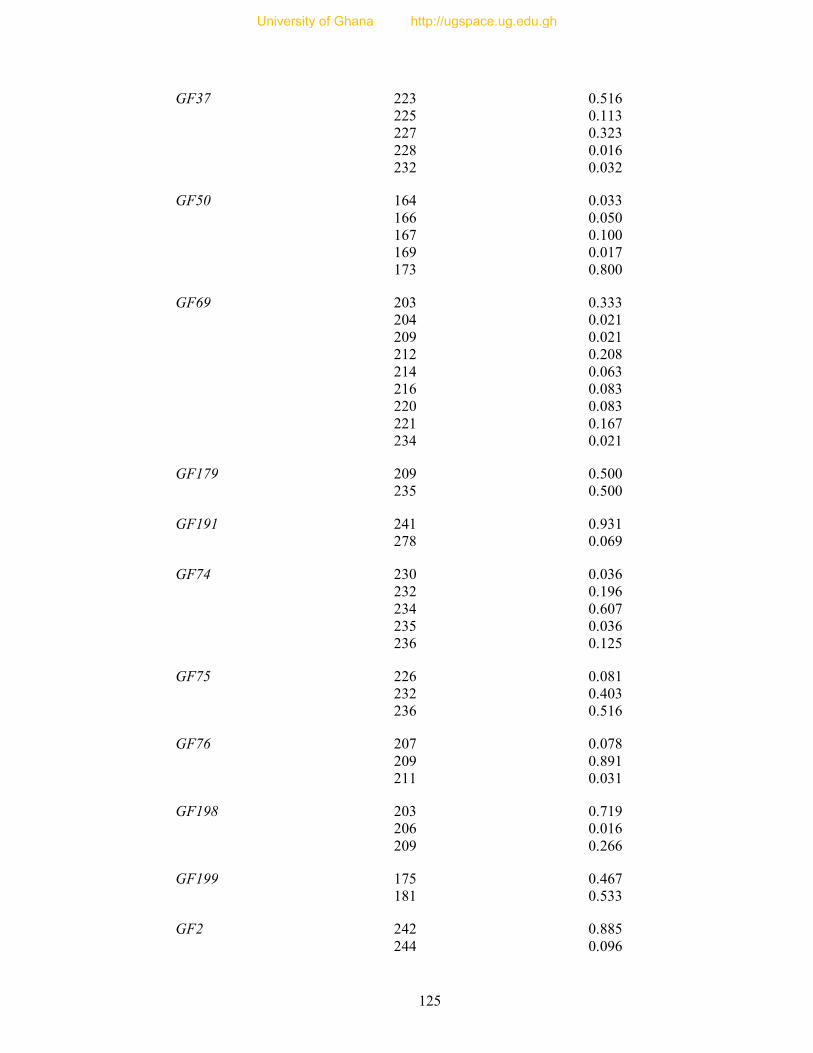
125
GF37 223 0.516
225 0.113 227 0.323 228 0.016 232 0.032
GF50 164 0.033 166 0.050 167 0.100
169 0.017 173 0.800
GF69 203 0.333 204 0.021
209 0.021 212 0.208 214 0.063
216 0.083 220 0.083 221 0.167 234 0.021
GF179 209 0.500 235 0.500
GF191 241 0.931 278 0.069
GF74 230 0.036 232 0.196 234 0.607 235 0.036 236 0.125
GF75 226 0.081 232 0.403
236 0.516
GF76 207 0.078 209 0.891 211 0.031
GF198 203 0.719 206 0.016 209 0.266
GF199 175 0.467 181 0.533
GF2 242 0.885 244 0.096
University of Ghana http://ugspace.ug.edu.gh
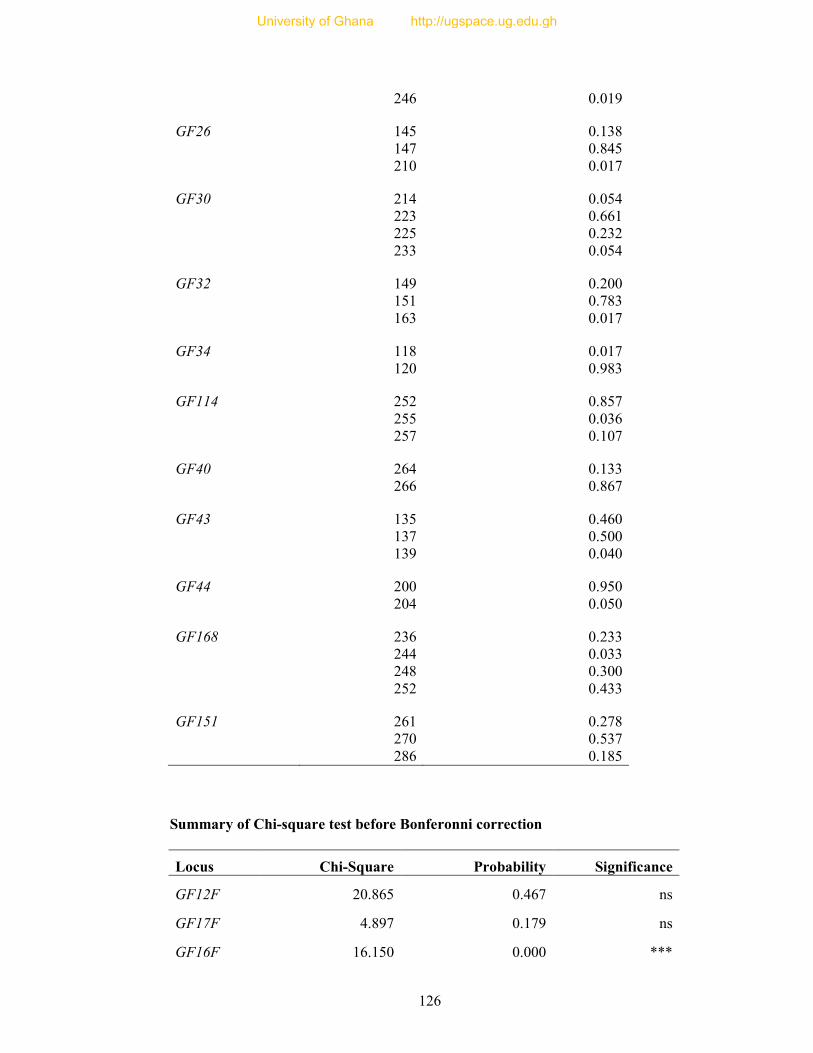
126
246 0.019
GF26 145 0.138 147 0.845 210 0.017
GF30 214 0.054
223 0.661 225 0.232 233 0.054
GF32 149 0.200 151 0.783 163 0.017
GF34 118 0.017 120 0.983
GF114 252 0.857 255 0.036 257 0.107
GF40 264 0.133 266 0.867
GF43 135 0.460 137 0.500
139 0.040
GF44 200 0.950 204 0.050
GF168 236 0.233
244 0.033 248 0.300 252 0.433
GF151 261 0.278 270 0.537 286 0.185
Summary of Chi-square test before Bonferonni correction
Locus Chi-Square Probability Significance
GF12F 20.865 0.467 ns
GF17F 4.897 0.179 ns
GF16F 16.150 0.000 ***
University of Ghana http://ugspace.ug.edu.gh
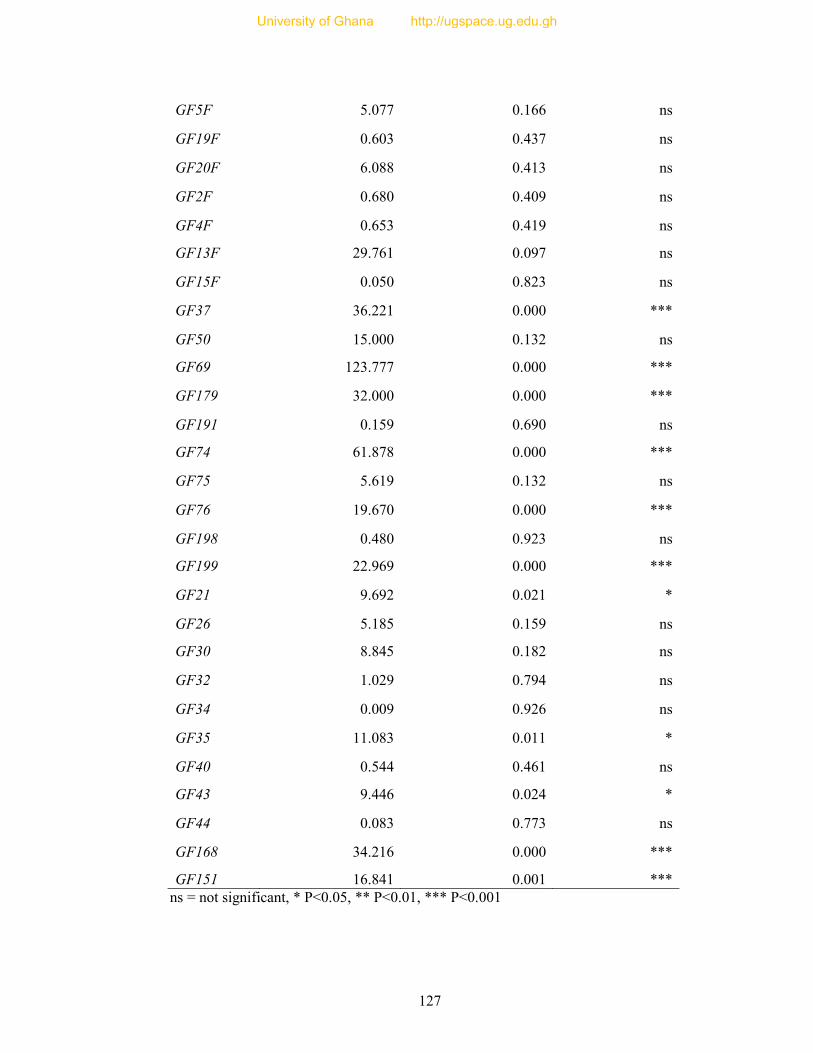
127
GF5F 5.077 0.166 ns
GF19F 0.603 0.437 ns
GF20F 6.088 0.413 ns
GF2F 0.680 0.409 ns
GF4F 0.653 0.419 ns
GF13F 29.761 0.097 ns
GF15F 0.050 0.823 ns
GF37 36.221 0.000 ***
GF50 15.000 0.132 ns
GF69 123.777 0.000 ***
GF179 32.000 0.000 ***
GF191 0.159 0.690 ns
GF74 61.878 0.000 ***
GF75 5.619 0.132 ns
GF76 19.670 0.000 ***
GF198 0.480 0.923 ns
GF199 22.969 0.000 ***
GF21 9.692 0.021 *
GF26 5.185 0.159 ns
GF30 8.845 0.182 ns
GF32 1.029 0.794 ns
GF34 0.009 0.926 ns
GF35 11.083 0.011 *
GF40 0.544 0.461 ns
GF43 9.446 0.024 *
GF44 0.083 0.773 ns
GF168 34.216 0.000 ***
GF151 16.841 0.001 *** ns = not significant, * P<0.05, ** P<0.01, *** P<0.001
University of Ghana http://ugspace.ug.edu.gh

1
University of Ghana http://ugspace.ug.edu.gh