character location in scene images from digital camera
TRANSCRIPT

Pattern Recognition 36 (2003) 2287–2299www.elsevier.com/locate/patcog
Character location in scene images from digital camera
KongqiaoWanga ;∗, Jari A. KangasbaNokia Research Center, No.11 He Ping Li Dong Jie, Nokia H1, Beijing 100013, People’s Republic of China
bNokia Research Center, Box 100, (Visiokatu 1), FIN-33721 Tampere, Finland
Received 11 September 2001; received in revised form 3 March 2003; accepted 3 March 2003
Abstract
In this paper, a robust, connected-component-based character locating method is presented. It is an important part of anoptical character recognition (OCR) system. Color clustering is used to separate the color image into homogeneous colorlayers. Next, for each color layer, every connected component in color layers is analyzed using black adjacency graph (BAG),and the component-bounding box is computed. Then, for coarse detection of characters, an aligning-and-merging-analysis(AMA) scheme is proposed to locate all the potential characters using the information about the bounding boxes of connectedcomponents in all color layers. Finally, to eliminate false characters, a four-step identi�cation of characters is used. Theexperimental results in this paper have proven that the method is e�ective.? 2003 Pattern Recognition Society. Published by Elsevier Ltd. All rights reserved.
Keywords: Character location; Optical character recognition (OCR); Anisotropic di�usion; Color clustering; Aligning and merginganalysis (AMA)
1. Introduction
Characters are key objects in images and video databases.They are ubiquitous in tra�c signs, indicators, billboards,video sequences, text documents, etc. Therefore, characterextraction and recognition are very important technologies,and they have many applications. For example, OCR tech-nology would sometimes be useful tool in connection withinformation devices like mobile phones, which will haveintegrated cameras for image acquisition. At home, videosequences can be labeled or indexed automatically basedon the recognized characters presented in a frame or a fewframes. However, character location and extraction from im-ages, especially scene images, has always been di�cult, dueto the following reasons [7]:(A) The characters are often mixed with other objects,
such as structural bars, company logos and smears.
∗ Corresponding author. Tel.: +86-10-65392828x2771; fax:+86-10-84210576.
E-mail addresses: [email protected] (K. Wang),[email protected] (J.A. Kangas).
(B) The characters may be of any color, and the back-ground color may di�er only slightly from that of the char-acters.(C) The font style and size of the characters may vary.(D) The lighting conditions in the images may vary.Some previous work to solve these problems have been
presented [1–11]. Antani et al. [1] utilized the temporal re-dundancy in video to detect and extract unconstrained textfrom general-purpose video. Toshio Sato et al. [2] com-bined sub-pixel interpolation on individual frames, multi-frame integration across time, character extraction �lteringand recognition-based character segmentation to obtain sat-isfactory video OCR performance for video news indexing.Yu Zhang et al. [4] used the intensity variation informationencoded in the discrete cosine transform (DCT) domain topresent a fast text captions methods in JPEG compressed im-ages and I-frames of MPEG compressed videos. In anotherpaper, Yu Zhang et al. [6] used horizontal spatial varianceand color information to locate text in compact disc (CD)and book cover images, as well as in the images of traf-�c scenes captured by a video camera. Chung-Mong Lee etal. [7] presented a coarse-to-�ne search scheme to extract
0031-3203/03/$30.00 ? 2003 Pattern Recognition Society. Published by Elsevier Ltd. All rights reserved.doi:10.1016/S0031-3203(03)00082-7

2288 K. Wang, J.A. Kangas / Pattern Recognition 36 (2003) 2287–2299
Preprocessingof color images
The normalizedRGB space based
color layering
The gray basedcolor layering
Color layering
Aligning & MergingAnalysis (AMA)
Identificationof character
regions
color image Character location
Fig. 1. The block diagram of the character location algorithm.
characters written on cargo containers, and this method hasbeen installed as part of a vision system which veri�es con-tainer codes on vehicles passing through the Port of Singa-pore.Most of the above-mentioned e�orts, however, are
focused on limited set of characters or controllable back-grounds. In this paper, we present a robust, connected-component (CC)-based character locating method for sceneimages with complex background. Block diagram is shownin Fig. 1. The method is composed of four stages. In the�rst stage, a weighted-median �lter-based anisotropic dif-fusion removes both stochastic noise and pepper-salt noisefrom the input color image. In the second stage, the colorimage is grouped into di�erent color layers based on thenormalized RGB color space and its gray component. Sincecharacters and the background normally are of di�erentcolors, color clustering separates them into di�erent colorlayers. In the third stage, an aligning-and-merging-analysis(AMA) scheme is presented to locate all potential charac-ters in each color layer. Next, all potential characters will beidenti�ed by heuristic rules induced from characters them-selves. False alarms are going to be discarded at that stage.lastly, character regions in the scene image are located.The method primarily utilizes four di�erent principles: (1)
the normalized color space, (2) the rejection of redundant el-ements in the color space, (3) a color clustering process, and(4) an algorithm to recognize connected components in therespective color layers. For the whole character locating pro-cess, it is not important which color space is used. Using themethod, the vision system need not be restricted to the hu-man vision range, 390–770 nm. The method can be appliedto every wavelength range and every color space applicableto image systems, including images from infrared (IR) or ul-traviolet (UV) cameras, as long as these images are “ color”images. Besides the red–blue–green (RGB) color space, theselected color space could be hue-saturation-intensity (HSI),cyan magenta yellow (CMY ), cyan magenta yellow black(CMYB), commission illumination d’eclairage (CIE), YIQ,etc.It should be noted that the method could be used
with grayscale images, as well. In that case, the methodshould have an additional step to check the image for-mat and to skip the color normalization. Accordingly,
during the color clustering process, the color layers ofthe image are only generated from its gray informationcontent.The content of the rest of the paper is arranged as fol-
lows: The preprocessing of color images is presented inSection 2. In Section 3, the color clustering of images isdiscussed. The detail of the AMA scheme and identi�cationof potential characters are described in Sections 4 and 5,respectively. Finally, the performance analysis of characterlocating method and the experimental results are provided inSection 6.
2. The preprocessing of color images
Any scene image from a digital camera is contaminatedwith noise. There are two main types of noise, stochasticnoise caused mainly by the camera and the sensor element,and pepper–salt noise due to smears in the natural scene. Forconsistent color clustering results, noise reduction before theclustering process is needed.One approach to reduce noise is to use an anisotropic dif-
fusion �lter. The 4-connected, discrete approximation of thetraditional anisotropic di�usion (TAD) [12] is implementedby
I(t + 1) = I(t) + �∑D
cD∇DI(t); D∈ {N; E; S;W}; (1)
where ∇ is a gradient operator. N , E, S, and W repre-sent the north, east, south and west directions, respectively.cD = e−(∇DI=K)
2(K is a constant), is the space-varying con-
duction coe�cient, and designed to be large in homoge-neous regions to encourage smoothing and small at edges topreserve structure (see Fig. 2).Basing the anisotropic di�usion coe�cient completely on
local gradients creates a �lter capable of smoothing an im-age while maintaining edge locality. However, it is unable toremove small-scale features with high contrast. This prop-erty makes anisotropic di�usion unsuitable for the removalof certain noise types, like pepper–salt noise [13]. To solvethat problem, a weighted-median �lter-based anisotropic dif-fusion (WMFAD) method [14] is used with extensions tocolor images.

K. Wang, J.A. Kangas / Pattern Recognition 36 (2003) 2287–2299 2289
Fig. 2. The 4-connected description of the anisotropic di�usion.
(a) (b) (c)
Fig. 3. The results of the TAD and the WMFAD after three iter-ations (O = 1
4 ; K = 40): (a) the original image, (b) the result ofTAD, and (c) the result of WMFAD.
Substituting a new nonlinear conduction coe�cient forthe one in Eq. (1) results in the WMFAD method:
cD = e−(∇Dmedian(Y )=K)
2; (2)
where Y is the illumination component of the processedcolor image, i.e., Y = 0:299R + 0:587G + 0:114B, andmedian(Y ) is the �ltering result using the weighted median�lter [14] to Y by the mask:1 1 1
1 3 1
1 1 1
:
Imposing the WMFAD method on the three R, G, and Bcomponents of a color image, i.e., let I ∈ {R; G; B}, imple-ments the preprocessing of the color image.Fig. 3 shows the smoothing results of TAD andWMFAD.
In Fig. 3(b), most of the stochastic noise is removed, butsome smears with high contrast still remain. In Fig. 3(c),both kinds of noise are about removed while the edges inthe image are still preserved.
3. Color clustering of scene images
Color clustering is a process of grouping pixels of animage into di�erent clusters or layers based on the colorinformation. It is based on the idea that all the pixels of
homogeneous color are separated from other colors. Tofacilitate character location in a scene image, a color cluster-ing method is utilized to separate characters from the back-ground into separate layers.The selection of the color space is brie�y discussed.
Histogram-based image segmentation for color clusteringis described. Finally, black-adjacency graph (BAG)-basedconnected-component (CC) analysis [7] is applied, whichresults in bounding boxes of the connected black regions ineach color layer.
3.1. The selection of the color space
The di�erent color spaces in use include RGB, normal-ized RGB (rgb), HSI , YIQ, and various CIE spaces [15]. Inpractice, but RGB, normalized RGB (rgb), and HSI colorspaces are the most often used ones. RGB space is aboutbasic colors. Each of the components in the RGB space canbe obtained directly from BITMAP image format, but thecomponents are highly correlated. HSI space is remarkablypopular in view of human color perception. It characterizescolor in terms of hue, intensity and saturation components.A typical de�nition [15] (transformation from RGB) is givenby
int =(R+ G + B)
3;
sat = 1− min(R; G; B)int
;
hue = arctan[ √
3(G − B)(R− G) + (R− B)
]; (3)
where arctan(y=x) utilizes the signs of both y and x to deter-mine the quadrant in which the resulting angle lies. Gener-ally, hue is thought of as the angle between a reference lineand the color point in the RGB space. However, the non-linear transformation from RGB to HSI has an unfortunateproperty of an irremovable singularity at the axis of the HSIcolor cylinder, where R=G= B (sat = 0). The normalizedRGB (rgb) is also derived from the RGB space. The trans-formation formula is given by
(r; g; b)=
(0; 0; 0) if k=0;(Rk;Gk;Bk
)=(Rk;Gk; 1−r−g
)if k¿0;
(4)
where k = R+ G + B.From the above transformation formula, it can be noticed
that one of the r, g, and b components is redundant thatany two of the three components can describe the wholecolor space. The transformation compresses color informa-tion from three dimensions to two dimensions (shown in Fig.4), which is useful for color space processing. From the im-age processing point of view, although the normalized RGB(rgb) space is not in line with human vision perception, it

2290 K. Wang, J.A. Kangas / Pattern Recognition 36 (2003) 2287–2299
Fig. 4. The transformation from 3D RGB space to 2D rg plane.
V1 V2 V3 V4 V5 V6 V7 V8 V9
V10
Fig. 5. A histogram in which the noise extrema overlap with thereal ones.
can reduce the e�ects of lighting. Fig. 4 shows the trans-formation from the 3D RGB space via a 2D rgb plane to a2D rg plane. In the �gure, the normalized RGB (rgb) spaceis used as the color clustering space. It is apparent that thisprinciple can be applied to any color space. Furthermore itis clear that, instead of the rg-plane, any other color plane,e.g. the gb or the rb-plane can also be selected.
3.2. Histogram-based color clustering
For a gray-scale image composed of regions with di�er-ent intensities, the regions often correspond to the peaks ofits histogram. If these peaks are detected and segmented ac-curately, the regions can be segmented successfully by thecorresponding valleys. But in reality, all images are pollutedwith noise, which often contributes to noise peaks that over-lap with real ones. That often makes image segmentationunreliable. Fig. 5 shows a histogram of an image. By ana-lyzing the histogram, one may conclude that the image iscomposed of four regions, but due to the noise disturbance,nine valleys V1–V9 (10 peaks) are detected in the histogram.If the image is layered by using the nine valleys, not fourbut ten layers will be created, which, of course, leads to poorsegmentation.
The left heightof the valley The right height
of the valley
A valley
Fig. 6. Description of the left and right heights of a valley.
Fig. 6 gives a description of the left and right heightsof a valley. Many techniques for removing noise ex-treme have been developed, such as �ngerprint-based scalespace �ltering strategy [16,17]. That kind of strategiescan remove overlapping noise peaks e�ciently, but it canalso remove some high and narrow peaks, which mightresult from some real regions or objects with uniformcolor. In this paper, we assume that all the noise peaks are“spur”-like. Hence, we implement the following simple andfast algorithm for the task.The algorithm is divided into four steps as follows (refer
to Figs. 5 and 6):(A) Initialization: The left and right heights for each val-
ley are computed. A given threshold TH1 is set for the leftand right heights of each valley.(B) Removal of noise valleys. Any valley, whose left
and right heights both are less than threshold TH1, will beremoved, e.g. V6 and V8. This kind of noise valleys is namedas the �rst class. Any valley, whose left or right height isless than threshold TH1, will be removed, e.g. V1, V3, V4, V7,and V9. This kind of noise valleys is named as the secondclass.(C) Creation of new valleys: If there are one or more
noise valleys of the �rst class (no other valleys) between anytwo-noise valleys of the second class, a new valley, locatedin the middle of the two noise valleys of the second class,will be created. For example, V8 locates between V7 and V9,and V8 belongs to the �rst class, while both of V7 and V9

K. Wang, J.A. Kangas / Pattern Recognition 36 (2003) 2287–2299 2291
1 2 3
4 5 6
rV(0) rV(1) rV(2) rV(3)
r
g
gV(0)
gV(2)
gV(1)
Fig. 7. A color plane grouped by the valleys.
belong to the second class of noise valleys, so V10 is createdin the middle of V7 and V9.(D) End: The rest of the valleys (e.g. V2 and V5) and
the new created valley(s) (e.g. V10) are regarded as the realones for image clustering.It should be noted that the new generated valley(s) might
not be accurate, but this does not have signi�cant e�ect tothe clustering result.Using the histogram-based valley-searching algorithm, it
is simple to explain the color clustering. For any color image,its normalized RGB components need to be computed �rst.As only two components are needed, histograms are countedfor the r and g components respectively. Finally, by applyingthe histogram-based valley-searching process to both of thetwo histograms, the color image can be clustered into severalcolor clusters (also called color layers) by
cluster(u) =rV (m+1)∑r=rV (m)
r(x; y) ∩gV (n+1)∑g=gV (n)
g(x; y); (5)
where x and y are the row and column of the image, u is anindex for the grouped layers or clusters, and “∩” is a logicalAND operator. Fig. 7 shows an example where there aretwo valleys for the r component and only one valley for theg component, so the color image is grouped into six layers.It should be mentioned that a good clustering result might
not be obtained under the condition that characters (fore-ground) and background are all gray. For example, if thecharacters are black while the background is white, bothlead to the same normalized “color”, i.e., r= 1
3 , g=13 , even
though their intensities are obviously di�erent. For con�r-mation, the gray-scale image (got by transformation fromthe corresponding color image) is layered with reference tothe valleys in its gray histogram. For convenience, all thesegray layers are also called color layers (Fig. 8). After clus-tering, a color image is grouped into di�erent color layers.Each layer is a binary image, i.e., the pixels of the binarylayers are either black or white.
r, g
grey
The color image The color layers(binary images)
Fig. 8. Color clustering of color images.
It should also be noted that the color clustering processbased on the normalized color data is skipped if the inputimage is a gray-scale one. In this case, the image is onlylayered based on its gray information content.
3.3. Connected component (CC) analysis in each colorlayer
In order to detect all potential characters, analysis of theconnected black regions (also called connected components(CC)) in each color layer is necessary. A common analysisapproach is based on using BAG [7], where each analyzedcolor layer is presented as a BAG. BAG-based CC analysispreserve both shape and structure information of each CCwith a low computation cost. The result of the BAG-basedCC analysis is a list of connected components (CCs) foreach color layer, de�ning the top, bottom, left and rightborders of each CC.Depending on the features of characters, those CCs with
too large area or those linked to the borders of the analyzedimage should be deleted. It should be noted that taking intoaccount those CCs that linked to the border of the image isunnecessary, even though they might be characters or partsof characters, because observers are usually more interestedin the characters located in the center regions of images.Sometimes, the bounding boxes of some CCs overlap
each other; this means they could be parts of same character.In order to speed up subsequent processing, it is useful tomerge overlapping CCs if the condition on formula (6) is�lled
Smin(S1; S2)
¿ 0:5; (6)
2292 K. Wang, J.A. Kangas / Pattern Recognition 36 (2003) 2287–2299
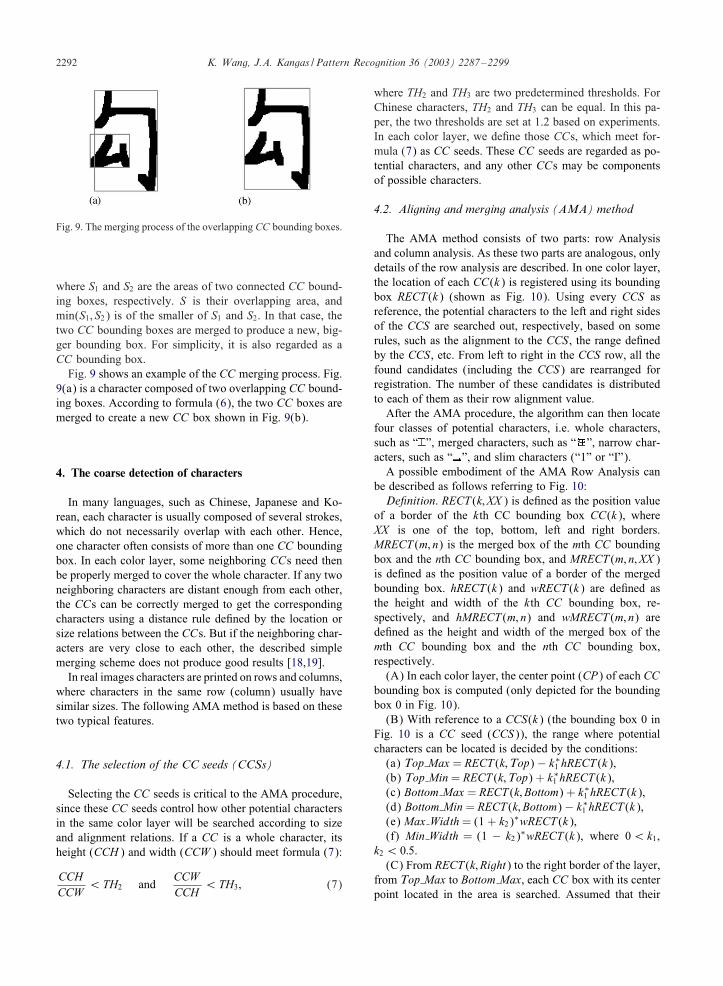
Fig. 9. The merging process of the overlapping CC bounding boxes.
where S1 and S2 are the areas of two connected CC bound-ing boxes, respectively. S is their overlapping area, andmin(S1; S2) is of the smaller of S1 and S2. In that case, thetwo CC bounding boxes are merged to produce a new, big-ger bounding box. For simplicity, it is also regarded as aCC bounding box.Fig. 9 shows an example of the CC merging process. Fig.
9(a) is a character composed of two overlapping CC bound-ing boxes. According to formula (6), the two CC boxes aremerged to create a new CC box shown in Fig. 9(b).
4. The coarse detection of characters
In many languages, such as Chinese, Japanese and Ko-rean, each character is usually composed of several strokes,which do not necessarily overlap with each other. Hence,one character often consists of more than one CC boundingbox. In each color layer, some neighboring CCs need thenbe properly merged to cover the whole character. If any twoneighboring characters are distant enough from each other,the CCs can be correctly merged to get the correspondingcharacters using a distance rule de�ned by the location orsize relations between the CCs. But if the neighboring char-acters are very close to each other, the described simplemerging scheme does not produce good results [18,19].In real images characters are printed on rows and columns,
where characters in the same row (column) usually havesimilar sizes. The following AMA method is based on thesetwo typical features.
4.1. The selection of the CC seeds (CCSs)
Selecting the CC seeds is critical to the AMA procedure,since these CC seeds control how other potential charactersin the same color layer will be searched according to sizeand alignment relations. If a CC is a whole character, itsheight (CCH) and width (CCW ) should meet formula (7):
CCHCCW
¡TH2 andCCWCCH
¡TH3; (7)
where TH2 and TH3 are two predetermined thresholds. ForChinese characters, TH2 and TH3 can be equal. In this pa-per, the two thresholds are set at 1.2 based on experiments.In each color layer, we de�ne those CCs, which meet for-mula (7) as CC seeds. These CC seeds are regarded as po-tential characters, and any other CCs may be componentsof possible characters.
4.2. Aligning and merging analysis (AMA) method
The AMA method consists of two parts: row Analysisand column analysis. As these two parts are analogous, onlydetails of the row analysis are described. In one color layer,the location of each CC(k) is registered using its boundingbox RECT (k) (shown as Fig. 10). Using every CCS asreference, the potential characters to the left and right sidesof the CCS are searched out, respectively, based on somerules, such as the alignment to the CCS, the range de�nedby the CCS, etc. From left to right in the CCS row, all thefound candidates (including the CCS) are rearranged forregistration. The number of these candidates is distributedto each of them as their row alignment value.After the AMA procedure, the algorithm can then locate
four classes of potential characters, i.e. whole characters,such as “ ”, merged characters, such as “ ”, narrow char-acters, such as “ ”, and slim characters (“1” or “I”).A possible embodiment of the AMA Row Analysis can
be described as follows referring to Fig. 10:De�nition. RECT (k; XX ) is de�ned as the position value
of a border of the kth CC bounding box CC(k), whereXX is one of the top, bottom, left and right borders.MRECT (m; n) is the merged box of the mth CC boundingbox and the nth CC bounding box, and MRECT (m; n; XX )is de�ned as the position value of a border of the mergedbounding box. hRECT (k) and wRECT (k) are de�ned asthe height and width of the kth CC bounding box, re-spectively, and hMRECT (m; n) and wMRECT (m; n) arede�ned as the height and width of the merged box of themth CC bounding box and the nth CC bounding box,respectively.(A) In each color layer, the center point (CP) of each CC
bounding box is computed (only depicted for the boundingbox 0 in Fig. 10).(B) With reference to a CCS(k) (the bounding box 0 in
Fig. 10 is a CC seed (CCS)), the range where potentialcharacters can be located is decided by the conditions:(a) Top Max = RECT (k;Top)− k∗1 hRECT (k),(b) Top Min= RECT (k;Top) + k∗1 hRECT (k),(c) Bottom Max = RECT (k; Bottom) + k∗1 hRECT (k),(d) Bottom Min= RECT (k; Bottom)− k∗1 hRECT (k),(e) Max Width= (1 + k2)∗wRECT (k),(f) Min Width = (1 − k2)∗wRECT (k), where 0¡k1,
k2¡ 0:5.(C) From RECT (k; Right) to the right border of the layer,
from Top Max to Bottom Max, each CC box with its centerpoint located in the area is searched. Assumed that their

K. Wang, J.A. Kangas / Pattern Recognition 36 (2003) 2287–2299 2293
Fig. 10. AMA row analysis.
center points are CP(i); i=1; 2; : : : ; n. Let i be 1, the aligningand merging process is started.(D) Choosing the RECT (i), whose center point is CP(i),characters classify based on the following;(E) If the RECT (i) meets all the conditions:(a) Top Max¡RECT (i;Top)¡Top Min,(b) Bottom Min¡RECT (i; Bottom)¡Bottom Max,(c) Min Width¡RECT (i; Width)¡Max Width,then the CC(i) is registered as a whole potential charac-
ter. After i is increased by one, the process will return tostage (D) to classify the next candidate. If the above fails,the process will move to stage (F).(F) RECT (i) and RECT (i + 1) are merged to get the
merged bounding box MRECT (i; i + 1).(G) IfMRECT (i; i+1) satis�es only one of the following
conditions:(a) MRECT (i; i + 1;Top)¡Top Max,(b) MRECT (i; i + 1; Bottom)¿Bottom Max,(c) MRECT (i; i + 1; Width)¿Max Width,then the process will move to (H); otherwise ifMRECT (i; i + 1) satis�es all the conditions:(a) Top Max¡MRECT (i; i + 1;Top)¡Top Min,(b) Bottom Min¡MRECT (i; i + 1; Bottom)¡Bottom Max,(c)Min Width¡MRECT (i; i+1; Width)¡Max Width,then MRECT (i; i + 1) is a merged potential character.
After i is increased by one, the process will return to stage(D) to classify the next candidate. If the above fails, letRECT (i+1)← MRECT(i; i+1), after which i is increasedby one, the process will move to stage (F), and continue tomerge subsequent CC boxes.(H) In the merged bounding boxMRECT (i; i+1), if there
is a CC box RECT (x), which meets all the conditions:(a) Top Max¡RECT (x;Top)¡Top Min,(b) Bottom Min¡RECT (x; Bottom)¡Bottom Max,(c) RECT (x;Width)¡ 3∗RECT (x; Height),then the CC is a slim potential character. Otherwise if
the bounding box RECT (x) meets all the conditions:(a) Top Min¡RECT (i;Top); RECT (i; Bottom)¡
Bottom Min,(b) Min Width¡RECT (i; Width)¡Max width,(c) RECT (i; Height)¡ 3RECT (i; Width),then the CC is a narrow potential character. If i is equal
to n, the process will move to stage (I), otherwise return tostage (D) to classify the next candidate.(I) Rearrange all the potential characters (including the
CCS) from left to right. Meanwhile, count the number ofpotential characters (including the CCS). This count is therow alignment value of the potential characters.(J) If the AMA row analysis of every CCS in the color
layer has been �nished, exit the row analysis process of thecolor layer; otherwise, the process will move to stage (B),and start the AMA row analysis of another CCS boundingbox.In Fig. 10, the No. 0 bounding box is registered as a
CCS. After its AMA row analysis, a merged potentialcharacter (composed of the No. 1, 2, 3 boxes), a slimpotential character (composed of the No.5 box) and anarrow potential character (composed of the No. 6 box)can be searched respectively. Their row alignment valuesare 4. The remaining boxes (No. 4, 7, 8, 9, 10) are notcharacters or parts of characters. They are regarded asnoise.The AMA column analysis is analogous to row anal-
ysis. The only di�erence is in the distribution of thealignment values of the potential characters. After theAMA row analysis, if a potential character is given arow alignment value ALIGN1, i.e., there are ALIGN1potential characters found in the same row as the po-tential character, and there are ALIGN2 potential charac-ters found in the same column as the potential characterafter its column analysis, the �nal alignment value ofthe potential character is the maximum of ALIGN1 andALIGN2.

2294 K. Wang, J.A. Kangas / Pattern Recognition 36 (2003) 2287–2299
Fig. 11. The coarse detection of characters in a color layer: (a) the results of the AMA analysis, and (b) the potential characters after thepre-selection.
4.3. The pre-selection of the character candidates in theintra and inter color layers
After the AMA analysis, each potential character in itscolor layer has an alignment value. Before identi�cation ofall potential characters, we impose a pre-selection processon the potential characters to remove some obvious falsealarms.First, if the bounding box areas of two potential charac-
ters and their overlapping area are S1, S2 and S, respectively,and they meet: S=min(S1; S2)¿ 0:5 (where min(S1; S2) isthe smaller of S1 and S2), the potential character with thesmaller alignment value will be removed. Second, if a po-tential character, with an alignment value of one, is isolated,it will be removed.Two examples are shown in Fig. 11, in which the potential
characters are bounded in boxes.
5. Identi�cation of character regions
Amongst all potential characters detected at the coarsedetection stage, there are many real characters. There canalso be some false detections, which should be removedfrom the candidcate character set. This section describes theproblem of identifying character regions. To carry out this, acombination of various heuristic techniques is utilized. Thefollowing algorithm is applied:(A) If the candidate region does include a character, the
region should have enough contrast where the histogram ofthe region has a bimodal distribution, with two peaks cor-responding to the character and the background intensities[7]. A simple means of measuring the contrast is by con-structing a cumulative histogram and demarcating two graylevels, low and high, such that:low=the gray-level below which 10% of the total number
of pixels lie;high=the gray level below which 90% of the total number
of pixels lie.
0
1
1
1
1
0
0
1
0
0
1 1 1 0000000
Fig. 12. The description of structure identi�cation of character.
The di�erence between high and low is simply utilized tocheck the contrast of the candidate region. In practical iden-ti�cation, the four types of the potential character regions,the whole, merged, slim and narrow character regions, areprocessed di�erently. The two former types of character re-gions should have high contrast. Empirically, the contrastthreshold is set to 95, i.e. high–low¿ 95. But for the twolatter types of character regions, as each character regiononly has one stroke, (i.e. a slim character is composed ofa vertical stroke, and a narrow character is composed of ahorizontal stroke), and the stroke �lls its region fully, thecontrast inside the region should not be high, even thoughthe stroke has enough contrast with the background out ofits region. Empirically, the contrast threshold for the char-acter regions is set to 15, i.e. high–low¡ 15.(B) The structure of characters, which are composed of
one or more strokes, for example, a horizontal stroke, anda vertical stroke, etc., can be utilized to remove some falsealarms. Assuming that the candidate region has been bina-rized, the black pixels belong to the character, and the whitepixels belong to the background (as shown in Fig. 12). The

K. Wang, J.A. Kangas / Pattern Recognition 36 (2003) 2287–2299 2295
region is scanned from left to right by row, top to bottom,and all horizontal segments are searched. A horizontal seg-ment is de�ned as a collection of consecutive black pixels ina row. In each row, if there exists a horizontal segment withlength ¿ 5W=6 (W is the width of the region), the row ismarked with 1, otherwise 0. After the scan is �nished, fromtop to bottom, we search the consecutive rows marked with1. Generally, the number of the consecutive rows markedwith 1 is regarded as the width of a horizontal stroke. Fora whole or merged character, the number of the consecu-tive rows marked with 1 should not be large, say less thanH=3 (H is the height of the region), meanwhile, there arenot many horizontal strokes in one character region if thecandidate is a real one. For a narrow character, the numberof consecutive rows should be large compared to the heightof the candidate region, say more than 5H=6, because thereis only one horizontal stroke in a narrow character, and thestroke almost �lls the region. In a similar way, we can searchall vertical segments in the candidate region. A vertical seg-ment is de�ned as a collection of consecutive black pixels ina column. Then the similar scheme as the above is utilizedto identify the whole, merged or slim potential characters.(C) Characters are usually aligned in rows or columns.
At the coarse detection stage, we use the AMA algorithm todetect all potential characters in each color layer. Obviously,after the potential characters detected in all color layers aremapped into the same plane, their alignment property shouldnot be changed. At this step, we use the aligning scheme ofthe AMA algorithm to realign all potential characters, andcompute their alignment values. If the alignment value ofone candidate is exactly 1, and isolated, it is regarded as afalse alarm.(D) Character recognition can be used to remove some
false alarms. If a potential character can not be recognized, itis certainly not a real one. At this step, we use the recognitiondistance computed using the character recognition softwarekit to identify potential character. The recognition distancedescribes the similarity between a potential character andthe character models. The larger the distance is, the morepossible it is that the candidate is not a real character.
6. Experimental results and discussion
To evaluate the performance of the proposed method,we built a test image database which included 325 im-ages with size of 640 × 480 pixels. The images in thedatabase were captured using a digital camera at di�er-ent sites, i.e. indoors and outdoors, and at di�erent times,e.g., at daytime, at dusk and at night using the light ofeither streetlamp or �ash. The database included charac-ters (most of them Chinese characters) with di�erent fontsand di�erent colors, and the characters were embedded indi�erent backgrounds, such as street indicators, billboards,walls, and so on. Besides these, we also considered di�er-ent angles of view while capturing the test images so that
the captured characters are intentionally distorted to someextent.
6.1. The performance analysis
For the whole character locating process, the performancemainly depends on some parameters, e.g. iteration count andK in formula (2) of WMFAD noise-�ltering, TH1 includedin the histogram-based valley searching algorithm of colorclustering, and k1 in (a)–(d) of (B) step in AMA algorithm.E�cient noise �ltering is useful for color clustering. More
iteration and bigger K in formula (2) can give smoother re-sults using the WMFAD method. But over-smoothing theimages will lead to edge loss, and high computation costs.Obviously, this is not bene�cial for the whole character lo-cating process. Actually, if the subsequent color clusteringwere noise tolerant enough, the choice of the parameters inthe WMFAD method would become easier. In general, theWMFAD noise �lter with K = 40 and three iterations is al-ready good enough for most of the scene images from thechosen digital camera.The color clustering is an important step of the whole
character locating process. If there are no valid color lay-ers with characters segmented from the background, char-acters will not be detected even with a high performanceAMA algorithm! To a great extent, the performance of thecolor clustering process depends on threshold TH1 in thehistogram-based valley-searching algorithm. The criterionto evaluate the process is to check whether valid color lay-ers are created with characters segmented from their back-ground.As there usually is a strong color or intensity contrast
between the characters and the background in any scene im-age, they should have di�erent peaks in the histogram. Fur-thermore, the peaks should be well separated. Hence, theexact value of threshold TH1 is not critical. Fig. 13 showsone example of the color clustering process. Fig. 13(a) isthe original color scene image in which some red charactersare embedded. Fig. 13(c) and (d) show the histograms ofthe r and g components of the scene image, and their val-leys, which are marked with the white vertical short line.In Fig. 13(c), there are seven valleys (valley location: 34,65, 72, 92, 106, 158, and 245) and �ve valleys (valley lo-cation: 48, 75, 100, 148, and 249) found for the r and ghistograms, respectively, at TH1 = 5, while in Fig. 13(d),there are only three valleys (valley location: 34, 158, and245) and four valleys (valley location: 48, 75, 100, and148) found for the r and g histograms, respectively, atTH1 = 15. Although there are the di�erent number of colorlayers which can be created at TH1 = 5 and 15, i.e., underthe two cases, we get 48 and 20 color layers, respectively,there is a common color layer (shown at Fig. 13(b)), inwhich the red characters in the original scene image are seg-mented from the background successfully, in both cases. Ac-tually, the shown experimental result is not exceptional, andvalid color layers, with characters segmented from the back-

2296 K. Wang, J.A. Kangas / Pattern Recognition 36 (2003) 2287–2299
Fig. 13. Performance evaluation of the histogram-based color clustering process: (a) The original scene image, (b) A color layer includingthe red characters, (c) the searched valleys of the r and g histograms (TH1 = 5, left and right are r and g histograms, respectively), and (d)the searched valleys of the r and g histograms (TH1 = 15, left and right are r and g histograms, respectively).
Fig. 14. Performance analysis of locating the distorted characters(k1 = 0:1–0.4).
ground correctly, can usually be obtained with di�erent TH1values.The performance of the AMA algorithm depends
mainly on the parameter k1 chosen for step (B) in thealgorithm. Parameter k1 de�nes the search range of thecharacters to be located as reference to their CCS (Asseen in Fig. 10). A smaller k1 will tighten the alignmentproperty of the characters in the same row or column.This is not bene�cial when processing an image withtilted rows, like in Fig. 14. On the other hand, a big-
ger k1 might lead to creation of more false alarms. Ofcourse, the performance of the AMA algorithm mustbe evaluated using some images with distorted char-acters or tilted rows. As an example, one can con-sider the image at Fig. 14, which was captured fromleft.The range of variable k1 was set from 0 to 0.5 in the AMA
algorithm. For Fig. 14, the parameter k1 was varied between0.1 and 0.4. We achieved the same �nal detection results(shown at Fig. 14), even though the alignment values diddi�er during the process. For example, at k1 = 0:1, the rightfour characters in the second line had alignment values allfour; for the rest of the characters, the alignment value ofeach character was two. At k1 = 0:4, the alignment value ofevery character was six. As can be seen, the capabilityof the AMA algorithm to locate the distorted characters wasfairly strong.
6.2. The experimental results
Our database contains 325 test images. However, the over-all number of characters in the database is di�cult to deter-mine. There are many small indistinctive characters in someof the images, like the small characters at the far left ofFig. 15(e). For convenience, we only take the recogniz-able characters in the 325 images into account and get 3597characters overall. The detection results are then listed as

K. Wang, J.A. Kangas / Pattern Recognition 36 (2003) 2287–2299 2297
(a) (b)
(c) (d)
Fig. 15. Experiment on some scene color images.
follows:
The number of correctly located characters: 3314.The number of missed characters: 283.The number of false alarms: 376.
The processing speed depends on the complexity of pro-cessed images. A medium complexity image takes about 3seconds to process on Pentium III 600.Some experimental results are shown in Fig. 15. In
Figs. 15(a) and (b), characters are overlapping with reg-ular bars or lines, but since the colors are di�erent, goodresults are still achieved. Although the lighting in Figs.15(c) and (d) is uneven, most of the characters in theimages can be located. The reason is the uniformity ofnormalized color. In Fig. 15(d), there are some capitalEnglish letters besides Chinese characters. As they meetthe conditions of the AMA algorithm, they can be cor-rectly located. Figs. 15(e) and (f) include characters withdi�erent colors and di�erent fonts, but these features donot a�ect the algorithm and the correct locations of manycharacters are found. In Fig. 15(f), some lowercase En-glish are missing, because they are of di�erent heights. InFig. 15(g), there are some characters quite near to eachother. They are well located, anyway, because of the robustAMA algorithm. But, there are also some small characters,
which are missing because of the noise removing in eachcolor layer. Of course, this problem could be avoided hav-ing less smoothing, but that would lead to increase falsealarms. Fig. 15(h) includes four Chinese characters. Onlytwo of them are located. It is mainly due to the unevenre�ections of the cuprous surface. The uneven re�ectionsresult in incomplete character segmentation during colorclustering.From the experimental results, the following conclusion
is drawn: the proposed method can locate most of Chinesecharacters in scene images, although two kinds of mis-takes sometime occur, missing characters and false alarms.When characters are too small, characters are not alignedwell, or surfaces of characters are re�ecting unevenly, the�rst kind of mistake is prone to happen. When the pro-cessed images are complex, the second mistake can easilyhappen.In this paper, a robust method of automatic char-
acter location is presented to detect and locatecharacters in scene images, assuming that every char-acter is homogeneous. It is most suitable for squarecharacters, such as Chinese, Korean, Japanese, andalso for most western capital letters, etc. The ex-perimental results have proven that the method ise�ective.

2298 K. Wang, J.A. Kangas / Pattern Recognition 36 (2003) 2287–2299
(e) (f)
(g) (h)
Fig. 15. continued.
Acknowledgements
The authors would like to thank Dr. Hannu Nieminen,head of lab, and Jukka Yrjanainen, group manager, fromVisual Communication (VIC) lab of Nokia Research Center(NRC) for their support and encouragement that made thiswork possible. We would also like to thank other membersof the research group of VIC at NRC China for technical dis-cussion includingWangHao, LiWenwen and ZouYanming.Finally, we would like to thank Grimm Jerry (Nokia/NETDallas), Juha Iso-Sipila (NRC Tampere) and Yuan Chen(Nokia/NET Dallas) for revising and commenting on thepaper.
References
[1] S. Antani, et al., Robust extraction of text in video.Proceedings of the IEEE 15th International Conference onPattern Recognition, Barcelona, Spain, pp. 831–834.
[2] Toshio Sato, et al., Video OCR for digital news archive, IEEEInternational Workshop on Content-based Access of Imageand Video Database, Bombay, India, 1998, pp. 52–60.
[3] Huiping Li, et al., Automatic text detection and tracking indigital video, IEEE Trans. Image Process. 9 (1) (2000) 147–156.
[4] Yu Zhang, et al., Automatical caption localization incompressed video, IEEE Trans. Pattern Anal. Mach. Intell. 22(4) (2000) 385–392.
[5] R.L. de Queiroz, et al., Fast segmentation of the JPEGcompressed documents, J. Electron. Imaging 7 (2) (1998)367–377.
[6] Yu Zhang, et al., Locating text in complex color images,Pattern Recognition 28 (10) (1995) 1523–1536.
[7] Chung–Mong Lee, et al., Automatic extraction of charactersin complex scene images, Int. J. Pattern Recognition, Artif.Intell. 9 (1) (1995) 67–82.
[8] Bin Yu, et al., A generic system for form dropout, IEEE Trans.Pattern. Anal. Mach. Intell. 18 (11) (1996) 1127–1134.
[9] Jun Ohya, et al., Recognizing characters in scene images, IEEETrans. Pattern. Anal. Mach. Intell. 16 (2) (1994) 214–220.
[10] Y. Cui, et al., Character extraction of license plates fromvideo, Proceedings of IEEE Conference on Computer Visionand Pattern Recognition, San Juan, Puerto Rico, 1997, pp.502–507.
[11] J. Zhou, et al. OCR for World Wide Web images, Proceedingsof SPIE Document Recognition IV, Vol. 3027, 1997 pp.58–66.
[12] P. Perona, et al., Scale-space and edge detection usinganisotropic di�usion, IEEE Trans. Pattern. Anal. Mach. Intell.12 (7) (1990) 629–639.
[13] Y. You, et al., Behavioral analysis of anisotropic di�usion inimage processing, IEEE Trans. IP 5 (11) (1996) 1539–1553.

K. Wang, J.A. Kangas / Pattern Recognition 36 (2003) 2287–2299 2299
[14] M. Gabbouj, P. Haavisto, Y. Neuvo, Recent advances inmedian �ltering, in: E. Arikan (Ed.), Communication, Control,and Signal Processing, Vol. II, Elsevier Science Publishers B,Ankara, Turkey: 1990, pp. 1080–1094.
[15] F. Perez, et al., Toward color image segmentation in analogVLSI: algorithm and hardware, Int. J. Comput. Vision 12 (1)(1994) 17–42.
[16] Chung-Lin Huang, et al., Color images’ segmentationusing scale space �lter and Markov random �eld, PatternRecognition 25 (10) (1992) 1217–1229.
[17] Young Won Lim, et al., On the color image segmentationalgorithm based on the thresholding and the fuzzy c-meanstechniques, Pattern Recognition 23 (9) (1990) 935–952.
[18] Wang Kongqiao, Jari Kangas, Li Wenwen, Charactersegmentation of color images from digital camera, ICDAR,Seattle, USA, 2001, pp. 210–214.
[19] Wang Kongqiao, Jari Kangas, Color clustering and itsapplication in character location, Second InternationalConference on Image and Graphics, Hefei, China, 2002, pp.645–650.
About the Author—WANG KONGQIAO received his M. Sc. degree and Ph.D. degree in signal and information processing from HeFeiPolytechnique University, China in 1996 and University of Science and Technology of China in 1999, respectively.From 1999 to 2001, he worked as an R& D researcher of the research group of Visual Communication laboratory at Nokia Research Center,China. He is currently the R& D manager of the research group. His interests are in the area of image processing and analysis and patternrecognition.
About the Author—JARI KANGAS received his M.Sc. degree in computer science from Helsinki University of Technology, Espoo,Finland, in 1988, and his D.Sc. degree from the same university in 1994. He works currently as a Principal Scientist at Nokia ResearchCenter, Tampere, Finland.His research interests are in pattern recognition and multimodal data analysis in general, emphasis being in methods and techniques to enhancethe User Interface functions of mobile terminals by using, for example, handwriting recognition, speech recognition and image analysis.