chapter v. tools and practices - world banksiteresources.worldbank.org/intempowerment/...processing,...
TRANSCRIPT

72
CHAPTER V. TOOLS AND PRACTICES
1. Information and Communications Technology As a Tool for Empowerment ......................... 73 2. Empowerment and the World Bank’s Country Assistance Strategy for Indonesia .................. 93 3. Empowerment in the Vietnam Country Program................................................................... 100 4. Peru Portfolio Review through an Empowerment Lens ......................................................... 104 5. Social Accountability Mechanisms In Programmatic and Structural Adjustment Loans....... 108 6. Participatory Budgeting .......................................................................................................... 124 7. Information Disclosure ........................................................................................................... 133 8. Decentralization Strategies for Empowerment ....................................................................... 148 9. Community-Driven Development .......................................................................................... 155 10. Empowerment in Education.................................................................................................. 172 11. Institutional Innovations to Support Micro, Small, and Medium Enterprises ...................... 184 12. Institutional Innovations in Financial Services for the Poor................................................. 191 13. Poor People’s Organizations ................................................................................................. 200 14. Legal and Judicial Reform.................................................................................................... 212 15. Institutional and Governance Reviews ................................................................................. 222 16. Citizen Report Cards ............................................................................................................. 232 17. World Bank Corruption Surveys .......................................................................................... 240 18. Public Expenditure Tracking Surveys .................................................................................. 247 19. Private Enterprise Surveys of the Business Environment ..................................................... 253 20. Participatory Poverty Diagnostics......................................................................................... 260

TOOLS AND PRACTICES 1
Information and Communications Technology As a Tool for Empowerment
Information and communications technology (ICT) is creating economic, social, and political empowerment opportunities for poor people in the developing world.1 Direct and independent access to information about prices and exchange rates can transform the relationship between poor producers and middlemen. Connectivity through telephones, radio, television, and the Internet can enable the voices of even the most marginal and excluded citizens to be heard, promoting greater government responsiveness. ICT can thus help to overcome poor people’s powerlessness and voicelessness even while structural inequities exist in the distribution of traditional assets such as education, land, and finance. Although most poor people are isolated from the new information revolution, shared cellular phones, telecenters,2 and other innovative solutions are in fact beginning to provide low-cost ways for them to access ICT (box 1). Exploiting the potential of ICT to improve the lives of poor people, however, is not automatic and requires attent ion to policy formulation and project design. The primary condition for reaching poor people is low-cost access to information infrastructure, as inadequate or absent connectivity and unstable power supply reduce the economic viability of most ICT projects. In addition, the issues of content, intermediaries, and local ownership are key to realizing the empowerment potential of ICT. To become truly relevant for poor people, ICT applications must make content available in local languages and, to the extent possible, should be visual and graphic-oriented. Further, ICT projects have a greater chance of success in reducing poverty when they are conducted by organizations and grassroots intermediaries that have the appropriate incentives and a proven track record in working with poor people. Finally, before launching any ICT initiative, the information needs of a community should be thoroughly assessed, with the active involvement of the community, and software should be developed taking into account local conditions. Local ownership ensures continuity, while a top-down approach can lead to a waste of resources in the initial start-up of projects, endangering future sustainability. 3 Rigorous monitoring, evaluation, and beneficiary impact assessments are needed to appraise whether the benefits of ICT projects outweigh the costs; financial sustainability is indeed one of the main challenges for ICT projects and initiatives. This note highlights how ICT can empower poor women and men in four broad areas:
• access to basic services
This note was prepared by Simone Cecchini and Talat Shah, under the overall guidance of Deepa Narayan (PREMPR). 1 ICT consists of hardware, software, networks, and media for collection, storage, processing, transmission, and presentation of information (voice, data, text, images) (World Bank 2002). 2 Telecenters are shared locations that provide access to ICT for educational, personal, social, and economic development (Reilly and Gómez 2001). 3 See Cecchini forthcoming; and Narayan and Shah 2000.

Tools and Practices 1
74
• improved governance • support for entrepreneurship • access to financial services
Box 1. Innovative and Creative Solutions to Bring ICT to Poor People The Simputer (Simple, Inexpensive, Multilingual Computer), developed by scientists at the Indian Institute of Science and a software company in Bangalore, is a user- friendly and inexpensive handheld computing device, particularly suitable for illiterate people. The device uses locally relevant icons, touch-sensitive screens, and text-to-speech features in different Indian languages. Costing about $250 each, Simputers are designed to be shared by a local community of users. For example, a village panchayat, a village school, or even a shopkeeper can purchase a Simputer and rent it out to individuals for a user fee. “Smart card” technology personalizes the device by storing individual user profiles.4 In Kothmale, Sri Lanka, a joint project between UNESCO, the Ministry of Posts, Telecommunications, and the Media, the Sri Lanka Broadcasting Corporation, and the Sri Lanka Telecommunication Regulatory Commission uses the radio as an interface between rural people and the Internet. A daily one-hour live radio program, in which an announcer and a panel of resource persons browse the Internet in response to listener requests, has proved able to overcome linguistic barriers to Internet use by non-English-speakers. In addition to the live program, the Kothmale community radio station develops a rural database, primarily by packaging public domain information often requested by listeners for off- line use. The radio station also functions as a mini–Internet service provider by offering Internet access points at two public libraries located within the radio’s target area and running an Internet café at the radio station. 5 In Uganda, a CD-ROM produced by the International Women’s Tribune Center, “Rural Women in Africa: Ideas for Earning Money,” is providing training and information to women engaged in microenterprise activities. The CD-ROM, developed both in English and in local languages, is available for use at rural telecenters. By using sound and visuals, the CD-ROM content is accessible to women with low levels of education. 6
Access to Basic Services The relatively low cost and wide reach of radio and television are enabling the delivery of education to isolated rural areas, and telecenters are becoming the means for the delivery of distance learning and virtual education. Customized ICT training for marginalized groups with low levels of education, from poor women in Africa and India to slum dwellers and street
4 Mathew 2001 and Reuters 2002. A smart card looks like a plastic credit card and has a microprocessor or memory chip embedded in it. The chip stores electronic data and programs that are protected by security measures enabling controlled access by appropriate users. Smart cards provide data portability, security, convenience, and transparency of financial records and transactions. 5 Grace and others 2001. 6 Available at the International Women’s Tribune Center website at http://www.iwtc.org/!start.html

Tools and Practices 1
75
children in Latin America, is creating new opportunities in the job market.7 Experience indicates that even illiterate adults and children quickly learn to use icon-based Web services. ICT can also improve health care delivery to the poor. Telemedicine can overcome the cost and hardship of long-distance travel for medical attention and diagnosis; e-mail and medical list-serves can deliver recent medical findings at minimal cost to health workers lacking research and technological facilities;8 and ICT is simplifying medical data collection, record management, and paper filing processes. Education In Brazil, the Committee for Democracy in Information Technology (CDI) provides computer and civics training to young people living in urban slums, or favelas. Founded by former teacher Rodrigo Baggio, CDI emerged from the belief that computer literacy can maximize opportunities in the job market and promote democracy and social equity. Along with training in word processing, spreadsheets, accounting programs, and Web design, CDI teaches civic participation, nonviolence, human rights, environmental awareness, health, and literacy. After a three- or four-month course, graduates typically find well-paid jobs, start microbusinesses, or become certified teachers within the organization. Some CDI graduates who had dropped out of regular or traditional school decide to go back to public school and complete their formal education. And many others put their computer skills to work in various community activities, including health education and AIDS awareness campaigns. In addition to serving the poor, the CDI model has spread the benefits and applications of ICT to indigenous communities, the blind, prisoners, and the mentally ill. The first Information Technology and Citizenship School opened in Rio de Janeiro’s Santa Maria favela in 1995. CDI has since established about 350 schools in 19 states in Brazil, training more than 166,000 children and youth. Although some schools, supported by foundations, offer free computer training, most schools maintain a symbolic fee of $4 per student to cover administrative costs and pay instructors.9 Students who cannot afford to pay have the option to volunteer in exchange for classes. CDI schools are created through partnerships with community organizations, NGOs, and religious groups. Communities have complete ownership of the schools, including their physical space, and are responsible for staffing, management, and maintenance. To develop a CDI partner school, a community sets up a coordinating committee to assess local demand, identify future instructors and a suitable location, and establish security measures for the computers. Over the course of three to six months, CDI trains the instructors, works with the school to obtain a hardware donation from sponsors, and helps the school install the computers. After a
7 Examples include the InfoDev-sponsored Project SITA (Study of Information Technology Applications) in India, Women’s Net in South Africa, and the Street Children Telecenter project in Colombia and Ecuador. 8 HealthNet, for instance, is using a diverse array of ICT technologies (including radio and telephone-based computer networks and low-earth-orbit satellites) to allow health care workers in 30 developing countries to access medical research, exchange data on emerging epidemics, and obtain information on the use of drugs and treatments. 9 Even with such low fees, instructors teaching just eight classes per week receive almost twice Brazil’s official minimum wage.

Tools and Practices 1
76
school has been established, CDI serves as a partner and consultant but does not manage the school activities. CDI is funded through partnerships with the government, the private sector, and philanthropic and international organizations, as well as with individuals and local businesses that donate computer hardware and software. Microsoft has donated $5 million in software and the Gates Foundation has granted $400,000; the World Bank has earmarked $200,000 through InfoDev, and the IDB is going to provide $250,000 to help CDI expand in Brazil and other Latin American countries. Other partners include Dell, Exxon, McKinsey, SSI Server, the Starmedia Foundation, Xerox, and UNESCO. The CDI model has been exported to Japan, Mexico, Colombia, Chile, and Uruguay, countries where there is now a CDI international office, and will soon reach Guatemala, Angola, and South Africa.10 The World Bank Institute’s World Links for Development (WorLD) program provides training in the use of technology in education for teachers, teacher trainers, and students in developing countries, and connects them via the Internet to counterparts in developed countries for collaborative learning. It also offers telecommunications policy advice for the education sector as well as monitoring and evaluation support. The WorLD program is currently active in over 20 countries in Asia, Africa, Latin America, and the Middle East, reaching nearly 130,000 students. The program calls for the establishment of a network cluster, consisting of a resource center and five satellite schools, in each country. Each resource center will have 10 to 15 networked computers and a central server with an Internet connection. Satellite schools will each have one computer and a monitor to organize access for teachers and students. An independent review of the program in 1999–2000 found that, while the contribution of computer equipment was significant, the program’s most important contribution was the provision of professional development to enhance teachers’ technological and pedagogical skills. Teachers reported that the program had the greatest impact on their capacity to design and prepare projects for students, learn more about their subject matter, and have students work in groups. Seventy-eight percent of WorLD teachers indicated that student knowledge about the use of computers had increased a great deal as a result of working with computers. The WorLD program has helped to cultivate pockets of innovation in schools using ICT to improve education and communication. Sixty-three percent of WorLD teachers reported that their students use computers to interact with students and teachers in other countries, compared with 9 percent of non-WorLD teachers.11 Health In India, InfoDev and CMC Ltd., a government-owned enterprise, are working together to optimize scarce health care resources in the southern state of Andhra Pradesh through a system based on handheld computing technology. The Information-Based Health Care Delivery project seeks to reduce paperwork, improve data accuracy, and empower village health care workers to provide timely care and information. The impetus for the project came from the 10 For more information see the CDI website at http://www.cdi.org.br/. Also see Narayan and Shah 2000. 11 Bloome 2000; SRI International 1999; SRI International 2000; de Alcántara 2001. Also see the WorLD program website at http://www.worldbank.org/worldlinks/english/index.html
Tools and Practices 1
77
Indian government’s interest in improving the effectiveness of preventive health programs in that state and alleviating the heavy burden of data collection and paperwork on health care workers. The project, which began in 199412 and has been piloted in two sites in the Nalgonda district of Andhra Pradesh since June 2001, aims at increasing the efficiency of auxiliary nurse midwives (ANMs). ANMs are a small group of women who shoulder most of the responsibility for health care delivery in the vast and densely populated rural areas. Each one serves 5,000 people, typically spread among different villages and hamlets, often located several miles apart. ANMs administer immunizations, advise on family welfare, and educate people about mother-child health programs. Along with health care delivery, ANMs are also responsible for data collection and record keeping on the rural population’s growth, birth rate, and immunization rate. Handheld computers, or personal digital assistants (PDAs), are expected to facilitate data acquisition and transmission to the primary health centers, saving up to 60 percent of the ANMs’ work time. Redundant entry of data prevalent in paper registers will be eliminated, and ANMs’ monthly reports will be generated automatically, making data electronically available for further analysis and compilation at higher levels of the health care system. The PDAs, whose navigation is based on icons representing villages, households, and individuals, are designed to cater to the literacy levels of the health workers. Each icon, when tapped with the PDA’s pen, leads to a more specific record with information on immunization status, diseases, and other conditions. ANMs show no hesitation in us ing the device, taking the pen in hand, and tapping on the screen. Some had experience with keyboards and took easily to using the software version. Health workers are extensively trained in the use of the pocket computers, which can have screens translated into the local Telugu language. Challenges to the project included delays caused by technical problems and by frequent changes in end-user requirements. For instance, the households list on the PDAs was presented in the order the ANMs typically visit their villages—house by house—but there were cases in which the ANMs administered health services by assembling all villagers in one place. This entailed searching for individuals rather than for households on the PDAs, and required substantive changes to search features.13
ICT as a Tool to Improve Governance E-government refers to the use of ICT by government agencies to transform relations with citizens and businesses. ICT can serve a variety of different ends for improving governance: from better delivery of government services to citizens to improved interactions with business and industry, from citizen empowerment through access to information to more efficient government management. The resulting benefits include less corruption and increased
12 The project began as a collaborative effort between the Indian government and Apple Computers. The first pilot project was conducted in the state of Rajasthan, near the city of Ajmer, between 1994 and 1995. 13 World Bank 2001; InfoDev 2001; Bhatnagar and Schware 2000; CMC Ltd. 2001.

Tools and Practices 1
78
transparency. Information disclosure and the possibility of interacting with public officials can build pressure for improved government accountability at both the local and national levels.14 E-government can be implemented at different stages. At a first stage, departments and agencies use the Web to post information about themselves for the benefit of citizens and business partners. At a second stage, these sites become tools for two-way communication, allowing citizens to request feedback on a particular issue. At a third stage, websites allow a formal, quantifiable exchange to take place, such as renewing a license, paying a fine, or enrolling in an education course. 15 At a final stage, a portal integrates the complete range of government services and provides a path to them that is based on need and function, not on department or agency. 16 Box 2. Enabling More Effective Participation at the Local, National, and Global Levels In Mexico City, the NGO Women to Women used e-mail connections with women’s groups in California to obtain information on the business practices, profit structures, and ownership of a textile company that had announced plans to build a new plant in their community. As a result, they were better prepared to negotiate in their meetings with plant officials and management and with local government. In India, the women’s rights NGO Sakshi faced difficulties in lobbying for sexual harassment legislation. With help from international women’s networks through the Internet, Sakshi was able to receive advice and technical assistance on legal issues surrounding sexual harassment. As a result, the group succeeded in convincing the Indian Supreme Court to establish sexual harassment guidelines in workplaces and brought the issue within the purview of human rights violations.17 Women have used the Internet for organizing and lobbying at the regional and international levels for many years, beginning most notably in 1995 with organization of the U.N. World Conference on Women in Beijing. In 1999, to prepare for Beijing+5, more than 40 women’s media networks formed WomenAction. WomenAction has developed global and regional websites on women’s issues and has also initiated workshops to train women from all regions in the construction of websites, the facilitation of regional and national dialogues, and the repackaging of information downloaded from the Internet.18 Improving Local Governance ICT can play an important role in improving local governance, connecting poor people to local leaders, reducing transaction costs, and better connecting the poor to services. 14 See the World Bank’s e-government website at http://www1.worldbank.org/publicsector/egov/
15 In Brazil, Serviço de Atendimento ao Cidadão (SAC) is a system of public service assistance created by the state government of Bahia. Mobile SAC units visit remote areas and allow geographically isolated populations access to some essential services, such as the issuing of birth certificates, I.D. cards, and labor I.D. cards (World Bank 2001). 16 Symonds 2000. One example of such a portal is Singapore’s eCitizen Centre at http://www.gov.sg/ 17 World Bank 2002. 18 Carr and Huyer 2001.

Tools and Practices 1
79
In Madhya Pradesh, India, Gyandoot, a government-owned computer network, is making government easily accessible to villagers, reducing the time and money they spend trying to get to and through public officials, and giving them immediate and transparent access to local government data and documentation. Gyandoot started in January 2000 in Dhar, a district where 60 percent of the 1.7 million inhabitants live below the poverty line. The program was launched with the installation of a low-cost rural Intranet that initially connected 20 villages and was later expanded to another 11. The district was wired for Rs. 2.5 million (about $55,000) in less than a year. The average cost incurred by the village committee (panchayat) in establishing a single kiosk was Rs. 75,000 (about $1,650). Information kiosks (soochanalayas), located in panchayat buildings, have been placed in villages that have block headquarters, hold weekly markets, or are located on major roads, so that each kiosk can cater to about 25 to 30 villages. The entire network of 31 kiosks thus covers more than 600 villages and reaches half a million people. Kiosks are run by local operators along commercial lines. The operators pay an annual license fee of Rs. 5,000 to the district council (zila panchayat) and earn a monthly gross income between Rs. 1,000 and Rs. 5,000 from user fees. Since most villagers are barely literate and electronic financial transactions in India are not yet legal, an operator to assist users and a physical office for making payments are needed. Currently only a few kiosks have proved to be commercially viable. Gyandoot provides the prevailing rates for prominent crops at auction centers for a charge of Rs. 5. It also furnishes information on previous rates and on the volume of incoming agricultural produce. Villagers now use Gyandoot to keep track of the cost of fruits and vegetables in the region’s wholesale market. They pool their resources and catch a bus to the place offering the best deals, cutting out the middlemen traders. Sometimes this means trucking their produce 400 miles to Mumbai to earn 40 percent more than they would at home. Other times villagers decide to wait and hold on to their produce until prices are higher in local markets. Gyandoot also provides documents on land records for a charge of Rs. 15, thus helping the poor fight fraudulent land claims. In the words of a villager: “The farmers need these land records every season to get crop loans, and the patwari [keeper of land records] extracts a heavy price every season. Bribe him and he will redraw your map at your neighbor’s expense. Ask him for old records and he will tell you that they are lost, burnt, or damaged for good. In the digital database we can retrieve land records for Rs. 15 instead of the minimum bribe of Rs. 200 plus transport costs.” As a consequence, some local politicians and the lower- level bureaucracy, perceiving a loss of power, have attempted to sink the program. Other services offered include an online registration of applications for caste, income, and domicile certificates, a public complaint line for reporting broken pumps, unfair prices, absentee teachers, and other problems, as well as an auction facility to trade land, agricultural machinery, equipment, and other commodities. Gyandoot also offers e-mail services in Hindi connecting village-level institutions with block and district offices.

Tools and Practices 1
80
Challenges encountered when implementing the project included problems with the power supply and with the dial-up connection —as most of the local rural telephone exchanges did not operate with optical fiber cable. Poor or no connectivity can reduce the economic viability of the kiosk and decrease the motivation level of the kiosk operator to be a partner in the project. Around 40,000 people have used Gyandoot’s services since the project’s inception. Following the success of the initiative, the government of Madhya Pradesh has issued a tender to set up information kiosks on the lines of the Gyandoot project across the state. Drishtee.com, an Indian software company, intends to replicate the Gyandoot model nationwide and has already expanded the project in northern India, reaching Sirsa in Haryana, Shahdol and Seoni in Madhya Pradesh, and Jallandhar in Punjab. Pilot projects are to be launched soon in Gujarat and Maharashtra.19 Improving National Governance ICT has the potential to improve national governance by increasing transparency and accountability; allowing greater access to information about representatives, institutions, decisions, laws, and regulations affecting poor people’s lives; and providing mechanisms for contacts between poor people and leaders and decision-making bodies at the national level. In Argentina, the Cristal government website provides information to citizens so that they can exercise more effective control over their political representatives.20 Through the Internet, this initiative discloses and disseminates information concerning the use of public funds in the country in an easily understandable format. The Cristal website was launched in early 2000 to fulfill the mandate of the September 1999 Fiscal Responsibility Law, which required that the state make available to its citizens information related to the administration of public funds. The website includes information on the execution of budgets to the lowest level of disaggregation; purchase orders and public contracts; payment orders submitted to the National Treasury; financial and employment data on permanent and contracted staff and those working for projects financed by multilateral organizations; an account of the public debt; inventory of plant and equipment and financial investments; outstanding tax and customs obligations of Argentine companies and individuals; and regulations governing the provision of public services. After initial problems—stemming from lack of information on much of the site—a new version of Cristal was launched in August 2000. Between the launch and March 2001, visits to the website increased by about 200 percent. The website is currently organized into three thematic areas: “The State within Reach of All,” which explains how public monies are redistributed between the national government and provinces; “Goals and Results,” which gathers information on all national policies to evaluate their management and the manner in which public funds are allocated; and “Accountability and Representatives,” which gathers information related to the fight against corruption, both in government and in the nongovernmental sector. Tutorials
19 World Bank 2002; Gyandoot 2001; Narayan and Shah 2000; Rajora 2002. 20 See the website at www.cristal.gov.ar.

Tools and Practices 1
81
explain each of the themes in a clear and easy-to-grasp fashion. Users can also interact with website staff and feedback is provided within 24 hours. This initiative is proving significant not only because it seeks to improve governmental transparency, but also because many agencies have started to improve their data gathering practices in response to Cristal’s requests. Cristal is audited externally by Foro Transparencia, a coalition made up of 15 nongovernmental organizations concerned with government transparency. 21
ICT as a Tool to Support Poor People’s Entrepreneurship Connecting people to markets, ICT can stimulate poor people’s entrepreneurship and the development of businesses in underdeveloped rural areas. ICT allows poor people to access important market and business-related information in a more timely and efficient manner. For example, isolated farmers can use ICTs to access essential agricultural information such as data on crops, input prices, weather conditions, and credit facilities. Further, electronic bulletin boards and databases are allowing farmers to share innovations and technical information (see discussion of Honey Bee and the National Dairy Development Cooperative below).22 Commercial possibilities for micro producers in developing countries have been multiplied by the Internet, with its capacity to connect producers directly to buyers. By cutting out layers of middlemen, e-commerce has the potential to increase the income of poor producers by giving them a greater share of the final sale price, sometimes 10 times what they would get in traditional trade. Through online sales, artisans can assess which products sell better and tailor production accordingly (see PEOPLink below).23 E-commerce in developing countries, however, is still in its infancy and net profits are generally low because a large portion of the sales price goes to high delivery and payment charges.24 Access to Markets and Business-Related Information In Bangladesh, Grameen Phone provides commercial phone service in rural areas through local entrepreneurs, usually poor women, who own and operate cellular phones that typically serve an entire village.25 Women entrepreneurs borrow about $350 at 22 percent interest from the Grameen Bank to purchase a handset. They then sell telephone services to other villagers,
21 Radics 2001; World Bank 2001. 22 Examples include Chile’s rural information service for farmers groups, as well as Agropol and Agrositio in Argentina. 23 E-commerce websites selling handicrafts made by small artisans from developing countries include Novica.com, OneNest.com, ElSouk, African Crafts Online, and many others. See Narayan and Shah 2000. 24 UNCTAD has estimated the average annual turnover of e-commerce enterprises based in developing countries between $2,000 and $30,000 a year. See UNCTAD 2001, p.192. 25 Grameen Phone was founded in 1996, when the Bangladeshi government was preparing to auction off private cell phone licenses to four companies. Grameen Phone is owned 51 percent by Telenor, a Norwegian company, and 35 percent by the Grameen Bank through its Grameen Telecom arm. The rest of the shares are owned by a Japanese trading house, Marubenu, and a group of Bangladeshi expatriates in the United States.

Tools and Practices 1
82
making a living and paying off their loan, usually within a year. This creates a self-employment opportunity in each village and provides all villagers with access to telephones. Grameen Phone started its operations in Dhaka in 1997 and later expanded to rural areas. As of March 2002, about 100,000 village phones are in operation, catering to an estimated 15 million people. Rural telephones are very profitable for Grameen Phone, bringing in revenues per phone of US$93 a month, twice as much as Grameen Phone’s urban mobile phones. However, rural phones represent less than 2 percent of the phones used on Grameen Phone’s network and so bring in only 8 percent of the company’s total revenue. The company’s profitability thus still depends on its urban business. Village phones, on average, serve 70 customers a month. The average income of the “phone ladies” is estimated at more than $700 a year after covering all costs, more than twice the country’s annual per capita income. In larger villages, individual phone revenues can be more than $12,000 per year, although revenues are falling in areas with multiple telephones. High and, so far, secure returns have led many women to regard these telephones as their “modern cows.” Estimates show that village phones generate savings (or revenues) of between $2.70 and $10.00 per call. This is not only because phone calls would otherwise be extremely expensive, but also because very important information is exchanged: users (40 percent of them women) call relatives and friends, often overseas, to request remittances or medical help; farmers and traders call city markets to find out the prices of agricultural produce. About 50 percent of the calls are made for economic reasons, mainly by poor people. In villages with phones, eggs and poultry sell for higher prices, the cost of information is much lower (17 taka as opposed to 72 taka, the cost of a trip to town), cost of feed is lower, and diesel prices are more stable. Prices paid by traders for raw materials and crafted goods have risen because sellers have more pricing information. Exchange rates for currency from expatriates have improved. Furthermore, the phones offer the villagers additional benefits such as improved law enforcement, faster and more effective communications during disasters, and stronger kinship bonding. The Grameen Phone experience has shattered many myths about the capabilities of poor rural women. Even illiterate women in rural areas who have never seen a telephone have mastered the skills quickly, gained confidence, and earned new status and respect in their communities as owners of a powerful and desirable asset. Telephone owners have greater freedom than before to move about the villages as they deliver messages or take the phones to users, charging a higher fee for the service. Women learn about medical information and the status of markets in Dhaka by overhearing conversations. Some have developed a sophisticated functional knowledge of international currency markets. “She used to cook for the elites,” said the neighbor of one of these phone ladies. “Now she is invited by them.” Looking to the future, Grameen Telecom plans to set up cyber kiosks in rural villages. “The cell phone will be followed by the Internet, faxing, and worldwide networking,” says Grameen Bank’s Mohammed Yunus, who hopes that telecommunications will revolutionize the cognitive world of the villagers. In 1999, the International Finance Corporation signed an agreement to lend $16.7 million and invest $1.6 million in equity toward expanding Grameen Telecom, now

Tools and Practices 1
83
the largest cellular phone operator in Bangladesh. The Asian Development Bank and the Commonwealth Corporation are providing parallel financing in the form of loan and equity investments.26 E-Commerce: Connecting Small Artisans to Markets PEOPLink is a nonprofit corporation formed in 1995 to build a global network of trading partners that can provide services to community-based artisan producer groups. PEOPLink currently works with more than 100 trading partners—local NGOs with relationships to grassroots groups such as craft cooperatives and peasant leagues—in Africa, Asia, and Latin America. PEOPLink functions both as a business-to-consumer (B2C) business, connecting poor producers to customers through the Internet, and as a business-to-business (B2B) broker and escrow agent for wholesale opportunities, connecting producers with firms in industrial countries. Artisans represented by the trading groups, the majority of them women, are organized into community-based producer groups. They are talented artisans who have developed their skills over generations but who have not had the resources to connect directly to the global marketplace. Traditionally, they have sold their goods through a long and complicated chain of middlemen who pay them low prices and then mark up the items many times on the way to the final consumer. Through e-commerce, PEOPLink helps artisans improve their terms of trade. It has placed great emphasis on training and developing a set of equipment, software, and procedures that enables trading partners to work with electronic communications for improved product design and sales. Trading partners are equipped with digital cameras and trained to photograph artisan products and load them onto the PEOPLink e-commerce website. They also receive online training and product development support to build their own websites and online catalogues. PEOPLink staff usually travel to the country where the trading partner is located and do a series of demonstrations to demystify the technology to people with limited exposure to Internet applications. Additional technical support is provided in specific areas such as product design, quality control, packing, shipping, and creation of a coordinated global distribution and payment system. Daily sales range between $50 and $500, with up to 90 percent going to artisans. Examples of PEOPLink’s wide range of trading partners include the Kuna Mola Cooperative, Tiendas Camari, and the Community Crafts Association of the Philippines. Kuna Mola is a cooperative of 1,200 indigenous Kuna women living on the San Blas Islands off the Caribbean coast of Panama, who produce intricate reverse appliqués based on their traditional dress. Tiendas Camari serves 98 community producer groups representing more than 8,000 artisans in the highlands of Ecuador producing both handicrafts and foodstuffs. The Community Crafts Association of the Philippines (CCAP) serves 21 producer associations and 30 family-based
26 Burr 2000; Digital Opportunity Initiative 2001; Grameen Phone 2001 and 2002; Narayan and Shah 2000.

Tools and Practices 1
84
groups with more than 2,000 artisans, 90 percent of whom are women. CCAP is a well-established institution with more than $700,000 in annual exports.27 Support to Innovators In India, the InfoDev-sponsored Honey Bee Network is making poor people’s innovations and traditional knowledge visible through a multimedia and multi- language database of solutions to local development problems. The database contains more than 10,000 innovations in text form collected from 4,000 villages and presented in seven languages, as well as over 100 innovations in multimedia format. The information is disseminated both through the Honey Bee newsletter and through stalls in religious fairs, which receive more than 400 visitors per day. Soon, linkages between farmers, rural extension workers, and researchers in agricultural institutions will be strengthened by the creation of a knowledge network. This network will allow extension workers and researchers to transmit information by sound or picture files to facilitate communication with farmers who are illiterate. The Honey Bee Network is a concrete example of the democratization of knowledge through horizontal networking. Local communities and individual innovators, even those who are illiterate, can use the network to learn from each other across large geographic distances and across cultures. Many of the innovations are extremely simple but can significantly improve the efficiency of farm workers, small farmers, and artisans. Innovative solutions have included a tilting bullock cart, a simple device to fill nursery bags, an improved pulley for drawing water, and a gum scrapper to enable women to collect gum from thorny bushes or trees. The database also features a large number of small machineries, herbal pesticides, veterinary medicines, new plant varieties, and agronomic practices developed by small farmers. Scouting and documenting innovations, however, is not enough. Some of the innovators actually experienced increased frustration after being featured in the database. They know that despite doing good work, they remain poor. There is therefore a need to commercialize these innovations, which in turn requires an incubator fund, a microventure capital fund, and the protection of intellectual property rights. In 1993 Honey Bee was strengthened by the formation of a volunteer organization, the Society for Research and Initiatives for Sustainable Technologies and Institutions (SRISTI). Since then, Honey Bee has scaled up significantly, with the creation of a regional microventure promotion fund, the Gujarat Grassroots Innovation Augmentation Network (GIAN), and a national register for innovations, the National Innovation Foundation (NIF). GIAN was created in 1997 in collaboration with the Gujarat state government, which as of June 2001 contributed $300,000 to convert innovations from the Honey Bee database into viable enterprises. Innovators are given access to risk capital and to technical know-how to turn their innovations into a product that can be commercialized. As of June 2001, GIAN incubated several innovations into products, filed nine patents on behalf of grassroots innovators, and licensed some of the innovations to entrepreneurs on a district-wide basis with the license fee
27 See the PEOPLink website at http://www.peoplink.org. Also see Digital Opportunity Initiative 2001; Narayan and Shah 2000.

Tools and Practices 1
85
going to innovators. Honey Bee intends to set up similar venture promotion funds in other states in India. The National Innovation Foundation was set up in March 2000 to replicate the Honey Bee model all over the country, with $5 million from the Indian Department of Science and Technology at Ahmedabad. The NIF will develop a national register of inventions and innovations, link innovations, investments and enterprises, connect excellence in formal and informal sciences, set up incubators, and help in changing society’s mindset to ensure respect, recognition, and reward for grassroots innovators who often face indifference or contempt. In 2001, NIF organized a national contest for scouting innovations, and more than 1,800 proposals were received from all over India.28 Support to Small Farmers The milk cooperative movement initiated by India’s National Dairy Development Board serves 600,000 households daily, making it one of the largest cooperatives in the world. Dairy products are marketed in 500 towns and milk is collected through 96,000 village milk collection societies in 285 districts, involving 10 million farm families. Approximately 16.5 million liters of milk are procured daily with an annual value of Rs. 780 billion (about $16 billion). About 2,500 collection centers in Gujarat have introduced a computerized system with integrated electronic weights, electronic fat-testing machines, and plastic readers. This has increased transparency and led to faster processing, shorter queues, and immediate payment to farmers. Formerly, the fat content in milk was calculated through a cumbersome measurement process hours after the milk was received. Even if they delivered milk daily, farmers were paid only every 10 days and had to trust the cooperative society staff’s manual calculations of the quality and quantity of milk. Malfeasance and underpayment to farmers, although difficult to substantiate, were commonly alleged. With the computerized system, dairy farmers now receive immediate payment and save considerable time with shorter queues at milk collection centers. Farmers delivering milk to the cooperative collection centers are given a plastic card as a form of identification. The card is dropped into an electronic reading machine that transmits the I.D. number to a personal computer. The milk is then emptied into a steel trough and the weight is instantly displayed to the farmer and communicated to a computer. A sample is also fed into a machine that determines its fat content in seconds, displaying it to the farmer and transmitting it to the computer. The computer calculates the amount due to the farmer on the basis of the milk’s fat content. The total value of the milk is then printed on a payment slip and given to the farmer, who collects the payment at an adjoining window. In many centers the entire transaction takes no more than 30 seconds. The more than 50,000 dairy farmers who use the computerized sys tem feel empowered and benefit from a more transparent, efficient, and effective cooperative delivery system.
28 Baramati Initiatives 2001; Bhatnagar and Schware 2000; Cecchini forthcoming.

Tools and Practices 1
86
The Centre for Electronic Governance at the Indian Institute of Management, Ahmedabad has also developed a Dairy Information System Kiosk (DISK) software package which is being pilot tested in two cooperative villages in the Kheda District, Gujarat. DISK has two main components: an application with enhanced database and reporting that includes a complete history of all milch cattle owned by the farmers, and a dairy portal connected to the Internet through which producers can make business transactions, order supplies, access information and government documents, and exchange information with each other. Farmers will also be able to learn about dairy innovations through a multimedia database, the Honey Bee Network (see above)..29
Access to Financial Services Computerization, smart cards, and automated teller machines (ATMs) reduce costs for financial institutions, enabling them to reach clients more efficiently. Poor people and micro businesses, therefore, can gain broader access to financial services. Even the most efficient MFIs are in fact spending between 35 percent and 51 percent of their average loan outstanding on operating costs. Smart cards with an embedded microchip containing information on the clients’ credit history, along with software systems that provide loan tracking, financial projections, and branch management information, help microfinance institutions (MFIs) reduce transactions costs. By lowering costs, smart cards and software systems can make MFIs financially sustainable more quickly and in a position to reach a large number of poor people.30 In addition to smart cards, ATMs, allowing cost-effective deposits and withdrawals, can make it possible for commercial banks to extend services to poorer townships and slums.31 Smart Cards for Microfinance An Indian MFI, Swayam Krishi Sangam (SKS), started using smart cards in August 2000 to reduce time spent on copiously recording financial transactions at group meetings. SKS was set up in 1998 by Vikram Akula, a son of Indian immigrants to the United States, who was inspired by a visit to Muhammad Yunus and the Grameen Bank. SKS targets the poorest 20 percent of the population by focusing on the poorest regions and selecting individuals through key informant interviews and village surveys. As a result, SKS clients are considerably poorer than most MFI clients. SKS currently operates four branches in Medak District, Andhra Pradesh, and serves about 2,200 female customers. SKS provides savings and loan products designed through participatory processes and disbursed through village collectives called sangams. As of June 2001, total disbursement was $165,000 with a repayment rate of 100 percent on income-generating loans
29 World Bank 2001; Bhatnagar and Schware 2000. See also India’s National Dairy Development Board website at http://www.nddb.org. 30 In Africa, the financial and information service network provided by Pride Africa offers microfinance to a client base of 100,000 in five countries. The average loan size is $125 (Digital Opportunity Initiative 2001). 31 Digital Opportunity Initiative 2001; Akula 2000.

Tools and Practices 1
87
(20 percent interest rate), seasonal loans, and emergency loans (0 percent interest rates). Most members take $50 general loans their first year and $100 their second, and use these funds for land and livestock-related enterprises. At one of the four SKS branches, loan officers are piloting the smart card technology. At the branch office they download borrower information from a main computer terminal into a handheld computer before a group meeting. At the meeting, borrowers insert their smart cards into a reader in the handheld computer to review their accounts and record new transactions. Upon returning to their offices, loan officers upload information back into the main computer. A read-only handheld computer is left in the village for customers to check their balances on a regular basis. SKS plans to expand the use of the technology to all four branches. Smart cards offer three important advantages for SKS. First, they lower the high cost of delivering financial services to the poor by reducing the time of weekly village meetings by as much as 50 percent, enabling field staff to conduct three or four village meetings per day instead of the typical two per day. Second, smart cards help SKS maintain sound financial standards and controls to prevent error and fraud. This is particularly important because microfinance involves a large number of transactions, thus leaving ample scope for error and fraud. Smart cards solve this problem by having a single data entry point on an “electronic passbook” that seamlessly links information from the village to the branch, up to the head office and even to donor and lending agencies. In addition, the smart card system enhances the ability of management to monitor operations and respond quickly to problems. Finally, smart cards promote SKS sustainability and enable the MFI to offer a wide range of flexible financial services to better meet the financial needs of the poor.32 Smart Cards for Small Businesses In Swaziland, the Growth Trust Corporation, a business affiliate of Swazi Business Growth Trust (SBGT), with assistance from USAID and Development Alternatives, Inc., is issuing smart cards to its small business clients to allow them to get funds and make repayments at participating commercial bank branches around the country. SBGT, acting as a “virtual bank,” has provided Swaziland’s four major banks and their branches in the country’s two largest cities with battery-powered smart card reading terminals. SBGT maintains a line of credit with the commercial banks offering the service free of charge to its low-income clients. Transaction information, complete with cash flow analysis, is downloaded daily, enabling SBGT to accurately and easily monitor disbursements and repayments. SBGT invested approximately $100,000 to develop its smart card technology and banking software. Smart card reading terminals cost $1,000 per unit; smart cards cost about $8 each, and can be reprogrammed after being returned by graduated borrowers. The system is becoming less expensive, as the cost of smart cards is falling rapidly and a less expensive ($500) reading terminal is being developed. In the future, SBGT plans to make transactions, including savings services, available to its customers by telephone and online.
32 Akula 2000.

Tools and Practices 1
88
ATMs to Bring Commercial Banking to the Poor In 1993, the Standard Bank of South Africa created an affiliate, E Bank, to deliver basic banking services to the urban poor through ATMs conveniently located in townships. Historically, poor South Africans have opened direct deposit accounts with the banking system in order to avoid theft. Most wage laborers have passbook savings accounts that have high transaction costs because of high transaction fees and teller time. Long payday lines of one to two hours at banking halls are expected. Due to high levels of illiteracy, banks were unable to move these low-balance high-volume accounts to card-based accounts accessible through regular ATM machines. E Bank combines innovative technology of modified ATM services with staff trained to help clients with basic electronic banking. E Bank outlets are situated in nontraditional kiosks open to the sidewalk, conveniently located in townships, with videos for entertainment or instruction, and are decorated with vibrant colors. In addition to text, the ATMs have a simplified screen that uses graphics to illustrate usage for illiterate customers. Each kiosk is staffed by three or four assistants who speak several local languages. E Bank offers a single savings account (no checking, no passbook) and all accounts with more than R 250 ($56) earn interest. Clients can obtain cash, deposit savings, and transfer money to relatives and others in the system around the country. Depositors with regular minimum balances become eligible for drawings and prizes and even automatically receive a modest amount (R 1,500, or $333) of life insurance coverage. More than 150,000 customers created E Bank accounts within its first year of operation. However, running E Bank as a stand-alone entity was not profitable as the number of transactions per machine was below the break-even point. In 1996 E Bank was folded back into Standard Bank and E Bank clients were transferred to a new E Plan; facilities were renamed Auto Bank E outlets. In May 1997, Standard Bank converted 570,000 low-balance customers to the E Plan. In addition, E Plan attracted 600,000 new account holders in the 10 months between late 1996 and mid-1997. By 2000 there were approximately 1.4 million E Plan account holders using 70 Auto Bank E outlets. In 1997 there were more than 18 million Auto Bank E transactions, which make up 24.6 percent of all Standard Bank transactions. It takes about 8,000 transactions per month to break even on the ATM machines, and the average for E Plan is about 12,000. Forecasts for 2002 were for 50 million Auto Bank E transactions—42.5 percent of all Standard Bank of South Africa transactions.33
Resources Akula, Vikram Byanna. 2000. “Putting Technology to Work for Poverty Alleviation: A Draft
Proposal for $151,030 to Develop Smart Cards for Microfinance.” Swayam Krishi Sangam, Hyderabad, Andhra Pradesh, India.
33 Paulson and McAndrews 1998.

Tools and Practices 1
89
Baramati Initiatives. 2001. “Honeybee Network Case Study.” Prepared for the workshop on
Achieving Connectivity for the Rural Poor in India, Baramat, Maharashtra, India, May 31–June 2. Available: http://www.baramatiinitiatives.com/cases/case4.htm
Bhatnagar, Subhash, and Robert Schware, eds. 2000. Information and Communication
Technology in Rural Development: Case Studies from India. New Delhi: Sage Publications India.
Bloome, Anthony. 2000. “The Bindura–World Links for Development Telecentre: Modest in
Size, but Mighty in Impact.” TechKnowLogia 2 (November/December). Burr, Chandler. 2000. “Grameen Village Phone: Its Current Status and Future Prospects.” Paper
presented at international conference on Business Services for Small Enterprises in Asia: Developing Markets and Measuring Performance, Hanoi, Vietnam, April 3–6. Available: http://www.ilo.org/pub lic/english/employment/ent/papers/grameen.htm
Carr, Marilyn, and Sophia Huyer. 2001. “Information and Communications Technologies: A
Priority for Women in Developing Countries.” Paper prepared for Once and Future Network Meeting on Gender and ITs in a Global Economy, Harvard University, May 1.
Cecchini, Simone. Forthcoming. “Can Information and Communications Technology
Applications Contribute to Poverty Reduction? Lessons from Rural India” World Bank, Poverty Reduction and Economic Management Network, Washington, D.C.
CMC Ltd. 2001. “India Health Care Project. 4th Quarterly Report.” Covering July 1 to September
30, 2001. Submitted to InfoDev, Hyderabad, India. de Alcántara, Cynthia Hewitt. 2001. “The Development Divide in a Digital Age. An Issues
Paper.” Programme Paper 4. United Nations Research Institute for Social Development, Technology, Business and Society program area, Geneva. Available: ftp://ftp.unicc.org/unrisd/outgoing/pp/tbs/hewitt.pdf
Digital Opportunity Initiative. 2001. “Creating a Development Dynamic: Final Report of the
Digital Opportunity Initiative.” New York. Available: http://www.opt-init.org/framework.html
Grace, Jeremy, Charles Kenny, and Christine Qiang, with Jiu Liuard Taylor Reynolds. 2001.
“Information and Communication Technologies and Broad-Based Development: A Partial Review of the Evidence.” World Bank, DECRA Research Project, Washington, D.C.
Grameen Phone. 2001. “Village Phones.” Available: http://www.grameenphone.com/village.htm ———. 2002. Grameen Phone Newsletter, March 2002. Available:
http://www.grameenphone.com/news/new.htm

Tools and Practices 1
90
Gupta, Anil K. 2001. “Building Upon Grassroots Innovations: Articulating Social and Ethical Capital.” SRISTRI, Ahmedabad, India. Available: http://209.249.15.51/users/know-net/papers/A34.htm
———. 2001. “Honey Bee Scales Up.” May 23, email. Gyandoot. 2001. “A Community-Owned, Self Sustainable and Low Cost Rural Intranet Project.”
Available: http://www.gyandoot.nic.in/gyandoot/intranet.html Heeks, Richard. 1999. “The Tyranny of Participation in Information Systems: Learning from
Development Projects.” Development Informatics Working Paper 4. Institute for Development Policy and Management, University of Manchester, U.K. Available: http://idpm.man.ac.uk/idpm/di_wp4.htm
InfoDev. 2001. “InfoDev Quarterly Report: Second Quarter 2001.” The World Bank:
Washington D.C. Available: http://www.infodev.org/library/qr201.pdf Mathew, Ciny. 2001. “Simputer: Netdevice for DCs.” Information Technology in Developing
Countries (10) 3. Available: http://www.iimahd.ernet.in/egov/ifip/dec2000.htm Michiels, Isabel, and L. Van Crowder. 2001. “Discovering the Magic Box: Local Appropriation
of Information and Communication Technologies.” SD Dimensions (June). Food and Agriculture Organization of the United Nations, Sustainable Development Department, Communications for Development Group. Available: http://www.fao.org/sd/2001/KN0602a_en.htm
Narayan, Deepa, and Talat Shah. 2000. “Connecting the Local to the Global: Voices of the
Poor.” Framework paper prepared for workshop on Local to Global Connectivity for Voices of the Poor, December 11–13. World Bank, Poverty Reduction and Economic Management Network, Poverty Reduction Group, Washington, D.C. Available: http://www.worldbank.org/poverty/voices/globcoal/dec00/narsha.pdf
Paulson, Jo Ann, and James McAndrews. 1998. “Financial Services for the Urban Poor: South
Africa’s E Plan.” Policy Research Working Paper 2016. World Bank, Development Research Group, Washington, D.C.
Radics, Axel. 2001. “Cristal: Transparencia en la Gestión Pública.” Revista Probidad 14 (May–
June). Special edition on corruption in Argentina. Buenos Aires, Argentina. Available: http://www.probidad.org/revista/014/art14.html
Rajora, Rajesh. 2002. Bridging the Digital Divide: Gyandoot – The Model for Community
Networks. Tata McGraw-Hill, New Delhi. Reilly, Katherine, and Ricardo Gómez. 2001. “Comparing Approaches: Telecentre Evaluation
Experiences in Asia and Latin America.” Electronic Journal on Information Systems in Developing Countries 4 (3):1–17. Available: http://www.is.cityu.edu.hk/ejisdc/vol4/v4r3.pdf

Tools and Practices 1
91
Reuters. 2002. “Simputer for the masses set for takeoff.” March 6, 2002. Available:
http://zdnet.com.com/2100-1103-852805.html SRI International. 1999. “World Links for Development: Accomplishments and Challenges.
Monitoring and Evaluation Annual Report 1998–1999.” SRI Project P03617. SRI International, Center for Technology in Learning, Menlo Park, Calif. Available: http://www.worldbank.org/worldlinks/english/assets/SRI_WorLD_report-view.pdf
———. 2000. “World Links for Development: Accomplishments and Challenges. Monitoring
and Evaluation Annual Report 1999-2000.” SRI Project P10533. SRI International, Center for Technology in Learning, Menlo Park, Calif. Available : http://www.worldbank.org/worldlinks/english/assets/SRI_M-E_Annual_Report_1999-2000.pdf
Symonds, Matthew. 2000. “The Next Revolution: After E-Commerce, Get Ready for
E-Government.” The Economist, 24 June, 53–59. Available: http://www.economist.com/surveys/showsurvey.cfm?issue=20000624
UNCTAD. 2001. E-Commerce and Development Report. United Nations: New York and
Geneva. Available : www.unctad.org/en/pub/ps1ecdr01.en.htm World Bank. 2002. “Information and Communication Technologies: A World Bank Group
Strategy” Global Information and Communication Technologies Department, Washington, D.C. Available: http://info.worldbank.org/ict/ICT_ssp.html
Websites Committee for Democracy in Information Technology (CDI) http://www.cdi.org.br/ Global Coalitions for Voices of the Poor Web Guide ICT: http://www.worldbank.org/poverty/voices/globcoal/webguide/ict.htm E-Commerce: http://www.worldbank.org/poverty/voices/globcoal/webguide/ecom.htm Grameen Phone http://www.grameenphone.com PEOPLink http://www.peoplink.org World Bank E-government Website http://www1.worldbank.org/publicsector/egov/ World Links for Development (WorLD) Program http://www.worldbank.org/worldlinks/english/index.html

Tools and Practices 1
92
TOOLS AND PRACTICES 2
Empowerment and the World Bank’s Country Assistance Strategy for Indonesia
Drawing from the most recent poverty report on Indonesia prepared by the World Bank, the Bank’s Indonesia Country Assistance Strategy Fiscal Year 2001–2003 (CAS) emphasizes policies and programs to help empower Indonesia’s poor and vulnerable. This note outlines the poverty report’s treatment of empowerment issues and then describes how they are taken up in the CAS, including specific lending and non- lending activities. It concludes with a review of the Bank’s support for community-driven development programs.
The Poverty Report Poverty Reduction in Indonesia: Constructing a New Strategy (October 2000) discusses up front the close link between poverty and governance issues. The report notes that it is pointless to discuss recommendations for actions the government can take to reduce poverty “without first worrying, deeply, about the capability and incentives and accountability of the government itself.” The report points out that democratization and decentralization are changing the fundamental design of governance in Indonesia, and that the nature of these changes in governance will matter for the poor, suggesting three basic elements for emphasis:
• Information. Poverty reduction programs should break the “monopoly on information” held by previous administrations. Wide publicity through multiple channels about the content of programs before and during program implementation should be given high priority and budget. A criterion for program success should be the extent of awareness created among primary target groups (such as the poor, and the most disadvantaged among the poor).
• Voice. The voices of poor people should be included in public expenditure allocation, in
program design, and in public sector implementation. Programs to reach the poor should strive to give them at least as much choice as the non-poor, rather than limiting the poor to government suppliers only. But choice is not possible in all situations, and in many cases “public goods”—such as roads and police services—are necessarily used by all citizens in the community. In these cases, citizen voices, especially of poor people and women, must be sought directly in making decisions and in monitoring services.
• Accountability. Decision makers at all levels should be accountable to the people for
each stage of planning, budgeting, implementing, and monitoring public programs and projects. In particular, officials should be accountable for outcomes: Do people find the public services useful to them, in line with what they need, and are they kept up over
This note was prepared by Jessica Poppele (EACIQ).

Tools and Practices 2
94
time? This will mean creating a new ethic of public service, reorienting civil service incentives, and gradually increasing the rule of law and transparent law enforcement.
After making this fundamental link between governance and poverty, the report discusses specific policies and programs in two broad areas of action: a policy environment conducive to raising the incomes of the poor, and effective public services that reach the poor in the core areas of government responsibility. Policy Environment The first area of action assumes that, for the most part, families and individuals will escape poverty and reduce their vulnerability through their own efforts. The economic policies pursued by government can either stymie or assist these individual efforts. A policy framework to create an environment in which individuals can make progress contains three elements that raise empowerment issues:
• Resumption of rapid sustainable growth. Policies that lead to a growing economy with rising real wages, expanding employment, and limited inflation will create an environment for poverty reduction. But for the poor to benefit fully from growth, the government must take steps to eliminate corruption; maintain open internal trade (which benefits poor farmers); enable small and medium enterprises to thrive; and raise rural incomes (through productivity improvements).
• Economic empowerment of the poor. For growth to be an effective route to poverty
reduction, the poor must have equitable access to assets and fair returns for their products. Policies affecting the markets for labor, capital (finance, savings), land, and natural resources will be key determinants.
• Poverty-focused public expenditures. Allocations of public expenditures that maintain
fiscal balance and enable decentralization while benefiting the poor are a third key element of economic policy. Three actions are essential: looking at what subsidies can be eliminated (as most benefits go to the rich and there are more direct ways of helping the poor); examining the pattern of spending across and within sectors to see who benefits; and supporting a regional transfer system that reduces inequality.
Effective Public Service Delivery The second area of action concerns issues of effective public service delivery, starting with local governance and including basic health and education, basic infrastructure, mobility and access, and safety nets. In each of these areas, the report focuses on factors that affect how well these services are provided and how responsive they are to the needs of citizens.
• Local governance that puts people first. Decentralization will hand over public service delivery and development responsibilities to subnational governments. The report looks at the areas and ways in which the basic ingredients of good governance should be considered in local elections, civil service structures, budget processes, and program

Tools and Practices 2
95
design, and in responsible spending of public monies, so that decentralization can actually improve public service delivery.
• Basic health, education, and infrastructure that meet the needs of the poor. The report
discusses various ways to reorient service delivery to be more responsive to local needs, especially those of the poor. These include better incentives for civil servants, “demand side” measures to give providers feedback and provide accountability for adequate services for the poor, and creating a “broker” or “facilitator” function that helps the poor make their voices heard.
• Safety nets for the poorest and measures to help vulnerable groups cope with shocks.
The report notes two groups who need special attention. One is a small number of chronically poor people, primarily those who lack earning power (widows, orphans, the socially excluded, the physically disabled) and thus require some basic income assistance. The other, larger group consists of people who need a temporary hand after losing a job or falling ill: not a safety net, but a temporary safety trampoline or cushion to prevent a drop into chronic poverty and propel them back into productive activity.
The Country Assistance Strategy for Indonesia The same ideas that shape the poverty report form the core of the Country Assistance Strategy. The CAS states:
The overarching goal of the Bank Group’s CAS will be to reduce poverty and vulnerability in a more open and decentralized environment. This will require attention to government policies that promote broad-based economic growth as a key requirement for poverty reduction. At the same time, the quality of growth matters to make it sustainable and genuinely pro-poor. But it is not just what government does, not just how much the government spends, but how well its services are provided. Strong improvements in governance will be critical to winning back confidence from private investors and giving voice to the poor. With the far reaching decentralization of government functions just around the corner, actions will be required to build strong governance both at the national and local levels to ensure effective public service delivery to the poor. (p.19)
The CAS then elaborates three broad priority areas, each of which gives special attention to empowerment and governance issues. Sustaining Economic Recovery and Promoting Broad-Based Growth This first CAS area explains how the Bank will promote pro-poor policies and public expenditures in the context of other actions to support economic recovery and growth:
• Keeping rice prices affordable and internal trade open, and supporting rural development through provision of basic infrastructure, credit, research, and extension

Tools and Practices 2
96
services. The Bank will continue to provide policy advice in these critical areas and will use investment programs that emphasize empowerment in rural development.
• Helping to empower the poor through access to secure possession of land and natural
resources and increasing the availability of financial services to them. The Bank is working to encourage stakeholder dialogue on forestry and land policy. It is also undertaking analytical work and supporting preparation of a Land Management Policy Development Program to help reverse past practices of land allocation and distribution that disadvantaged the poor. The Bank’s support for microfinance will focus on increasing access by the poor and strengthening institutions, rather than on credit subsidies. A rural finance project is foreseen for fiscal 2003.
• Helping to keep a poverty focus in public expenditures, including looking hard at which
subsidies can be eliminated and supporting poverty reduction by local governments. The Bank will continue to support the government’s policy of reducing fuel subsidies and redirecting funds to pro-poor programs. To help encourage poverty agendas at the local level, through budget transfer, the Bank will focus on the fiscal transfer framework, as well as on the minimum standards of service delivery. These will be addressed through policy advice and technical assistance, and in the context of proposed projects in health, education, and basic infrastructure.
Building National Institutions for Accountable Government This CAS area notes that “strong improvements in governance” will be critical to giving voice to the poor. Actions in this area rely heavily on analytical and advisory activities addressing, at the national level, legal and judicial reforms, civil service reforms, decentralization, and the government’s fiduciary controls. Delivering Better Public Services to the Poor The national- level governance agenda is complemented by and overlaps with this third CAS area. Here the Bank’s strategy looks at Indonesia’s decentralization and democratization reforms as an opportunity to support empowerment on three fronts: supporting improvements for more accountable and transparent public sector management at the local level; building community participation features, where appropriate, into sectoral projects (for example, empowering water users associations); and expanding projects that work through communities linking up to local government from below. During the CAS period, Indonesia’s “big bang” decentralization offers the biggest hope for—and significant risks to—public service delivery. Decentralization makes possible more accountable and transparent government by bringing government closer to the people. However, in light of international experience, it is clear that decentralization will not lead automatically to these empowerment outcomes. To encourage such reforms, the Bank strategy proposes that donor support be directed toward subnational governments that have put pro-poor reforms into practice, that is, those who have taken steps toward more transparent, accountable, and demand-responsive public service delivery. To begin to get to know local governments and identify
Tools and Practices 2
97
reformers, the country strategy includes a process for deeper engagement with local governments and civil society organizations in three provinces and 10 cities through consultations and public expenditure reviews. This activity is expected to begin supporting efforts by the selected local governments to become more transparent and accountable to citizens, to understand from local stakeholders ways to address key development challenges in the regions, and to build an analytical foundation for the selection of regions in which the Bank could operate. Concurrent with the Bank’s engagement with local governments on public sector management reforms, sectoral studies and projects are investiga ting and pushing ahead with empowerment reforms. Water sector management provides a good example. Under an umbrella of broad institutional and regulatory reforms, supported by the Bank’s Water Sector Adjustment Loan, national, provincial, and river basin–level authorities are being set up with membership from civil society and other stakeholders to improve accountability. The reforms also require local governments to apply demand-driven and participatory approaches for planning, building, and maintaining rural water infrastructure. To help put these reforms into practice, the Java Irrigation Improvement and Water Management Project has been establishing self-governing water users associations across Java since 1997. By 2001 more than 360 of these were operational, with membership from over half a million rural households. These associations (whose members are the users of irrigation services) elect their leaders, collect irrigation fees, take the lead in operation and maintenance of the infrastructure, and allocate water. In some districts (kabupatens), part of the irrigation budget is being transferred to these water users associations for the O&M on a matching basis. Preliminary evidence suggests that productivity and rural income have improved, and water and finance are being used more efficiently. A grant from the Netherlands will allow this approach to be piloted off Java. A new investment loan, Water Resource Management Program (FY03), will help take improved governance, accountability, and water user empowerment objectives to the next stage.
The World Bank’s Role in Community-Driven Development in Indonesia Bank-funded community empowerment projects have built from an Indonesian tradition of (troubled) “bottom-up” planning. Indonesia has for some time made the provision of basic infrastructure for villages—addressing problems of access to education, health, and safe water—a development priority. Studies all pointed to the lower costs, higher quality, and greater ownership that comes from community participation. However, in all cases, the top-down government budget transfer system was clumsy and slow to respond to the so-called bottom-up planning that was in place. Furthermore, reviews of community programs on the ground showed recurrent problems of elite capture and political manipulation. Simply building infrastructure was not enough without a more conducive environment for planning and managing it. Large-scale Bank and government sector work and operational replies to the systemic problems of bottom-up planning started in the mid-1990s, with the Local-Level Institutions study (LLI, FY98) on the one side, and the Water Supply and Sanitation for Low-Income Communities project (WSSLIC, FY92 Board) and the Village Infrastructure Project (VIP, FY95 Board) on the

Tools and Practices 2
98
other. WWSLIC was the first government of Indonesia project to bring communities into project decision making by requiring them to contribute both in cash and in kind. The project combined community participation in water supply and sanitation planning with integrated hygiene and sanitation education in order to improve villagers’ health, and also to free up time spent carrying water for other productive activities. Other early projects, such as the National Watershed Management and Conservation Project (NWMCP, FY93 Board), piloted the direct transfer of funds to community groups. But it was the VIP that pioneered direct resource transfers on a large scale to villages across Java. Funds were used by villagers to build rural infrastructure despite initial skepticism that the system (and villagers) could respond. The LLI study documented the systematized mismatches between community priorities and development investment decisions, and regional agricultural area development projects were restructured in light of these lessons. The LLI study identified the growing gap between government agencies and community organizations, and it also pointed to the social processes that were creating these gaps. The key finding from that study was the potentially positive role that community institutions could play in local development despite the many ways in which they were being undermined by the “New Order” approach of the government, which sought to limit the involvement of civil society. The Bank’s Poverty Assessment (FY01) also stressed the close linkages between local governance reform, demand-responsive public services, and a revived strategy for poverty reduction. These findings harmonized well with academic work on social capital, and with work being done in other countries on community-driven development. The Bank’s strategy for community development has evolved along with the government’s own changing perspective on decentralization and local reform. However, the heart of this strategy has been the use of projects to create “facts on the ground” that show that properly designed community empowerment programs lead to higher returns, greater benefits for the poor (including better accountability for and more transparent use of funds), and more sustainable outcomes. World Bank contributions to these types of programs have concentrated less on detailed sector work per se than on setting the operational precedents for pushing to the next level. Thus, the first Village Infrastructure Project provided the design machinery for communities, on a large scale, to receive funds directly and manage them in accountable ways. Lessons from WSSLIC and the NWMCP pilot also lent support to rooting rural infrastructure in community empowerment. The NWMCP Implementation Completion Report of 2000 affirmed: “Direct involvement of primary stakeholders in planning, implementation and management of key activities, e.g., conservation and village infrastructure works is important for realizing sustainable project development.” Once there was a system in place to transfer and manage money and projects at the village and community levels, other projects began to make use of this mechanism for various approaches to development assistance. Beginning in the mid-1990s, new project approvals shifted steadily away from big-contract, large-scale infrastructure and began putting more funds directly under community control. In the mid-1990s less than 10 percent of new Bank approvals were directed to communities, but by the latter part of the decade this rose to one-third, and from fiscal 1999 to 2001 more than 50 percent—with as much as 75 percent in one year—of approvals were for community empowerment. For example, the Decentralized Agriculture and Forestry Extension Project (FY00 Board) is piloting ways to help extension workers better respond to farmers’ needs by

Tools and Practices 2
99
giving communities more control over project funds. The Second Water Supply and Sanitation for Low Income Communities Project (FY00 Board) adopted the Village Infrastructure Project fund-channeling mechanism to take community participation to the next stage in the health sector. The value of community empowerment approaches is not limited to rural areas. The Urban Poverty Project (FY99 Board) has shown that the incomes of poor city-dwellers can also be raised through community-driven approaches. Older projects were also restructured based on community-driven success. After languishing in problem status for over two years, two regional area development projects (Nusa Tenggara and Sulawesi) were restructured in the late 1990s to put control in the hands of villagers. These projects are now back on track for successful outcomes. The Kecamatan Development Project (KDP) broke new ground with its ambitious coverage and open menu. The first KDP began in 1998 and will disburse $273 million (IBRD and IDA funds) by early 2002. Of the 67,500 villages in Indonesia, more than 12,000 of the poorest villages have participated in KDP so far, with a total beneficiary population of almost 10 million people. Building from VIP, the first kecamatan (subdistrict) project focused on broadening the range of stakeholders involved in decision making, including a renewed regulatory and advisory role for the decentralized district governments and, for the first time, an institutionalized role for civil society monitors. KDP also opened up project menus so that for the first time villagers were engaged in fully participatory and transparent budgeting. By the second year the project was disbursing $100 million. Seventy-five percent of the village grants were used to build economic infrastructure such as roads (62 percent), bridges (10 percent), irrigation (8 percent), and clean water (7 percent). The remaining 25 percent was used for economic activities. Economic infrastructure built through KDP methods costs as much as 30 percent less than that built using traditional approaches in the same places. Poverty benefits from the village investments have been large. Seventy-seven percent of KDP’s loan beneficiaries are believed to be among the poorer members of their communities, and 38 percent have been women. Nearly 5 million people received wages in KDP’s first year for their labor on project works, and because the project sets wages below the local agricultural minimum, nearly all of the wage amount is paid to the poor and vulnerable. Ex-post reviews show average rates of return of 30–40 percent to rural infrastructure built through KDP, virtually all of which is captured by villagers. A sample of the subdistricts that were included in the first year of the project found that 60 percent of the participants in project meetings were poor, and 40 percent were women. The second KDP (FY01 Board) continues this program, with an increasingly explicit governance-poverty linkage. At $325 million, the project accounts for 75 percent of the Bank’s FY01 lending program to Indonesia. The heart of the project is the activities that increase communities’ abilities to assess their development needs and involve local governments and other stakeholders in solving them. However, while the program presumes that representative institutions are fundamental for successful service delivery to the poor, there still needs to be a responsive technical support structure to ensure the quality of whatever it is that communities build with their resources. The new project places more emphasis than before on developing local technical capacities for design, management, and maintenance.

TOOLS AND PRACTICES 3
Empowerment in the Vietnam Country Program Following adoption of the doi moi (“renovation”) strategy in 1986 and the introduction of a series of economic reforms, Vietnam experienced GDP growth rates averaging 8 percent per year between 1990 and 1997. Absolute poverty declined from 58 percent in 1993 to around 37 percent in 1998, while the number of people below the “food poverty line” dropped from 25 percent to 15 percent. Trends in nonmonetary indicators of welfare confirmed that living standards were improving. Access to health, education, and infrastructure services expanded for the bulk of the population. The shift toward a market-oriented economy also brought some changes in the political structures of the country. According to the new constitution adopted in 1992, the Communist Party remains the leading organ of the state, but is bound to operate within the framework of the law and the constitution. The constitutional and legislative powers of the National Assembly, whose members are elected through universal suffrage and secret ballot, were also expanded. In recent years, the government has taken significant steps to improve communication and to encourage a two-way flow of information and views. In 1998 a Grassroots Democracy Decree was passed, which established the legal framework for the participation of citizens in local decision-making processes at the commune level and their right to “monitor” local government expenditures. Although the capacity of citizens to participate actively remains constrained, especially by their lack of awareness of their rights and entitlements, the decree is viewed as a step toward enhancing the transparency and accountability of local government officials.
Building Blocks for a Strengthened Empowerment Agenda The 1998 Country Assistance Strategy The World Bank’s early assistance to Vietnam focused on rehabilitation of infrastructure that was devastated during the consecutive wars, and restoration of the system of basic health and education. The program was designed to gain high rates of return from these investments and had an impact on poverty by easing constraints to broad-based growth. The most recent Country Assistance Strategy, in 1998, was designed to support government efforts to restore growth momentum, which had faltered in the late 1990s as a result of the regional economic crisis. This CAS emphasizes the need to concentrate on the quality of growth, with a more explicit focus on poverty, social issues, and rural development. The CAS also emphasizes the need to develop clearer links between individual projects and the policy dialogue and to give greater attention to improving the efficiency of public administration—particularly accountability of the public sector.
This note was prepared by Carrie Turk (EACVF).

Tools and Practices 3
101
The 1998 CAS had a number of elements intended to give poor people a stronger voice in project planning and in broader processes of government planning and budgeting. These included:
• Introduction of two community-driven development projects in some of the poorest parts of the country (the Community Based Rural Infrastructure Project and the Northern Mountains Poverty Reduction Project), which delegate both planning and resource management responsibilities to the commune level;
• Plans for implementing Participatory Poverty Assessments in poor regions to form an integral part of a collaborative poverty assessment;
• Initiatives to enhance transparency and accountability in the use of public funds through increased decentralization and participation. These included a Public Expenditure Review; a Participatory Provincial Partnership with UNDP and Oxfam GB to strengthen participatory planning in Tra Vinh Province; and work to strengthen local civil society.
With the exception of the planned support for the strengthening of local civil society (which, ultimately, the government decided not to take advantage of), these initiatives have provided a firm basis for future efforts to forge a stronger link between poor households and decision-making processes. The Community Based Rural Infrastructure Project was approved by the Board in June 2001 ($102.78 million), and the Northern Mountains Poverty Reduction Project was approved in October 2001 ($110 million). The PPAs have had widespread impact, and the Public Expenditure Review led to a comprehensive program of follow-up activities, several of which are related to improved financial accountability of local authorities to poor communities. The PPAs and “Vietnam: Attacking Poverty” Despite the important achievements of the 1990s in reduc ing poverty and raising living standards for nearly all groups in Vietnam, the PPAs highlighted the extent to which poorer households felt alienated from decision-making and policy-making processes.34 These studies emphasized the constraints that poor people face in accessing basic information on matters of importance to their lives. Findings suggested that some groups had less voice than others: women, ethnic minorities, and unregistered migrants were particularly unlikely to participate in decision-making processes. Drawing on these findings, the poverty assessment “Vietnam: Attacking Poverty” placed issues of local governance and grassroots democracy at the heart of the discussion on social equity. A number of new initiatives are now planned to respond to the issues raised, as described below. The process of implementing the PPAs and integrating the findings fully into the poverty assessment sought to involve government policy makers, at both the central and local levels, as much as possible. The establishment of a governance structure made up of many stakeholders—the Poverty Working Group—was key to generating buy- in and consensus on the findings.35 As a result, issues that were sensitive and rarely discussed in public policy debate, such as some of the findings on voicelessness and powerlessness, were brought to the fore with the agreement of government counterparts. It was felt that the way in which the PPAs had been implemented, as much as the information they generated, was important in raising the profile of some of these empowerment issues. The government used the PPAs as background information in the
34 Poverty Working Group 1999. 35 Turk 2001.
Tools and Practices 3
102
preparation of the interim PRSP and several of the areas flagged as strategically important are derived from the PPAs. These include improving the dissemination of information on legal rights to poor households; strengthening a two-way dialogue between local authorities and poor households; creating an enabling environment for poor households to take part in local economic development plans; and creating a legal framework to enable communities to maintain and manage resources provided through development projects.36
A Future Empowerment Agenda Initiatives Underway Experience in implementing the 1998 CAS and the findings of the PPAs led directly to several initiatives. First, findings of the Ha Tinh PPA—that methods of raising revenue at the commune level were burdensome, regressive, nontransparent, and poorly accounted for in some parts of the country—led to the inclusion of further work in the Public Expenditure Review. Conducted with the Ministry of Finance, this study concluded that households were subject to a complex range of fees and contributions that were confusing to households and commune officials alike. This in turn limited the potential for poor households to question the legitimacy or calculation of charges. In addition, the finding that few, if any, communes in the study area were making any serious attempts to implement the Grassroots Democracy Decree (which requires commune authorities to publish and publicly discuss commune plans, budgets, and expenditure) compounded the impression that ordinary citizens are remote from local financial decision making. The Ministry of Finance responded to this by drawing up new regulations governing revenue collection at this level. Second, in response to findings in the PPAs that there were pockets of very severe poverty in urban areas, a decision was made to refocus the urban component of the assistance strategy to develop a stronger emphasis on community-identified needs and poverty reduction objectives. This led to the preparation of a community-based urban upgrading program, beginning with participatory surveys of how poor and vulnerable groups prioritize solutions to their problems in access to housing and infrastructure. Third, plans have been established to assist the government in gathering feedback from households on their views about the quality, efficiency, and usefulness of public service delivery. In the longer term it is hoped that this feedback can be incorporated into household survey work to yield a more accurate national picture of access to and quality of public services, broken down by socioeconomic group. It is hoped that ultimately a link could be made between client assessments of public services and resource allocation. Fourth, the Ministry of Finance would like to address some of the transparency and accountability issues at the commune level as part of their follow-up to the Public Expenditure Report. They have requested assistance in investigating ways in which budget and expenditure information could be made more readily accessible and comprehensible to poor households. At the time of writing, this
36 Government of the Socialist Republic of Vietnam 2001.

Tools and Practices 3
103
was being pursued in collaboration with a local NGO which specializes in disseminating information on legal rights. Future Work Production of the next CAS has been delayed slightly to allow the government of Vietnam to complete its PRSP, which it calls the Comprehensive Poverty Reduction and Growth Strategy (CPRGS). Future assistance strategies, on the part of the World Bank and some other donors, will be closely aligned to the CPRGS. It follows that the future agenda of empowerment work depends to a large extent on the strategic direction set out by the government in its CPRGS. This highlights the need to develop stronger mechanisms for meaningful consultations with poor households and vulnerable individuals during preparation of the CPRGS. The absence of a vibrant local civil society that includes poor peoples’ organizations is a gap in this respect, and the development of robust processes for participation by poor households in the preparation of the CPRGS is a priority area of concern for the World Bank and many other donors. The government of Vietnam has adopted several strategies, in cooperation with the World Bank, for approaching this, and for developing mechanisms for stakeholders to monitoring progress against strategic targets. The World Bank has coordinated village- level consultations on the CPRGS to discuss whether villagers’ diagnosis of poverty is adequately addressed by the proposed strategies. The Poverty Task Force (formerly the Poverty Working Group) is assisting the government in developing a monitoring framework for the CPRGS by preparing a series of eight papers on core development goals and outcome targets. At the time of writing, discussions had already involved more than 100 policy makers and practitioners who have agreed on the importance of including goals to make government more transparent, accountable, predictable, and participatory. 37
Resources Government of the Socialist Republic of Vietnam. 2001. “Interim Poverty Reduction Strategy.”
Hanoi. Available: http://www.worldbank.org/poverty/strategies/index.htm Government of Vietnam-Donor-NGO Poverty Task Force. 2001. “Report of the Haiphong
Workshop. Localizing the International Development Goals: The Vietnam Development Targets.” Hanoi.
Poverty Working Group. 1999. “Vietnam: Attacking Poverty.” Vietnam Development Report
2000. Joint Report of the Government of Vietnam-Donor-NGO Poverty Working Group. World Bank, Washington, D.C.
Turk, Carrie. 2001. “Linking Participatory Poverty Assessments to Policy and Policymaking: Experience from
Vietnam.” Policy Research Working Paper 2526. World Bank, Development Research Group, Washington, D.C.
37 Government of Vietnam-Donor-NGO Poverty Task Force 2001.

TOOLS AND PRACTICES 4 Peru Portfolio Review through an Empowerment Lens After the publication of Voices of the Poor and World Development Report 2000/2001: Attacking Poverty, it became clear to the Country Management Unit (CMU) for Peru that empowerment of the poor is central to economic growth and poverty reduction strategies. The question that followed was how and with what results the Bank was incorporating empowerment in its assistance strategy and ongoing operations in Peru, and how that could be improved. Given that the country team was winding up implementation of the 1997 CAS, a first step was to look into the country portfolio.
A Glance at the Peru Portfolio As part of the annual Country Portfolio Performance Review (CPPR), the CMU undertook an exercise to assess how the eight Bank-financed projects underway in Peru were contributing to empowerment of the project beneficiaries. The specific objectives of the exercise were to:
• Analyze and ident ify to what extent empowerment was included within the project design and project activities, and with what mechanisms; and
• Identify ways to improve empowerment in the projects. Two consultants were engaged, under the oversight of the Country Officer and guidance of other Bank staff, 38 to undertake the following activities: (a) an overall desk review of Bank documents (PADs, PSRs, and supervision aide memoires); (b) preparation of an interview guide; (c) interviews of government project directors and project staff and Bank task managers; (d) presentation and discussion, during the CPPR, of the findings of the desk review and interviews; and (e) preparation of a report summarizing the main findings of the exercise.39 Principal findings of the exercise were as follows:
• Although the term “empowerment” has only recently come into wider use, the Bank has been striving for the last few years to include in its projects in Peru some elements of empowerment through the concepts of participation, equity, transparency, and sustainability. These elements were included in most project designs and formed part of the ongoing supervision and evaluation of the projects.
• Although these elements have been included in projects to varying degrees, the empowerment objective, understood as the creation of capabilities and sharing of power with project beneficiaries, was not included in all logical frameworks. Input, output, and outcome indicators to measure empowerment were also missing.
This note was prepared by Keta Ruiz (LCCPE). 38 The Regional Adviser for Poverty Reduction, the Regional Civil Society Coordinator, and the Civil Society Specialist for Peru contributed to the preparation of the terms of reference for the consultants and also contributed as advisers to the process. 39 This note draws heavily from the consultants’ report.

Tools and Practices 4
105
• Empowerment is relevant to, and could be applied differently in, each of the Bank-financed projects in Peru. There are a few projects (education, health, rural development, and indigenous peoples) where empowerment of project beneficiaries has been a central element of project design and implementation. In other cases (urban water rehabilitation and infrastructure, urban property rights) empowerment has been achieved indirectly through the project. For example, by earning property rights through the Urban Property Rights Project, poor Peruvians have gained access to an economic asset that allows them to enter the formal economy and creates new opportunities.
• There was the risk of “Babelization” of the concept of empowerment, given the novelty, complexity, and ambiguity of the term, the heterogeneity of the projects, and the professional diversity of project directors and staff.
• There was also the risk that the objective of the exercise would be trivialized if project directors, staff, and Bank teams adopted it just because it is a requirement of the Bank and not because they are convinced of its importance or relevance.
Building a Common Understanding Given the risks outlined above, it was decided that the next step after the CPPR exercise should be to build a better understanding of empowerment and its operationalization in project work. For this purpose, two workshops, each addressing four of the eight projects, were organized with the participation of Bank staff and government project directors. The specific objectives of the workshops were to:
• Provide an opportunity for analyzing empowerment and reaching a better common understanding of the concept within the project teams;
• Define mechanisms for the monitoring and evaluation of empowerment in the projects; and
• Provide an opportunity for the project teams to exchange experiences of the way empowerment was included in their projects.
During the workshops, project teams briefly explained their project objectives, how they understood empowerment, and how empowerment of beneficiaries was being achieved through their projects. They also discussed the key elements of empowerment and some intended and unintended effects of its operationalization, and applied the concept through working teams that reviewed project activities and monitoring indicators related to empowerment. The discussions yielded several common understandings about what empowerment entails in the context of Peru’s project work; these can also be applied more broadly in operational work. First, empowerment is a process that responds to endogenous and exogenous factors. It therefore cannot have a set target, but rather is a matter of level or degree. Second, empowerment implies a change in the power relationship among project directors, operational project staff (intermediary clients), and beneficiaries. Third, capacity building and a clear understanding of empowerment at the level of both project directors and intermediary clients, but especially of the beneficiaries, is indispensable for the effectiveness and sustainability of this change in power relationships.

Tools and Practices 4
106
Other key questions discussed during the workshops included: • Who to empower? Although the ultimate target is project beneficiaries, it became clear
that it is also important to empower intermediary clients, since it would be difficult for them to promote empowerment of project beneficiaries if they are not empowered themselves.
• How to carry out the process? A main element is to ensure consultation with and participation of the beneficiaries throughout the project cycle.
• Why empower? In addition to the understanding that empowerment of poor people is central to economic growth and poverty reduction, it is also important to consider that it is key to project sustainability.
Working with the Project Teams and Beneficiaries: The Peru Irrigation Rehabilitation Project As the workshops drew to a close, participants emphasized the need to carry out similar exercises with intermediary clients and also to observe in the field how “empowered” project beneficiaries may have actually become. It also was apparent that more detailed work was necessary to clarify the logical framework and indicators to be used in operationalizing empowerment. Work on this is being piloted in the Peru Irrigation Rehabilitation Project, a US$85 million project approved by the Board in 1996 to increase the productivity of more than 50,000 families cultivating approximately 65 percent of the existing irrigation schemes on the coast of Peru (200,000 hectares). The project has achieved only some of its original objectives because of slow implementation caused by initial delays, restructuring due to changes in priorities as a result of El Niño, and lack of counterpart funds. The establishment of decentralized decision making by associations of water users, however, is one of the specific objectives on which significant progress has been made. Of the 64 water users associations, 52 now have technical managers and 60 have followed awareness courses; the regulations to the water law have been changed to make water users less dependent on the Ministry of Agriculture. The project is also reducing the role of the state in the irrigation sector. Elections of representatives of water users associations have been held for all irrigation schemes, in hopes that this will enable the associations to be run more efficiently and less under the direct control of the Ministry of Agriculture. Cost recovery of investment, operation, and maintenance in irrigation systems is slow, but there has been progress. As of 2001, 20 water users associations (30 percent of the total number) recovered 75 percent of water charges (compared to 5 percent two years before), and only 25 associations were recovering less than 50 percent of the water charges. Through interviews and workshops with intermediary clients of the project, along with field visits to assess how “empowered” the project beneficiaries have become, it was possible to identify a number of additional steps that could increase the effectiveness and sustainability of the project through empowerment. These include:
• Reassigning budget items to activities that strengthen empowerment of the water users associations and water committees, especially capacity building, technical assistance, and required equipment;

Tools and Practices 4
107
• Strengthening the project board by including not only irrigation experts, Ministry of Agriculture authorities, and representatives of the private sector, but also representatives of the water users associations;
• Promoting experience-sharing among project beneficiaries by setting up a technical exchange system to allow sharing of best practices; and
• Linking project beneficiaries to technical assistance and hydraulic engineering services providers (universities, consulting firms) so that beneficiaries can hire them directly for the rehabilitation and maintenance of their irrigation infrastructure.
Finally, it is essential to take steps to simplify, unify, and select indicators in the project logical framework in order to measure progress achieved in the empowerment process. These should include indicators that will: (a) measure the management capacity of the water users associations, such as increase in revenues, percentage allocated to operations and maintenance, and percentage of beneficiaries who are satisfied with the management of the association; and (b) measure the organization and technical management of the farmers, such as percentage of farmers who participate in the decisions of the water users associations and percentage of farmers who are satisfied with the quality of the technical assistance they receive from the associations.

TOOLS AND PRACTICES 5
Social Accountability Mechanisms In Programmatic and Structural Adjustment Loans
There are two basic ways in which governments may be held accountable for public actions and outcomes:
• Horizontal accountability refers to checks and balances among the various agencies and institutions of government, and to institutional oversight.
• Vertical accountability refers to the accountability of government to citizens.40 Citizens have important roles to play in reinforcing both the horizontal and vertical accountability of their governments. Social accountability mechanisms include a range of tools that promote greater accounting to citizens. Social accountability mechanisms have become a feature of recent budget support, adjustment, and public and sectoral reform loans. Recent examples of loans with provisions for social accountability include the Guinea Decentralization Project, the Tanzania Public Sector Reform Project, the Guatemala Financial Management and Judicial Reform projects, the PSRL to Thailand, the PRSC approved for Uganda, the SECALs to the Russian coal sector, the PSALs to Latvia, and the PSRL to Peru. Examples from Uganda, Russia, Latvia, and Peru follow.
Uganda Poverty Reduction Support Credit The first Poverty Reduction Support Credit (PRSC) of US$150 million was approved in 2001 for Uganda. The PRSC is planned as a series of annual programmatic structural adjustment credits with clear performance benchmarks, outcome indicators, and policy measures. The reform program supported by the first PRSC aims to (a) improve public service delivery through efficient and equitable use of public resources; (b) improve governance by increasing transparency and participation, fighting corruption, and reforming public services, procurement, financial and human resource management, and monitoring and evaluation; and (c) increase access to and quality of basic services, including education, health care, water, and sanitation. 41 What Problems Will the PRSC Address? In Uganda, public service delivery currently focuses on inputs and implementation processes rather than on the end results of policies and programs. Major problems include insufficient clarity and consistency of sector outcome/output indicators, targets, and service standards, and lack of systematic feedback from public service users. Monitoring and evaluation activities and
This note was prepared by Laura Bureš (PRMPR), with inputs from Magüi Moreno Torres, under the overall guidance of Deepa Narayan (PREM). 40 See O’Donnell 2000; Fox 2000. 41 See World Bank 2001c, 2001d, 2001e, 2001f.

Tools and Practices 5
109
reporting requirements are uncoordinated and often place a considerable burden on weak local governments. Accounting for public expenditure is lax owing to disregard for timely and regular recording of transactions, sidestepping of controls, and lack of financial discipline. Access to information about public sector performance and practices is limited. Transparency and accountability in both government and NGO service delivery are also weak. Community participation and the use of participatory approaches and methods remain mostly ad hoc. Corruption is widespread, especially in the judiciary, the police, and the health services, which decreases poor people’s access to public services. Uganda’s Experience with Public Expenditure Tracking Surveys Uganda has had success in recent years with using information to improve government accountability and performance, most notably in the case of the Public Expenditure Tracking Surveys in the education and health sectors.42 These surveys provided useful checks on the supply side of service delivery. In education, for example, diagnostic surveys were conducted to compare budgets with actual spending on primary education after it was found that official outcome indicators showed scarcely any increase in enrollment despite substantial increases in budgetary allocations for education. The school survey showed that only 2 percent of public nonwage spending on education reached schools in 1991, and only 20 percent in 1995, as district authorities had siphoned off the bulk of nonwage funds intended for schools. These findings prompted the central government to begin publishing information on monetary transfers to districts via newspapers and radio broadcasts and to insist that this information be posted at school and district headquarters. A follow-up survey in 2000 showed that, as a result of reforms made in response to the earlier survey, schools were receiving over 90 percent of nonwage spending transferred from the central government. The PRSC will build on Uganda’s success with public expenditure tracking surveys and information disclosure to improve accountability. What Accountability Mechanisms Does the PRSC Introduce? Vertical accountability To improve vertical accountability, the PRSC will support Uganda in efforts to monitor public service delivery and expenditures and increase citizens’ access to information about their government. Over the three-year period, the government of Uganda and/or civil society and other stakeholders will:
• Monitor public service delivery and corruption on a regular basis through surveys; • Implement regular expenditure tracking surveys in basic services; • Establish a common monitoring and evaluation system linked to performance in basic
service sectors; • Improve citizens’ access to public information, including tabling an Access to
Government Information bill in Parliament; • Post public notices of conditional and other grants at service delivery points; • Publish budget performance reports;
42 See Reinikka 1999, 2001; Tikare and others 2001.

Tools and Practices 5
110
• Prepare and implement a communication strategy for the budget process and fiscal policy;
• Increase availability of public information on fiscal transfers at local levels; • Streamline reporting requirements for local governments; • Develop, publish, and implement government pay and procurement reform strategies; • Harmonize NGO policy and a code of conduct for using participatory approaches.
Surveys and monitoring. The country will institutionalize surveys similar to the Public Expenditure Tracking Surveys in other sectors and will streamline the numerous ongoing monitoring and evaluation activities. Key monitoring mechanisms for poverty and sector-level outcomes include three independent annual surveys (household, service delivery, and integrity surveys). Sector reviews in health and education have made significant progress toward agreement on a small but consistent set of monitoring indicators and means of verification. A sector program for water and sanitation was also recently established. Periodic Participatory Poverty Assessments, enterprise surveys, and annual expenditure tracking surveys in basic service sectors will be carried out. A poverty monitoring and evaluation strategy has been prepared as well. Monitoring is increasingly a joint effort between the Ugandan government, IDA, and other donors for the PEAP/PRSP. Monitoring the progress in reform program implementation and its impact will follow the PRSP review mechanism, taking into account information collected in citizen and civil society monitoring activities. The Ugandan government will make quarterly reports on progress in each program area. The reform program sets clear quantitative and qualitative benchmarks for three years, and the government and IDA will agree on PRSC II and PRSC III on an annual basis. Access to information. In March 2001, the Ministry of Information, in collaboration with the Ministry of Ethics and Integrity, reviewed the Official Secrets Act in light of best practice regarding access to government information. The cabinet is working to approve principles of access to government information, and it is hoped that the Ministry of Information will table an Access to Government Information bill in Parliament by April 2004. Also in March 2001, the Ministry of Finance, Planning, and Economic Development produced a citizens’ guide to the budget process. Horizontal accountability To improve horizontal accountability, the PRSC will support efforts to:
• Improve accounting and auditing systems at central and district levels of government; • Improve the flow of funds to frontline service delivery; • Coordinate financial management reform and update the legal- institutional framework; • Increase collaboration among judicial and law enforcement agencies.
These efforts are expected to improve financial management, accounting, and auditing processes and improve coordination and accountability between government agencies and institutions.

Tools and Practices 5
111
By March 2001, the Directorate of Accounts had made preparations for introducing consolidated quarterly reports on budget implementation for 2001 and 2002. The Ministry of Finance, Planning, and Economic Development and the Ministry of Local Government agreed to appoint additional accounting staff at the central and district levels. The government also appointed an internationally qualified accountant as auditor general.
Russian Coal Sector Adjustment Loans The World Bank has supported Russia’s coal restructuring program through two Coal Sector Adjustment Loans (Coal SECAL I, $500 million; and II, $800 million) between 1996 and 2000.43 What Problems Did the Coal SECALs Address? Transition from the Soviet period Years of poor management of the coal sector during the Soviet period, combined with a drop in demand in the early 1990s, significantly damaged the sector’s economic viability. The coal sector was second only to agriculture in the magnitude of the government subsidies it received. By 1993, subsidies reached unsustainable levels, exceeding 1 percent of Russia’s GDP. There was little relationship between the amount of subsidy and the output of the mines. In addition, the coal sector suffered from enormous inefficiencies and ever-worsening safety conditions, while the system of wage payments had collapsed. Wages went unpaid for an average of 8–16 months, and when workers were paid, they were often paid in kind—in shoes, glass, or sugar. The capacity of municipal governments was very limited, and systems for resource transfers related to the coal sector were not in place. Government instability, secrecy, and loss of public trust There was a high level of instability as a result of turnover in top government positions, which hindered reforms. Between 1996 and 2000, Russia had five prime ministers, seven deputy prime ministers who were also the formal convenors of the Inter-Agency Coal Commission, six ministers of energy, and four leaders of the coal agency. In addition, there were major constraints on information flows within government. Top officials had very little access to information, which tended to be hoarded by lower ranking officials who had a stake in the status quo. Trust in government generally and in the coal sector particularly was extremely low. According to a survey of mining households in 1995, one-fifth of the households did not trust any organization to distribute money or assistance. Only 5 percent trusted RosUgol, less than 3 percent trusted regional coal companies, 3 percent trusted the regional government, and 8 percent trusted trade unions.
43 This section draws from Ghani 2001a, 2001b. See also World Bank 1996b, 1997a, 1997b, 2000d.

Tools and Practices 5
112
What Were the Outcomes of the Coal Sector Reforms? Outcomes on the ground
• Subsidies to the coal sector decreased from $2.76 billion in 1994 to $0.28 billion in 2000. These subsidies have been reoriented from soft budget support of an unproductive sector to the delivery of social protection and community development. (Of the coal subsidy for the year 2000, 31 percent was directed to social protection.)
• Over the same six-year period, productivity of mines increased from 764 tons per worker per year to 1,355 tons per worker per year—a 77 percent improvement in productivity. The imposition of hard budget constraint in the coal sector created incentives for managers to focus on productivity.
• Delivery of social protection improved. All workers laid off from closed or continuing mines have received their benefits directly, in full, and on time, as verified through multiple sources in government and through social impact monitoring. All disabled workers from closed mines have received their benefits in full and on time. The delivery of benefits has allowed citizens to participate in economic activity to a greater extent.
• Coal worker salaries and conditions improved. In Siberia, salaries are now paid 100 percent in cash and reach 30,000 rubles per month.
Organizational outcomes
• New roles for existing organizations. The Treasury’s role was expanded to make it the central agency in the new system for accountability, delivery of benefits, and management of subsidies. For the delivery of benefits to disabled miners, a credible mechanism was created: the Social Insurance Fund (SIF) agreed to deliver benefits initially out of funds from the Ministry of Energy and, in the longer term, from fees collected from the coal mines. In the SIF, a culture of delivery and a pattern of predictability was established, as benefits were delivered in full and on time.
• Mechanisms established for intra-governmental participation. The Inter-Agency Coal Commission provides a forum for discussion and resolution of issues by bringing all government stakeholders together. An interministerial group for tranche releases ensures that the necessary actions have been taken by different stakeholders in order to achieve outcomes on time.
Institutional outcomes
• Across government agencies, rules were created establishing clear links between allocations and outcomes. Budgets now clearly state the categories of subsidy, the recipients of subsidies, and the mechanisms of delivery and accountability.
• Checks and balances between government ministries are now in place for enforcement of rules. Mechanisms are also in place to secure the participation of government agencies in reform and decision-making processes.
• Because new government rules and resolutions have been translated into corresponding action, and because they have been geared toward long-term solutions for the coal sector, they may have long-term positive effects on the credibility of the state by satisfying citizens’ expectations.
Tools and Practices 5
113
• The new accountability mechanisms introduced in government for coal sector reform have also set precedents for reform in other sectors of the Russian economy.
• Local municipalities, which had initially opposed accountability mechanisms pertaining to local development funds, found the new accountability mechanisms helpful because they protected local officials from intense pressure from other stakeholders.
What Accountability Mechanisms Did the Coal SECALs Introduce? Reform of the coal sector included several important accountability mechanisms such as process mapping and stakeholder mapping, greater information sharing and transparency, mechanisms providing for consultation with and participation of stakeholders, checks and balances between ministries for budget allocation and enforcement of rules, and financial auditing and accountability processes. Process mapping was used to build accountability for outcomes by tracing flows in three key areas:
• Flows of money relating to the delivery of social protection; • Flows of policies and decision making relating to the closure of mines; • Flows of information among government ministries and officials, and to the public.
Mapping the flows of money allocated for social protection from the very top all the way to intended recipients showed that one flow passed through the federal, regional, and local governments to communities, while another flow went from the federal government to the national coal company to regional coal companies, then to the mines, and finally to miners. At each point in the flow, correspondence between the formal rules and actual practices was checked, and major breakdowns were revealed. Coal companies and mine managers had enormous discretion and soft budgets with scant accountability to recipients for delivery of funds. There was little predictability in flows of money for social protection. Mapping the flows of policies revealed the gaps between policy intention and reality. For example, though policy dictated that 300 billion rubles were to be spent on social protection in 1996, less than 35 percent of miners received their funds; though only eight mines were to close, 60 mines closed without legal due process. The mapping between stated policy and policy outcomes also showed uncertainty among miners about when mines would close and what their entitlements were, and there were no procedures in place to inform miners of their rights. Mapping the flows of information showed that low-level government officials often kept information from high-ranking officials and ministries typically failed to share information with each other. For example, the Ministry of Finance classified most information as “national secrets.” In response, the Bank established neutral mechanisms for gathering and analyzing information from multiple sources, cross-tabulated the information to find areas of agreement and disagreement, and ensured timely delivery of information at monthly and quarterly intervals.

Tools and Practices 5
114
Stakeholder mapping was also important because stakeholders provided critical information on processes and were able to recommend catalytic mechanisms for institutional interventions.44 Stakeholder mapping at the local level showed that accountability and transparency were problematic given the absence of budgeting and accounting procedures. In response, mechanisms were established to ensure that all payments were directed through the Treasury to constrain the discretion of local governments. The reform included provisions for government to provide miners, their families, and their communities with adequate and timely information about the reform program, its implementation, their entitlements, and mechanisms for legal recourse during restructuring. Horizontal accountability was strengthened as budget allocations were checked by several ministries as well as the Bank, and rules for internal processes, oversight mechanisms, and financial auditing were put in place. Floating loan tranches provided flexibility to reassess and respond to unanticipated issues and focused the attention of key government officials on the coal sector several times a year. Participatory processes were created to improve accountability at the regional, local, and community levels:
• Social partnership mechanisms that included various groups of residents in coal regions were developed by strengthening the regional Inter-Agency Coal Commissions set up in 1994–95 and establishing commissions in coal regions that did not yet have them.
• At the local level, an association of mayors of mining cities was created and funded to bring mayors together to discuss impacts of reform and ways of enhancing local capacity.
• Oversight committees, including the local heads of administrations and representatives of various affected groups, were formed to plan, coordinate, and implement a local strategy for development, determine social protection for laid-off workers and residents of mining communities, and create guidelines for disbursement of funds for local programs.
• Workers, communities, and unions were also brought into the process as stakeholders. Two labor unions were awarded contracts of $400,000 each to promote workers’ awareness of their rights and to engage in monitoring programs.
• Social impact monitoring was also conducted at the local level to monitor and assess the delivery of benefits and the impact of coal sector reforms on miners, their families, and mining communities. Federal government and Bank officials traveled to the field repeatedly to meet directly with workers.
Latvia Programmatic Structural Adjustment Loans In the late 1990s, Latvia faced the difficult last stages of transition in which government efficiency and effectiveness were the main impediments to achieving a full- fledged market economy and sustained economic growth. Latvia continued to have difficulty in privatizing the remaining large state enterprises, and the country’s system of public administration continued to permit widespread corruption. The World Bank provided a Programmatic Structural Adjustment
44 An institutional intervention is one that changes the rules of the game to alter relationships among stakeholders, remove stakeholders, or introduce new stakeholders. A catalytic mechanism is one that requires an initial push to jump-start reform but then continues to function without further intervention.

Tools and Practices 5
115
Loan (PSAL I, $40.41 million) to Latvia in 2000 to support the country’s ongoing reform process.45 PSAL I was intended to assist in the country’s efforts to improve the credibility, efficiency, and effectiveness of the public sector in public service delivery; to support private sector–led growth; to fortify the economy against external shocks; and to prepare Latvia for EU accession by improving public sector management and reducing corruption. Over the three-year period, three programmatic structural adjustment loans were planned to support these reforms. What Problems Did PSAL I Address? Corruption Recent Bank research has classified Latvia as a country with medium levels of administrative corruption and high levels of state capture. Inefficiency and corruption in the delivery of public services have undermined public welfare and disproportionately hurt the country’s most vulnerable people who cannot afford private sector alternatives. Excessive and corrupt regulation of the business community stifled private sector development, while evasion of regulations through bribery resulted in erosion of safety in the workplace, environmental degradation, and other negative effects. Government agency proliferation and lack of accountability During the 1990s, the government allowed the creation en masse of quasi-autonomous agencies with inadequate provisions for accountability and transparency with respect to resources used and services provided. This resulted in much informality, waste, and abuse, and was a significant source of corruption in the system and loss of control over budgetary resources. The government lacked a strategic planning framework that would allow overall policy commitments, the policy priorities of individual ministries, and targets to be linked with budget allocations. The public sector pay system was not transparent and did not ensure equal pay for equal work. Local governments lacked adequate accountability mechanisms as well. What Accountability Mechanisms Did PSAL I Introduce? The focus of PSAL I was on strengthening the credibility of public sector institutions; increasing the capacity of the state to manage resources—human and financial—efficiently and deliver services effectively; and rationalizing the boundary and relationship between the public and private sectors. PSAL I included mechanisms to improve both vertical and horizontal accountability of the Latvian government. Vertical accountability Information disclosure and public access to information. The government passed the Law on Information Access in 1998, providing for openness and disclosure of government information, and adopted related implementation regulation in 1999. However, many government officials remain unaware of the implications of the law and regulations, and ministries do not yet have sufficient capacity to respond to information requests by the public.46 To address this situation,
45 See World Bank 1996a, 1999, 2000a, 2000b, 2000c. 46 On information access in Latvia, see Lubbers and others 2001; Ericsson 1999.

Tools and Practices 5
116
the Cabinet of Ministers adopted regulations that stipulate more clearly the classification of information and the institutional arrangements for ensuring access to information. The government has also set up a unit within the Ministry of Justice that will:
• Establish an action plan to: (a) build capacity in public sector bodies to respond to public requests for information; (b) report on compliance with the law; and (c) educate the public on procedures for obtaining government documents.
• Develop a system for monitoring implementation of the law, including: (a) a mechanism for measuring fulfillment of public requests for information; and (b) publication of these measures in public sector annual reports.
• Ensure that the annual reports of public sector bodies include information on: (a) rights of the public to information; (b) procedures for the public to access information; and (c) measures for fulfillment of public requests for information.
The inclusion of this information in the annual reports of public sector bodies has been institutionalized. The Cabinet of Ministers adopted an instruction on public sector annual reports that requires all public institutions, including regulatory bodies and inspectorates, to prepare an annual report on their activities, beginning in the year 2000. For this purpose, the government developed clear and simple guidelines for the content of annual reports, requiring them to have a greater performance focus. Ten regulatory bodies have implemented reporting requirements that include a regulatory impact assessment, and have designed and initiated a system for monitoring compliance with the requirements. Anti-corruption efforts. In 1997, the government formed a Corruption Prevention Council, an interministerial body responsible for the development and implementation of an anti-corruption program. Under PSAL I, the government appointed an executive head of the secretariat to the Corruption Prevention Council and provided an adequate number of qualified staff and resources. To improve the council’s transparency and accountability to the public, a regulation was put in place to require that the council publish the status of all measures identified in the anti-corruption program. The council has established and published mechanisms to monitor corruption and anti-corruption efforts and piloted them, though it has experienced some difficulty in effectively establishing its monitoring capacity. In addition, the council implemented procedures for the public to report on cases of corruption. Other government anti-corruption efforts included a Law on Political Parties, submitted by the Cabinet of Ministers to the Saeima, with provisions for transparency, oversight, and audit. Civil society has also increased its involvement in the anti-corruption effort, particularly in related monitoring activities. Delna, the local affiliate of Transparency International, has prepared a report on progress made as a result of the government’s anti-corruption program and is also monitoring the privatization process of the remaining large enterprises. This information is being released publicly and will contribute to monitoring the progress of the PSAL program and preparing future reforms. Transparency in judiciary reform. In addition to other judiciary reforms, the minister of justice has drafted instructions to require that all court decisions and rulings be made public, and to

Tools and Practices 5
117
provide greater transparency in communications between judges and litigants in criminal and civil cases. Horizontal accountability Government agency accountability. To address the problem of ad hoc proliferation of public agencies without a clearly defined institutional framework of public administration or a legislative framework for agency operations and financial management, the Cabinet of Ministers adopted a moratorium on the creation of public sector agencies. A Law on Public Sector Agencies was enacted in March 2001 to limit the proliferation of new agencies and increase transparency and accountability of existing public sector agencies. In addition, an Administrative Procedures Law has been drafted and is under consideration (as of October 2001) and is designed to provide a uniform framework of general principles and guidelines by which agency decisionmaking must be conducted. Public expenditure management and monitoring. The Saeima adopted a Public Sector Agency Law in March 2001, which will improve transparency and accountability for budget resources by defining the financial and accounting framework for public sector agencies. A related law was passed to bring all accounts of budget-financed institutions into the budget and to ensure that all of them have their accounts only with the Treasury. Other measures to improve accountability in budgeting and resource management are also in place, such as a Public Accounts Committee of the Saeima to review State Audit Office reports. Latvia has also initiated an external audit of its budget carried out by a special government commission. Because accountability is weak at both the central and local government levels, the central government has proposed integrated financial accounting and reporting procedures for local governments to improve access to information about local government budget execution and resource management. Transparency and accountability in civil service pay. The Cabinet of Ministers has adopted a public sector pay concept that supports the introduction of a broad-banded, transparent, uniform pay scale with performance evaluation mechanisms, though difficulties remain in implementation, phasing, and change management. In addition, the Law on State Civil Service was passed by the Saeima in September 2000 to promote the development of a professional and politically neutral civil service, and includes provisions for performance evaluation. Conflict of interest. The government asked the anti-corruption unit in the State Revenue Service to develop guidelines to identify conflict of interest and cases of illicit enrichment among public officials. Development of these guidelines is still underway. They will include forms for declarations of income and assets and a manual on processing and assessing declarations, as well as manuals and training curricula for public sector employees on conflicts of interest. Declarations of income and assets have been submitted by key government officials and parliamentary secretaries and published. The anti-corruption unit also designed and implemented a system for public officials to report potential cases of conflict of interest.
Tools and Practices 5
118
Peru Programmatic Social Reform Loan A Programmatic Social Reform Loan (PSRL) is designed to support the medium-term social reform program of the government of Peru. 47 Signed in June 2001, the Peru PSRL I focused on building the foundation for transparent and participatory resource allocation mechanisms, rationalization of expenditures, decentralized implementation, and systematic performance-tracking of social programs. The first loan ($100 million) was fully disbursed July 2001 with funds going toward protection of critical social expenditures especially beneficial to the poor during a difficult period of fiscal adjustment and political transition. It laid the groundwork for medium-term reforms, including those that increase capacity for targeting and monitoring poverty alleviation programs and those that improve public access to information on social expenditures. The second PSRL loan to Peru, under consideration by the Board in June 2002,will help consolidate the institution-building begun under the first, focusing on depoliticization of resource allocation and utilization, further elimination of program duplication, improvement of the safety net for social risks, and strengthening of social control by civil society. What Problems Does the PSRL Address? Peru does not have a strong tradition of evaluation or transparency in the planning and monitoring of poverty alleviation programs. Few programs in Peru have conducted rigorous impact evaluations, and the population is rarely involved in monitoring the use and impact of public resources.48 In addition to this weak tradition, corruption is also a problem. The collapse of the Fujimori government and the allegations of different levels of corruption—from the use of public funds for campaign financing to scandals involving prominent members of public institutions—have resulted in widespread demand in Peruvian society for greater transparency. As a consequence, anti-corruption efforts have become a priority for both the transition and elected governments. National Poverty Dialogues and Mesas de Concertación In preparation for the transition in government and in response to a 1997 Poverty Assessment, the World Bank has been promoting a space for dialogue, exchange, and partnership in Peru for four years. Following the 1997 Poverty Assessment, which suggested that duplication and lack of synergies among development actors meant that further gains in poverty reduction were unlikely, the Bank suggested the establishment of an inclusive forum for plural debate and action. In 1998, with the agreement of other donors and eventually the government, the National Poverty Dialogue was established. The objective was to share experiences and information and promote better use of poverty reduction resources.
47 Katherine A. Bain (LCRVP) contributed to this section. See World Bank 2001a, 2001b. 48 The few exceptions in evaluation are the Social Investment and Compensation Fund (FONCODES) annual beneficiary assessments as well as the ex-post impact evaluations by FONCODES, Caminos Rurales, and the National Project for the Management of Water Sheds Basin and Soil Conservation.

Tools and Practices 5
119
After three sets of decentralized, thematic poverty dialogues between 1998 and 2001, the National Poverty Dialogue became an institutionalized, plural forum. During the transition, the government—recognizing the need to institutionalize public debate and create country ownership of development strategies—issued a presidential decree, giving the forum longevity and promoting the decentralization of efforts through plural coordinating bodies called mesas de concertación. These are roundtables for dialogue and collaboration that include participants from local communities, civil society, local and national government, and the donor community. What Accountability Mechanisms Does the PSRL Introduce? Overall, the PSRL has helped to institutionalize transparent and participatory processes of resource allocation and performance-based tracking for social expenditures, enhancing the ability of poor Peruvians to exert influence and voice in the use of fiscal resources. The PSRL has also strengthened anti-corruption efforts and promoted the empowerment of civil society and the private sector while streamlining the public sector’s role. Reforms under the PSRL include mechanisms to improve both vertical and horizontal accountability. Vertical accountability Monitoring of social agencies and programs. The PSRL has assisted the government’s medium-term reform program by strengthening the capacity of social agencies and programs to plan and budget based on expected results, to monitor implementation, and to determine the impact that programs have had on critical dimensions of poverty. In the long run, this programmatic loan seeks to institutionalize a culture of evaluation, in which poverty alleviation programs are regularly reviewed to assess their impact on the living conditions of poor households. As part of this effort, the Ministry of Economy and Finance (MEF) is working with the heads of national poverty alleviation programs to ensure that they conduct systematic ex-post impact evaluations on a regular basis. With support from the first PSRL, the Ministry reached agreement with the leaders of major social programs, including the Social Investment and Compensation Fund, the National Complimentary Food Program, Caminos Rurales, the National Project for the Management of Watersheds Basin and Soil Conservation, and the rural electrification program, on developing a monitoring strategy and evaluation guidelines for those programs that have not conducted a systematic ex-post impact evaluation in the last two years. The National Ombudsman’s Office (Defensoría del Pueblo) is charged with investigating and taking recourse in the event of abuse in social programs. Participatory processes and public oversight. An integral part of reform under the PSRL is the participation of citizens and civil society in the review and monitoring processes related to social programs. The PSRL supports efforts to build the capacity of the mesas de concertación. These forums are working to institutionalize the participation of civil society in the design, decision making, and control of social programs at the departmental level. By 2001, 75 percent of regional department development plans were agreed to by the mesas de concertación. In January 2001, the Paniagua Administration established a Round-Table for Attacking Poverty (Mesa de Concertación para la Lucha Contra la Pobreza) whose mandate is to ensure that social policies and actions are transparent, efficient, and have effective impact on poverty. This Round-Table is

Tools and Practices 5
120
working to institutionalize the participation of civil society in the design, decision-making, and control of poverty-related programs. To further advance citizen scrutiny and oversight of public services, a “score card” system allowing for public evaluation of government services was piloted in a number of cities in 2001. In addition, 75 percent of public programs have implemented service quality evaluations that include public input.At the request of the Peruvian government, the World Bank launched a conference in July 2001 on empowerment and public accountability mechanisms to draw together international best practice and provide concrete suggestions for reform to the Peruvian team. Anti-corruption efforts and transparency. One of the key initiatives of Peru’s transition government is an anti-corruption program. The first PSRL supported an assessment of the types and areas of corruption and disseminated these results to the public and public officials. To complement its anti-corruption efforts, an Institutional and Governance Review was conducted in 2001 consisting of an in-depth analysis of the incentive structures that have affected Peru’s current institutional and governance system. To further the goal of transparency, the National Ombudsman’s Office undertook a well-publicized information campaign and established a complaint mechanism, including a hotline, to discourage the political use of social programs during the 2001 elections. Numerous bodies, including the ombudsman’s office, the executive, and the Ministry of Women, adopted resolutions intended to guarantee the political neutrality of their staff and the programs they administer during the pre-electoral transition. Public access to information and public oversight. Increased public access to information about the government’s use of resources and the major poverty alleviation programs is also a priority of reforms under the PSRL. The Ministry of Finance launched the Economic Transparency Website (Transparencia Economica) in February 2001 to give the general public access to information on government transfers to social and other development programs. In addition, district-by-district expenditures and other transfers made by a number of social programs in 2000 are published on the Internet. For example, the National Complementary Food Program (PRONAA) has published the transfers made to each of more than 15,000 soup kitchens around the country. The government has also launched information campaigns to ensure that the public are informed about their rights as citizens. For example, a national campaign explaining the public right to information was launched in 2001 by the Public Ombudsman’s Office. Horizontal accountability To improve public expenditure management and accountability, the government instituted Multi-Annual Sector Strategic Plans and a System of Integrated Financial Management (SIAF). The Multi-Annual Sector Strategic Plans introduces performance-based budgets, while SIAF tracks public income and expenditures and provides reliable information on a regular basis. The financial administration system was created in 1999 and has consolidated income and expenditure information from the approximately 559 executing units of various ministries at the

Tools and Practices 5
121
provincial level. Formerly the executing units had sent this information to the National Directorate for Public Budgets, the General Directorate for Public Treasury, and the National Public Accountant. Now, with SIAF, the executing units receive their monthly transfers from the National Directorate for Public Budgets and in turn register their operational income and expenditures, which are then transmitted to the Ministry of Economy and Finance for verification and approval. These systems have helped to improve overall financial management, transparency, and accountability. In January 2001 SIAF was extended to the ministries of the Interior and Defense, so that these ministries’ use of funds, formerly well-guarded information, will be tracked by the Ministry of Economy and Finance. This will further improve horizontal accountability and transparency of social expenditures within government. The general public also has access to the system’s information on budget transfers to social programs through the Economic Transparency Website mentioned above. At the time of publication, the SIAF is not as accessible as it might be, due to the way information is presented, the lack of computer infrastructure below the provincial level, and the time it takes to log onto the central system. The second PSRL will support improvements in SIAF and its extension to a sample number of municipal governments as well as development by the Ministry of Economy and Finance of an integrated plan to track all transfers from the central government to local governments.
Resources Ericsson, Fredrik. 1999. “Access to Information in Latvia: Practice, Provisions, and Proposals.”
Prepared for the World Bank, Washington, D.C. Fox, Jonathan. 2000. “Civil Society and Political Accountability: Propositions for Discussion.”
Paper prepared for the workshop on Institutions, Accountability, and Democratic Governance in Latin America, University of Notre Dame, Kellogg Institute, May 8–9. Available: http://www.nd.edu/~kellogg/
Ghani, Ashraf. 2001a. “Russia Coal Sector Reform.” Presentation given at the workshop on
Voices and Choices at the Macro Level: Participation in Country Owned Poverty Reduction Strategies, World Bank, Washington, D.C., April 3–5. Available: http://www.worldbank.org/participation/ghanippt_files/frame.htm
———. 2001b. “Russia Coal SECAL.” Paper prepared for the workshop on Voices and Choices
at the Macro Level: Participation in Country Owned Poverty Reduction Strategies, World Bank, Washington, D.C., April 3–5. Available: http://www.worldbank.org/participation/ghanidoc.htm
Lubbers, Jeffrey, Vedat Milor, and Malcolm Russell-Einhorn. 2001. “Preliminary Report on the
Public Sector Reform Initiative in Latvia.” Prepared for the World Bank, Washington, D.C.

Tools and Practices 5
122
O’Donnell, Guillermo. 2000. “Further Thoughts on Horizontal Accountability.” Paper prepared for the workshop on Political Institutions, Accountability, and Democratic Governance in Latin America, University of Notre Dame, Kellogg Institute, May 8–9. Available: http://www.nd.edu/~kellogg/
Reinikka, Ritva. 1999. “Using Surveys for Public Sector Reform.” PREM Note 23. World Bank,
Poverty Reduction and Economic Management Network, Washington, D.C. ———. 2001. “Recovery in Service Delivery: Evidence from Schools and Health Centers.” In
Ritva Reinikka and Paul Collier, eds., Uganda’s Recovery: The Role of Farms, Firms, and Government. Washington, D.C.: World Bank.
Tikare, Seema, Deborah Youssef, Rita Hilton, Paula Donnelly-Roark, and Parmesh Shah. 2001.
“Organizing Participatory Processes in the PRSP.” In World Bank, Poverty Reduction Strategy Sourcebook. Washington, D.C.: World Bank, Poverty Reduction and Economic Management Network. Available: http://www.worldbank.org/poverty/strategies/index.htm
World Bank. 1996a. “President ’s Report: Republic of Latvia Structural Adjustment Loan.”
Report P-7019 LV. Washington, D.C. ———. 1996b. “President’s Report: Russian Federation Coal Sector Adjustment Loan.” Report
P-6919-RU. Washington, D.C. ———. 1997a. “President’s Report: Russian Federation Second Coal Sector Adjustment Loan.”
Report P-7202-RU. Washington, D.C. ———. 1997b. “Russia Coal Sector Adjustment Loan II.” Project Implementation Document
5822. Europe and Central Asia Region, Energy Sector, Washington, D.C. ———. 1999. “Latvia Programmatic Structural Adjustment Loan.” Project Implementation
Document 8581. Europe and Central Asia Region, Public Sector Management, Privatization Sector, Washington, D.C.
———. 2000a. “Draft President’s Report: Republic of Latvia Programmatic Structural
Adjustment Loan.” Washington, D.C. ———. 2000b. “President’s Report: Republic of Latvia Programmatic Structural Adjustment
Loan.” Report P-7352 LV. Washington, D.C. ———. 2000c. “Reforming Public Institutions and Strengthening Governance: A World Bank
Strategy.” Public Sector Group, Poverty Reduction and Economic Management Network, Washington, D.C.
———. 2000d. “World Bank Supports Russia’s Coal and Forestry Sectors.” News release
2000/059/ECA, September 13.

Tools and Practices 5
123
———. 2001a. “Peru Programmatic Social Reform Loan (PSRL).” Project Implementation Document 10052. Latin America and Caribbean Region, uman Development Network, Washington, D.C.
———. 2001b. “President’s Report: Republic of Peru Programmatic Social Reform Loan.”
Report P-7447-PE. Latin America and Caribbean Region, Bolivia, Ecuador and Peru Country Management Unit, Human Development Network, Washington, D.C.
———. 2001c. “President’s Report: Uganda Poverty Reduction Support Credit.” Report P7442-
UG. Washington, D.C. ———. 2001d. “Uganda’s Poverty Reduction Support Credit.” Bank’s World Today, June 4.
Available: http://ispace.worldbank.org/todayarchive/html/060401b.htm ———. 2001e. “Uganda Poverty Reduction Support Credit.” Project Implementation Document
9653. Africa Region, Washington, D.C. ———. 2001f. “World Bank Approves First Poverty Reduction Support Credit.” News release
2001/351/AFR, June 1. Washington, D.C.

TOOLS AND PRACTICES 6
Participatory Budgeting Participatory budgeting is a process in which a wide range of stakeholders debate, analyze, prioritize, and monitor decisions about public expenditures and investments. Stakeholders can include the general public, poor and vulnerable groups including women, organized civil society, the private sector, representative assemblies or parliaments, and donors. Participatory budgeting can occur in three different stages of public expenditure management:49
• Budget formulation and analysis. Citizens participate in allocating budgets according to priorities they have identified in participatory poverty diagnostics; formulate alternate budgets; or assess proposed allocations in relation to a government’s policy commitments and stated concerns and objectives.
• Expenditure monitoring and tracking. Citizens track whether public spending is consistent with allocations made in the budget and track the flow of funds to the agencies responsible for the delivery of goods and services.
• Monitoring of public service delivery. Citizens monitor the quality of goods and services provided by government in relation to expenditures made for these goods and services, a process similar to citizen report cards or scorecards.50
Increased participation in budgeting can lead to the formulation of and investment in pro-poor policies, greater societal consensus, and support for difficult policy reforms. Experiences with participatory budgeting have shown positive links between participation, sound macroeconomic policies, and more effective government. Participatory budgeting processes have been utilized in a number of different countries, including Ireland, Canada, India, Uganda, Brazil, and South Africa. Three examples of participatory budgeting—in Ireland, Porto Alegre, Brazil, and South Africa—are outlined below.
Ireland’s Social Partnership Agreements Since 1987, Ireland has developed five “social partnership” agreements in which the government and a range of civil society organizations engage in extensive consultations on economic and social objectives.51 The idea of social partnership developed in the mid-1980s in response to Ireland’s recession (1980–87), high inflation, heavy public borrowing and deficit, and loss of manufacturing base. In 1986 the National Economic and Social Council (NESC) began facilitating consultations among a number of “social partners” in a process of shared learning to achieve an inclusive overview of socioeconomic options, challenges, and trade-offs.
This note was prepared by Laura Bureš, with inputs from Magüi Moreno Torres, under the overall supervision of Deepa Narayan (PREM). 49 This section draws on Tikare and others 2001. Also see the Participation Thematic Group website at http://www.worldbank.org/participation/. 50 See Tools and Practices 16 for more information on citizen report cards. 51 This section draws on World Bank 2001a and Government of Ireland 2000.

Tools and Practices 6
125
The first agreement (1987–90) had a narrow macroeconomic focus and was primarily geared toward negotiating wage levels in the public and private sectors with the central goal of maintaining public finance discipline and promoting competitiveness. The process encouraged consensus building and centered around the need for the country as a whole, in the aftermath of the recession and in order to meet EMU entry conditions, to avoid creating excessive inflationary pressure through exaggerated fiscal claims on the exchequer. Trade unions were key participants in negotiating pay levels, taxes, and social welfare benefits. In 1990 NESC identified three critical elements for a consistent policy framework within a national strategy: (a) macroeconomic policy securing low inflation and steady growth; (b) evolution of incomes that promotes competitiveness and manages conflict over distribution; and (c) structural change to adapt to a changing external environment. The NESC argued, however, that the economic strategies being employed to meet EMU conditions would succeed only with the active consent and participation of those affected by the policies. The National Economic and Social Forum (NESF), established in 1993, was brought on board to address social policy issues such as inclusion and unemployment. While the first three agreements focused more narrowly on economic matters, the fourth (1997–2000) and fifth (2000–02) were broader in scope. The latest social partnership agreement, “Program for Prosperity and Fairness,” was launched in February 2000 and outlines a comprehensive set of economic and social objectives finalized through consultations between the government and civil society organizations from November 1999 to February 2000. Results of the Social Partnership Agreements Social partnership has been identified as a driving force behind Ireland’s economic success over the last decade.52 This success includes a number of achievements:
• In 1999, Ireland posted a budget surplus of over 1.1 billion Irish pounds, compared with its 1.4 billion pound deficit in 1986. As a result, expenditures on health have been increased by 150 percent, on education by 84 percent, and on welfare by 70 percent since 1987.
• The exchequer surplus reached 747 million Irish pounds in 1998, compared to a 2.1 billion pound exchequer borrowing requirement ten years earlier.
• The national debt-to-GDP ratio dropped to 52 percent in 1998 from 120 percent in 1986. • Average annual inflation, which had been as high as 20 percent in the early 1980s, was
2.8 percent since 1987. • Average annual GDP growth was 4.9 percent over the period and reached 9.5 percent in
1998. • The stock of U.S. manufacturing FDI in Ireland doubled between 1994 and 1998 ($3.8
billion to $8.1 billion), and a third of American investment in Europe is now in Ireland. • The unemployment rate dropped from 17.5 percent to less than 5 percent in 12 years. • Inflation-adjusted pay rates rose by about 30 percent during the 1990s—two and a half
times the increase for the EU and four times that of the United States.
52 See World Bank 2001a. This study cites opinions and findings from, among others, McCarthy 1999; O’Donnell 1999; and The Economist 2000.

Tools and Practices 6
126
While it is difficult to prove direct causality between the partnership agreements and Ireland’s success since the late 1980s, the stability offered by these multi-annual policy and wage commitments has been instrumental in positioning Ireland as one of Europe’s fastest growing economies—the so-called Celtic or Emerald Tiger. The partnership agreements have been credited for facilitating the country’s participation in the EMS and EMU through prudent public finance management, maintenance of low inflation, low interest rates, credible exchange rates, and improved competitiveness. In addition to these tangible benefits, the partnership process has built social capital and trust as partners know they will be held accountable for their commitments and will meet again in future negotiations. Social Partnership Participants and Process Stakeholders included Based at the Department of the Taoiseach (prime minister), the NESC includes representatives from government,53 trade unions, business and employer organizations, farmers’ associations, and, since 1996, community and voluntary organizations. There are 19 social partners in total, selected by government to represent the four “pillars” of Irish society:
• Trade unions: Irish Congress of Trade Unions; • Business and employer organizations: Irish Business and Employers Confederation,
Small Firms’ Association, Chambers of Commerce of Ireland, Construction Industry Federation, Irish Exporters’ Association, Irish Tourist Industry Confederation;
• Farm organizations: Irish Farmers’ Association, Irish Creamery Milk Suppliers Association, Irish Cooperative Organization Society, Macra na Fierme;
• Community and voluntary organizations: Irish National Organization of the Unemployed, Congress Centers for the Unemployed, the Community Platform, Conference of Religious of Ireland, National Women’s Council of Ireland, National Youth Council of Ireland, Society of Saint Vincent de Paul, Protestant Aid.
The participatory budgeting process Although each of the social partnership agreements has been made through a slightly different process, the agreement process generally begins with the Department of Finance’s economic forecast, which is submitted to the NESC. Over a one-year period, the NESC discusses with experts the issues and parameters laid out in the forecast and, with input from other reports on aspects of socioeconomic performance, draws up a strategy report which becomes a background paper for discussion. Formal consultation between the government and the partners over a three- to four-month period then produces a new agreement, which is a compilation of endorsed “Operational Frameworks.” The government provides the forum in which the social partnership process takes place. It invites participants and sets the limits in which partnership structures operate. The government also serves as facilitator of the negotiations. Unlike a bilateral interaction, the consultative process involving diverse groups with different interests allows each party to present its position, listen to other positions, and adjust its stance. Ireland’s social partnership has been called an 53 Secretaries general from five key departments and independent, government-appointed experts.

Tools and Practices 6
127
exercise in multiparty negotiation; yet it is in many ways a thorough attempt at broad-based stakeholder participation because partners not only influence the outcome of the agreement but are also obligated to fulfill their part of pledges made in the negotiations. Thus both government and partners are accountable to the agreement.
Participatory Budgeting in Porto Alegre, Brazil Beginning in the late 1980s, the Workers Party in Brazil sought to encourage democracy through popular administration of government.54 After winning several municipal elections in 1989, the party, through the mayor’s office, began an experiment in engaging a wide spectrum of citizens in formulating city budgets. The participatory budgeting process put in place in Porto Alegre involves bringing together citizens from different areas and interest groups to define expenditure and investment priorities for the government budget based on criteria accepted by the community. The process also includes citizen monitoring to determine whether the previous year’s budget has been implemented according to policy. Results of Porto Alegre’s Participatory Budgeting Results on the Ground Before 1989, Porto Alegre’s finances suffered from the effects of deindustrialization, in-migration, indebtedness, and a poor revenue base. Since the introduction of participatory budgeting and the major fiscal reforms undertaken between 1989 and 1991, there have been significant improvements in Porto Alegre’s finances and development. The achievements between 1989 and 1996 include:
• An increase in the percentage of households with access to water services, from 80 percent to 98 percent;
• An increase in the percentage of the population served by municipal sewerage, from 46 percent to 85 percent;
• A doubling of the number of children enrolled in public schools; • 30 kilometers of road paved annually; • A 50 percent increase in tax revenues, as a result of increased transparency in tax rates
and payments received, which has encouraged payment of taxes. Much of the credit for these improvements was given to the participatory budgeting process. An influential business journal nominated Porto Alegre four consecutive times as the Brazilian city with the best quality of life. Increased participation In Porto Alegre, the number of participants involved in the participatory budgeting process rose from fewer than 1,000 in 1990 to more than 14,000 in 1996. Including informal consultations, 100,000 people—almost 8 percent of the city’s population—may have engaged in these participatory processes. Sixty percent of citizens across the state were aware of the participatory
54 This section draws on World Bank 2001b; MOST Clearinghouse 2001; Santos 1998; Avritzer 2000; Baiocchi 1999.

Tools and Practices 6
128
budget process. Across Brazil, more than 80 other cities are now following the Porto Alegre model of participatory budgeting. The Participatory Budgeting Process and Institutional Mechanisms In the Porto Alegre municipal government, the mayor’s office serves as the executive, and the Chamber of Deputies as the legislature. Municipalities have considerable autonomy over their revenues—raised through local taxes, tariffs, and federal transfers—and their expenditures. The executive prepares the budget, which is then ratified by the Chamber. Within the mayor’s office, two institutions—the planning office (GAPLAN) and the Coordination of Relations with the Communities (CRC)—manage budgetary consultations with city residents. The CRC works with community leaders through regional coordinators to set up discussion assemblies and to aggregate community claims. GAPLAN reconciles citizens’ demands with technical and economic viability. The city is divided into 16 regions, and policy issues are grouped into five broad areas: transportation; education, leisure, and culture; health and social welfare; economic development and taxation; and city organization and urban development. For each region, there are two rounds of plenary sessions per year on each theme to discuss citizens’ priorities. Following these smaller sessions, two mass assemblies are held yearly—one to monitor the previous year’s expenditures in relation to budget allocations and one to identify priorities and elect representatives. Citizens meet in March, before the first round of formal assemblies, to gather individual requests and concerns and to mobilize the community to select regional delegates. The municipality is not involved in these intra-community discussions. The first round of meetings between citizens and the mayor follows in April to review the previous year’s investment plans, discuss new proposals, and elect people to the delegates’ forums for upcoming deliberations. Between the first and second rounds (March to June), informal preparatory meetings are held with various community organizations (unions, cooperatives, mothers’ clubs) to discuss demands in different sectors. Demands are ranked on an ascending scale of 1 to 5, and are then aggregated by the executive along with points earned through two other criteria: need, as measured by how much access a region has had to a particular service; and population size. The second round follows in July when two municipal town councilors are elected from each of the 16 regions, and two from each of the five policy areas, in addition to one member each from the civil servants’ trade union and an umbrella organization of neighborhood communities. These councilors make up a 44-member Council of Participatory Budgeting (COP), which serves as the main participatory institution. Councilors then familiarize themselves with the state of municipal finances, debate criteria for resource allocation, discuss their constituents’ demands, and revise the budget proposal prepared by GAPLAN and the mayor’s cabinet. For these purposes, the COP convenes weekly meetings until the end of September when a final budget proposal is submitted to the legislature. From

Tools and Practices 6
129
September to December, the COP follows the debates in the chamber and lobbies the legislature while working on an investment plan that outlines allocations for specific public works by region. The mayor drives the COP process by coordinating meetings, setting the agenda, and presenting information before opening the forum to negotiation with the councilors. In the end, resources are divided through a weighting system that combines citizens’ preferences with quantitative criteria.
The Women’s Budget Initiative in South Africa IDASA is an independent NGO dedicated to promoting sustainable democracy in South Africa.55 It was founded as the Institute for a Democratic Alternative South Africa in the 1980s to support democracy and address the polarization of black and white in the country. After the 1994 elections, the organization changed its name to the Institute for Democracy in South Africa and created the Budget Information Service (BIS) to analyze how the allocation and use of public resources affects the country’s poor. The BIS also addressed the issue of poor information flow between the government and citizens and sought to enhance the participation of Parliament and civil society in budget planning. A particular area of concern for IDASA and the BIS was the position of women, children, and the disabled, who comprise a large proportion of poor and vulnerable people in South Africa. In 1995 the BIS convened a small group of interested individuals to discuss the possibility of creating a South African women’s budget initiative. With the support of new parliamentarians, the Women’s Budget Initiative was created as a joint project of the BIS, the Parliamentary Committee on the Quality of Life and Status of Women, and the Community Agency for Social Enquiry. The Women’s Budget Initiative set out to analyze the country’s budget with regard to its differential impact on women and men. Analyzing the budget through a “gender lens” is, in essence, a gender audit that examines whether public expenditures are allocated in ways that promote or hinder gender-equitable patterns of revenue and resource use. Results of the Women’s Budget Initiative The Women’s Budget Initiative has led to a gender budget exercise that operates within the South African government, and to the production of a gender-focused budget manual for government officials. The initiative has also inspired similar disaggregation analyses on the impact of the budget on other interest groups such as rural people, the poor, people with disabilities, and children. The Women’s Budget Initiative and spin-off projects have been successful in expanding their networks, and the involvement of project researchers in key budgetary public policy work testifies to the impact of the Women’s Budget Initiative on national policy formation. The success of the initiative has led to the adaptation of its gender analysis and advocacy work elsewhere in Africa, notably in Uganda. Process, Institutional Mechanisms, and Participants
55 See the website of IDASA’s Budget Information Service at www.idasa.org.za/bis/. See also the website of the International Budget Project of the Center on Budget and Policy Priorities at www.internationalbudget.org. Information in this section also draws on Krafchik 2001.

Tools and Practices 6
130
Development of the Women’s Budget process The Women’s Budget Initiative began by analyzing the South African budget from outside government. It examined whether the budget addressed women’s needs and made adequate provision (financial and otherwise) for implementing gender-sensitive policies. It also identified indicators to measure whether resources were used effectively in reaching intended targets and goals. The Women’s Budget Initiative looked at both revenues and expenditures, taking into account the limited financial resources available. In areas where the analysis highlighted a need for greater budgetary allocation, it identified potential savings that could be realized by reducing expenditure in areas identified as subverting gender equity. Within a year, a parallel initiative for a gender analysis of the budget was launched within government. The Select Committee on Finance instituted special hearings on women and invited presentations by the Women’s Budget Initiative and other organizations. Gender analysis research was launched three days before Budget Day and presented to key stakeholders, including parliamentarians, NGOs, the media, and others, through plenary presentations and group discussions of sectoral findings. Information dissemination Since 1998, analysis developed by the Women’s Budget Initiative has been disseminated through materials written in accessible, popular language, including simplified translations of key sections. Materials have also been developed for workshops and training events. Participants in the Women’s Budget process The Women’s Budget analysis is undertaken by researchers from a range of NGOs and academic institutions, who are chosen for their expertise in particular sectors and in gender issues. A reference group, which includes parliamentarians, government officials, NGO members, and sectoral experts, supports the researchers. The reference group changes every year in order to draw in the widest possible range of experience and increase involvement in the initiative. The roles and relationships of those involved in the Women’s Budget Initiative have been critical to its success:
• NGOs provide the expertise and staff time to collect information and produce analysis. • Parliamentarians provide access to information, maintain focus on salient political
issues, and act as advocates in the government. • Government provides the critical link to policy. Government is also expected to provide
information on its activities and report its goals and the difficulties it faces in achieving them.
Focus of the Women’s Budget The first Women’s Budget was produced in March 1996 a few days before the tabling of the national budget. It evaluated national budget departments in six sectors: welfare, housing, education, trade and industry, labor, and the Reconstruction and Development Programme. It also addressed two cross-cutting budget themes: public service and taxation and the socioeconomic profile of South African women.

Tools and Practices 6
131
The initiative published its second Women’s Budget in the second half of 1997. It dealt with methodology, budget reform, justice, safety and security, correctional service, energy, home affairs and foreign affairs, transport, land affairs and agriculture, and health. The third Women’s Budget, published in August 1998, covered a broad scope, including budgeting on finance, public works, public enterprises and communications, arts, culture, science and technology, constitutional development, defense, water affairs and forestry, environmental affairs and tourism, and Parliament. In the fourth Women’s Budget, from 1999, gender- impact methodology was applied to three new areas: local government budgets, employment creation, and foreign donor funding of the public sector.
Resources Avritzer, L. 2000. “Public Deliberation at the Local Level: Participatory Budgeting in Brazil.”
Paper presented at the Experiments for Deliberative Democracy Conference, Madison, Wisconsin, January 13–16.
Baiocchi, G. 1999. “Participation, Activism and Politics: The Porto Alegre Experiment and
Deliberative Democratic Theory.” Draft. Madison, Wisconsin. Available: http://www.archonfung.net/papers/Baiocchi.pdf
Government of Ireland. 2000. “Programme for Prosperity and Fairness.” Department of the
Taoiseach. Available: ww.irlgov.ie/taoiseach/publication/prosperityandfairness The Economist. 2000. “Hot and Sticky in Ireland.” July 29. Krafchik, Warren. 2001. “Institute for Democracy in South Africa: Budget Information Service.”
Presentation given at workshop on Accountability of Public Institutions to the Poor: Participatory Approaches to Public Expenditure Management, World Bank, Washington, D.C., May 21.
McCarthy, Dermot. 1999. “Building a Partnership.” In B. Reynolds and S. Healy, eds., Social
Partnership in a New Century. Dublin: Conference of Religious of Ireland Justice Commission.
MOST Clearinghouse. 2001. “The Experience of the Participative Budget in Porto Alegre,
Brazil.” United Nations Educational, Scientific and Cultural Organization, Management of Social Transformations Programme. Available: http://www.unesco.org/most/southa13.htm
O’Donnell, Rory. 2000. “Social Partnership: Principles, Institutions and Interpretations.” EIRI
Review (November/December).

Tools and Practices 6
132
Santos, B. De Sousa. 1998. “Participatory Budgeting in Porto Alegre: Towards a Redistributive Democracy.” Politics and Society 26 (4): 461–510.
Tikare, Seema, Deborah Youssef, Rita Hilton, Paula Donnelly-Roark, and Parmesh Shah. 2001.
“Organizing Participatory Processes in the PRSP.” In World Bank, Poverty Reduction Strategy Sourcebook. Washington, D.C.: World Bank, Poverty Reduction and Economic Management Network. Available: http://www.worldbank.org/poverty/strategies/index.htm
World Bank. 2001a. “Case Study 1: Ireland, Participation in Macroeconomic Policy Making and
Reform.” Participation Thematic Group, Social Development Department, Washington, D.C. ———. 2001b. “Case Study 2: Porto Alegre, Brazil, Participatory Approaches in Budgeting and
Public Expenditure Management.” Participation Thematic Group, Social Development Department, Washington, D.C.

TOOLS AND PRACTICES 7
Information Disclosure Informed citizens can take advantage of opportunities, access services, negotiate better deals for themselves vis à vis government and the private sector, exercise their rights, and hold state and nonstate actors accountable. Disclosure of information about performance of institutions promotes transparency in government, public services, and the private sector. Rules on information disclosure must be institutionalized with the help of laws concerning rights to information and a free press. Dissemination of this and other information in a timely manner, presented in forms that are appropriate and easily understood, provides the basis for the emergence of informed civic participation. Many investment and institutional reform projects underestimate and underinvest in information disclosure and dissemination; yet important and innovative efforts are taking place in this field. This note highlights initiatives in the following areas:
• The Freedom of Information Act in Romania; • The Program for Pollution Control, Evaluation, and Rating in Indonesia; • The public performance audit in Manila’s Metropolitan Waterworks and Sewerage
System; • Information disclosure and dissemination practices in the Kecamatan Development
Program in Indonesia; • Private sector information disclosure: the case of Nike in Vietnam.
The Romania Freedom of Information Act In 1999–2000, the Romanian Academic Society conducted public opinion surveys on corruption in Romania, Bulgaria, and Slovakia.56 The surveys showed that corruption was a widespread problem in all three countries. In addition, the surveys revealed that in Romania neither the media nor the people (especially the poor) have access to government information. In response, the Romanian Academic Society built a domestic coalition in Romania of NGOs, media, and political organizations to advance a Freedom of Information Act (FOIA) bill. The coalition came together quickly, as the society sent an e-mail message to the NGO community calling for an emergency meeting on the FOIA. In addition, the society immediately and widely published working papers on freedom of information acts in general and its recommendations for a Romanian FOIA. Calling the coalition meeting and publishing the related papers occurred in a tight five-day window in order to raise visibility and momentum for the bill.
This note was prepared by Laura Bures (PRMPR), under the overall guidance of Deepa Narayan (PREM). 56 This section is based on Mungiu-Pippidi 2001a, 2001b; Government of Romania n.d.
Tools and Practices 7
134
In January 2001, the coalition succeeded in having all essential points of its proposal included in the FOIA endorsed by the new government and the political opposition. In October 2001, the law was officially passed and made public, with implementation in December 2001. Freedom of Information Act Provisions The FOIA calls for regulating access to public information and radically transforming administrative culture in Romania. Under the FOIA, all public agencies are required to set up a public relations/information office responsible for assembling and publishing official documents specified by the law in a timely and user-friendly format. Official documents include organizational charts, program budgets, policy decisions, internal regulations, and procurement and contracting records. Government offices must furnish a complete activity report of the previous year’s activities. The FOIA requires a 24-hour turnover of information requested by the media and a 30-day turnover for citizen requests. Denial of requests can be appealed through the bureaucratic hierarchy or through the Administrative Court. No information can be classified without a public statement of justification, and the public retains the right to sue for declassification. The Pilot Ombudsman Project To assist in the capacity building of the government PR offices, the Romanian Academic Society began a pilot project in 2001 employing local journalists to work with the PR offices and ensure due process. Together, the PR office and the local journalists promote transparency through intra- and interagency communication within the government, websites, newsletters, and local media broadcasts and publications. The project also calls for local NGOs and community organizations to act as ombudsman bodies, checking reports and filing complaints on behalf of citizens in the first years after the law is passed.
Indonesia’s Program for Pollution Control, Evaluation, and Rating In the early 1990s, Indonesia suffered from acute pollution problems and a shortage of funding for environmental protection. 57 Indonesia’s Environmental Impact Management Agency (BAPEDAL) found its limited monitoring and enforcement capacity insufficient to effectively combat industrial pollution. In response, the Deputy for Pollution Control, Nabiel Makarim, began developing the Program for Pollution Control, Evaluation, and Rating (PROPER) in 1993. With support from the World Bank, PROPER was introduced to the public in 1995. How PROPER Works The PROPER system was designed to receive pollution data from factories, analyze and rate their environmental performance, and disseminate this information to the public. The rationale
57 This section draws on Afsah, Laplante, Shaman, and Wheeler 1997; Afsah, Laplante, and Wheeler 1997; Afsah and others 1996.
Tools and Practices 7
135
was that providing information about pollution in a way that nonspecialists could understand would harness the growing power of the media and public opinion to promote cleaner industry. BAPEDAL hoped that environmental performance ratings would encourage communities to join in efforts to pressure local factories for improvements and would provoke financial markets to react negatively to companies with low ratings. PROPER was intended to draw negative attention to heavy polluters and to recognize good environmental performance so as to provide an incentive for factories to operate more cleanly than required by environmental regulations. The PROPER program grew out of increasing international recognition of public disclosure as a tool for improved transparency and accountability of public institutions. It functioned as a public performance audit, disclosing performance indicators to create incentives for better performance. Although public performance audits usually focus on improving public sector performance, similar programs can promote improvements by private entities whose activity would otherwise require costly enforcement or litigation. In such efforts, the quality of the information used to assess performance is of critical importance. The rating system BAPEDAL chose to focus on water pollution first because the agency already had data on factories’ compliance with water regulations. The agency knew that the credibility of the PROPER program would depend on the reliability of its information and sought assistance from the Environment, Infrastructure, and Agriculture Division of the World Bank’s Policy Research Department in creating a data management system. The system included information on each factory’s economic activities, emissions control equipment, and in-house pollution monitoring. In February 1995, the analysis team sent survey questionnaires to 350 factories and supplemented the surveys with rigorous on-site inspections. The team used a computer model to translate all the information on a factory into a single performance rating. Based on the government’s evaluation of a plant’s environmental performance, each plant was assigned a color rating (gold, green, blue, red, or black) by PROPER. A gold rating was reserved for world-class performers on environmental standards; a blue rating was given to factories in compliance with national regulations; black was given to factories that had made no attempt to control pollution and were causing serious environmental damage. Green and red were intermediate ratings: green meant that a plant was cleaner than regulations required but not a world-class performer on environmental standards, while red meant that a company was not in compliance with regulations but was not as bad a polluter as a plant with a black rating. Information disclosure In the first phase of the program 187 plants, representing 13 provinces and 14 industrial sectors with effluent discharge standards, were rated for their environmental performance. Five factories were awarded a green rating (no factory was rated gold), 61 were rated blue, 115 were rated red, and 6 were rated black. Under the threat of public disclosure, the plants with red and black ratings were given until December 1995 to improve their performance. In that month full disclosure began, as plants’ color ratings, names, locations, managers, and parent companies were released to the media and the public. Information was released gradually to encourage sustained media attention.

Tools and Practices 7
136
Results of the PROPER Program In June 1995, plants that were not in compliance with environmental regulations accounted for 65 percent of the total. After implementation of the PROPER rating system and the disclosure of results, the number of noncompliant plants was reduced to 47 percent of the total by September 1996. In addition, the number of firms in compliance with regulations increased by 50 percent over this period. The number of factories volunteering to participate in PROPER doubled (from 11 to 23). PROPER used public relations incentives to promote better environmental performance. Information collected from plant owners and other evidence suggests that the main reason for these improvements in environmental performance was concern on the part of factory management about the possible negative response of local communities and markets to unfavorable PROPER ratings. The program also proved to be the means by which some factory owners first learned about the environmental performance of their plants. PROPER thus played an educational role as well and increased the environmental awareness of plant owners, managers, and employees, and citizens. PROPER also led BAPEDAL to increase its factory inspections and to improve the quality and reliability of its data collection and verification. The information provided by the PROPER system empowered citizens in local communities to negotiate better environmental arrangements with factories. It also enabled firms with good ratings to advertise their performance and earn market benefits, allowed investors to assess environmental liabilities more accurately, and helped BAPEDAL regulators focus limited resources on the worst offenders. BAPEDAL itself also became more transparent under PROPER and received greater public scrutiny. The program’s success also inspired similar programs in other places.
Improving Performance of Municipal Waterworks in Manila Manila’s public performance audit system is part of the Water Districts Development Project in the Philippines.58 The public performance audit system was piloted in the Manila Metropolitan Waterworks and Sewerage System, which was privatized in 1997. The goal of introducing the audit was to test a new approach to furnishing citizens and service providers with transparent information on service quality, reliability, and satisfaction. The public performance audit was intended to alter fundamentally the way service providers and consumers interact with each other. It was hoped that the project would spark private sector interest in entering long-term contracts with Philippine water utilities, which could in turn provide much needed investment, management expertise, and client-oriented service to improve overall service delivery and coverage. The audit’s emphasis on transparency was also aimed at reducing the risk that corruption would undermine regulations. Lessons learned were then to be used to implement the system fully in the Metropolitan Waterworks and Sewerage System and extend it to other water utilities in the country. 58 This section draws on World Bank 1999, 1997a, 1997b, 2001c; and Renardet S.A. and Louis Berger Group 2001.

Tools and Practices 7
137
Problems Addressed by the Public Performance Audit In water districts and other water and sanitation utilities, consumers and local politicians had limited access to information on the relative performance of the utilities and the scope for performance improvements. These utilities also lacked a well- targeted, consistent, and transparent framework of economic regulation. Furthermore, there was limited capacity at the local level to develop proposals for private sector participation and to assess the merits of unsolicited proposals for private water and sanitation schemes. The water sector’s regulatory and institutional framework was the product of incremental and ad hoc policy decisions over many years, resulting in a high degree of fragmentation. Multiple institutions held regulatory power over the water sector, and their jurisdictions were overlapping and unclear. Transparency in the design and application of regulatory rules and in mechanisms for appeal of regulatory decisions was lacking. As a result, utilities lacked clear signals about the limits of acceptable performance; there was no systematic approach to the protection of consumers from potential monopolistic abuses by water and sanitation utilities; and potential private sector investors were discouraged by the high degree of regulatory uncertainty. The Water Districts Development Project provided technical assistance to the government to improve the regulatory framework. The Public Performance Audit System The performance audit component of the Water Districts Development Project financed technical assistance designed to pilot and field-test a privatized public performance audit system. The project was based on the idea that poor delivery of water and sanitation services in Manila would not improve until provider incentives changed. Under the performance audit system, independent auditors monitored, evaluated, and publicly reported the performance of the two Metropolitan Waterworks and Sewerage System concessionaires using a format that could be easily understood by the public, the media, and congressional leaders. The audit provided timely and reliable information to enable consumers, community leaders, and the media to monitor the benefits of privatization of the metro Manila water and sanitation services. In addition, the consistent, accurate, and independent reporting provided by the system made the concession agreements less prone to litigation. The system also allowed sanctions against concessionaires to be more easily imposed because shortfalls in service quality were clearly and publicly documented. Public performance audit stakeholders The performance audit system for Manila water and sanitation services was designed to meet the needs of several groups:
• Consumers, the media, and community leaders wanted a simple, credible index of performance to judge service delivery;
• Regulators needed service quality measures to set appropriate incentives for good performance;
• Utility managers needed similar information for efficient service operation;
Tools and Practices 7
138
• Environmental authorities needed wastewater measures to check for compliance with regulations.
Information provided by the audit system The goal of the system was to provide all stakeholders with appropriate, accurate, and timely information about the quality and cost of water and sanitation services. Reporting covered three dimensions of service quality for end-users in each billing period: 1. Water quality: Degree of chemical, physical, and bacteriological contamination
a. Chemical: Toxics, heavy metals b. Physical: Suspended solids, transparency c. Bacteriological: Total coliform, fecal coliform
2. Reliability: Water availability as a percentage of total time in the billing period 3. Pressure: Open-tap flow pressure The audit reports in each billing period were prepared for consumers in each district. Service quality measures covered all three dimensions (water quality, reliability, and pressure), and reports for wastewater discharges covered only the water quality measures. The audit system is based on sampling for cost reasons. The concessionaire provides its own measures on key points in the distribution system (pumping stations, large mains, wastewater from treatment facilities) for each billing period, while the audit contractor randomly selects and reports measures for a sample of the same points. Both the concessionaire and the audit contractor randomly sample a significant group of households and businesses in each period to establish comparable measures of end-user service quality. Thus random sampling by the contractor monitors self- reporting by the concessionaire. Misreporting of a quality parameter (defined as a statistically significant overestimation of quality) for an area can result in automatic assignment of an unsatisfactory status to service quality for that area for a specified period. The key to the system is benchmarking on accepted standards, with ratings assigned to degrees of positive or negative deviations from the benchmarks. Results and Follow-up The audit found that improvements in water distribution had occurred since privatization, with 33 percent of the 10,000 households surveyed rating service as better, 55 percent as the same, and 12 percent as worse. Areas for improvement include municipalities where new pipes were laid and where water improvement programs for depressed areas were carried out. Service quality was also found to need improvement, as over 50 percent of barangays showed poor ratings. Water quality ratings were consistently positive, but network quality (i.e., hours of service) were rated as “needs improvement” in 11 out of 15 business areas. A forum was held in the summer of 2001 bringing together representatives from water service providers, consumer groups, the NGO community, and government in the audits to present the results, raise awareness, and discuss follow-up action. The information gathered in the surveys was viewed as sending important signals to government and regulatory offices for translation into improved policies and service delivery to consumers. Water service providers emphasized

Tools and Practices 7
139
that the information gathered from the surveys will enable them to better prioritize their limited resources in order to address problems identified by consumers. It was also emphasized that unless the information generated in the surveys is presented clearly and in ways that consumers can understand, it runs the risk of being misinterpreted or creating false expectations. The use of appropriate instruments and language in communicating the findings is thus important. Plans were put in place to present the performance results to municipalities in “Road Shows,” make the data available for viewing at a “Performance Café” workstation to be located at MWSS facilities, on their website, and in concessionaire business area offices.
The Kecamatan Development Program The Kecamatan Development Program (KDP) is a community empowerment initiative designed to alleviate poverty in rural communities and improve local governance in Indonesia.59 It was initiated in August 1998 as a three year program, through an IBRD loan of $228 million. The program targets the poorest kecamatans in Indonesia and finances village- level development projects. (Kecamatans are the subdistrict level of administration in Indonesia; each kecamatan includes approximately 20 villages and a population of more than 50,000 people.) As a result of its successful implementation, a second, four-year phase—the Second Kecamatan Development Program (KDP-2)—began as the three-year KDP ended in early 2002. The program is receiving $325 million from the Bank for the second phase. KDP’s goal is to develop more democratic and participatory fo rms of local governance by strengthening kecamatan and village capacities and improving community participation in development projects. The program provides block grants to kecamatans and villages for small-scale infrastructure projects and economic activities. All KDP activities are geared toward enabling villagers to make their own choices about the kinds of projects they need and want. A particular emphasis of the program is information disclosure and dissemination. Results of the Program In its first year of implementation (1998–99), KDP assisted 105 districts across 20 provinces and funded about 6,000 village-level projects, including roads, bridges, irrigation and clean water facilities, and economic loans for small businesses. By the end of the second year (1999–2000), the project was reaching 727 kecamatans and 11,325 villages. As of June 2001, more than 12,000 poor villages have participated in KDP, out of a total of 67,500 villages in Indonesia. The program has reached a beneficiary population of almost 10 million. During the project’s first two years, 75 percent of the funds were used to build economic infrastructure such as roads (62 percent), bridges (10 percent), irrigation (8 percent), and clean water (7 percent), while the remaining 25 percent was used for economic activities. Economic
59 This section draws on National Management Consultants 2000; World Bank 1998a, 1998b, 2000a, 2001a, 2001b; de Aenlle 2001.

Tools and Practices 7
140
infrastructure built through KDP’s participatory methods have cost as much as 30 percent less than traditional approaches used in the same places. The benefits in fighting poverty have been considerable. A sample of kecamatans that were included in the first year found that 60 percent of all participants in project meetings were poor, and 40 percent were women. Nearly 5 million people received wage payments in the program’s first year. Ex-post reviews show average rates of return of 30–40 percent to rural infrastructure built through the program, nearly all of which is captured by villagers. The project generated 4 million person-days of labor in the first year. Because the project sets wages below the local agricultural minimum, almost all of these wages have been paid to the poor and vulnerable. Program Activities Analysis of KDP activities shows how they are structured to enable informed community choices, local accountability, and inclusion, and are greatly assisted by a well-developed strategy for information disclosure and dissemination. Institutional set-up Responsibility for the project lies with the Department of Home Affairs. The program operates through elected local governments rather than through line agencies in order to make a systematic commitment to administrative decentralization in Indonesia. The core of the project’s institutional arrangements lies in the relationships between the kecamatan and village levels. Already existing in each kecamatan was a Kecamatan Council of Village Heads (UDKP), bringing together the village head and leader of the village council (LKMD) from each village in the kecamatan. Under the project, villages send three additional representatives to the council, two of them women, which is viewed as a way to introduce more transparency and accountability in the UDKPs, as well as more gender balance. To leverage and strengthen community capacity, the project supports two facilitators per village, who are selected by the village and trained by the project, and employed for seven months of the year. Their main role is to disseminate project information to village groups (especially marginalized groups), though in some areas they do assist in developing projects. They also organize village and UDKP meetings and supervise project implementation. In addition, the project supports a facilitator in each kecamatan and another in each kabupaten. The kecamatan facilitator assists in a range of activities, such as helping in project design, establishing and handling bank accounts, and overall coordination. Facilitators help communities build linkages with other organizations, particularly government agencies. Project identification and design A village project identification and planning process selects a maximum of two projects. After being reviewed for technical feasibility by local experts, proposals are submitted to the kecamatan council, the UDKP, for discussion. The project has an “almost open” menu (only a few possibilities are excluded, such as religious buildings and environmentally damaging projects), so prioritization decisions are scarcely affected by project design criteria. Ostensibly, projects are prioritized according to three criteria: overall impact, poverty impact, and technical

Tools and Practices 7
141
and financial feasibility. In practice, however, these criteria are left quite vague, so the UDKP prioritizes and approves projects according to its own criteria. Contracting, implementation, and operation To encourage local accountability, villages do their own subcontracting for projects whenever possible. They receive cash from the project, and pay contractors in cash. Project implementation is ultimately the responsibility of the villages, with support and supervision by project facilitators at the kecamatan and (to a lesser extent) kabupaten levels. Similarly, the village council (LKMD) monitors implementation. The village is also responsible for planning and funding the operation and maintenance of the facility, which, depending on the type of project, may be done in cooperation with local government. KDP Information Disclosure and Dissemination Information dissemination Disclosure and dissemination of information about KDP take place in several ways. Generally, information is shared orally by facilitators through meetings and informal discussions as well as in writing through pamphlets, posters, manuals, and information boards. Information boards post information regarding KDP principles along with key data on types of projects to be funded, costs, progress, and expected dates of completion. Workshops are held at the provincial, district, and kecamatan levels to disseminate information, raise awareness, and generate interest in the program. These workshops include community leaders, local government officials, local press, universities, and NGOs. At the village level, dissemination of information occurs through large village meetings and through group and sub-village level meetings in which people are encouraged to propose ideas for KDP projects. On average, about 50 to 100 villagers attend the large village meetings, though in some places attendance often reaches several hundred participants. These methods of information dissemination are also supplemented by additional and unique efforts to share information about KDP. In Pugeran village, Gondang Kecamatan in East Java, facilitators found that few villagers were reading the information board. They found spreading information orally to be more effective, especially before or after the weekly Muslim prayer meetings in each neighborhood and the regular skills training group for women. In Edera Kacamatan, Papua, the local parish priest became very interested in KDP and began disseminating information about the program in his weekly sermons. He also began placing public information boards in the front yards of churches because the information boards in public areas were often damaged by vandalism. In the Sampang District of East Java, religious holidays can last for a few months at a time, and community members do not attend meetings at the town hall during these holidays. The facilitator in Camplong therefore began attending all of the village’s celebrations and presenting KDP information there. Information disclosure for monitoring and evaluation Several monitoring mechanisms are in place. At the village level, village governments (LKMD and village leader) monitor projects. There is an incentive for community self-monitoring as the failure of a project to fulfill obligations disqualifies the whole village from projects for the
Tools and Practices 7
142
following year. This rule is widely publicized, creating strong accountability pressures and performance incentives for local leadership. At the province level the project has begun to hire and train journalists, local NGOs, and universities as third-party project monitors. At the national level, journalists have been contracted to write stories on the project and are given training and transport costs to visit KDP sites. Finally, random project audits are conducted. Annual lists of kecamatans participating in the program have been disclosed by posting them on a website, which is monitored by a number of NGOs. In addition, the project’s performance indicators have included contracts with a host of professional journalists who provide independent reporting on site visits to KDP areas. Lessons learned in information strategies According to an August 2000 survey of 444 Kecamatan facilitators, 56 percent (from 250 kecamatans) reported that the information boards were functioning. A number of reports have shown that information boards have not been kept up to date, are not very interesting, or are not read by the communities, in part due to the problem of illiteracy. For the second and third years of the program, efforts have been made to improve information, education, and communication by disseminating information in styles and formats more tailored to the intended audiences and users, especially community members in KDP areas. The current KDP project is conducting an ongoing evaluative review of the media used to convey information in villages which will contribute to the information disclosure and dissemination plans of the Second Kecamatan Development Program. The Second KDP also includes an action plan for integrating gender into the program, which calls for identifying local, specific, and acceptable ways of disseminating information to women. To further improve information disclosure and dissemination in the second phase of the program, much of the work of KDP empowerment facilitators will consist of finding and disseminating information—about available government programs, standards for projects, technical problem solving, and support for contract enforcement. Project financial information will be registered in district budgets and records. Kecamatans will prepare an “accountability speech” for the district parliament summarizing the accomplishments and faults of KDP projects. Province-based independent monitoring by NGOs and the media will be continued and expanded. The program will maintain its support of an aggressive transparency, advocacy, and disclosure program through the media, which will publish annual implementation summaries and release all audits, an official transparency policy, and assistance to community-based advocacy on disclosure.
Private Sector Information Disclosure: Nike in Vietnam International information campaigns linked to industrial labor and environmental practices are powerful tools for holding multinational corporations accountable to local communities. In the case of a Nike Inc. subcontractor in Vietnam, an international information campaign was instrumental in improving labor and environmental practices.60
60 This section draws on O’Rourke forthcoming; O’Rourke and Brown 1999; Global Alliance for Workers and Communities 2000. For further information, see the following websites: http://www.saigon.com/~nike/index.html http://www.saigon.com/~nike/reports/report1.html

Tools and Practices 7
143
The Tae Kwang Vina Factory In 1998 Nike Inc. was the world’s leading producer of sports shoes and clothing, with sales reaching $9.6 billion. The company was also a leader in global outsourcing of production and, in fact, owned none of the factories that produced its shoes. In Vietnam, Nike factories (five in all) were owned by Korean and Taiwanese subcontractors and employed 35,000 people. The Tae Kwang Vina company was a subcontractor of Nike Inc. in Dong Nai Province. The Tae Kwang factory in the Bien Hoa 2 Industrial Estate employed about 9,200 workers, mostly women, who worked 11 hours a day, six days a week, for salaries of about $40 a month. Most of the factory’s workers were recent immigrants to the province, and many had left farms for the factory. During the summer, workers sweated in a one-room plant about the size of a football field in over 100-degree heat. They were exposed to toxic solvents and glues used in the manufacture of Nike shoes, which caused dizziness and nausea. Many workers suffered from respiratory ailments, and accidents occurred in the more hazardous sections of the plant. In addition, workers were subjected to verbal and physical abuse by managers. Tae Kwang was known as a bad place to work, and most workers tried to avoid working there if they could. Dong Nai government officials considered the factory “uncooperative” and claimed that their requests to Tae Kwang were ignored. Regulation of companies like Tae Kwang was difficult because of Vietnam’s desire to attract foreign capital while establishing effective regulatory policies and enforcement mechanisms. Tae Kwang had avoided complying with national requirements for a wastewater treatment plant as well as other environmental regulations. The factory burned all of the scrap rubber from its production process to generate steam, which produced clouds of black smoke. Despite the government’s requests that the plant reduce the pollution, Tae Kwang purchased additional scrap rubber from other Nike factories in Vietnam. In addition, the factory hired the son of the chairman of the Communist Party in the province to provide connections and act as a “problem solver” with the government. Difficulties in Initiating Change at the Local Level Because the factory was located in the middle of an industrial zone, no one officially lived near it; as a result, there was virtually no local community to complain about the problems. The people most affected by Tae Kwang’s practices were the workers, and they had little power to influence the company. The union in the factory was controlled by the company, and all of its worker representatives were chosen by management. The surrounding community had little capacity, cohesion, or linkages to external actors. Furthermore, because so many of the factory’s workers were recent immigrants to the province and usually stayed less than two years, the residents of the surrounding area felt little connection to Tae Kwang workers.
http://www.nikebiz.com/labor/index.shtml http://web.mit.edu/dorourke/www/

Tools and Practices 7
144
External Information Disclosure and Pressure As a result of this situation, efforts by local government officials and community members proved ineffective in changing Tae Kwang’s practices. However, Nike has been influenced by a range of external pressures. Networks of NGOs in the United States and Europe have had some success in pressuring Nike and Tae Kwang to improve production practices. Some of these efforts have involved using the media to educate the public about conditions in Nike factories; others have called for boycotts of the company’s produc ts, and still others have lobbied governments to force Nike to change. NGOs have also assisted in building the capacity and linkages available to factory workers and community members. Activist campaigns targeting labor practices and conditions in Nike factories have received worldwide media attention. In October 1997, civic groups from more than 10 countries organized protests and information campaigns about Nike’s production practices. In April of the following year, the effort spread to more cities in Europe and America. Fueling these information campaigns and protests were a CBS television report in October 1996 on the working conditions in Vietnamese factories, subsequent research and publicity by the Vietnamese Labor Watch, and a New York Times report in November 1997 that was based on research by Dara O’Rourke for the United Nations Industrial Development Organization and on a leaked Ernst & Young audit of Tae Kwang. One of the most important players in the effort to pressure Nike and Tae Kwang to improve labor and environmental practices was the Vietnamese Labor Watch, headed by Thuyen Nguyen and based in Washington, D.C. Mr. Nguyen and the organization began monitoring the Tae Kwang factory in 1996, meeting with workers, shoe manufacturing executives, labor union officials and representatives, and legal and foreign investment experts. The information collected was then shared with other labor and environmental NGOs, activists, and the media, and was posted on the Vietnamese Labor Watch’s website.61 Mr. Nguyen and the Vietnamese Labor Watch gave out prepaid calling cards to factory workers at Tae Kwang and contacts around the community, so that they could call him in Washington and report problems. When such a report was made, the Vietnamese Labor Watch could then use its connections with media outlets to draw attention to the problem. In one case, a worker who was being physically abused called Mr. Nguyen on the calling card, and Vietnamese Labor Watch then arranged for a film crew to go to Tae Kwang. Within a day, the film crew had recorded abuse at Tae Kwang on videotape and distributed it to cable outlets. The calling cards proved to be a very effective though informal way of getting information about factories to the activist community and the media, and demonstrated the rapid work and influence of transnational networks. Results of External Information Disclosure and Pressure At Tae Kwang, these external pressures have spurred regular visits to the factory by Nike’s labor and environmental inspectors as well as monitoring by third parties in accounting, health, and
61 www.saigon.com/~nike/.

Tools and Practices 7
145
safety firms. The first target of these inspections was worker exposure to toxic solvents and glues. In May 1998, Nike announced a major initiative to eliminate the use of organic solvent–based cleaners and glues and pledged to comply with U.S. workplace laws in all of its factories. By December of that year, workplace health and safety conditions were much improved at Tae Kwang. Now, pressure from Nike, driven by external NGO and media pressure, is making a larger impact on the reduction of air pollution and workplace hazards at Tae Kwang than local government or community efforts had been able to achieve. The activist community also put pressure on Nike to disclose information about its operations and the locations of its factories, information that Nike had never before released. Beginning in the fall of 1999, Nike began disclosing information about its operations and factories in response to this pressure. The company has also begun posting audits of its factories online. The activist community has not been entirely satisfied with the disclosure of these audits because Nike has been releasing summaries rather than full audit documents; however, Nike has made great strides in information disclosure as a result of the pressure. In fact, the company provides an example of self-reinforcing disclosure and accountability: as Nike discloses information, activists put more pressure on the company to improve its standards and practices. Nike began working toward improving its labor and environmental standards in the early 1990s, and created its code of conduct in 1992. After the attention on Tae Kwang and other factories in the mid- and late 1990s, Nike stepped up efforts to monitor factories through quarterly internal inspections by the company’s own production staff (called “Safety-Health-Attitude of Management-People Investment-Environment” inspections, or SHAPE). Monitoring also included periodic visits and inspections by the Nike labor practices staff, inspections and tests by outside health and safety specialists, and the independent audits mentioned above. Nike has also created “Transparency 101,” which publishes action plans and progress reports on the Nike website in response to results of the company’s external and internal monitoring. Nike has joined the Global Alliance for Workers and Communities, which conducts independent research on the attitudes and aspirations of factory workers, including those working in Nike contract factories in Indonesia, Vietnam, and Thailand.62 Based on the results from such a study in Indonesia, Nike has developed a remediation plan and has begun implementing it with the company’s Indonesian factory partners.
Resources Afsah, Shakeb, Benoit Laplante, and David Wheeler. 1996. “Controlling Industrial Pollution: A
New Paradigm.” Policy Research Working Paper 1672. World Bank, Development Research Group, Washington, D.C.
———. 1997. “Regulation in the Information Age: Indonesian Public Information Program for
Environmental Management.” World Bank, Economics of Industrial Pollution Control Research Project, Development Economics Unit, Washington, D.C.
62 See www.theglobalalliance.org.
Tools and Practices 7
146
Afsah, Shakeb, Benoit Laplante, David Shaman, and David Wheeler. 1997. “Creating Incentives
to Control Pollution.” DEC Notes 31. World Bank, Washington, D.C. de Aenlle, Conrad. 2001. “Small Loans Go Far in Indonesia.” International Herald Tribune,
May 8. Global Alliance for Workers and Communities. 2000. “Global Alliance Gives Asian Workers a
Voice.” Press release, September 6. Available: www.theglobalalliance.org/content/press2.cfm
Government of Romania. n.d. “Law Regarding Access to Public Information.” Draft. Ministry of
Public Information, Bucharest. Mungiu-Pippidi, Alina. 2001a. “For an Institutional Approach to Post-Communism Corruption:
Analysis and Policy Proposal Based on a Survey of Three Central European States: Romania, Bulgaria and Slovakia.” Paper presented at Bertelsmann Conference on Accountability, Bucharest, May 3–5.
———. 2001b. “‘Selling’ Good Governance: An Eastern European Experience.” Presentation at
the World Bank, Washington, D.C., May 23. National Management Consultants. 2000. “Kecamatan Development Program: Second Annual
Report, 1999/2000.” Prepared for the KDP National Secretariat, Jakarta. O’Rourke, Dara. Forthcoming. “Community-Driven Regulation: Towards an Improved Model of
Environmental Regulation in Vietnam.” In Peter Evans, ed., Livable Cities: The Politics of Urban Livelihood and Sustainability. Berkeley: University of California Press.
O’Rourke, Dara, and Garrett Brown. 1999. “Beginning to Just Do It: Current Workplace and
Environmental Conditions at the Tae Kwang Vina Nike Shoe Factory in Vietnam.” Available: www.globalexchange.org/economy/corporations/nike/vt.html
Renardet S.A. Consulting Engineers and the Louis Berger Group, Inc. 2001. “Pilot Public
Performance Assessment Project: PPA Final Stakeholders Forum.” Summary Report of Final Stakeholders Forum of the Pilot PPA Project, Quezon City, Philippines, June 15, 2001. Prepared for Republic of the Philippines, Metropolitan Waterworks and Sewerage System, Regulatory Office.
World Bank. 1997a. “President’s Report: Philippines Water Districts Development Project.”
Report P-7122-PH. Washington, D.C. ———. 1997b. “Staff Appraisal Report: Philippines Water Districts Development Project.”
Report 16526-PH. Washington, D.C.

Tools and Practices 7
147
———. 1998a. “Indonesia Kecamatan Development Program.” Project Implementation Document 6343. Washington, D.C.
———. 1998b. “Project Appraisal Document: Kecamatan Development Project.” Report 17397-
IND. Washington, D.C. ———. 1999. “Philippines Water Districts Development Project.” Project Implementation
Document 4903. Washington, D.C. ———. 2000. “President’s Report: Kecamatan Development Project.” Report P7421IND.
Washington, D.C. ———. 2001a. “Indonesia: Demonstrating the Impact of Community Empowerment.” Bank’s
World Today, June 26. Available: http://ispace.worldbank.org/todayarchive/html/062601b.htm
———. 2001b. “Project Appraisal Document: Second Kecamatan Development Project.” Report
22279-IND. Washington, D.C. ———. 2001c. “Manila Public Performance Audit.” Seminar, Manila, February 22. Available as
online video: http://www.worldbank.org/wbi/B-SPAN/sub_manila.htm

TOOLS AND PRACTICES 8
Decentralization Strategies for Empowerment Many countries throughout the world are undertaking some forms of decentralization by shifting fiscal, political, and administrative responsibilities to lower levels of government. Decentralization is driven by unique circumstances in each setting. In some countries it is linked to recent democratization, while in others it is spurred by the failure of central government to deliver basic public services. The four elements of empowerment put forward in this paper—access to information, inclusion and participation, local organizational capacity, and accountability—are often integral components of successful decent ralization. In some countries, particularly those in the Europe and Central Asia Region, central governments have decentralized responsibilities to local governments for another reason: to reduce national fiscal deficits. By pushing expenditure functions down to local governments while retaining centralized tax bases, governments maintain macroeconomic balance; yet service delivery often declines due to underfunding. In these cases, the decentralization agenda is unlikely to achieve benefits unless it is modified to empower local governments through greater resources and a sound intergovernmental framework, and empower people so they can hold their local governments accountable. The idea behind decentralization is that moving decision making closer to people will lead to public sector decisions that better reflect local needs and priorities. This in turn will lead to greater efficiency in public expenditures, improved governance, and greater equity. These results, however, are by no means automatic or easy to achieve. Efforts to decentralize usually stop at the local government level and often go no farther than the provincial or state level. Decentralization is unlikely to achieve its theoretical impact unless it extends down to the population, permits informed input in public decisions, and motivates local government to respond to this input. Further, as noted below, although empowerment can help achieve benefits of decentralization and vice versa, these processes are only part of an effective poverty alleviation strategy. There remains a strong role for central governments in ensuring adequate funding and incentives that target the poor, along with a legal framework that enables them to live securely.
Ukraine: The People’s Voice Program After decades of centralized control, Ukraine has begun exploring ways in which bottom-up accountability can improve governance, but the country has moved haltingly with regard to decentralization. A pilot initiative introduced in 1999, with support from the World Bank and CIDA, demonstrates how greater citizen participation at the municipal level can lead to better service delivery and higher public satisfaction. Called the People’s Voice Program, this effort responds to the problem of insufficient public participation and control in the policy-making
This note was prepared by Jennie Litvack and Tripti Thomas (PRMPS).
Tools and Practices 8
149
process, perceived as one of the major constraints to advancing reform in Ukraine. The program is being implemented along two fronts: (a) helping selected Ukrainian cities to improve their service delivery to households and businesses, and enhancing their level of integrity in the process; and (b) strengthening the capacity of citizen groups and officials to interact with each other in order to strengthen the overall quality of governance in these cities. Ternopil and Ivano-Frankivsk were the first two Ukrainian cities chosen for the pilot. Under the supervision of a local NGO, the International Centre for Policy Studies, surveys were conducted in both cities among households, the business community, and public officials to identify the key problems associated with major services, and to identify the public’s priority service needs. The information gathered from the surveys, which included data on corruption, was widely distributed through the local media, public discussions, and NGOs, putting pressure on local leaders to respond to specific criticism and open channels for greater participation. Meanwhile, intensive technical assistance and training were provided to municipal officials and agencies to strengthen their capacity to listen and respond to citizen demands. Open budget hearings were introduced, task groups were set up to address the most pressing problems, and community advisory boards and working groups were established. In response to the survey in Te rnopil, a gender audit of regional and local government policies, practices, and services was undertaken to ensure equitable inclusion of women. The results of this greater participation have been very encouraging. Better informed and mobilized community groups now play active roles in public hearings that affect critical local public decisions. Certain demands such as the reform of public education have emerged as priorities for communities in both cities. In Ivano-Frankivsk, NGOs, parents, and education officials have come together to develop proposals to improve the local education system. An interesting innovation has been the establishment of “service centers,” one-stop shops where citizens can pay for all municipal services and will soon be able to file and monitor responses to their complaints. As a result of the wide consultations around the gender audit, community clusters have emerged to focus on issues such as women’s health. Other citizen working groups have formed around sectoral concerns such as housing and business development. The capacity of NGOs to raise awareness, facilitate public hearings, monitor and participate in service delivery, and become self-sufficient is also being enhanced. The program has relied heavily upon the invo lvement and commitment of the city mayors and local officials. In fact, it is their initial interest and commitment that prompted the selection of Ternopil and Ivano-Frankivsk as the first pilots. These officials are now highly motivated to respond to this newly expressed citizen voice. As part of the program, a second round of surveys will be conducted in both cities to measure changes in citizen satisfaction with the public sector. In Ivano-Frankivsk, bimonthly surveys are planned for particular services. It is expected that that mayors in other cities in Ukraine will be held up to the standards set in Ternopil and Ivano-Frankivsk. In the summer of 2001, two more cities, Kupyansk and Chuguiv, conducted baseline surveys. The models developed from these four pilots will be used as the basis for expanding the program further to interested cities in Ukraine and for demonstrating to the central government the potential merits of decentralization to participatory local governments.
Tools and Practices 8
150
Guinea: Investment in Rural Government to Improve Service Delivery Guinea’s rural inhabitants represent 70 percent of its population and about 87 percent of its poor, a situation exacerbated by a quarter-century of command and control dictatorship between 1958 and 1984.63 Despite political changes in 1984, which emphasized decentralization and established 33 urban and 303 rural development communities (CRDs), the ensuing decade saw little improvement in rural poverty. Participation by rural citizens and provision of services to their localities remained low. In the mid-1990s the government recommitted itself to poverty alleviation and conducted an extensive participatory, bottom-up, strategic planning effort. Civil society representatives from across the country participated in these consultations and helped place the following priorities on the country agenda: rural development, basic education, primary health care, local entrepreneurship, and good governance. As a follow-up to these consultations, in 1999 the Bank prepared two complementary five-year Adaptable Program Loans to support the government in its reform program: a Village Community Support Project ($22 million) to engage local communities directly, and a Capacity Building for Service Delivery Project ($19 million) to enhance public sector capacity (at both the prefecture and national levels) to respond to these communities. The components of both programs are aimed at widening and strengthening the process and impact of fiscal, administrative, and political decentralization by shifting resources, responsibilities, capacity, and accountability for service delivery to local governments and communities. The combination of these two efforts represents a bottom-up/top-down approach that is at the heart of creating sustainable, meaningful empowerment through decentralization. The bottom-up strategy entails promoting active participation of the beneficiaries in the choice and delivery of needed services. To this end the program involves an extensive public information program, as well as the establishment of administrative and financial management and information systems at the prefecture and community levels to ensure the transparent use of resources. Also included are budget tracking and citizen satisfaction surveys to stimulate transparency and participation. Participation is also being encouraged by improving communication between public officials and citizens. Poor communication between service providers and beneficiaries as well as between the CRDs and prefecture agencies has been identified as a key barrier to effective service delivery in the past. The new approach, therefore, emphasizes improving communication and participation at the point of service delivery, particularly by developing local organizational capacity in the form of parent-teacher associations, health center management committees, and farmers groups. The top-down effort has several components. In order for citizen groups to participate meaningfully in public decisions, responsibilities and resources need to be clearly assigned to different groups (such as levels of government and service providers). This initiative includes a revision of the framework governing roles and responsibilities of different levels of government under decentralization, and the establishment of decentralized delivery and management systems at the prefecture and CRD levels. Under a pilot initiative, some CRDs will be able to keep head
63 This section draws on World Bank 2000.

Tools and Practices 8
151
taxes within their locality. Furthermore, as an initial step in increasing direct access of rural communities to the national fiscal authorities, these head tax resources will be matched by direct transfers of budgetary and donor funded resources from the center. To reflect the growing shift in accountability to rural communities, a performance incentive system is being introduced to reward high-performing CRDs and public officials at the prefecture and central level on the basis of beneficiary satisfaction with services. Elected CDR councils are being made more representative, and Prefecture Development Councils are being established with membership elected by and accountable to CRDs, to advise on programs and budget trade-offs across CRDs. Prefects will eventually be responsible to these elected bodies for ensuring that local service needs are met. Taken together, these programs will help foster a range of governance, fiscal, and administrative reforms, which aim at the end of 10 to 15 years to achieve an 80 percent increase in access to and quality of all services to rural areas.
Mbabane, Swaziland: Two-Way Communication Mbabane, Swaziland offers another example of how decentralization can lead to increased empowerment. Over the past few years, local authorities in Mbabane have encouraged empowerment to improve municipal services and increase citizen satisfaction with public sector performance. Information dissemination has been a notable element in this endeavor. The Mbabane city council has launched a website to publicize its policies and programs and to make accessing government services more user- friendly. Information about programs to upgrade informal settlements has been disseminated through radio, print, and even street theater. In an effort to gather views on the provision of municipal services, the city council has conducted surveys of citizens, the business sector, and city employees, and has strategic plans to follow up on survey results. Information dissemination has led to greater participation in civic affairs. The city council has established a network of outreach facilitators to encourage input from community members and groups, particularly in the context of the urban upgrade project. As a result of these developments, transparency in public processes and accountability of local authorities is increasing. The demand for accountability is further enhanced by the devolution of tax bases, which enables Mbabane to support almost two-thirds of its budget from its own local taxes. The city council presents an annual report (available to the public) and makes information on its programs and financial flows available to citizens through community meetings, the press, and its website. Photographs of each city council member are included in the annual report, increasing the sense of personal answerability. The largely elected city council (last elected in 1998), and the indirectly elected mayor, will face an increasingly informed and empowered citizenry in subsequent elections.

Tools and Practices 8
152
Philippines and Uganda: Limited Information Hampers Citizen Influence A recent in-depth study of decentralization and governance in Uganda and the Philippines evaluated how well the different elements of empowerment were being implemented in these countries and what the impact was on delivery of social services.64 One of the most interesting findings of the study is that independent sources of local information play a key role in enabling effective participation. In both countries, citizens were less informed about local government than about national government. While citizens in both countries rely on the media for information about national politics and corruption, they rely largely on community leaders (in Uganda) and personal contacts (in the Philippines) for such information at the local level. The econometric analysis confirms the importance of access to the media by indicating its association with better education and health care. In addition to weak local information leading to less effective participation, local accountability is weak because officials have very limited authority to respond to local needs. Although local leaders perceive the needs of their citizens more accurately than higher level leaders do, the reliance on earmarked transfers leaves them little scope for responding to these needs.
Decentralization: A Qualified Measure for Empowering the Poor Some observers have argued that decentralizing poverty programs from the national to the local level can reduce costs and improve targeting. Local governments and administrators are likely to have better information about local conditions and people and are thus better able to identify local households in need. Others worry that decentralized resources may be prone to “capture” by local elites. Whether or not improved information can lead to better targeting of poverty programs depends on several factors, including the level of government involved, political institutions (for example, rules of the electoral system), community characteristics (including ethnic diversity, income inequality, historical and cultural factors, and so forth), and the design of the poverty program. An exciting research agenda is currently underway in the Bank’s Development Economics Unit to better understand the conditions that affect the ability of programs to reach the poor in decentralized settings. Many of the benefits of decentralization seem most likely to be achieved when decisions are made at the village level, and least likely when decision making rests at the provincial level. Village- level decentralization can lead to greater participation, more effective local decisions, better development strategies, and improved service delivery. Widespread information dissemination can encourage participation at the local level, but it is only likely to lead to satisfying results if strong channels of accountability exist. If accountability is weak, citizen voices are unlikely to be effective even if they are heard. Even in a perfect democracy with full participation of all citizens and strong accountability of locally elected officials, decision making is unlikely to benefit the very poor and marginalized if they are a minority in the local
64 Azfar and others 2001; see also World Bank 2001.

Tools and Practices 8
153
population. (Where national minority groups represent a majority in a local jurisdiction, decentralization can be very advantageous.) Although some countries have modified their electoral rules to ensure participation by women and minority groups, this has had mixed results. In decentralized settings, decision making may be captured by the elite, and it is generally likely to favor the majority. Thus, decentralization has limitations for certain very poor groups and there remains an important role for the central government in ensuring safety nets for them, as well as an overall governance structure that provides security. A recent careful study of Vietnam’s decentralized poverty programs illustrates the need for central government to play a continued strong role.65 Vietnam’s poverty programs have expanded considerably over the past decade and have relied on administration by provincial authorities. However, since they have lacked national norms for identifying the poor across regions, and have not consistently measured or monitored local needs, there is little sign that poor people or poor communes are being targeted. Data analysis indicates that the poorer provinces are less effective at targeting their poor than are wealthier provinces. Given that growing urban-rural disparities and risks that vary by community or area (such as natural disasters) are significant components of the national poverty profile, targeting of national programs by province is a problem. Although citizen empowerment is weak in Vietnam, the problems with its decentralized poverty programs are largely central design issues. Moreover, increasing information and participation in a situation of weak local accountability would likely have minimal impact. Argentina also administers a decentralized poverty program that has been examined.66 Although the elements of empowerment are more strongly in place than is the case in Vietnam, similar problems were identified. Wealthier areas were more effective than poor areas in targeting poorer citizens. This does not seem surprising since the poverty reduction priorities of poor and wealthy areas may well be different, with the latter being more willing to identify individual communities and households requiring additional assistance. The study recommends more incentives for improved provincial targeting. In the case of national poverty programs, information and monitoring must feed back into the modification of central government policies to ensure desired results for poverty targeting.
Conclusion While there are certainly places where empowerment has made effective decentralization possible, and decentralization has facilitated empowerment, actual outcomes depend on a host of details that differ from case to case—community characteristics, local institutions, the type of decentralization, and the mechanisms of empowerment (related to information dissemination, citizen participation, group formation, and accountability). Decentralization and empowerment are partner concepts. Together they have the potential to aid the development process, particularly for the poor, yet the challenges in better understanding them in each context remain large.
65 Van de Walle 2001. 66 Ravallion 1998.

Tools and Practices 8
154
Resources Azfar, Omar, Satu Kahkonen, and Patrick Meagher. 2001. “Conditions for Effective
Decentralized Governance: A Synthesis of Research Findings.” University of Maryland, Center for Institutional Reform and the Informal Sector (IRIS), College Park, Md.
Ravallion, Martin. 1998. “Reaching Poor Areas in a Federal System.” Policy Research Working
Paper 1901. World Bank, Development Research Group, Washington, D.C. Van de Walle, Dominique. 2001. “The Static and Dynamic Incidence of Vietnam’s Pub lic Safety
Nets.” Processed. World Bank, Development Economics Research Group, Washington, D.C. World Bank. 2001. “Decentralization and Governance: Does Decentralization Improve Public
Service Delivery?” PREM Note 55. Poverty Reduction and Economic Management Unit, Washington, D.C.

TOOLS AND PRACTICES 9
Community-Driven Development Community-driven development (CDD) is broadly defined as the process of giving control of development decisions and resources to community groups. Communities can be geographical entities, such as urban neighborhoods or villages, or groups with common interests, such as water user associations, parent-teacher associations, herders, members of a microcredit society, or women’s groups. Once formed, these groups typically work in partnership with support organizations and service providers—local governments, the private sector, or NGOs—to develop and implement projects that meet their immediate priorities in education, health, sanitation, transportation, resource management, economic activities, and other livelihood issues.
CDD can be divided into four practice areas:67 • Enabling environment: Development of policy and institutional reforms oriented toward
increased control of decisions and resources by community groups and/or by participatory elected local governments.
• Participatory elected local governments: Elected local governments make decisions on planning, implementation, operation, and maintenance in partnership with community groups.
• Community control and management of investment funds: Community groups make decisions on planning, implementation, operation, and maintenance, and manage investment funds.
• Community control without direct management of investment funds: Community groups make decisions on planning, implementation, operation, and maintenance, without directly managing investment funds.
This note first presents evidence of CDD success, and follows with four case studies:
• Malawi Social Action Fund • Zambia Social Investment Fund • Romania Social Development Fund • Tunisia Northwest Mountainous Areas Development Project
Evidence of CDD Success Experience has shown that CDD can make poverty reduction efforts more demand-responsive, increase efficiency and effectiveness, and enhance sustainability. The World Bank has undertaken both project-based and regional studies to assess CDD success in reducing poverty and improving livelihoods. An internal analysis of World Bank projects in Africa in 1994–97, for example, showed that 75 percent of projects with some level of community participation
This note is based on contributions from Philippe Dongier (SDV), Daniel Owen (SDV), Andrea Ryan (SASEI), Talat Shah (PRMPR), Idah Z. Pswarayi-Riddihough (MNSRE), and Deepa Narayan. 67 World Bank 2001a.
Tools and Practices 9
156
were rated satisfactory, compared to 60 percent of all African projects carried out in the period.68 At the same time, only one-fifth of participatory projects in Africa were rated “sustainable,” pointing to one of the major concerns around CDD practice. As the following brief examples show, CDD approaches can be applied in widely varying contexts and address varied problems. 69 Brazil The FUMAC project in northeastern Brazil delegates decision making for state approval of subprojects to project municipal councils, 80 percent of whose members are potential beneficiary associations and civil society groups. A study found that the subprojects executed by local contractors or communities cost 20–30 percent less than those executed by municipalities or government contractors. Furthermore, 95 percent of project funds are reaching targeted beneficiaries, who are mostly landless.70 India During the 1980s, an average of 18,000 forest offenses were recorded annually in the state of Gujarat: 10,000 cases of timber theft, 2,000 of illegal grazing, 700 fires, and 5,300 other offenses. Twenty forestry officials were killed in confrontations with communities and offenders. In response, an experiment in joint management with communities was initiated. The strategy included community meetings, widely publicized creation of forest protection committees, and profit sharing in which 25 percent of timber returns went to local groups. As a result, conflicts between officials and community groups diminished, community groups assumed responsibility for patrolling forests, and productivity of land and returns to villages increased sharply. In one year, one village of 88 households harvested and sold 12 tons of firewood, 50 tons of fodder, and other forest products, while also planting and protecting teak and bamboo trees.71 Côte d’Ivoire A national rural water supply program established community water groups that managed the maintenance of 13,500 water points, reducing breakdown rates from 50 percent to 11 percent at one-third the previous cost. The shift to community- level maintenance was achieved by taking away the responsibility for rural water supply from the sector agency, supporting private sector involvement in spare parts distribution, retraining technicians, and signing contracts with village groups and the water directorate for management of water pipes. The results were more sustainable in those villages that had high demand for the rehabilitated water point and in which community organizations already functioned well.72
68 World Bank 2000. 69 For evidence linking CDD with improved sustainability, see Narayan 1995 and World Bank 1996. 70 World Bank 2000. 71 Narayan 1995 and World Bank 1996. 72 Narayan 1995.

Tools and Practices 9
157
India A community-based nutrition outreach program in 9,000 villages in Tamil Nadu reduced severe malnutrition in the state by one-third. Twenty women interested in health issues were hired in each village as part-time nutrition educators accountable to the communities they served. With skills and networks developed through participation in the program, these groups of women, formed initially to “spread the word,” became entrepreneurs, branching off to start food production activities on their own. Earlier programs focusing only on the creation of health infrastructure had been unable to make any difference in the nutritional status of children. 73 Following are more detailed reviews of community-driven development initiatives in Malawi, Zambia, Romania, and Tunisia.
Malawi Social Action Fund Launched in 1996 with a total investment of $71 million over 5 and a half years (World Bank $56 million), the Malawi Social Action Fund (MASAF) focused on alleviating rural poverty through community-based action. Targeting the 60 percent of the population that is considered poor, MASAF was the lead strategy for the Government of Malawi’s Poverty Alleviation Program. Closed in December 2001, MASAF provided funding to communities for the upgrading and construction of community infrastructure such as schools, health facilities, community water points, rural-urban markets, and granaries. MASAF II, funded for 1999–2003 at $70 million, was designed to respond to the fact that the most disadvantaged groups did not benefit significantly from the first round of MASAF financing, mainly because of the limited ability of these groups to organize themselves and approach MASAF directly. In order to better serve these groups, MASAF II partners closely with intermediary NGOs and community organizations that are already working with underserved populations to develop and support subprojects specifically designed for marginalized groups, including orphans, street children, persons with disabilities, the elderly, and people affected by HIV/AIDS. Program Achievements The majority of projects – 79 percent or 656 projects – carried out under MASAF II are in the education sector\.74 Thirteen percent are in the water sector; 4 percent are in the infrastructure and communications sector, covering roads, bridges, and post offices; and 3.7 percent are in the health sector. Rapid progress in project implementation has meant that disbursement of all funds for community subprojects was completed three years ahead of schedule. The program has had significant impacts in the communities where projects have been undertaken. For example, when communities controlled the type of projects they chose and implemented, they tended to select projects that better matched community needs and interests.
73 Narayan 1995. 74 This section is drawn from de Silva and Kamwendo 2000, which presents an assessment of local stakeholder perspectives on MASAF carried out by the World Bank in 2000.

Tools and Practices 9
158
Many communities have opted for micro-projects such as small dams, wood lots, and water tanks. Others have identified civilian police units as a priority, to check high crime rates and protect property. Few top-down development schemes would have taken note of this preference, or even been aware of the urgent need of poor people for better policing. Economic rates of return for subprojects have ranged from 15 percent for secondary education projects to 50 percent for boreholes, far ahead of the 10 percent standard for projects deemed “successful.” Construction costs have been lowered sharply through local participation and contracting—by as much as 20 percent in the case of boreholes, for instance. The gender impacts of the program have been quite significant, as women have benefited from increased participation and better access to services and incomes. An average of 30 percent of Project Management Committee members are women, including a significant number who hold leadership positions such as treasurer or secretary. In education, gendered impacts include higher enrollment rates and lower dropout rates and reduced attrition of older girls, helping to delay the age of marriage. Women’s access to health care (especially maternal care) has improved where health facilitates have been constructed, and emergency health care has improved due to better roads built by the project. In terms of employment, MASAF has created 1,350 jobs for women, 26 percent of the total 5,111 jobs made available by the project.75 Subprojects under MASAF II are also meeting the needs of some vulnerable groups. For example, the Friends of Orphans subproject has provided housing, nutrition, nursing, and schooling to more than 1,200 orphaned children.76 MASAF II and Community Empowerment MASAF is the first social fund in Africa that empowers communities to choose projects and also gives them the responsibility for implementation, contracting, and accountability. Communities identify local priorities, contribute 20 percent of the project cost, and receive matching funds from the central government and donors. The Project Management Unit manages the day-to-day operations of the Project, including appraisal and approval of subprojects and supervision of operations at the zone level. In the “Community Contracting” approach, individual subprojects are identified, executed and managed by a Project Management Committee (PMC). The PMC, elected by and composed of community members, controls subproject finances, receiving funds in tranches of 30, 40, 20, and 10 percent. Communities also have the freedom to choose subproject facilitators – either NGOs or technical experts – rather than have facilitators chosen for them by the central management office. Using a learning by doing approach, the program is addressing participant complaints with the project, most commonly involving delays in disbursement of project funds. Delays in releasing tranches have often halted subproject implementation for long periods of time, causing contractors and wage laborers to lose interest and money. Such delays are usually due to poor
75 World Bank 2001b. 76 Malawi has hundreds of thousands of orphans, the vast majority of them orphaned by AIDS. At the end of 1999, according to UNAIDS, there were 277,000 children under age 15 in the country who had lost either their mother or both parents to AIDS.
Tools and Practices 9
159
financial reporting by communities and/or delays in the processing of financial reports at the project management level. Even those PMCs that have undergone the necessary training have found it difficult to complete the required financial reports. Access to information The project includes an information, education, and communication (IEC) component geared to generate public support for the project and disseminate project information widely. 77 Through radio messages, posters, bus advertisements, and personal contacts, prospective stakeholders are given a clear understanding of the norms of the project, the roles they are expected to play, and their responsibilities in project implementation. Dissemination of this information has brought about a distinct change in the relationships between poor communities on the one hand and NGOs and government district extension staff on the other. Communities have made it clear to NGOs that the communities themselves will make final decisions in choosing, designing, and implementing projects. Community attitudes toward the district administration have changed from passive acceptance of whatever is handed down to active participation in ensuring that the administration’s extension staff deliver on their responsibilities in project management and implementation. Within communities, where elites traditionally are seldom challenged, free access to project information has opened the way for pointed questions to local authorities regarding the use of funds, the quality of materials purchased, the selection of contractors, and many other community concerns. Members of Parliament who attempt to influence procurement or contracting have been, for the most part, kept at bay by the communities. The most significant impacts of this free flow of information are better working relationships between stakeholders and increased trust. Adversarial relationships have in many cases been replaced by growing respect. For example, the fact that the project has a gender focus has been communicated widely, prompting women to insist that they should be part of project subcommittees and encouraging their active participation in decision making regarding the community’s priority needs. Inclusion/participation One zone manager reports that participants believe the project has empowered them and restored their dignity by allowing them to play an active role in their own development.78 In fact, the community response and participation has been unprecedented, exceeding all initial expectations. Before a public launch of subprojects is carried out, MASAF requires a “launching ceremony” in which at least 50 percent of the adult population in the community must participate – a practice that embeds community ownership, accountability and responsibility for subprojects.79 According to an assessment of local stakeholder perspectives in 2000, participation by the larger
77 This section draws on World Bank 1998. 78 MASAF management divides Malawi into 12 zones. Kamwendo 2001. 79 Mandala 2002.

Tools and Practices 9
160
community has been much greater during subproject identification and planning than during implementation. 80 Accountability/enforcement Several mechanisms to ensure accountability have been incorporated into the project design. First, Project Management Committees are democratically elected by the communities to promote accountability to their constituents in managing the implementation of subprojects. Community auditing and inter-community exchange visits enforce the accountability of the PMC to the communities at large. Also, a monitoring and evaluation system tracks the level of participation, particularly of women, in community projects, and assesses project impact on female beneficiaries. It is primarily the Project Management Committee and not the larger community that is involved in contracting and procurement, as well as supervision during implementation. In nearly all of the communities visited for the assessment, PMC members see themselves as accountable to MASAF and not necessarily to the larger community. Community leaders do not feel it is their role to actively provide oversight to the PMC. The matching grant approach ensures that communities own the projects to which they have contributed and increases their incentives to ensure effective project management and implementation. Disbursement of funds is done in tranches of 30, 40, 20, and 10 percent, enabling good performers to be rewarded and bad ones penalized. Communities see the tranche system as both a negative and positive feature. While some PMCs note that tranching allowed them to gradually build their expertise in handling large sums of money, others consider it a burden, noting that delays in project implementation are most often linked to late disbursements. However, while decreasing the number of tranches would greatly reduce the administrative burden both on the community and on the MASAF administration, it would also reduce community oversight and control.
Zambia Social Investment Fund The Zambia Social Investment Fund (ZAMSIF) was launched in May 2000 with a commitment of $130 million, the third social investment fund for Zambia following the largely successful Social Recovery Projects (SRP) of 1991–2000.81 ZAMSIF represents a shift from its precursors, in that it emphasizes community-driven development set within a framework of strengthened local government. Over a span of ten years (2000–2010), ZAMSIF aims to upgrade skills in the country’s 57 District Councils, creating elected local bodies with assured sources of income. ZAMSIF’s major innovation is a district graduation program, which rewards districts that achieve performance benchmarks with additional resources. Project Components ZAMSIF incorporates three major components:
80 de Silva and Kamwendo 2000. 81 SRP I and II financed community-managed investments for the construction or rehabilitation of social and economic infrastructure and supported capacity building at the district level.

Tools and Practices 9
161
The Community Investment Fund finances small projects for basic infrastructure (education, health, rural water supply and sanitation, roads); natural resources management projects; capacity building, basic skills training, and other activities to stimulate local productivity; and special programs targeting vulnerable groups (orphans, people with HIV/AIDS, etc.). Subprojects are identified, prepared, implemented, managed, and maintained by the community. Communities contribute roughly 15 percent of the cost of each project in cash, in kind, or as a combination. There are five levels of increasing district participation in the project cycle, corresponding to various levels of responsibility and involvement. At the final stage districts are expected to be able to perform all steps of the project cycle. The District Investment Fund aims to strengthen districts’ own facilitation of community-based development and strengthen the planning, management, and implementation capacity of local authorities and community members. It finances larger infrastructure investments that benefit more than one community, such as district health facilities and marketplaces. District authorities are expected to gradually take the lead in planning, managing, and financing such projects, initially by managing resources allocated on a project-by-project basis, and eventually by managing a district allocation grant. ZAMSIF is targeting investments in districts with the worst social and poverty indicators, focusing on strengthening the accountability of district staff to poor communities. The Poverty Monitoring and Analysis (PMA) component aims to improve the sustainability and usability of poverty data collection and analysis. The component also finances a range of activities to strengthen the institutional, technical, and financia l framework for sustainable monitoring and policy use of poverty information. This includes support for the development of pilot District Data Banks. ZAMSIF and Community Empowerment The community investment component of ZAMSIF has substantially increased decentralization of decision making and devolution of responsibilities to local levels. Further, there is a critical shift in emphasis, from community intervention as a “project” to community intervention as an ongoing opportunity for social development and increased access to information. Hence, the process of community-managed development is not tied to time-bound delivery of inputs or outputs under a micro-project, but focused on a process of community empowerment. Assistance for a community’s development efforts is expected to continue with or without ZAMSIF support, and the program supports capacity-building activities that aim to encourage this. Under ZAMSIF, the emphasis is no longer on outputs or achievements measured against targets, but on the outcomes of project activities. Indicators of success have changed from, for example, number of classrooms constructed to broader social and human development gains such as school attendance, teacher-pupil ratio, women’s participation, and so forth. ZAMSIF’s monitoring system now collects information on these outcomes, with communities taking part in monitoring the outcomes of their projects themselves. To ensure that vulnerable groups participate in and benefit from projects, communities identify these groups and take steps to

Tools and Practices 9
162
involve them in decision making about the project. Activities that address their specific needs are included in the project design. Between July 2000 and June 2001 ZAMSIF received 222 proposals and approved 72 projects countrywide, with a commitment of $6.3 million under the Community Investment Fund component. Education projects made up more than half of those financed, with a total of 44 projects receiving $3.8 million. Other projects were in the categories of health (15), water and sanitation (8), infrastructure (4), and food security (1). To reach more communities, ZAMSIF has simplified its guidelines for accessing support and has translated these guidelines into the seven major local languages. Access to information ZAMSIF promotes access to information about the project through information sessions with communities given by trained facilitators or NGOs, dealing with such topics as the environment, HIV/AIDS, and gender. The intent is to redress the imbalance in information access faced by poor and isolated communities, and to catalyze new community projects to address these issues. To further project promotion, ZAMSIF is using both radio and print materials to reach communities. Future outreach plans include providing communities implementing projects with wind-up radios and encouraging them to form radio listening groups. The project will also provide pamphlets and leaflets on HIV/AIDS to every community-managed project. In July 2001 ZAMSIF concluded an intensive nationwide awareness program that involved a series of radio programs in English and the seven major local languages and a television documentary about the project. In addition, project staff conducted “awareness workshops” at the provincial and district levels to ensure that the people for whom the project was designed know how to access ZAMSIF funds. Information workshops were also held for members of Parliament as they are an important conduit of information to communities. Project staff noted that inquiries from communities seeking support from ZAMSIF regional and central offices increased significantly after the provincial, district, and other awareness workshops. To support the dissemination of research and resources on poverty, a Poverty Monitoring and Analysis (PMA) Resource Center has been established at project headquarters as a “one-stop shop” for researchers, policy makers, and the public to obtain poverty-related data and resources. The first phase of creating the center involves documentation, classification, and creation of a database of consultants. The PMA resource center has registered more than 120 consultants on its database, including specialists in environment, poverty, social policy, drought, food security, education, health and gender. The database is being used by ZAMSIF, the United Nations, government ministries, development organizations, and NGOs to identify experts and consultants. The resource center is also making key documents available to poverty researchers and practitioners. ZAMSIF is designing and preparing to launch a website for the PMA component that will allow the public to access most documents online. Local organizational capacity ZAMSIF is training 13 regional facilitators to enhance the participation of communities in the project cycle activities. With skilled facilitation, the quality of community participation is improving, giving voice and power to all in a community.

Tools and Practices 9
163
Communities build capacity through three mechanisms: (a) learning by doing, with development of manuals for project management and advice offered by district and ZAMSIF staff during implementation; (b) training modules, delivered by trained facilitators using participatory techniques and adult learning methods, covering topics such as HIV/AIDS, gender sensitization, environmental appraisal and management, procurement, financial management, equipment maintenance, etc.; and (c) skills training for community members in, for example, home-based care, counseling, entrepreneurship, health care, and veterinary care, and other appropriate community-based services. Accountability Through the District Investment Fund, special attention is given to financial management and accountability. Each district is allocated a specific amount of money, based on poverty and deprivation indices, and these figures are widely known at the local level. The rate at which the district funds are used depends on how well the district administration facilitates, plans, manages, and coordinates district development. As districts improve their capacity, the benefits to the district improve. In this way ZAMSIF aims not only to build the capacity of district staff but also to improve their accountability in relation to the communities they serve.
Romania Social Development Fund The Romanian Social Development Fund (RSDF) was established in 1998 as an independent, nonprofit organization with a twofold objective: to improve the livelihood of poor rural communities and disadvantaged groups, and to increase social capital in beneficiary groups by strengthening levels of trust and organizational and self-help capacities. Using the RSDF mechanism, poor communities take the lead in articulating their priorities and in designing and implementing demand-driven subprojects. Communities are eligible to receive funding for small-scale infrastructure subprojects, community-based social services, and income and employment generation activities, with beneficiaries expected to contribute amounts equivalent to 10–15 percent of RSDF grants to the project. To complement these activities RSDF provides technical assistance for increasing local organizational capacity. In the process of implementing projects, communities not only satisfy their specific urgent needs, but also increase their ability to identify and prioritize needs, to mobilize and manage resources, and to design, implement, operate, and maintain their own projects. Total RSDF funds are approximately $45 million, comprising a $20 million IBRD loan (in two phases), a Romanian government contribution of $5 million, and approximately $20 million from other donors. Program Achievements After two years, initial outcomes from the RSDF are encouraging. Achievements for 1999–2000 include the following:

Tools and Practices 9
164
• 1,332 subproject applications were received, of which 833 have been appraised. Of these, 290 projects have been awarded funding, including 195 infrastructure projects, 56 income generation projects, and 39 community-based social service projects.
• 48 villages received “facilitation,” a process that helps them determine their own assets and needs and express them collectively.
• 233 community-based organizations from villages and 21 NGOs working with disadvantaged groups have been trained in RSDF project management regulation, accounting, and procurement procedures—a step toward increasing local organizational and self-help capacity.
A beneficiary assessment completed by the project in 2000 indicates that RSDF funding has directly contributed to increased quality of life in beneficiary communities. It has also bolstered communities’ self-confidence in their ability to address local issues themselves and increased social capital by strengthening social interaction and trust. For example, 83 percent of polled villagers who participate in RSDF projects say they are “relatively content” or “very content” about relationships among the inhabitants of the village, versus 72 percent of polled villagers not participating in RSDF projects. In contrast, the 1998 public opinion barometer showed that 57 percent of polled people were relatively or very content with other villagers. Similar increases were reported for trust: 44 percent of polled villagers participating in RSDF projects say they trust other people, versus 33 percent of polled villagers not participating in RSDF projects. In contrast, a 1999 public opinion poll showed that 31 percent of the sample believe that most people can be trusted and the 1998 public opinion barometer showed 25 percent trust. Program Design Targeting RSDF targets poor communities and, within these communities, particularly disadvantaged groups. First, poverty maps are used to identify poor counties and regions of Romania. Poor communities are then identified according to specific criteria including isolation, lack of normal access to safe water, lack of electricity, lack of railway facilities, distance to school for school-age children, and distance to a medical doctor for the majority of the villagers. Next, eligibility criteria are used to target disadvantaged groups within the communities—typically drawn from populations of children, women, and the elderly—who cannot satisfy their basic needs through their own efforts. Criteria include lack of access to universal social assistance programs and lack of assistance from family members or informal social networks. The RSDF uses intermediaries, such as NGOs, local authorities, and community-based organizations, to assist with identification and mobilization of disadvantaged groups. The types of services offered to these groups and the low subproject financing ceiling also ensure that only the poorest will be encouraged to apply. Eligible activities Eligible communities may receive RSDF funding for the following activities:
• Small-scale infrastructure, maximum RSDF grant of $75,000. This comprises small-scale rehabilitation/repair, upgrading and building works for the provision of social

Tools and Practices 9
165
infrastructure such as local water supply, latrines, sewerage, and community centers, and economic infrastructure such as roads and bridge repair. A minimum contribution of 10 percent of the RSDF grant is expected from beneficiaries either in kind or in cash.
• Community-based social services, maximum RSDF grant of $20,000. This includes
services, shelters, and life skills development for children, home care for disadvantaged elderly, shelters or services for the homeless, and legal assistance services for accessing all social protection programs. NGOs working in partnership with local authorities provide these services. Community groups are asked to contribute up to 5 percent of the RSDF grant.
• Income-generating activities and employment opportunities, maximum RSDF grant of
$20,000. To strengthen the capacity of productive groups in poor communities, funds are provided for technical assistance, institutional support, business skills training, and assistance in network building and strengthening. Activities include processing and marketing wood, wool, fruits, vegetables, milk, meat, or other locally available raw materials; producing and marketing handicrafts; market and storage facility rehabilitation; solar tents and greenhouses; and community bakeries. A minimum contribution of 15 percent of the RSDF grant is expected from the productive group.
Role of RSDF Identification, design, and implementation of subproject activities are managed directly by communities and disadvantaged groups. RSDF supports these efforts but limits its role to the following activities:
• Promoting and disseminating information on the activities and eligible subprojects, as well as helping target beneficiaries and disadvantaged groups to identify their needs and design subprojects;
• Designing the assessment, selection, and approval mechanism for subprojects submitted by the target beneficiaries;
• Concluding the grant agreement with the beneficiary representatives; • Making disbursements for subproject implementation; • Supervising and evaluating subproject implementation; • Assessing the execution of the grant agreement based on the financial auditing expertise.
RSDF and Community Empowerment In transitional economies, community-driven approaches such as those adopted by the RSDF present a distinct set of challenges. The philosophy of RDSF is directly contrary to the historically top-down command organization of economies and societies in the Eastern European region. Through its operations, RSDF promotes the formation and development of the kind of bottom-up informal associations that have traditionally been stifled in these countries. By providing access to information, ensuring social inclusion and community participation, promoting accountability, and strengthening local organizational capacity, RSDF has created an enabling environment for communities to mobilize their resources and increase the ir physical and human capital, producing self-sustaining institutions within the communities and enhancing physical and social welfare.
Tools and Practices 9
166
Access to information A facilitation process has been developed as an integral component of the project. The main objectives of facilitation are to inform poor rural communities about RSDF subprojects, opportunities, and eligibility criteria, and to enable them to organize and submit high-quality subproject proposals. At the same time, facilitation seeks to increase the participation of community members in the decision-making process, develop local problem-solving capacity, and stimulate local initiative. RSDF provides information directly to potential beneficiaries through organized itinerant communication campaigns. These target poor villages within the poorest districts of Romania. Beneficiaries themselves are also directly involved in information dissemination to their communities through television, radio, and newspapers. This same information is reinforced through many communication channels. For example, television and radio reporters as well as journalists are encouraged to talk directly to project beneficiaries, and these interviews have provided the best publicity for the social fund. Today, beneficiaries’ voices are regularly heard on national radio, which is the primary mass media channel accessible to poor rural communities. Inclusion/participation Under RSDF the inclusion of disadvantaged groups occurs at every stage of the subproject cycle. Results of the October 2000 beneficiary assessment after two years of implementation show strong community participation in program identification, selection, and development. Under RSDF, facilitators assist communities in organizing and participating in meetings where needs and priorities are discussed. Communities also contribute to subproject costs (usually in kind), and are responsible for subproject implementation, including procurement and contracting. The level of community participation and commitment is a key element considered by appraisers and supervisors in evaluating subproject applications. In a community survey considering different aspects of an RSDF project, 180 out of 189 approving votes were recorded. Community contributions to projects were made in the form of materials, money, and labor, and were supported by contributions from the financed organizations (social service organizations) and local government. According to the survey, about 70 percent of inhabitants of communities with a financed project had at least one person in their family who contributed. It was typically more difficult to raise financial contributions from communities for small infrastructure projects, as people are more wary of contributing money than of contributing labor or materials. In general, it was found that two factors positively influenced community participation: (a) active involvement of local authorities in helping to mobilize communities; and (b) increased social cohesion among community members, which provided social pressure and resulted in a higher level of voluntary participation. It was found that community participation, confidence in coordinators, and quality of work were superior in more cohesive communities, even when projects were more difficult.

Tools and Practices 9
167
Accountability The RSDF encourages community organizations to elect a three-person Project Management Committee (PMC), consisting of a president, treasurer, and secretary, which becomes responsible for managing the subproject (including funds) and is accountable both to the community and to RSDF. The whole community is involved in monitoring activities through checking the quality of work done by contractors and keeping track of funds spent and outcomes. As a result of this process, communities learn how to hold local authorities accountable for using resources judiciously through monitoring and information dissemination. In addition to being able to monitor activities of local authorities, communities that participate in RSDF come to better understand the decisions made by local authorities regarding use and allocation of public funds. Local organizational capacity Throughout the subproject cycle RSDF plays a critical role in increasing local organizational capacity. In the initial stages RSDF provides access to information, which empowers community groups to voice their needs. The facilitation process then identifies and promotes community leaders and leadership, organizes community meetings, and supports participatory decision making, assisting communities in developing the skills to identify and prioritize demands. Before implementation, the capacity of community organizations and PMCs is strengthened through training in order to develop appropriate knowledge and skills to manage the subproject. Supervision is provided during project implementation to encourage communities to become self-confident and gain control over their assets and resources.
Tunisia: Northwest Mountainous Areas Development Project The Tunisia Northwest Mountainous Areas Development Project was prepared in 1993 as a follow-up to a successful rural development project that built basic infrastructure such as schools, clinics, roads, and potable water.82 One of the key lessons from the infrastructure project was that sustainability of investments in the region could not be expected without the participation of local communities. Accordingly, the second project, funded at $26.02 million, used an integrated participatory approach to encourage local participation, with the broad objectives of improving the well-being of the region’s population and arresting degradation of the natural resource base. Specifically, the project aimed to: (a) promote increased involvement of village organizations in development activities; (b) promote measures to increase on-farm and off- farm income generating activities; (c) improve the management and productivity of range and farm land; (d) promote measures to reduce erosion, run-off, and reservoir sedimentation; and (e) improve social conditions of the disadvantaged population by providing basic infrastructure and social services. Program Achievements
82 This section draws from World Bank 2001c.

Tools and Practices 9
168
Results of the program have been impressive in a number of areas, including improvements in income, basic infrastructure, education, and environment.83 Incomes. Family incomes from agricultural production on small farms improved, in real terms, from TND 1,113 per year in 1998 to TND 1,429 per year by 2000, a difference of TND 316 a year. Yearly incomes from medium farms improved from TND 3,141 to TND 4,135, a difference of TND 994. These represent real annual growth rates of 6.3 percent and 6.9 percent for small and medium farms respectively.84 Basic infrastructure. The percentage of beneficiary populations having difficulty with access to water and/or rural roads was reduced from the baseline estimate of 48 percent to 18 percent by 2000. The average distance from potable water was reduced from 1.5 kilometers in 1996 to 0.8 kilometers by 2000. The construction and rehabilitation of rural roads contributed significantly to increasing access to basic services in these remote areas, as well as to expanding the possibilities for trading surpluses with markets outside their immediate areas. Education. The project constructed several schools, raising the percentage of surveyed villages that were close to a school from 39 percent in 1996 to 46 percent by 2000. It is estimated that the building of schools, coupled with improvements in rural roads, contributed to reducing average illiteracy rates from baseline estimates of 60 percent to approximately 44 percent. Environment. On the whole, there has been a significant shift to agricultural systems that are more compatible with natural resources management. The project emphasized soil and water conservation activities, which brought about increased filtration rates and higher crop and tree survival rates. In addition, as a result of the increased water retention capacity of the soils, the adoption of perennial crops increased from the baseline estimate of 45 percent to 55 percent by 2000. The Tunisian Project and Community Empowerment The Integrated Participatory Approach Priority activities were identified jointly with the beneficiary populations and presented in a Community Development Plan (CDP), which was valid for a five-year period. The plan outlined the most urgent needs of the population, presented the socioeconomic context, and most importantly, specified how each party would participate to achieve set goals. In addition, the CDP outlined the improved technical solutions that would be used, making it a guiding tool for extension workers and specialists who would implement the activities with the populations. To implement the plan, the beneficiary populations signed yearly contracts with Sylvopastoral Development Authority for the Northwest (ODESYPANO), a Tunisian NGO.
83 The project defined several criteria based on socioeconomic, technical, and environmental factors, which were measured at three intervals during implementation. A baseline survey was conducted in 1996, followed by surveys in 1998 and 2000. The 1998 survey covered 527 families in 51 Development Committees. In 2000, 259 families in 28 Development Committees were surveyed. 84 The three farm sizes considered during project implementation were: small farms, those under 5 hectares; medium farms, 5 hectares up to 20 hectares; and large farms, 20 hectares and larger.

Tools and Practices 9
169
The participatory approach was successful in encouraging the adoption of improved technical solutions. Adoption of technical solutions was higher when the demonstrations were on farmers’ lands, mainly because the farmers were able to exchange information on a regular basis. In addition, farmers participated in selecting the type of demonstration and the site, which increased project ownership at the community level. This strategy helped raise the number of households participating in the Community Development Plans. In a survey of four CDPs, for example, the number of participating households increased from 183 to 258 within five years. Local organizational capacity After consultations between extension workers, technical specialists, and interested local communities, the communities formed local Development Committees, which functioned as intermediaries between the program administration and the beneficiary population. Active committees—those that held frequent meetings to give and gather information, resolve internal conflicts, and train CDP members—generally resulted in a higher level of community participation in project activities, increasing the benefits of the Community Development Plans. By organizing the local communities into groups, the project was more efficient in building beneficial relationships with the local communities as well as building their capacity to participate in project activities. A total of 162 Development Committees were established by 2000, with a total of 103 Community Development Plans prepared. More than 290 contracts signed with ODESYPANO had been completed or were under implementation. In addition, a total of 361 Integrated Action Contracts (CAI) were signed. These were designed as an interim measure in response to the rising demand from local communities to participate in development activities once the project’s results became better known. The CAI allowed implementation of priorities jointly identified with the populations to be jumpstarted without preparation of a CDP, a process that took at least two months. Despite their timeliness in addressing the immediate priorities of a community, an evaluation of the CAIs showed that since communities using these contracts received less technical assistance and training, their programs were less likely to be sustainable. As a result, after a two-year period, the implementing unit stopped the preparation of new CAIs and the numbers of such contracts fell from a high of 104 in 1996 to only 48 in 2000.
Resources Aiyar, Swaminathan S. 2001. “Progress of Community Driven Development in Zambia.” World
Bank, Community Driven Development Group Anchor, Washington, D.C. Available: http://essd.worldbank.org/cddwk2000.nsf/9a0da286b06474fe852569f30061c879/c459233174149b1585256a6b00776daf?OpenDocument
de Silva, Samantha, and Christine Kamwendo. 2000. “Community Contracting in the Malawi
Social Action Fund: Local Stakeholder Perspectives.” Africa Region Findings 163. World Bank, Africa Region, Washington, D.C. Available: http://www.worldbank.org/afr/findings/english/find163.htm

Tools and Practices 9
170
Kamwendo, Christine. 2001. “MASAF Presentation: Working with Vulnerable Groups.” Presentation at the World Bank, Washington, D.C., June 5.
Narayan, Deepa. 1995. “Designing Community Based Development.” Social Development Paper
Number 7, Environmentally and Socially Sustainable Development Network, World Bank, Washington, DC. Available: http://essd.worldbank.org/intranet/icdb.nsf/D4856F112E805DF4852566C9007C27A6/D59BB2FB9CAAD9DD85256A790061D9A5/$FILE/sdp07.pdf
Sandi, Ana Maria, and Christina Vladu. 2000a. “The Romanian Social Development Fund and
Community Empowerment.” World Bank, Washington, D.C. ———. 2000b. “What Is the Romanian Social Development Fund.” World Bank, Washington,
D.C. World Bank. 1996. “Designing Community-Based Development.” In The World Bank
Participation Sourcebook. Washington, D.C.: World Bank. Available: http://www.worldbank.org/wbi/sourcebook/sba211.htm
World Bank. 1998. “The Role of Information, Education and Communication in the Malawi
Social Action Fund.” Africa Region Findings 30. World Bank, Africa Region, Washington, D.C. Available: http://www.worldbank.org/afr/findings/infobeng/infob30.htm
World Bank. 2000. “The Community Driven Development Approach in the Africa Region: A
Vision of Poverty Reduction through Empowerment.” Africa Region, Washington, D.C. Available: http://essd.worldbank.org/cddwk2000.nsf/Gweb/AFR_vision_en
World Bank. 2001a. “Community-Driven Development Typology.” CDD Anchor Unit,
Washington, D.C. Available: http://essd.worldbank.org/cddwk2000.nsf/SearchDocView/8F2C9A3E6EA55FA585256AF8006CDC6D?OpenDocument
World Bank. 2001b. “Good Practice in Lending: Multi-Sector Projects Incorporation Gender
(Malawi Social Action Fund Project).” GenderNet, Washington, D.C. Available: http://gender/resources/examples/good_practice_lending/masaf/multimalawi.htm
World Bank. 2001c. “Northwest Mountainous Areas Development Project (Ln. 3691-TUN).”
Report No. 22390-TUN. Middle East and North Africa Region. Rural Development, Water, and Environment Group. Washington, D.C.
World Bank. 2001d. “Why Community Driven Development: Key Points and References.” CDD
Anchor Unit, Washington, D.C. Available: http://essd.worldbank.org/CDDWk2000.nsf/9a0da286b06474fe852569f30061c879/e8777cc955fedb6485256a2e0000fd1c?OpenDocument
Tools and Practices 9
171
Websites Romania Social Development Fund http://frds.ong.ro/e_index.html World Bank Community Driven Development http://essd.worldbank.org/CDDWk2000.nsf/GWeb/Home Zambia Social Investment Fund http://www.zamsif.org.zm/zamsif/index.html

TOOLS AND PRACTICES 10
Empowerment in Education Sustained access to effective basic services—including health care, education, water, and basic infrastructure—is of primary importance in the lives of poor people. Improvements in the quality and consistency of services must be approached first of all by addressing institutional and governance models to make them more responsive to the needs of poor people. At the same time, important steps can also be taken at the local level to address the specific needs and goals of each community. Education is an area in which expanding the involvement of community actors has led to marked improvements—higher enrollments and better quality schools. Examples from around the world show that when communities can hold teachers, administrators, and government officials accountable through formal institutional mechanisms, community members become more interested in school improvement and more willing to commit their own resources to the task. This commitment may include forming partnerships with outside actors. Furthermore, programs that expand the access of excluded groups to education have led to important shifts in mind-set among community members and government leaders regarding the contributions that those groups can make to society. The success of small pilot efforts, often with the inspiration and involvement of devoted “champions” at different leve ls of government, can lead to fundamental changes in the governance of the education system at the national level. These changes include creating formal channels for the participation of local actors in the management of their schools and widely expanding access to education, with a shared commitment of resources among all concerned actors.
Madagascar: Community Schooling and National Development In the early 1990s, enrollment in primary education in Madagascar was declining due to a lack of investment, deteriorating quality, and demoralization of parents and teachers.85 More than 2,500 public primary schools had been closed, mostly owing to a lack of teachers, and almost all 13,500 schools needed major repairs. Schools lacked educational materials and professional support. Most of all, they lacked the support of their communities. At the end of 1993, a decision was made to closely involve local communities in the improvement of basic education in the public primary schools. The idea of a school-based contract emerged from the vision of one official and his management team, a senior civil servant responsible for primary education who was transferred to one of the six provinces. With World Bank support, and prompted by the results of an education sector study, a team of innovative
This note was prepared by Bryan Kurey (PRMPR), under the overall guidance of Deepa Narayan (PREM). 85 This section draws on Viens and Lynch 2001a, 2001b.

Tools and Practices 10
173
decision makers initiated PRAGAP, a program for strengthening pedagogical and administrative management in primary education. The guiding principles of PRAGAP, developed during the first stages of the program, include:
• Those responsible for education at the local and regional levels are at the service of parents and pupils for the achievement of national educational objectives.
• The state cannot do everything: effective participation of parents and local authorities is a must. However, it is important that each party respect its own commitments to the letter.
• The school contract can and should contain all the actions that the local community perceives as priorities. Such actions might include, for example, the assignment of a teacher, the repair of classrooms, the construction of a home for the teacher, or the making of classroom benches.
• All schools within the administrative district should benefit from being able to prepare and sign a contract. Some may decline, but all should have the opportunity to engage in such a process.
• In view of the limited budgetary resources, the government’s contribution will be restricted to the provision of a sufficient number of teachers, to be matched by a complementary World Bank project86 in funding the repair of classrooms or the construction of new ones.
• Other priorities, such as the construction of teacher housing, the sinking of a well, the provision of a water point, the accommodation of a school yard, or the building of a boundary fence will depend on the local community.
• A minimal local contribution is demanded for each school contract, either in goods or in cash.
• Each contract can be unique, given that it is prepared and negotiated in a particular community and reflects the priorities identified by that community.
Community Mobilization The program began in two districts in one of Madagascar’s six provinces, and later expanded to 20 districts (out of 111 total) across all six provinces. All program implementers first articulated and recorded a clear vision of aims, with the primary focus being the improvement of the pupils’ learning. It was recognized from the start that program administration would have to be flexible in order to respond to the real needs of the community. This implied a fundamental rule, supported by the provincial champions of the program: listening and being open to new ideas. Such an approach required basic changes in attitude and behavior on the part of government officials, in terms of their relations both with their education colleagues at all levels and with the local village communities. This first phase of direction setting was followed by community mobilization and training, including meetings and workshops, visits to schools, and exchanges of information and points of view. The aim was to empower parents, village leaders, and other community members to take
86 Known by its French acronym CRESED, the project contributed $39 million to support the initial phases of PRAGAP, with the primary goal of establishing institutional bases in subsectors concerned with curriculum, teacher training, and the management of education systems.
Tools and Practices 10
174
responsibility for education in their schools. These meetings often focused on issues such as poor enrollment or attendance by pupils and teachers, dropping out and grade repetition, lack of parental involvement, weak accountability of teachers and local authorities, poor condition of school buildings, and lack of educational resources in the schools. School Councils and School-Based Contracts Each community was invited to set up a representative School Council as a mechanism for directly involving community members in decision making regarding the schools. Representatives included teachers, parents, and village members. The School Councils then signed contracts with local representatives of the Ministry of Education, spelling out plans to improve education in the community and specifying the commitments to be made by the local community, teachers and staff, and district and regional authorities in the pursuit of agreed plans. In devising and implementing the school-based contracts, all parties were expected to bring to the table their expertise, vision (image of the school in one, two, or three years), resources (labor, money, commitment to send children to school), and willingness to act. Investment depended on initial actions by the local community. When the first visit to the community resulted in agreement on a few practical actions for implementation by community members, the second visit would be used to assess achievement of these commitments, and a decision would be made on further action, including whether to prepare a school contract. Entering into these contracts, which were based on community needs and availability of resources, encouraged each community to recognize its role, along with that of the central and local authorities, in the transformation and improvement of their schools. Results After visits to 237 schools in the two pilot districts, a considerable majority of the local communities held meetings, identified priorities, fulfilled their obligations, and prepared a school contract. Four months from the launch of PRAGAP, 235 negotiated school contracts were submitted to the authorities for their consideration. During the pilot phase of the program, achievements included the following:
• 462 primary teachers were transferred within the province of Mahajanga, and 25 public primary schools were reopened;
• New enrollments in the first year of the primary cycle increased by 26.5 percent between 1993–94 and 1994–95;
• A new organizational structure within the Provincial Directorate of Education at Mahajanga was adopted;
• Local management teams were organized in the two school districts. The average cost of each school renovation was estimated at US$481 for an average of 103 pupils (1994–95), or approximately US$4.70 per pupil, including construction materials and direct administrative funds for the management of the program. These early positive outcomes motivated the management teams at the district, provincial, and national levels to extend the PRAGAP approach to the other five provinces of Madagascar. In

Tools and Practices 10
175
the 20 school districts of phase two of PRAGAP, enrollments in year one of the first cycle increased by 28 percent between 1993–94 and 1995–96, almost twice the increase observed at the national level over the same period. The lessons of PRAGAP served as the basis for formulation of a new national education policy, in place since 1996. This policy stresses the absolute priority of primary education, the importance of improving the quality of education and training at all levels, and the need to mobilize the energies and commitments of parents, communities, and beneficiaries, as well as the private sector and civil society. In December 1997, the government of Madagascar adopted the Second National Improvement Plan for Education, based on three principles:
• Centered on the child: each action or activity has to be measured for its impact on the child and his/her learning;
• Based on the school: the school in its community and environment is seen as the fulcrum for change and action; and,
• A bottom-up approach: information and data drawn from a school’s experience should be used by local partners to make continuing improvements in the quality of learning.
Preparation of the second national plan, as well as its dissemination among national and international partners, led to the institutionalization of the school-based contract at the primary level throughout the system, as well as to similar institution-based contracts in higher education and vocational training. From 1998 to 2000 the PRAGAP approach was gradually adopted and applied to all programs and projects in more than half of all school districts in Madagascar.
El Salvador: Community Managed Schools Program After a decade of civil war, approximately one million of El Salvador’s children were not in school in the late 1980s.87 The national enrollment rate for basic education was around 80 percent, and poor rural communities in particular suffered from a lack of schools and teachers. In 1989, Cecilia Gallardo de Cano took the role of minister of education as a reform proponent from the “modernizing” wing of the conservative ARENA party. Under her leadership, the Ministry of Education identified expanding access to and quality of basic education as a central policy objective, both to strengthen national unity and to promote long-term economic development. The ministry began a comprehensive reform of El Salvador’s traditional education system, with the objectives of decentralizing the education bureaucracy, improving the quality of education, expanding coverage at all levels, strengthening administrative capacity, and promoting participation by private and nongovernmental actors. One of the first steps was the piloting of a new decentralized model of service provision in rural areas, the Community Managed Schools Program (EDUCO). The program initially targeted the poorest 78 (out of 221) municipalities and was driven by the urgent need to restore basic education services quickly. The three main aims of the EDUCO program are to:
87 This section draws on World Bank 2000 and El Salvador Evaluation Team 1997.

Tools and Practices 10
176
• Increase the supply of educational services in the poorest rural communities; • Promote the participation of local community members in their children’s education; • Improve the quality of pre-primary and primary schooling.
The EDUCO program built on the demonstrated willingness of communities to participate. While providing technical assistance to build capacity, it delegated the management of new rural preschool and primary schools to parents and community organizations. In the course of developing the program, the ministry began to work, for the first time, with local NGOs that supported program implementation. Community Education Associations The program emphasizes the direct involvement of parents in their children’s education. To facilitate this involvement, each EDUCO school has a Community Education Association (ACE), composed of and run by elected parents and community members. The ACE is legally responsible for running the school, including its budget and personnel. It can hire and fire teachers and is responsible for supervising their performance and attendance. The Ministry of Education transfers funds directly to the ACE’s bank account, and the association administers these funds according to its assessment of the educational needs of the school. The bulk of the transfer is used to pay teachers’ salaries according to their contract with the ACE. ACEs are able to raise additional revenues by negotiating with other government agencies and international donors as well as by mobilizing local support, including in-kind support. Information Dissemination, Consultation, and Communication Strategies By 1993, the pilot program demonstrated clear results in restoring services to the poor and empowering local communities. Enrollment rates rose in rural parts of the country. Parents reacted very positively to being taken seriously and given key responsibilities, such as the hiring and firing of teachers. However, despite this success pilot, the Ministry of Education found little support for the program at the national level. The EDUCO experience had changed some attitudes and perceptions among education officials, but the new approach was not well understood outside the ministry. There had been little public discussion or consultation when the program was developed. In general, policy changes were made in an unsystematic way, contributing to a lack of transparency and continued skeptic ism on the part of teachers, communities, and political opposition groups. In light of this, the Ministry of Education began to organize seminars with teachers and other key stakeholders to discuss the EDUCO experience and its use as a model for broader efforts to promote a decentralized approach. The teachers’ association, ANDES, feared that new authority given to parents might lead to arbitrary hiring and firing, and they expressed strong opposition. These concerns were addressed through dissemination of the EDUCO experience, through creation of new job opportunities for teachers, and by having EDUCO teachers defend the decentralized approach, citing the increased involvement and support of parents.
Tools and Practices 10
177
Between November 1994 and February 1995, a social assessment was undertaken during preparation of a ministry project to support basic education reform in El Salvador. In the absence of formalized communication channels, the assessment provided valuable feedback to ministry officials about the perceptions and misperceptions of key stakeholders. Local consultants conducted focus groups, in-depth interviews, and a case study to learn the views of Ministry of Education staff, teachers, parents, and students. Parents were suspicious of government motives and expressed concern that the ministry was planning privatization of education or a closer link to municipal governments, which were seen as highly politicized and as lacking the capacity to manage education. The study revealed a high level of mutual distrust between the government and approximately 110 NGOs active in the education sector. But it also demonstrated that the end of the civil war and the new emphasis on democratic procedures were beginning to have a positive impact on government accountability. The ministry declared 1995 as the Year of Consultation on the Reform Process. The government established a National Commission for Education, Science, and Development which helped to launch a national dialogue about education, and from that dialogue produced a report outlining a broad, conceptual approach to reform. Results The commission’s report provided the conceptual basis for a detailed, ten-year plan for the Ministry of Education that formalized broad commitments for expanding access to education. Although some key reforms in curriculum and other areas had been undertaken previously, this marked the start of a more formalized, comprehensive reform process. The plan defined a set of measures and programs in support of four objectives: (a) increasing access to education and improving literacy; (b) improving the quality of education; (c) promoting the formation of values; and (d) modernizing institutions. New legislation prepared and approved in 1995, included the Law on Higher Education, the Law on the Teacher Promotion/Profession, and the General Law on Education. Reforms were undertaken within the ministry to address administrative bottlenecks. As implementation began, in 1996, the government launched a formal communications program. Its goals were to build public support for reforms, open permanent channels within the ministry and with the public, and receive feedback from key stakeholders, including the ministry, parents, teachers, students, and NGOs. Overall, enrollment rates in rural areas of El Salvador increased from 76 percent in 1991 to 83 percent by 1993. By 1999, more than 237,000 children were enrolled in the EDUCO network of schools, up from 8,400 in 1991. In these schools dropouts rates have plunged, and fewer students fail. The portion of students repeating grades fell from 23 percent in 1994 to 15 percent in 1998. The World Bank has supported the program through three loans totaling $148 million.

Tools and Practices 10
178
India: Uttar Pradesh Basic Education Project In 1992 the government of India presented an educational reform proposal to the World Bank with the objective of assisting Uttar Pradesh (UP), one of India’s poorest states, through a statewide primary education initiative targeted at improving the status of women and girls.88 With female literacy rate in UP third lowest in India, and the estimated enrollment rate of children aged 6–10 fourth lowest, the UP Basic Education Project aimed to increase female enrollment, reduce dropout rates, improve academic achievement, and strengthen community ownership of schools. Mechanisms for Community Participation From its inception, the project sought community involvement. Surveys and focus group discussions identified a wide range of educational issues at the village level, from caste discrimination to the language of instruction to the impact of weather on educational opportunities. In some villages, girls were not attending school because of their responsibility to care for younger siblings. In other places, the issue was girls’ safety. One of the key elements of the UP pilot project was the development of local Village Education Committees (VECs). These committees directly involve all interested community members, including women and minority groups, in the process of making decisions and setting goals for the schools. VECs are involved in school construction, community mapping, monitoring teacher attendance, and processing funds from the government. Capacity Building for Sustainability By the mid-term review in 1993, the UP project had developed an in-service teacher training program, which was also decentralized at the level of village blocks and clusters. These local efforts were supported by improved capacity building for Institutes of Education and Training at the district level and through the creation of a State Institute of Educational Management and Training. The government of India independently hired educational specialists who shadowed World Bank staff working on the project to learn from their expertise and ensure the sustainability of the program. The government had been accustomed to running top-down programs, so developing a program that took its direction from the ground up was a new approach. Local politicians have promoted the UP project’s educational objectives; they were pleased to find an approach that worked at the community level and that they could champion as their own regardless of which government was in power at the state level. Results The results of strengthening community involvement in schools through VECs in the UP Basic Education Project have been impressive. Targets set for female participation in primary 88 This section draws on World Bank 2001.

Tools and Practices 10
179
education were exceeded. The enrollment gap between boys and girls decreased, and dropout rates for girls were halved. Learning achievement improved in 8 of the 10 districts, particularly in the second grade, and as a result of this project, 2 million girls are in school who otherwise would not be. In reviewing the outcomes of the UP project, the government agreed that the decentralized approach worked effectively and decided that the project was exactly the kind of primary education program needed nationally. In 1995, the program was scaled up to the national level through the District Primary Education Project.
Bangladesh: Female Secondary School Assistance Project In its fourth five-year plan, the government of Bangladesh set a goal of raising the female literacy rate from 16 to 25 percent and ensuring that women participate in all aspects of national life.89 The principal objective is to create employment opportunities for women in primary and secondary schools, health care, family planning, agriculture extension departments, and self-employment programs run by nongovernmental organizations. The Bangladesh Female Secondary School Assistance Project (FSSAP), initiated in 1993 as part of that plan, is an example of a targeted project designed to encourage greater participation and inclusion of girls in schooling, and in the process change mind-sets regarding the value and contributions of females to society. Specific economic, cultural, and religious factors in Bangladesh combine to depress demand for girls’ education. As a result, many girls either never enroll in school or withdraw from school earlier than boys. Educational attainment of women in Bangladesh is among the lowest in the world, with only 20 percent of women able to read and write, according to the 1991 census. During the early 1990s, the disparity of access between girls and boys was most significant in secondary schools. Only one-third of students enrolled in secondary school in 1990 were girls, and the number of girls completing secondary school was less than half the number of boys. Low female schooling is largely due to the fact that, unlike primary school, secondary education requires payment of tuition fees, in addition to other costs such as transportation, books, uniforms, school supplies, and examination fees. In a culture where daughters are considered economic liabilities, many parents are not willing to make such investments in their education. Project Design and Expansion The FSSAP, budgeted at about US$88 million, has a twofold objective: to reduce constraints to enrolling girls in secondary education, and to promote positive community values regarding the education of girls. Of the program’s six components, the most important is a stipend program for girls, ranging from US$12 per year in grade 6 to US$36 per year in grade 10, which addresses the direct costs of educating girls in secondary school by assisting with personal and tuition costs in all grades and book and examination fees in upper grades. Other components include: (a) salaries of additional teachers, particularly females; (b) occupational skills training for girls related to market demand in both wage and self-employment; (c) activities to promote public 89 This section draws on World Bank 1999; World Bank 2002; and Liang 1996.

Tools and Practices 10
180
awareness regarding the benefits of female education; (d) toilets, tubewells, and water supply and sanitation programs at schools; and (e) capacity building at national and local levels. Initially, the FSSAP was to be implemented in two overlapping phases in 118 rural thanas (subdistricts), with 59 thanas starting in 1994 and another 59 in 1997. These thanas were identified using combined criteria of income level, female literacy level, and female attendance level. During the first phase, community support became so widespread that the first applicants were about double the original estimate. The government of Bangladesh decided not only to implement the FSSAP in all 118 thanas in 1994, but also to expand the stipend concept into a national Female Secondary Stipend Program in 460 rural thanas. In addition to the government’s contribution, support for the program is provided by the World Bank through IDA ($68 million), by the Norwegian Agency for Development Cooperation, and by the Asian Development Bank. Project Mechanisms for Enhanced Image and Inclusion of Girls Mechanisms were put in place during the project design to encourage the direct involvement of both schools and parents in the process of changing community mind-sets and behavior regarding female education. In order to receive the stipends associated with the program, schools are required to sign cooperation agreements with the government confirming participation in the project. Once registered, the schools have the following obligations:
• Help create public awareness and encourage girls to enroll; • Issue warnings to girls not fulfilling the requirements; • Accept the tuition fees from the project at a rate decided by the Ministry of Education; • Assist eligible students in filling out the student application form; • Maintain a roster book, assigning a unique ID number to each applicant.
Similar mechanisms are at work in the design for parental involvement. Eligibility for and continuation of stipends depends on parents agreeing that their daughters will:
• Attend school for at least 75 percent of the school year; • Obtain at least 45 percent marks in the annual examination; • Remain unmarried throughout the secondary school certificate exams.
In addition to setting up schools and parents as agents of social transformation, the program is designed so that girls contribute to their own empowerment by taking responsibility for payments of fees beyond tuition. The tuition part of the stipend is paid directly to the school where the girl is enrolled, but the rest of the subsidy is paid directly to the girl in two annual installments through a savings account in her name at the nearest Agrani Bank branch in the project district. The girls are responsible for paying all fees beyond tuition, such as session fees and examination fees, directly to their schools immediately on return from the bank. The image this promotes of girls bringing resources into the community and paying their own way is a significant departure from traditional norms. Results The growth in girls’ secondary school enrollment in the project thanas is far above the most optimistic projections. Since inception, the number of girls enrolled in the program has

Tools and Practices 10
181
increased each year and for every class the program has covered. In project areas, enrollment more than doubled from 462,000 in 1994 to over one million by 2001. By July 1997, the gap between girls’ and boys’ enrollment in the project area had been virtually eliminated, and close to 100 percent of primary-age girls are now in school. In addition, the overall proportion of 13-15 year old females who married in project areas declined from 29 percent in 1992 to 14 percent by 1995, and from 72 percent in 1992 to 64 percent in 1995 for girls aged 16-19. In March 2002, as a result of the impressive success of the FSSAP program, the World Bank approved a second round of the project, FSSAP II, with an IDA credit of $120.9 million. Up to 1.45 million girls are expected to participate in schools covered under FSSAP II. In addition to expanding the stipend program, FSSAP II will include components to improve access to and quality of education to all students in 5,000 schools in the project areas. This will involve teacher training and support, and incentives focusing on learning outcomes. The number of female secondary school teachers is to be increased, and mechanisms are being introduced to encourage participants and communities to take a more active role in ensuring better educational results and improved management of schools.
Colombia Education Voucher Program
In Colombia, low government spending on secondary education has greatly limited the availability of public secondary schools to poor people, forcing them to choose whether to spend their limited incomes on private schooling or let their children go without a secondary education. 90 About 14 percent of fifth-grade students drop out of the system; many of them would have continued in school if a public school were available or private schooling were affordable. Colombia’s targeted education voucher program91 was launched in 1992 with the aim of increasing low-income students’ participation in secondary education. By providing vouchers to students without access to public secondary schools, the program allowed these students to enroll in selected private schools with excess capacity. 92 In five years of implementation, the program enabled more than 125,000 children living in the poorest areas of Colombia to attend secondary school. Targeting Poor People The design of Colombia’s program avoided some criticisms commonly made against voucher plans. The program guaranteed that levels of funding for public schools would not decrease, even if their enrollments should fall, thus mitigating concerns that vouchers draw resources from already underfunded public schools. In addition, by law, only poor people qualified for the program. Strict eligibility requirements were imposed for both students and secondary schools. Students had to reside in a poor neighborhood, one located in the two lowest strata of a neighborhood stratification scheme that ranks neighborhoods from poorest to richest. During the 90 This section is taken from a summary write-up provided by Harry Patrinos (HDNED). It draws from Angrist 2001; King and others 1997; King, Orazem, and Wohlgemuth 1998; and Patrinos 1997. 91 Programa de Ampliación de Cobertura de la Educación Secundaria (PACES). 92 The maximum voucher value was initially set to correspond to the average tuition of low-to-middle-cost private schools. Vouchers became less generous over time, not keeping up with inflation, and participants had to supplement vouchers with additional payments to cover school fees.
Tools and Practices 10
182
application process, students’ families had to verify their socioeconomic status, usually by presenting a utility bill containing the status classification of their neighborhood. The program was a partnership between local governments and the national government, supported in part by the World Bank, with participating municipalities paying 20 percent of costs and the national government contributing the remaining 80 percent. It was designed to offer municipalities a short-term, cost-effective, efficient option for expanding access to secondary schooling. The National Ministry of Education signed an agreement with each participating municipality setting forth the terms and conditions of the voucher, and the financial and administrative arrangements. Municipalities determined the number of vouchers required, certified that private schools met the requirements for participation, and jointly monitored the progress of the program with the Colombian Institute for Education Credit and Training Abroad (ICETEX), a public institution mainly handling administration of study-abroad programs. ICETEX charged 3.5 percent of the central government’s share of program costs to pay for administrative costs related to meetings between students and schools, publicity efforts, implementing the voucher system, and monitoring the program. Results Throughout the program, demand for vouchers exceeded supply in almost all participating municipalities. In most of these cases, a lottery was used to select recipients. Depending on location, between 20 percent and 90 percent of qualifying applicants received vouchers. The program significantly increased educational opportunities for poor people, with a considerable increase in enrollments at a low cost to the government. By 1995, about 90,000 vouchers were being used by students in 1,800 private schools in 217 municipalities, and by the end of the program, more than 125,000 students had been reached. Three years into the program, voucher recipients were 15 percentage points more likely to have attended private school, had completed 0.1 more years of schooling, and were about 10 percentage points more likely to have finished eighth grade, primarily because they were less likely to repeat grades. Students who participated in the program scored 0.2 standard deviations higher on standardized tests than those who did not. Furthermore, voucher students were less likely to be married or cohabiting as teenagers, and worked about 1.2 fewer hours per week, suggesting an increased focus on educational achievement.
Resources
Angrist, Joshua, Eric Bettinger, Erik Bloom, Elizabeth King, and Michael Kremer. 2001. “Vouchers for Private Schooling in Colombia: Evidence from a Randomized Natural Experiment.” NBER Working Paper w8343. National Bureau of Economic Research, Cambridge, Mass.
El Salvador Evaluation Team. 1997. “El Salvador’s EDUCO Program: A First Report on
Parents’ Participation in School-Based Management.” Working Paper Series on Impact Evaluation of Education Reforms No. 4. Ministry of Education, National Research and

Tools and Practices 10
183
Evaluation Division, El Salvador, and World Bank, Development Economics Research Group, Poverty and Human Resources, Washington, D.C.
King, Elizabeth, Peter F. Orazem, and Darin Wohlgemuth. 1998. “Central Mandates and Local
Incentives: The Colombia Education Voucher Program.” Working Paper Series on Impact Evaluation of Education Reforms No. 6. World Bank, Development Economics Research Group, Washington, D.C.
King, Elizabeth, Laura Rawlings, Marybell Gutierrez, Carlos Pardo, and Carlos Torres. 1997.
“Colombia’s Targeted Education Voucher Program: Features, Coverage, and Participation.” Working Paper Series on Impact Evaluation of Education Reforms No. 3. World Bank, Development Economics Research Group, Washington, D.C.
Liang, Xiaoyan. 1996. “Bangladesh: Female Secondary School Assistance.” Draft. World Bank,
Human Development Department, Washington, D.C.. Available: http://www.worldbank.org/education/economicsed/finance/demand/case/bangladesh/bangladesh_index.htm.
Patrinos, Harry Anthony, and David Lakshmanan Ariasingam. 1997. Decentralization of
Education: Demand-Side Financing. Directions in Development. Washington, D.C.: The World Bank.
Viens, Daniel, and James Lynch. 2001a. “PRAGAP: The Birth of an Innovation. Community
Schooling and National Development in Madagascar.” World Bank, Washington, D.C.
———. 2001b. “Madagascar: A Developmental Approach to Community-Based School
Management.” Africa Region Findings 175. World Bank, Africa Region, Washington, D.C. Available: http://www.worldbank.org/afr/findings/english/find175.htm.
World Bank. 1999. “Pioneering Support for Girls Secondary Education:
The Bangladesh Female Secondary School Assistance Project.” South Asia Brief. South Asia Region, Washington, D.C.
———. 2000. “Reform of Basic Education in El Salvador.” Action Learning Program on
Participatory Processes for PRSP. Participation Thematic Group, Social Development Department. Available: http://www.worldbank.org/participation/web/webfiles/eseducation.htm
———. 2001. “A Social Development Saga: India Uttar Pradesh Basic Education and India
District Primary Education Projects.” Social Development Notes 55. Environmentally and Socially Sustainable Development Network, Washington, D.C.
———. 2002. “Bangladesh: Girls Education Gets US$121 Million in World Bank Support.”
Press Release 2002/232/SAR. World Bank, Washington, D.C.

TOOLS AND PRACTICES 11
Institutional Innovations to Support Micro, Small, and Medium Enterprises
Many governments of developing countries perceive micro, small, and medium enterprises (SMEs) as engines of employment, poverty alleviation, and broad-based economic growth. Growth and development of SMEs in developing countries can increase poor people’s opportunities, security, and empowerment. This note presents examples of two types of commercially viable innovations that increase productivity and growth of SMEs in developing countries: business networks and clusters and venture capital to small enterprises through a combination of equity investments and technical assistance.
SME Network and Cluster Development In order to better compete in the marketplace, micro, small, and medium enterprises in the same or related industries can form business collectives. Partnerships among businesses in geographic proximity are called “clusters,” while businesses that team up to work on a joint development objective are called “networks.” The term “networking” characterizes the overall process of building business relationships, whether through clusters or networks. SMEs team up for sound economic reasons, including the opportunity to procure raw materials and other resources more efficiently, the availability of customized business development services, the abundance of clients attracted by the cluster, and the presence of a skilled labor force. Such partnerships reduce costs for individual enterprises through economies of scale and raise profits through industry development. Cooperation among firms can also create a learning environment in which firms can exchange ideas and knowledge to improve products and profits. The following examples explore how business networks and clusters can be supported, yielding benefits to both firms and economies. Broadening SME Networking in Nicaragua In 1995, the United Nations Industrial Development Organization (UNIDO) and the government of Nicaragua formed a partnership to develop a strategy for strengthening small and medium enterprises in the country. The technical assistance program promotes networking, understood as relations between enterprises (and between enterprises and institutions) that allow the SMEs to overcome their isolation and achieve new collective competitive advantages unattainable by individual firms. The program also helps develop local institutions that facilitate the networking process by helping to forge a joint entrepreneurial vision and build capacity to implement that
This note was prepared by Radha Seshagiri (PRMPR), under the overall guidance of Deepa Narayan, (PREM).

Tools and Practices 11
185
vision through common development projects. These network brokers act as “system integrators” at the local level, facilitating the development of relationships between the enterprises and optimizing the use of available technical and financial services. The joint Nicaragua-UNIDO initiative to foster the growth of Nicaraguan SMEs emphasizes local capacity building. The national consultants working in the project are local professionals with no international experience and no direct knowledge of cluster or network practices or policies. The project therefore invests in training for them to upgrade and specialize their skills, which is expected to result in improved services to the enterprises. Project consultants are also training “network brokers” to expand network creation capabilities and multiply results throughout the country. Network brokers are selected from locally active institutions, especially entrepreneurial ones, and from other technical assistance projects. The project also seeks to diversify its activities to include the training of new network brokers, the promotion of industrial districts or clusters, and the promotion of industrial integration along production chains (large enterprises subcontracting to SMEs, with emphasis on upgrading of the small firms that serve as suppliers). The initiative has resulted in growth of clusters and networks among Nicaraguan SMEs. Twenty networks were created within two years by a team of seven national consultants, assisted by short-term international consultants. More and more local institutions are demanding the services of network brokers. The project was invited to assume an important role in the National Committee for Competitiveness and Sustainable Development, made up of high- level policy makers and representatives from the private sector and academia, and is contributing to the dialogue around design of an overall SME development policy. The early support for and involvement in this business networking project by the Nicaraguan government has been important to its success. First, the project has had easy access to local policy dialogue and formulation around business development and has been able to propose business networking as a key SME development strategy for Nicaragua. Network promotion has now become one of the main instruments of the government’s approach to private sector support. Second, public sector involvement has made the project a model of interinstitutional coordination and, as a result, has enabled the project to have greater access to local people and resources. Third, public sector involvement has brought about a much clearer prospect for sustainability of the project. The long-term expectation is that the networking project will be taken over by the public sector counterpart and eventually become an independent agency. EcoHamaca: Networking Hammock Producers One successful example supported by this initiative is Ecohamaca, a network of 11 small enterprises in Nicaragua producing handcrafted hammocks. Each enterprise employs about 15 people and competes with the other hammock producers in the local market. After consultations with UNIDO experts at the beginning of 1997, the producers were convinced of the need for closer collaboration in order to develop and carry out an export strategy. They subsequently applied for UNIDO support in March 1997. By August of that year, the group had gained formal legal status as a producer association and had a standing constitution signed by all 11 members. Through the UNIDO networking project, producers received technical assistance to help standardize their production so that they could collectively improve the quality and design of

Tools and Practices 11
186
their products, develop pricing systems, and produce quantities suitable for export. In order to offer a more eco-friendly and exportable product, the group changed the wood used for the poles (from cedar, which is close to extinction, to other more abundant exotic species) and shifted from chemical to natural dyes. The producers have agreed on the common brand name, “Made in Masaya,” in order to promote a local identity. By 1999, the network was exporting more than 3,000 hammocks a month, with regular customers in Sweden, Finland, the United States, and Peru. In order to advance their common work and maintain their competitiveness, EcoHamaca has hired a manager whose tasks include identifying more formal training opportunities for the producers, securing additiona l technical and financial assistance from local SME support institutions, and developing a stronger marketing strategy that capitalizes on the Internet. Hand-Block Printed Textile Cluster of Jaipur, India Jaipur, Rajasthan, India is home to a group of artisans specializing in hand-block printing, a form of fabric printing that uses ethnic designs and traditional, eco-friendly vegetable dyes to produce colorful textiles. More than 550 small firms engage in both hand-block and screen printing and employ almost 10,000 workers. In the 1980s and 1990s, as national and international demand for hand-block textiles grew, traditional hand-block printers in Jaipur failed to keep up. Increasing competition from substitute products also began to squeeze the artisans out of the market. UNIDO conducted a diagnosis of the artisan group in 1996 and offered recommendations to help revitalize these small businesses.93 The recommendations included developing clusters—interlinked similar enterprises in a particular sector—in order to promote cooperation and collaboration and thus achieve greater gains than would be possible for the enterprises individually. UNIDO also recommended fostering cooperative relations between the public and private sectors to develop a coordinated industrial policy, identify and implement coherent actions, and support entrepreneurship. For the hand-block artisans, the result has been a revitalization of their business cluster, greater access to international markets, and a restructuring of activities to meet growing demand. Revitalizing the hand-block cluster UNIDO’s study assessed constraints to the cluster and the potential for growth. It identified an unexploited potential for traditional artisans in the cluster to target profitable national and world markets. Constraints included lack of an active association, limited capacity, and inadequate access to financial services. The resulting action plan aimed to promote traditional production methods and improve the living standards of the artisans. The plan envisaged restructuring the cluster and improving linkages among the different enterprises; enhancing the design, production, and marketing capacity of the firms; developing a product image to meet market demand; and improving business support services.
93 UNIDO’s 1996 survey of small-scale enterprise clusters in India found that there are 350 industrial clusters and approximately 2,000 rural and artisan-based clusters throughout the country. These clusters account for approximately 60 percent of manufactured exports from India (Clara and others 2000).

Tools and Practices 11
187
Has it worked? As a result of the UNIDO intervention one dormant artisan association, Calico Printers Co-operative Society (CALICO), has been revitalized. Its membership has increased from 26 artisans in 1997 to 120 by 1999, and a common showroom has been created. In addition, after two years of UNIDO assistance four new formal networks (three of women) and four informal networks had been created. The Consortium of Textile Exporters (COTEX) has also been formed. By 1999, of the 155 firms involved in the whole hand-block cluster, 40 have expanded their capacity; 20 have been exposed to international markets; 25 have improved their design capacities; 80 have been registered with various institutions to provide regular market linkages; 15 have received bank credit; 22 have trained in visual merchandising; and 55 have trained in marketing and entrepreneurship. India’s National Bank for Agriculture and Rural Development played a key role in the growth of the cluster. Following the bank’s 1998 contribution of 15% of costs for the cluster artisans to participate in a product fair in Jaipur City, collaboration within the cluster improved considerably. Other agencies, working in partnership with UNIDO, also made contributions. Small Industries Development Bank of India (SIDBI) and the National Institute of Design initiated activities related to marketing training, design development, technical training, and introduction of an innovative credit mechanism. SIDBI has also adopted the cluster for further intervention under its Rural Industrialization Program. Commercial banks have also begun playing a role in development of the hand-block cluster. Lending by commercial banks to these small-scale businesses was suspended in 1991 following a flood tha t deprived the artisans of their collateral. Once the hand-block cluster was reestablished with UNIDO assistance in 1997, the president of CALICO, a respected businessman from Sanganer, successfully negotiated an agreement with the banks for the resumption of lending to the small businesses. CALICO smoothed the financing process by providing collateral on behalf of its members to secure the loans and by screening applications before submission to the commercial banks. In a matter of months, 15 loan agreements were signed between local banks and CALICO members. The supply of loans has increased so dramatically that bank managers have been known to reach out to CALICO to inquire about upcoming projects and identify potential loan recipients. The cluster has progressively relied on fewer subsidies as it has developed. UNIDO’s contribution declined from 50 percent in the first product fair in 1998, to 7 percent at the last fair, a year and a half later.
Small Enterprise Assistance Funds (SEAF) Small Enterprise Assistance Funds is a U.S.- and Dutch-based NGO that aims to foster economic development and entrepreneurship in developing and transitional countries. Spun off from the development organization CARE in 1989, SEAF began by pursuing operations in Central and Eastern Europe, then expanded to Latin America. It is now branching out to operations in Asia. With $140 million under management in 2001, it has made over 160 investments valued at about

Tools and Practices 11
188
$45 million, and manages a network of 14 commercially driven investment funds around the world. Individual investments range from $100,000 to $1.5 million, with SEAF holding a minority equity position of 25–49 percent. SEAF funds companies that are too small to interest most mainstream foreign investors, commercial banks, or public development banks, typically those with 10 to 100 employees and annual revenues of $200,000 to $2 million. Its approach is similar to that of a venture capital firm. As an active shareholder, it provides donor-funded technical assistance and fee-based services to help the firm grow, and exits the firm when it has reached a point of maturity, usually after five to seven years. While SEAF is a nonprofit with a development objective, it manages each of its investment funds as separate, for-profit entities. At the end of 2000, the average company in SEAF’s portfolio saw a revenue increase of 80 percent. Employment growth was also strong: 7,000 jobs have resulted from the funds’ investments. As of April 2000, SEAF had sold nine of its 37 investee companies, earning a 32 percent return. SEAF typically begins operations in a particular country or region by launching an SME equity fund to serve emerging enterprises, then seeks promising firms that need outside capital and management support to grow. Once it identifies a firm, SEAF takes a minority equity position in the firm and helps it grow by providing technical assistance. SEAF’s “equity plus assistance” model provides technical assistance along with funds to develop capacity in SME management and expertise, and builds a relationship with firm managers to achieve growth. Technical assistance in financial management, marketing, accounting, and other fields are provided to the firm for a fee. Specialized consultants funded by donors are also available if needed. SEAF has found that this customized support to firms has helped small firms grow rapidly. It recovers approximately 50 percent of its costs through fees and return on equity, while the remainder is financed by loans or grants from development institutions. Examples of SEAF Investments Bolivia: Jolyka Flooring Company In Cochabamba, Bolivia, SEAF helped to restructure management operations of a small flooring company, Jolyka. After making an investment of $860,000 in 2000, SEAF helped the company restructure its balance sheet and negotiate its debt to achieve greater profitability. The new structure of the company has helped production; annual revenues have risen from $850,000 to $2.2 million. SEAF has also helped to negotiate contracts with major U.S. firms and introduced Jolyka to trade shows in North America. Poland: Holding Centrum Bookstore A typical example of a company that has benefited from SEAF assistance is Holding Centrum in Poland, which grew from a start-up of 86 employees run from its founder’s apartment into a nationwide chain of 50 bookstores with 446 employees. Technical assistance grants from donors also helped the firm grow.

Tools and Practices 11
189
Estonia: Regio Maps Technology company Regio was the first firm in Estonia to receive assistance from SEAF, which provided Regio with strategic management advice to help expand its production and operations. Regio had focused its operations on sales of paper and digital maps. When SEAF invested $140,142 in 1998, acquiring a 28.6 percent stake in the company, it recommended moving into higher-value-added services and improving financial management, marketing, and business organization. In 2000, SEAF facilitated negotiations with the Finnish industrial group DONE to purchase Regio, which resulted in a Euro 3.9 million sale of 100 percent of Regio’s shares. IFC’s Role In 1996 SEAF began working with IFC through a $600,000 IFC/GEF line of credit. Since IFC’s subsequent 1998 investment in SEAF Macedonia, the two have collaborated to improve the efficiency and reduce management costs of SEAF’s operations. Since 1999, IFC has invested $17 million in four different SEAF-managed funds. SEAF receive $850,000 from IFC’s SME Capacity Building Facility in March 2001 to help the organization scale up and expand to several countries and regions.
Resources Ceglie, Giovanna, and Marco Dini. 1999. “SME Cluster and Network Development in
Developing Countries: The Experience of UNIDO.” Paper presented at the International Conference on Building a Modern and Effective Development Service Industry for Small Enterprises, organized by the Committee of Donor Agencies for Small Enterprise Development, Rio de Janeiro, Brazil, March 1999. Available: www.ilo.org/public/english/employment/ent/papers/cluster.htm
Clara, Michele, Fabio Russo, and Mukesh Gulati. 2000. “Cluster Development and BDS
Promotion: UNIDO’s Experience in India.” Paper presented at the International Conference on Business Services for Small Enterprises in Asia: Developing Markets and Measuring Performance, Hanoi, Vietnam, April 2000. Available: http://www.ilo.org/public/english/employment/ent/papers/unido.htm
International Finance Corporation. 2000. “Partner Profile: Small Enterprise Assistance Funds.”
SME Focus 1 (2): 6. Small and Medium Enterprise Department, Washington, D.C. Available: http://www.ifc.org/sme/html/sme_publications.html
———. 2001a. “The Power of Partners.” SME Focus 2 (2): 1–3. Small and Medium Enterprise
Department, Washington, D.C. Available: http://www.ifc.org/sme/html/sme_publications.html ———. 2001b. “Partner Profile: SEAF.” SME Fact Sheets, March. Small and Medium
Enterprise Department, Washington, D.C. Available: http://www.ifc.org/sme/html/sme_publications.html

Tools and Practices 11
190
United Nations Industrial Development Organization. “Cluster Development in India.”
Document 331112. Available: http://www.unido.org/doc/331112.htmls

TOOLS AND PRACTICES 12
Institutional Innovations in Financial Services for the Poor
Poor people represent a largely untapped market for financia l services. While some institutions are extending microfinance (very small savings, credit, and other financial services offered to a poor clientele), the supply is still far below demand. In recent years, several institutions have developed innovative ways to address the financial needs of the poor by offering new products to the marketplace that enable outreach to a much larger and more diverse population. This note highlights five examples of institutional innovations in provision of sustainable financial services to the poor:
• Accion International • BRAC in Bangladesh • Information technology applications • Kosovo’s Micro Enterprise Bank • Consultative Group to Assist the Poorest (CGAP).
ACCION International A pioneer in microfinance, ACCION International supports a network of independent institutions that between 1991 and 2001 provided more than $3 billion in loans to 2 million low-income borrowers in Latin America, the Caribbean, and the United States. It is an NGO with a private sector approach, one with a proven technical assistance model that helps poor people raise their incomes through entrepreneurship. ACCION’s work has demonstrated that, under the right regulatory conditions and with proper management and technology in place, microfinance can both serve the poor and earn profits—sparking the interest of some commercial banks to enter the field. The key, ACCION believes, lies in the strong technical support it provides to its network. ACCION considers its clients skilled business people, not objects of charity. With access to the basic tools of business—capital and training—ACCION’s clients can work their own way up the economic ladder, with dignity and self-respect. As their businesses grow, ACCION’s clients gain security and self-esteem and participate more fully in the economic, social, and political life of their communities, thus empowering themselves. One ACCION study in Latin America showed family income increased an average of 30 percent after a few small loans. With 27 years of microfinance experience in one hemisphere, ACCION took its model to Africa for the first time in 2001. Support from the World Bank Group’s SME Capacity Building Facility is enabling ACCION to help new microfinance partners in South Africa and Mozambique, while scaling up existing networks in Guatemala and Brazil. In each case the
This note was prepared by Radha Seshagiri (PRMPR), under the overall guidance of Deepa Narayan (PREM).

Tools and Practices 12
192
facility provides $100,000 to support ACCION’s work, for a total of $400,000. In South Africa, ACCION and local partners will create a new microfinance institution in the country’s North West Province. In Mozambique the work will center on strengthening an institution called Tchuma in the Maputo area, where only 5 percent of potential poor clients are currently being reached. ACCION also began work in Benin and Zimbabwe in 2001. The International Finance Corporate endorsed ACCION International by making its first direct investment in an ACCION affiliate, Compartamos of Mexico, in 2001. In the last 10 years Compartamos has developed a highly profitable lending portfolio serving 60,000 Mexican borrowers, mostly women. With technical assistance provided by ACCION and funded by the U.S. Agency for International Development, Compartamos spun off its microfinance operations into a separate for-profit entity, Financiera Compartamos SA. IFC is now supporting this new institution through $1.63 million in loans and equity investments, taking over 15 percent of the newly issued shares and helping to triple its number of borrowers by 2006.
BRAC: Extending Financial Services to the Extreme Poor Bangladesh is home to over 25 million people who are considered “extremely poor.”94 Women are particularly disadvantaged: they suffer from higher mortality rates, poorer health conditions, limited access to employment, and lower literacy rates than men (female literacy is 29 percent compared to male literacy of 45 percent).95 In 1985 the Bangladesh Rural Advancement Committee (BRAC) pioneered an innovative program to help extremely poor Bangladeshis, mainly illiterate and landless women, many of them widowed or abandoned. The Income Generation for Vulnerable Groups Development (IGVGD) program, jointly administered by the government of Bangladesh and BRAC, gives the extreme poor the opportunity to generate income, build skills, and become independent entrepreneurs. The IGVGD program has grown to become a national program. From 1991 to 2001, the program expanded to provide food grain assistance and savings and credit services to over a million participants. Nearly two-thirds of participants have moved out of absolute poverty, become mainstream microfinance clients, and no longer require government safety net programs.96 How It Works IGVGD enables the extreme poor, previously excluded from participation in financial institutions, to access mainstream microfinance programs. In partnership with central and local governments and the World Food Program, BRAC devised this program to help the extreme poor generate income through poultry farming, an activity in which more than 70 percent of rural landless women are directly or indirectly involved. The government and the World Food
94 Extreme poverty is defined as food consumption of 1,740 calories a day (Saleque 1999; Hashemi 2001). 95 Saleque 1999. 96 Saleque 1999; Hashemi 2001.

Tools and Practices 12
193
Program provide an 18-month stipend of free wheat while BRAC provides training in income-generating activities, human rights and legal education, nutrition, essential health care, and credit. Through this package of support, the program prepares women to earn a regular income after the subsidy ends. The IGVGD mechanism is designed to facilitate the entry of the poorest Bangladeshis into regular credit programs, and acts as a transition from a safety net to a longer-term development program. The IGVGD program has three main elements: food grain assistance, skills training, and financial services in the form of savings and credit. Elected representatives of local government first ident ify recipients of free food grain. BRAC then chooses households from this group to participate in the IGVGD program according to the following criteria: (a) they are headed by widows or abandoned women; (b) they own less than half an acre of land; and (c) they earn less than 300 taka per month ($6). Participants begin the program by training in poultry and livestock rearing, vegetable gardening, and other topics. They also begin saving a minimum of 25 taka ($5) per month with BRAC and attend weekly meetings. Once training is completed, BRAC provides credit to the beneficiaries as initial investment capital in two loan cycles. The first loan is for 2,500 taka ($50); once it is repaid, participants are given a second loan of 4,000 taka ($80). Once the second loan is repaid, participants are “graduated” to BRAC’s regular microfinance program, the Rural Development Program. 97 Evidence indicates that about 80 percent of participants stay on for the second loan while about two-thirds move on to regular microfinance membership.98 Results to Date The program’s combination of training, financial assistance, and food grain assistance has enabled participants to graduate from reliance on the government safety net to participation in regular financial services programs. From 1991 to 2001, the IGVGD program has grown to provide food grain assistance and savings and credit services to over a million participants. Nearly two-thirds of participants have moved out of absolute poverty and have become mainstream microfinance clients, and have not slipped back into requiring government safety net programs.99 During the June 1998 to June 1999 cycle alone, 180,900 women received training while 97,230 graduated to regular employment with the assistance of small loans from BRAC.100 The IGVGD program has had considerable success in reaching the extreme poor of Bangladesh. A recent longitudinal survey tracked household economic changes in IGVGD participants, starting before participation (1994), at the end of the program (1996), and three years later (table 1). Data suggest that in the early 1990s, while 16 percent of total households and 53 percent of the extreme poor did not own land in rural Bangladesh, nearly 80 percent of IGVGD participants were landless. By 1996, this number had fallen to 62 percent of participants. Similarly, 87
97 BRAC’s Rural Development Program has reached out to 3.3 million poor landless people since 1977. 98 Hashemi 2001. 99 Saleque 1999; Hashemi 2001. 100 Bangladesh Rural Advancement Committee 2001.

Tools and Practices 12
194
percent of IGVGD households owned no blankets (compared to 37 percent of the total extreme poor), a number which had fallen to 75 percent by 1999.101 Most participants have moved out of extreme poverty to become independent, viable entrepreneurs. The participants’ overall income has risen considerably after participation in BRAC’s IGVGD program, by more than 30 percent on average. Notably, the percentage of households engaged in begging declined dramatically, from 18 percent in 1994 to 2 percent in 1996, to 0 in 1999. Overall, program participants sustained their economic improvement, even three years after the program ended.102 Table 1 Household Economic Changes among IGVGD Participants Indicator of household economic status 1994
(pre-program) 1996 (end-program)
1999 (+3 years)
Households without blankets (%) 86 — 75 Households without beds (%) 42 40 36 Monthly income preceding survey (Tk) 75 717 415 Households earning more than Tk. 300 (%) 7 64 31 Households saving with NGOs (%) 11 34 37 Households begging (%) 18 2 0 Landless households (%) 78 62 — Households with no homestead land (%) 27 13 — Functionally landless households (%) 94 72 — — Not available. Source: Hashemi 2001.
Information Technology Applications Innovations in the delivery of financial services to poor people are emerging through the application of technologies which greatly increase efficiency and bring previously inaccessible services to poor people at lower costs. Two such examples are highlighted below: Smart card technology, and ATM services for poor people. Smart Cards: Innovative Banking Services for the Poor Smart cards, an emerging information technology tool, can be used effectively by financial institut ions to reach poor people. A Smart Card is a plastic card, akin to a credit card, on which both borrowers and lenders can record loan activity in lieu of tracking transactions on passbooks, collection sheets and loan ledgers. It allows the development of client history through electronic record. Smart card transactions are much faster than traditional teller transactions. They are easy to use, do not require literacy, and protect against fraud by forgery. The cards also leave a “transparent and tamper-proof” audit trail for reconciling accounts, thereby reducing central accounting time.103
101 Hashemi 2001. 102 Hashemi 2001. 103 Nelson 1999.

Tools and Practices 12
195
MFIs with a scale of operation classified as small and medium spend between 35 percent and 50 percent of their portfolios on overhead costs.104 By lowering costs, smart cards have the potential to greatly increase the efficiency of all MFIs, and particularly small and medium MFIs, while at the same time allowing them to reach large numbers of poor people. While commercial banks previously shied away from small business services due to high transaction costs, many banks have now become interested in doing business with poor people. Financial institutions in India and Swaziland are using smart cards with an embedded microchip containing information on the client’s credit history in order to reduce transaction costs and build credit history. India: Swayam Krishi Sangam Swayam Krishi Sangam (SKS) is a microfinance institution that operates in the Narayankhed area of Medak District in Andhra Pradesh, India, an arid area with many poor villagers trapped in perpetual debt to moneylenders. A recipient of one of the first CGAP Pro-Poor Innovation Challenge Awards, SKS was founded in 1998 by Vikram Akula, a son of Indian immigrants to the United States, who was inspired to expand financial services to the poor after visiting Muhammad Yunus and the Grameen Bank in Bangladesh. SKS targets the poorest 20 percent of the population by focusing its activities on the poorest regions and selecting individuals through key informant interviews and village surveys. A typical participant is a woman from a household that has an annual income of less than Rs. 20,000 ($450).105 SKS offers its clients two savings and four loan products that were designed through participatory processes. It provides general and seasonal loans at an interest rate of 20 percent, consumption loans from group funds at 0 percent interest, and emergency loans also at 0 percent interest. Most members take out a $50 general loan their first year and $100 their second year, and use the funds for enterprises related to land and livestock. SKS started using smart cards in August 2000 at one of its four branches to improve the tedious process of copiously recording all financial transactions at group meetings, which often took 90 minutes per meeting. SKS integrated the smart card into various stages of its operations. Staff members carry a handheld computer to group meetings in order to download collection information from the branch office computer. Members have a smart card that electronically holds their information and records transactions. A read-only computer is available in the village so that members can check their accounts (like an ATM). SKS plans to expand use of the technology to its other branches, and estimates that the time and financial savings will be substantial. The smart card will allow staff to hold three meetings a day instead of the current two, and even with additional costs of the cards and terminals, each branch
104 MicroBanking Standards Project 2001. Criteria for classification of scale of operations varies by region, based on size of gross outstanding loan portfolio. See additional analysis tables in source, p. 53, for more details. 105 SKS believes there has been up to 20 percent leakage into the next higher decile of the population, but this still makes SKS clients considerably poorer than most MFI clients.
Tools and Practices 12
196
will save about $2,000 annually. Computerization of financial records will also minimize errors and provide management with immediate client- level information. Swaziland: Swazi Business Growth Trust In Swaziland, the Swazi Business Growth Trust (SBGT), with donor assistance, issues smart cards to its small business clients. Clients use the smart card to obtain funds and repay loans at commercial bank branches around the country that have smart card reading terminals.106 SBGT maintains a line of credit with the commercial banks that provide this service free of charge to SBGT. SBGT downloads daily transaction information complete with cash flow analysis, which allows accurate and easy monitoring of disbursements and repayments. The system enables SBGT to act as a “virtual bank” within the nationwide banking network with smart card terminals. SBGT invested approximately $100,000 in the smart card technology and banking software. Future plans are to make transactions available by telephone and online and to expand to savings services. ATM Services for Poor People: E Bank, South Africa Standard Bank of South Africa has been a pioneer in demonstrating that a commercial bank can use market information and technological innovations to offer a bundle of services needed and valued by poor people at a fee high enough to cover costs. In 1993, Standard Bank created the affiliated E Bank to deliver basic banking services to the urban poor. E Bank offers services designed for low-income populations and convenient to access while keeping costs to the bank low. E Bank combines the innovative technology of modified ATM services with staff trained to help clients with basic electronic banking. E Bank offers a single savings account (no checking, no passbook) and all accounts of more than R 250 ($56) earn interest. Clients can obtain cash and deposit savings, and will soon be able to safely transfer money to relatives and others in the system around the country. 107 Depositors with regular minimum balances become eligible for drawings and prizes and automatically receive a modest amount (R 1,500, or $333) of life insurance coverage. E Bank outlets are nontraditional kiosks, conveniently located and open to the sidewalk, decorated with vibrant colors, with video displays for entertainment or instruction. The ATM screen shows graphic as well as text prompts. Each kiosk has three or four assistants who speak several local languages. More than 150,000 customers created E Bank accounts within the first year of operation. Costs of developing, marketing, and operations were borne by E Bank customers and E Bank was barely breaking even at the time. In 1996 it was merged with Standard Bank and renamed Auto Bank E and E Plan. A resulting feature is that E Plan cards can be used as point-of-sale cards at
106 The current cost is $1,000 per unit (a $500 version is being developed). 107 It costs Standard Bank R 4.58 per month to maintain an account. Transactions per account average about 2.8 per month. E Plan transaction fees are high relative to income and higher than the market on some transactions. Average daily balances for E Plan accounts is R 320 (US $71).

Tools and Practices 12
197
certain retail stores including Pick and Pay, the largest in the country. The fixed cost of managing E Plan accounts is half that of the traditional low-balance Plus Plan. In May 1997, Standard Bank converted 570,000 low-balance customers to the E Plan. In addition, E Bank attracted 600,000 new account holders in the 10 months between late 1996 and mid-1997. After three years in operation there are approximately 1.4 million E Plan account holders using 70 Auto Bank E centers. In 1997 there were about 18.5 million Auto Bank E transactions comprising 24.6 percent of all Standard Bank transactions. By 2002, the Bank expects more than 50 million Auto Bank E transactions, representing 42.5 percent of all transactions.
Kosovo Micro Enterprise Bank: A Microfinance Model During and after the recent conflict in Kosovo, the Micro Enterprise Bank (MEB-Kosovo), established in late 1999, emerged as a key player in the provision of financial services. The first and only regulated commercial institution in post-conflict Kosovo, MEB has taken in $53.2 million in deposits and built a loan portfolio of $1.2 million, comprising 311 loans to small and medium enterprises since its inception in January 2000. Despite the 100 new accounts that are opened each working day, demand still exceeds supply. After just six months of providing financial services to low-income clients, Micro Enterprise Bank was already showing a profit. Although the bank operates in one of the world’s most difficult business environments, strong repayment rates took its initial portfolio of $500,000 in small loans to nearly $5 million by the end of 2000. The success of the Micro Enterprise Bank in Kosovo has served as a model for other IFC support to financial institutions. IFC formed a successful partnership with a German firm, Internationale Projekt Consult GmbH, to start Micro Enterprise Bank of Kosovo. The bank turned a profit in its first six months, and the partnership has been extended through an $85 million package of grants and equity investment to start up commercially viable microcredit banks in several other countries, including Romania, Bulgaria, Moldova, Georgia, Kazakhstan, Macedonia, the Philippines, and Ghana. Start-up costs include training, fundraising, and management support services.108 The facility supports an initial period for set-up operations, using grant money. 109 During the start-up phase, the microfinance institution builds relationships with the formal financial sector and puts into place best-practice management systems to bring about commercial viability rapidly. “The banks are profit oriented, but do not aim for short-term profit maximization,” said
108 IFC 2000b. 109 The IFC also offers an SME Capacity Building Facility in developing countries for small business projects that are innovative, replicable, sustainable, and that involve close partnerships with outside organizations. The initiative was launched in September 2000 with a $7.1 million allocation from IFC (IFC 2001). IFC also offers project development facilities, or regionally based capacity building facilities, to strengthen small enterpris es through provision of technical assistance and capital.
Tools and Practices 12
198
Dr. Claus-Peter Zeitinger, managing director of IPC. “They seek a reasonable balance between social and economic goals.”110
Consultative Group to Assist the Poorest (CGAP) The Consultative Group to Assist the Poorest (CGAP) is a consortium of 27 bilateral and multilateral donor agencies that support microfinance, with the World Bank as a major financial supporter. Its mission is to improve the capacity of microfinance institutions to deliver flexible, high-quality financial services to the very poor on a sustainable basis. CGAP’s work focuses on five main areas, or strategic themes:
• Supporting the development of microfinance institutions; • Supporting changes in the practices of member donors to improve their microfinance
operations; • Increasing the poverty outreach of MFIs; • Improving the legal and regulatory framework for MFIs; • Facilitating commercialization of the industry.
To achieve these goals, CGAP serves MFIs, donors, and the microfinance industry by providing technical assistance and strategic advice, by developing and disseminating technical guides and services, by delivering training, and by performing field research on innovations. CGAP also has a small grant facility that provides funding for these activities and for strategic investments in MFIs. CGAP’s training and capacity-building programs are increasing technical and managerial capacities at the local level, through national workshops and networks such as those held recently in Benin/Togo, Mali, Ghana, and Cameroon.
Resources Bangladesh Rural Advancement Committee. 2001. “BRAC Development Programme: Rural
Development Programme.” Available: http://www.brac.net/pov3.html Baydas, Mayada, Douglas Graham, and Liza Valenzuela. 1998. “Commercial Banks in
Microfinance: New Actors in the Microfinance World.” CGAP Focus Note 12. Consultative Group to Assist the Poorest, Washington, D.C. Available: http://www.cgap.org/html/p_focus_notes12.html
Hashemi, S. M. 2001. “Linking Microfinance and Safety Net Programs to Include the Poorest:
The Case of IGVGD in Bangladesh.” CGAP Focus Note 21. Consultative Group to Assist the Poorest, Washington, D.C.
110 IFC 2000b.

Tools and Practices 12
199
International Finance Corporation. 2000a. “IFC and Internationale Projekt Consult Finance Microcredit Start-ups in Developing Countries.” Press release 00/115, June 22.
———. 2000b. “Micro Enterprise Bank, Kosovo: Financial Institution Building in a Post-War
Environment.” SME Facts 1 (14). Small and Medium Enterprise Department, Washington, D.C. Available: http://www.ifc.org/sme/acrobat/14-Kosovo.pdf
———. 2001. “The SME Capacity Building Facility.” SME Facts 2 (9). Small and Medium
Enterprise Department, Washington, D.C. Ledgerwood, Joanna. 1998. The Microfinance Handbook. Washington, D.C.: World Bank. MicroBanking Standards Project. 2001. “Focus on Productivity.” MicroBanking Bulletin 6
(April): 53–70. Nelson, Eric R. 1999. “Financial Intermediation for the Poor: Survey of the State of the Art.”
African Economic Policy Discussion Paper 10. Development Alternatives, Inc., Washington, D.C.
Paulson, Jo Ann, and James McAndrews. 1998. “Financial Services for the Urban Poor: South
Africa’s E Plan.” Policy Research Working Paper 2016. World Bank, Development Research Group, Washington, D.C.
Saleque, Md. A. 1999. “Scaling-up: Critical Factors in Leadership, Management, Human
Resource Development and Institution Building in Going from Pilot Project to Large Scale Implementation: The BRAC Poultry Model in Bangladesh.” Paper presented at workshop on Poultry as a Tool in Poverty Eradication and Promotion of Gender Equality, Denmark, March 1999. Available: http://www.husdyr.kvl.dk/htm/php/tune99/5-Saleque.htm
Zaman, Hassan. 1999. “Assessing the Impact of Micro-credit on Poverty and Vulnerability in
Bangladesh.” Policy Research Working Paper 2145. World Bank, Development Research Group, Washington, D.C. Available: http://econ.worldbank.org/docs/244.pdf

TOOLS AND PRACTICES 13
Poor People’s Organizations One of the most important and most overlooked development assets is the capacity of poor people to mobilize and organize for collective action. 111 Membership-based organizations and networks of poor people have emerged in many places in response to the common needs of specific groups: rural producers, home-based workers, slum dwellers, indigenous people, and landless workers, among others. Poor people’s exclusion from decision making at the local, national, and global levels, especially in the face of rapid changes brought about by globalization, gives impetus to the formation of these organizations and to their efforts to make their voices heard. When successful, such groups have been able to effectively represent their members in local and even national forums. Some have then reached out to similar groups in other countries, recognizing both the power of numbers and the commonality of problems poor people face. This note begins with a description of the World Bank’s experience with rural producers organizations (RPOs). It then describes some successes and good practices of these and other poor people’s organizations in three major areas:
• Development of processing, marketing, and alternative employment; • Management of collective goods; • Networking and coalition building for influencing decision making.
The emergence of vibrant, representative poor people’s organizations such as those described below is enabling poor people to connect with and influence national and global actors.
World Bank Experience with Rural Producers Organizations Seventy percent of the world’s poor live in rural areas, where agriculture or agriculture-related activities are the mainstay of their livelihoods. The rural poor have limited access to services or means of production, and limited weight, if any, in local, national, or global decision-making processes. To lift themselves out of poverty and improve their livelihoods, rural producers around the world have organized themselves into rural producers organizations. RPOs are key actors for any development strategy aimed at reaching the rural poor. A 1993 review of the World Bank’s role in the development of cooperatives and rural organizations concluded that inappropriate policy frameworks and government interference were the major reasons that many cooperatives failed to develop as viable and efficient organizations.112 This was true despite significant investments of financial resources and technical support from donors. Projects with rural producers organizations were negotiated This note was prepared by Pierre Rondot (RDV) and Marie-Hélène Collion (MNSRE), with contributions from Bryan Kurey (PRMPR) and Deepa Narayan (PREM). 111 This introduction is taken from Narayan and Shah 2000. 112 Hussi and others 1993.

Tools and Practices 13
201
exclusively between the Bank and governments. They failed to analyze institutional issues, were overly complex, and provided very limited capacity building, most of it for government services. The review concluded that cooperatives must be seen as private sector enterprises and that government’s primary role should be not only to control or regulate, but also to establish a conducive policy environment for their growth. In June 1999, the Bank organized a consultative workshop to hear the views of RPO representatives and NGOs providing support to RPOs. The goal was to better understand why supporting RPOs is important, what types and activities of RPOs should be strengthened, how RPOs could be supported, and what the role of the World Bank should be.113 In addition, as part of the process of revising its Rural Development Strategy, the Bank commissioned a study to identify the potential role of RPOs in its future rural development strategy. 114 The findings from both the workshop and the study emphasize that RPOs are not only key economic actors, but also vehicles for the empowerment of rural people and for their inclusion in policy dialogues at the local, national, and global levels. Partnership with rural development actors and the private sector—including RPOs—is necessary to achieve rural development, but it is a fledgling process that requires long-term support. Some areas for programmatic emphasis include the following: 1) Promoting a conducive environment
a) Promote a conducive legal environment in which private initiatives (collective and individual) are supported by appropriate legislation that is effectively enforced.
b) Promote effective decentralization that provides a favorable environment for RPOs to generate locally relevant answers to their needs.
c) Promote decentralized rural finance institutions. d) Promote institutional reforms in the delivery of public services to ensure client-
responsive services and accountability to users. e) Strengthen the capabilities of service providers. f) Promote a dialogue among donor agencies to harmonize approaches and procedures in
support to RPOs. 2) Empowerment of rural producers organizations
a) Promote the establishment of forums for RPOs at the local, regional, and national levels (when they do not already exist), where rural producers can meet, establish their priorities, and exchange experiences.
b) Finance a regional and national RPO capacity-building fund, in which allocation decisions are made by RPOs themselves.
c) Finance “professional facilitators” to help RPOs organize themselves and help them define transparent procedures to allocate resources and operate their forum.
d) Obtain recognition of RPOs from governments and end the mistrust directed toward them by public services.
e) Ensure that RPOs are recognized as partners by governments and donors, and that they actively participate in:
113 Rondot et Collion 2001. 114 CIRAD/ODI 2001.

Tools and Practices 13
202
- preparation and negotiations of rural development policy or strategy (CAS, PRSPs, etc.);
- preparation, implementation, monitoring, and evaluation of rural development projects.
Activities of Poor People’s Organizations: Selected Examples Development of Processing, Marketing, and Alternative Employment Poor people’s organizations have the potential to play important roles in improving and expanding access to markets and opportunities. Among other services, they can coordinate production activities of rural producers and workers in the informal sector, provide marketing and/or advocacy services, and execute capital- intensive investments in infrastructure or processing equipment. Dairy cooperatives in India Dairy cooperative development in India began in Gujarat with the establishment of the milk company AMUL in 1946 in response to limited opportunities for traditional milk producers.115 Operation Flood built on this experience when formation of cooperatives became a government priority for agricultural development in the 1970s. Beginning in 1974 with three projects in Karnataka, Rajasthan, and Madhya Pradesh, and following with two national dairy projects funded through the late 1980s, the World Bank lent over $500 million to develop the milk industry through cooperatives (made up of district unions combined into state federations). The projects have focused on capacity building (strengthening cooperative institutional structures and training) and support to activities and infrastructure development for increasing production and marketing. The overall objective was to promote viable cooperative businesses, owned and managed by producers, for collecting and marketing milk products in order to expand rural incomes and improve dairy productivity. The national federation comprises 70,000 village milk cooperatives with some 9 million members. Sixty percent of milk suppliers are landless, small, or marginal farmers. The federation and its members produce 13 million liters of milk daily, generating an annual additional income of $90 for each family. Per capita milk consumption has almost doubled, and the milk cooperative business created an estimated 250,000 off- farm jobs, most of them in rural areas. Investment has been heavy, and some observers have been concerned about the cooperative being overprotective and monopolistic; there are also concerns that it could use its political power inappropriately. However, these problems seem to be heavily outweighed by the impressive results of the program, due largely to committed membership and farmer-controlled organizations at the local level, sound management, influential and charismatic leaders, strong accounting systems, and effective and profitable services provided to members.
115 This section draws on World Bank 1997 and Candler n.d.
Tools and Practices 13
203
Vila Paraná, Brazil Vila Paraná is one of 22 communities settled in 1973 through the Projeto de Colonização of Serra do Mel, in the northwestern part of the state of Rio Grande do Norte in Brazil.116 Attracted by a variety of incentives offered by the state government, 1,196 families received individual plots of 50 hectares each, of which 15 hectares were already planted with cashew nut trees. Since then, much development has taken place in Serra do Mel. Cashew nut plantations occupy a total area of 25,000 hectares, with annual production of unprocessed cashew nuts as high as 10,000 tons. In the late 1980s, farmers in Serra do Mel began to process cashew nuts using small, semi-artisanal family units developed with the help of the Associação de Apoio às Comunidades do Campo (AACC), one of the most active NGOs in Rio Grande do Norte. These individual family units had difficulty competing in the market. At the end of 1998, the association representing the 46 families of Vila Paraná presented a request, through the local FUMAC council,117 for a subproject to set up a larger cashew nut processing and marketing center (central) for the community. The proposal was approved and financed by the World Bank-supported Rural Poverty Alleviation Program, at a cost of R$15,400. Individual producers now take their cashews for further processing, grading, and marketing in the central, selling their processed cashew nuts at an average price of R$9.20 per kilogram, compared to the R$7.50 per kilogram received previously from intermediaries. The central employs 25 people from the community, 19 of them women. Each receives a monthly salary which is 13 percent higher than the minimum wage in Brazil. When asked if local intermediaries can still buy unprocessed cashew nuts in the area, the president of the association replied: “Maybe elsewhere than Vila Paraná, because here no producer sells his cashew nuts outside the central anymore.” In January 2000, Dutch businessmen visited Vila Paraná and, recognizing the high quality of the cashew nuts produced in the central, initiated contractual arrangements that will allow the association to export its production to Europe. Self-Employed Women’s Association (SEWA), India In December 1971, Ela Bhatt, a lawyer and social activist who was then head of the women’s wing of the Textile Labor Association (TLA), along with Arvind Buch, president of the TLA, founded SEWA in Ahmedabad, India. In April 1972 SEWA was registered as a trade union, making it the first trade union to address the needs of poor women workers in the informal sector, working at home, or trading and vending in the streets.118 Any self-employed female worker in India can become a member of SEWA by paying an annual membership fee of 5 rupees (about 12 cents). Every three years SEWA members elect representatives to a new trade council made up of worker- leaders, and this committee then elects the executive committee.
116 This section draws on Van Zyl and others 2001. 117 FUMAC refers to municipal community schemes created under the World Bank–financed Rural Poverty Alleviation Projects in northeast Brazil. Through the FUMAC, decision making for subproject approval is delegated to project municipal councils, with 80 percent of members potential beneficiary associations and civil society representatives. 118 The section draws on Narayan and Shah 2000.

Tools and Practices 13
204
SEWA has 212,000 members across India, with 84 cooperatives, 181 producers groups, 1,000 savings groups in nine districts of Gujarat, and about 100,000 women depositors in the SEWA Bank. About 30,000 poor women participate annually in the SEWA Academy, where they explore their contribution to the national economy, their roles and responsibilities as women, their own organizations, and the values and vision behind their movement. SEWA also has a “barefoot managers” training program, and health and life insurance programs. On behalf of its members it has won high court rulings to improve work conditions of urban vendors. SEWA is exploring options to access large loans and venture capital to finance its insurance, information technology, and banking activities. Based on its 20 years of experience, SEWA has reached out across national boundaries and actively participated in the emergence of cross-country networks of common interest. Management of Collective Goods It has recently been acknowledged that people whose livelihoods depend on the sustainable management of collective goods are most motivated to manage them, and if formally organized, have the capabilities to do so adequately. Impressive cases exist in which governments have adopted new policies to transfer management of irrigation schemes or other collective resources to farmers groups, resulting in notable improvements in the sustainability of those resources. In urban areas, it has been found that slum dwellers organizing and pooling their resources can bring about collective ownership of property and more secure land tenure.119 Water users associations in Albania Following the breakup of state farms and cooperatives in Albania, and the subsequent privatization of the agricultural sector, there was no organization to take over the operation of irrigation systems and the distribution of water.120 The formation of water users associations (WUA) began under the World Bank–financed Irrigation Rehabilitation Project in 1994. The first WUAs were organized by village unit, but since several villages might share a single source of water, they were reorganized on the basis of water source to avoid disputes. WUA members are full- time farmers who grow wheat, vegetables, alfalfa, and maize. The state-run water enterprises, which operated the primary and secondary levels of the irrigation systems, had become overstaffed and inefficient; farmers lost confidence in them and were reluctant to pay water charges. The idea of allowing WUAs to manage the overall irrigation systems evolved as a solution to this problem. The WUAs became responsible for all costs involved in operating the system, and paid reduced charges to the water enterprises according to their level of responsibility. Although it started only in 1994, the program has had considerable success. By 1997 there were 187 WUAs covering the entire project area of 98,000 irrigated hectares By 2001 408 water user associations had grouped into 21 federations covering 200,000 families, or one-third of the entire population. The associations are self- financing and manage entire irrigation schemes; they have
119 See also Tools and Practices 9 on Community Driven Development. 120 This section was prepared with the assistance of David Groenfeldt. It draws on Konishi 2001 and INPIM 1998.

Tools and Practices 13
205
improved delivery of water to those at the end of irrigation schemes and increased cost recovery from zero in 1994 to $700,000 in 2000. Hill community forestry in Nepal In 1978 the government of Nepal passed legislation handing a substantial amount of public forest land and hilly areas over to local communities.121 Local management of both public and locally owned forest was to be achieved through the panchayats (villages), under agreed forest management plans. The panchayats, however, proved ill suited to undertake local forest management. Although forest management committees were formed, they seldom functioned as representative discussion and decision-making bodies. The system was revised to incorporate features of the indigenous control and management systems traditionally practiced by many communities. These systems were based on user groups rather than on whole communities. These groups established management rules that were enforced by use of forest watchers, and included social sanctions. The focus on user groups was formalized, with more authority and responsibility progressively devolving to these groups under Nepal’s 1993 Forest Act. Ownership of the land remains with the state but trees legally belong to the user groups. Management control rests solely with the users of the resources, who develop their own operational plans, set the prices at which the produce is sold, and determine how surplus income will be spent. By June 1997 there were 6,000 user groups, managing 450,000 hectares, with another 6,000 waiting for formal registration. Issues still arise within user groups, between them, and with the forest department; some of these issues have to do with difficulties securing access to forest areas from officials, domination by local elites, politicization, and pressures from the forest department. Nevertheless, the Nepal experience has been encouraging: recent studies have demonstrated that managed forests have often thrived with active user group management. Regional producer groups in Burkina Faso The World Bank is piloting an RPO capacity-building program in Burkina Faso as a component of the National Agricultural Services Development Project II (PNDSA II).122 The project, ), approved in 1997 with a World Bank commitment of $47.3 million over six years, is using a community-driven development approach in nine pilot provinces (out of 45) to encourage RPOs in each province to form a regional forum of RPOs. Within these forums, RPOs carry out several activities, including: (a) exchange experiences and discuss common issues or problems; (b) set up priorities for productive investment or services; and (c) select capacity-building subprojects identified and prepared by RPOs, to be financed on a cost-sharing basis. Projects accepted by the regional RPO forum are implemented by the RPOs that prepared them, with funds transferred directly to them. They may contract with service providers of their choice when necessary. Members of the RPO forum are RPO leaders, selected by their peers.
121 This section draws on World Bank 2001. 122 This section is based on personal communication with the project facilitator and on quarterly reports of CECI (Canadian Centre for International Cooperation).

Tools and Practices 13
206
In order to benefit from project support, local RPOs need legal status and a bank account. The PNDSAII supported efforts by the Ministry of Agriculture to: (a) revise the existing laws relating to cooperatives and local groupements so that these traditional farmers’ groups could be registered as legal entities; (b) translate information on the new law into local languages and disseminate it; and (c) facilitate the registration of RPOs. Implementation and roles. Responsibilities are distributed as follows. Local RPOs prepare capacity-building subproject proposals on the theme of their choice, selecting one of the following instruments: training, advisory services, communication, participation in a national or international RPO meeting, small productive investments, or on-farm R&D. They then submit these proposals to the RPO regional forum. If a proposal is accepted, the local RPO implements the subproject activities on the basis of a contract between the project management unit and the RPO (see below), and reports implementation progress to the RPO provincial forum. The RPO provincial forum adapts the proposed procurement and disbursement manual; organizes sessions to discuss RPOs’ priorities, exchange experiences, and review and select proposals made by RPOs; and monitors implementation of financed subproject proposals. A professional facilitator (NGO) has been recruited to help RPOs form regional forums. Its functions include: (a) local diffusion of information regarding the project, its objectives, the procurement and disbursement mechanisms, and total amount of funds available for RPOs per zone; (b) facilitation to help RPOs select their representatives at the local and provincial levels; (c) elaboration of governing rules for the provincial forum; (d) revision/adaptation of a simplified procurement and disbursement manual with RPOs leaders; (e) training RPO leaders and members of the regional and local forums in their functions regarding the review and selection of subprojects, and subsequent monitoring; (d) monitoring the process; and (f) drawing lessons. Subproject proposals selected by RPO regional forums are sent to a national financial management unit. Documents include the subproject proposal, the approval from the RPO regional forum, and the RPO’s bank account statement. On the basis of the documentation received, the national financial unit prepares a contract with the RPO and transfers funds according to the contract. The financial unit also organizes technical and financial audits of financed subprojects on a random basis. Summary of results after two years of implementation.
• Of the 4,009 local RPOs eligible, 1,480 of them submitted a subproject, and the regional forum selected 908 of these.
• The project financial management unit signed 201 contracts and transferred an estimated $351,000 to 201 RPOs (an average of $1,700/project/RPO). RPOs contributed up to 20 percent of the total costs of subprojects.
• The Bank and the national financial management unit cannot keep up with the pace of project proposals. A total of 707 RPO subproject proposals, for an estimated amount of $1.2 million, are awaiting contracts and initial disbursement. The national financial management unit cannot disburse funds quickly enough due to administrative problems within the Bank and national administrations.
Tools and Practices 13
207
Scaling up. RPOs in Burkina Faso have demonstrated their capacity to identify and formulate subproject proposals, select service providers, and implement their subprojects. The Burkina Faso government and the donor community have decided to expand this approach to the whole country. The same approach has also been tested in Senegal with similar results. RPOs Influencing Public Policy Decision Making In many different settings, poor people’s organizations are forming networks and coalitions to present a united front and strengthen their influence and bargaining positions in decision making at the local, national, and global levels. The National Rural Exchange and Cooperation Council (CNCR), Senegal In March 1993, nine national federations of rural producers in Senegal joined to create CNCR, with the goal of representing rural producers in any formal negotiations related to rural development. By 2001 CNCR had grown to include 19 national rural producers organizations, representing 3 million rural producers in all regions of Senegal. CNCR is recognized by the government of Senegal as a legitimate institution representing rural producers and can speak in their names. Its activities, driven by the idea that rural people are responsible for their own destiny, center on three objectives:
• To promote dialogue and exchange of experiences among the leaders of farmers organizations in order to strengthen the farmers movement and its federations.
• To represent farmers’ interests in negotiations with the government or other national or international partners.
• To contribute to the promotion and sustainable development of family farming. CNCR is actively involved in rural development policy making, holding regular meetings with the president of Senegal (once a year), with the prime minister (once every three months), and with the minister of agriculture (once a month). The group is also involved in designing, implementing, and monitoring several World Bank and other non-Bank-funded projects, including the National Rural Investment Project and the Agricultural Services and Producer Organizations Project. CNCR’s successes show that negotiations between national policy bodies and representatives of poor people’s interests can have a significant impact on ensuring the promotion of policies favorable to people at the local level. For example, in 1994, as the credit borrowing rate varied between 13.5 percent and 17.5 percent in rural areas in Senegal, CNCR discussed with the national rural credit bank (La Caisse Nationale de Credit Agricole) and the Senegalese government the difficulties these high interest rates were causing for Senegalese farmers. As a result, in 1995 the interest rate for farmers was reduced to 7.5 percent. Also in 1995, CNCR raised the issue of the low productivity of soil in Senegal with the Ministry of Agriculture. An agreement was reached by which the government arranged for the systematic provision of free rock phosphate (a slow-release fertilizer) to farmers and their organizations, greatly improving soil productivity. In return, farmers groups agreed to arrange for the distribution of the fertilizer to rural areas across the country.

Tools and Practices 13
208
Society for the Promotion of Area Resource Centres (SPARC)/ Shack/Slum Dwellers International (SDI) Formed in Mumbai, India, in 1984 by Sheela Patel, SPARC works to form partnerships between professionals committed to grassroots activism and communities of pavement dwellers.123 It provides support to Mahila Milan, a network of women’s collectives initially formed by women pavement dwellers, and to the National Slum Dwellers Federation, a network of leaders from urban slum settlements. Working with communities in 36 cities across India, SPARC is actively involved in regional and international networks of slum dwellers associations and participates in a global campaign for secure tenure for poor city dwellers. SPARC’s aim is to support the organization of communities and create physical, social, and emotional space for communities to pool their resources, learn from each other, and take action on their collective concerns. SPARC has educated and trained pavement dwellers—mostly women with children—to collectively avert or deal with demolition or eviction, helping to break isolation and create solidarity. Through SPARC’s intervention, 600 families living on the pavement in Mumbai have been encouraged to save an average of 5,000 rupees for future permanent housing. In addition, 600 families have saved 1.6 million rupees in a savings fund that they use in times of crisis. About 1,800 people have received loans. SPARC programs help poor people advocate changes in policies, obtain land, design and construct homes, and manage their settlements. The alliance has convinced the government to provide alternative land for slum dwellers and to stop mass demolitions of slums without notice. It has demonstrated new models of urban upgrading in World Bank–financed projects, including resettlement of slum dwellers living directly next to railway lines. On a regional and global scale, SPARC is a lead member of Shack/Slum Dwellers International (SDI). This global network of national slum dweller federations from 12 countries works to strengthen grassroots efforts against homelessness and negotiates with governments.124 SDI member federations support grassroots savings and credit schemes that bring poor people together to challenge the structures of poverty. Key to SDI’s success is exchange visits of slum and shack dwellers to other villages, towns, and countries to share their experiences and ideas with people in similar situations but often different contexts. African savings schemes were kick-started by one such exchange between South Africa and India in 1991 and 1992. In South Africa, the South Africa Homeless People’s Federation has mobilized over 60,000 federation members to save regularly, amassing the equivalent of over $1.7 million. The model has spread to Zimbabwe, where more than 17,000 people are saving, and to Namibia, where over 6,000 people are saving. In addition to knowledge sharing and learning, SDI also supports action by local members across countries. For example, an organized international solidarity effort led by SDI successfully supported local efforts to prevent demolition if slums located directly next to railway lines in Mumbai, India, in February 2000.
123 This section draws on Narayan and Shah 2000. “Pavement dwellings” are seemingly makeshift structures that exist mainly on sidewalks and other paved areas in cities. For more information see the SPARC website at www.sparcindia.org. 124 This section draws on Narayan and Shah 2000.

Tools and Practices 13
209
Via Campesina This international movement, whose name means “the peasant way,” is based in Honduras and coordinates more than 50 peasant organizations of small and middle-scale producers, agricultural workers, rural women, and indigenous communities from Asia, Africa, the Americas, and Europe.125 Its objective is to develop solidarity and unity in diversity among organizations of small farmers in pursuit of economic and social justice. It also aims to strengthen women’s participation in formulating proposals to improve livelihoods. The organization began in April 1992 when several peasant leaders from Central America, North America, and Europe gathered in Managua, Nicaragua, at the Congress of the National Union of Farmers and Livestock Owners. In 1999 Via Campesina launched its Global Campaign for Agrarian Reform. In Toledo, the Philippines, peasant families had started to benefit from agrarian reform by receiving land previously belonging to a huge estate. But armed struggle with the landlords, who had tried to get their land back, resulted in the burning of some peasant houses, eviction of peasants, and killings of members of peasant organizations. An international campaign in support of the Toledo families was mounted through hundreds of letters sent to the Philippine Ministry for Agrarian Reform. Confronted with this international pressure, officials forced the landlords to turn over the land to the peasants. Another global action by Via Campesina is the International Solidarity and Resistance Caravan. More than 450 farmers from India, Brazil, and Europe came together in 1999 in an international caravan that made its way through 12 European countries. The purpose was to confront the most powerful countries of the world to demand a new framework for international economic relations, one in which the world’s wealth would not be concentrated in a small group of transnational corporations. Via Campesina has also been a major mobilizer against the World Trade Organization. In Seattle in 2000 members from several continents protested against transnational companies and announced their decision to fight genetically modified food. The International Federation of Agricultural Producers (IFAP) Founded in 1946, the International Federation of Agricultural Producers is an internationa l organization grouping nationally representative general farmers organizations from around the world.126 IFAP has nearly 80 member organizations in 52 countries and 42 associate members in 30 countries. It represents all of the agricultural producers in the industrialized world and hundreds of millions of farmers in developing countries, and is financed and governed entirely by its member organizations. Established to bring about cooperation between organizations of agricultural producers, with a view to ensuring the security of the world’s food supply, IFAP also works to improve the economic and social status of all who live by and on the land, and to promote the creation and strengthening of independent farmers organizations in every country. In pursuit of these objectives, IFAP:
125 This section draws on Narayan and Shah 2000. 126 Information in this section is drawn from the International Federation of Agricultural Producers website at www.ifap.org.

Tools and Practices 13
210
• Acts as a forum in which leaders of national farmers organizations can meet to exchange information and ideas, highlight mutual interests, and take coordinated action to further those interests. IFAP has five permanent standing committees on agriculture in developing countries, representing Africa, Asia, the Mediterranean, North and South America, and Central America/Andean region/Caribbean.
• Keeps members informed about international events and issues of concern to farmers organizations.
• Promotes the creation and strengthening of independent, representative organizations of agricultural producers around the world through such tools as the Corporate Development Committee, which supports the development of organizational capacity among poor people’s rural organizations in developing countries.
• Acts as the recognized representative of the world’s farmers, bringing the concerns of agricultural producers to the attention of international meetings of governments and other bodies, including the United Nations Food and Agricultural Organization, the Organisation for Economic Co-operation and Development, the World Trade Organization, and the World Bank.
IFAP’s influence has been taken into account in many international conferences. During the 1995 U.N. World Summit for Social Development in Copenhagen, for example, as a result of IFAP’s efforts, the world’s governments recognized farmers organizations as an essential element of civil society. At the Earth Summit in Rio de Janeiro in 1992, IFAP presented a declaration in which the world’s farmers committed themselves to environmental conservation. According to a German farmers organization, this declaration had an important impact not only on the international bodies involved with IFAP, but also on national governments. “In Germany, we referred strongly to this resolution in order to influence national politics and to prove to our government that German farmers shared the same point of view as other farmers worldwide.” IFAP has also worked since 1989 to strengthen the links between farmers organizations and research institutes, organizing a series of consultations that resulted in the farmers’ real needs being considered in research programs. Since then, projects linking farmers organizations and research institutes have been implemented in Burkina Faso, Kenya, Zambia, and Zimbabwe.
Resources Beaudoux, Elian, and others. 1994. “Farmer Empowerment in Africa through Farmer
Organizations: Best Practices.” Departmental Working Paper 14. World Bank, Africa Technical Department, Washington, D.C.
Candler, Wilfred. n.d. “Operation Flood: The Cooperatives’ Role.” PowerPoint presentation
prepared for the World Bank, Rural Development and Agriculture Sector, Animal Resources Thematic Team. Available: http://essd.worldbank.org/rdv/RDVWeb.nsf/Animal/dairy_master

Tools and Practices 13
211
CIRAD/ODI. 2001. “The Role of Rural Producers Organizations in the World Bank Rural Development Strategy: Reaching the Rural Poor.” Cirad-tera 17/01. Centre de Coopération Internationale en Recherche Agronomique pour le Développement (CIRAD) and Overseas Development Institute (ODI), Montpellier, France.
Delion, Jean. 2000. “Producer Organizations–Donors Partnership in Project Implementation:
Risk and Precautions from a Social Perspective.” World Bank, Agriculture Knowledge and Information Systems, Thematic Team on Producer Organizations, Washington, D.C.
INPIM 1998. “Country Updates: Albania.” INPIM Newsletter #7. May 1998. Washington, D.C.
Available: http://www.inpim.org/Library/Newsletters/newsletters.html Konishi, Toru. 2001. “Albania Irrigation Rehabilitation Project: In the Context of Community
Driven Development.” Presentation given at World Bank seminar on Community Driven Development in ECA: Experience with Water Users Associations, May 27, 2001. Environmentally and Socially Sustainable Development, Social Development Department, World Bank, Washington D.C.
Narayan, Deepa, and Talat Shah. 2000. “Connecting the Local to the Global: Voices of the
Poor.” Framework paper prepared for workshop on Local to Global Connectivity for Voices of the Poor, December 11–13. World Bank, Poverty Reduction and Economic Management Network, Poverty Reduction Group, Washington, D.C.
Rondot, Pierre, and Marie-Hélène Collion, eds. 2001. “Agricultural Producer Organizations:
Their Contribution to Rural Capacity Building and Poverty Reduction—Report of a Workshop, Washington, D.C., June 28–30, 1999.” World Bank, Rural Development Department, Washington, D.C.
van Zyl, Johan, Loretta Sonn, and Alberto Costa. Forthcoming. “Decentralized Rural
Development, Enhanced Community Participation and Local Government Performance: Evidence From Northeast Brazil.” In Luis Coirolo, Keith McLean, Mondonga Mokoli, Andrea Ryan, Parmesh Shah, and Melissa Williams, Community Based Rural Development: Reducing Poverty from the Ground Up. Washington, D.C.: The World Bank.
World Bank. 1997. “India, Second National Dairy Project.” Implementation Completion Report
16218. Rural Development and Agriculture Sector, Animal Resources Thematic Team, Washington, D.C.
———. 1999. “Zimbabwe Farmers’ Union.” Case study prepared for workshop on Agricultural
Producer Organizations: Their Contribution to Rural Capacity Building and Poverty Reduction, June 28–30, Washington, D.C. Rural Development Department. Available: http://wbln0018.worldbank.org/essd/essd.nsf/producer/casestudies
———. 2001. “A Revised Forest Strategy for the World Bank Group.” Draft paper prepared
under the Forest Policy Implementation Review and Strategy. Environmentally and Socially Sustainable Development Network, Washington, D.C.

TOOLS AND PRACTICES 14
Legal and Judicial Reform As of 2001, there were more than 300 World Bank–financed projects with legal and judicial reform components. In addition, a total of 17 freestanding projects have been approved in four regions and another 13 are in the pipeline. Typically, World Bank legal and judicial reform projects are implemented over two to five years through institution building, technical assistance, learning and innovation, or Adaptable Program Lending Loans, as well as grants from the Institutional Development Fund and advisory work by the Legal Department.127 This section examines the empowerment impact of four innovative legal and judicial reform projects undertaken by the Bank in the Latin America and Caribbean Region, in Guatemala, Venezuela, Ecuador, and Peru.
Guatemala Judicial Reform Project In October 1999, a $33 million Adaptable Program Lending Loan was approved for the Guatemala Judicial Reform Project for five years, through June 2004. The project aims to create a more effective, accessible, and credible judicial system that will foster public trust and confidence and improve consistency and equity in the application of law. Extensive input from a wide range of stakeholders, in the government as well as civil society, informed the project design. An innovative collaborative participatory assessment involved more than 1,000 individuals, including judges and representatives from government agencies, law schools, the private sector, and civil society. This unique process of citizen participation in judicial reform helped identify the problems to be targeted: poor performance of the court system, limited citizen access to justice, corruption, poor institutional management, and negative public perception of the judicial branch. Designed to address these problems, the project has mainstreamed the idea that citizens, as users of judicial services, have a right and obligation to contribute to the design and implementation of reforms. As a result, the project has brought the law closer to the people. Impact In the two years since its inception, the project has made significant strides toward strengthening the judicial system and improving public access to the law. The project supports a 50 percent increase in the budget for the judicial branch, enabling the hiring and training of 30 new judges, many of them women. In addition, the number of regional courts has been increased, allowing many more people than before to actually go to court. Court processes and plans have been simplified and made user- friendly. For example, before the reforms it used to take 5–6 months
This note was prepared by Talat Shah (PRMPR) under the overall guidance of Deepa Narayan (PREM). 127 For an overview of World Bank legal and judicial reform projects, see World Bank 2001b.

Tools and Practices 14
213
to register power of attorney or file for a divorce. Through court reengineering the same processes now take only 24 hours. Several mechanisms enable better access to justice by indigenous Guatemalans, a widely underserved population who live mainly in rural and remote areas. Language training for judges and interpreters in indigenous languages has made the justice system more accessible and responsive to the indigenous population. With the demonstrated success of the initial language training, the demand for this training among judges and court personnel has increased tremendously. In addition, the project has expanded Guatemala’s justice of the peace program in locations where judges are absent. In 2001 justices of the peace made up 50 percent of all judges in Guatemala. They also have increased power to vet and mete out cases, expediting case management. This single reform has significantly increased productivity and efficiency throughout the judicial system. In addition to process improvements, Guatemala passed a judicial ethics code in April 2001 that has helped generate some unprecedented rulings. For example, the Guatemala Supreme Court voted to send a military general to jail for killing a religious official. The Supreme Court also denied immunity to a senior Congressman (also a former general), stating unequivocally that he must face trial under international human rights law. Previously, the public believed that military and political officials were above the law. Such rulings hold great symbolic value and communicate to the public that judicial reform is serious and accountable. Access to Information The Guatemala Judicial Reform Project includes a comprehensive social communications component to promote public access to legal information as well as to improve information and communication within the judicial system. With project support, a Supreme Court Public Information Center was established in the capital city in 2001. Similarly, information centers are being established in other urban centers. In addition, public education campaigns spread the word about the “new” judiciary. A public website was created to provide the public with direct access to judicial procedures and rulings.128 Through the website, members of the public can register a complaint or receive regular judicial updates by e-mail. Several mechanisms are in place to improve information flow within the judiciary and help professionalize court personnel. A judicial systems Intranet has increased communication among judges and other court officials, and has been particularly useful for judges in rural and remote areas. A digital divide program is under development (pilot testing was carried out in 2001) to provide distance education to judges in remote areas and promote knowledge sharing across the judiciary. Inclusion/Participation
128 The Guatemala Judicial Extranet is at www.organismojudicial.gob.gt/index.html

Tools and Practices 14
214
An independent Public Defender’s Office has been established to open up opportunities for poor people to have equal access to the law. Alternatives to courts, such as mediation and conciliation centers, have been successfully piloted and will be expanded throughout the country. Pilot mediation centers in indigenous areas have been very well received by the local population and public demand is high for the expansion of such centers to other underserved areas. A first workshop on cultural sensitivity training fo r judges in indigenous areas was held in January 2001 in Santa Cruz del Quiché. Sixty-one judges and auxiliary staff from five of the 21 Quiché municipalities took part in the participatory program that included interactive and practical activities, role playing, presentations, and group discussion. The major concerns voiced by participants had to do with language and cultural barriers to justice as Guatemalan formal courts operate exclusively in Spanish. Participants recommended training in the Quiché language for local judges and their staff. At the end of the workshop, participants felt better equipped to integrate cultural sensitivity into their work. Accountability A new anti-corruption program has been instituted to promote public oversight over the judiciary. The program includes preventive and control measures that streamline procedures for discipline of judges, require information disclosure on judges and judiciary personnel, and promote community participation in identifying concerns with the judicial system and correcting wrongdoing. In addition, groups involved in the initial broad stakeholder consultation continue to be involved in various aspects of project implementation, monitoring, and evaluation. Lessons Learned This project demonstrates how broad stakeholder consultation can help identify critical areas for judicial reform and start a process to regain public confidence in the judicial system. The experience also demonstrates that projects designed using participatory methods are more likely to have participatory practices mainstreamed during implementation and evaluation. In part, reaching poor people requires using local languages and establishing branches and services in closer proximity to poor people themselves. Transparency and information dissemination, in combination with technical improvements, are important for legal and judicial reform to be sustainable.
Venezuela Supreme Court Modernization Prepared in 1997 through a participatory methodology, the Venezuela Supreme Court Modernization Learning and Innovation Project was supported by a $4.7 million loan through June 2001. The project was designed to strengthen the judiciary and make it more accessible to the public. The design incorporates the results of extensive stakeholder assessments, carried out through one- and two-day workshops with judges, judges’ assistants, administrative staff, and civil society organizations. Impact
Tools and Practices 14
215
The project has improved the functioning of the judiciary and has increased public access to the judicial system. Constitutional changes facilitated by the project ensure that the judiciary receives at least 2 percent of the annual federal budget, has financial and political independence, and is open to scrutiny by the public. The project promotes coordination among formerly adversarial judicial sector agencies to foster mutual understanding, identify policy gaps, and capitalize on opportunities for collaboration. Access to Information Both judges and the public have better access to information because of reforms espoused by the modernization project. A criminal procedure code instituted in July 1999 eliminated secret trials and introduced less complicated and oral procedures to promote transparent processes and use of resources. A CD-ROM on the new code was prepared to facilitate training of judicial sector employees and dissemination of the new regulations. Venezuelan judges now participate in an international virtual network of knowledge sharing for judges called IUDICIS. Participation has meant that Venezuelan judges are better informed about the law and, as a result, feel more ownership of and pride in their work. For public benefit, the Supreme Tribunal has launched a public website and has begun publishing its decisions online.129 Public information windows have been set up in renovated courts to enable the public to track their cases and obtain information about the judicial system. Some information locations are fully automated, providing the community with instant access to the judiciary. The Venezuelan public can also watch a new television show that discusses how people can obtain greater access to justice and raise their awareness of the law. Accountability While Venezuelan judges themselves have taken the lead in implementing the modernization project, a Supreme Court Civil Society Unit was also created and provided with adequate staff, training, and resources as a forum for public dialogue and partnership. One unique form of civil society participation is that as new supreme court justices are appointed, they are subject to citizen scrutiny through direct review and press coverage. In a 2000 appointment process, the names of short- listed candidates for judgeships were published in Venezuelan newspapers and over the Internet with the purpose of soliciting citizen feedback before final selections were made. A similar process is being developed to carry out public evaluation of all judges throughout the country. Local Organizational Capacity As a result of civil society consultations, in the first year of the project a group of 45 NGOs formed the umbrella organization Alianza Social para la Justicia, whose members are active participants in judicial reform activities. The World Bank helped coalesce the NGOs into this umbrella group, which became more unified in its priorities and concerns and began to present joint plans for reform and implementation. The Internet was a useful tool in helping the NGOs
129 The Venezuela Supreme Court website is at www.tsj.gov.ve

Tools and Practices 14
216
come closer together, share information, and work as an alliance. Alianza has introduced new ideas and has shown a commitment to public pressure for change. The umbrella structure has also enabled alliance members to share and compile information, strengthen their organizational capacity, and improve their outreach and communication skills. Lessons Learned This project demonstrates the importance of linking strong public support with government commitment, leadership, and technical capacity to create building blocks for judicial change. Modernization through partnership between civil society and judges has begun to show some valuable returns, benefiting courts and communities alike with high-quality justice.
Ecuador Judicial Reform Project: Legal Aid for Poor Women In April 1995, the World Bank approved a $10.7 million loan for the Ecuador Judicial Reform Project to support case administration, mediation centers, an education program on legal rights and procedures, and remodeling and development of court infrastructure. A subproject on Legal Aid for Poor Women, funded with $256,780 over two years, supported the creation of five legal aid clinics in the cities of Quito, Guayaquil, and Cuenca to help poor women and their children exercise their legal rights and improve their socioeconomic condition. By design, each of the five legal aid clinics was established and operated by one of the following local and national Ecuadorian NGOs: Centro Ecuatoriano de Promoción y Acción de la Mujer, Fundación Maria Guare, and Corporación Mujer a Mujer. Impact Over two years, from April 1998 to March 2000, the pilot program provided legal consultation and representation, counseling, and dispute resolution services to almost 17,000 poor women for a project cost of about $15 per client. The majority of women in Quito and Guayaquil who used legal services used them either to obtain child support, to stop domestic violence, or to file a case. The project also assisted another 50,000 indirect beneficiaries, most of whom were the children or other relatives of the women clients. An evaluation of the legal aid subproject revealed that women did better when they used NGO legal services than when they used private lawyers to litigate their claims. For example, women using NGO legal services obtained child support awards that were on average 20–50 percent higher than awards obtained by women who adjudicated traditionally. In addition, legal aid clients obtained restraining orders in a shorter period of time: two or three days rather than the weeks typically needed by private lawyers. The public reputation of the NGO centers is so positive that demand has outstripped supply. Even middle- and upper-class women would like to be able to use the services. The work and outreach of the legal aid clinics has helped build community awareness of domestic violence as a human rights violation. It has also strengthened NGO relationships with the media, increased the judiciary’s respect for the NGOs, and initiated policy change processes.

Tools and Practices 14
217
For example, the Municipality of Santa Elena is vetting a proposal for a new family code and a strategic development plan that includes a gender perspective. Access to Information The legal aid clinics facilitate women’s concerns by educating them about their rights. They use an extensive outreach methodology employing radio programs, brochures, flyers, information tables at community events, meetings with women’s groups, and other public activities to reach out to the general public and, more specifically, to poor women. Mobile brigades on Saturdays and Sundays bring services directly to distant areas where no lawyers or legal offices are usually available. Local Organizational Capacity The pilot program promoted local organizational capacity by improving staffing, technology, and training of local NGOs delivering legal services. These NGOs are the critical partners in the implementation of the legal aid clinics. Early on, service teams from each clinic participated in workshops on mediation, litigation in crisis situations, child support, defense of women’s and children’s rights, coordination of community resources, gender and justice, abuse prevention, and education and training. The expanded organizational capacity of these NGOs is reflected in the remarkable improvements in the quality, range, and geographic scope of services to poor women. For example, high demand for services has resulted in extended hours so that the centers can assist many more clients. Participating NGOs have also developed a database of cases which now produces a wealth of information on the needs and characteristics of the beneficiary population. This information will be useful for future initiatives supporting women’s access to law and justice as well as their public health needs. Lessons Learned This project demonstrates that legal aid clinics are an important complement to the formal court system that help underserved populations obtain fair access to justice. By providing legal, psychological, and medical assistance, the clinics demonstrate the importance of using an integrated approach to help poor women find lasting solutions to their problems. The sustainability of providing legal aid services to poor populations remains a critical challenge. In this instance, there is no long-term financing mechanism for Ecuador legal aid clinics for women despite their undeniable success. Because poor women do not have the resources to pay for transportation or court fees even when legal services are free, alternative financing mechanisms must be identified. As the project comes to a close (June 2002), project staff are seeking a private partner to help finance the clinics and are considering the possibility of providing services on a sliding payment scale.
Peru Urban Property Rights Project

Tools and Practices 14
218
Most of Peru’s urban poor live as squatters on publicly owned lands and have no formal rights as citizens or property holders. Recognizing this problem, Peru began to initiate legal reforms to support property rights in the late 1980s and early 1990s. In 1996 then President Fujimori announced a public commitment to formalize 1.6 million urban properties by 2001. Formalizing property rights involves issuing and registering land titles to squatters through legal and institutional improvements in the legal and bureaucratic system. Without secure property rights, the urban poor are not able to claim the social and economic benefits of land ownership. For example, they are unable to use their homes or lands as collateral for loans or pass their property on to their children. In addition, credit providers have no incentive to provide financial services to this population. With the creation of an autonomous national agency responsible for formalizing existing property in poor urban settlements, 200,000 such properties were registered by early 1998. As a result of simplified and more transparent procedures, the cost of registering and titling property was reduced overnight from $2,000 to $50, and the length of time necessary for the process dropped from 15 years to six weeks or less. In August 1998 the Bank approved the $38 million Urban Property Rights Project to support the creation of a low-cost, user- friendly system of formal and sustainable property rights in selected predominantly poor settlements in Peruvian cities. The project builds upon Peru’s national program with an additional commitment to register about 1 million properties in eight urban areas by 2001. Impact Through regulatory reforms, the Peru Urban Property Rights Project has dramatically reduced the cost and time required for registering property. The urban poor can more easily and affordably register their property and become “legitimate” citizens. The institutional reforms have been very effective – by August 2000 the project had helped almost 7 million Peruvians secure land titles collectively worth more than $4 billion. By introducing the newly formalized urban properties into the organized capital markets, the property values increased by more than $1.7 billion since the start of the project.130 A social assessment involving repeated consultations with key stakeholders and beneficiaries at all levels was used as an iterative process to devise, test, and adapt land titling strategies at the neighborhood level. With the introduction of formal property rights, communities are being affected in different ways. For the first time, Peruvian women have equal rights to property under the law. In some areas neighborhood organizations have been weakened with individual ownership while in other cases communities are better organized to provide social services to residents. The project has earned a high political profile in Peru because of its widespread success in providing tangible assets to poor people. Access to Information The project supports regular and multidirectional informational flows. For example, regular stakeholder consultations and weekly visits to participating communities are scheduled in order
130 Panaritis 2001.

Tools and Practices 14
219
to solicit public feedback about the project. The outreach process is also active with the two relevant public agencies, the Commission for Formalizing Informal Property (COFOPRI) and the Urban Lands Registry (RPU),131 visiting beneficiaries in their communities rather than waiting for citizens to visit them. Community leaders facilitate the formalization program by organizing community meetings, which precede COFOPRI’s door-to-door collection of ownership information. The advantages of registering property are being widely publicized, as is the process for formalizing ownership. People are encouraged to provide info rmation about their property to the government agencies charged with titling and registration, and residents are organizing themselves to obtain registration certificates and to produce evidence of ownership. Registration is conducted house by house to verify that applicants are the true owners of each property. Accountability Through social and economic monitoring, the project is able to track the impact of property formalization on local communities. The general director of the project (who is also the national coordinator of formalization) is accountable for outcomes. A project management committee, with equal representation from COFOPRI and RPU, oversees implementation and the attainment of project goals, and makes any strategic decisions needed. Conflicts among community members are resolved in an assembly. Problems of leadership, land ownership, and conditions of occupancy are among the issues discussed. The establishment of a property arbitration system eliminates the incentive to turn to the courts to challenge or block the granting of a title. A mediation and conciliation system is being developed for settling disputes between squatters and private owners. The project concept was developed a decade ago by Hernando de Soto at the Instituto Libertad y Democracia (ILD), a Peruvian research institute. The World Bank and the ILD worked together to expand the concept nationally and encourage the development of local organizations and institutions that could undertake the project. The $13.07 million institutional strengthening component finances efforts to bolster the administrative and institutional capabilities of RPU and COFOPRI so that they can be sustainable and viable. Local Organizational Capacity A continuous participatory process has involved a wide range of stakeholders from all sectors. Neighborhood organizations in new informal urban communities, which have been responsible for acquisition and distribution of land, have been impacted by the reforms. In some cases, the property formalization process has weakened neighborhood organizations; in other cases, the organizations have evolved in function and now provide social services to the community.
131 Established in 1996, the Co mmission for Formalizing Informal Property (Comision de Formalizacion de la Propiedad Informal, COFOPRI) is a decentralized public institution responsible for promoting access to formal ownership and registered title, in order to guarantee the right of individuals to privately hold property. The Urban Lands Registry (Registro Predial Urbano, RPU) was formed in 1996 to register properties located in squatter settlements and low-income neighborhoods, and has technical, administrative, economic and financial autonomy. Since 1996, RPU has registered a total of 683,000 titles.

Tools and Practices 14
220
Urban settlements have also seen the growth of voluntary functional organizations (community kitchens, mothers clubs, parents associations, sports clubs) normally run by women and providing a safety net to poorer people. This has strengthened the role of women in these communities. Lessons Learned A key to the urban property project’s success is the careful analysis of citizen needs through studying and listening to poor people’s concerns. The iterative process of devising, testing, and adapting land titling strategies at the neighborhood level has led to the development of a streamlined and responsive land registration process. The project helps integrate low-income families into the wider urban landscape and creates rights and obligations that enable small property owners to develop a greater sense of partnership with the government and private sector.
Resources Clark, Jeffrey A. 2000. “Building on Quicksand: The Collapse of the World Bank’s Judicial
Reform Project in Peru.” Lawyers Committee for Human Rights, New York. Available: www.lchr.org/pubs/Perubuilding.htm
Dietrich, Mark K. 2000. “Legal and Judicial Reform in Central Europe and the Former Soviet
Union: Voices from Five Countries.” World Bank, Legal Vice Presidency, Washington, D.C. Available: www4.worldbank.org/legal/publications/ljr_eca.pdf
Hammergren, Linn. 2000. “Can Law and Institutions Give Voice to the Poor?” PREM News,
June 12. World Bank, Washington, D.C. Lawyers Committee for Human Rights. 1996. “Halfway to Reform: The World Bank and the
Venezuelan Justice System.” Joint report by the Lawyers Committee for Human Rights and the Venezuelan Program for Human Rights Education and Action. Available: www.lchr.org/pubs/halfway.htm
Malik, Waleed. 2000. “Challenges of Forging Civil Society Partnerships for Judicial Reform.” In
Moji Anderson, ed. Thinking Out Loud II: Innovative Case Studies on Participatory Instruments. LAC Civil Society Paper Series. Latin American and Caribbean Region, Civil Society Team, World Bank, Washington, D.C.
Méndez, Juan E. 2000. “Legislatures, Judiciaries and Innovations in Horizontal Accountability.”
Paper presented at conference on Institutions, Accountability, and Democratic Governance in Latin America, University of Notre Dame, Kellogg Institute, May 9.
Panaritis, Elena. 2001. “Do Property Rights Matter? An Urban Case Study from Peru.” Global
Outlook: International Urban Research Monitor 1 (April): 20–22. Woodrow Wilson

Tools and Practices 14
221
International Center for Scholars and the United States Department of Housing and Urban Development, Washington, D.C.
Rodríguez, Marcela. 2000. “Empowering Women: An Assessment of Legal Aid Under
Ecuador’s Judicial Reform Project.” World Bank, Legal Vice Presidency, Washington, D.C. Available: www4.worldbank.org/legal/publications/Empowering-Women-web.pdf
Van Puymbroeck, Rudolf V. 2001. Comprehensive Legal and Judicial Development: Toward an
Agenda for a Just and Equitable Society in the 21st Century. Washington, D.C.: World Bank. World Bank. 2001a. “Argentina Legal and Judicial Sector Assessment.” World Bank, Legal Vice
Presidency, Washington, D.C. Available: www4.worldbank.org/legal/publications/argentina-final.pdf
———. 2001b. “Initiatives in Legal and Judicial Reform.” World Bank, Legal Vice Presidency,
Washington, D.C. Available: www4.worldbank.org/legal/publications/initiatives-final.pdf

TOOLS AND PRACTICES 15
Institutional and Governance Reviews Strengthening public institutions underpins the World Bank’s work in all sectors. Most Bank activities engage public sector institutions that are, or should be, supporting policy making and service delivery, and providing oversight and accountability.132 Institutional and Governance Reviews (IGRs) are analytical reports that focus on the functioning of key public institutions. They have three features. First, they take performance failures in policy management, service delivery, or accountability as the starting point for their analysis. Second, they use standardized toolkits, surveys, and quantitative measures of performance wherever possible.133 Third, and most fundamentally, they analyze the feasibility of reform recommendations with a rigorous assessment of political realities and constraints to reform. The purpose of IGRs is to inform the Country Assistance Strategy and operational priorities by identifying institutional weaknesses that are contributing to measurable performance problems, by helping to improve the design of projects, and by providing a basis for rigorously prioritizing reforms according to institutional or political feasibility. IGRs should be undertaken upstream of the CAS or major lending operations. They are prepared for the country team, providing a basis for dialogue between the Bank and counterparts.
Confronting Politics IGRs would not have been produced in the Bank just a decade ago. Their examination of political issues and motives—reinforcing the vital point that short-term, purely technical applications will not solve problems that have deep political roots—and their use of empirical data to make comparisons between institutional arrangements and to monitor officials’ behavior are signs of growing openness and candor within the Bank and among an increasing number of client countries. Certainty about development objectives, coupled with a readiness to accept the primacy of politics, fosters a robust and comprehensive dialogue. IGRs can provide an analysis of the relevant political dynamics and show how the structure of political institutions and the behavior of political actors drive public sector performance and increase or decrease the prospects of achieving those development objectives. A well-executed analysis of the relevant political dynamics is fundamental to an IGR. The Bolivia IGR, for example, convincingly showed how the structure of political institutions and the behavior of political actors drive the operation of that country’s public administration, and hence
This note was prepared by Nick Manning (PRMPS) and Laura Bureš (PRMPR), with guidance from Deepa Narayan (PREM). 132 See World Bank 2000c. 133 See http://www1.worldbank.org/publicsector/toolkits.htm for recent work on toolkits. Details of the public officials surveys are available at http://www1.worldbank.org/publicsector/civilservice/surveys.htm

Tools and Practices 15
223
the service-delivery performance of its public sector. It showed that the intrusion of political factors and incentives into administrative practices and outcomes has benefits and costs. Finally, it set out a pragmatic strategy and program of action. Such analyses raise significant challenges and expose sensitivities both on the client side and on the part of the Bank. Reformers committed to good governance welcome robust analytic reports and their contribution to productive political discourse. At the same time, there are necessarily sensitivities around such politically delicate topics. The degree of explicitness in IGRs thus will vary considerably.
“Best Fit”: Emphasizing Alternatives and Tradeoffs IGRs respond to the challenge of moving away from the “best practice” model that has proved less than successful in fostering institutional reform. In the best-practice approach, problems in formal institutional arrangements are highlighted, and advice and incentives to address the problems are provided. Governments are urged to make their civil services more meritocratic and their budget processes more performance-focused, but without any pragmatic guide to how those changes could be introduced given political realities.134 A “best fit” approach, by contrast, asks, “What would work here?” Recent research on the effectiveness of aid concludes that aid in the form of money has a large impact only when countries have already begun to make substantial progress in reforming their policies and institutions. In such settings, donor support should be geared less to project financing and more to economic and sector work that in the long run lays the groundwork for institutional and policy reform. 135 Successful refo rmers among IDA countries typically have gone through a period of intensive policy dialogue with the Bank and other stakeholders, without the formality of adjustment lending (and without a great deal of donor financing).136 The implications of these findings for the Bank’s operational work are clear: in countries with weak institutions and poor policy performance, the Bank’s focus should be on ideas, not money. In pursuing “best fit,” IGRs seek to provide governments with ideas about the tradeoffs between approaches, rather than to dictate which approach to follow. The Bolivia IGR, for example, set out three alternative arrangements: public action by a centralized bureaucratic hierarchy, by an insulated autonomous agency, or by decentralized and participatory local governments. Opening up the agenda in this way provides a fertile basis for exploring what sequence of actions—including the relative emphasis accorded diverse alternatives—offers the best prospects for sustainable success.
134 See World Bank 2000c. 135 World Bank 1998. 136 See Devarajan, Dollar, and Holmgren 2001.

Tools and Practices 15
224
The Pioneers IGRs have been undertaken in Bolivia, Bangladesh, Armenia, the Organization of Eastern Caribbean States, Peru, and Argentina, and are planned for southeast Europe (fiscal 2002). Their styles have varied according to the nature of the performance problem being addressed, the stage of the country dialogue, and the resources available to the country team. Some have been sweeping and others more incremental in their recommendations. The Bolivia and Bangladesh IGRs, which recommended broad-based reforms, are described in more detail below. The Bolivia IGR The Bolivia Institutional and Governance Review, issued in August 2000, aimed at understanding the country’s public sector and identifying challenges and possible directions for an ambitious second-generation reform program. 137 The IGR recognized the achievements of the last 15 years in public sector reform, including the government’s current Institutional Reform Project, and identified informality as the most significant obstacle facing the Bolivian bureaucracy. 138 Bolivia Findings: Informality as the Primary Obstacle to Institutional Development The review found informality to be a problem in several areas of public administration, including public expenditure, personnel management, and implementation of Law 1178 of Financial Management and Control (the SAFCO Law), which is one of the principal formal- legal instruments for regulating public administration in Bolivia. The underlying causes of informality were identified as stemming from political dynamics in the country, which produced a system of patronage and clientelism. In particular, the IGR cited:
• Politicians’ interest in obtaining electoral support from and exerting control over the bureaucracy by distributing public jobs and other types of rents and placing “persons of confidence” in critical bureaucratic posts;
• A weak private sector that failed to generate employment opportunities for the middle class, encouraging some segments of the population to seek employment in the public sector;
• A fragmented party system that forced political parties to negotiate coalition agreements. While Bolivia’s coalition governments had passed some key reforms and were the basis for democratic stability, this macro- level governance was achieved at the cost of deteriorating public services at the micro level due to excessive politicization of the government bureaucracy and its weak institutional capacity. As additional obstacles to a properly functioning government, the review faulted deficiencies in formal rules and procedures, weakness of supporting institutions, the Ministry of Finance’s focus on fiscal discipline at the expense of strategic allocations and efficiency, and delays in the implementation of the Statute of Public Officials.
137 This section draws on World Bank 2000a. 138 Informality is defined as the gap between “ideal” or “desirable” behavioral patterns prescribed in a set of formal institutions (laws, rules, and organizational norms) and actual behavioral patterns that obtain without following the letter or spirit of the existing formal rules.

Tools and Practices 15
225
In public expenditure management, the review found the clearest indication of informality in the lack of credibility of annual budgets. Significant deviations between approved and executed budgets were the result of inadequate central control over details of resource allocation and use, combined with unrestrained, opportunistic spending behaviors by line agencies. Analysis of budget data for 1990–92 and 1994–96 showed that 15–20 percent of approved agency budgets were reallocated across agencies. In public personnel management, the IGR found several areas of informality. One example was the widespread use of consultants for line functions. Because regular government employees had low salary levels, agencies had difficulty attracting qualified personnel and therefore were in the habit of hiring consultants to circumvent the government’s formal wage policy. Other forms of informality included civil servants’ tendency to give in to outside political pressure in fear of losing their jobs or salaries, deliberate destruction or concealment of agency-related information at times of government change, and use of nonwage budget items for salary supplements. The review found implementation of the Law of Financial Management and Control, which provides the legal framework for regulating public administration, to be incomplete and uneven. The law had been created to introduce results-oriented management practices and strengthen central oversight; however, the IGR demonstrated that there was little evidence that such reforms had been implemented. The failure to implement the law more fully was primarily the result of limited commitment on the part of the Ministry of Finance and resistance from public officials. The IGR survey showed that in the nine years since promulgation of the law, public officials had not internalized its norms and values; most did not believe the law encouraged officials to focus on results or improved their agency’s efficiency. The IGR also found micro-institutional causes of informality in weak mechanisms for management control and regulatory enforcement. The laxness or indifference of agencies such as the Controller General of the Republic and the Ministry of Finance contributed to weak central oversight. In addition, unavailability of information on agency performance, transactions, and compliance with rules made it impossible for any central oversight body to exercise effective control over public agencies. For example, the Treasury did not have timely information on budget execution to adjust disbursement during a fiscal year, and the Controller General could not audit line agencies’ accounts effectively because it had no adequate financial statements to audit. Analysis of Participatory Reforms The IGR analyzed Bolivia’s experience with the 1994 Popular Participation Law, which empowered communities in some municipalities to oversee the actions of local municipal governments and to hold them accountable. Some of the participatory mechanisms created by the law included:
• Regular election of town councils to five-year terms in office, which provided the most basic means of citizen control through electoral accountability. The council could remove a poorly performing mayor from office after a year by a three-fifths vote of censure.

Tools and Practices 15
226
• Establishment of “vigilance committees” that could issue public statements on how co-participation funds were budgeted and invested. The committee could file a complaint or petition the national Senate if problems were found and not resolved.
• Establishment of rights and duties of territorial base organizations, including the ability to propose, request, and control the performance of public works and provision of services. These organizations were required to account for all actions undertaken on the community’s behalf and elect representatives to the vigilance committee.
• Introduction of a participatory investment planning process through development of an annual operative plan.
One year after the Popular Participation Law was enacted, an Administrative Decentralization Law was passed to redefine the role of administrative departments. Deliberative and oversight functions of departments were now carried out by departmental councils, and council members were elected from each province by town councilors. Departmental councils had a legal mandate to approve departmental budgets, reports on resource expenditure, and development projects and public investments. Shortcomings of Bolivia’s participatory reforms. The review found that departmental councils were weak in practice, with little power to take initiative. There were several reasons for this weakness: the prefect presided over the council presidency; the council had no budget of its own; and members had no means of hiring technical support. Popular Participation’s planning process was not working well as an accountability mechanism at the local level because it was difficult to get people to participate and planning meetings tended to produce lists of projects rather than planning strategies. The oversight and participatory instruments created by the Popular Participation Law were sometimes co-opted by political parties and interest groups, which weakened transparency and accountability. The IGR’s case studies demonstrated a conflict-ridden struggle to gain partisan control over municipal resources—in elected officials’ decisions about how to distribute co-participation funds and what projects to carry out, in the oversight and participatory roles played by the vigilance committees and the territorial base organizations, and in the use of the vote of censure. Political parties were found to exert disproportionate influence in local affairs, undermining civil society’s oversight mechanisms. The IGR survey found high turnover of mayors, instability in council membership, limited roles and impact of civil committees at the local level, limited power of vigilance committees, and bypassing of vigilance committees by mayors. The survey also showed signs of politicization of intergovernmental relations, as party alliances and divisions largely determined relations between prefectures and municipalities and between mayors and prefects. Strong political party clientelism was discovered in the hiring of departmental personnel, while job stability and merit-based promotion did not exist. The IGR survey revealed weak citizen participation at the departmental level, as four of six prefectures reported they had not taken steps to promote participatory governments. Positive outcomes of Bolivia’s participatory reforms. In their localities, Bolivians pressed their demands through their territorial base organizations and vigilance committees, despite

Tools and Practices 15
227
shortcomings of the system. A degree of community representation was created that had been weak or nonexistent in the past, and communities pressured mayors for equitable distribution of resources. Electoral accountability was improved as local officials were now elected throughout the country, providing opportunities for traditionally marginalized groups to participate in municipal government. Bolivian municipal governments were empowered to a greater extent than in the past, as they were developing plans, investing resources in major public works, improving public services, mobilizing resources, and responding to community pressure. Recommendations of the Bolivia IGR The IGR classified institutional reforms as urgent priorities for the government. It found signs of “reform fatigue” among citizens, whose quality of life had not improved very much in 15 years of reform efforts. The review warned that unless the state began to provide better public services and alleviate poverty more effectively, the credibility of the current regime might be threatened, and it pointed to recent social protests as one indication of the fragile legitimacy of the Bolivian government. In response to the pervasive problem of informality, the IGR provided four central recommendations:
• Depoliticize personnel management in the public sector; • Strengthen central oversight capacity in financial and personnel management; • Learn from the recent successful experience of the autonomous regulatory agencies
(superintendencies) and replicate the success in other public sector institutions; • Use “citizen voice” as a means of exercising social control over public administration.
Depoliticization. The IGR argued that “depoliticization” of Bolivia’s administration lay at the heart of further reform. However, given the strong incentives to maintain a coalition government, a depoliticization process was likely to be successful only if it were initiated and sustained with the explicit participation of the major political parties. Government-wide civil service reform, including a credible Superintendency of Civil Service, and agency-specific reform, such as of the customs agency, were two approaches advocated by the IGR that would require broad societal support. The IGR also noted the importance of transparency in the depoliticization process and, to this end, recommended that the government establish reasonable parameters for political appointments agreeable to major political parties; provide information to Congress and the public about the number of political appointees in each agency; and commit to decreasing the scope and magnitude of political appointments over time. Oversight mechanisms. The IGR emphasized the importance of establishing effective oversight mechanisms in the core areas of personnel and financial management and institutional mechanisms for sharing management information within the public sector. The review argued that a strong central oversight body, autonomous and insulated from short-term partisan political considerations, was essential for implementing a depoliticization strategy. The IGR also recommended reconsidering the institutional arrangement for overseeing procedural compliance in financial management. For this purpose, the review recommended either expanding the role of the Superintendency of the Civil Service or strengthening the authority of the Controller General. The IGR also discussed the need for predictability in budget allocations and results-oriented management and recommended greater coordination between the Ministry of the

Tools and Practices 15
228
Presidency and the Ministry of Finance in developing a performance-oriented management and evaluation system. Learning from past success with autonomous regulatory agencies. The review’s recommendations were based in part on an assessment of past institutional reform efforts, including the successful creation of autonomous regulatory agencies and partially successful decentralization. The IGR public officials survey showed that autonomous agencies in the country had achieved a much higher level of organizational development than the rest of the public sector. However, the review warned that “autonomization” could create other costs to efficient public administration, such as ambiguous accountability arrangements, duplication of functions, and difficulty in coordination. Therefore, the review recommended autonomous agencies in cases where political independence was important for agency success, but not in service delivery agencies. Citizen voice for social control. The IGR recommended that participatory reforms be adapted for the national level. It advised a government strategy of engaging the private sector, civil society, and the media as supporters of the reform agenda, consulting with them on reform implementation, and providing them with information on institutional performance in the public sector to enable them to monitor progress and exert pressure for continued reform. To this end, the IGR recommended that the Ministry of Finance and the Controller General adopt a more open policy of information disclosure. The Bangladesh IGR The Bangladesh IGR of September 2000 analyzed the underlying causes of Bangladesh’s poor governance, the consequent weak performance of its public institutions, and reasons for the government’s slow response to reform proposals.139 The review focused in particular on the available mechanisms for holding government agencies accountable to the public. Drawing on prior economic and sector work and integrated economic and social analysis, it described the vested interests and underlying incentives, both formal and informal, operating within the bureaucracy and political leadership to explain the deep-seated opposition to public sector reform. The report examined these factors at both the national and local government levels and proposed measures to improve accountability for the delivery of public services. The report gave high priority to reforms that would promote the rule of law and enhance the security of citizens, especially the poor. It also emphasized the importance of finding ways to strengthen the voice of civil society and to build partnerships for better governance involving the press, NGOs, independent research centers, and private business. A central theme of the IGR was that successful public sector reform must benefit all stakeholders. Bangladesh Findings: Sociopolitical Obstacles to Improved Governance Overall, the IGR found that reform initiatives had frequently failed in Bangladesh because they had promoted technical solutions when the main obstacles to improving public sector
139 This section draws on World Bank 2000d.
Tools and Practices 15
229
management were sociopolitical. The review noted three obstacles to public sector reform in particular:
• Pervasive clientelism in public service; • Organized interest groups, some illegitimate, determining political decisions; • Major discrepancies between the private agendas of principal public actors and their
formal public agendas. According to the IGR, clientelism in Bangladesh’s public service operated within clearly defined hierarchies, and the government’s “rules of business” for conduct in public service were increasingly disregarded. The well-organized interest groups that determined political decisions included the military, the bureaucracy, private business, trade unions, religious groups, NGOs, and donors. However, the activities of some of these interest groups were illicit and included bribery, extortion, harassment, and the use of musclemen. The political, business, trade union, and bureaucratic power structures had been partially captured by an underworld that used strong-arm tactics to enforce its power. In the districts, the powerful often gained support from the police and members of the judiciary for their own benefit, to the disadvantage of the poor. Poor people meanwhile were dependent on patron-client relationships for their survival. Corruption and fraud on the part of public officials were widespread, while economic losses from inefficiencies in the public sector were huge. The IGR estimated that the revenue loss from corruption and inefficiency in the customs and income tax departments exceeded 5 percent of GDP. Over 40 percent of commercial banks’ loan portfolios were overdue, and much of this money would likely never be recovered. Investors were discouraged by the country’s poor governance. In addition, the physical insecurity of poor people and women of all classes, as well as the rapid deterioration of the natural environment, adversely affected the quality of life in Bangladesh. Political dissension had led to a number of large strikes and to street violence. Recommendations of the Bangladesh IGR The Bangladesh IGR made several recommendations to improve governance in the country’s public sector:
• Strengthen systems of accountability by reinforcing the role of Parliament, reforming the judiciary, tightening public financial accountability, promoting transparency, and strengthening civil society;
• Increase decentralization; • Reinvigorate administrative reform by focusing on incentives, performance, merit
postings and promotions, a credible oversight system, and delegation of authority over personnel and financial matters;
• Take advantage of the potential of e-government; • Mobilize support for reform.
Strengthening systems of accountability. The IGR’s recommendations for strengthening public accountability are described in more detail below. To reinforce the role of the Parliament, the IGR advised several steps. It recommended that parliamentary committees undertake investigative work when appropriate. As one example, the IGR suggested that the committee overseeing the health ministry gather data on the operation of
Tools and Practices 15
230
health facilities around the country, produce a written report, and commit to engaging with civil society and the media. The review also suggested that the government respond to outstanding queries in recent reports of the Public Accounts Committee and the Public Undertakings Committee. It recommended that the Parliament debate these reports and allow the press to witness and report on such deliberations. The IGR also supported creating a greater separation between policy makers and the bureaucracy, so that bureaucrats could be required to come before parliamentary committees to justify their actions. To improve the judicial system in Bangladesh, the IGR recommended computerizing court records and case management, upgrading facilities, supporting initiatives to improve management of physical and human resources, and improving the training of justices, including preparing them to deal with technical cases (as in environmental or commercial law). The review further called for streamlining court procedures and providing adequate resources to ensure more prompt and effective enforcement of the law. To tighten public financial accountability, the IGR called for a phased, medium-term program of 5–10 years. It identified several top priority measures: providing top-notch policy advice to the minister of finance; establishing a resource management unit to monitor the implementation of the budget and improve the quality of budget data; providing urgent practical training to the economics, budgeting, and planning staff; and computerizing and rationalizing the payroll and pensions system. To promote transparency, the IGR focused on protecting the independence of the press, building its capacity, and allowing independent radio and television. The review recommended that public agencies issue regular reports on their activities, submit them to Parliament, and make them available to the public. It advised that such reports describe clearly defined annual work programs and budgets with performance targets and objectives that could be monitored. Accounts and audits would be published within six to nine months of the end of each fiscal year.
Resources Devarajan, Shantayanan, David Dollar, and Torgny Holmgren. 2001. Aid and Reform in Africa:
Lessons from Ten Case Studies. Washington, D.C.: World Bank. World Bank. 1998. Assessing Aid: What Works, What Doesn’t, and Why. Washington, D.C.:
Oxford University Press. ———. 2000a. Bolivia: From Patronage to a Professional State. Bolivia Institutional and
Governance Review, Volume 1: Main Report. Report 20115-BO. Poverty Reduction and Economic Management Network, Latin America and Caribbean Region. Washington, D.C.
———. 2000b. “Fixing ESW: Where Are We?” Draft report prepared by Operations Policy and
Strategy Group for the meeting of the Committee on Development Effectiveness, Washington, D.C.

Tools and Practices 15
231
———. 2000c. Reforming Public Institutions and Strengthening Governance: A World Bank Strategy. Washington, DC: World Bank.
———. 2000d. “Taming Leviathan: Reforming Governance in Bangladesh, An Institutional
Review.” South Asia Region, Poverty Reduction and Economic Management, Washington, D.C.
———. 2001. “Assessing the Quality of FY01 ESW: Approach Paper.” Quality Assurance
Group, Washington, D.C.
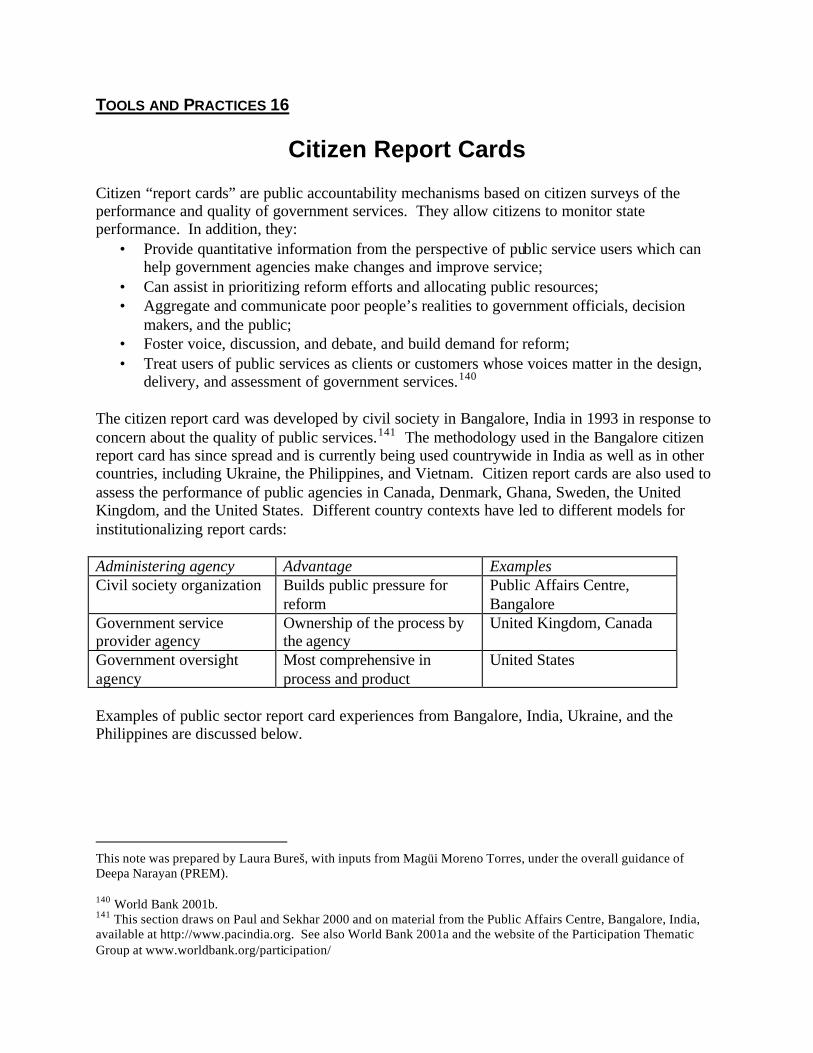
TOOLS AND PRACTICES 16
Citizen Report Cards Citizen “report cards” are public accountability mechanisms based on citizen surveys of the performance and quality of government services. They allow citizens to monitor state performance. In addition, they:
• Provide quantitative information from the perspective of public service users which can help government agencies make changes and improve service;
• Can assist in prioritizing reform efforts and allocating public resources; • Aggregate and communicate poor people’s realities to government officials, decision
makers, and the public; • Foster voice, discussion, and debate, and build demand for reform; • Treat users of public services as clients or customers whose voices matter in the design,
delivery, and assessment of government services.140 The citizen report card was developed by civil society in Bangalore, India in 1993 in response to concern about the quality of public services.141 The methodology used in the Bangalore citizen report card has since spread and is currently being used countrywide in India as well as in other countries, including Ukraine, the Philippines, and Vietnam. Citizen report cards are also used to assess the performance of public agencies in Canada, Denmark, Ghana, Sweden, the United Kingdom, and the United States. Different country contexts have led to different models for institutionalizing report cards: Administering agency Advantage Examples Civil society organization Builds public pressure for
reform Public Affairs Centre, Bangalore
Government service provider agency
Ownership of the process by the agency
United Kingdom, Canada
Government oversight agency
Most comprehensive in process and product
United States
Examples of public sector report card experiences from Bangalore, India, Ukraine, and the Philippines are discussed below.
This note was prepared by Laura Bureš, with inputs from Magüi Moreno Torres, under the overall guidance of Deepa Narayan (PREM). 140 World Bank 2001b. 141 This section draws on Paul and Sekhar 2000 and on material from the Public Affairs Centre, Bangalore, India, available at http://www.pacindia.org. See also World Bank 2001a and the website of the Participation Thematic Group at www.worldbank.org/participation/

Tools and Practices 16
233
Bangalore’s Report Cards on Public Services In 1993 Dr. Samuel Paul and a small advisory group of local leaders initiated the first report card on Bangalore’s public services. Based on a sample survey of middle- income and poor (slum dweller) households, the report card assessed public services from the perspective of the user. It was not an opinion poll, but rather reflected people’s actual experiences with a range of public services. The exercise was then institutionalized as a core function of the Public Affairs Centre (PAC), a nonprofit organization in Bangalore founded in 1994 and dedicated to improving the quality of governance in India. PAC completed a second report card in 1999 to provide a comparative assessment and benchmarking device to gauge whether public services improved or declined between 1993–94 and 1999.142 Findings The second report card showed that most public services in Bangalore had improved to some extent in the five years since the first report card.143 Slum dwellers reported improvements in service quality for all agencies, though in varying degrees. Yet the second report card’s findings revealed a generally low level of citizen satisfaction with government services, with less than 50 percent of respondents satisfied in most cases. Among slum dwellers, the services that were rated satisfactory by more than 70 percent were: public transport (83 percent), primary schools (74 percent), electricity (73 percent), and public hospitals (73 percent). The lowest satisfaction ratings were for the police (only 25 percent satisfied). Problems with services most frequently involved garbage collection, drainage, streetlights, roads, and telephones. Bribery was described as a pervasive problem, and satisfaction with time taken to solve problems was very low. Nearly two-thirds of the poor reported that they were willing to pay more for services if quality and reliability were improved. More than half were willing to pay more for water and health services. Only 5 percent were aware of anti-poverty programs meant to benefit them, making the percentage of poor people who attempted to use the programs very low. In any case, applicants rarely succeeded in getting benefits. The report card demonstrated that corruption remained widespread in most agencies with few exceptions. The incidence of corruption in almost all agencies increased between 1993–94 and 1999, and the average amount paid in bribes rose dramatically in four of 10 agencies. The proportion of slum dwellers paying bribes declined by 22 percent, but the average amount paid increased by 71.5 percent. In addition, more people visited agencies in 1999, but their rate of success in having their problems solved declined. For slum dwellers, the incidence of problems rose from 22 percent in 1993–94 to 34 percent in 1999, while problem resolution declined from 38 percent to 1.3 percent.
142 For more on benchmarking, see Kingdom and Jagannathan 2001. 143 See Paul and Sekhar 2000 for detailed findings.

Tools and Practices 16
234
Outcomes Despite the negative findings of the second report card in some areas, the process led to a number of positive outcomes. After the publication of the first report card, civil society groups in Bangalore took on a range of government reform activities. Media coverage of the report card’s results contributed significantly to informing the public and drawing attention to problems with government services. Public agencies became engaged in the efforts sparked by the report card, and some agency leaders initiated collaborative programs with citizen groups and their networks. In some cases, service providers adopted the report card approach as an internal monitoring device. In telephones, electricity, and water supply, bill collection was streamlined and decentralized. Increased competition in services (such as cellular phones) also spurred improvements between the first and second report cards. The second report card also attracted wide media attention and public interest and stimulated civil society to put further pressure on local government to improve performance. Agency leaders acknowledged that their responses to the report cards were stimulated by public pressure to improve services, and many officials now view report cards as a guide to better delivery of services and greater public accountability. As a result of Bangalore’s success, a number of cities and countries have replicated or adapted the report card method. Methodology The first report card was based on surveys of approximately 480 middle- income and 330 low-income (slum-dweller) households. Focus group discussions were held, and pre-tested questionnaires were used to collect data on respondents’ levels of satisfaction with a range of public services. The second report card was based on a sample of 1,339 middle- income and 839 low-income households and used similar scales for responses as in the first report card to allow appropriate benchmarking. A multi-stage stratified sampling plan ensured representativeness. The field work was conducted by Gallup MBA India Pvt. Ltd., a market research agency. The report cards covered water supply and sewage, power, telephones, ration shops, police, public buses, the regional transport office, hospitals, and the development authority. The survey of the slum-dweller sample covered primary schools but did not ask about telephones, the regional transport office, or the development authority. Lessons Learned To move from the report card to reform and improvement of public services, the Public Affairs Centre recommends a number of steps based on its experience:
• Identify critical services/agencies and design both short- and long-term reform strategies; • Build support constituencies and partnerships and determine capacity/resource
requirements; • Find “quick wins” to build momentum for reform; • Focus on services and agencies rather than on individuals; • Identify a “local champion” to support and encourage the report card process; • Use an independent and technically competent local NGO or professional organization to
carry out the study, and establish local ownership of the process.

Tools and Practices 16
235
The People’s Voice Program in Ukraine Inspired by Bangalore’s experience with citizen report cards, the People’s Voice Program was created in Ukraine to promote public participation in building an open, accountable, and effective government by bringing together the supply and demand sides of reform. The International Centre for Policy Studies (ICPS) is the lead local institution for the program and works with a number of local partners to gather and disseminate information on public services through citizen surveys for improved service delivery. The project is a World Bank pilot initiative, funded in partnership with the Canadian International Development Agency. 144 Two Ukrainian cities, Ternopil and Ivano-Frankivsk, were selected because their mayors had agreed to be “local champions” and their city governments had shown willingness to cooperate. ICPS implemented the program in the spring of 1999 with the goals of monitoring local service delivery through the public sector scorecard approach and supporting local reform initiatives. Findings Although some public services, such as the post office, telephone company, local schools, and infrastructure, received positive evaluations in the People’s Voice surveys, the study revealed widespread dissatisfaction with service quality. In general, survey respondents found the performance and integrity of public agencies to be no better than “average” (a rating of 3 on a scale of 1 to 5). Problems were most frequently cited in the housing authority and health services. Citizens who interacted with agency officials about service problems found them neither helpful nor friendly. The highest frequency of bribe-taking was in hospitals, road police posts, and visa offices. Over a third (36 percent) of respondents reported that they paid bribes “on their own initiative”; 28 percent paid because bribes were solicited by officials, while 36 percent paid on the advice of others. Despite dissatisfaction with services, 93 percent of citizens had never filed a complaint because they believed that doing so would be futile. While 80 percent of citizens were aware of government rules and regulations, 50 percent claimed that these rules and regulations were not followed by public agencies. Entrepreneurs who were surveyed indicated that they encountered a number of problems in their interactions with the public sector. They cited arbitrary interpretation and enforcement of regulations as significant obstacles, as well as the high costs of regulatory compliance and tax inspections. Respondents indicated that 40 percent of senior managers’ time was spent dealing with government. These problems were considered greater than those related to corruption. The respondents found municipal government to be hostile toward business, and they had little confidence in the court system for resolving commercial disputes in a fair, honest, and timely manner. The survey revealed problems (late or insufficient payment) in public procurement. The entrepreneurs also indicated dissatisfaction with the lengthy process of business registration.
144 See the website of the International Centre for Policy Studies at http://www.icps.kiev.ua/pvp/home_e.html. Also see UFE Foundation and others 2000; Ternopil Urban Development Agency and others 2000.

Tools and Practices 16
236
Outcomes In response to the dissemination and public discussion of survey results, the People’s Voice Project has generating dialogue among citizens and public officials in the cities of Ternopil and Ivano-Frankivsk. The free-flow of information has resulted in unprecedented actions by municipal authorities and by citizen groups for improved public services. For example, municipal officials in Ternopil set up several task groups to develop concrete solutions to the most critical problems identified by survey respondents. The surveys also mobilized Ternopil residents to pressure the local government to create “service centers” as one-stop shops where people can pay for all of their municipal services. The service centers are also intended to become clearinghouses for filing and monitoring citizen complaints. In terms of citizen action, the project has supported the establishment of NGO coalitions and citizen action groups in both cities. The project has improved the capacity of its NGO partners to be more sustainable by providing training in human resource management, strategic planning, media relations, and coalition building. As citizens in both cities identified education as a primary area of concern, NGOs, parents, and education officials have held dialogues and are developing proposals to improve the local education system. In Ternopil, these dialogues have produced the “City Blueprint for Education” an Education Plan for 2005. The city of Ivano-Frankivsk convened the multi-stakeholder Ivano-Frankivsk Education and Advisory Council in October 2001. In addition, community advisory boards have been established in both cities to create an agenda of issues and needs for citizen engagement to further educational reforms. In both cities, other citizen working groups are focusing on strategies to improve transport, housing, and business development. In summer 2001, the People’s Voice Program expanded to two additional Ukrainian cities – Chuguiv and Kupyansk – conducting surveys on the quality of public services involving citizens, business representatives and public servants. In both cities, the public evaluates service quality as less than satisfactory, with the most problematic institutions for citizens being local housing offices, public health clinics, and the city energy department. Methodology The study’s methodology used pre-tested surveys with standard questionnaires conducted through face-to-face interviews with random samples of 500 households and 100 entrepreneurs.145 The surveys asked citizens and business people about their experiences with the following government agencies: the post office, health services, phone service, housing authority, school authorities, state savings bank, office of social benefits, tax inspection, road police, hospital, local executive committee, customs service, visa department, police, and courts. Lessons Learned ICPS identified several factors as very important in implementing the project effectively:
• Commitment and engagement of city mayors and local government officials;
145 The program also surveyed a sample of civil servants.

Tools and Practices 16
237
• Close cooperation with local NGOs; • Establishment of local NGO coalitions working in different sectors; • Additional surveys over time to reassess services, monitor progress, identify lessons
learned, and recommend steps for the future.
The Filipino Report Card on Pro-Poor Services The Filipino Report Card on Pro-Poor Services was conducted in the spring of 2000 as a follow-up to the World Bank’s Philippines Poverty Assessment.146 It was based on a national survey of client satisfaction with public services designed to help the poor. The survey asked poor Filipinos about constraints they encountered in accessing public services, and about their views on the quality and adequacy of services and the responsiveness of government officials. This information provided insight into citizens’ priorities and problems and raised the issue of how different services could better meet people’s needs—especially the needs of the poor. Findings The survey findings showed that poor Filipinos used health facilities less than those with higher incomes, despite the fact that a larger percentage of the poor were sick. One in five poor households that used private facilities did not have access to government facilities, especially in poorer and more remote areas. Satisfaction with health care was lowest in urban areas. Payment for health care by the poor was almost entirely out-of-pocket, as insurance coverage was low overall. High prices for medicine were especially burdensome. In education, about 10 percent of school-age children (ages 7 to 12) were not in school during the period of the survey. Dropouts were mostly from poor families, with the reasons most often related to illness or physical disability, followed by economic need and poor academic performance. Very few poor and middle- income households used private schools, which charged tuition fees 10 times as high as public school tuition. Families spent about 2 percent of income on enrollment for each child in school. Water supply services reached about 64 percent of the Filipino population. About a third relied on self-provision from their own wells or rainfall collection. Among the poor, 75 percent were without access to home-piped water, and most of them had not applied for access. The median per capita daily water consumption of the poor was barely 30 liters and was lower among the small percentage that relied on water vendors. Water supplied by all sources was considered unsafe for drinking. Half of the households sampled considered their housing inadequate. The urban poor were less satisfied with their housing than the rural poor. Only 53 percent of poor households owned the land on which their house stood, although a large percentage (81 percent) owned their home. Only 6 percent of poor households applied for housing assistance, while larger percentages of the middle- and high- income groups applied for assistance (9 percent and 14 percent respectively). 146 World Bank 2001b. See also http://www.worldbank.org/participation/philsocial.htm for information on the Philippines social “weather stations” system.

Tools and Practices 16
238
In addition, the approval rate for assistance was lower among the poor than among the higher-income groups. According to the survey, rice was important to the welfare of the poor. Though the availability of subsidized rice was limited, poor people purchased more subsidized rice than those classified as middle- income. Yet higher- income people purchased more rice in general and thus benefited more from the subsidy on the whole. Survey respondents recommended geographical targeting to the poor. Outcomes The Report Card is being used by President Gloria Macapagal-Arroyo’s administration to revise the Philippines Medium Term Development Plan and to develop new poverty alleviation strategies and programs. The Department of Budget and Management intends to institutionalize client feedback and “performance-based budgeting” so that all public agencies will use the information generated by the survey and other measurement tools for allocating funds. This is an unprecedented measure to obtain regular citizen feedback on key public services, bringing citizens directly into the budget allocation process. At the time of writing, a number of “localized” Report Card initiatives are also underway in various cities throughout the Philippines and the report card model is being replicated in other countries like Vietnam, India, and Albania. Methodology The report card survey was undertaken by the World Bank in collaboration with Social Weather Stations, an independent survey research organization in the Philippines. The survey was carried out in March and April 2000 and included a sample of 1,200 households distributed across the four regions (National Capital Region, Luzon, Visayas, and Mindanao) in proportion to population. The questionnaire asked for information on awareness, access, use, and satisfaction related to pro-poor public services in five areas: health care, primary education, housing, water, and subsidized rice distribution. Lessons Learned Similar assessments in the past have failed to make a lasting impact because they were one-time exercises that lacked follow-through. Incentives for reform and improvement are more likely to increase if service providers know they will be monitored again. The Philippine experience points to the need to institutionalize the report card system as a process to be repeated periodically to assess progress (or lack thereof) in service delivery.

Tools and Practices 16
239
Resources Kingdom, Bill, and Vijay Jagannathan. 2001. “Utility Benchmarking: Public Reporting of
Service Performance.” Viewpoint Note 229. World Bank, Private Sector and Infrastructure Network, Washington, D.C.
Paul, Samuel, and Sita Sekhar. 2000. “Benchmarking Urban Services: The Second Report Card
on Bangalore.” Public Affairs Centre, Bangalore, India. Ternopil Urban Development Agency, People’s Voice Project, and International Center for
Policy Studies. 2000. “Educational Policy Reform in the City of Ternopil.” Ternopil, Ukraine.
UFE Foundation, World Bank Institute, International Centre for Policy Studies, and Canadian
International Development Agency. 2000. “People’s Voice Project Survey in Ternopil: Report, July 30, 1999.” Ivano-Frankivsk, Ukraine.
World Bank. 2001a. “Case Study 1: Bangalore, India, Participatory Approaches in Budgeting
and Public Expenditure Management.” Participation Thematic Group, Social Development Department, Washington, D.C.
———. 2001b. “The Filipino Report Card on Pro-Poor Services.” Draft. Participation Thematic
Group, Social Development Department, Washington, D.C.

Tools and Practices 17
World Bank Corruption Surveys In recent years, research and analysis have provided overwhelming evidence that corruption is a regressive tax on the poor. Corruption distorts public resource allocation and impedes access to basic services such as health and education. It discriminates against small and medium enterprises in their access to markets. Evidence shows that poor people tend to spend a larger proportion of their incomes on bribes than citizens in other income categories. Corruption undermines the legitimacy and functioning of the state, affecting even its ability to ensure basic security of life and property. In 1996–97 the World Bank began exploring the use of surveys as a means to “measure” corruption. Illicit and secretive, corruption by its very nature is difficult to quantify using survey instruments. In fact, for many years it was thought that data on corruption were impossible to capture. But experience over the last few years has shown that if designed, targeted, and implemented well, surveys can elicit from victims and even perpetrators of corruption—including households, the private sector, and public officials themselves—perceptions of, as well as experiences with, corruption across the range of public sector institutions. Thus far, the Bank’s experience has demonstrated that:
• Surveys can help diagnose the extent and source of institutional dysfunction in a country, help set reform priorities, and inform policy dialogue;
• They can help quantify the economic and social costs of corruption, and evaluate the quality of public service delivery and of the business environment;
• They represent an empirical approach that turns the policy debate away from a focus on individuals toward a focus on institutions;
• Surveys allow the establishment of baselines against which progress on anti-corruption can be measured;
• Surveys can also provide public information on corruption, which in turn can encourage attention by the executive, parliamentary scrutiny, and greater participation of civil society to stimulate the demand for better governance and measures against corruption.
In short, surveys can be powerful components of strategies to combat corruption and improve governance. Since its initial efforts in 1996–97, the Bank has developed and adapted a range of survey instruments and applied them in a variety of contexts, countries, and regions. A few key efforts are highlighted below.
This note was prepared by Tripti Thomas (PRMPS).

Tools and Practices 17
241
Global Surveys of the Private Sector Surveys of Firms for World Development Report 1997 One of the Bank’s first attempts to use surveys to understand the causes and consequences of corruption was a survey of firms carried out to inform World Development Report 1997: The State in a Changing World (WDR97). This large-scale survey, covering more than 3,600 firms in 69 countries, aimed at understand ing the institutional framework faced by the private sector. Entrepreneurs from a range of small to large firms were asked to evaluate different institutional conditions in their country, such as the security of property rights, the predictability of rule s and policies, judicial reliability, problems with corruption and discretionary power in the bureaucracy, and disruption due to political transitions. Analysis of the survey data flagged the enormous extent to which corruption disrupts private sector activity and development. Respondents in all countries except the high- income OECD countries rated corruption in their countries as among the top three impediments to doing business. As noted in WDR97, “Overall, more than 40 percent of entrepreneurs reported having to pay bribes to get things done as a matter of course. In industrial countries, the figure was 15 percent, in Asia about 30 percent, and in the CIS over 60 percent. … Furthermore, over half the respondents worldwide did not regard a bribe as a guarantee that the promised service would be delivered.”147 It was also found that general arbitrary action by governments (including corruption and red tape) forced businesses to spend excessive amounts of time on negotiating laws and regulations with public officials, rather than on productive activities.148 The World Business Environment Survey The World Business Environment Survey (WBES), initiated in 1999–2000, was intended to build and expand upon the WDR97 survey approach. Under this effort, surveys of at least 100 firms in each of at least 100 countries are envisioned, in order to develop a global dataset on corruption from the perspective of business. The survey instrument is designed to elicit detailed information about bribes in public procurement and bribes as a share of firm revenues. While the dataset is intended primarily for global comparisons, individual country analyses such as those in a May 2001 report on West Bank Gaza149 have also been gleaned from the survey results. One of the best large-scale examples of the WBES effort has been the Business Environment and Enterprise Performance Surveys (BEEPS). Business Environment and Enterprise Performance Surveys Commissioned jointly by the World Bank and the European Bank for Reconstruction and Development, the BEEPS involved surveys of more than 3,000 enterprise owners and senior firm managers in 22 transition countries in ECA. Among other things, BEEPS aimed to identify the many forms of corruption across transition countries. For the first time, it provided the basis
147 World Bank 1997. 148 World Bank 1997. 149 Sewell 2001.

Tools and Practices 17
242
upon which empirical evidence could be gathered on the means through which firms influence the state, leading to introduction of the concept of “state capture” into the anti-corruption lexicon. 150 Whereas administrative corruption refers to the abuse of existing rules, regulations, laws, and policies for private gain, the term “state capture” refers to the actions of individuals, groups, or firms in both the public and private sectors to influence the formation of laws, regulations, decrees, and other government policies to their own advantage as a result of the illicit and nontransparent provision of private benefits to public officials.151 The report Anticorruption in Transition: A Contribution to the Policy Debate used the BEEPS data to explore reform options for the 22 transition countries, using a typology of corruption based on the relative levels of administrative corruption and state capture in each country. 152 The options for reform are presented as integral parts of a multipronged strategy for combating corruption. This multipronged strategy includes addressing institutional restraints, political accountability, a competitive private sector, civil society participation, and public sector management. The recommendations of the report are increasingly being integrated into country analysis, strategy, and policy dialogue in ECA.
Country-Specific Corruption Surveys While the surveys discussed above have primarily involved the application of a single survey instrument to firms across a range of countries, country-specific instruments have also been developed. One such approach has entailed simultaneous surveys of households, firms, and public officials to develop multidimensional profiles of corruption in a country. The surveys of households and firms help establish the status of governance conditions in the country and identify the costs (for example, in the form of lost public revenues, investments, and poverty impacts) of weak governance and corruption. The surveys of public officials also try to get at the sources of weak governance, such as levels of pay, incentive structures, and reporting mechanisms. Given the nature of the phenomena under observation, a triangulation approach is favorable because it allows for corroboration of responses across the different groups of respondents.153 These tripartite surveys gather information on both perceptions of and actual experiences with corruption. First Steps in Albania, Georgia, and Latvia The triangulation approach was pioneered in the ECA region in 1998. Albania, Georgia, and Latvia were the first countries in which such surveys were used, primarily because they were among the first to request assistance from the World Bank on anti-corruption. The analysis of these surveys and comparisons of the results across the three countries revealed in particular that each country faced unique patterns of problems and that the problems had different institutional causes in each country. Notably, the surveys revealed that bureaucrats in all three countries
150 Hellman and others 2000. 151 World Bank 2000. 152 World Bank 2000b. 153 Kaufmann and others 2000.

Tools and Practices 17
243
purchased positions based on expected illicit gains, and that private enterprises would be willing to pay higher taxes rather than deal with corruption. 154 The results of these surveys were widely disseminated in each of the count ries and led to broad public debate. Albania subsequently launched an anti-corruption program, tackling, among other things, patronage in judicial appointments and the civil service, two key sources of corruption. In Georgia, where the surveys pointed to excessive licensing and regulations as prime causes of corruption, subsequent Bank assistance has helped put in place the legal and institutional framework for procurement, licensing, and tax reform. The surveys in Latvia revealed high- level corruption as a serious problem. Accordingly, a key feature of Latvia’s governance PSAL entails the strengthening of institutions to expose and resolve the conflicts of interest that lie at the core of high- level corruption in the country. Expanding Country Coverage and Adapting Approaches Country-specific surveys have since been conducted in a range of countries including Bolivia, Bosnia and Herzegovina, Cambodia, Ecuador, Ghana, Paraguay, Peru, Romania, and Slovakia, and in Uttar Pradesh in India. Smaller-scale surveys have also been conducted at the local and municipal levels, including in Ukraine and Venezuela. In each case, the surveys have been adapted to the particularities of the country environment. In Poland, a different approach was taken with a view to using the process of data collection to build momentum behind the results and encourage ownership of the reform process. Existing surveys conducted by reputable local organizations, polls, audits, and other existing reports and research supplemented a large number of targeted and face-to-face interviews with parliamentarians, judges, government officials, business people, academics, media workers, and NGO representatives.155 Although the surveys differ in approach and methodology, there has been common agreement on the wisdom of garnering perspectives from many segments of society, including public officials. Another underlying commonality has been that in all cases the surveys have been conducted at the request of the client governments. In most cases, the survey results have helped inform anti-corruption strategies, formulated in collaboration with a wide range of stakeholders. Workshops and other mechanisms for building coalitions across all segments of society to formulate, implement, and monitor strategies for change have also been an important common feature in most cases. Surveys of Public Officials In addition to the corruption surveys discussed above, surveys of public officials, while not directly targeted at measuring corruption, have nevertheless proved useful in getting at the same questions of the incentives, costs, causes, and consequences of corruption. Through a set of stand-alone surveys, conducted by the Bank with funding from the Bank Netherlands Partnership Program, more than 7,000 public officials have been surveyed in 16 countries including Albania, Argentina, Bangladesh, Bolivia, Bulgaria, Guyana, Indonesia, Kenya, Macedonia, Moldova, and
154 World Bank 1998a. 155 World Bank 1999b.

Tools and Practices 17
244
countries of the East Caribbean region. These surveys form part of a broader effort to inform work on civil service reform in these countries, and have primarily been used to analyze the institutional factors underlying poor performance in public organizations in developing countries. They have solicited direct input from public officials about the signals they receive from policies, the flow of resources, their perceptions of the formal and informal rules in their organizations, and the consequences of adhering to or breaking these rules. While these surveys have not been targeted toward measuring corruption per se, the survey questionnaires include explicit questions about perceptions of corruption in the public officials’ agencies and in the public sector at large. As with the surveys discussed above, the design has been adapted to fit each country context, and each survey has been followed by a report presenting country-specific findings. Among the varied country results, concerns about poor accountability and corruption emerge as common themes. Solutions for reform, some suggested by the public officials themselves, are being incorporated into economic and sector work such as Institutional and Governance Reviews, and are informing civil service reform strategies in the participant countries.
Practical Considerations in Using Surveys for Anti-corruption Costs and Resources The costs of conducting country- level surveys vary widely among countries depending upon country size, the level of domestic capacity, local conditions and the scope and complexity of the survey exercise. Nevertheless, some cost ranges may be noted. The tripartite country- level corruption surveys have typically cost between $30,000 and $50,000, with an additional $50,000–$100,000 for the processes of country dialogue, design, analysis, dissemination, and linkage to country programs. The public officials surveys funded by the Bank-Netherlands Partnership Program have generally cost between $40,000 and $50,000. Funding for these surveys has largely been provided by bilateral donors such as USAID and the Dutch government. The Bank has mostly funded staff time for dialogue, analysis, outreach, dissemination, and linkages to country programs. Core knowledge and capacity for designing and conducting surveys have been developed in the regional PREM units, WBIGF, and the PREM anchor. These units have developed a host of materials, websites, and other resources (referenced in the list of sources below) that are easily accessible to staff and external audiences looking for country reports, lessons and experiences, and information on methodologies. Challenges and Considerations Data from surveys, as noted above, can be a powerful tool to gauge the extent and nature of corruption and governance problems; to identify practical areas for policy change; and to build the impetus for reform and empowerment. However, data on corruption can also be used ineffectively, or worse still, abused. In using anti-corruption surveys, therefore, some considerations are key:

Tools and Practices 17
245
• Survey methodologies must be carefully designed and adapted, and the analysis must be conducted in a rigorous fashion.
• Surveys should only be implemented in appropriate country environments. Ownership on the part of in-country stakeholders, as well as the capacity and political commitment to follow up on survey findings, is critical to ensure the utility of survey exercises and the credibility of the reform processes during which survey exercises are undertaken. Identifying and building constituencies for reform before embarking on a labor-, time-, and resource- intensive survey is a precondition for effectiveness.
• Public dissemination of survey results is obviously crucial, but the process of dissemination must be carefully considered, and just as importantly, owned and agreed to by the client government. In addition, cross-country comparisons must be made with care, given the many different underlying methodologies, as well as the delicate relationships of trust that enable the Bank to conduct corruption surveys in its client countries.
The key challenge remains that of translating data on corruption, a fundamentally negative phenomenon, into positive strategies and action for change.
Resources Hellman, Joel, Geraint Jones, and Daniel Kaufmann. 2000. “Seize the State, Seize the Day: An
Empirical Analysis of State Capture and Corruption in Transition.” Policy Research Working Paper 2444. World Bank, Development Research Group, Washington, D.C.
Hellman, Joel, and Daniel Kaufmann. 2001. “Confronting the Challenge of State Capture in
Transition Economies.” Finance and Development 38 (3). International Monetary Fund, Washington, D.C.
Kaufmann, Daniel, Aart Kraay, and Pablo Zoido-Lobaton. 2000. “Governance Matters: From
Measurement to Action.” Finance and Development 37 (2). International Monetary Fund, Washington, D.C.
Manning, Nick, Ranjana Mukherjee, and Omar Gokcekus. 2000. “Public Officials and Their
Institutional Environment: An Analytical Model for Assessing the Impact of Institutional Change on Public Sector Performance.” Policy Research Working Paper 2427. World Bank, Development Research Group, Washington, D.C.
Narayan, Deepa, Raj Patel, Kai Schafft, Anne Rademacher, and Sarah Koch-Schulte. 2000.
Voices of the Poor: Can Anyone Hear Us? New York: Oxford University Press. Sewell, David. 2001. “Governance and the Business Environment in West Bank/Gaza.” Middle
East and North Africa Working Paper 23. World Bank, Washington, D.C.

Tools and Practices 17
246
World Bank. 1997. World Development Report 1997: The State in a Changing World. New York: Oxford University Press.
———. 1998a. “New Frontiers in Diagnosing and Combating Corruption.” PREM Note 7.
Poverty Reduction and Economic Management Network, Washington, D.C. ———. 1999a. “Using Surveys for Public Sector Reform.” PREM Note 23. Washington, D.C. ———. 1999b. “Corruption in Poland: Review of Priority Areas and Proposals for Action.”
World Bank, Warsaw. ———. 2000a. “Cambodia Governance and Corruption Diagnostic: Evidence from Citizen,
Enterprise and Public Official Surveys: New Empirical Tools for Anti-corruption and Institutional Reform.” Report prepared by the World Bank for the Royal Government of Cambodia. World Bank Institute, Washington, D.C.
———. 2000b. Anti-corruption in Transition: A Contribution to the Policy Debate. Washington,
D.C.: World Bank.
Websites World Bank Anti-corruption www.worldbank.org/publicsector/anticorrupt WBI Governance and Anti-corruption www.worldbank.org/wbi/governance Administrative and Civil Service Reform www.worldbank.org/publicsector/civilservice

TOOLS AND PRACTICES 18
Public Expenditure Tracking Surveys When assessing service delivery, most surveys examine the effects of policies or interventions on households and their demands for and perceptions of the quality of services. Inputs and outputs on the supply side—such as the flow of public funds and school enrollment rates—are left for official statistics or administrative records. Public Expenditure Tracking Surveys (PETS) and Quantitative Service Delivery Surveys (QSDS) are two new tools that seek to document service delivery on the supply side, and have proven effective in increasing both the accountability and the effectiveness of service providers. In both instruments, the facility or frontline service provider is typically the main unit of analysis, in much the same way that the firm is the unit of observation in enterprise surveys and the household in household surveys. Diagnostic surveys such as these can provide vital information for decision makers when institutional weaknesses inhibit a more regular flow of information. They are particularly helpful in identifying areas where actions are needed to improve the relationships among different levels of government involved in service delivery; illustrating areas where information asymmetries exist among agencies; and highlighting opportunities for more effective means of accountability within agencies, among agencies at different levels, and between agencies and end users. When surveys are strategically designed, their findings can help induce policy change by making it easier for policy makers to find solutions. This note describes these tools in more detail and highlights their recent application in Uganda, Tanzania, Ghana, and Honduras.
What Are the PETS and QSDS? When increases in public spending do not appear to be generating improvements in the delivery of basic services, two explanations are possible. One possibility is ineffective transfers of funds among public sector agencies, such as leakage of funds that prevents spending from reaching the intended end producer. A second possibility is deficiencies in the capacity of end users to create valuable goods and services, along with waste and corruption. Because of this, micro- level tools are needed to reveal provider behavior and illuminate the translation of public spending into services, where the quantity and quality of services reflect the public funds spent on them. PETS and QSDS have recently been tested in several countries to document frontline service delivery from public, private not- for-profit, and private for-profit providers. The PETS and QSDS approach focuses on provider behavior in general, including issues of incentives, oversight, accountability, and multiple-principal multiple-agent dynamics in the public sector. As information on actual public spending is generally unavailable in many developing countries, the PETS was designed to provide the missing information from different tiers of government
This note was prepared drawing from work by Ritva Reinikka and Jakob Svensson (2002), compiled by Bryan Kurey, with guidance from Deepa Narayan.
Tools and Practices 18
248
and frontline service facilities. It focuses on collecting micro- level data on the characteristics of the service facility, the nature of financial flows from facility records, outputs, and accountability arrangements. In this process, a PETS can also help uncover where and to what extent corruption and abuse are leading to breakdowns in service delivery systems. Nearly all applications of the PETS so far have been in the health and education sectors, although the survey can be applied in other areas as well. In the QSDS, quantitative data are collected both through interviews and directly from the service provider’s records. Facility data can be “triangulated” by also surveying local governments, umbrella NGOs, and private provider associations. The compilation of facility-level quantitative data typically requires much more effort than, say, a perception survey of service users, which makes the QSDS both more costly and time consuming to implement than its qualitative alternatives.156 The PETS and QSDS can be conducted in conjunction, and their combination allows a direct evaluation of the effect of wider institutional and resource-flow problems on frontline service delivery. In general, the surveys have two broad uses. First, they serve as diagnostic tools on service delivery, enabling the analysis of public expenditure priorities to take into account the implementation capacity of governments. Second, these surveys provide primary data on service providers for empirical research, data that up to now have been severely lacking on questions of incentives and moral hazard.157
PETS in Practice Several countries have already implemented diagnostic Public Expenditure Tracking Surveys, while the QSDS is just beginning to be applied in a number of countries. This section reviews the experience gained from the use of PETS in Uganda, Tanzania, Ghana, and Honduras. Analysis of these surveys provides several key findings, particularly related to information and accountability:
• Information. The surveys show that the flow of funds to the frontline and the efficacy of service delivery agencies are seriously hampered by information asymmetries, both among agencies at different levels and between agencies and end users. further, as access to and ability to acquire information differ among segments of society, the actual programs benefits may also be unequally distributed. In addition, the surveys show that cash budgeting, deemed necessary in a number of low-income countries to bring about fiscal discipline, has serious negative side effects in that it produces volatile monthly releases of funds, aggravating the informational disadvantage that beneficiaries typically have. This may lead to substantial leakage of funds.
• Accountability. Nonwage expenditures are found to suffer more from leakage than salary expenditures. Furthermore, the sources of leakage can be located at different tiers of government. In Uganda and Tanzania, the most serious leakage arose at the local
156 Examples of these survey instruments can be found at www.publicspending.org (tools). 157 For further information on the diagnostic, data collection, and research benefits of the PETS and QSDS, along with the potential for capacity building, see Reinikka and Svensson 2002.
Tools and Practices 18
249
government level, while in Ghana it occurred before the resources reached the local government.
Uganda In 1996 Uganda became the first country to carry out a PETS, prompted by the observation that despite a substantial increase in public spending on education since the late 1980s, officially reported primary enrollment remained stagnant. The PETS compared budget allocations to actual spending through various levels of government, including frontline service delivery points, in primary education and health care. It also collected quantitative data on outputs produced by schools and clinics, as well as data on facility characteristics. Adequate public accounts were not available to report on actual spending, so the surveys of 19 districts (out of 39), 250 government primary schools, and 100 health clinics collected a panel dataset on spending (including in-kind transfers) and outputs for 1991–95. The school survey showed that, on average, only 13 percent of per-student nonwage funds distributed annually by the central government reached schools during the survey period. Eighty-seven percent either disappeared for private gain or was used by district officials for purposes unrelated to education. Most schools (roughly 70 percent) received very little or nothing. In fact, based on yearly data 73 percent of the schools received less than 5 percent, while only 10 percent of the schools received more than 50 percent of the intended funds. Although the trend was showing improvements over time, by 1995 only 22 percent of funds reached the schools. The survey confirmed that public primary education was mostly funded by parents who contributed up to 73 percent of total school spending in 1991 (42 percent at the median school). While the government’s share increased during the survey period, by 1995 parents still financed 60 percent of total primary school spending on average; furthermore, parental contributions continued to increase in real terms despite higher public spending. The survey quantified the adverse effects of asymmetric information on the flow of funds. Because local government officials have an informational advantage regarding the amount of funds received as transfers, they can obtain rents at the expense of PTAs simply by reducing the amount of funds actually used for the school. Following publication of the survey findings, the central government began publishing the monthly intergovernmental transfers of public funds in major newspapers and broadcasting the information on radio, and required primary schools to post information on inflows of funds for all to see. This not only made information available to PTAs, but also signaled to local governments that the center had resumed its oversight function, thus creating incentives for increased accountability among local agencies. Initial assessments of these reforms a few years later, through two locally implemented follow-up PETS, show that the flow of intended capitation grants improved dramatically, from 13 percent (on average) reaching schools in 1991–95 to about 80 to 90 percent reaching schools in 1999 and 2000.
Tanzania Tanzania implemented two Public Expenditure Tracking Surveys in 1999 and 2001 to investigate the suspicion that serious problems existed in the flow of funds from the central government via

Tools and Practices 18
250
the local authorities to frontline service facilities. The first Tanzanian PETS, which covered 45 primary schools and 36 health facilities in three districts, found tha t local councils diverted a large part of funds disbursed by the center for nonwage education and health expenditures—57 percent in education and 41 percent in health care—to other uses as well as private gain. Salaries appeared to be less prone to diversion, but payrolls suffered from ghost workers and frontline staff suffered delays in pay. The second PETS covered four primary schools and four clinics in each of five districts. Considerable delays in disbursement of funds were found at all levels of government, particularly for nonwage expenditures and in rural areas. Rural districts received a smaller share of the intended resources than urban districts. One important cause of this was cash budgeting leading to volatile transfers due to fluctuations in revenue, which in turn gave rise to information asymmetry as it became increasingly difficult for beneficiaries to know the amount of their monthly allocation or entitlement. Council staff took advantage of these information asymmetries in their relationship with service facilities. Similarly, highly aggregated government records were found to undermine transparency in public spending. The findings of the two PETS were disseminated during the national budget consultations, but they have not yet had as strong a catalytic effect on central government oversight or transparency arrangements as the PETS in Uganda. The Treasury has begun regular dissemination of itemized local government budgets to members of Parliament and regular publication of budget allocations for the selected pro-poor spending programs in both Swahili and English- language newspapers, covering allocations for ministries, regions, and local authorities. Ghana Ghana implemented a PETS in 2000 to estimate the leakage of funds in the transfer from central government via districts to basic education and primary health care facilities. The Ghana PETS covered four districts in each of the 10 regions, with interviews of 40 district education officers and 40 district health officers, and a survey of 119 primary schools, 79 junior secondary schools, and 173 primary health clinics. The survey found that only about 20 percent of nonwage public health expenditure and 50 percent of nonwage education expenditure reached frontline facilities. As observed in Uganda and Tanzania, the leakage in salaries, in contrast, was much smaller. Contrary to the Ugandan and Tanzanian experience, a large proportion of the leakage seemed to occur between line ministries and district offices during the process of translating public expenditures from funds into in-kind transfers. The in-kind nature of transfers gave rise to information asymmetries and lack of accountability within the delivery system, and discouraged opportunities for feedback from frontline facilities regarding their resource needs or complaints. The possibilities for leakage were found to be much greater when the value of the materials distributed was unknown to their recipients. The PETS opened an avenue for interministerial collaboration and provided a practical approach for assessing frontline expenditures and service delivery. However, it has not yet been able to catalyze a strong response to reduce leakage.

Tools and Practices 18
251
Honduras Honduras used the PETS to diagnose moral hazard with respect to frontline health and education staff, demonstrating that issues related to staff behavior and incentives in public service—such as ghost workers, absenteeism, and capture of multiple jobs by employees—can have adverse effects on service delivery. The hypothesis of the PETS was that the central payroll office in Honduras has no means of ensuring that public employees really exist and that they are actually working where they are supposed to work. The objective of the PETS was thus to quantify the incongruity between budgetary and real assignments of staff and to determine the degree of attendance at work. In the health sector, 2.4 percent of staff were found to be ghost workers. Absenteeism is a generic problem, with an average attendance rate of 73 percent across all categories of staff (meaning that only 73 percent of staff members were at work in the five days prior to the survey). Thirty-nine percent of these absences were without legitimate reason (such as sick leave, vacations, and compensation for extra hours worked). In addition, multiple jobs were prevalent, especially for general practitioners and specialists: 54 percent of specialist physicians held two or more jobs, of which 60 percent were in a related field. Slightly over 5 percent of staff members had migrated to posts other than those to which they were assigned in the central database, while 40 percent had moved since their first assignment. In the education sector, 3 percent of staff members were found to be ghosts, while only 5 percent of primary school teachers were unknown in their place of work. Absenteeism is less of a problem than in the health sector, with an average attendance rate of 86 percent across all categories of staff and 15 percent of all absences unexcused. As the PETS study was carried out fairly recently, there has not yet been much follow-up within government of the findings.
Resources Ablo, Emmanuel, and Ritva Reinikka. 1998. “Do Budgets Really Matter? Evidence from Public
Spending on Education and Health in Uganda.” Policy Research Working Paper 1926. World Bank, Africa Region, Macroeconomics 2, Washington, D.C.
Reinikka, Ritva. 1999. “Using Surveys for Public Sector Reform.” PREM Note 23. World Bank,
Development Economics and Poverty Reduction and Economic Management, Washington, D.C.
———. 2001. “Recovery in Service Delivery: Evidence from Schools and Health Centers.” In
Ritva Reinikka and Paul Collier, eds., Uganda’s Recovery: The Role of Farms, Firms, and

Tools and Practices 18
252
Government. World Bank Regional and Sectoral Studies. Washington D.C.: The World Bank.
Reinikka, Ritva, and Jakob Svensson. 2002. “Assessing Frontline Service Delivery.” World
Bank, Development Research Group, Public Services, Washington, D.C.

TOOLS AND PRACTICES 19
Private Enterprise Surveys of the Business Environment
Recognizing the private sector’s efficiency at allocating resources and spurring economic growth, the World Bank Group seeks to identify obstacles to its development. Listening to the problems of active entrepreneurs is an important step toward identifying needed reforms in the enabling environment and support systems for private enterprise. Surveys give greater confidence in the Bank’s conclusions and credibility to its recommendations. Recent initiatives in the Bank have attempted to bring greater uniformity to the questions asked and the implementation methodology of surveys, in order to better leverage resources to generate internationally comparable indicators of investment climate conditions. The use of surveys offers a number of advantages that complement other methods in identifying business experience in, and perceptions of, the local investment climate. Bank staff often have limited sources of information on the local business environment: official statistics, contacts with public officials, discussions with a limited number of experts and representatives of large firms, as well as the collection of other existing data. In the context of brief missions often centered in the seat of government, Bank staff have limited possibilities to obtain a complete and objective understanding of the views and experiences of the entire business community. A properly structured survey can help to break out of this box. Surveys can generate a rich body of fact (and anecdote) that illuminate: (a) the relative priorities for reform as perceived by businesses; (b) the private costs imposed by constraints in the enabling environment and support systems (and/or their impact on firm-level performance); and (c) the functioning of policies “on the ground” in a country’s unique institutional environment. For example, the Pakistan Private Sector Assessment Survey (1995) showed that Karachi firms lost an average of 25 working days a year to ethnic and political unrest. The unreliability of the electric power supply cost Pakistani firms an average of 21 working days a year, and two-thirds of firms owned generators to compensate for the faulty public power supply. These generators cost an average of $240,000 to buy (although prices varied widely) and $62,000 a year to run. The results of uniform questionnaires uniformly administered may also be compared across countries to better evaluate responses using international comparators, and to begin to understand patterns in economic and institutional problems facing private enterprise both by location and over time. For example, the 1999–2000 World Business Environment Survey (WBES) was implemented in 80 countries around the world. Econometric analysis of the results of the WBES shows that perceived severity of policy uncertainty and instability as a constraint and perceived severity of corruption as a constraint are both negatively associated with firm-level sales growth and foreign direct investment at the national level. This annex was prepared by Andrew H. Stone (PSAFB).

Tools and Practices 19
254
Hence, the use of properly designed survey instruments should enhance the credibility of Bank analysis and recommendations in the eyes of governments, the business community, and other donors. However, for results to be useful, care must be taken in the design of a questionnaire (“survey instrument”), the selection of a sample, the administration of the survey, and the analysis and interpretation of the results. While surveys can be performed economically, it is unwise to cut corners in planning and implementation. Equally important, survey results must be kept in perspective. The value of this new source of information in no way argues for the abandonment of other sources, such as traditional economic analysis. Firms’ responses have certain biases—in general they would like lower costs and less competition—suggesting that results should always be weighed against other information sources and interpreted with common sense. In other cases, the main contribution of surveys is to make private sector priorities clear. For example, although “taxes and regula tions” ranks high on the list of constraints in most regions, the majority of African firms responding to the WBES did not place this even among their top five problems. Instead, the issues of financing, corruption, infrastructure, inflation, and “street crime/theft/disorder” led the priorities of private enterprises in Africa. In addition, private enterprise surveys can document the state of business practice, including financial management, personnel management, technological innovation, and marketing. Information on business practice can help the Bank to understand both where enterprises are starting from (which will shape the design of interventions) and what services they would find useful. Detailed studies and panel studies such as the Regional Program on Enterprise Development (RPED) conducted in Africa and the series of studies described in Tan and Batra’s Enterprise-Led Training in Developing Countries allow econometric analysis of the determinants of firm-level productivity and performance in various dimensions, such as investment, growth and exports.158 If repeated, they can allow the tracking of trends over time. An RPED study using cross-country data from Ghana, Kenya, and Zimbabwe, for example, finds that access to short-term working capital increases value added in firms by as much as 40 percent.159
Survey Design The focus of a survey can be determined by:
• Collecting and reviewing existing knowledge about the private sector through relevant documents and discussions with operational staff, and in the process, learning what experts currently understand to be the priorities for promoting private sector development.
• Identifying gaps in knowledge on key issues and on the role and structure of the private sector.
158 Tan and Batra 1995. 159 Biggs and Srivastava 1996.

Tools and Practices 19
255
Increasingly, however, the World Bank Group relies on standardized core questions applied across multiple countries to represent the experiences and perceptions of businesses in comparable ways across countries and over time. In the field, surveys should be accompanied by traditiona l information described above. Most surveys to date have relied on some form of stratified random sampling. Strata have been chosen either broadly to represent the entire economy (such as by sector, location, and/or size), or more narrowly to investigate priority areas of the economy (such as the manufacturing sector) or to highlight phenomena of special interest (such as industries with long contracting horizons versus industries with short ones, nontraditional exporters, etc.). Across or within selected strata, a list of industries is acquired which constitutes the sample frame. Then a random, structured, or stratified selection method is employed. In cases where available lists are known to have systematic biases, nonrandom methods (such as quota sampling) or area-based methods have been used to improve representation of smaller or less formal enterprises, or to highlight characteristics of certain groups (such as foreign investors). Sample design often suffers from rushed implementation and limited budget. Business environment enterprise surveys have generally been performed under strict time and budgetary constraints. Therefore, the instrument itself has been kept short, so that it can be completed in a single one- to two-hour sitting with an entrepreneur, and so as to ensure that randomly selected entrepreneurs will complete their responses. In order to achieve this brevity, survey designers have been forced to make tradeoffs between breadth and depth. In general, the breadth approach is more useful for charting unknown terrain, while the depth approach is more useful in countries where the terrain is known, but economic or institutional details in a few areas are unknown. Some efforts have used much longer surveys, but have asked only a limited amount of time from each of several individuals associated with the enterprise (such as the director, the chief financial officer, workers, etc.). Questionnaires are usually divided into sections, beginning with simple (and safe) background information and moving on to a series of substantive areas of the designer’s choosing, such as “regulation,” “finance,” and “infrastructure.” A typical sequence of questions would move from the general to the specific to the comparative. For example, a section of a questionnaire on regulation often begins with an open-ended question such as: What are your three worst problems with regulation and regulatory agencies? This allows researchers to gain an unbiased overview of what is bothering entrepreneurs before they possibly bias that view by suggesting specific issues of concern. Next, detailed questions, combining short-answer questions and multiple choice, address the specific agenda. Finally, either at the end of each section or at the end of the entire survey, a ranking question can elicit the relative importance of the constraints just discussed. In a “nested” approach, each section of the questionnaire ends with a ranked constraint question on a particular category (such as regulation, infrastructure, or finance). Then, either at the beginning or the end, each category of constraints is compared in a ranking question, which also adds general constraints not previously covered in the detailed sections of the survey (such as some macroeconomic and political constraints). A critical concern of surveys has been to evaluate business costs—particularly the burden imposed on businesses by the fiscal and regulatory environment and by inadequate public

Tools and Practices 19
256
infrastructure, financial systems, and other services. Initially surveys focused on relative costs, using ranked responses. This methodology rests on the hypothesis that the constraint rankings assigned by firms reflect the (unobserved) incremental costs associated with the constraints. Therefore, constraint scores reveal the ranking of the shadow prices for different constraints. Such rankings allow comparisons, and allow investigators to determine the enterprise characteristics associated with high and low constraint scores, as well as to identify the collective business perspective on priorities for reform. For example, the WBES survey is based on a nested structure of constraint and qualitative rankings, with a general constraint question and specific sets of questions on regulatory constraints, financial constraints, quality of public services, etc. However, ranking does not assign a monetary equivalent to the constraint score. Increasingly, surveys have also focused on obtaining quantitative estimates of costs. Direct cost estimates prove particularly useful for the analysis of regulatory burden and other costs involving discrete payments or expenditures of time by the firm. Direct questions ask about expenditures of money or time on particular activities or items, such as the cost of business licenses or the monthly operating cost of a generator to compensate for poor public power supply. In addition, questions may concern lost days of business due to, for example, inspections, power interruptions, or strikes. Indirect questions attempt to get entrepreneurs to assign values to items without well-defined monetary or labor costs. Contingent valuation questions ask entrepreneurs what percentage of gross sales they would sacrifice to be free from particular constraints. As noted above, enterprise surveys are increasingly designed to maximize comparability with work in other countries or periods. The use of “core” groups of questions in surveys is beginning to allow international comparisons of the severity of, and costs imposed by, different constraints in the investment climate.160 For valid comparisons to be drawn, sample design must also be standardized.
Survey Implementation Before a survey is launched, the questionnaire itself must be tested to ensure that the questions are comprehensible to respondents, that they elicit the desired information, that none of the questions seriously offends or threatens respondents, and that the entire survey does not take too long. There will always be problems or opportunities to improve questions, and opportunities to adjust language and questions to local usage and local institutions—something that will increase respondents’ enthusiasm. Survey costs vary substantially depending on a number of conditions, including the length and design of the survey itself, the number of firms to be included, the number of different economic sectors examined, and the number and dispersion of locations at which the survey will be administered. They also depend on who administers the survey. For multi-country surveys, the use of international survey firms may bring greater standardization, but also increases costs. Local consultants usually bring with them important local knowledge, language skills, and the ability to quickly mobilize local surveyors, and they cost much less than international consultants
160 Several standard survey modules can be found at the following site: http://www1.worldbank.org/beext/resources/assess-wbessurvey-alt.htm

Tools and Practices 19
257
or Bank staff. However, the feasibility of using them depends on local supply conditions and the intensity of supervision they require. In assessing a local consultant, the following factors are key:
• Experience carrying out enterprise surveys or, next best, public opinion or market research surveys;
• Knowledge of business issues from an entrepreneurial and a policy perspective; • Access to sources of information on firms required to construct the sample frame; • Access to firms; • Ability to mobilize, train, and supervise surveyors (enumerators); • Ability to control quality in survey implementation, data entry, and analysis; • Ability to analyze or assist in analyzing results both quantitatively and qualitatively.
Even with experienced local consultants, proper orientation and training are key. Very few have administered a World Bank private enterprise survey, so the type of questions being asked and even the subject of the survey may be unfamiliar to them. It is important to orient them to the purpose of the survey, the etiquette of interviewing, the importance of confidentiality, and the correct methods of recording and encoding data. It is useful to illustrate the value of surveys with examples from past Bank work. Completed forms must be checked to ensure accurate and consistently recorded responses. Inadequate supervision may lead to large data losses because of errors in entry, unreadable responses, or incomplete forms. Before responses can be analyzed, they must be put into a tractable form, generally by entry into a spreadsheet, database, or statistical software program. In the process, most responses are coded so that a number represents a particular response (for example, 0 for “no” and 1 for “yes”). Clearly, the accuracy of this process is vital to the usefulness of all the work that precedes it. Data should be scanned for obvious errors, and entries should be checked against the actual survey forms from which they were recorded. In general, effective reporting on survey results combines quantitative analysis with qualitative interpretation.
Ongoing International Initiatives Different survey instruments are appropriate for different purposes. Some recent examples:
• The World Business Environment Survey focuses on perceptions of factors external to a firm. Based on samples of about 100 firms in some 80 countries, the WBES covers perceptions of the national business environment as shaped by local economic policy; governance; regulatory, infrastructural, and financial impediments; and the quality of public services.
• The Regional Program on Enterprise Development in Africa (RPED) and Firm Analysis and Competitiveness Survey (FACS) focus on selected factors, both internal and external to the enterprise, and relate them to firm productivity and performance, based on detailed firm-level financial data.
• Regulatory and administrative costs surveys document time and monetary costs of various procedural requirements, such as tax and customs compliance, business registration, obtaining land and premises, and complying with product conformity
Tools and Practices 19
258
assessment procedures. These have been implemented in a number of Eastern European countries.
• The SME mapping survey which adds to the WBES core details on financing, business services, and bus iness information.
In a major recent initiative, the Bank Group has created an Investment Climate Unit (ICU)161 to standardize its approach to assessment through surveys and indicators. This unit has already generated a standard core instrument for investment climate assessment, drawing on the best elements of each of the above-mentioned instruments. The core survey provides the basis to link investment climate conditions to firm-level productivity. Additional modules of questions are under development to evaluate regulatory compliance costs, SME and foreign investor concerns, and details of financing and labor issues. The ICU is now working to develop a standard methodology for a core survey sample design.
Using Results In order to use survey results appropriately, staff should understand their applications and limitations. Firm-level surveys fill gaps in existing information by supplying firm-specific information. In general, survey data is better at identifying problems than identifying solutions, so the survey represents only one step in improving the business environment. However, properly designed surveys have a distinct legitimacy with local businesses and policy makers, and thus make an excellent focal point for consultations on policy and projects. In order to make survey results useful to clients and country strategy and operations, surveys should be followed up by direct consultation with both government counterparts and the private sector on priority issues and implications arising from the survey. In 2000–01, the FACS India survey was carried out by the World Bank in collaboration with a leading local business association, the Confederation of Indian Industries. Results were discussed at two seminars (in Bangalore and Hyderabad) in 2001 involving representatives of government, business, NGOs, and donors. Further consultative conferences in Delhi, Bombay, and other locations will disseminate findings and discuss their implications for policy reform.
Resources Biggs, Tyler, and Pradeep Srivastava. 1996. “Structural Aspects of Manufacturing in Sub-
Saharan Africa.” World Bank Discussion Paper 346. Africa Technical Department Series. Washington, D.C.
161 See the ICU website at http://rru.worldbank.org

Tools and Practices 19
259
Tan, Hong W., and Geeta Batra. 1995. “Enterprise Training in Developing Countries: Incidence, Productivity, Effects, and Policy Implications.” World Bank, Private Sector Development Department, Competition and Strategy Unit, Washington, D.C.

TOOLS AND PRACTICES 20
Participatory Poverty Diagnostics In order to devise effective and appropriate strategies for poverty reduction and economic and social development, it is essential to understand levels of poverty, how poverty occurs, why it persists, and how it can be alleviated.162 A variety of data collection instruments, including household surveys, are necessary to understand the multidimensional nature of poverty and the realities that determine the opportunities and barriers poor people face in their efforts to move out of poverty. This note describes the methods and value of Participatory Poverty Assessments for understanding poverty and presents examples of participatory poverty diagnostics conducted in Tanzania, Vietnam, Uganda, and Guatemala.
Participatory Poverty Assessments A Participatory Poverty Assessment, or PPA, is an iterative, participatory research process that seeks to understand poverty in its local, social, institutional, and political contexts, incorporating the perspectives of a range of stakeholders and involving them directly in planning follow-up action. While the most important stakeholders involved in the research process are poor men and women, PPAs can also include decision makers from all levels of government, civil society, and the local elite in order to take into account different interests and perspectives and increase local capacity and commitment to follow-up action. Because PPAs address national policy, micro-level data are collected from a large number of communities in order to discern patterns across social groups and geographic areas. PPAs are usually carried out by NGOs, academic institutions, government extension workers, or local consulting firms. They use a variety of participatory research methods, including community mapping, flow diagrams showing links and causes of deprivation, seasonal calendars, matrix analysis, and rankings of wealth or wellbeing. They incorporate anthropological methods, including semi-structured interviews with key informants about poverty-related issues and institutions. While PPAs and more traditional quant itative poverty diagnostics should be viewed as complementary, two underlying principles make the participatory approach different from other research approaches. First, the PPA methodology engages respondents actively in the research process through the use of open-ended and participatory methods. Second, it assumes that the research process will empower participants and lead to follow-up action. The design of a PPA depends on the purpose of the study being conducted. PPAs have become increasingly common since the early 1990s. In 1994 only one-fifth of the World Bank’s country-level poverty assessment reports incorporated PPA material. In 1995 one-third included PPAs, and between 1996 and 1998 PPAs were included in half of all Bank poverty assessments.
This note was prepared by Laura Bureš, with inputs from Bryan Kurey (PRMPR), under the overall guidance of Deepa Narayan (PREM). 162 This introductory section draws on Narayan 2000 and Robb 2000; for more information, see also Norton 2001.

Tools and Practices 20
261
The Tanzania Participatory Poverty Assessment In 1995 the government of Tanzania, the University of Dar es Salaam, and the World Bank conducted a PPA involving more than 6,000 people in 87 villages across Tanzania.163 The World Bank and the British Overseas Development Agency provided financial assistance for the project. Methodology The PPA combined qualitative and quantitative data collection methods and tools, including participatory tools such as community mapping, group discussions, and Venn diagrams; key informant interviews; and household survey instruments. The issues explored included how poor Tanzanians view poverty, perceptions of inflation and other trends over time, the effects of liberalization on the rural poor, access to and use of formal and informal credit and savings institutions, the role of social capital in household welfare, and the relationship between poverty and the natural environment. Different sampling techniques were used for a household survey focusing on expenditures, along with a range of participatory tools. To establish credibility and ensure that the PPA was broadly representative of rural areas as a whole, 100 villages were selected throughout the country. These villages were part of the National Master Sample framework that had been established by the government’s Planning Commission. All national- level studies in Tanzania—including a human development survey conducted by the government and the World Bank—are done in these villages to allow researchers to generalize findings to the national level and to ensure that findings from one survey can be compared and contrasted with data from other studies. The 15 households selected in each village for the household survey were the same as those randomly selected for the national agricultural survey. Six to 12 discussion groups of men, women, and youth were conducted in each village. Before the PPA team entered a village, the community was informed so that village leaders and community members would be available to meet with the team during their stay. To ensure that group discussions were not dominated by the more powerful community members, the team supervisor met with local elites while the research team focused on the broader community. Participatory data collection tools Two participatory methods were used in the Tanzania PPA. SARAR (Self-esteem, Associative Strength, Resourcefulness, Action Planning, and Responsibility) relies on visual exercises to generate discussion and involvement. Participatory Rapid Appraisal (PRA) is based on open-ended dialogue and community- level analysis. Various participatory tools were administered in discussion groups of men and women, usually segregated by gender to conform to local culture and to ensure that women felt the freedom to speak frankly. These participatory tools included:
163 This section draws on Narayan 1997.
Tools and Practices 20
262
• Mapping. Groups were asked to draw a map of their community, marking key features of the village and drawing in households which were labeled according to wealth status later in the process.
• Poverty characteristics and wealth ranking. Once trust was established between the PPA team and the village group, people were asked to identify characteristics of five different wealth groups, from very rich to very poor. After consensus was reached on the defining characteristics, people used colored stickers to classify households into these categories.
• Seasonal analysis. People were asked to draw a matrix, with months on the horizontal axis and activities or resources on the vertical. Discussions focused on how people coped across seasons, over years, and during periods of hardship.
• Trend and price analysis. Groups plotted changes they had noticed in availability of services and prices of food and important commodities at the beginning of the liberalization process (a decade earlier) and when basic food commodities were liberalized in 1991.
• Venn diagrams. Groups were asked to draw a large circle representing the community and circles of various sizes representing village- level groups and institutions. Size indicated importance, overlapping circles represented overlapping membership, and lines between them indicated interaction. Discussions focused on the membership, structure, and functioning of village groups and the relationships between them.
• Problem identification. Drawings by local artists and community members were used to depict a variety of problems and issues. People were provided with blank paper to draw a problem they faced if it was not already depicted. Participants ranked the five most important problems affecting their lives through a voting exercise, and these issues were then discussed in depth.
• Story with a gap. This activity began with two pictures, one showing a poor, unproductive farm and the other a prosperous farm. Using the pictures, people discussed the situation of their own farms. The discussion then moved on to how to turn a poorly functioning farm into one that works well. Pictures were drawn to represent the crops and ecology of different agro-ecological zones.
• Gender analysis. A local artist drew three large pictures of a man, a woman, and a couple. People were then handed more than 30 smaller pictures of different objects including land, a house, household items, babies, and young children. The group was asked to arrange these pictures under the man, woman, or couple to indicate who owned which possessions during marriage. Then people were asked what happened to property in situations of divorce, separation, or death of a husband.
• Key informant interviews. Much of the information obtained through groups was also asked of key informants, who included village officials, schoolteachers, and others. In each village, discussions were held with two or three key informants. Information that did not tally was further cross-checked.
• Household surveys. A two-part household questionnaire was developed, including a Social Capital and Poverty Survey (part one), and the household expenditure and consumption module of the 1993 Human Resources Development survey (part two). Part one focused on social capital issues, agriculture, savings and credit, environmental issues, and three measures of poverty, including wealth rankings and household asset indices.
• District-level workshops. Because district officials implement many of the programs that affect the poor, each PPA team held a one-day workshop at the district level to brief

Tools and Practices 20
263
district officials about the study, explore their attitudes toward knowledge about poverty, learn the reach of their programs, and share preliminary findings from the field. These officials also participated in mapping and story-with-a-gap techniques related to poverty and agriculture in their district.
Data analysis The PPA study drew on the content analysis and field notes of 29 fieldworkers who generated more than 100 notebooks of village- level data. Fieldwork was done by six teams who received training for three weeks in the various participatory data collection tools. Team members were drawn from the University of Dar es Salaam, other research institutes, and government ministries, as well as from respondents to a newspaper advertisement. Each team was headed by a senior social scientist, half of them men and half women, and the work was supervised by a World Bank sociologist. In addition, the study relied on approximately 1,500 household questionnaires as well as regional reports written by team supervisors. All data gathered through participatory methods were subject to systematic content analysis, and statistics were obtained, where appropriate, through a step-by-step aggregation of village data. Field teams checked the quality of household survey data, and a private firm in Nairobi, Kenya, entered the data into a computer. Data were cleaned and checked for accuracy. Statistical analysis consisted of a step-by-step process involving frequencies, cross tabs, index construction, and model testing. Findings The Tanzania PPA provides a unique example of a case in which a PPA was done in the same villages and using the same samples as a household survey. As a result, it proved particularly useful in comparing the findings and benefits of both quantitative and qualitative methods. In this case, with the exception of findings on availability of drinking water and the status of female-headed households, the aggregate results of the two approaches turned out to be very similar, with the PPA generating more subtle and detailed findings in a number of areas, some of which had been previously overlooked. The PPA’s overall findings revealed inflation in prices in rural areas, widespread need for rural credit, and people’s desire to save. The study found that while many poor Tanzanians faced hardship as a result of cutbacks in government subsidies, most favored expanded opportunities to improve their livelihoods rather than a return to subsidies. In defining categories of wealth, land ownership was nearly always the first characteristic mentioned. Poverty was associated with skipping meals, sending children to neighbors’ homes to eat, and poor performance in school. The causes of poverty most frequently cited were farming problems, sickness or chronic poor health, and drunkenness. While the household survey showed that female-headed households were doing better at each expenditure level, the findings from the PPA were the opposite, that is, female-headed households were classified as less well off than male-headed households at every level of wellbeing. Further analysis revealed that female-headed households owned fewer assets and experienced greater insecurity and vulnerability. However, female-headed households appeared

Tools and Practices 20
264
to do more with fewer assets than male-headed households, using a range of coping strategies, particularly petty trading. Girls were more likely to be withdrawn from school for various reasons, while educating boys was considered to be a better investment. For women, the dissolution of marriage and widowhood were identified as major sources of financial difficulty. Local customs often caused women to be left destitute after divorce, despite laws intended to protect women’s inheritance of property. The household survey did not pick up availability of water as a problem. However, water problems emerged high on the list of priorities identified through participatory methods. Further comparisons of information from both data sets revealed that the household survey did not reflect seasonal dimensions of water availability and the unreliable functioning of water sources. Perhaps the most striking finding was the contribution of village- level social capital to household incomes: an increase of one standard deviation in social capital at the village level was found to increase household expenditures per person by at least 20–30 percent. By comparison, a standard deviation in schooling of nearly three years per person increased income by less than 5 percent.
The Vietnam Participatory Poverty Assessment In 1999, four Participatory Poverty Assessments were implemented in Vietnam in an effort led by the World Bank in partnership with NGOs and other donors:164
• The Vietnam-Sweden Mountain Rural Development Program conducted PPAs in two districts of Lao Cai Province, an upland area with a high proportion of ethnic minorities living in remote villages.
• Action Aid, a British NGO, coordinated a PPA in six districts of Ha Tinh Province in the north-central coastal region, a typhoon-prone area with very poor natural endowments.
• Oxfam GB carried out a PPA in two districts of Tra Vinh Province, a coastal region with a large ethnic minority population and growing problems of landlessness.
• Save the Children Fund (U.K.) coordinated a PPA in three poor urban districts in Ho Chi Minh City.
Methodology Each of the four implementing agencies took responsibility for planning and undertaking the research in its site, but all of the PPAs used common techniques and covered certain common subject matter in order to facilitate the compilation of a national perspective. The process of designing the studies was facilitated by the institutional knowledge of the PPA study agencies and their experience with participatory techniques. All of the teams made use of a variety of participatory research tools (described in greater detail in the Tanzania example above), including focus group discussions, semi-struc tured interviews, wealth/wellbeing rankings, matrix and preference ranking and scoring, flow diagrams, and institutional ranking and Venn diagrams.
164 This section draws on Turk 2001; World Bank 1999, 2000, 2001a.

Tools and Practices 20
265
All together, the four PPAs engaged more than 1,000 households. All the research teams worked with men and women separately. All teams also interviewed elderly people separately, and two teams worked with children separately. Comparison of Results: PPA and the Vietnam Living Standards Survey The PPAs were analyzed and synthesized at the same time that the quantitative household survey data from a second round of the Vietnam Living Standards Survey were being analyzed. In areas where the PPA research themes and Living Standards Survey data overlapped, findings generally coincided closely, with a few notable exceptions, and the PPAs and household surveys reinforced the same key messages overall. The quantitative data revealed robust, nationally representative trends, while the qualitative, participatory studies helped to indicate explanations for some of these trends. Findings of the two methods differed in two important areas. First, while the survey found female-headed households to be better off than male-headed households in per capita expenditure terms, the position of female-headed households were routinely described as being poor and vulnerable in the PPAs. Second, the scope and nature of urban poverty did not appear to be a pressing problem according to the survey. However, urban poverty did figure as an issue of importance in the PPAs. Additional findings included high indebtedness and growing landlessness, strong demand for off-farm economic opportunities, vulnerability due to health shocks, lack of information on government decisions and programs, domestic violence, and vulnerability of women and children within households. Involving Government and Establishing Credibility The amount of collaborative work between the Bank, government agencies, other donors, and NGOs in implementing the PPAs led to wide circulation and use of PPA findings. The Vietnamese government became involved in the process through a Poverty Working Group, which was initiated by the Bank and included the Ministry of Planning and Investment, the Ministry of Labor, Invalids and Social Affairs, the Ministry of Agriculture and Rural Development, the Ministry of Finance, the General Statistics Office, the Committee for Ethnic Minorities and Mountainous Affairs, the Women’s Union, and the State Bank of Vietnam. Many government officials joined the Working Group highly skeptical of the value of PPAs, but the workshops, presentations, meetings with local government, and connections with the global Voices of the Poor project played important roles in establishing the credibility of the research methodology and findings. Government ownership of the process was also encouraged through the production of a joint PPA report. During the PPA process, the Poverty Working Group met one day each month to discuss methodology and findings and review early drafts of its poverty assessment. The group also traveled to all four PPA provinces for workshops to discuss and debate PPA findings when the studies were completed.

Tools and Practices 20
266
Provincial workshops were very important in building local government support, for raising interest in the findings among local officials, and for addressing their questions and concerns about the research. The involvement of the World Bank and the Poverty Working Group were especially important in this regard. World Bank meetings with local authorities at an early stage raised awareness of the studies at the local level and reinforced the idea that donors and central policy makers took participatory information seriously. A workshop that evaluated the impact of the PPAs found that all stakeholders—poor communities, communes/wards, districts, provinces, central government, NGOs, and donors—experienced changes in knowledge, understanding, and attitudes in many areas as a result of the PPA studies. Some of these changes included: a better understanding of the nature and causes of poverty; increased commitment to consulting with the poor and to participatory research, planning, and monitoring; greater willingness to acknowledge sensitive issues such as domestic violence and marginalization of some social groups; and increased demand for better social services, programs, and grassroots democracy. Additional Studies and Policy Changes A number of additional studies and policy changes were initiated as a result of the PPA findings and process. They include:
• A Health Sector Review studying the high costs of curative health care; • A Public Expenditure Review, investigating high health care costs, local revenue-raising,
the high direct costs of education for the poor, and the fees and voluntary contributions related to commune- level financing;
• Inclusion of both poor households’ lack of access to information on legal rights and the “knowledge of the poor” as issues addressed in the government’s poverty reduction strategy.
• New criteria in some Ho Chi Minh City districts for including long-settled but unregistered migrants in the city’s Hunger Eradication and Poverty Reduction activities;
• A study of constraints to the development of the off- farm sector in Tra Vinh; • A study of the marginalization of ethnic minorities in upland areas; • Development of a more integrated approach to dealing with community-wide shocks and
disasters, which the government has asked donors to become involved in.
The Uganda Participatory Poverty Assessment Project The idea of undertaking a PPA in Uganda emerged during the World Bank’s Country Assistance Strategy consultation in 1998.165 The government began planning for the Uganda Participatory Poverty Assessment Project (UPPAP) with initial funding from DFID, the World Bank, and UNDP. It was designed as a three-year initiative whose objectives were twofold: (a) linking poverty analysis to policy decisions by strengthening the participatory poverty assessment capacities of government (both central and district level) and civil society organizations, and (b) enriching and verifying quantitative data used in poverty monitoring.
165 This section draws on Narayan 2000; World Bank 2001b; Robb 2000.
Tools and Practices 20
267
Oxfam agreed to become the implementing partner for the project and identified nine research institutions and local NGOs, which it invited to join the UPPAP Technical Committee and carry out the participatory research. The first round of assessments began in September 1998 in 36 rural and urban sites in nine pilot districts. The location of the PPA project within the Ministry of Planning and Economic Development (which merged with the Ministry of Finance in 1998) kept the poverty agenda at the forefront of government policy and has been identified as a key factor in the Uganda PPA’s success. Methodology Twenty-four rural and 12 urban sites in nine of the most disadvantaged districts were selected as the sample for the UPPAP in order to capture the multiple facets of poverty in the country. In each district, at least one urban and up to three rural communities were chosen. The research for the PPA included focus group discussions, case studies, and key informant interviews. Findings The participatory research of the PPA brought to light several issues that had been previously overlooked or had been given insufficient priority from a policy perspective. Among these issues were:
• The importance of local responses to local needs. Poverty in Uganda proved to be location- and group-specific.
• The importance of information flows. There was a limited flow of information about government policies, both between different levels of government and between government and communities. Ugandans were largely unaware of their rights.
• The importance of involving communities. People in all communities expressed interest in participating in making policies that would affect their lives, but lacked the information, mechanisms, and forums to do so.
Policy Responses to the PPA The report from the first phase of the project revealed a number of outcomes of the PPA process. PPA findings have been extensively used in the development of influential government documents, including the revised PEAP in 1999/2000, the annual Background to the Budget 1999–2000, and the biennial Poverty Status Report. The Plan for Modernization of Agriculture now includes the poor as primary producers, focusing interventions on their constraints and priorities for reducing poverty. The mid-term expenditure framework process used PPA findings for reviewing public investment programs and sector expenditures, and the government allocated additional resources to providing clean water in response to poor people’s priorities. PPA findings have been incorporated into education and health sector reviews as well. The Poverty Monitoring and Analysis Unit published its first biennial Poverty Status Report in 1999, which presented the latest trends and analysis drawing on both governmental and nongovernmental sources, including PPA results. This unit also began to compile indicators that the PPA had revealed to be important, such as vulnerability, risk, and security. Poverty
Tools and Practices 20
268
indicators identified by poor people through the PPA have also been included in national household surveys. To respond to specific, regional, or local needs expressed in the PPA, flexibility has been introduced in the utilization of conditional and equalization grants by districts, and grant utilization procedures have been modified accordingly. The Poverty Action Fund has been reoriented to monitor the effective utilization of conditional grants and the impact on the poor. Local governments, particularly in the nine partner districts where the study was conducted, have also begun to internalize participatory poverty assessment principles. On a broader level, the PPA raised awareness on the part of politicians and civil servants about the concerns of the poor through PPA-related dialogues, briefing documents, public presentations, regional workshops, and the media. In addition, the PPA led to greater insight into the obstacles to poverty reduction efforts, awareness of the regional differences between problems, and greater openness about sensitive issues, such as the issue of corruption at all levels of government. The PPA raised critical questions among some NGOs about the design and implementation of their own projects. Civil society organizations have also used the PPA findings to support their participation in the process of revising the PEAP. Research institutes have begun to mainstream participatory poverty assessment principles into their work as well. Phase 2 A second phase of the Uganda Participatory Poverty Assessment Project aims to support capacity building for participatory planning at the district level. Local NGOs that were involved in the first phase have asked to go back to the same communities in order to allow follow-up and continuity in the process. The main objectives of this second phase of the PPA will be to look at the need to revise priorities; to examine the implementation of Community Action Plans; to help communities identify the best channel for flow of funds; and to raise awareness among communities about how to access funding, through government structures as well as other sources.
The Guatemala Poverty Assessment The Guatemala Poverty Assessment (GUAPA) is an on-going multiyear program of analytical work and technical support to provide a better understanding of the multiple dimensions that characterize poverty and exclusion and to identify related policy implications.166 The GUAPA is one of the first country-level studies to build on the three pillars of poverty reduction identified in World Development Report 2000/2001—opportunity, empowerment, and security—using both qualitative and quantitative data to explore the multiple dimensions of poverty. This comprehensive investigation will contribute to the World Bank’s country assistance program and strategy, and foster institutional development and capacity-building in counterpart agencies for greater ownership and sustainability of the process. 166 This section draws on Lindert 2000; Clert and others 2001; and World Bank forthcoming.
Tools and Practices 20
269
Gathering Information on the Multiple Dimensions of Poverty The GUAPA uses quantitative data to draw conclusions about general tendencies and patterns, and qualitative information to understand the processes that perpetuate poverty, inequality, and exclusion. The main source of quantitative data is the Living Standards Measurement Survey (ENCOVI 2000). Qualitative information has been collected under the Qualitative Poverty and Exclusion Study for 10 rural ENCOVI villages whose populations represent five different ethnic groups. The multiple dimensions of poverty are analyzed through a basic analysis of poverty and inequality and investigation of three major components: opportunity, vulnerability, and empowerment. Basic analysis of poverty and inequality The first phase of ENCOVI analysis involved production of a standard profile of poverty and inequality and analysis of their determinants. The profile of poverty and inequality uses monetary indicators of poverty, nonmonetary social indicators (health, education, infrastructure), and qualitative definitions based on the perceptions of communities. ENCOVI data on monetary welfare indicators were used to construct a profile of inequality. Determinants of poverty and inequality are analyzed using multivariate regression analysis. This quantitative analysis is supplemented by qualitative information on the perceptions of communities as to the “causes” of poverty, prosperity, and inequality. Opportunity A series of background papers were prepared on the different facets determining opportunity as a key dimension of poverty. Topics covered include livelihoods and poverty; education and poverty; health, malnutrition and poverty; poverty and modern utility services; social protection; transport; exclusion; and vunerability. Vulnerability Work to understand vulnerability and security in the context of Guatemala focuses on several factors. The study identifies key vulnerable groups and constructs a typology of these groups, including their characteristics, poverty status, and living conditions, and the main risks they face. In addition to this, investigation is made into risks and shocks, informal mitigation and coping mechanisms, and formal risk management and social protection interventions.
Empowerment In relation to empowerment, the GUAPA explores the following topics:
• Perceptions of poverty and exclusion. This includes household and community perceptions of exclusion, institutions, interactions with officials, and living conditions, changes in these issues over time, and priorities and aspirations for the future.
• Social capital. Issues include: (a) a typology of the types and degree of social capital at the household and community levels; (b) community relations with the “outside world,” including other communities and formal institutions; (c) the effects of other social forces on social capital (such as conflict, crises, etc.); (d) the correlation between social capital and poverty/prosperity; and (e) the uses of social capital.

Tools and Practices 20
270
• Other topics include: Voice, participation, and citizenship issues, and conflict, crime, violence, and justice.
Findings The GUAPA highlights the extremity of poverty in Guatemala, where over half of the population lives in poverty. Over 81 percent of the poor and 93 percent of the extreme poor live in rural areas. Malnutrition is strikingly high, with 44 percent of children under five stunted. Guatemala ranks as one of the most unequal countries in the world, with the top quintile of the population accounting for 54 percent of total consumption. Disparities in assets constitute the main sources of inequality in the country, with education accounting for over half of all inequality. Patterns of land ownership are among the most highly unequal in the world. Opportunity Poor people are highly constrained in terms of opportunities and livelihoods. Growth in Guatemala, while averaging 3.9 percent per year between 1950 and 2000, has not been pro-poor, and has not favored the sectors that primarily employ poor people, such as agriculture. Poor people are highly dependent on agricultural income, and close to two-thirds of salaried poor workers receive less than the minimum wage. Vulnerability Primarily because of their low asset bases, poor people in Guatemala are extremely vulnerable to shocks. 88 percent of the extreme poor and 86 percent of the poor suffered losses in response to shocks, compared with 83 percent of the non-poor. Further, the effects of shocks are felt not only in income, but also in reductions in community assets, psychological and social well-being, and health and education. Existing social protection programs are poorly targeted and inefficient, and as a result, when shocks occur government assistance does not reach poor people. Poor people are thus forced to cope with shocks by reducing consumption (reported by 40.9 percent of the poorest quintile) or seeking other forms of self-help (39.4 percent of the poorest quintile), such as supplying more labor, selling or mortgaging assets, or drawing down savings. Empowerment A weak public sector has been an obstacle in Guatemala’s efforts to improve living conditions and promote a more inclusive society. Problems include a weak tax base, poor public expenditure management, poor targeting public spending, insufficient accountability and responsiveness, and high centralization. Corruption is also a serious problem. Households in the ENCOVI survey ranked corruption/bad government as the second main cause of poverty in Guatemala. Using key indicators of governance, Guatemala ranks worst in Latin America in voice and accountability, political instability and rule of law. Social capital is concentrated among the more privileged groups in society, with inequalities favoring those in urban areas over rural areas, men over women, the nonpoor over the poor, and the educated over the non-educated. Poor people do have strong connections within villages, however they have little bridging social capital linking them to other communities or to formal institutions. Participation rates in within-village organizations (18 percent) are over three times

Tools and Practices 20
271
higher than those for organizations linking individuals and communities to others outside their communities.
Resources Clert, Carine, Michael Woolcock, Ana-Maria Ibanez, and Kathy Lindert. 2001. “Social
Exclusion and Empowerment in Guatemala: A Quantitative and Qualitative Study.” Draft of Proposed Framework and Issues Paper being developed under the Guatemala Poverty Assessment Program. World Bank, Washington, D.C.
Lindert, Kathy. 2000. “Guatemala: Reducing Poverty and Exclusion. World Bank’s Poverty
Assessment Program: 1999–2002.” Draft of Approach and Concept Paper being developed under the Guatemala Poverty Assessment Program. World Bank, Washington, D.C.
Narayan, Deepa. 1997. “Voices of the Poor: Poverty and Social Capital in Tanzania.”
Environmentally and Socially Sustainable Development Studies and Monographs Series 20. World Bank, Washington, D.C.
Narayan, Deepa, with Raj Patel, Kai Schafft, Anne Rademacher, and Sarah Koch-Schulte. 2000.
Voices of the Poor: Can Anyone Hear Us? New York: Oxford University Press. Norton, Andy, with Bella Bird, Karen Brock, Margaret Kakande, and Carrie Turk. 2001. “A
Rough Guide to PPAs: Participatory Poverty Assessment, An Introduction to Theory and Practice.” Overseas Development Institute, London.
Robb, Caroline M. 2000. “How the Poor Can Have a Voice in Government Policy.” Finance &
Development 37 (4): 22–25
Turk, Carrie. 2001. “Linking Participatory Poverty Assessments to Policy and Policymaking: Experience from Vietnam.” Policy Research Working Paper 2526. World Bank, Development Research Group, Washington, D.C.
World Bank. 1999. “Vietnam Development Report 2000: Attacking Poverty.” Report 19914-VN.
Poverty Reduction and Economic Management Unit, East Asia and Pacific Region, Washington, D.C.
———. 2000. “Vietnam: Managing Public Resources Better. Public Expenditure Review 2000.”
Report 21021-VN. Poverty Reduction and Economic Management Network, East Asia and Pacific Region, Washington, D.C.
———. 2001a. “Case Study 3: Vietnam—Process Document of the Country Experience.” Case
study prepared as part of the Action Learning Program on Participatory Processes for Poverty Reduction Strategies. Participation Thematic Group, Washington, D.C. Available: www.worldbank.org/participation/web/webfiles/vietnam.htm

Tools and Practices 20
272
———. 2001b. “Process Document of the Country Experience—The Case of Uganda.” Case study prepared as part of the Action Learning Program on Participatory processes for Poverty Reduction Strategies. Participation Thematic Group, Washington, D.C. Available: www.worldbank.org/participation/web/webfiles/uganda.htm
———. Forthcoming. “Guatemala Poverty Assessment.” Poverty Reduction and Economic
Management Unit and Human Development Sector Management Unit, Latin America and the Caribbean Region, Washington, D.C.