chapter one introduction of portfolio theory. part one the asset classes
Post on 21-Dec-2015
223 views
TRANSCRIPT

Chapter OneChapter One
Introduction of Portfolio TheoryIntroduction of Portfolio Theory

Part OnePart One
The asset classesThe asset classes
Basic principlesBasic principles
There are many asset classes and many of them There are many asset classes and many of them are useful to investors. are useful to investors.
Some asset classes are noted for their long term Some asset classes are noted for their long term stability (low risk), others for their high returns.stability (low risk), others for their high returns.
Generally speaking, the higher the reward you are Generally speaking, the higher the reward you are after, the more risk you’ll need to take.after, the more risk you’ll need to take.
Portfolios can be constructed that exhibit superior Portfolios can be constructed that exhibit superior risk and return relationships to any single asset, risk and return relationships to any single asset, because one can significantly reduce risk by because one can significantly reduce risk by diversification.diversification.

Why risk and return are linkedWhy risk and return are linked
B
AA
BB
A
B
AA
B
A
B
Investment A is the obvious choice… … but add
risk, is the choice still obvious?
B would die out through lack of takers!

When two investments appear to offer identical risk, investors will prefer to buy the higher returning one. If the market is peopled by reasonably well informed investors, there simply won’t be any high returning low risk investments left and nobody will buy high risk assets with a low expected return.

In a portfolio construction context “risk” is In a portfolio construction context “risk” is usually measured with some sort of usually measured with some sort of measure of price volatility.measure of price volatility.
There are other risks of course that need to There are other risks of course that need to be taken into account.be taken into account.
Inflation risk is a major problem with the Inflation risk is a major problem with the more “conservative” asset classes such as more “conservative” asset classes such as fixed interest and cash. Many pensioners fixed interest and cash. Many pensioners find to their horror that they can no longer find to their horror that they can no longer live off their savings, despite the live off their savings, despite the conservatism of their strategy, simply conservatism of their strategy, simply because inflation devalued their money and because inflation devalued their money and the portfolio did grow enough to keep up.the portfolio did grow enough to keep up.
It is necessary for all but the most short term It is necessary for all but the most short term oriented investors to consider at least some oriented investors to consider at least some exposure to growth assets like shares and exposure to growth assets like shares and property, just to fight inflation.property, just to fight inflation.

Major asset classes: sharesMajor asset classes: shares
Shares are part interests in businesses. Shares are part interests in businesses. How good a return you get on your share How good a return you get on your share depends to a large extent on the depends to a large extent on the fundamental business developments of the fundamental business developments of the company itself and on the price you paid for company itself and on the price you paid for the share.the share.
Averaged out over many companies, shares Averaged out over many companies, shares as an asset class tend to respond to interest as an asset class tend to respond to interest rates and the economy.rates and the economy.
Although in the last few years many markets Although in the last few years many markets have fallen substantially, shares are still the have fallen substantially, shares are still the highest performing asset class over the long highest performing asset class over the long term.term.

Shares generally go up in price over the Shares generally go up in price over the long term because businesses don’t pay out long term because businesses don’t pay out 100% of their profits as dividends, they keep 100% of their profits as dividends, they keep some to grow the value of the business some to grow the value of the business itself.itself.
Over the long term, shares have beaten Over the long term, shares have beaten inflation.inflation.

Major asset classes: propertyMajor asset classes: property
There are many types of property to invest There are many types of property to invest in, each are different.in, each are different.
The highest income yield comes generally The highest income yield comes generally from commercial and industrial property.from commercial and industrial property.

Major asset classes: fixed interestMajor asset classes: fixed interest
A “fixed interest” investment is a debt that A “fixed interest” investment is a debt that can be bought and sold.can be bought and sold.
The borrowers are usually governments and The borrowers are usually governments and companies. A typical fixed interest companies. A typical fixed interest investment pays a regular “coupon” (interest investment pays a regular “coupon” (interest payment) and will repay the principle on payment) and will repay the principle on maturity.maturity.

Some fixed interest securities have a maturity of Some fixed interest securities have a maturity of several decades, others are shorter term.several decades, others are shorter term.
The actual price of a fixed interest investment will The actual price of a fixed interest investment will fluctuate in response to many things, most fluctuate in response to many things, most particularly interest rates. If general interest rates particularly interest rates. If general interest rates fall, the price of a long term fixed interest security fall, the price of a long term fixed interest security will usually rise such that the “yield to maturity” is will usually rise such that the “yield to maturity” is similar to those of other investments with a similar similar to those of other investments with a similar risk. On the other hand, if interest rates rise, fixed risk. On the other hand, if interest rates rise, fixed interest investments fall.interest investments fall.

Major asset classes: cashMajor asset classes: cash
““Cash” may mean currency, but in an Cash” may mean currency, but in an investment context cash is just a really short investment context cash is just a really short term highly liquid fixed interest investment.term highly liquid fixed interest investment.
Longer term fixed interest investments are Longer term fixed interest investments are usually called “bonds”, shorter term fixed usually called “bonds”, shorter term fixed interest investments may be called “notes” interest investments may be called “notes” and really short term ones are often called and really short term ones are often called “bills”. “bills”.
Cash management trusts usually invest in a Cash management trusts usually invest in a portfolio of high quality short term fixed portfolio of high quality short term fixed interest investments. Because of the short interest investments. Because of the short maturity, these fixed interest investments maturity, these fixed interest investments are not as sensitive to interest rate changes are not as sensitive to interest rate changes and thus don’t have a great deal of capital and thus don’t have a great deal of capital volatility.volatility.
Other asset classesOther asset classes
Shares, property, bonds and cash are the Shares, property, bonds and cash are the major asset classes, but there are many major asset classes, but there are many others to choose from.others to choose from.

Hedge funds are sometimes called a distinct Hedge funds are sometimes called a distinct asset class as they pursue unconventional asset class as they pursue unconventional strategies that give them performance very strategies that give them performance very different to the asset classes that they invest different to the asset classes that they invest in.in.

““Private equity” is basically a shares Private equity” is basically a shares investment, but in companies not listed on a investment, but in companies not listed on a stock exchange.stock exchange.
Agribusinesses are agricultural investments Agribusinesses are agricultural investments in things like tree farms and vineyards.in things like tree farms and vineyards.
Some people also consider commodities like Some people also consider commodities like gold to be an asset class of its own, and gold to be an asset class of its own, and many people consider collectibles, race many people consider collectibles, race horses and fine wines to be useful horses and fine wines to be useful alternative investment asset classes.alternative investment asset classes.

The point of portfolio constructionThe point of portfolio construction
A portfolio is often more than the sum of its A portfolio is often more than the sum of its parts. Because not all asset classes parts. Because not all asset classes perform the same way over the short term, a perform the same way over the short term, a portfolio of many asset classes usually portfolio of many asset classes usually offers a superior overall relationship offers a superior overall relationship between risk and return to any single assetbetween risk and return to any single asset

A portfolio consisting only of shares would A portfolio consisting only of shares would have done badly in the last few years since have done badly in the last few years since the market crashed, but property has the market crashed, but property has performed very well. This is quite typical, performed very well. This is quite typical, more “defensive” asset classes often do well more “defensive” asset classes often do well when equities are falling.when equities are falling.
A diversified portfolio has a reasonable long A diversified portfolio has a reasonable long term growth rate because over time all asset term growth rate because over time all asset classes offer a positive return, but being classes offer a positive return, but being invested across different asset classes invested across different asset classes smooths out returns and offers a more smooths out returns and offers a more predictable growth rate.predictable growth rate.

Part TwoPart Two
Creating diversified portfoliosCreating diversified portfolios

How diversification reduces riskHow diversification reduces risk
There are two mechanisms by which There are two mechanisms by which diversification reduces risk: dilution and diversification reduces risk: dilution and interference.interference.
Dilution is easy to understand, if you swap Dilution is easy to understand, if you swap half your shares for cash then you lose half half your shares for cash then you lose half your equity exposure and therefore half your your equity exposure and therefore half your equity risk. If the market crashed tomorrow equity risk. If the market crashed tomorrow you’d only lose half as muchyou’d only lose half as much
““Interference” is where negative movements Interference” is where negative movements in some assets are partly cancelled by in some assets are partly cancelled by positive ones in other assets. A good positive ones in other assets. A good example is with property vs. shares, in the example is with property vs. shares, in the recent bear market in shares property did recent bear market in shares property did very well while shares did badly, the very well while shares did badly, the opposite may be true in the next few years. opposite may be true in the next few years.

Interference and correlationInterference and correlation
“Correlation” is the word given to the extent to which assets move together, this is measured with statistical formulae. Correlations can range from -1 (perfectly negatively correlated) through to +1 (perfectly positively correlated).

If asset B tends to move in the opposite direction to asset A then these two assets are said to have “negative correlation”, and they can be highly effective at cancelling out each other’s volatility. If the assets both trend upwards over the longer term a combination of them will have a return equal to the average of the two assets’ returns but with substantially reduced volatility.

the greatest Negatively correlated assets cancel most amount of each other’s volatility.

Negative correlation isn’t essentialNegative correlation isn’t essential
Assets don’t need to be negatively Assets don’t need to be negatively correlated to have some volatility correlated to have some volatility smoothing.smoothing.
As long as the correlation is less than +1 As long as the correlation is less than +1 the assets will be at least a little bit the assets will be at least a little bit different and at least some volatility will be different and at least some volatility will be cancelled.cancelled.

Most real world assets are positively Most real world assets are positively correlated because most prices are related correlated because most prices are related somehow to important “macro”somehow to important “macro” factors like factors like global economic growth, interest rates, oil global economic growth, interest rates, oil prices etc.prices etc.
Even if negative correlations are rare, Even if negative correlations are rare, substantial volatility reduction is possible substantial volatility reduction is possible by using assets with a low positive by using assets with a low positive correlation. correlation.

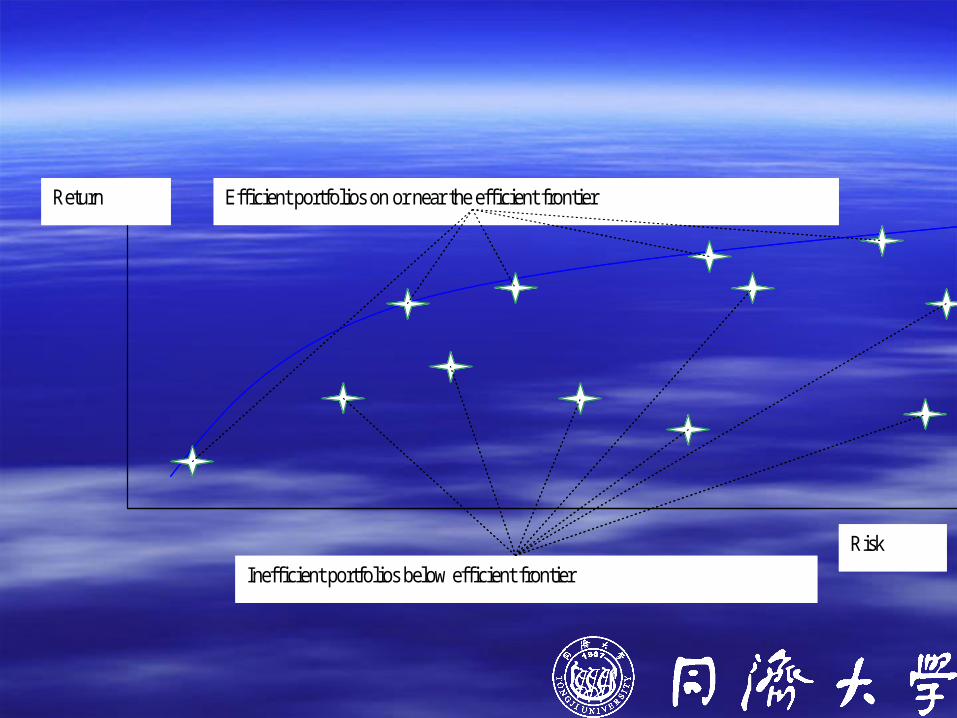
The “efficient frontier” is the name given to the line The “efficient frontier” is the name given to the line that joins all portfolios that have achieved a that joins all portfolios that have achieved a maximum return for a given level of risk (portfolios maximum return for a given level of risk (portfolios that are “efficient”). If you chart every possible that are “efficient”). If you chart every possible portfolio that could be constructed out of a group portfolio that could be constructed out of a group of assets and plotted a point on a risk vs. return of assets and plotted a point on a risk vs. return chart, the resulting plot usually looks much like the chart, the resulting plot usually looks much like the chart in next slide. The top of the curve is the chart in next slide. The top of the curve is the efficient frontier, anything below that curve is an efficient frontier, anything below that curve is an “inefficient” portfolio, anything actually on the “inefficient” portfolio, anything actually on the curve, or close to it, is an “efficient” portfoliocurve, or close to it, is an “efficient” portfolio
Risk
Inefficient portfolios below efficient frontier
Efficient portfolios on or near the efficient frontierReturn
Risk
Inefficient portfolios below efficient frontier
Efficient portfolios on or near the efficient frontierReturn
Efficient vs. inefficient portfoliosEfficient vs. inefficient portfolios
It is It is impossibleimpossible to predict in advance which to predict in advance which portfolios will be the most efficient as this portfolios will be the most efficient as this would require knowing in advance asset would require knowing in advance asset class performance and correlationsclass performance and correlations
A portfolio that has been diversified into a A portfolio that has been diversified into a variety of asset classes should be close to variety of asset classes should be close to efficient over the longer term, provided it is efficient over the longer term, provided it is rebalanced regularly.rebalanced regularly.

RebalancingRebalancing
Rebalancing a portfolio is the process of Rebalancing a portfolio is the process of adjusting a portfolio to bring it back to its adjusting a portfolio to bring it back to its original asset allocation.original asset allocation.
Since assets perform differently at different Since assets perform differently at different times, the portfolio is likely to drift from your times, the portfolio is likely to drift from your desired asset allocation.desired asset allocation.
Failure to rebalance means that a portfolio Failure to rebalance means that a portfolio can change risk profile over time and may can change risk profile over time and may no longer be appropriate. no longer be appropriate.

A few simple rules of portfolio A few simple rules of portfolio constructionconstruction
If you have two assets with roughly equal If you have two assets with roughly equal expected returns, putting 50% into each is a expected returns, putting 50% into each is a way to hedge one’s bets (and spread the way to hedge one’s bets (and spread the risk) without compromising expected return risk) without compromising expected return at all. The lower the correlation of those at all. The lower the correlation of those assets, the more the risk will be reducedassets, the more the risk will be reduced

If 1
Mean ofX1
Mean ofX2 Where P = ½ [X1] + ½ [X2]
1,2 1/21 + 1/22
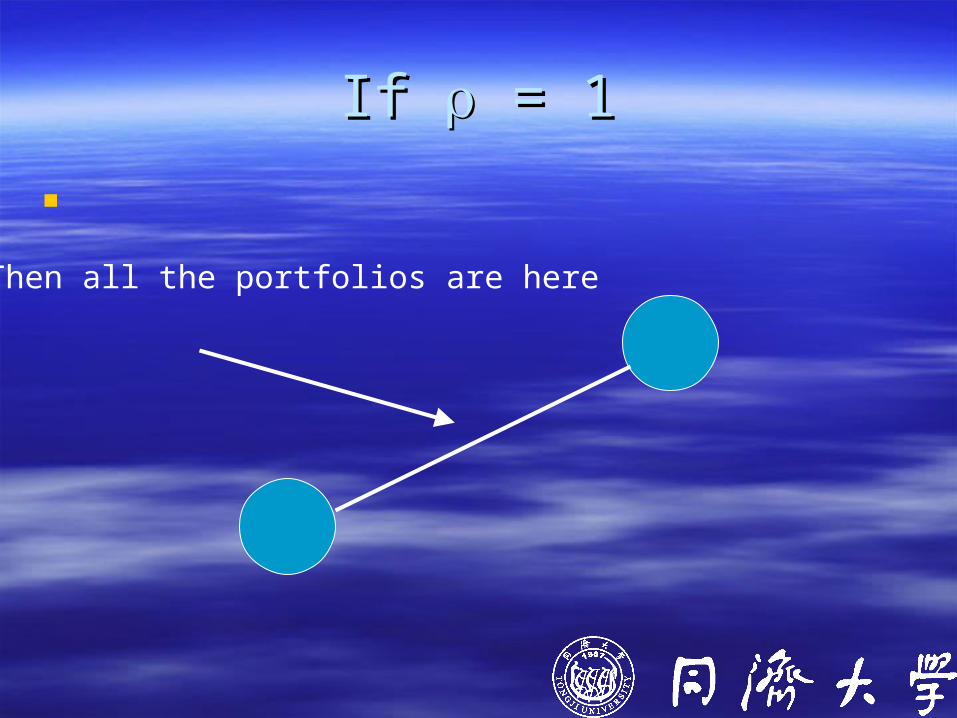
If If = 1 = 1
Then all the portfolios are here

If If 1 1
Then all the portfolios are here

This Means the “boundary”This Means the “boundary”of the possible portfoliosof the possible portfolios
looks like thislooks like this

Standard Deviation
MeanMaximizesUtility

Combine with Risky AssetsCombine with Risky Assets
Mean
Standard Deviation
Risky Assets
Risk FreeAsset
?
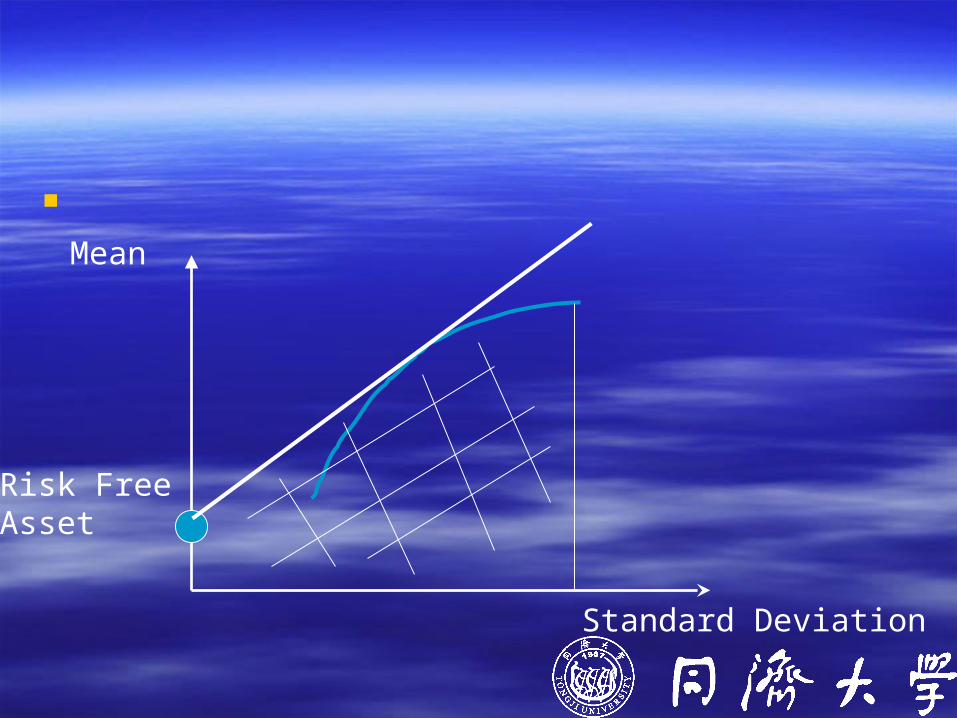
Mean
Standard Deviation
Risk FreeAsset
Actually, this holds true with a greater Actually, this holds true with a greater number of investments. If you have 5, 10 or number of investments. If you have 5, 10 or 1,000 assets1,000 assets
There is such a thing as “diversifiable” risk, There is such a thing as “diversifiable” risk, as you add extra assets to the portfolio the as you add extra assets to the portfolio the volatility tends to decrease – but only up to a volatility tends to decrease – but only up to a point. When a portfolio reaches a certain point. When a portfolio reaches a certain level of diversification the only way to level of diversification the only way to reduce risk is to add lower risk assets which reduce risk is to add lower risk assets which will reduce volatility by dilution, this usually will reduce volatility by dilution, this usually reduces the returnreduces the return

Diversification can also increase Diversification can also increase returnsreturns
A higher return may often be obtained from A higher return may often be obtained from rebalancing the portfolio as a result of rebalancing the portfolio as a result of “reversion to the mean”. “reversion to the mean”.
If you believe that at some point in the future If you believe that at some point in the future two assets will give the same cumulative two assets will give the same cumulative return then it would make sense to invest in return then it would make sense to invest in the asset class with the worst recent the asset class with the worst recent performance and sell the one with the best performance and sell the one with the best performance! performance!
Rebalancing does precisely this, although it is Rebalancing does precisely this, although it is normally seen only as a risk management normally seen only as a risk management technique.technique.
This is why the diversified portfolio did a little This is why the diversified portfolio did a little better than all three component asset better than all three component asset classes. A small “rebalancing premium” is classes. A small “rebalancing premium” is quite common because last year’s worst quite common because last year’s worst performing asset class often outperforms performing asset class often outperforms last year’s best performing asset class this last year’s best performing asset class this year.year.

Pushing out the efficient frontierPushing out the efficient frontier
Investors desire higher returns with lower Investors desire higher returns with lower risk. There is however a limit to what can be risk. There is however a limit to what can be achieved with a particular set of assets, that achieved with a particular set of assets, that limit is drawn on charts as the efficient limit is drawn on charts as the efficient frontier.frontier.
By adding more assets we can change the By adding more assets we can change the shape of the efficient frontier. Assets carry shape of the efficient frontier. Assets carry two items of interest to us, their returns and two items of interest to us, their returns and their correlation with the rest of the portfolio.their correlation with the rest of the portfolio.

Refining our asset allocationRefining our asset allocation
There is wide acceptance that so-called There is wide acceptance that so-called “value” stocks outperform “growth” stocks, “value” stocks outperform “growth” stocks, and “small companies” tend to outperform and “small companies” tend to outperform “large companies”, at least over the longer “large companies”, at least over the longer termterm
Their higher long term performance is very Their higher long term performance is very interesting, but so too is the fact that they interesting, but so too is the fact that they often have a low correlation to large growth often have a low correlation to large growth companies, the dominant stocks in the companies, the dominant stocks in the market.market.
They provide what asset allocation is They provide what asset allocation is independent source of risk and return.independent source of risk and return.
This may enable us to improve the efficient This may enable us to improve the efficient frontier.frontier.

The stock market is dominated by what The stock market is dominated by what would be classified as “large growth would be classified as “large growth companies”, also known as “blue chips”. companies”, also known as “blue chips”. 蓝蓝筹 筹 As a portion of market capitalisation, the As a portion of market capitalisation, the very largest companies dominate the market very largest companies dominate the market and so an exposure in market weightings and so an exposure in market weightings tends to have a very small amount of small tends to have a very small amount of small company and value exposurecompany and value exposure

Many asset allocators believe a portfolio Many asset allocators believe a portfolio should have more small company and value should have more small company and value exposure than the market gives. Although exposure than the market gives. Although small companies might only make up 5% of small companies might only make up 5% of the market by capitalisation, they make up the market by capitalisation, they make up the vast majority of listed companies by the vast majority of listed companies by number, despite the tiny market weighting, number, despite the tiny market weighting, asset allocators often allocate a larger asset allocators often allocate a larger amount of 10 to 20% to small caps.amount of 10 to 20% to small caps.

A non-technical approach goes back to the A non-technical approach goes back to the basics – try to build your portfolio from many basics – try to build your portfolio from many “independent sources of risk and return”. “independent sources of risk and return”. This simply means you should diversify into This simply means you should diversify into many different asset classesmany different asset classes
how do you go about how do you go about constructing a portfolio?constructing a portfolio?
The usefulness of historical correlations and The usefulness of historical correlations and returns is usually overstated, but can form a returns is usually overstated, but can form a crude guide as long as we don’t take them crude guide as long as we don’t take them too seriously.too seriously.
Don’t get too hung up on quantitative data, Don’t get too hung up on quantitative data, but try to find assets that are very different but try to find assets that are very different (i.e. property vs. shares.)(i.e. property vs. shares.)

DecisionsDecisions Active funds or passive/index funds?Active funds or passive/index funds? How much to growth assets, how much to income How much to growth assets, how much to income
assets?assets? Balance of value stocks to growth stocks?Balance of value stocks to growth stocks? How much large cap shares, how much small How much large cap shares, how much small
caps?caps? How much money to put in developed markets vs. How much money to put in developed markets vs.
emerging markets?emerging markets? Listed or unlisted property?Listed or unlisted property? Short or long maturity fixed interest?Short or long maturity fixed interest?
Risky assets vs. risky portfolios.Risky assets vs. risky portfolios.
It is important to think about risk in a It is important to think about risk in a portfolio context, not an asset context. portfolio context, not an asset context.

Small percentage allocations to riskier Small percentage allocations to riskier assets like emerging markets, private equity, assets like emerging markets, private equity, commodities, hedge funds and agribusiness commodities, hedge funds and agribusiness can actually reduce the risk of the overall can actually reduce the risk of the overall portfolio because they don’t operate on the portfolio because they don’t operate on the same cycles as major asset classes. Small same cycles as major asset classes. Small allocations to such assets can have a great allocations to such assets can have a great impact on the efficient frontier.impact on the efficient frontier.
Are risky assets like emerging Are risky assets like emerging markets too risky for conservative markets too risky for conservative
portfolios?portfolios? Emerging markets are by themselves a Emerging markets are by themselves a
very risky asset class, their monthly very risky asset class, their monthly volatility is about 50% higher than global volatility is about 50% higher than global large companies . On the other hand, their large companies . On the other hand, their correlation with the global large caps correlation with the global large caps indexes is quite low.indexes is quite low.
Despite the high volatility of emerging Despite the high volatility of emerging markets, their low correlation with global markets, their low correlation with global large cap equities means a small large cap equities means a small percentage allocation of emerging markets percentage allocation of emerging markets to a global portfolio can actually to a global portfolio can actually reducereduce the the volatility of a portfolio while volatility of a portfolio while potentiallypotentially increasing returns.increasing returns.
A little volatility can go a long wayA little volatility can go a long way
In a sense, the high volatility of the riskier In a sense, the high volatility of the riskier asset classes is one of their most valuable asset classes is one of their most valuable attributes for a portfolio.attributes for a portfolio.
The high volatility of asset classes like The high volatility of asset classes like emerging markets and commodities means emerging markets and commodities means they do well above their weight in they do well above their weight in contributing risk and return to the portfolio. contributing risk and return to the portfolio.

Some notesSome notes
Obviously some asset classes have been Obviously some asset classes have been more efficient than others over this time more efficient than others over this time frame, but which asset classes will be best frame, but which asset classes will be best over the next 10 years is another matter over the next 10 years is another matter entirely. entirely.
There really is no way to forecast which There really is no way to forecast which assets are going to outperform, although it assets are going to outperform, although it doesn’t stop people from trying!doesn’t stop people from trying!

Adding conservative assetsAdding conservative assets So far we’ve only shown what happens when So far we’ve only shown what happens when
growth assets of the various flavours of growth assets of the various flavours of shares and property are added together. shares and property are added together.
Although we can substantially improve on Although we can substantially improve on large cap growth share portfolios in terms of large cap growth share portfolios in terms of risk and return there are limits to how risk and return there are limits to how conservative a portfolio of growth assets can conservative a portfolio of growth assets can be, to push the efficient frontier more toward be, to push the efficient frontier more toward lower risks the income asset classes (bonds, lower risks the income asset classes (bonds, cash, mortgages) will need to be added.cash, mortgages) will need to be added.

We have to accept that over the longer term We have to accept that over the longer term this will probably cost the investor money this will probably cost the investor money due to a lower expected return, but the risk due to a lower expected return, but the risk reduction potential is tremendous and this reduction potential is tremendous and this may be more suitable for conservative may be more suitable for conservative investors.investors.
Half the risk doesn’t mean half the Half the risk doesn’t mean half the return!return!
Risk to reward ratios get more favourable for Risk to reward ratios get more favourable for conservative portfolios. conservative portfolios.
Putting half a share portfolio into cash will Putting half a share portfolio into cash will basically halve the risk, but since cash basically halve the risk, but since cash doesn’t return 0% you won’t halve the doesn’t return 0% you won’t halve the return.return.

If you gear a portfolio though you do double If you gear a portfolio though you do double your risk (if you use 50% gearing), but your risk (if you use 50% gearing), but because you have to pay interest on the because you have to pay interest on the loan you won’t double your return.loan you won’t double your return.
Conservative portfolios therefore can greatly Conservative portfolios therefore can greatly reduce risk without necessarily having the reduce risk without necessarily having the same amount of reduction in the return. same amount of reduction in the return. This can be seen on the efficient frontier, This can be seen on the efficient frontier, which is usually curved instead of straight.which is usually curved instead of straight.

Part ThreePart Three
Risk profiling and portfolio designRisk profiling and portfolio design
why not always use a medium risk why not always use a medium risk portfolio?portfolio?
If diversification makes it relatively easy to If diversification makes it relatively easy to substantially reduce risk for only a small substantially reduce risk for only a small cost in return, why not do it all the time?cost in return, why not do it all the time?
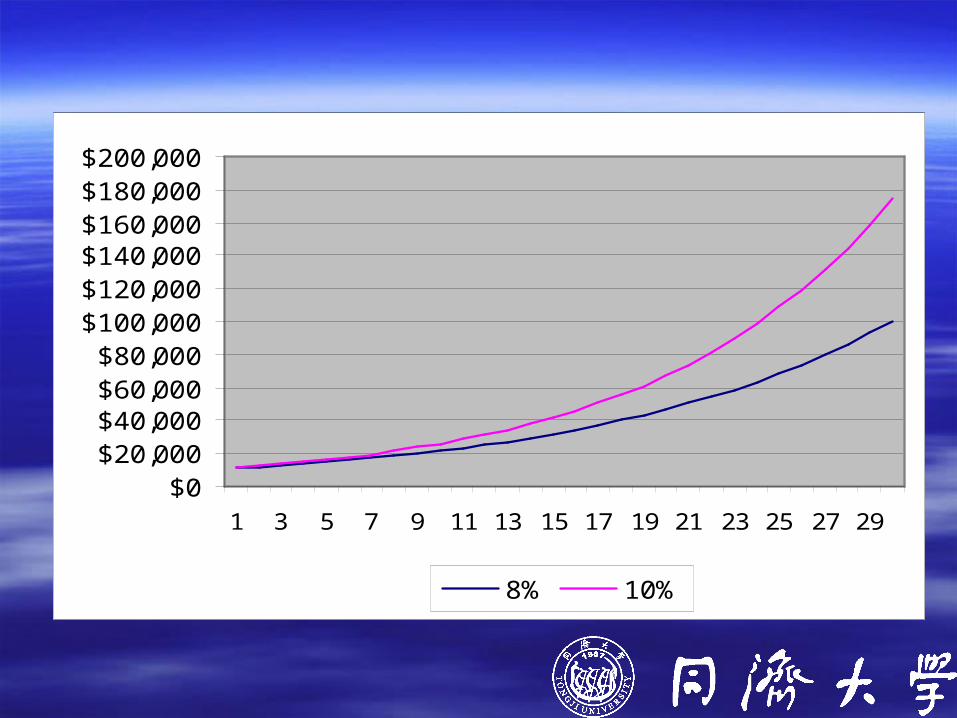
The answer lies in compounding interest. The answer lies in compounding interest. Over a long period a small increase in Over a long period a small increase in returns makes a big difference to the final returns makes a big difference to the final portfolio value.portfolio value.

The difference between a portfolio that The difference between a portfolio that returns 8% over 20 years and a portfolio that returns 8% over 20 years and a portfolio that returns 10% over 20 years is very returns 10% over 20 years is very substantial. Ten thousand dollars invested substantial. Ten thousand dollars invested at 8% for 20 years will grow to $46,610, one at 8% for 20 years will grow to $46,610, one thousand invested at 10% for 20 years will thousand invested at 10% for 20 years will grow to $67,275 - a very significant grow to $67,275 - a very significant difference! If you are young then your time difference! If you are young then your time frame on retirement assets is likely to be 30 frame on retirement assets is likely to be 30 years or more.years or more.

Over a short period of time there is very little Over a short period of time there is very little difference so it may not be worth taking a difference so it may not be worth taking a risk, but if you do have a long term horizon risk, but if you do have a long term horizon then serious thought should be put into then serious thought should be put into ways to get an extra percentage point or two ways to get an extra percentage point or two out of the portfolio. An extra point of risk is out of the portfolio. An extra point of risk is often hard to notice, but an extra point of often hard to notice, but an extra point of return makes a very big difference in the return makes a very big difference in the long term! Risk is important but being overly long term! Risk is important but being overly conservative can be a costly mistake over conservative can be a costly mistake over the long term.the long term.
$0$20,000$40,000$60,000$80,000
$100,000$120,000$140,000$160,000$180,000$200,000
1 3 5 7 9 11 13 15 17 19 21 23 25 27 29
8% 10%

Choosing a level of risk vs. returnChoosing a level of risk vs. return ““Risk profiling” is a tricky business that Risk profiling” is a tricky business that
depends on the time horizon, risk tolerance depends on the time horizon, risk tolerance and return requirements of an investor.and return requirements of an investor.
Some model portfolios with different levels Some model portfolios with different levels of risk and their risk/return profiles are of risk and their risk/return profiles are shown on the next few slides.shown on the next few slides.
Three dimensional approach to risk Three dimensional approach to risk profilingprofiling
Most advisors discuss risk tolerance in Most advisors discuss risk tolerance in terms of potential volatility only, often using terms of potential volatility only, often using short multi-choice questionnaires. In my short multi-choice questionnaires. In my opinion, this is inadequate and doesn’t really opinion, this is inadequate and doesn’t really address the client’s needs. there are address the client’s needs. there are actually three dimensions to risk profiling:actually three dimensions to risk profiling:

1.1. Time frame – when is the money Time frame – when is the money required?required?
2.2. Volatility tolerance – how much Volatility tolerance – how much volatility?volatility?
3.3. Conventionality – given the different Conventionality – given the different cycles of value and small cap shares cycles of value and small cap shares and that they may underperform large and that they may underperform large growth companies for extended periods growth companies for extended periods of time, how much of a value and small of time, how much of a value and small cap tilt is acceptable?cap tilt is acceptable?

Designing a portfolio – risk toleranceDesigning a portfolio – risk tolerance
Examining data from model portfolios and Examining data from model portfolios and adding on a margin of safety, decide how adding on a margin of safety, decide how much downside risk over that time frame much downside risk over that time frame that you can accept.that you can accept.
First, determine the time frame of the First, determine the time frame of the investment.investment.
Remember, the Remember, the consequenceconsequence of risk is of risk is more important than the more important than the probability probability of risk. of risk. Risk should be assessed in terms of how Risk should be assessed in terms of how much damage it would do to your ability to much damage it would do to your ability to pay for something you need at some time in pay for something you need at some time in the future. Don’t get too obsessed about the future. Don’t get too obsessed about daily, weekly, monthly or even annual daily, weekly, monthly or even annual volatility if your investment horizon is 20 or volatility if your investment horizon is 20 or 30 years! 30 years!
Of course if your investment horizon is quite Of course if your investment horizon is quite short term, you probably short term, you probably shouldshould be be obsessed about short term volatility!obsessed about short term volatility!
Designing a portfolio – value vs. Designing a portfolio – value vs. growthgrowth
Value stocks and small companies tend to Value stocks and small companies tend to outperform large cap growth companies outperform large cap growth companies over the longer term but they do have risks over the longer term but they do have risks of their own.of their own.
Value stocks outperformed by a huge Value stocks outperformed by a huge margin during the “bear market” of the last margin during the “bear market” of the last few years.few years.

The trouble though is that during the “tech The trouble though is that during the “tech boom” of the late 1990s, value stocks boom” of the late 1990s, value stocks lagged by a large margin. We know with lagged by a large margin. We know with hindsight this was a bubble, and most of hindsight this was a bubble, and most of those gains were lost, but this wasn’t that those gains were lost, but this wasn’t that easy to spot at the time. The newspapers easy to spot at the time. The newspapers were all touting the “new economy”, and were all touting the “new economy”, and value investors seemed like they were value investors seemed like they were obsolete. As a dimension to risk profiling, obsolete. As a dimension to risk profiling, this one is about how willing you are to this one is about how willing you are to ignore underperformance and the ignore underperformance and the prognostications of experters.prognostications of experters.

Some people are happy to have a very strong tilt Some people are happy to have a very strong tilt toward value stocks, but not everyone feels that toward value stocks, but not everyone feels that way.way.
The numbers for value vs. growth strongly favour The numbers for value vs. growth strongly favour value for more than half a century in the US and value for more than half a century in the US and many other markets where data is available, the many other markets where data is available, the track record of value is impressive.track record of value is impressive.
But how many years will you persist with value But how many years will you persist with value investing if it underperforms the general market? investing if it underperforms the general market? How do you know there isn’t really a “new How do you know there isn’t really a “new paradigm” and markets haven’t really changedparadigm” and markets haven’t really changed

Most people prefer to hedge their bets, Most people prefer to hedge their bets, allocating some but not all of their portfolio allocating some but not all of their portfolio to value stocks, buying growth stocks and to value stocks, buying growth stocks and having a “balanced” exposure. This may not having a “balanced” exposure. This may not be the highest returning strategy for the very be the highest returning strategy for the very long term, but it seems more conservative long term, but it seems more conservative for most people.for most people.

Is value more risky than growth?Is value more risky than growth?
Many academics argue that the Many academics argue that the outperformance of value stocks vs. growth outperformance of value stocks vs. growth stocks is a “risk premium”, i.e. that investors stocks is a “risk premium”, i.e. that investors are merely being rewarded for taking on are merely being rewarded for taking on more risk.more risk.
Others who don’t believe in the “efficient Others who don’t believe in the “efficient market hypothesis” think that the market hypothesis” think that the outperformance of value is caused be outperformance of value is caused be systematic errors made by analysts who systematic errors made by analysts who overestimate the future profits of “growth overestimate the future profits of “growth stocks” and underestimate the future profits stocks” and underestimate the future profits of “value stocks”, this would be an of “value stocks”, this would be an “inefficiency”, an opportunity to earn a “inefficiency”, an opportunity to earn a higher return without higher risk.higher return without higher risk.
Various people have put forward various Various people have put forward various theories about the extra risk of value, but theories about the extra risk of value, but one of the most obvious troubles in the one of the most obvious troubles in the value = risky theory is that value based value = risky theory is that value based portfolios tend to be less volatile, not more.portfolios tend to be less volatile, not more.

Risk of value stocksRisk of value stocks
The main reason why many academics say The main reason why many academics say value stocks are more risky is because in value stocks are more risky is because in theory they would have to be more risky for theory they would have to be more risky for the efficient markets hypothesis to remain the efficient markets hypothesis to remain valid. Many explanations are given, but valid. Many explanations are given, but some tend to be almost metaphysical, some tend to be almost metaphysical, claiming that the risk can’t be measured but claiming that the risk can’t be measured but is there somehow and somewhereis there somehow and somewhere

Interestingly, prior to academics discovering Interestingly, prior to academics discovering the “value premium”, nobody claimed value the “value premium”, nobody claimed value stocks were more risky, this claim was stocks were more risky, this claim was made by efficient market supporters only made by efficient market supporters only after the higher returns were documented.after the higher returns were documented.
It is an interesting issue, but from a personal It is an interesting issue, but from a personal investor’s point of view it is a question of investor’s point of view it is a question of whether the value premium is likely to whether the value premium is likely to persist for ever and whether they are willing persist for ever and whether they are willing to tolerate periods of underperformance to tolerate periods of underperformance where growth does better than value.where growth does better than value.

Value vs. growthValue vs. growth In the late 1990s, growth stocks outperformed In the late 1990s, growth stocks outperformed
value stocks. If you had switched out of value and value stocks. If you had switched out of value and into growth following that period of outperformance into growth following that period of outperformance you would have been hurt badly by the bear you would have been hurt badly by the bear market that followed, where value stocks market that followed, where value stocks outperformed growth by a big margin. outperformed growth by a big margin.
Growth stocks often outperform in rising markets, Growth stocks often outperform in rising markets, especially in the latest stages of bull markets when especially in the latest stages of bull markets when most people invest the most money. Typically, most people invest the most money. Typically, value stocks offer more consistent performance.value stocks offer more consistent performance.
If you can’t tolerate underperforming the market or If you can’t tolerate underperforming the market or don’t want to bet on a value premium continuing, don’t want to bet on a value premium continuing, stick with normal large cap “blue chip” shares. stick with normal large cap “blue chip” shares. Strongly tilted value and small cap portfolios aren’t Strongly tilted value and small cap portfolios aren’t suitable for everyone.suitable for everyone.

Part FourPart Four
Starting and managing a portfolioStarting and managing a portfolio

The importance of rebalancingThe importance of rebalancing
Rebalancing consists of regularly adjusting the Rebalancing consists of regularly adjusting the portfolio to re-establish the original asset portfolio to re-establish the original asset allocation.allocation.
If you don’t rebalance, periods of high If you don’t rebalance, periods of high performance for some assets and/or low performance for some assets and/or low performance for others will mess up the asset performance for others will mess up the asset allocation.allocation.
If the market reverses then such a portfolio might If the market reverses then such a portfolio might experience greater losses or be less exposed to experience greater losses or be less exposed to the recovery in underperforming assets.the recovery in underperforming assets.

Apart from anything else, if you don’t Apart from anything else, if you don’t rebalance then the portfolio will drift towards rebalance then the portfolio will drift towards other risk profiles, resulting in a different risk other risk profiles, resulting in a different risk and return profile to what it was intended for. and return profile to what it was intended for. A balanced portfolio will become high A balanced portfolio will become high growth by the end of a bull market, a high growth by the end of a bull market, a high growth portfolio will become a balanced growth portfolio will become a balanced portfolio near the market bottom – the portfolio near the market bottom – the opposite of what one should be doing.opposite of what one should be doing.

Rebalancing and capital gains taxRebalancing and capital gains tax
Obviously any time one sells an asset at a Obviously any time one sells an asset at a profit a capital gains tax liability will be profit a capital gains tax liability will be created. If you are rebalancing then it is created. If you are rebalancing then it is quite likely that a higher than normal quite likely that a higher than normal proportion of capital gains will be realised proportion of capital gains will be realised because we are necessarily selling the best because we are necessarily selling the best performing assets.performing assets.

For tax reasons it is usually a good idea to For tax reasons it is usually a good idea to implement rebalancing first by buying implement rebalancing first by buying underperforming asset classes with new underperforming asset classes with new contributions and reinvestment of income, contributions and reinvestment of income, thus minimizing sales.thus minimizing sales.

Approaching retirementApproaching retirement
The closer one gets to retirement, the more The closer one gets to retirement, the more appropriate it is to start implementing a appropriate it is to start implementing a conservative investment strategy since conservative investment strategy since withdrawals will start soon.withdrawals will start soon.
This need not always involve selling high growth This need not always involve selling high growth assets. Over a number of years one can turn a assets. Over a number of years one can turn a portfolio from “high growth” into “conservative” by portfolio from “high growth” into “conservative” by simply investing new contributions and simply investing new contributions and distributions into conservative income assetsdistributions into conservative income assets

If the portfolio is producing 5%pa distributions, If the portfolio is producing 5%pa distributions, then simply by reinvesting distributions into then simply by reinvesting distributions into income producing assets the portfolio can drop a income producing assets the portfolio can drop a risk profile category (High Growth -> Growth -> risk profile category (High Growth -> Growth -> Balanced -> Low Growth -> Conservative) about Balanced -> Low Growth -> Conservative) about every three years. With new contributions one can every three years. With new contributions one can change the portfolio more quickly.change the portfolio more quickly.
It is better to gradually transition the portfolio as It is better to gradually transition the portfolio as you approach retirement than to make a sudden you approach retirement than to make a sudden change because otherwise retirement incomes change because otherwise retirement incomes can be highly susceptible to the behaviour of the can be highly susceptible to the behaviour of the market in the year or two prior to retirement.market in the year or two prior to retirement.

After retirementAfter retirement
A sixty year old usually has at least A sixty year old usually has at least another 20 years of life expectancy so another 20 years of life expectancy so unless you are planning on spending your unless you are planning on spending your all money within a few years at least all money within a few years at least some of your funds will have a time some of your funds will have a time horizon exceeding a decade.horizon exceeding a decade.
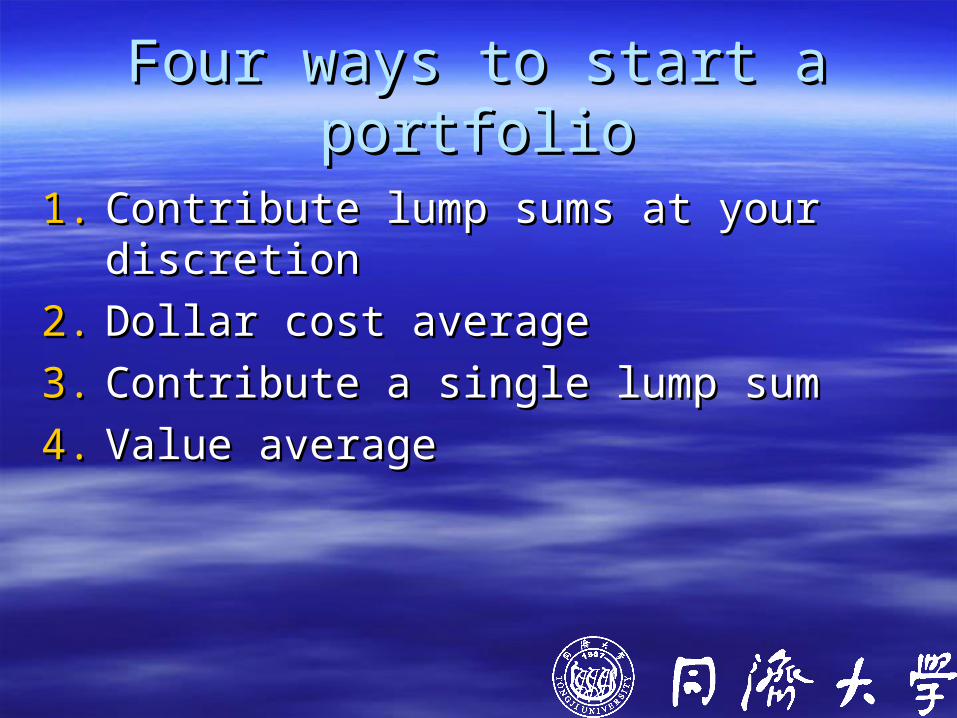
Four ways to start a portfolioFour ways to start a portfolio
1.1. Contribute lump sums at your discretionContribute lump sums at your discretion
2.2. Dollar cost averageDollar cost average
3.3. Contribute a single lump sumContribute a single lump sum
4.4. Value averageValue average

Contribute a single lump sumContribute a single lump sum
If you have money to invest, single lump If you have money to invest, single lump sum investing gets that money to work sum investing gets that money to work immediately in the market. The trouble immediately in the market. The trouble though is that you never know what the though is that you never know what the market is about to do and you risk making a market is about to do and you risk making a major investment just before a market fall.major investment just before a market fall.

Lump sum investments at your Lump sum investments at your discretiondiscretion
Many people prefer to spread out their Many people prefer to spread out their investment into several parcels, but investment into several parcels, but incorporate market timing into their incorporate market timing into their decisions.decisions.
Great caution should be exercised with this Great caution should be exercised with this approach, various studies have shown that approach, various studies have shown that people are bad market timers.people are bad market timers.

Dollar cost averagingDollar cost averaging
If you have trouble pulling the trigger when it If you have trouble pulling the trigger when it comes time to buy in gloom and sell in comes time to buy in gloom and sell in boom, consider using a mechanical boom, consider using a mechanical approach to remove emotion from the approach to remove emotion from the equation.equation.
If you invest regular amounts every month If you invest regular amounts every month (or quarter) without fail, irrespective of what (or quarter) without fail, irrespective of what the market does and not varying the amount the market does and not varying the amount invested, timing mistakes are avoidedinvested, timing mistakes are avoided

Dollar cost averaging as insuranceDollar cost averaging as insurance
Dollar cost averaging is a way to provide an Dollar cost averaging is a way to provide an insurance policy against short term volatility insurance policy against short term volatility following the initial investment.following the initial investment.
If the market falls after you start your If the market falls after you start your investments then your continuing regular investments then your continuing regular investments will take advantage of those investments will take advantage of those falls.falls.

Dollar cost averaging in a volatile Dollar cost averaging in a volatile marketmarket
To an extent, dollar cost averaging is a way to To an extent, dollar cost averaging is a way to benefit from market falls. benefit from market falls.
If the price drops, then your regular monthly If the price drops, then your regular monthly contribution will buy you more shares.contribution will buy you more shares.
In fact, if you are dollar cost averaging the best In fact, if you are dollar cost averaging the best kind of market is one where the stock market only kind of market is one where the stock market only goes sideways or even down for some time.goes sideways or even down for some time.
As long as stocks eventually go up (and eventually As long as stocks eventually go up (and eventually they will), bear markets are best seen as a they will), bear markets are best seen as a welcome buying opportunity, not a disaster.welcome buying opportunity, not a disaster.

Special needs of a pension portfolioSpecial needs of a pension portfolio one could construct a pension portfolio with one could construct a pension portfolio with
short term, medium term and long term short term, medium term and long term components.components.
The reason why one would want to do this is The reason why one would want to do this is so we know that the pension payments for so we know that the pension payments for the next few years are not held “hostage” to the next few years are not held “hostage” to market volatility.market volatility.
Volatility may or may not be a serious Volatility may or may not be a serious concern to investors in the accumulation concern to investors in the accumulation phase, but it is more serious during the phase, but it is more serious during the pension phase. pension phase.

Dollar cost averaging in reverseDollar cost averaging in reverse If you are dollar cost averaging during If you are dollar cost averaging during
accumulation, you welcome a fall in stocks accumulation, you welcome a fall in stocks because it means you get to buy more because it means you get to buy more stocks with your dollars at lower prices.stocks with your dollars at lower prices.
During a pension phase you dollar cost During a pension phase you dollar cost average in reverse, a bear market is more average in reverse, a bear market is more serious because a fall in stocks means you serious because a fall in stocks means you are forced to sell more stocks at lower are forced to sell more stocks at lower prices in order to make up the payment.prices in order to make up the payment.
Capital can be severely reduced by these Capital can be severely reduced by these large sales to make pension payments.large sales to make pension payments.
Pension fund withdrawalsPension fund withdrawals
Segregating the portfolio into Segregating the portfolio into short/medium/long term components is one short/medium/long term components is one way to reduce the impact of volatility, putting way to reduce the impact of volatility, putting several years worth of payments into cash several years worth of payments into cash and low risk investments does free the and low risk investments does free the pensioner from worry about stocks for at pensioner from worry about stocks for at least a few years, but how does one transfer least a few years, but how does one transfer money between the portfolios to top up money between the portfolios to top up money that is spent?money that is spent?

Regular fixed dollar transfers from a long Regular fixed dollar transfers from a long term portfolio to a short term portfolio will term portfolio to a short term portfolio will result in dollar cost averaging in reverse – result in dollar cost averaging in reverse – not a good thing in a volatile market.not a good thing in a volatile market.
A simple way to overcome this difficulty is to A simple way to overcome this difficulty is to not make fixed dollar transfers, instead not make fixed dollar transfers, instead make make percentagepercentage transfers in and out of a transfers in and out of a reserve account. (Thus you’ll make larger reserve account. (Thus you’ll make larger withdrawals when your portfolio is large, withdrawals when your portfolio is large, smaller ones when it is small).smaller ones when it is small).

ConclusionsConclusions Asset allocation is an overlooked and Asset allocation is an overlooked and
underrated field of investment, but studies underrated field of investment, but studies show it is more influential on the behaviour show it is more influential on the behaviour of a portfolio than stock selection or market of a portfolio than stock selection or market timing, more importantly you can exercise timing, more importantly you can exercise more control over asset allocation whereas more control over asset allocation whereas the others are often a matter of luckthe others are often a matter of luck

Used properly, asset allocation is the major Used properly, asset allocation is the major risk management tool, but it can also be a risk management tool, but it can also be a source of higher returns.source of higher returns.
Asset allocation can be a complex area with Asset allocation can be a complex area with many fine points that are often overlooked many fine points that are often overlooked and is particularly important for pension and is particularly important for pension portfoliosportfolios
Part FivePart Five
Capital Asset Pricing ModelCapital Asset Pricing Model
(CAPM)(CAPM)

One Factor (beta-pricing) ModelOne Factor (beta-pricing) Model– FactorFactor– BetaBeta
Deriving the CAPMDeriving the CAPM– Expected returns are linear in betaExpected returns are linear in beta– Diversifiable and Non-diversifiable riskDiversifiable and Non-diversifiable risk
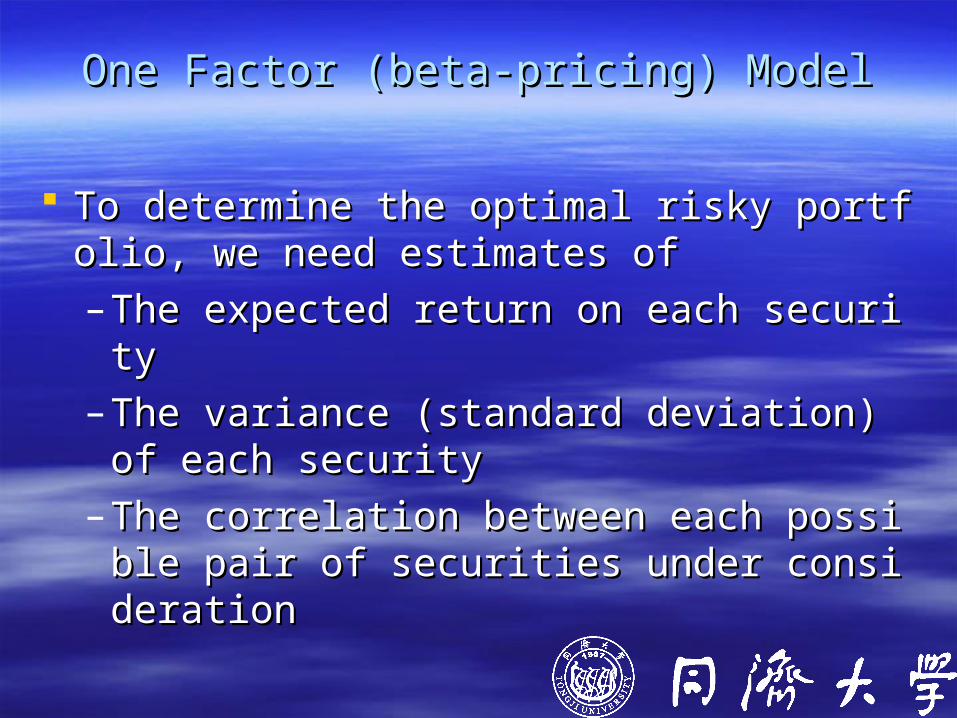
One Factor (beta-pricing) ModelOne Factor (beta-pricing) Model
To determine the optimal risky portfolio, we To determine the optimal risky portfolio, we need estimates of need estimates of – The expected return on each securityThe expected return on each security– The variance (standard deviation) of eacThe variance (standard deviation) of eac
h securityh security– The correlation between each possible pThe correlation between each possible p
air of securities under considerationair of securities under consideration

Our Portfolio ProblemOur Portfolio Problem
If we are looking at 150 to 250 securities, If we are looking at 150 to 250 securities, we need estimates of 150 – 250 expected rwe need estimates of 150 – 250 expected returns and variances, but 11,175 – 31,125 eturns and variances, but 11,175 – 31,125 correlation coefficients!correlation coefficients!

Is There an Easier Way?Is There an Easier Way?
Casual observation shows that securities teCasual observation shows that securities tend to move together: when the economy annd to move together: when the economy and the market do well, most security prices ind the market do well, most security prices increase; when the economy and the market dcrease; when the economy and the market do poorly, so do most securities.o poorly, so do most securities.
ImplicationImplication: Security prices move in respons: Security prices move in response to some e to some commoncommon (macro) factor(s) (macro) factor(s)..

Factor Models: Statistical models dFactor Models: Statistical models designed to measure the systematic esigned to measure the systematic (macro) risk of a security, vs. its fir(macro) risk of a security, vs. its firm-specific risk.m-specific risk.

The Single Index ModelThe Single Index Model
Index Models: Factor models where market Index Models: Factor models where market indices (portfolios) are used to proxy for the indices (portfolios) are used to proxy for the common or systematic risk factors.common or systematic risk factors.
The most common model is the single or market The most common model is the single or market index model.index model.
In the single index model, a broad market index In the single index model, a broad market index (e.g., the S&P 500) is typically used as the (e.g., the S&P 500) is typically used as the market index.market index.

Specification of the Single Index Specification of the Single Index ModelModel
StockStock’’s excess returns excess returnif the market is neutralif the market is neutral
eRRRR ifmiifi
movementsmarket overall todueReturn ofComponent
Indexon Return ExcessStockon Return Excess
Component due to Component due to unexpected events unexpected events relevant only to this relevant only to this securitysecurity

What is Beta?What is Beta?
Beta: Sensitivity of a security’s return to the Beta: Sensitivity of a security’s return to the systematic or market factorsystematic or market factor
Beta measures the change in expected returBeta measures the change in expected return for a security given a change in the return n for a security given a change in the return on the marketon the market

Risk premium format:Risk premium format:
RRii - R - Rf f = = ii + ß + ßii(R(Rm m - R- Rff)) + e+ eii

More on BetaMore on Beta Beta is the slope in a regression of a security Beta is the slope in a regression of a security
ii’s excess return on the market excess return.’s excess return on the market excess return.
From statistics, we know thatFrom statistics, we know that
2
cov( , )slope i M
M
R R

Estimating the Index ModelExcessExcess Returns (i)Returns (i)
SecuritySecurityCharacteristicCharacteristicLineLine
..
..
..
.. ....
.. ....
.. ..
......
......
.. ..
.. ....
.. ....
.. ..
.. ....
..
..
....
.. .... .... ..ExcessExcess returnsreturnson market indexon market index
RRii -- RRff = = ii + + ßßii(R(Rmm -- RRff)) + + eeii
......

Components of RiskComponents of Risk
Using the risk premium version of the single Using the risk premium version of the single index model,index model,
We can writeWe can write
ii2 2 = = ii
22 mm2 2 + + 22(e(eii))
Total risk = Systematic risk + Unique RiskTotal risk = Systematic risk + Unique Risk
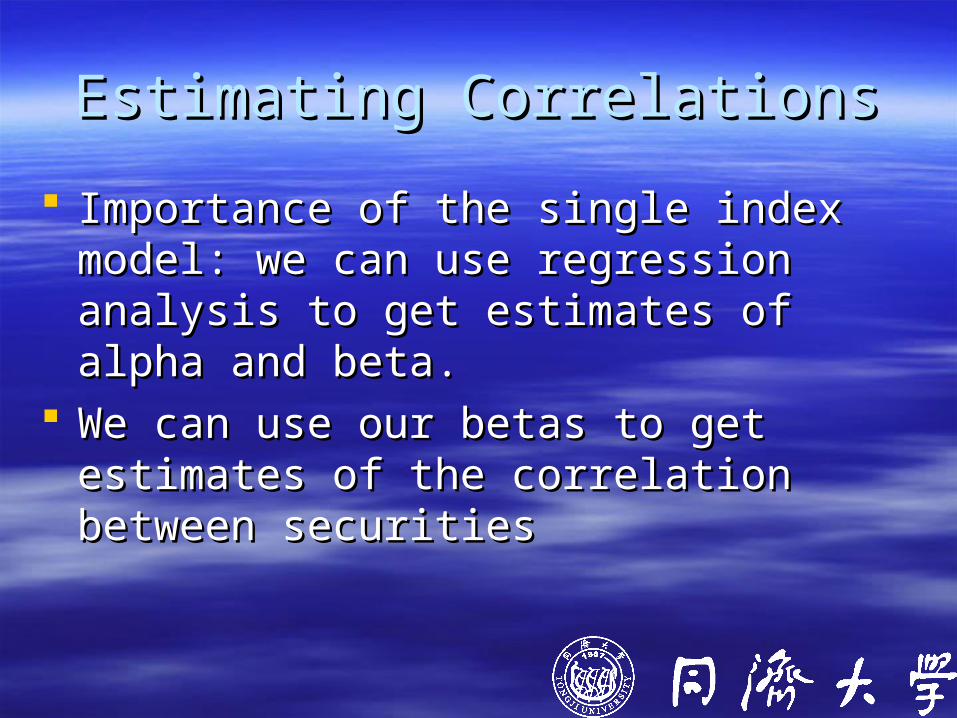
Estimating CorrelationsEstimating Correlations
Importance of the single index model: we Importance of the single index model: we can use regression analysis to get estimates can use regression analysis to get estimates of alpha and beta.of alpha and beta.
We can use our betas to get estimates of We can use our betas to get estimates of the correlation between securitiesthe correlation between securities
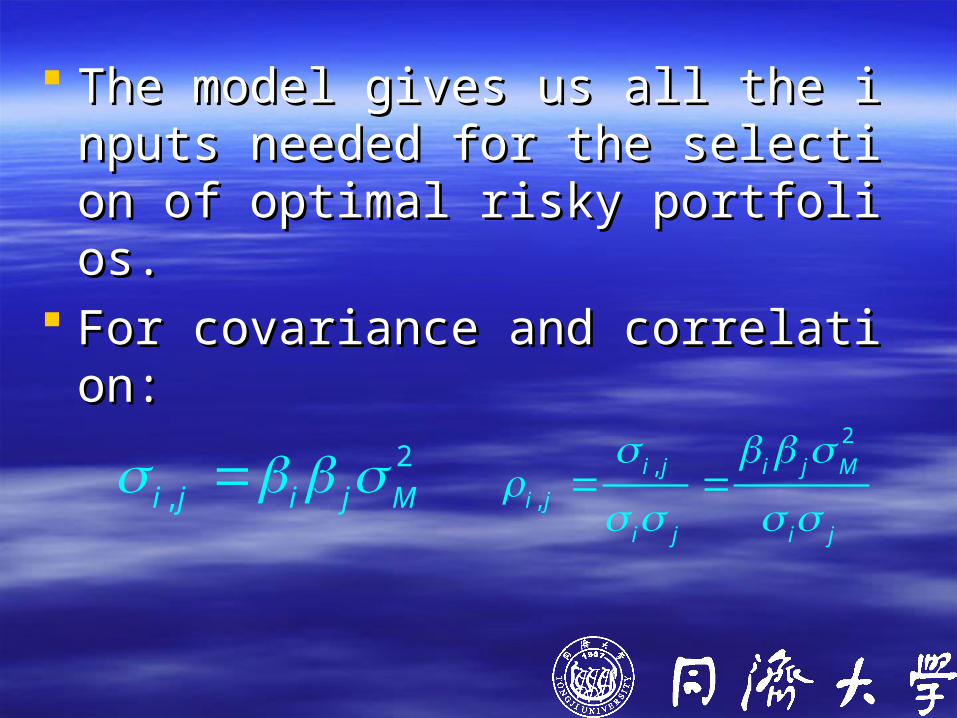
The model gives us all the inputs needThe model gives us all the inputs needed for the selection of optimal risky pored for the selection of optimal risky portfolios.tfolios.
For covariance and correlation:For covariance and correlation:
2
,i j i j M 2
,
,
i j i j M
i j
i j i j

Capital Asset Pricing Model (CAPM)Capital Asset Pricing Model (CAPM)
Why The Market Portfolio?Why The Market Portfolio? We’ve been talking about a single Index. We We’ve been talking about a single Index. We
explicitly used the market portfolio as such.explicitly used the market portfolio as such.
Is there any reason we believe that the markIs there any reason we believe that the market portfolio is a risk factor?et portfolio is a risk factor?

We have to Think:We have to Think: What happens if all investors seek portfolios of What happens if all investors seek portfolios of
risky securities using the framework we previously risky securities using the framework we previously discussed?discussed?
How will using this framework affect equilibrium How will using this framework affect equilibrium security prices and returns?security prices and returns?
How does optimal diversification affect the market How does optimal diversification affect the market price of securities?price of securities?
Can we develop a model that explains security Can we develop a model that explains security prices under conditions of market equilibrium?prices under conditions of market equilibrium?
Can we identify a Can we identify a commoncommon (macro) Risk Factor? (macro) Risk Factor?
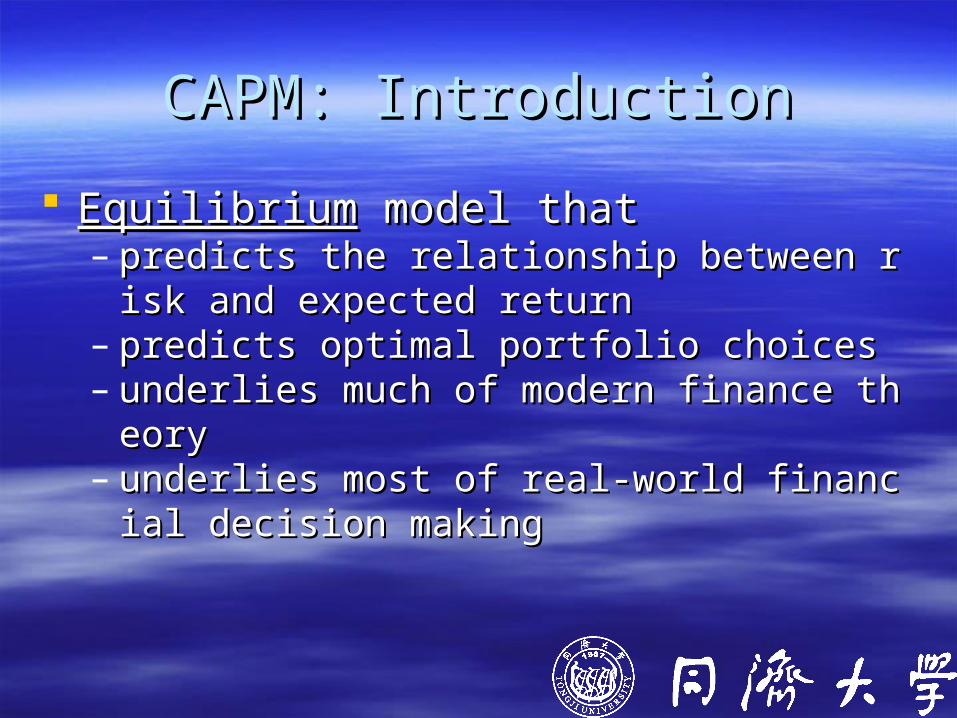
CAPM: IntroductionCAPM: Introduction
EquilibriumEquilibrium model that model that – predicts the relationship between risk and expecpredicts the relationship between risk and expec
ted returnted return– predicts optimal portfolio choicespredicts optimal portfolio choices– underlies much of modern finance theoryunderlies much of modern finance theory– underlies most of real-world financial decision munderlies most of real-world financial decision m
aking aking

Derived using Markowitz’s principles of portfDerived using Markowitz’s principles of portfolio theory, with additional simplifying assumolio theory, with additional simplifying assumptions.ptions.
Sharpe, Lintner and Mossin are researchers Sharpe, Lintner and Mossin are researchers credited with its development.credited with its development.
William Sharpe won the Nobel Prize in 1990.William Sharpe won the Nobel Prize in 1990.
AssumptionsAssumptions
1.1. No transaction costs,No transaction costs,
2.2. Assets are infinitely divisible,Assets are infinitely divisible,
3.3. No taxes,No taxes,
4.4. Individuals are price takers,Individuals are price takers,
5.5. Individuals are rational mean variance maxiIndividuals are rational mean variance maximizers,mizers,
6.6. Short selling allowed,Short selling allowed,

7.Unlimited lending and borrowing at the risk free 7.Unlimited lending and borrowing at the risk free rate,rate,
8.Homogeneous expectations,8.Homogeneous expectations,
9.Single-period model,9.Single-period model,
10. All assets are marketable.10. All assets are marketable.
Assumptions are unrealistic. Some can be Assumptions are unrealistic. Some can be relaxed and still CAPM holds. CAPM is broadly relaxed and still CAPM holds. CAPM is broadly used. It does an amazing job in practice. used. It does an amazing job in practice.
Deriving The CAPM. Deriving The CAPM. Step 1: What is the Equilibrium Step 1: What is the Equilibrium
Tangency Portfolio?Tangency Portfolio? Recall from portfolio theory: Recall from portfolio theory:
– All investors should have a (positive or negative) All investors should have a (positive or negative) fraction of their wealth invested in the risk-free fraction of their wealth invested in the risk-free security, andsecurity, and
– The rest of their wealth is invested in the tangency The rest of their wealth is invested in the tangency portfolio.portfolio.
– The tangency portfolio is the same for all investorsThe tangency portfolio is the same for all investors (homogeneous expectations).(homogeneous expectations).

In equilibrium, supply=demand so:In equilibrium, supply=demand so:– the tangency portfolio must be the portthe tangency portfolio must be the port
folio of all existing risky assets, the “mfolio of all existing risky assets, the “market portfolio” !!arket portfolio” !!

The Market PortfolioThe Market Portfolio
ppii = price of one share of risky security = price of one share of risky security ii nnii = number of shares outstanding for risky = number of shares outstanding for risky
security security ii M = Market Portfolio. The portfolio in which M = Market Portfolio. The portfolio in which
each risky security each risky security ii has the following weig has the following weight:ht:

M
market capitalization of security
total market capitalization
i ii
i ii
p n
p n
i
In words, the market portfolio is the portfolio consisting of all assets (everything!).

The Capital Market Line (CML)The Capital Market Line (CML)
Recall: The CAL with the highest Sharpe rRecall: The CAL with the highest Sharpe ratio is the CAL with respect to the tangencatio is the CAL with respect to the tangency portfolio. y portfolio.
In equilibrium, the market portfolio is the taIn equilibrium, the market portfolio is the tangency portfolio.ngency portfolio.
The market portfolio’s CAL is called the The market portfolio’s CAL is called the CaCapital Market Line (CML)pital Market Line (CML)..

The CML gives the risk-return combinationThe CML gives the risk-return combinations achieved by forming portfolios from the ris achieved by forming portfolios from the risk-free security and the market portfoliosk-free security and the market portfolio::
M
M
[ ( ) ]( ) f
p f p
E R RE R R

Step 2: What is the Risk Investors Step 2: What is the Risk Investors Face?Face?
We know that for very well diversified portfolios, We know that for very well diversified portfolios, we can eliminate diversifiable (non-systematic) we can eliminate diversifiable (non-systematic) risk. But we cannot eliminate market risk. But we cannot eliminate market (systematic) risk.(systematic) risk.
Under our assumptions, all investors hold very Under our assumptions, all investors hold very well diversified portfolios.well diversified portfolios.
Thus, we assume that the relevant measure of Thus, we assume that the relevant measure of risk for an investor is market risk. That risk is risk for an investor is market risk. That risk is measured by beta.measured by beta.
Investors are only concerned with expected Investors are only concerned with expected return and beta.return and beta.
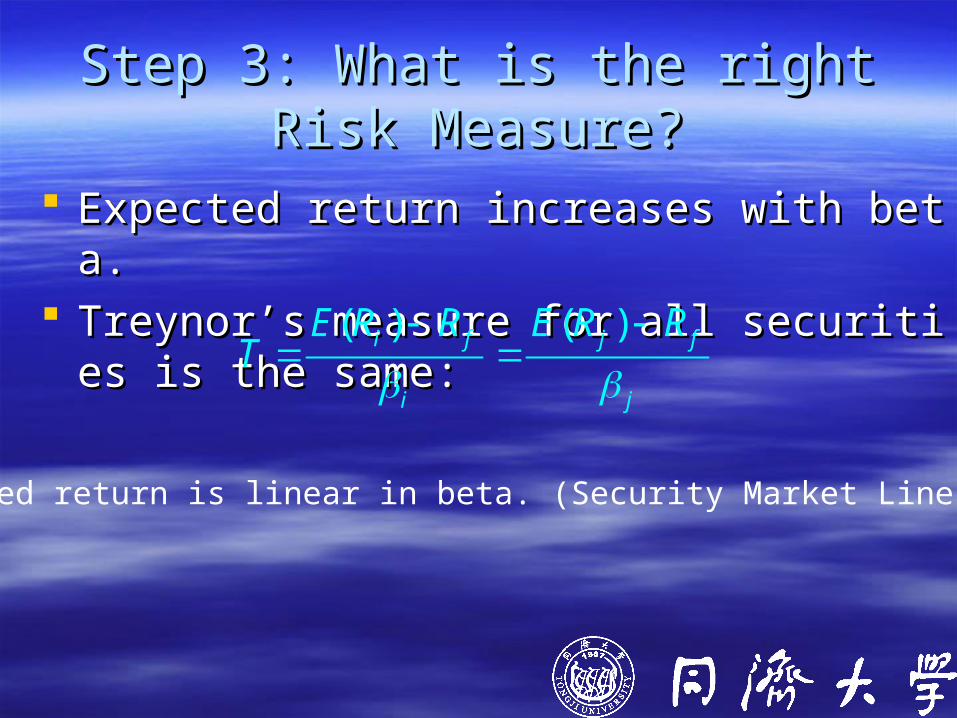
Step 3: What is the right Risk Step 3: What is the right Risk Measure?Measure?
Expected return increases with beta.Expected return increases with beta. Treynor’s measure for all securities is the samTreynor’s measure for all securities is the sam
e:e: ( ) ( )i f j f
i j
E R R E R RT
•Expected return is linear in beta. (Security Market Line, SML)

Last StepLast Step
1 Mj
))(()(
))(()(
1
)()(
fMifi
fMifi
fM
i
fi
RRERRE
RRERRE
RRERRE
CAPM
Put j=Market

CAPM ResultCAPM Result
( ) ( )i f i M fE R R E R R
Expected (required) return on a security
Compensation for time value of money
Compensation for market risk = (beta) x (market risk premium)
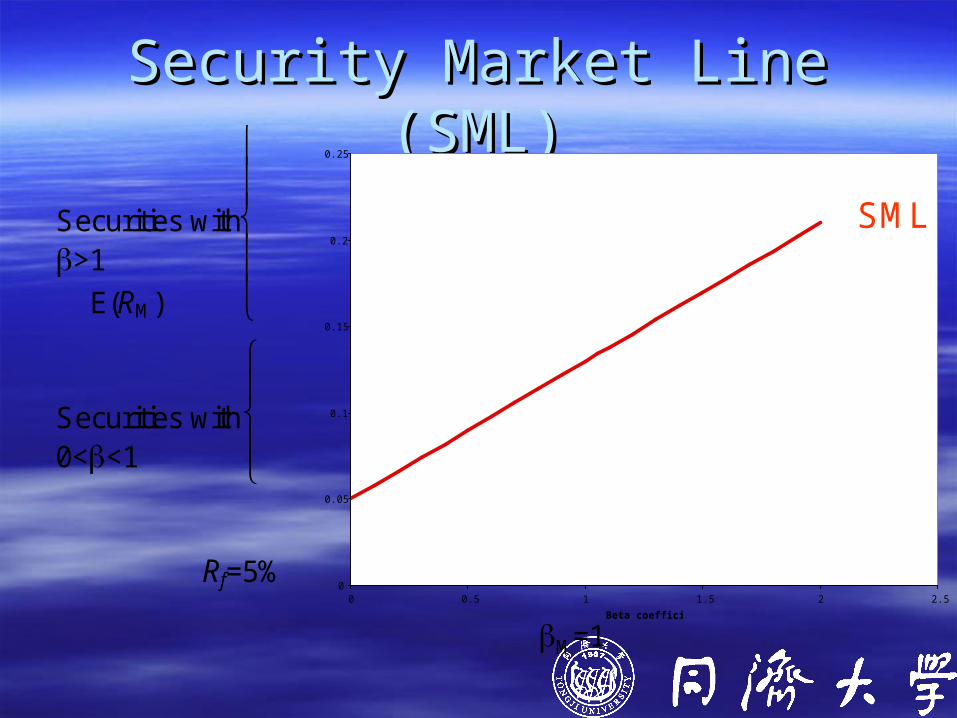
Security Market Line (SML)Security Market Line (SML)
0
0.05
0.1
0.15
0.2
0.25
0 0.5 1 1.5 2 2.5
Beta coefficient
Exp
ecte
d R
etu
rn
M=1
E(RM)
Rf=5%
SML
Securities with0<<1
Securities with>1

The Capital Market Line and The Capital Market Line and the Security Market Linethe Security Market Line

Systematic andSystematic andNon-Systematic RiskNon-Systematic Risk
The CAPM equation can be written as:The CAPM equation can be written as:
2
( )
cov[ , ]where
σ
E( ) 0
cov[ , ] 0
i f i M f i
i Mi
M
i
i M
R R R R error
R R
error
error R

This implies the total risk of a security can be partThis implies the total risk of a security can be partitioned into two components:itioned into two components:
2 2 2 2
i
var( ) var( )
σ β σ σi i
i i M
R market errorrisktotal idiosyncratic
risk risk
bi measures security i’s contribution to the total risk of a well-diversified portfolio, namely the market portfolio.Hence, bi measures the non-diversifiable risk of the stock

Investors must be compensated for holding Investors must be compensated for holding non-diversifiable risk. This explains the CAPnon-diversifiable risk. This explains the CAPM equation:M equation:
E(E(RRii) = ) = RRff + + ii [ E( [ E(RRMM) - ) - RRff ], ], ii = 1,…,N = 1,…,N

ExampleExample
ABC Internet stock has a volatility of 90% anABC Internet stock has a volatility of 90% and a beta of 3. The market portfolio has an exd a beta of 3. The market portfolio has an expected return of 14% and a volatility of 15%. pected return of 14% and a volatility of 15%. The risk-free rate is 7%.The risk-free rate is 7%.
What is the equilibrium expected return on AWhat is the equilibrium expected return on ABC stock?BC stock?
What is the proportion of ABC Internet’s variWhat is the proportion of ABC Internet’s variance which is diversified away in the market ance which is diversified away in the market portfolio?portfolio?
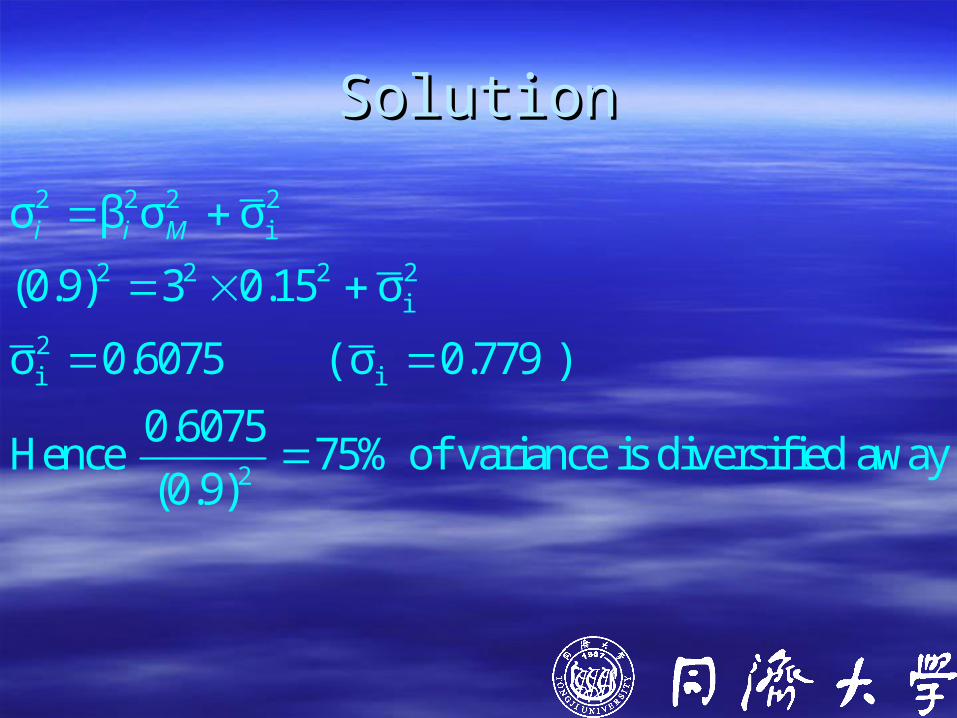
SolutionSolution
2 2 2 2i
2 2 2 2i
2i i
2
σ β σ σ
(0.9) 3 0.15 σ
σ 0.6075 ( σ 0.779 )
0.6075Hence 75% of variance is diversified away
(0.9)
i i M

CAPM and Expected ReturnCAPM and Expected ReturnThe CAPM provides us with the expected return of aThe CAPM provides us with the expected return of a
ny asset or portfolio based on its risk as measured ny asset or portfolio based on its risk as measured by beta, the risk premium in the market, and the riby beta, the risk premium in the market, and the risk free rate.sk free rate.
The difference between the asset’s implied expected The difference between the asset’s implied expected return given by the CAPM and its actual expected return given by the CAPM and its actual expected return is referred to as the asset’s alpha.return is referred to as the asset’s alpha.
alphaalpha - the difference in the rate of return of a securit - the difference in the rate of return of a security and what was predicted by an equilibrium modely and what was predicted by an equilibrium model