instructions for creating your own asset classes - moneyguidepro
TRANSCRIPT

Instructions for Customizing Asset Classes and Portfolios
MoneyGuidePro (MGP) provides default asset classes and model portfolios. In addition, historical (determined by selecting indices and a historical period) and projected (developed for MGP by Harold Evensky, CFP®) data are provided for the MGP default asset classes. These assumptions can be customized to better fit your practice and philosophy.
MGP allows you to customize your version of the program in several different ways. You can:
• add, change, and delete asset classes
• select different indices for calculating the historical return for each asset class
• choose a different historical period
• enter your own estimates for projected returns, standard deviations, and correlations
• add, change, or delete model portfolios and portfolio sets
• adjust the risk scoring.
Implications of “Creating Your Own Portfolios” The moment you click the “Continue” link on the Create Portfolios Start page, MGP creates a separate asset class and portfolio database unique to you using the existing MGP default asset class and portfolio assumptions. Even if you don’t change anything, you are now using your own asset classes and portfolios that you will control. You are now responsible for reviewing and maintaining your asset class and portfolio data which is separate from the MGP Standard database. MGP automatically updates the annual end-of-year returns for the historical indices, but you must review all other data and decide if an update is desired. When MGP updates its Standard Portfolio allocations or changes projected returns, standard deviations, or correlations, your asset class and portfolio data is not updated. We’ll notify you via email when we make changes to our standard asset class and portfolio information. You determine whether to make analogous changes to your data.
Making a Plan Before you begin attempting to create your own custom asset classes and portfolios, we encourage you to map out your selections using the worksheets provided at the end of this User Guide. Planning the changes you wish to make ahead of time will make the customization process go smoothly.
1. Begin by creating a list of the asset classes you want included in the program using the “My Asset Classes” worksheet provided at the end of this user guide. This may include some or all of the program defaults.
2. If you are going to use projected returns, determine the projected return and standard deviation for each class. Remember to include taxable and tax-free returns and standard deviations for those classes that may contain both.
© 2015 PIEtech, Inc. All Rights Reserved. Instructions for Creating Your Own Asset Classes Page 1

3. For historical returns, select an index to be used as a proxy for each asset class. A list of available indices can be found in the “Available Indices in MoneyGuidePro” table at the end of this user guide. Consider the historical period (e.g., 1950-previous year or 1970-previous year) you wish to use. The indices used for each asset class and historical period are intertwined. The start date for the historical period cannot be earlier than the latest index start date.
4. Compare the list you created in “My Asset Classes” to the default list in “Changes to the Default Asset Classes.” This way you can determine which asset classes need to be kept, which should be deleted, and which should be modified (e.g., increase return, change proxy index). Indicate any action required for each existing asset class.
5. If you choose to delete an asset class, you will first need to “move” the assets currently allocated to that asset class to another asset class or classes. Indicate the asset class(es) that will receive the assets from the class being deleted.
6. Once you have determined the asset classes you want to include in the program, you can define your portfolios in the “My Portfolios for MoneyGuidePro” worksheet. Name each portfolio and include a percentage allocation for each asset class you are including in the program (0% is an acceptable allocation).
7. Compare the list you created in “My Portfolios for MoneyGuidePro” to the default list in the “Default Portfolios in MoneyGuidePro” (the existing asset classes being used in MGP). This way you can determine which existing portfolios to keep, which to delete, and which to change. If you will be deleting any portfolios, use the “Move Allocations from Default Portfolios (if deleting)” worksheet to determine the new allocation of those assets currently allocated to the default portfolios.
Customizing Asset Classes and Portfolios To begin, log onto MGP and, on the Main Menu page and click the “User Options” link. Click the “Create Portfolios” link on the left navigation. Changes you make in the first two pages of the Create Portfolios section, Return Options and Inflation, will not separate your asset classes from the MGP defaults.
Return Options
In Return Options, you can set your preferences for return method.
1. Click “Edit Return Options” to select whether to use historical returns, projected returns, or both.
2. If you use both historical and projected returns, select one as the default (i.e., the one used each time you create a new Plan unless you choose otherwise).
Inflation
The Inflation page displays the default inflation rates. The program uses three inflation rates. The “Base Inflation Rate” is used in all calculations except: 1) the Social Security benefit cost-of-living adjustment (COLA), and 2) income tax brackets, personal exemptions and standard deductions. Social Security and Income Taxes default to the base inflation rate, but can be modified. If you
© 2015 PIEtech, Inc. All Rights Reserved. Instructions for Creating Your Own Asset Classes Page 2

choose to modify these, then MGP uses the value you enter for both historical and projected returns.
1. Click the “Edit Inflation” link and review the assumptions. When using historical returns, the Base Inflation Rate is the Consumer Price Index (CPI) for the historical period you have selected, and cannot be changed. When using projected returns, the default Base Inflation rate is 2.50%. If you chose to use only historical or projected returns, then only one Base Inflation Rate displays.
2. If you wish to use an inflation rate different than the Base inflation rate for Social Security and/or Income Tax assumptions, select to “Use My Estimate” and enter your own inflation assumption for each.
Start
Before you begin customizing, you should carefully read the Start page instructions. There are two links on the page. The first of these two allows you to review the default MPG information without making any changes. The second link, “Continue”, appears at the bottom of the Start page. Once you click this link, you will be using your own portfolios and the additional links will appear on the left menu.
Asset Class Groups and Asset Classes
Each asset class belongs to an asset class group. There are four asset class groups in the program: Cash, Bond, Stock, and Alternative. An asset class’s assigned group determines the percentage stock (or bonds, cash, etc.) displayed for the portfolio in which it’s used. A portfolio with 100% stock would include only asset classes that are part of the Stock Asset Class Group.
There is only one set of asset classes for the program, which are not only used to allocate a client’s existing assets, but also for the model portfolios.
If allowing for both Historical and Projected returns (select Both in Return Options) a return and standard deviation must exist for both. For Historical returns, you select a proxy index for each asset class to determine the Historical Rate of Return and, if desired, the Historical Standard deviation. For Projected, you must enter the return and standard deviation.
1. Go to the “Asset Class Groups” page, and select the name, order, and representative color for each of the Asset Class Groups. The default names are Cash, Bonds, Stock, and Alternative.
2. Go to the “Asset Classes” page.
a. Modify asset classes in the "default list" you plan to keep. This can include changes such as editing the name of the asset class, historical index, or projected return. You may want to change the name of the class, change the historical index, or change projected data. For historical returns, the program will calculate the standard deviation for you.
b. If you plan to delete any asset classes, append the word “delete” to the end of the asset class name. (Do not change the name to "delete," you still need the old name to identify it later.)
3. Add any new asset classes you wish to include using the “Add Asset Class” link. Enter the name of the class, select the historical index, and enter the projected return(s) and standard deviation(s). Assets in the Cash and Bond Groups can have both taxable and tax-free returns
© 2015 PIEtech, Inc. All Rights Reserved. Instructions for Creating Your Own Asset Classes Page 3

and standard deviations. When entering new classes, make sure you choose the appropriate Asset Class Group. The default Asset Class Group is Cash.
4. Sort the list of asset classes by clicking the “Change Asset Class Order” link. This determines the way they appear in the list of asset classes for allocation.
Correlations
Correlations between asset classes, in addition to the asset class standard deviation, determine the standard deviation of the portfolios used in the plan. It is important that the correlation coefficients are completed for all asset classes, otherwise the portfolio standard deviations will be incorrect, causing the Monte Carlo results and (projected) Bad Timing results to be invalid.
1. Go to the “Correlations” page.
a. If you are using historical returns, the program will automatically calculate the historical correlations.
b. If you are using projected returns, you must enter the correlation data for all asset classes in the Projected Correlations table.
c. To enter the correlation data, click on the first asset class in the Correlations table, enter the required data, and click the “Done” button. Repeat for each asset class.
Constraints
You may wish to enter the base asset class constraints within your model portfolios. This allows you to set a minimum and a maximum allocation percentage rule for each asset class included in your portfolios.
1. Go to the “Constraints” page.
a. If you wish to change constraints, click the “Add and Change Class and Group Constraints” link.
b. Review and change the minimum and/or maximum percentage allocation for each asset class as needed, and click the “Done” button to save your changes.
c. If you also wish to create Constraint Group(s), click the “Add Constraint Group” link.
d. Give the Constraint Group a description, a group minimum/maximum percentage, and then use the check boxes and minimum/maximum fields to set which asset classes belong to the group and in what concentration. Click the “Done” button to save your changes.
Please note that it is possible to create logical inconsistencies when adding more than one Constraint Group that references the same asset class(es). If such an inconsistency exists the program will be unable to tell you the exact cause, only that one exists.
Morningstar Class Mapping
When asset holdings are entered into MGP, either manually (by you) or through an integration partner, MGP uses the symbol (ticker or cusip) to automatically allocate the holding to the MGP asset classes. The program looks up the ticker in the Morningstar database to determine the
© 2015 PIEtech, Inc. All Rights Reserved. Instructions for Creating Your Own Asset Classes Page 4

Morningstar Category. The program uses the Morningstar Category to allocate among the MoneyGuidePro asset classes using the table in the Morningstar Class Mapping section.
1. Go to the “Morningstar Class Mapping” page.
2. To change the allocation for a particular style or Category, click on the name and revised the allocation.
3. If you have added new asset classes, be sure to review the Mapping tables to determine if any Morningstar Styles/Categories should be allocated to any of your new asset classes.
4. If you are deleting asset classes, be sure that no Category or Style is mapped to an asset class you will be deleting.
Portfolio Sets and Portfolios
Portfolio Sets group together certain portfolios. You may decide to have one set with the MGP default portfolios and another for your own portfolios. This way you can toggle between sets of portfolios for different clients depending on your relationship or their situation.
1. Go to the “Portfolio Sets” page.
2. The program default is one set, with the name Set 1. You can change the set name by clicking on the description.
3. To add another set, click the “Add Portfolio Set” link.
4. Once you have added all your portfolio sets, you can order them. The portfolio set in the “1” position will be the default set used in plans. You will be able to switch between sets within plans.
5. Go to the “Portfolios” page. Compare the portfolios in your first (or only) set to the default portfolios in MGP. Label the portfolios you don’t want by appending the word "delete" to their names.
a. Modify the portfolios in the "default list" you plan to keep. This can include changes such as editing the name of the portfolio or changing the allocation (to include some of your new asset classes). Be sure to remove allocations to any asset classes you will delete
b. If you plan to delete any portfolios, append the word “delete” to the end of the portfolio name. (Do not change the name to "delete," you still need the old name to identify it later.)
6. If you have added additional sets, you can switch between them using the drop-down provided. The portfolio set selected will display in the page heading.
i. Add portfolios to a set using the “Add Portfolio” link. The program automatically calculates the portfolio standard deviation using the portfolio allocation, asset class standard deviations, and correlations.
7. If you are deleting portfolios, you may want to use the “Change Portfolio Order” link to sort the portfolios so the portfolios to be deleted are last.
© 2015 PIEtech, Inc. All Rights Reserved. Instructions for Creating Your Own Asset Classes Page 5

Deleting Asset Classes and Portfolios
Now that you have added all your new asset classes and portfolios and removed any removed any allocation for the asset classes you wish to delete, you can now begin deleting the asset classes and portfolios you do not want to keep.
Prior to deleting an existing asset class or portfolio (yours or MGP default), you will need to tell the program where to move any assets already allocated to that asset class or portfolio. MGP has protections to prevent you from deleting an asset class or a portfolio being used in another part of the program.
To delete an asset class:
1. Click the “Move and Delete Asset Classes” link.
2. Select the Asset class to be deleted in the “Class to Move Amount From” drop-down. In the “Class To Move Amount To” drop-down, select the asset class(es) you wish to reallocate to. Click the “Move” button to initiate. Please note this cannot be undone.
3. Once the move is completed successfully, delete the asset class.
An asset class cannot be deleted if:
• any model portfolio has an allocation for that class. All portfolios must have an allocation of 0% to the asset class you are trying to delete
• any Morningstar Style or Morningstar Category (on the Morningstar Class Mapping page) is mapped to that class.
• it is constrained. An asset must be completely unconstrained (minimum allocation of 0% and maximum of 100%) to be deleted.
To delete a portfolio:
1. On the Portfolios page, click the “Move and Delete Portfolios” link.
2. Select the portfolio to be deleted in the “Currently Selected Portfolio” section. In the “New Selected Portfolio” section select the portfolio to reallocate to. Click the “Move” button to initiate. Please note this cannot be undone.
3. Once the move is completed successfully, delete the portfolio.
Historical Period
The historical period determines the period of time from which the historical asset class returns, standard deviations, and correlations are calculated. Because you must have data for the entire historical time period, your historical period “start year” is limited to the start year of the youngest index selected for an asset class.
1. Go to the “Historical Period” page. The default period is 1970 to the present.
2. To change the period, click the “Edit Historical Period” link and enter the new start year for the Historical Period. The “Update Portfolio Details” link allows you to see how the change in
© 2015 PIEtech, Inc. All Rights Reserved. Instructions for Creating Your Own Asset Classes Page 6

historical period affects the asset class returns and worst one-year losses. If you want the system to recalculate historical asset class standard deviations and correlations, click “Yes,” and then click “Continue.”
Risk Scoring
The Risk Scoring is used in the Financial Goal Plan and Asset Allocation plan. You will select a range for each portfolio which will be used to determine the Risk Based portfolio when you and the client select a Risk Score on the slider in the Risk Assessment section.
1. Go to the “Risk Scoring” page.
2. Enter the risk scoring for each of your portfolio sets by choosing the set name from the drop-down box, and clicking the “Edit Risk Scoring” link.
3. Next to each portfolio in the set, enter the lowest score for which the corresponding portfolio should be selected. The “range” of scores for this portfolio will begin at the number you enter and end at the next highest beginning score range. This is why it’s helpful to order your portfolios so you can quickly select an appropriate range for each. More detailed information regarding score ranges can be found in the “explain” bubble on this page.
User Guides of Interest
“Historical Returns and Projected Returns for Asset Classes and Inflation” – provides information about using historical and projected returns in MGP
© 2015 PIEtech, Inc. All Rights Reserved. Instructions for Creating Your Own Asset Classes Page 7

Planning Worksheet - My Asset Classes
Asset Class Group Asset Class Historical Taxable Index Exp.
Adj. Proj.
Return Proj. SD Historical Tax-free Index Proj. TF
Return Proj. TF
SD
Alt Example
Alternative Dow Jones Conservative
Relative Risk Index 1% 8% 26% N/A N/A N/A
Print multiple pages if necessary.
Notes:
© 2015 PIEtech, Inc. All Rights Reserved. Instructions for Creating Your Own Asset Classes Page 8

Planning Worksheet –Changes to the Default Asset Classes
MGP Default Action Required
(e.g. increase return, change proxy index, no change)
Asset Classes Historical Index*(taxable and tax-free, where applicable)
Projected Return
Standard Deviation
Cash and Cash Alternatives
T - Ibbotson U.S. Treasury Bills - Total Return (1926-2014)
TF -U.S. 30-Day Treasury Bill adjusted by Donoghue TF discount (1970-1981) Tax-Free Money Market Average (1982-2014)
3.0 % 2.0 %
Short Term Bonds
T - 50% Ibbotson U.S. Treasury Bills and 50% Ibbotson Intermediate-Term Government Bonds (1970-1978) Merrill Lynch 1-3 Year Govt Bonds (1979-2014)
TF - 50% Ibbotson U.S. T-Bill and 50% Ibbotson Intermediate-Term Government Bonds adjusted by Barclays Capital 3-year Muni discount (1970-1990) Barclays Capital 3-year Muni Bonds (1991-2014)
3.5 % 2.0 %
Intermediate Term Bonds
T - Ibbotson Intermediate-Term Government Bonds - Total Return (1926-2014)
TF - Ibbotson Long-Term Government Bonds - Total Return adjusted by Barclays Capital 10-year Muni discount (1970-1979) Barclays Capital 10-year Muni Bonds (1980-2014)
3.5 % 6.5 %
Long Term Bonds
T - Ibbotson Long-Term Corporate Bonds - Total Return (1926-2014)
TF - Ibbotson Long-Term Government Bonds - Total Return adjusted by Barclays Capital Long Muni Bonds discount (1970-1980) Barclays Capital Long Muni Bonds (1981-2014)
2.5 % 12.0 %
© 2015 PIEtech, Inc. All Rights Reserved. Instructions for Creating Your Own Asset Classes Page 9

MGP Default Action Required
(e.g. increase return, change proxy index, no change)
Asset Classes Historical Index*(taxable and tax-free, where applicable)
Projected Return
Standard Deviation
Large Cap Value Stocks
S&P 500 Composite Total Return (1970-1994) S&P 500 / Citigroup Value (1995-2014) 8.0 % 20.0 %
Large Cap Growth Stocks
S&P 500 Composite Total Return (1970-1994) S&P 500 / Citigroup Growth (1995-2014) 7.0 % 20.0 %
Mid Cap Stocks S&P 500 Composite Total Return (1970-1979) Russell Midcap (1980-2014) 7.5 % 20.0 %
Small Cap Stocks Ibbotson Small Company Stocks (1926-2014) 8.0 % 22.0 %
Int'l Developed Stocks MSCI EAFE Equity (1970-2014) 7.5 % 19.0 %
Int'l Emerging Stocks
MSCI EAFE Equity (1970-1975) IFC Global Emerging Markets Index (1976-1987) MSCI EM (Emerging Markets) (1988-2014)
9.0 % 26.0 %
* "PLUS" after an index indicates a "standard index" (such as the S&P 500) or other applicable adjustment (e.g., the REIT indices use a mean return) is used from 1970 until the index began. The PLUS indices allow you to create portfolios with a wide range of asset classes for a historical period beginning in 1970.
© 2015 PIEtech, Inc. All Rights Reserved. Instructions for Creating Your Own Asset Classes Page 10

Planning Worksheet -- My Portfolios for MoneyGuidePro
Print multiple pages if necessary.
Portfolio Name Asset Class1
Asset Class2 Total
Portfolio 1 (example) 12% 8% 15% 5% 7% 3% 26% 14% 5% 5% 0% 100%
© 2015 PIEtech, Inc. All Rights Reserved. Instructions for Creating Your Own Asset Classes Page 11

Planning Worksheet –Default Portfolios in MoneyGuidePro
Portfolio Name Cash Equiv.
Short Bond
Int. Bond
Long Bond
LC Value
LC Growth
Mid Cap
Small Cap
Int'l Dev.
Int'l Emerg.
Total
Capital Preservation I 5% 47% 20% 0% 12% 7% 0% 4% 5% 0% 100%
Capital Preservation II 5% 37% 20% 0% 16% 9% 0% 5% 8% 0% 100%
Balanced I 4% 32% 19% 0% 18% 13% 0% 5% 9% 0% 100%
Balanced II 4% 26% 16% 0% 23% 14% 0% 6% 11% 0% 100%
Total Return I 4% 22% 13% 0% 24% 15% 0% 8% 10% 4% 100%
Total Return II 3% 16% 9% 0% 27% 19% 0% 9% 12% 5% 100%
Capital Growth I 2% 8% 8% 0% 30% 21% 0% 13% 12% 6% 100%
Capital Growth II 0% 5% 4% 0% 34% 22% 0% 13% 15% 7% 100%
Equity Growth 0% 0% 0% 0% 36% 25% 0% 14% 17% 8% 100%
Note: You might use this page, for example, if you want to make a few changes in the allocations, or choose different portfolio names.
© 2015 PIEtech, Inc. All Rights Reserved. Instructions for Creating Your Own Asset Classes Page 12

Planning Worksheet – Move allocations from Default Portfolios (if deleting)
MGP Default Portfolios Move to This New Portfolio
Example: Default Portfolio 1 N/A
Capital Preservation I
Capital Preservation II
Balanced I
Balanced II
Total Return I
Total Return II
Capital Growth I
Capital Growth II
Equity Growth
© 2015 PIEtech, Inc. All Rights Reserved. Instructions for Creating Your Own Asset Classes Page 13

Planning Worksheet – Asset Class Correlations for MoneyGuidePro
Asset Classes A
sset
Cla
ss 1
Ass
et C
lass
2
Asset Class 1 1.00
Asset Class 2 1.00
1.00
1.00
1.00
1.00
1.00
1.00
1.00
1.00
1.00
Print multiple pages if necessary.
© 2015 PIEtech, Inc. All Rights Reserved. Instructions for Creating Your Own Asset Classes Page 14

Planning Worksheet -- Assigning Risk Tolerance Scores to My New Portfolios in MoneyGuidePro
My New Portfolios Risk Tolerance Score
Print multiple pages if necessary.
© 2015 PIEtech, Inc. All Rights Reserved. Instructions for Creating Your Own Asset Classes Page 15

Planning Worksheet – Mapping Asset Classes to Morningstar Styles and Categories
You can allocate each style and category to maximum of 10 classes. To view MGP’s default Class Mapping, go to the Support Center located on the Main Menu.
Morningstar Styles – Used to Map Stocks Only
Style MGP Class Mapping Description
Large Core
Large-blend portfolios are fairly representative of the overall U.S. stock market in size, growth rates, and price. Stocks in the top 70% of the capitalization of the U.S. equity market are defined as large-cap. The blend style is assigned to portfolios where neither growth nor value characteristics predominate. These portfolios tend to invest across the spectrum of U.S. industries, and owing to their broad exposure, the portfolios' returns are often similar to those of the S&P 500 Index.
Large Growth
Large-growth portfolios invest in big U.S. companies that are projected to grow faster than other large-cap stocks. Stocks in the top 70% of the capitalization of the U.S. equity market are defined as large-cap. Growth is defined based on fast growth (high growth rates for earnings, sales, book value, and cash flow) and high valuations (high price ratios and low dividend yields). Most of these portfolios focus on companies in rapidly expanding industries.
Large Value
Large-value portfolios invest primarily in large U.S. stocks that are less expensive or growing more slowly than other large-cap stocks. Stocks in the top 70% of the capitalization of the U.S. equity market are defined as large-cap. Value is defined based on low valuations (low price ratios and high dividend yields) and slow growth (low growth rates for earnings, sales, book value, and cash flow).
Medium Core
The typical mid-cap blend portfolio invests in U.S. stocks of various sizes and styles, giving it a middle-of-the-road profile. Most shy away from high-priced growth stocks, but aren't so price-conscious that they land in value territory. The U.S. mid-cap range for market capitalization typically falls between $1 billion-$8 billion and represents 20% of the total capitalization of the U.S. equity market. The blend style is assigned to portfolios where neither growth nor value characteristics predominate.
© 2015 PIEtech, Inc. All Rights Reserved. Instructions for Creating Your Own Asset Classes Page 16

Style MGP Class Mapping Description
Medium Growth
Some mid-cap growth portfolios invest in stocks of all sizes, thus leading to a mid-cap profile, but others focus on midsize companies. Mid-cap growth portfolios target U.S. firms that are projected to grow faster than other mid-cap stocks, therefore commanding relatively higher prices. The U.S. mid-cap range for market capitalization typically falls between $1 billion-$8 billion and represents 20% of the total capitalization of the U.S. equity market. Growth is defined based on fast growth (high growth rates for earnings, sales, book value, and cash flow) and high valuations (high price ratios and low dividend yields).
Medium Value
Some mid-cap value portfolios focus on medium-size companies while others land here because they own a mix of small-, mid-, and large-cap stocks. All look for U.S. stocks that are less expensive or growing more slowly than the market. The U.S. mid-cap range for market capitalization typically falls between $1 billion-$8 billion and represents 20% of the total capitalization of the U.S. equity market. Value is defined based on low valuations (low price ratios and high dividend yields) and slow growth (low growth rates for earnings, sales, book value, and cash flow).
Small Core
Small-blend portfolios favor U.S. firms at the smaller end of the market-capitalization range. Some aim to own an array of value and growth stocks while others employ a discipline that leads to holdings with valuations and growth rates close to the small-cap averages. Stocks in the bottom 10% of the capitalization of the U.S. equity market are defined as small-cap. The blend style is assigned to portfolios where neither growth nor value characteristics predominate.
Small Growth
Small-growth portfolios focus on faster-growing companies whose shares are at the lower end of the market-capitalization range. These portfolios tend to favor companies in up-and-coming industries or young firms in their early growth stages. Because these businesses are fast-growing and often richly valued, their stocks tend to be volatile. Stocks in the bottom 10% of the capitalization of the U.S. equity market are defined as small-cap. Growth is defined based on fast growth (high growth rates for earnings, sales, book value, and cash flow) and high valuations (high price ratios and low dividend yields).
Small Value
Small-value portfolios invest in small U.S. companies with valuations and growth rates below other small-cap peers. Stocks in the bottom 10% of the capitalization of the U.S. equity market are defined as small-cap. Value is defined based on low valuations (low price ratios and high dividend yields) and slow growth (low growth rates for earnings, sales, book value, and cash flow).
© 2015 PIEtech, Inc. All Rights Reserved. Instructions for Creating Your Own Asset Classes Page 17

Morningstar Styles – Used to Map ADRs Only
Style MGP Class Mapping Description
Large Core
Large-blend portfolios are fairly representative of the overall U.S. stock market in size, growth rates, and price. Stocks in the top 70% of the capitalization of the U.S. equity market are defined as large-cap. The blend style is assigned to portfolios where neither growth nor value characteristics predominate. These portfolios tend to invest across the spectrum of U.S. industries, and owing to their broad exposure, the portfolios' returns are often similar to those of the S&P 500 Index.
Large Growth
Large-growth portfolios invest in big U.S. companies that are projected to grow faster than other large-cap stocks. Stocks in the top 70% of the capitalization of the U.S. equity market are defined as large-cap. Growth is defined based on fast growth (high growth rates for earnings, sales, book value, and cash flow) and high valuations (high price ratios and low dividend yields). Most of these portfolios focus on companies in rapidly expanding industries.
Large Value
Large-value portfolios invest primarily in large U.S. stocks that are less expensive or growing more slowly than other large-cap stocks. Stocks in the top 70% of the capitalization of the U.S. equity market are defined as large-cap. Value is defined based on low valuations (low price ratios and high dividend yields) and slow growth (low growth rates for earnings, sales, book value, and cash flow).
Medium Core
The typical mid-cap blend portfolio invests in U.S. stocks of various sizes and styles, giving it a middle-of-the-road profile. Most shy away from high-priced growth stocks, but aren't so price-conscious that they land in value territory. The U.S. mid-cap range for market capitalization typically falls between $1 billion-$8 billion and represents 20% of the total capitalization of the U.S. equity market. The blend style is assigned to portfolios where neither growth nor value characteristics predominate.
Medium Growth
Some mid-cap growth portfolios invest in stocks of all sizes, thus leading to a mid-cap profile, but others focus on midsize companies. Mid-cap growth portfolios target U.S. firms that are projected to grow faster than other mid-cap stocks, therefore commanding relatively higher prices. The U.S. mid-cap range for market capitalization typically falls between $1 billion-$8 billion and represents 20% of the total capitalization of the U.S. equity market. Growth is defined based on fast growth (high growth rates for earnings, sales, book value, and cash flow) and high valuations (high price ratios and low dividend yields).
© 2015 PIEtech, Inc. All Rights Reserved. Instructions for Creating Your Own Asset Classes Page 18

Style MGP Class Mapping Description
Medium Value
Some mid-cap value portfolios focus on medium-size companies while others land here because they own a mix of small-, mid-, and large-cap stocks. All look for U.S. stocks that are less expensive or growing more slowly than the market. The U.S. mid-cap range for market capitalization typically falls between $1 billion-$8 billion and represents 20% of the total capitalization of the U.S. equity market. Value is defined based on low valuations (low price ratios and high dividend yields) and slow growth (low growth rates for earnings, sales, book value, and cash flow).
Small Core
Small-blend portfolios favor U.S. firms at the smaller end of the market-capitalization range. Some aim to own an array of value and growth stocks while others employ a discipline that leads to holdings with valuations and growth rates close to the small-cap averages. Stocks in the bottom 10% of the capitalization of the U.S. equity market are defined as small-cap. The blend style is assigned to portfolios where neither growth nor value characteristics predominate.
Small Growth
Small-growth portfolios focus on faster-growing companies whose shares are at the lower end of the market-capitalization range. These portfolios tend to favor companies in up-and-coming industries or young firms in their early growth stages. Because these businesses are fast-growing and often richly valued, their stocks tend to be volatile. Stocks in the bottom 10% of the capitalization of the U.S. equity market are defined as small-cap. Growth is defined based on fast growth (high growth rates for earnings, sales, book value, and cash flow) and high valuations (high price ratios and low dividend yields).
Small Value
Small-value portfolios invest in small U.S. companies with valuations and growth rates below other small-cap peers. Stocks in the bottom 10% of the capitalization of the U.S. equity market are defined as small-cap. Value is defined based on low valuations (low price ratios and high dividend yields) and slow growth (low growth rates for earnings, sales, book value, and cash flow).
© 2015 PIEtech, Inc. All Rights Reserved. Instructions for Creating Your Own Asset Classes Page 19
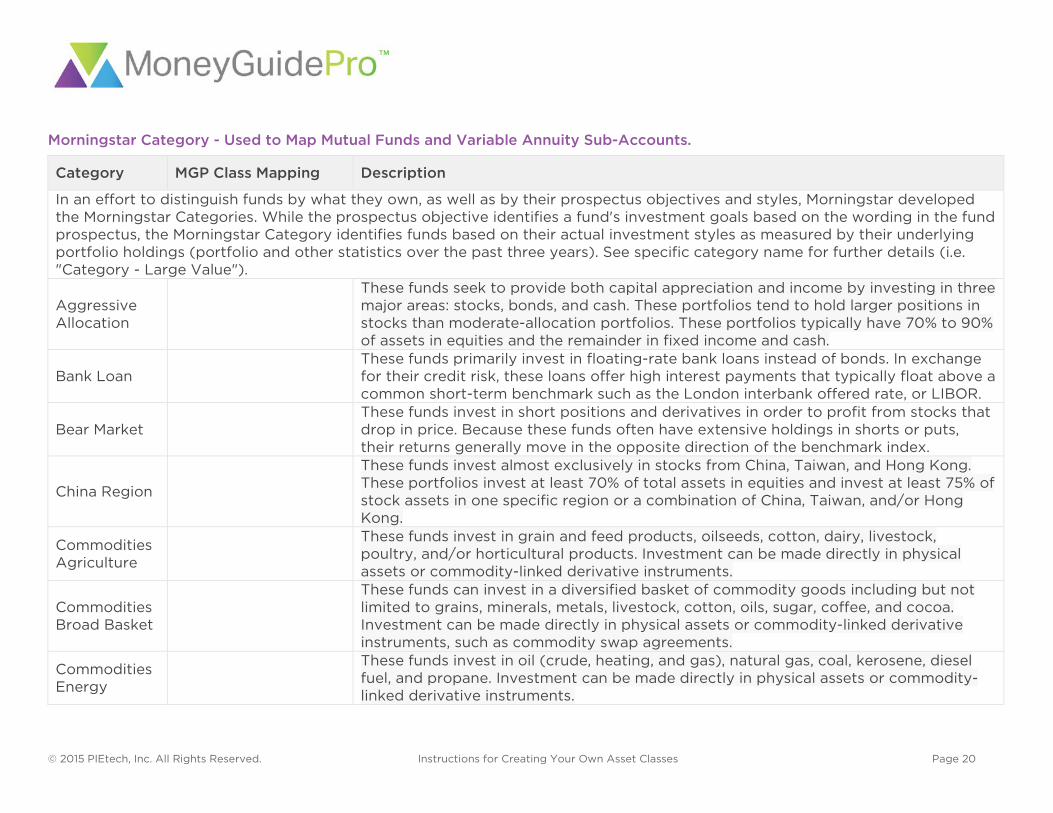
Morningstar Category - Used to Map Mutual Funds and Variable Annuity Sub-Accounts.
Category MGP Class Mapping Description
In an effort to distinguish funds by what they own, as well as by their prospectus objectives and styles, Morningstar developed the Morningstar Categories. While the prospectus objective identifies a fund's investment goals based on the wording in the fund prospectus, the Morningstar Category identifies funds based on their actual investment styles as measured by their underlying portfolio holdings (portfolio and other statistics over the past three years). See specific category name for further details (i.e. "Category - Large Value").
Aggressive Allocation
These funds seek to provide both capital appreciation and income by investing in three major areas: stocks, bonds, and cash. These portfolios tend to hold larger positions in stocks than moderate-allocation portfolios. These portfolios typically have 70% to 90% of assets in equities and the remainder in fixed income and cash.
Bank Loan These funds primarily invest in floating-rate bank loans instead of bonds. In exchange
for their credit risk, these loans offer high interest payments that typically float above a common short-term benchmark such as the London interbank offered rate, or LIBOR.
Bear Market These funds invest in short positions and derivatives in order to profit from stocks that drop in price. Because these funds often have extensive holdings in shorts or puts, their returns generally move in the opposite direction of the benchmark index.
China Region
These funds invest almost exclusively in stocks from China, Taiwan, and Hong Kong. These portfolios invest at least 70% of total assets in equities and invest at least 75% of stock assets in one specific region or a combination of China, Taiwan, and/or Hong Kong.
Commodities Agriculture
These funds invest in grain and feed products, oilseeds, cotton, dairy, livestock, poultry, and/or horticultural products. Investment can be made directly in physical assets or commodity-linked derivative instruments.
Commodities Broad Basket
These funds can invest in a diversified basket of commodity goods including but not limited to grains, minerals, metals, livestock, cotton, oils, sugar, coffee, and cocoa. Investment can be made directly in physical assets or commodity-linked derivative instruments, such as commodity swap agreements.
Commodities Energy
These funds invest in oil (crude, heating, and gas), natural gas, coal, kerosene, diesel fuel, and propane. Investment can be made directly in physical assets or commodity-linked derivative instruments.
© 2015 PIEtech, Inc. All Rights Reserved. Instructions for Creating Your Own Asset Classes Page 20

Category MGP Class Mapping Description
Commodities Industrial Metals
These funds invest in such industrial metals as aluminum, copper, lead, nickel, and zinc. Investment can be made directly in physical assets or commodity-linked derivative instruments.
Commodities Miscellaneous
These funds invest in a specific commodity that does not fit into any of Morningstar’s existing commodity categories and for which not enough funds exist to merit the creation of a separate category.
Commodities Precious Metals
The investment seeks to replicate the performance, net of expenses, of the price of gold bullion. The trust holds gold, and is expected to issue baskets in exchange for deposits of gold, and to distribute gold in connection with redemption of baskets. The gold held by the trust will only be sold on an as-needed basis to pay trust expenses, in the event the trust terminates and liquidates its assets, or as otherwise required by law or regulation.
Conservative Allocation
These funds invest in both stocks and bonds and maintain a relatively smaller position in stocks. These funds typically have 20%-50% of assets in equities and 50%-80% of assets in fixed income and cash.
Consumer Discretionary These funds seek capital appreciation by investing in equity securities of U.S. or non-
U.S. companies in the consumer discretionary sector.
Consumer Staples
These funds seek capital appreciation by investing in equity securities of U.S. or non-U.S. companies that are engaged in the manufacturing, sales, or distribution of consumer staples.
Convertibles These funds invest primarily in bonds and preferred stocks that can be converted to common stocks. Convertible bonds pay income to investors like a corporate bond, but convertibles are more correlated to the equity market than corporate bonds.
Currency These funds invest in U.S. and foreign currencies through the use of short-term money market instruments; derivative instruments including (and not limited to) forward currency contracts, index swaps, and options; and cash deposits.
Diversified Emerging Markets
These funds invest at least 70% of total assets in equities and invest at least 50% of stock assets in emerging markets.
Diversified Pacific/Asia These funds invest at least 70% of assets in equities and at least 75% of stocks assets
in Pacific countries, including at least 10% in Japan. Emerging-Markets Bond These funds seek income by investing in fixed-income securities in emerging markets.
These funds typically invest at least 65% of bond assets in emerging-market bonds.
© 2015 PIEtech, Inc. All Rights Reserved. Instructions for Creating Your Own Asset Classes Page 21

Category MGP Class Mapping Description
Equity Energy
These funds invest primarily in equity securities of U.S. or non-U.S. companies who conduct business primarily in energy-related industries. This includes and is not limited to companies in alternative energy, coal, exploration, oil and gas services, pipelines, natural gas services, and refineries.
Europe Stock These funds invest at least 70% of assets in equities and at least 75% of stocks in Europe.
Foreign Large Blend
These funds seek capital appreciation by investing in a variety of large international stocks. Large-cap foreign stocks have market capitalizations greater than $5 billion. The blend style is assigned to funds where neither growth nor value characteristics predominate. These funds typically will have less than 20% of assets invested in U.S. stocks.
Foreign Large Growth
These funds seek capital appreciation by investing in large international stocks that are growth-oriented. Large-cap foreign stocks have market capitalizations greater than $5 billion. Growth is defined based on high price-to-book and price-to-cash flow ratios, relative to the MSCI EAFE index. These funds typically will have less than 20% of assets invested in U.S. stocks.
Foreign Large Value
These funds seek capital appreciation by investing in large international stocks that are value-oriented. Large-cap foreign stocks have market capitalizations greater than $5 billion. Value is defined based on low price-to-book and price-to-cash flow ratios, relative to the MSCI EAFE index. These funds typically will have less than 20% of assets invested in U.S. stocks.
Foreign Small/Mid
Blend
Foreign small/mid-blend portfolios invest in a variety of international stocks that are smaller.
These portfolios primarily invest in stocks that fall in the bottom 30% of each economically integrated market (such as Europe or Asia ex-Japan). The blend style is assigned to portfolios where neither growth nor value characteristics predominate. These portfolios typically will have less than 20% of assets invested in U.S. stocks.
Foreign Small/Mid Growth
These funds seek capital appreciation by investing in small- and mid-sized international stocks that are growth-oriented. Small- and mid-cap stocks have market capitalizations less than $5 billion. Growth is defined based on high price-to-book and price-to-cash flow ratios, relative to the MSCI EAFE index. These funds typically will have less than 20% of assets invested in U.S. stocks.
© 2015 PIEtech, Inc. All Rights Reserved. Instructions for Creating Your Own Asset Classes Page 22

Category MGP Class Mapping Description
Foreign Small/Mid Value
These funds seek capital appreciation by investing in small- and mid-sized international stocks that are value-oriented. Small- and mid-cap stocks have market capitalizations less than $5 billion. Value is defined based on low price-to-book and price-to-cash flow ratios, relative to the MSCI EAFE index. These funds typically will have less than 20% of assets invested in U.S. stocks.
Global Real Estate
These funds invest primarily in non-U.S. real estate securities but may also invest in U.S. real estate securities. Securities that these portfolios purchase include: debt & equity securities, convertible securities, and securities issued by real estate investment trusts and REIT-like entities. Portfolios in this category also invest in real estate operating companies
High-Yield Bond
These funds primarily invest in U.S. high-income fixed-income securities where at least 65% or more of bond assets are not rated or are rated by a major agency such as Standard & Poor's or Moody's at the level of BB (considered speculative for taxable bonds) and below.
High Yield Muni
These funds invest at least 50% of assets in high-income municipal securities that are not rated or that are rated by a major agency such as Standard & Poor's or Moody's at the level of BBB (considered speculative in the municipal industry) and below.
Industrials
These funds seek capital appreciation by investing in equity securities of U.S. or non-U.S. companies that are engaged in services related to cyclical industries. This includes and is not limited to companies in aerospace and defense, automotive, chemicals, construction, environmental services, machinery, paper, and transportation.
Inflation-Protected Bond
Inflation-protected bond portfolios primarily invest in fixed-income securities that increase coupon and/or principal payments at the rate of inflation. These bonds can be issued by any organization, but the U.S. Treasury is currently the largest issuer of these types of securities. Most of these portfolios buy bonds with intermediate- to long-term maturities.
Intermediate Government
These funds have at least 90% of their bond portfolio invested in US government issues and have a duration of 3.5 to six years or (if duration is unavailable) an average effective maturity of four to 10 years.
Intermediate-Term Bond
These funds invest primarily in corporate and other investment-grade U.S. fixed-income issues and have an average duration of 3.5 to six years or (if duration is unavailable) an average effective maturity of four to 10 years.
Japan Stock These funds invest at least 70% of total assets in equities and invest at least 75% of stock assets in Japan.
© 2015 PIEtech, Inc. All Rights Reserved. Instructions for Creating Your Own Asset Classes Page 23

Category MGP Class Mapping Description
Large Blend These funds invest in a variety of large US stocks. Stocks in the top 70% of the capitalization of the US equity market are defined as large-cap. The blend style is assigned to funds where neither growth nor value characteristics predominate.
Large Growth
These funds invest primarily in large US stocks that are growth-oriented. Stocks in the top 70% of the capitalization of the US equity market are defined as large-cap. Growth is defined based on a strong growth style (high growth rates for earnings, sales, book value, and cash flow) and a weak value style (high price ratios and low dividend yields).
Large Value
These funds invest primarily in large US stocks that are value-oriented. Stocks in the top 70% of the capitalization of the US equity market are defined as large-cap. Value is defined based on a strong value style (low price ratios and high dividend yields) and a slow growth style (low growth rates for earnings, sales, book value, and cash flow).
Latin America Stock These funds invest at least 70% of total assets in equities and invest at least 75% of
stock assets in Latin America. Long-Term Government Bond
These funds have at least 90% of their bond portfolio invested in US government issues and have a duration of greater than six years or (if duration is unavailable) an average effective maturity of greater than or equal to 10 years.
Long-Short
Long-short portfolios take long positions in securities that appear attractive and short positions in securities that appear to be unattractive. Some of these portfolios are market neutral, which means that they divide their exposure equally between long and short positions in an attempt to minimize the losses that could occur from a broad market rally or decline. Other portfolios focus exclusively on stocks that are or could be involved in mergers and acquisitions.
Long-Term Bond
These funds invest primarily in corporate and other investment grade U.S. fixed-income issues and have an average duration of greater than six years or (if duration is unavailable) an average effective maturity greater than 10 years.
Market Neutral
These funds attempt to reduce systematic risk created by factors such as exposures to sectors, market-cap ranges, investment styles, currencies, and/or countries. They try to achieve this by matching short positions within each area against long positions. These strategies are often managed as beta-neutral, dollar-neutral, or sector-neutral. A distinguishing feature of funds in this category is that they typically have low beta exposures (< 0.3 in absolute value) to market indexes such as MSCI World. In attempting to reduce systematic risk, these funds put the emphasis on issue selection, with profits dependent on their ability to sell short and buy long the correct securities.
© 2015 PIEtech, Inc. All Rights Reserved. Instructions for Creating Your Own Asset Classes Page 24

Category MGP Class Mapping Description
Managed Futures
These funds primarily trade liquid global futures, options, swaps, and foreign exchange contracts, both listed and over-the-counter. A majority of these funds follow trend-following, price-momentum strategies. Other strategies included in this category are systematic mean-reversion, discretionary global macro strategies, commodity index tracking, and other futures strategies. More than 60% of the fund's exposure is invested through derivative securities. These funds obtain exposure primarily through derivatives; the holdings are largely cash instruments.
Mid-Cap Blend
These funds invest in a variety of mid-cap U.S. stocks. Mid-cap stocks collectively represent 20% of the total capitalization of the U.S. equity market (large-cap stocks represent the top 70%). The mid-cap range for market capitalization typically falls between $1-$8 billion. The blend style is assigned to funds where neither growth nor value characteristics predominate.
Mid-Cap Growth
These funds invest primarily in mid-cap U.S. stocks that are growth-oriented. Mid-cap stocks collectively represent 20% of the total capitalization of the U.S. equity market (large-cap stocks represent the top 70%). The mid-cap range for market capitalization typically falls between $1-$8 billion. Growth is defined based on fast growth (high growth rates for earnings, sales, book value, and cash flow) and high valuations (high price ratios and low dividend yields).
Mid-Cap Value
These funds invest primarily in mid-cap U.S. stocks that are value-oriented. Mid-cap stocks collectively represent 20% of the total capitalization of the U.S. equity market (large-cap stocks represent the top 70%). The mid-cap range for market capitalization typically falls between $1-$8 billion. Value is defined based on low valuations (low price ratios and high dividend yields) and slow growth (low growth rates for earnings, sales, book value, and cash flow).
Miscellaneous Sector
These funds invest in specific sectors that do not fit into any of Morningstar’s existing sector categories and for which not enough funds exist to merit the creation of a separate category.
Moderate Allocation
These funds invest in both stocks and bonds and maintain a relatively higher position in stocks. These funds typically have 50%-70% of assets in equities and the remainder in fixed income and cash.
Money Market Tax Free
These funds invest in short-term municipal money market securities that are often exempt from some federal and state taxes. These funds provide current income and aim to preserve capital.
Money Market Taxable These funds invest in short-term money market securities in order to provide a level of
current income that is consistent with the preservation of capital. © 2015 PIEtech, Inc. All Rights Reserved. Instructions for Creating Your Own Asset Classes Page 25

Category MGP Class Mapping Description
Multialternative
These funds will use a combination of alternative strategies such as taking long and short positions in equity and debt, trading futures, or using convertible arbitrage, among others. Funds in this category have a majority of their assets exposed to alternative strategies and include both funds with static allocations to alternative strategies and funds tactically allocating among alternative strategies and asset classes.
Multisector Bond
These funds seek income by diversifying their assets among several fixed-income sectors, usually U.S. government obligations, U.S. corporate bonds, foreign bonds, and high-yield U.S. debt securities. These funds typically hold 35% to 65% of bond assets in securities that are not rated or are rated by a major agency such as Standard & Poor's or Moody's at the level of BB (considered speculative for taxable bonds) and below.
Muni California Int/Sh
These funds invest at least 80% of assets in California municipal debt. This category includes all such funds with an average duration of less than seven years or (if duration is unavailable) an average maturity of less than 12 years.
Muni California Long
These funds invest at least 80% of assets in California municipal debt. This category includes all such funds with an average duration of more than seven years or (if duration is unavailable) an average maturity of more than 12 years.
Muni Florida These funds invest at least 80% of assets in Florida municipal debt and can include long, intermediate, and short duration funds.
Muni Massachusetts These funds invest at least 80% of assets in Massachusetts municipal debt and can
include long, intermediate, and short duration funds. Muni Minnesota These funds invest at least 80% of assets in Minnesota municipal debt and can include
long, intermediate, and short duration funds.
Muni National Intermediate
These funds invest in municipal securities across the U.S. and have an average duration of 4.5 to seven years or (if duration is unavailable) an average maturity of five to 12 years.
Muni National Long
These funds invest in municipal securities across the US and have an average duration of more than seven years or (if duration is unavailable) an average maturity of more than 12 years.
Muni National Short
These funds invest in municipal securities across the U.S. and have an average duration of less than 4.5 years or (if duration is unavailable) an average maturity of less than five years.
Muni New Jersey These funds invest at least 80% of assets in New Jersey municipal debt and can include
long, intermediate, and short duration funds.
© 2015 PIEtech, Inc. All Rights Reserved. Instructions for Creating Your Own Asset Classes Page 26

Category MGP Class Mapping Description
Muni New York Int/Sh
These funds invest at least 80% of assets in New York municipal debt. This category includes all such funds with an average duration of less than seven years or (if duration is unavailable) an average maturity of less than 12 years.
Muni New York Long
These funds invest at least 80% of assets in New York municipal debt. This category includes all such funds with an average duration of more than seven years or (if duration is unavailable) an average maturity of more than 12 years.
Muni Ohio These funds invest at least 80% of assets in Ohio municipal debt and can include long, intermediate, and short duration funds.
Muni Pennsylvania These funds invest at least 80% of assets in Pennsylvania municipal debt and can
include long, intermediate, and short duration funds. Muni Single State - Intermediate
These funds primarily invest in municipal securities from one state and have an average duration of less than seven years or (if duration is unavailable) an average maturity of less than 12 years.
Muni Single State Long
These funds primarily invest in municipal securities from one state and have an average duration of more than seven years or (if duration is unavailable) an average maturity of more than 12 years.
Muni Single State Short
Muni single-state short portfolios invest in bonds issued by state and local governments to fund public projects. The income from such bonds is generally free from federal taxes and from state taxes in the issuing state. To get the state-tax benefit, these portfolios buy bonds from only one state. These portfolios have durations of less than 4.5 years (or, if duration is unavailable, average maturities of less than five years).
Pacific/Asia ex-Japan These funds invest at least 70% of total assets in equities and invest at least 75% of
stock assets in Pacific countries, with less than 10% in Japan. Retirement Income These funds provide diversified exposure to stocks, bonds, and cash for those
investors who aim for Income during retirement.
Short Government
These funds have at least 90% of their bond portfolio invested in US government issues and have a duration of one to 3.5 years or (if duration is unavailable) an average effective maturity of one to four years.
Short-Term Bond
These funds invest primarily in corporate and other investment-grade U.S. fixed-income issues and have an average duration of one to 3.5 years or (if duration is unavailable) an average effective maturity of one to four years.
© 2015 PIEtech, Inc. All Rights Reserved. Instructions for Creating Your Own Asset Classes Page 27

Category MGP Class Mapping Description
Small Blend These funds invest in a variety of small US stocks. Stocks in the bottom 10% of the capitalization of the US equity market are defined as small-cap. The blend style is assigned to funds where neither growth nor value characteristics predominate.
Small Growth
These funds invest primarily in small US stocks that are growth-oriented. Stocks in the bottom 10% of the capitalization of the US equity market are defined as small-cap. Growth is defined based on a fast growth (high growth rates for earnings, sales, book value, and cash flow) and high valuations (high price ratios and low dividend yields).
Small Value
These funds invest primarily in small US stocks that are value-oriented. Stocks in the bottom 10% of the capitalization of the US equity market are defined as small-cap. Value is defined based on a strong value style (low price ratios and high dividend yields) and a slow growth style (low growth rates for earnings, sales, book value, and cash flow).
Specialty Communications These funds seek capital appreciation by investing primarily in communications stocks.
Specialty Financial
These funds seek capital appreciation by investing primarily in equity securities of US or non-US financial-services companies, including banks, brokerage firms, and insurance companies.
Specialty Health Care
These funds seek capital appreciation by investing primarily in equity securities of US or non-US health-care companies, including drug manufacturers, hospitals, and biotechnology firms.
Specialty Natural Resources
These funds seek capital appreciation by investing primarily in equity securities of US or non-US companies involved in the exploration, distribution, or processing of natural resources.
Specialty Precious Metals
These funds pursue capital appreciation by investing primarily in equity securities of companies engaged in the mining, distribution, or processing of precious metals.
Specialty Real Estate These funds seek capital appreciation by investing primarily in US or non-US real-
estate-related equity securities. Specialty Technology These funds seek capital appreciation by investing primarily in hardware, software, and
communications technology.
Specialty Utilities
These funds seek capital appreciation by investing primarily in equity securities of US or non-US public utilities including electric, gas, and telephone-service providers. This group includes funds that invest primarily in global communications.
© 2015 PIEtech, Inc. All Rights Reserved. Instructions for Creating Your Own Asset Classes Page 28

Category MGP Class Mapping Description
Stable Value
Stable-value portfolios seek to provide income while preventing price fluctuations. The most common stable-value portfolios invest in a diversified portfolio of bonds and enter into wrapper agreements with financial companies to guarantee against fluctuations in their share prices. These wrapper agreements typically provide price stability on a day-to-day basis, thereby insulating each portfolio's net asset value from interest-rate 23volatility. Therefore, their true overall durations are effectively zero.
Target-Date 2011-2015
These funds provide diversified exposure to stocks, bonds, and cash for those investors who have a specific date in mind (in this case, the years 2011-2015) for retirement or another goal.
Target-Date 2016-2020
These funds provide diversified exposure to stocks, bonds, and cash for those investors who have a specific date in mind (in this case, the years 2016-2020) for retirement or another goal.
Target-Date 2021-2025
These funds provide diversified exposure to stocks, bonds, and cash for those investors who have a specific date in mind (in this case, the years 2021-2025) for retirement or another goal.
Target-Date 2026-2030
These funds provide diversified exposure to stocks, bonds, and cash for those investors who have a specific date in mind (in this case, the years 2026-2030) for retirement or another goal.
Target-Date 2031-2035
These funds provide diversified exposure to stocks, bonds, and cash for those investors who have a specific date in mind (in this case, the years 2031-2035) for retirement or another goal.
Target-Date 2036-2040
These funds provide diversified exposure to stocks, bonds, and cash for those investors who have a specific date in mind (in this case, the years 2036-2040) for retirement or another goal.
Target-Date 2041-2045
These funds provide diversified exposure to stocks, bonds, and cash for those investors who have a specific date in mind (in this case, the years 2041-2045) for retirement or another goal.
Target Date 2050+
These funds provide diversified exposure to stocks, bonds, and cash for those investors who have a specific date in mind (in this case, the years 2050 and beyond) for retirement or another goal.
Target-Date 2000-2014
These funds provide diversified exposure to stocks, bonds, and cash for those investors who have a specific date in mind (in this case, the years 2000-2014) for retirement or another goal.
© 2015 PIEtech, Inc. All Rights Reserved. Instructions for Creating Your Own Asset Classes Page 29

Category MGP Class Mapping Description
Target-Date 2015-2029
These funds provide diversified exposure to stocks, bonds, and cash for those investors who have a specific date in mind (in this case, the years 2015-2029) for retirement or another goal.
Target-Date 2030+
These funds provide diversified exposure to stocks, bonds, and cash for those investors who have a specific date in mind (in this case, the years 2030 and beyond) for retirement or another goal.
Target-Date 2046-2050
These funds provide diversified exposure to stocks, bonds, and cash for those investors who have a specific date in mind (in this case, the years 2046-2050) for retirement or another goal.
Trading-Inverse Commodities
These funds seek to generate returns equal to an inverse multiple of short-term returns of a commodity index. The compounding of short-term returns results in performance that does not correspond to those of investing in the index with external leverage. For example, a fund attempting to achieve negative 2 times the returns of a given index on a daily basis is unlikely to deliver anything like negative 2 times the index’s returns over periods longer than one day. Many of these funds seek to generate a multiple typically negative 1 to negative 3 times of the daily or weekly return of the reference index.
Trading-Inverse Debt
These funds seek to generate returns equal to an inverse fixed multiple of short-term returns of a fixed-income index. The compounding of short-term returns results in performance that does not correspond to those of investing in the index with external leverage. For example, a fund attempting to achieve negative 2 times the returns of a given index on a daily basis is unlikely to deliver anything like negative 2 times the index’s returns over periods longer than one day.
Trading-Inverse Equity
These funds seek to generate returns equal to an inverse fixed multiple of short-term returns of an equity index. The compounding of short-term returns results in performance that does not correspond to those of investing in the index with external leverage. For example, a fund attempting to achieve negative 2 times the returns of a given index on a daily basis is unlikely to deliver anything like negative 2 times the index’s returns over periods longer than one day. Many of these funds seek to generate a multiple typically negative 1 to negative 3 times the daily or weekly return of the reference index.
© 2015 PIEtech, Inc. All Rights Reserved. Instructions for Creating Your Own Asset Classes Page 30

Category MGP Class Mapping Description
Trading-Leveraged Commodities
These funds seek to generate returns equal to a fixed multiple of short-term returns of a commodity index. The compounding of short-term returns results in performance that does not correspond to those of investing in the index with external leverage. For example, a fund attempting to achieve 2 times the returns of a given index on a daily basis is unlikely to deliver anything like 2 times the index’s returns over periods longer than one day. Many of these funds seek to generate a multiple of the daily or weekly return of the reference index.
Trading-Leveraged Debt
These funds seek to generate returns equal to a fixed multiple of the short-term returns of a fixed-income index. The compounding of short-term returns results in performance that does not correspond to those of investing in the index with external leverage. For example, a fund attempting to achieve 2 times the returns of a given index on a daily basis is unlikely to deliver anything like 2 times the index’s returns over periods longer than one day. Many of these funds seek to generate a multiple of the daily or weekly return of the reference index.
Trading-Leveraged Equity
These funds seek to generate returns equal to a fixed multiple of the short-term returns of an equity index. The compounding of short-term returns results in performance that does not correspond to those of investing in the index with external leverage. For example, a fund attempting to achieve 2 times the returns of a given index on a daily basis is unlikely to deliver anything like 2 times the index’s returns over periods longer than one day. Many of these funds seek to generate a multiple of the daily or weekly return of the reference index.
Trading-Miscellaneous
These funds seek to generate returns equal to a fixed multiple (positive or negative) of shortterm returns of an index. The reference index for this category is not equity, fixed-income, or commodity linked. The compounding of short-term returns results in performance that does not correspond to those of investing in the index with external leverage. For example, a fund attempting to achieve 2 times the returns of a given index on a daily basis is unlikely to deliver anything like 2 times the index’s returns over periods longer than one day.
Ultrashort Bond
These funds invest primarily in investment-grade U.S. fixed-income issues and have an average duration of less than one year or (if duration is unavailable) an average effective maturity of less than one year. This category can include general corporate and government bond funds, and it excludes international, convertible, multi-sector, and high yield bond funds.
© 2015 PIEtech, Inc. All Rights Reserved. Instructions for Creating Your Own Asset Classes Page 31

Category MGP Class Mapping Description
Volatility
Volatility strategies trade volatility as an asset class. Directional volatility strategies aim to profit from the trend in the implied volatility embedded in derivatives referencing other asset classes. Volatility arbitrage seeks to profit from the implied volatility discrepancies between related securities.
World Allocation
These funds primarily invest outside of the United States and invest in both stocks and bonds. These funds typically have at least 10% of assets in bonds, less than 70% of assets in stocks, and at least 40% of assets in non-U.S. stocks or bonds.
World Bond These funds seek income by investing in fixed-income securities all over the world. Some funds invest exclusively outside the U.S., while others regularly invest in both U.S. and non-U.S. bonds.
World Stock These funds seek capital appreciation by investing in equities worldwide. These funds typically have 20%-60% of assets in U.S. stocks.
© 2015 PIEtech, Inc. All Rights Reserved. Instructions for Creating Your Own Asset Classes Page 32

Available Indices in MoneyGuidePro
Group Index Name Year Description
Cash Citigroup 3-month Treasury Bill 1979 Citigroup 3-month Treasury Bill (1979-2014)
Cash Citigroup 3-month Treasury Bill PLUS 1970 Ibbotson U.S. Treasury Bills (1970-1978)
Citigroup 3-month Treasury Bill (1979-2014)
Cash Ibbotson U.S. Treasury Bills 1926 Ibbotson U.S. Treasury Bills - Total Return (1926-2014)
Cash Tax-Free Money Market Average 1982 Tax-Free Money Market Average (1982-2014)
Cash Tax-Free Money Market Average PLUS 1970
U.S. 30-Day Treasury Bill adjusted by Donoghue TF discount (1970-1981) Tax-Free Money Market Average (1982-2014)
Cash U.S. 30-day Treasury Bills 1926 U.S. 30-day Treasury Bills (1926-2014)
Bond Barclays Capital 1 - 3 Year Govt Bonds PLUS 1970
50% Ibbotson U.S. Treasury Bills and 50% Ibbotson Intermediate-Term Government Bonds (1970-1975) Barclays Capital 1 - 3 Year Govt Bonds (1976-2014)
Bond Barclays Capital 10-year Muni Bonds 1980 Barclays Capital 10-year Muni Bonds (1980-
2014)
Bond Barclays Capital 10-year Muni Bonds PLUS 1970
Ibbotson Long-Term Government Bonds - Total Return adjusted by Barclays Capital 10-year Muni discount (1970-1979) Barclays Capital 10-year Muni Bonds (1980-2014)
Bond Barclays Capital 1-3 Yr Government Bonds 1976 Barclays Capital 1-3 Yr Government Bonds
Bond Barclays Capital 3-year Muni Bonds 1991 Barclays Capital 3-year Muni Bonds (1991-2014)
Bond Barclays Capital 3-year Muni Bonds PLUS 1970
50% Ibbotson U.S. T-Bill and 50% Ibbotson Intermediate-Term Government Bonds adjusted by Barclays Capital 3-year Muni discount (1970-1990) Barclays Capital 3-year Muni Bonds (1991-2014)
Bond Barclays Capital 5-year Muni Bonds 1980 Barclays Capital 5-year Muni Bonds (1980-2014)
Bond Barclays Capital 5-year Muni Bonds PLUS 1970
Ibbotson Intermediate-Term Government Bonds - Total Return adjusted by Barclays Capital 5-year Muni discount (1970 -1979) Barclays Capital 5-year Muni Bonds (1980-2014)
© 2015 PIEtech, Inc. All Rights Reserved. Instructions for Creating Your Own Asset Classes Page 33

Bond Barclays Capital 7-year Muni Bonds 1991 Barclays Capital 7-year Muni Bonds (1991-2014)
Bond Barclays Capital 7-year Muni Bonds PLUS 1970
Ibbotson Intermediate-Term Government Bonds - Total Return adjusted by Barclays Capital 7-year Muni discount (1970 -1990) Barclays Capital 7-year Muni Bonds (1991-2014)
Bond Barclays Capital High Yield Composite Bonds PLUS - Long
1970
Ibbotson Long-Term Government Bonds - Total Return (1970-1983) Barclays Capital High Yield Composite Bonds (1984-2014)
Bond Barclays Capital Intermediate Govt 1973 Barclays Capital Intermediate Government
Bonds (1973-2014)
Bond Barclays Capital Intermediate Govt PLUS 1970
Ibbotson Intermediate-Term Government Bonds - Total Return (1970-1972) Barclays Capital Intermediate Government Bonds (1973-2014)
Bond Barclays Capital Intermediate Govt/Credit Index 1973 Barclays Capital Intermediate Govt/Credit Index
(1973-2014)
Bond Barclays Capital Intermediate Govt/Credit Index PLUS 1970
Ibbotson Intermediate-Term Government Bonds - Total Return (1970-1972) Barclays Capital Intermediate Govt/Credit Index (1973-2014)
Bond Barclays Capital Long Govt Bonds 1926 Barclays Capital Long Government Bonds (1926-
2014)
Bond Barclays Capital Long Muni Bonds 1981 Barclays Capital Long Muni Bonds (1981-2014)
Bond Barclays Capital Long Muni Bonds PLUS 1970
Ibbotson Long-Term Government Bonds - Total Return adjusted by Barclays Capital Long Muni Bonds discount (1970-1980) Barclays Capital Long Muni Bonds (1981-2014)
Bond Barclays Capital Long Term Credit Bond 1973 Barclays Capital Long Term Credit Bonds (1973-
2014)
Bond Barclays Capital Long Term Credit Bond Index PLUS 1970
Ibbotson Long-Term Corporate Bonds - Total Return (1970-1972) Barclays Capital Long Term Credit Bonds (1973-2014)
Bond Barclays Capital Long Term Govt/Credit Index 1973 Barclays Capital Long Term Gvt/Credit Index
(1973-2014)
Bond Barclays Capital Mortgage Bonds 1976 Barclays Capital Mortgage Bonds (1976-2014)
Bond Barclays Capital Municipal Bonds 1959 Barclays Capital Municipal Bonds (1959-2014)
© 2015 PIEtech, Inc. All Rights Reserved. Instructions for Creating Your Own Asset Classes Page 34

Bond Barclays Capital Municipal Bonds PLUS 1926
Ibbotson Long-Term Government Bonds - Total Return adjusted by Barclays Capital Muni Bonds discount (1926-1958) Barclays Capital Muni Bonds (1959-2014)
Bond Barclays Capital U.S. Aggregate Bond 1976 Barclays Capital U.S. Aggregate Bond (1976-
2014)
Bond Barclays Capital U.S. Aggregate Bond PLUS 1970
Ibbotson Intermediate-Term Government Bonds - Total Return (1970-1975) Barclays Capital U.S. Aggregate Bond (1976-2014)
Bond Barclays Capital U.S. Corporate High Yield Index 1984 Barclays Capital U.S. Corporate High Yield Index
(1984-2014)
Bond Barclays Capital U.S. Corporate High Yield Index PLUS
1970
Ibbotson Intermediate-Term Government Bonds - Total Return (1970-1983) Barclays Capital U.S. Corporate High Yield Index (1984-2014)
Bond Barclays Capital US TIPs Index PLUS 1970 CPI-U (1970-1996)
Barclays Capital US TIPs (1997-2014)
Bond Barclays Credit Index 1973 Barclays Credit Index (1973-2014)
Bond BofA Merrill Global Government Bond Index 1987 BofA Merrill Global Government Bond Index
(1987-2014)
Bond BofA Merrill Global Government Bond Index PLUS
1970
Ibbotson Intermediate-Term Government Bonds - Total Return (1970-1986) BofA Merrill Global Government Bond Index (1987-2014)
Bond BofA Merrill Lynch 1 - 3 Year Govt Bonds 1979 BofA Merril Lynch 1-3 Year Govt Bonds (1979-
2014)
Bond BofA Merrill Lynch 1 - 3 Year Govt Bonds PLUS 1970
50% Ibbotson U.S. Treasury Bills and 50% Ibbotson Intermediate-Term Government Bonds (1970-1978) BofA Merrill Lynch 1-3 Year Govt Bonds (1979-2014)
Bond BofA Merrill Lynch High Yield Master II 1986 BofA Merrill Lynch High Yield Master II (1986-
2014)
Bond BofA Merrill Lynch U.S. High Yield Cash Pay 1985 BofA Merrill Lynch U.S. High Yield Cash Pay
(1985-2014)
Bond BofA Merrill Lynch U.S. High Yield Cash Pay PLUS 1970
Ibbotson Intermediate-Term Government Bonds - Total Return (1970-1984) BofA Merrill Lynch U.S. High Yield Cash Pay (1985-2014)
Bond Citigroup Corporate - BBB Bonds 1981 Citigroup Corporate - BBB Bonds (1981-2014)
© 2015 PIEtech, Inc. All Rights Reserved. Instructions for Creating Your Own Asset Classes Page 35

Bond Citigroup Corporate - BBB Bonds PLUS 1970
Ibbotson Intermediate-Term Government Bonds - Total Return (1970-1980) Citigroup Corporate - BBB Bonds (1981-2014)
Bond Citigroup Corporate Bonds Composite 1926 Citigroup Corporate Bonds Composite (1926-
2014)
Bond Citigroup Mortgage 1972 Citigroup Mortgage (1972-2014)
Bond Citigroup Non-US World Govt Bonds - US$ PLUS 1970
Ibbotson Intermediate-Term Government Bonds - Total Return (1970-1984) Citigroup Non-US World Govt Bonds - US$ (1985-2014)
Bond Citigroup World Government Bond - Non-US$ 1985 Citigroup World Government Bond - Non-US$
(1985-2014)
Bond Citigroup World Government Bond - US$ 1978 Citigroup World Government Bond - US$ (1978-
2014)
Bond Citigroup World Government Bond - US$ PLUS 1970
Ibbotson Intermediate-Term Government Bonds - Total Return (1970-1977) Citigroup World Government Bond - US$ (1978-2014)
Bond Ibbotson Intermediate-Term Govt Bonds 1926 Ibbotson Intermediate-Term Government Bonds
- Total Return (1926-2014)
Bond Ibbotson Long-Term Corp Bonds 1926 Ibbotson Long-Term Corporate Bonds - Total
Return (1926-2014)
Bond Ibbotson Long-Term Govt Bonds 1926 Ibbotson Long-Term Government Bonds - Total
Return (1926-2014)
Bond Prime Rate Index 1950 Prime Rate Index (1950-2014)
Stock Barclays Capital Intermediate Aggregate Bond 1970
Ibbotson Intermediate Govt Bond (1970-1975) Barclays Capital Intermediate Aggregate Bond (1976-2014)
Stock Barclays Currency Traders 1991 Barclays Currency Traders (1991-2014)
Stock DJ UBS Commodity 1991 DJ UBS Commodity (1991-2014)
Stock DJ Wilshire Micro-Cap 1992 DJ Wilshire Micro-Cap (1992-2014)
Stock FTSE NAREIT REIT (All) 1973 FTSE NAREIT REIT - All (Price and Income) (1973-2014)
Stock FTSE NAREIT REIT (Equity) 1972 FTSE NAREIT REIT - Equity (Price and Income) (1972-2014)
Stock FTSE NAREIT REIT (Mortgage) 1972 FTSE NAREIT REIT - Mortgage (Price and
Income) (1972-2014)
Stock Ibbotson Large Company Stocks 1926 Ibbotson Large Company Stocks - Total Return
(1926-2014)
Stock Ibbotson Small Company Stocks 1926 Ibbotson Small Company Stocks - Total Return
(1926-2014)
© 2015 PIEtech, Inc. All Rights Reserved. Instructions for Creating Your Own Asset Classes Page 36

Stock MSCI EAFE 1970 MSCI EAFE Equity (1970-2014)
Stock MSCI EAFE (Net) Index 1970 MSCI EAFE (Net) Index (1970-2014)
Stock MSCI EM (Emerging Markets) 1976 IFC Global Emerging Markets Index (1976-1987) MSCI EM (Emerging Markets) (1988-2014)
Stock MSCI EM (Emerging Markets) PLUS 1970
MSCI EAFE Equity (1970-1975) IFC Global Emerging Markets Index (1976-1987) MSCI EM (Emerging Markets) (1988-2014)
Stock MSCI EM Latin America Index PLUS 1970
MSCI EAFE Index (1970-1975) MSCI Emerging Markets Latin America (1976 - 2014)
Stock MSCI Emerging Markets (Net) PLUS 1970
MSCI EAFE (Net) Index (1970-1975) IFC Global Emerging Markets Index (1976-1987) MSCI EM (Emerging Markets) (1976-1998) MSCI Emerging Markets (Net) (1999-2014)
Stock MSCI Europe Index 1970 MSCI Europe Index (1970-2014)
Stock MSCI Europe Value Index PLUS 1970 MSCI EAFE Index (1970-1974)
MSCI Europe Value Index (1975 - 2014)
Stock MSCI Far East Index 1970 MSCI Far East Index (1970-2014)
Stock MSCI Japan Index 1970 MSCI Japan Index (1970-2014)
Stock MSCI Pacific Index 1970 MSCI Pacific Index (1970-2014)
Stock MSCI United Kingdom Index 1970 MSCI United Kingdom Index (1970-2014)
Stock MSCI United States Index 1970 MSCI United States Index (1970-2014)
Stock MSCI World Index 1970 MSCI World Index (1970-2014)
Stock MSCIAC Asia ex Japan 1988 DJ Wilshire Micro-Cap (1988-2014)
Stock Russell 1000 1979 Russell 1000 (1979-2014)
Stock Russell 1000 Growth 1979 Russell 1000 Growth (1979-2014)
Stock Russell 1000 Growth PLUS 1970 S&P 500 Composite Total Return (1970-1978) Russell 1000 Growth (1979-2014)
Stock Russell 1000 PLUS 1970 S&P 500 Composite Total Return (1970-1978) Russell 1000 (1979-2014)
Stock Russell 1000 Value 1979 Russell 1000 Value (1979-2014)
Stock Russell 1000 Value PLUS 1970 S&P 500 Composite Total Return (1970-1978) Russell 1000 Value (1979-2014)
Stock Russell 2000 Growth 1979 Russell 2000 Growth (1979-2014)
Stock Russell 2000 Growth PLUS 1970 DFA Small Cap (1970-1978) Russell 2000 Growth (1979-2014)
Stock Russell 2000 PLUS 1970 DFA Small Cap (1970-1978) Russell 2000 (1979-2014)
Stock Russell 2000 Value 1979 Russell 2000 Value (1979-2014)
Stock Russell 2000 Value PLUS 1970 DFA Small Cap (1970-1978) Russell 2000 Value (1979-2014)
© 2015 PIEtech, Inc. All Rights Reserved. Instructions for Creating Your Own Asset Classes Page 37

Stock Russell 2500 1979 Russell 2500 (1979-2014)
Stock Russell 3000 1979 Russell 3000 (1979-2014)
Stock Russell 3000 Growth 1980 Russell 3000 Growth (1980-2014)
Stock Russell 3000 Growth Plus 1970 S&P 500 Composite Total Return (1970-1979) Russell 3000 Growth (1980-2014)
Stock Russell 3000 Plus 1970 S&P 500 Composite Total Return (1970-1978) Russell 3000 (1979-2014)
Stock Russell 3000 Value 1980 Russell 3000 Value (1980-2014)
Stock Russell 3000 Value Plus 1970 S&P 500 Composite Total Return (1970-1979) Russell 3000 Value (1980-2014)
Stock Russell Midcap 1980 Russell Midcap (1980-2014)
Stock Russell Midcap Growth 1987 Russell Midcap Growth (1987-2014)
Stock Russell Midcap Growth PLUS 1970 S&P 500 Composite Total Return (1970-1979) Russell Midcap (1980-1986) Russell Midcap Growth (1987-2014)
Stock Russell Midcap PLUS 1970 S&P 500 Composite Total Return (1970-1979) Russell Midcap (1980-2014)
Stock Russell Midcap Value 1987 Russell Midcap Value (1987-2014)
Stock Russell Midcap Value PLUS 1970 S&P 500 Composite Total Return (1970-1979) Russell Midcap (1980-1986) Russell Midcap Value (1987-2014)
Stock S&P 400 Midcap / Citigroup Growth PLUS 1970
S&P 500 Composite Total Return (1970-1980) S&P 400 Midcap Total Return (1981-1994) S&P 400 Midcap / Citigroup Growth (1995-2014)
Stock S&P 400 Midcap / Citigroup Value PLUS 1970
S&P 500 Composite Total Return (1970-1980) S&P 400 Midcap Total Return (1981-1994) S&P 400 Midcap / Citigroup Value (1995-2014)
Stock S&P 400 Midcap Total Return 1982 S&P 400 Midcap Total Return (1982-2014)
Stock S&P 400 Midcap Total Return PLUS 1970 S&P 500 Composite Total Return (1970-1981)
S&P 400 Midcap Total Return (1982-2014)
Stock S&P 500 Composite Total Return 1951 S&P 500 Composite Total Return (1951-2014)
Stock S&P 500 Growth Total Return 1995 S&P 500 Growth Total Return (1995-2014)
Stock S&P 500 Growth Total Return PLUS 1970 S&P 500 Composite Total Return (1970-1994)
S&P 500 Growth Total Return (1995-2014)
Stock S&P 500 Value Total Return 1995 S&P 500 Value Total Return (1995-2014)
Stock S&P 500 Value Total Return PLUS 1970 S&P 500 Composite Total Return (1970-1994)
S&P 500 Value Total Return(1995-2014)
Stock S&P Midcap 400 Growth Total Return 1995 S&P Midcap 400 Growth Total Return (1995-
2014)
© 2015 PIEtech, Inc. All Rights Reserved. Instructions for Creating Your Own Asset Classes Page 38

Stock S&P Midcap 400 Value Total Return 1995 S&P Midcap 400 Value Total Return (1995-2014)
Alternative Alerian MLP Total Return 1996 The Alerian MLP Index (1996-2014) is a composite of the 50 most prominent energy Master Limited Partnerships (MLPs)
Alternative Barclays CTA Index 1980 Barclays CTA Index (1980-2014)
Alternative Dow Jones Conservative Relative Risk Index 1970
50% Ibbotson U.S. Treasury Bills 30% Ibbotson Intermediate-Term Government Bonds - Total Return 20% S&P 500 Composite Total Return (1970 - 1982) Dow Jones Conservative Relative Risk Index (1982-2014)
Alternative Dow Jones US Select REIT Index 1978 Dow Jones United States Select Real Estate
Investment Trusts (REITS)(1978-2014)
Alternative Dow Jones Wilshire REIT (Full Cap) 1978 Dow Jones Wilshire REIT (Full Cap) (1978-2014)
Alternative Dow Jones Wilshire REIT (Full Cap) Plus 1970
Dow Jones Wilshire REIT Mean Return (1970-1977) Dow Jones Wilshire REIT (Full Cap) (1978-2014)
Alternative HFRI Composite Fund of Funds PLUS 1980
Blend Ibbotson Intermediate Bonds and S&P 500 Composite Total Return (1980 - 1982) Dow Jones Conservative Relative Risk Index (1982-1989) HFRI Composite Fund of Funds (1990-2014)
Alternative HFRI Equity Hedge (Total) 1990 Long and short positions in primarily equity and equity derivative securities (1990-2014)
Alternative HFRI Fund of Funds Diversified 1990
FOFs exhibit characteristics of Emerging Markets, Sector specific, and Equity Hedge; typically a greater dispersion of returns and higher volatility compared to the HFRI Fund of Funds Composite Index (1990-2014)
Alternative Lipper Balanced Funds IX 1970 Lipper Balanced Funds IX (1970-2014)
Alternative S&P GSCI (Commodity) Index 1970 S&P GSCI (Commodity) Index (1970-2014)
Alternative Thomson US Precious Metals 1956 Thomson US Precious Metals (1956-2014)
© 2015 PIEtech, Inc. All Rights Reserved. Instructions for Creating Your Own Asset Classes Page 39