chapter iii preprocessing &...
TRANSCRIPT
CAD SYSTEM FOR AUTOMATIC DETECTION OF BRAIN TUMOR THROUGH MRI
PREPROCESSING &ENHANCEMENT
52
CHAPTER III
PREPROCESSING &
ENHANCEMENT

CAD SYSTEM FOR AUTOMATIC DETECTION OF BRAIN TUMOR THROUGH MRI
PREPROCESSING &ENHANCEMENT
53
CHAPTER 3
PREPROCESSING AND ENHANCEMENT
3.1 PREFACE
Image processing and enhancement stage is the simplest categories of medical
image processing. This stage is used for reducing image noise, highlighting edges, or
displaying digital images. Some more techniques can employ medical image processing of
coherent echo signals prior to image generation. The enhancement stage includes resolution
enhancement and contrast enhancement. These are used to suppress noise and imaging of
spectral parameters. After this stage the medical image is converted into standard image
without noise, film artifacts and labels.
Image enhancement methods inquire about how to improve the visual appearance of
images from Magnetic Resonance Image (MRI), Computer Tomography (CT) scan; Positron
Emission Tomography (PET) and the contrast enhancing brain volumes are linearly aligned.
The enhancement activities are removal of film artifacts and labels, filtering the images.
This part is use to enhances the smoothness towards piecewise-homogeneous region and
reduces the edge-blurring effect. Conventional Enhancement techniques such as Low pass
filter, Median filter, Gabor Filter, Gaussian Filter and Prewitt edge-finding
filter[29,43,72,87].
CAD SYSTEM FOR AUTOMATIC DETECTION OF BRAIN TUMOR THROUGH MRI
PREPROCESSING &ENHANCEMENT
54
3.2 RELATED WORK
The Preprocessing aspects are surveyed and analyzed in this section. The
Preprocessing techniques such as Content Based model, Fiber tracking Method, Wavelets ,
Wavelet Packets, and Fourier transform technique [Jeyaram et al, Peter et al, Azadeh et al,
Karen et al,] [60,61,99,100,10,11,66 ].
Olivier et al. designed a new Standard Imaging Protocol for brain tumor
radiotherapy. MRI has been acquired in the standard follow up after surgical resection [94].
Dana et al presented statistical parametric mapping implementation and pipeline approach
for registration and resampling stages. The pipeline consists of noise reduction and inter-
slice intensity variation correction [28,68]. Elizabeth et al explained Pixel Histograms and
Morphological process for acquiring brain image from MRI. It was more robust to noise [12,
41, 81, 82, 88, 91]. Leung et al described Boundary Detection Algorithm, Generalized Fuzzy
Operator (GFO), Contour Deformable Model, and Region base technique for image
processing applied in radiology for 3D reconstruction [76]. Patrick et al developed a new
Boundary Model and Non linear matching scheme to estimate the location of the boundary
points using intensity data with standardized data [98,120]. Azadeh et al designed a method
on Wavelets & Wavelet Packets for noise reduction and correcting baseline [10, 11].
Paulo proposed a method of Fiber tracking to process MR-DT1 datasets. Karen et al
represented a Fourier transform technique for MRI preprocessing [66]. Lorenzen et al
designed a Geometric prior image registration [99,100]. Xin et al. presented Unseeded
Region Growing (URG) Algorithm use to convert the MRI image into standard Format

CAD SYSTEM FOR AUTOMATIC DETECTION OF BRAIN TUMOR THROUGH MRI
PREPROCESSING &ENHANCEMENT
55
[132]. Zu et al, analyzed a new method on Sub-second imaging technique and histogram
based technique Separate brain image from head image removal of residual fragments
[108,142]. Xiao et al described an automated method on Statistical Structure Analysis
method for analyzing the images from MRI [129]. Brian et al, designed Principal
Component for to minimize the artifacts present in the PET data set [17].Mark et al,
described a new method on Statistical Parametric Mapping for spatial registration and
resampling stages used the T1 single subject template and used existing implementation for
the intensity normalization stages [28,84].Shishir et al, presented a histogram method for
improving the quality of MR brain images [111].Toshiharu et al, said a Independent
Component Analysis (ICA) method for separate the components in MR images into
independent components (IC’s) [122].
Normalization Method [131,33,6,74,119][Xiangyang Wang ,Dimirits ,Ladan Amini ,
Thomas P Ryan] are employable for this work. Dimitris et al. presented a new method on
Gabor Filter applied to remove the tagging lines and enhance the tag-patterned regions in the
image. Tag Patterns in the blood are flushed out very soon [33]. Karnan et al. designed a
new CAD system for Image enhancement using median filter [83,118]. Tsai et al. studied
low pass filtered to take care of local noisy fluctuations, the bone and soft tissue outlines are
eliminated [123].
Boada et al represented that Triple Quantum Filter can be used to minimize the
effects of extra cellular Fluids on the Measurement of the intracellular sodium concentration
[16]. Marcel Prastawa presented Anisotropic Diffusion filter the registered images [12, 51].

CAD SYSTEM FOR AUTOMATIC DETECTION OF BRAIN TUMOR THROUGH MRI
PREPROCESSING &ENHANCEMENT
56
Ladan et al. studied Edge Finding filter for Reducing noise and prewitt filter for improving
the Image quality [74] Aria et al. described Gadolinium Enhanced tumor borders when
relation between Tumor cell extent and contrast-enhanced region is Unclear from MRI [9].
Amini et al. presented Prewitt edge-finding filter to enhance the image Edges robustly [6,
74]. Zhe et al. studied a new method for automatic detection of PET lesions using
Morphological Operations for removing Backgrounds from brain images [137]. Xiao et al
Designed Gabor Filter for filtering noise from MRI Brain tumor image and partition the
frequency space with equal angle of 30 degrees in angular direction [129]. Corina et al.
designed Gaussian filter is applied to the image to enhance its boundaries and Make the
image gradients stronger [27].Shishir et al described a nonlinear filter for removing noise
from Given MR brain images [11].
3.3 IMAGE ACQUISITION
Detection of brain tumor requires high-resolution brain MRI. Most Medical Imaging
Studies and detection conducted using MRI, Positron Emission Tomography (PET) and
Computer Tomography (CT) Scan. Now a day’s MRI systems are very important in medical
image analysis. MRI has a multidimensional nature of data provided from different
sequential pulses.
A MRI (Magnetic Resonance Imaging) scan is a radiology technique that uses
magnetism, radio waves, and a computer to produce images of body structures. The MRI
scanner is a tube surrounded by a giant circular magnet. The patient is placed on a moveable
bed that is inserted into the magnet. The magnet creates a strong magnetic field that aligns

CAD SYSTEM FOR AUTOMATIC DETECTION OF BRAIN TUMOR THROUGH MRI
PREPROCESSING &ENHANCEMENT
57
the protons of hydrogen atoms, which are then exposed to a beam of radio waves. This spins
the various protons of the body, and they produce a faint signal that is detected by the
receiver portion of the MRI scanner.
The receiver information is processed by a computer, and an image is produced. The
image and resolution produced by MRI is quite detailed and can detect tiny changes of
structures within the body. For some procedures, contrast agents, such as gadolinium are
used to increase the accuracy of the images. MR images result from the excitation of
hydrogen protons by Radio Frequency (RF) pulses.
The MRI machine generates very brief RF Pulses; these RF pulses excite hydrogen,
and elevate them to a higher energy state. As the protons return to a lower energy state, they
relies electromagnetic energy. This energy is picked up and amplified by the magnet’s
antennae and turned into visual display images. A MRI scan can be used as an extremely
accurate method of disease detection throughout the body. In the head, trauma to the brain
can be seen as bleeding or swelling. Other abnormalities often found include brain
aneurysms, stroke, tumors of the brain, as well as tumors or inflammation of the spine.Neuro
surgeons use a MRI scan not only in defining brain anatomy but in evaluating the integrity
of the spinal cord after trauma. It is also used when considering problems associated with
the vertebrae or inter vertebral discs of the spine.

CAD SYSTEM FOR AUTOMATIC DETECTION OF BRAIN TUMOR THROUGH MRI
PREPROCESSING &ENHANCEMENT
58
A MRI scan can evaluate the structure of the heart and aorta, where it can detect
aneurysms or tears. MRI scanners can produce 1500 images per second. Intra operative
Magnetic resonance imaging can acquire high contrast images of Soft tissue anatomy. MRI
is the modality of choice for evaluating brain morphology because it provides superior soft-
tissue contrast with flexible data acquisition protocols that highlight several different
properties of the tissue.
It provides valuable information on glands and organs within the abdomen, and
accurate information about the structure of the joints, soft tissues, and bones of the body.
Often, surgery can be deferred or more accurately directed after knowing the results of a
MRI scan.
MRI scanning uses magnetism, radio waves, and a computer to produce images of
body structures. MRI scanning is painless and does not involve x-ray radiation. Patients with
heart pacemakers, metal implants, or metal chips or clips in or around the eyes cannot be
scanned with MRI because of the effect of the magnet. Claustrophobic sensation can occur
with MRI scanning.
Images of a patient obtained by CT, MRI and SPECT, PET scanning are displayed as
an array of pixels (a two dimensional unit based on the matrix size and the field of view) and
stored in memory.In Matlab, there are several formats of image encoding, in this research
the MR image default size is 256 x 256.

CA
D S
YS
TE
M F
OR
AU
TO
MA
TIC
DE
TE
CT
IO
N O
F B
RA
IN
TU
MO
R T
HR
OU
GH
MR
I
PR
EP
RO
CE
SS
IN
G &
EN
HA
NC
EM
EN
T
59
Fig
ure
3.1
Im
age
dis
pla
y i
n M
at
lab

CAD SYSTEM FOR AUTOMATIC DETECTION OF BRAIN TUMOR THROUGH MRI
PREPROCESSING &ENHANCEMENT
60
The above appearing MR Brain image consists following attributes
Table 3.1 Image Attributes
Attribute Name Description
Filename 'brain.jpg'
File Mod Date '21-Apr-2010 10:48:38'
File Size 21057
Format 'jpg'
Width 256
Height 256
Bit Depth 8
ColourType 'grayscale'
Number of Samples 1
Coding Method 'Huffman'
Coding Process 'Sequential'
Comment {}

CAD SYSTEM FOR AUTOMATIC DETECTION OF BRAIN TUMOR THROUGH MRI
PREPROCESSING &ENHANCEMENT
61
3.4. GRAYSCALE OR INTENSITY MRI IMAGES
A grayscale image can be specified by giving a large matrix whose entries are
numbers between 0 and 255, with 0 to black, and 255 to white.
.
Figure 3.2 MRI image
To Access the real medical images like MRI, PET (Positron Emission Tomography)
or CT (Computer Tomography) scan and to take up a research is a very complex because of
privacy issues and heavy technical hurdles. The purpose of this research is to compare
Automatic Brain Tumor Detection methods through MRI Brain Images. MRI Images are
transformed to a Linux Network through LAN (Local Area Network) Kovai Medical Center
Hospital (KMCH), Coimbatore, India. All images had 1 mm slice thickness with 1×1 mm in
plane resolution.
The development of intra-operative imaging systems has contributed to the
improvement of the course of intracranial neurosurgical procedures. Among these systems,
the 0.5T intra-operative Magnetic Resonance Scanner of the Kovai Medical Center and

CAD SYSTEM FOR AUTOMATIC DETECTION OF BRAIN TUMOR THROUGH MRI
PREPROCESSING &ENHANCEMENT
62
Hospital (KMCH ) offer the possibility to acquire 256*256*58(0.86mm, 0.86mm, 2.5 mm)
T1 weighted images with the fast spin echo protocol (TR=400, TE=16 ms, FOV=220*220
mm) in 3 minutes and 40 seconds. The quality of every 256*256 slice acquired intra-
operatively is fairly similar to images acquired with a 1.5T Conventional Scanner, but the
major drawback of intra-operative image is that slice remains thick (2.5 mm).
3.4.1 LOAD IMAGE TO MATLAB
Read image file from the mammogram folder using matlab default function
Uigetfile, this function displays a dialog box used to retrieve one or more files. The dialog
box lists the files and directories in the current directory. Uigetfile returns the name and path
of the file selected in the dialog box. After the user clicks the Done button, FileName
contains the name of the file selected and PathName contains the name of the path selected.
If the user clicks the Cancel button or closes the dialog window, FileName and PathName
are set to 0, successful return occurs only if all the selected files exist. If the user selects a
file that does not exist, an error message is displayed and control returns to the dialog box.
Example
[filename, pathname] =
uigetfile({'*.tif';'*.jpeg';'*.png';'*.jpg';'*.tiff';'*.*'},'Open File');
3.4.2 CONVERT IMAGE TO DIGITAL MATRIX
Loaded image convert digital matrix with use of matlab library function imread.
This function convert image to digital matrix. Imread (filename,fmt) reads a grayscale or
colour image from the file specified by the string filename, where the string fmt specifies the
format of the file. If the file is not in the current directory or in a directory in the MATLAB

CAD SYSTEM FOR AUTOMATIC DETECTION OF BRAIN TUMOR THROUGH MRI
PREPROCESSING &ENHANCEMENT
63
path, specify the full pathname of the location on your system. For a list of all the possible
values for fmt. If imread cannot find a file named filename, it looks for a file named
filename.fmt. imread returns the image data in the array A. If the file contains a grayscale
image, A is a two-dimensional (M-by-N) array. If the file contains a colour image, A is a
three-dimensional (M-by-N-by-3) array. The class of the returned array depends on the data
type used by the file format. For most file formats, the colour image data returned uses the
RGB colour space. For TIFF files, however, imread can return colour data that uses the
RGB, CIELAB, ICCLAB, or CMYK colour spaces. If the colour image uses the CMYK
colour space, A is an M-by-N-by-4 array.
Example:
[filename,pathname]= uigetfile({'*.pgm';'*.tif';'*.jpeg';'*.png';'*.jpg';'*.tiff';'*.*'},'Open
File');
f=filename;
j=imread(f);
Image converted to digital matrix , image size reduced for displaying the image in the
system using imresize function , imresize(A,m,method) returns an image that is m times the
size of A using the interpolation method specified by method. Method is a string that can
have one of these values. The default value is enclosed in braces ({}).Value Description
{'nearest'} Nearest-neighbour interpolation 'bilinear' Bilinear interpolation 'bicubic' Bicubic
interpolation
Example
I = imresize (i,[255 255],'nearest');

CAD SYSTEM FOR AUTOMATIC DETECTION OF BRAIN TUMOR THROUGH MRI
PREPROCESSING &ENHANCEMENT
64
3.4.3 DISPLAYING IMAGE
Resized image displayed in matlab system to shows the image in imtool box by use
of imshow function. imshow (I,[low high]) displays the grayscale image I, specifying the
display range for I in [low high]. The value low (and any value less than low) displays as
black; the value high (and any value greater than high) displays as white. Values in between
are displayed as intermediate shades of gray, using the default number of gray levels. If you
use an empty matrix ([]) for [low high], imshow uses [min(I(:)) max(I(:))]; that is, the
minimum value in I is displayed as black, and the maximum value is displayed as white.
imshow is the toolbox's fundamental image display function, optimizing figure, axes, and
image object property settings for image display. imtool provides all the image display
capabilities of imshow but also provides access to several other tools for navigating and
exploring images, such as the Pixel Region tool, Image Information tool, and the Adjust
Contrast tool. imtool presents an integrated environment for displaying images and
performing some common image processing tasks.

CA
D S
YS
TE
M F
OR
AU
TO
MA
TIC
DE
TE
CT
IO
N O
F B
RA
IN
TU
MO
R T
HR
OU
GH
MR
I
PR
EP
RO
CE
SS
IN
G &
EN
HA
NC
EM
EN
T
65
M/N
1
2
3
4
. .
. 253
254
255
1
2
2
2
2
. .
. 2
2
2
2
3
3
2
2
.
2
1
1
3
3
3
3
3
. .
. 2
2
2
4
2
2
4
4
. .
. 3
3
3
. .
. .
. .
. .
. .
. .
. .
. .
. .
. .
.
. .
. .
. .
. .
. .
.
2
0
7
0
. .
. 5
6
255
253
6
2
0
7
. .
. 6
0
250
254
2
0
6
7
. .
. 13
3
255
255
0
5
1
1
.
. 2
8
254
Fig
ure
3.3
In
ten
sity
valu
e (D
igit
al
Matr
ix)
of
the
MR
I im
age.

CAD SYSTEM FOR AUTOMATIC DETECTION OF BRAIN TUMOR THROUGH MRI
PREPROCESSING &ENHANCEMENT
3.5 PRE-PROCESSING
Preprocessing indicates that the same tissue type may have a different scale of signal
intensities for different images. Preprocessing functions involve those operations that are
normally required prior to the main data analysis and extraction of information and are generally
grouped as radiometric or geometric corrections. Radiometric corrections include correcting the
data for sensor irregularities and unwanted sensor or atmospheric noise, removal of non-brain
voxels and converting the data so they accurately represent the reflected or emitted radiation to
find out a transformation between two images precisely.The preprocessed images will have some
noise which should be removed for the further processing of the image. Image noise is most
apparent in image regions with low signal level such as shadow regions or under exposed
images. There are so many types of noise like salt – and – pepper noise, film grains etc., All
these noise are removed by using algorithms. Among the several filters, median filter is used.
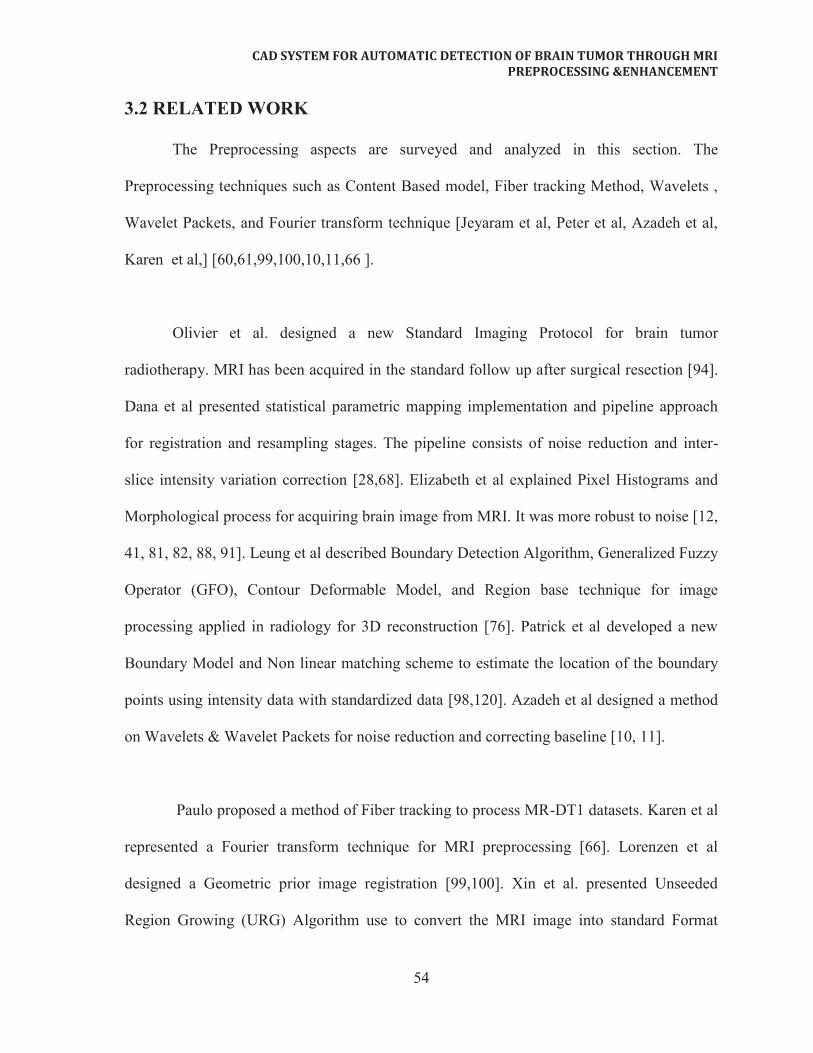
3.5.1 REMOVAL OF UNWANTED PARTS FROM THE BRAIN MR IMAGE
In preprocessing module image acquired will be processed for correct output. Medical
images surely will have some Film Artifacts like labels, marks and unwanted or critical parts
which are detected and removed for better result. Pre-processing was done by using some
algorithm. For all images the pre-processing should be done so that the result can be obtained in
the better way. To find out the transformation between two images precisely they should be
preprocessed to improve their quality and accuracy of result. If these images are too noisy or
blurred, they should be filtered and sharpened.

CA
D S
YS
TE
M F
OR
AU
TO
MA
TIC
DE
TE
CT
IO
N O
F B
RA
IN
TU
MO
R T
HR
OU
GH
MR
I
PR
EP
RO
CE
SS
IN
G &
EN
HA
NC
EM
EN
T
Fig
ure
3.4
(a)
Fil
m a
rti
fact
s w
ith
MR
I Im
ag
e

CA
D S
YS
TE
M F
OR
AU
TO
MA
TIC
DE
TE
CT
IO
N O
F B
RA
IN
TU
MO
R T
HR
OU
GH
MR
I
PR
EP
RO
CE
SS
IN
G &
EN
HA
NC
EM
EN
T
Fig
ure
3.4
(b
) A
fter
rem
oval
of
film
-arti
fact
s an
d l
ab
els.
CA
D S
YS
TE
M F
OR
AU
TO
MA
TIC
DE
TE
CT
IO
N O
F B
RA
IN
TU
MO
R T
HR
OU
GH
MR
I
PR
EP
RO
CE
SS
IN
G &
EN
HA
NC
EM
EN
T
Fig
ure
3.5
(a)
Aft
er l
abel
rem
oved
inp
ut.
Fig
ure
3.5
(b
) L
eft
skull
rem
oved
outp
ut
Fig
ure
3.5
(c)
Rig
ht
sku
ll
rem
oved
outp
ut
Fig
ure
3.5
(d
) T
op
skull
rem
oved
outp
ut

CAD SYSTEM FOR AUTOMATIC DETECTION OF BRAIN TUMOR THROUGH MRI
PREPROCESSING &ENHANCEMENT
3.5.2 FINDING EDGE POSITION FOR REMOVING LABELS
Consider breast tissue have an intensity value 10, set maximum intensity value for
greater than 10 intensity value positions. All tissue and labels set 255 intensity. Next use of
tracking algorithm remove the labels and unwanted film artifacts. For removing the
unwanted portions of the image, Tracking Algorithm is used.
for x=1:m
flag=0;
for y=n:-1:1
if( (flag==0) && (i2(x,y)<=35))
flag=1;
else
i3(x,y)=i1(x,y);
end
if(flag==1)
i3(x,y)=0;
end
end
end
Figure 3.6 Tracking Algorithm

CAD SYSTEM FOR AUTOMATIC DETECTION OF BRAIN TUMOR THROUGH MRI
PREPROCESSING &ENHANCEMENT
3.6 IMAGE SMOOTHING
The aim of image smoothing is to diminish the effects of noise, spurious pixel
values, missing pixel values etc. There are many different techniques for image smoothing.
The neighbourhood averaging and edge-preserving smoothing are used in image smoothing.
NEIGHBOURHOOD AVERAGING
Each point in the smoothed image, F(x,y) is obtained from the average pixel value in
a neighbourhood of (x,y) in the input image. For example, if 3x3 neighbourhood around
each pixel use the mask. Each pixel value is multiplied by 1/9, summed, and then the result
placed in the output image. This mask is successively moved across the image until every
pixel has been covered. That is, the image is convolved with this smoothing mask also
known as a spatial filter or kernel. However, one usually expects the value of a pixel to be
more closely related to the values of pixels close to it than to those further away.
1/9 1/9 1/9
1/9 1/9 1/9
1/9 1/9 1/9
Fig 3.7 Neighbourhood Averaging

CAD SYSTEM FOR AUTOMATIC DETECTION OF BRAIN TUMOR THROUGH MRI
PREPROCESSING &ENHANCEMENT
Some common weighting functions include the rectangular weighting function above
which just takes the average over the window, a triangular weighting function, or a
Gaussian. In practice one doesn't notice much difference between different weighting
functions, although Gaussian smoothing is the most commonly used. Gaussian smoothing
has the attribute that the frequency components of the image are modified in a smooth
manner. Smoothing reduces or attenuates the higher frequencies in the image.
EDGE PRESERVING SMOOTHING
Neighbourhood averaging or Gaussian smoothing will tend to blur edges because the
high frequencies in the image are attenuated. An alternative approach is to use median
filtering. Here the grey level is the median of the pixel values in the neighbourhood pixel.
The median m of a set of values is such that half the values in the set are less than ‘m’ and
half are greater. For example suppose the pixel values in a 3x3 neighbourhood are (10, 20,
20, 15, 20, 20, 20, 25, 100). If the values are sorted (10, 15, 20, 20, |20|, 20, 20, 25, 100) ,
the median is 20. The outcome of median filtering is that pixels with outlying values are
forced to become more like their neighbour, but at the same time edges are preserved.
IMAGE SHARPENING
The main aim in image sharpening is to highlight fine detail in the image, or
to enhance detail that has been blurred (perhaps due to noise or other effects, such as
motion). With image sharpening, the high-frequency components are enhanced, this implies
a spatial filter shape that has a high positive component at the centre as shown in figure 3.8.

CA
D S
YS
TE
M F
OR
AU
TO
MA
TIC
DE
TE
CT
IO
N O
F B
RA
IN
TU
MO
R T
HR
OU
GH
MR
I
PR
EP
RO
CE
SS
IN
G &
EN
HA
NC
EM
EN
T
Fig
ure
3.8
Fre
qu
ency
dom
ain
fil
ters
(to
p)
an
d t
hei
r co
rres
pon
din
g s
pati
al
dom
ain
cou
nte
rpart
s

CAD SYSTEM FOR AUTOMATIC DETECTION OF BRAIN TUMOR THROUGH MRI
PREPROCESSING &ENHANCEMENT
A simple spatial filter that achieves image sharpening is given by
-1/9 -1/9 -1/9
-1/9 8/9 -1/9
-1/9 -1/9 -1/9
Figure 3.9 spatial filter using image sharpening
Since the sum of all the weights is zero the resulting signal will have a zero DC value
i.e. the average signal value or the coefficient of the zero frequency term in the Fourier
expansion. For display purposes, the value of an offset to keep the result in the 0….255
range.
HIGH BOOST FILTERING
High pass filtering is achieved from subtracting a low pass image from the original
image, i.e. High pass = Original - Low pass.
However, in many cases where a high pass image is required, and retain some of the
low frequency components to aid in the interpretation of the image. Thus, if multiplying the
original image by an amplification factor before subtracting the low pass image, the result is
high boost or high frequency emphasis filter. Thus,

CAD SYSTEM FOR AUTOMATIC DETECTION OF BRAIN TUMOR THROUGH MRI
PREPROCESSING &ENHANCEMENT
High boost = A. Original – Low pass
= (A- 1).(Original) + Original – Low pass
= (A-1).Original + High pass
Now, if A = 1 it is a simple high pass filter. When A > 1 part of the original image is
retained in the output.
A simple filter for high boost filtering is given by
-1/9 -1/9 -1/9
-1/9 /9 -1/9
-1/9 -1/9 -1/9
Figure 3.10 simple high pass filter
Where ω = 9A-1

CAD SYSTEM FOR AUTOMATIC DETECTION OF BRAIN TUMOR THROUGH MRI
PREPROCESSING &ENHANCEMENT
3.7 ENHANCEMENT
The proposed system describes the information of enhancement using four types of
filters such as
1. Median filter
2. Weighted Median filter
3. Adaptive filter
4. Spatial filter
for removing high frequency components such as impulsive noise, salt and pepper noise and
high frequency components. In the Enhancement stage the filters are designed to enhance the
appearance of images, primarily by sharpening Edges, corners, and line detail. Several of the
new enhancement filters also incorporate a noise-reduction component.
Median filtering is a nonlinear operation often used in image processing to reduce
"salt and pepper" noise. Median filtering is more effective than convolution when the goal is
to simultaneously reduce noise and preserve edges.
If the input image A is of an integer class, all the output values are returned as
integers. If the number of pixels in the neighbourhood (i.e., m*n) is even, some of the
median values might not be integers. In these cases, the fractional parts are discarded.
Logical input is treated similarly.

CAD SYSTEM FOR AUTOMATIC DETECTION OF BRAIN TUMOR THROUGH MRI
PREPROCESSING &ENHANCEMENT
Median Filter can remove the noise, high frequency components from MRI without
disturbing the edges and it is used to reduce salt and pepper noise. This technique calculates
the median of the surrounding pixels to determine the new demonized value of the pixel. A
median is calculated by sorting all pixel values by their size, then selecting the median value
as the new value for the pixel. The amount of pixels which should be used to calculate the
median.
Example
i3=medfilt2(i3,[3 3]);
i3 is filtered image its return from medfilt2 function.
Noise is like interferences which present as an irregular granular pattern. This
random variation in signal intensity degrades image information. The main source of noise
in the image is the patient's body RF emission due to thermal motion. The whole
measurement chain of the MR scanner also contributes to the noise.
This noise corrupts the signal coming from the transverse magnetization variations of
the intentionally excited spins on the selected slice plane. Four filters in the Enhancement
phase are designed to enhance the appearance of images, primarily by sharpening edges,
corners, and line detail. Several of the new enhancement filters also incorporate a noise-
reduction component.

CAD SYSTEM FOR AUTOMATIC DETECTION OF BRAIN TUMOR THROUGH MRI
PREPROCESSING &ENHANCEMENT
3.7.1 MEDIAN FILTER
In medical image processing, it is necessary to perform a high degree of noise
reduction in an image before performing high-level processing steps. So the noise can be
removed through Median Filter high frequency components from MRI without disturbing
the edges and it is used to reduce ‘salt and pepper’ noise. This technique calculates the
median of the surrounding pixels to determine the new demonized value of the pixel. A
median is calculated by sorting all pixel values by their size, then selecting the median value
as the new value for the pixel. The amount of pixels which should be used to calculate the
median.
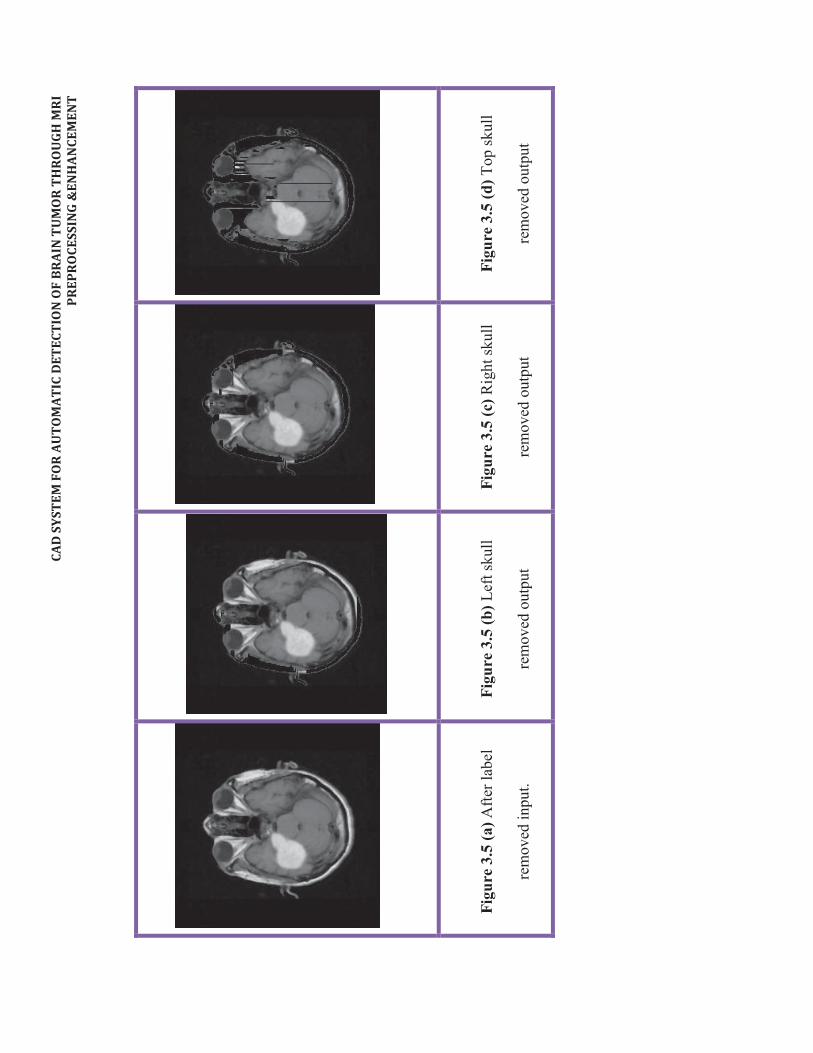
For each pixel, a 3 x 3, 5 x 5, 7 x 7, 9 x 9, 11 x 11 window of neighbourhood pixels
are extracted, and the pixel intensity values are arranged in ascending order and the median
value is calculated for that window. The intensity value of the center pixel is replaced with
the median value. This procedure is done for all the pixels in the image to smoothen the
edges of Magnetic Resonance Image. High Resolution Image was obtained when using 3 x 3
than 5 x 5 and so on. The below table3.2 shows the median filter.
CA
D S
YS
TE
M F
OR
AU
TO
MA
TIC
DE
TE
CT
IO
N O
F B
RA
IN
TU
MO
R T
HR
OU
GH
MR
I
PR
EP
RO
CE
SS
IN
G &
EN
HA
NC
EM
EN
T
3 x
3
5 x
5
7 x
7
9 x
9
11 x
11
Fig
ure
3.1
1 T
he
filt
ered
MR
I b
rain
im
age
usi
ng M
edia
n f
ilte
r w
ith
3x3 w
ind
ow
, 5
x 5
win
dow
, 7
x 7
win
dow
,
9 x
9 w
ind
ow
,11x 1
1 w
ind
ow
.

CAD SYSTEM FOR AUTOMATIC DETECTION OF BRAIN TUMOR THROUGH MRI
PREPROCESSING &ENHANCEMENT
Table 3.2 The example of median filter with 3 x 3 windows
(a) Before filtering
42 47 52
55 64 41
47 55 66
41, 42, 47, 47, 52, 55,55,64,66 Ascending Order of pixel
intensity
Median value 52
(b) After Filtering
42 47 52
55 52 41
47 55 66

CA
D S
YS
TE
M F
OR
AU
TO
MA
TIC
DE
TE
CT
IO
N O
F B
RA
IN
TU
MO
R T
HR
OU
GH
MR
I
PR
EP
RO
CE
SS
IN
G &
EN
HA
NC
EM
EN
T
Tab
le 3
.3 P
erfo
rm
an
ce
An
aly
sis
of
Med
ian
Fil
ter
wit
h d
iffe
ren
t se
t of
win
dow
.
Pix
el s
ize
Mea
n g
ray l
evel
of
fore
gro
un
d
Mea
n g
ray l
evel
of
Back
gro
un
d
Con
trast
valu
e
3×
3
93.1
54
4.0
49
0.9
167
5×
5
95.4
14
4.2
67
0.9
144
7×
7
95.4
75
4.3
05
0.9
137
9 ×
9
94.8
35
4.2
84
0.9
136
11 ×
11
93.8
69
4.2
43
0.9
135

CA
D S
YS
TE
M F
OR
AU
TO
MA
TIC
DE
TE
CT
IO
N O
F B
RA
IN
TU
MO
R T
HR
OU
GH
MR
I
PR
EP
RO
CE
SS
IN
G &
EN
HA
NC
EM
EN
T
Fig
ure
3.1
2 P
erfo
rm
an
ce
An
aly
sis
of
Med
ian
Fil
ter

CAD SYSTEM FOR AUTOMATIC DETECTION OF BRAIN TUMOR THROUGH MRI
PREPROCESSING &ENHANCEMENT
The above 3×3, 5×5, 7×7, 9×9, 11×11 windows are analyzed in that 3×3 window is
choose based on the high contrast than 5×5, 7×7, 9×9,and 11×11.
3.7.2 WEIGHTED MEDIAN FILTER
A weighted median filter controlled by evidence fusion is proposed for removing
noise from MRI brain images with contrast. It has a great potential for being used in rank
order filtering and image processing. The weights of the filter are set based on intensity
value of the pixels in the MRI image. Here we used four weights such as 0, 0.1, 0.2 and 0.3.
If the intensity value of the pixel is 0 then consider the weight of the pixel is 0. Else if the
range of pixel intensity between 1-100 then the weight is 0.1, else if the range of pixel
intensity between 101-200 and the weight is 0.2, otherwise the weight of the pixel is 0.3.
The above weights are multiplied with pixel intensity after that the median filter is applied
for calculate weighted median filter. The following figure 3.14 shows the filtered original
MRI brain image using 3×3, 5×5, 7×7, 9×9, 11×11 windows.

CA
D S
YS
TE
M F
OR
AU
TO
MA
TIC
DE
TE
CT
IO
N O
F B
RA
IN
TU
MO
R T
HR
OU
GH
MR
I
PR
EP
RO
CE
SS
IN
G &
EN
HA
NC
EM
EN
T
Tab
le 3
.4 P
erfo
rm
an
ce
An
aly
sis
of
Wei
gh
ted
Med
ian
Fil
ter
wit
h d
iffe
ren
t se
t of
win
dow
Pix
el s
ize
Mea
n g
ray
level
of
fore
gro
un
d
Mea
n g
ray
level
of
Back
gro
un
d
Con
trast
valu
e
3×
3
88.2
121
3.3
551
0.9
267
5×
5
96.4
823
3.6
145
0.9
278
7×
7
95.9
038
3.6
561
0.9
266
9 ×
9
96.1
042
3.7
143
0.9
256
11 ×
11
96.1
785
3.7
485
0.9
250

CA
D S
YS
TE
M F
OR
AU
TO
MA
TIC
DE
TE
CT
IO
N O
F B
RA
IN
TU
MO
R T
HR
OU
GH
MR
I
PR
EP
RO
CE
SS
IN
G &
EN
HA
NC
EM
EN
T
Fig
ure
3.1
3 P
erfo
rm
an
ce
An
aly
sis
of
Wei
gh
ted
Med
ian
Fil
ter

CA
D S
YS
TE
M F
OR
AU
TO
MA
TIC
DE
TE
CT
IO
N O
F B
RA
IN
TU
MO
R T
HR
OU
GH
MR
I
PR
EP
RO
CE
SS
IN
G &
EN
HA
NC
EM
EN
T
3 x 3
win
dow
5 x
5 w
ind
ow
7 x
7 w
ind
ow
9 x
9 w
ind
ow
11 x
11 w
ind
ow
Fig
ure
3.1
4 T
he
filt
ered
MR
I b
rain
im
age
usi
ng w
eigh
ted
med
ian
fil
ter
wit
h 3
x 3
, 5x 5
, 7x 7
, 9 x
9, 11x 1
1 w
ind
ow

CAD SYSTEM FOR AUTOMATIC DETECTION OF BRAIN TUMOR THROUGH MRI
PREPROCESSING &ENHANCEMENT
In above table5 3×3, 5×5, 7×7, 9×9, 11×11 windows are analyzed in that 5×5
window is chosen based on the high contrast than 3×3, 7×7, 9×9, and 11×11.
3.7.3 ADAPTIVE FILTER
A new type of adaptive center filter is developed for impulsive noise reduction of an
image without the degradation of an original image. The image is processed using an
adaptive filter. The shape of the filter basis is adapted to follow the high contrasted edges of
the image. In this way the artifacts introduced by a circularly symmetric filter at the border
of high contrasted areas are reduced. The following figure 6 shows the filtered original MR
brain image using 3×3, 5×5, 7×7, 9×9, 11×11 windows.

CA
D S
YS
TE
M F
OR
AU
TO
MA
TIC
DE
TE
CT
IO
N O
F B
RA
IN
TU
MO
R T
HR
OU
GH
MR
I
PR
EP
RO
CE
SS
IN
G &
EN
HA
NC
EM
EN
T
Tab
le 3
.5 P
erfo
rm
an
ce
An
aly
sis
of
Ad
ap
tive
Fil
ter
wit
h d
iffe
ren
t se
t of
win
dow
.
Pix
el s
ize
Mea
n g
ray l
evel
of
fore
gro
un
d
Mea
n g
ray l
evel
of
Back
gro
un
d
Con
trast
valu
e
3×
3
92.5
059
4.2
789
0.9
116
5×
5
95.1
252
4.5
236
0.9
092
7×
7
95.2
662
4.5
717
0.9
084
9 ×
9
94.1
861
4.5
462
0.9
079
11 ×
11
92.5
125
4.4
779
0.9
077

CA
D S
YS
TE
M F
OR
AU
TO
MA
TIC
DE
TE
CT
IO
N O
F B
RA
IN
TU
MO
R T
HR
OU
GH
MR
I
PR
EP
RO
CE
SS
IN
G &
EN
HA
NC
EM
EN
T
Fig
ure
3.1
5 P
erfo
rm
an
ce
An
aly
sis
of
Ad
ap
tive
Fil
ter

CA
D S
YS
TE
M F
OR
AU
TO
MA
TIC
DE
TE
CT
IO
N O
F B
RA
IN
TU
MO
R T
HR
OU
GH
MR
I
PR
EP
RO
CE
SS
IN
G &
EN
HA
NC
EM
EN
T
3 x 3
win
dow
5 x
5 w
ind
ow
7 x
7 w
ind
ow
9 x
9 w
ind
ow
11 x
11 w
ind
ow
Fig
ure
3.1
6 F
ilte
red
MR
I b
rain
im
age
usi
ng A
dap
tive
filt
er w
ith
3x
3, 5x 5
, 7x 7
, 9x 9
, 11x 1
1

CAD SYSTEM FOR AUTOMATIC DETECTION OF BRAIN TUMOR THROUGH MRI
PREPROCESSING &ENHANCEMENT
3.7.4 SPATIAL FILTER
A spatial filter design method is used to reduce the magnetic noise in the magnetic
resonance. This filter is used to extract the external magnetic noise appearing on MRI scan
image and to improve the signal-to-noise ratio of the MRI brain image. In spatial domain
filtering, the filter is specified as 3D array. The kernel is then applied to the image via
convolution or correlation using imfilter or filter2. Here, the filter for the picture elements
includes a first filter that applies one filter function to the pixels in each column of the
image. The partially filtered pixels are stored in matrix and then read row by row in a field
interlaced order. The rows of picture elements are sent to a second filter that applies another
filter function to each row. The fully filtered picture elements from the second filter are
stored or converted to a matrix to display an image.
For each pixel, a 3×3, 5×5, 7×7, 9×9, 11×11 window of neighbourhood pixels are
extracted A new type of adaptive center filter is developed for impulsive noise reduction of
an image without the degradation of an original image. The image is processed using an
adaptive filter. The shape of the filter basis is adapted to follow the high contrasted edges of
the image. In this way, the artifacts introduced by a circularly symmetric filter at the border
of high contrasted areas are reduced and the median value is calculated for that window.
Finally 3×3 window is selected for noise reduction based on high contrast. The following
figure 3.18 shows the filtered original MR brain image using 3×3, 5×5, 7×7, 9×9, 11×11
windows.

CA
D S
YS
TE
M F
OR
AU
TO
MA
TIC
DE
TE
CT
IO
N O
F B
RA
IN
TU
MO
R T
HR
OU
GH
MR
I
PR
EP
RO
CE
SS
IN
G &
EN
HA
NC
EM
EN
T
Tab
le 3
.6 P
erfo
rm
an
ce
An
aly
sis
of
Sp
ati
al
Fil
ter
wit
h d
iffe
ren
t se
t of
win
dow
.
Pix
el s
ize
Mea
n g
ray l
evel
of
fore
gro
un
d
Mea
n g
ray l
evel
of
Back
gro
un
d
Con
trast
valu
e
3×
3
92.5
049
4.2
689
0.9
106
5×
5
95.1
232
4.5
136
0.9
072
7×
7
95.2
552
4.5
617
0.9
024
9 ×
9
94.1
851
4.5
452
0.9
019
11 ×
11
92.5
225
4.4
679
0.9
017

CA
D S
YS
TE
M F
OR
AU
TO
MA
TIC
DE
TE
CT
IO
N O
F B
RA
IN
TU
MO
R T
HR
OU
GH
MR
I
PR
EP
RO
CE
SS
IN
G &
EN
HA
NC
EM
EN
T
Fig
ure
3.1
7 P
erfo
rm
an
ce
An
aly
sis
of
Sp
ati
al
Fil
ter

CA
D S
YS
TE
M F
OR
AU
TO
MA
TIC
DE
TE
CT
IO
N O
F B
RA
IN
TU
MO
R T
HR
OU
GH
MR
I
PR
EP
RO
CE
SS
IN
G &
EN
HA
NC
EM
EN
T
3 x 3
win
dow
5 x
5 w
ind
ow
7 x
7 w
ind
ow
9 x
9 w
ind
ow
11 x
11 w
ind
ow
Fig
ure
3.1
8 F
ilte
red
MR
I b
rain
im
age u
sin
g S
pati
al
filt
er w
ith
3x
3, 5x 5
, 7x 7
, 9x 9
,11x 1
1
CAD SYSTEM FOR AUTOMATIC DETECTION OF BRAIN TUMOR THROUGH MRI
PREPROCESSING &ENHANCEMENT
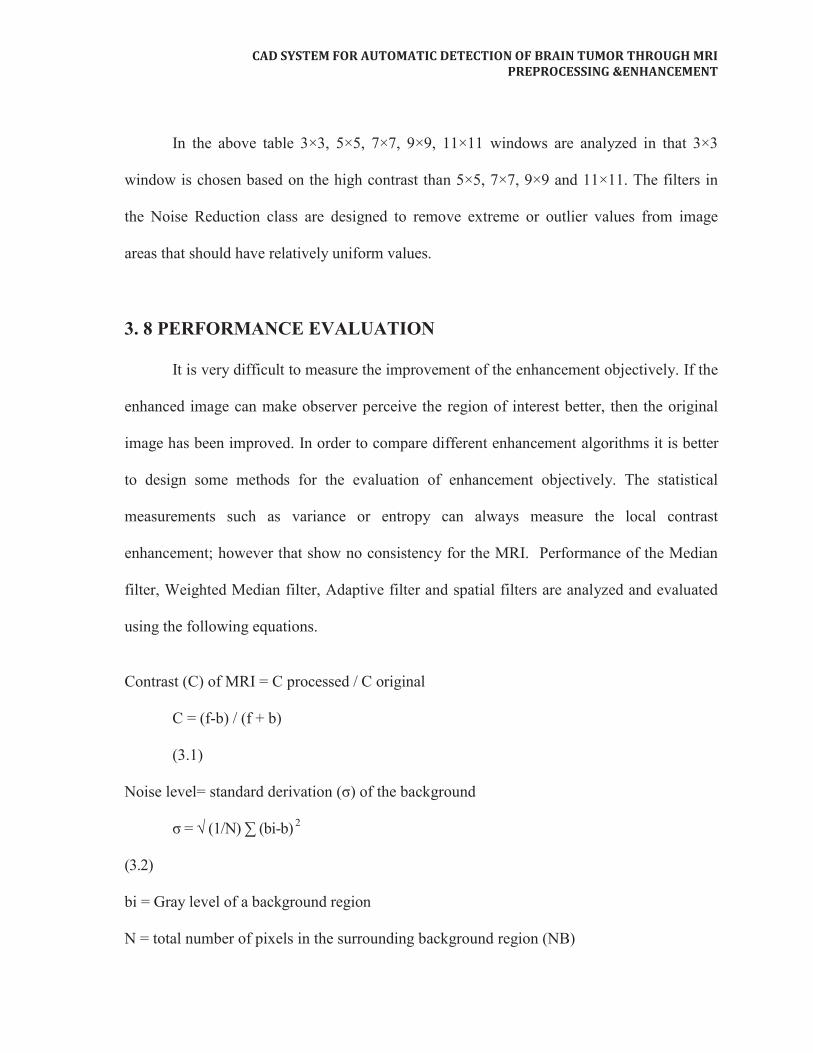
In the above table 3×3, 5×5, 7×7, 9×9, 11×11 windows are analyzed in that 3×3
window is chosen based on the high contrast than 5×5, 7×7, 9×9 and 11×11. The filters in
the Noise Reduction class are designed to remove extreme or outlier values from image
areas that should have relatively uniform values.
3. 8 PERFORMANCE EVALUATION
It is very difficult to measure the improvement of the enhancement objectively. If the
enhanced image can make observer perceive the region of interest better, then the original
image has been improved. In order to compare different enhancement algorithms it is better
to design some methods for the evaluation of enhancement objectively. The statistical
measurements such as variance or entropy can always measure the local contrast
enhancement; however that show no consistency for the MRI. Performance of the Median
filter, Weighted Median filter, Adaptive filter and spatial filters are analyzed and evaluated
using the following equations.
Contrast (C) of MRI = C processed / C original
C = (f-b) / (f + b)
(3.1)
Noise level= standard derivation (σ) of the background
σ = √ (1/N) ∑ (bi-b) 2
(3.2)
bi = Gray level of a background region
N = total number of pixels in the surrounding background region (NB)

CAD SYSTEM FOR AUTOMATIC DETECTION OF BRAIN TUMOR THROUGH MRI
PREPROCESSING &ENHANCEMENT
The value of PSNR and ASNR can be calculated using the following equations
PSNR = (p-b) / σ
(3.3)
ASNR = (f-b)/ σ
(3.4)
Where
p - is the maximum gray-level value
f - mean gray -level value of the fore ground,
b - mean gray-level value of the background
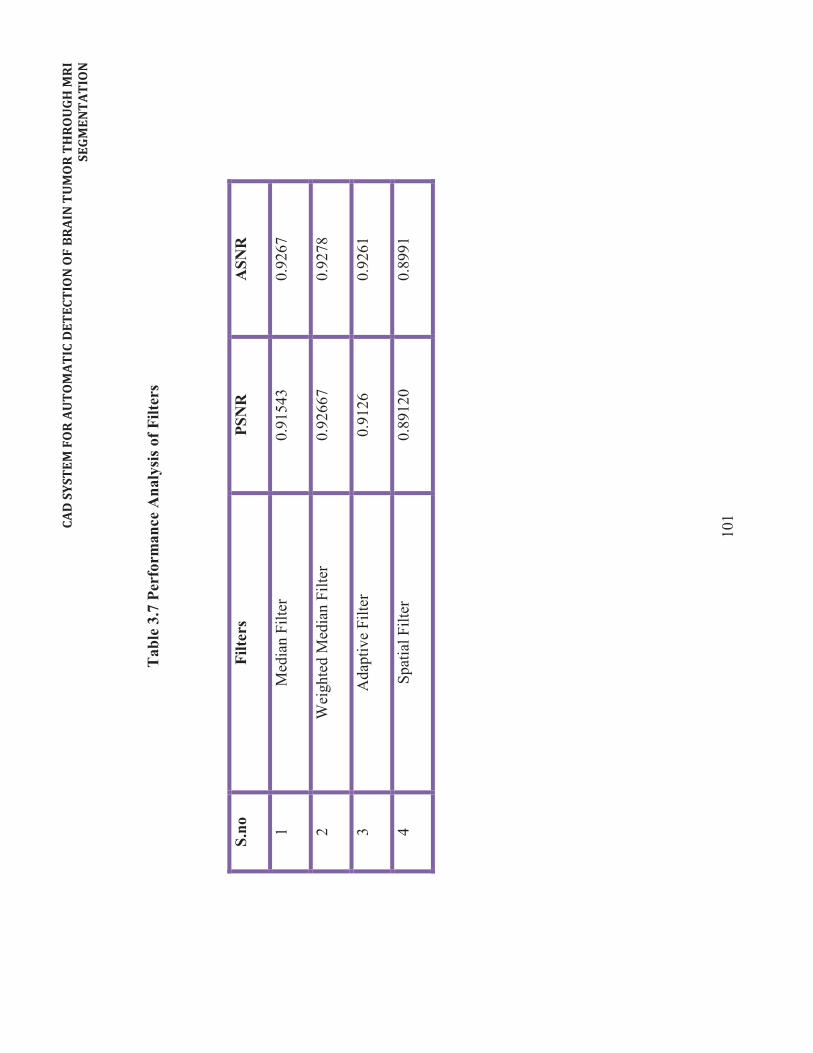
The value of two indexes are larger where as the enhancement method perform
better. This thesis is based on the experiments and results weighted median filter is highly
contrast than other three filters based on the below statistical analysis from PSNR and
ASNR values. Figure 3.19 (a&b )shows the value of Peak Signal-to-Noise Ratio (PSNR)
filters and the value of Average Signal-to-Noise Ratio (ASNR) filters.

CAD SYSTEM FOR AUTOMATIC DETECTION OF BRAIN TUMOR THROUGH MRI
SEGMENTATION
101
CA
D S
YS
TE
M F
OR
AU
TO
MA
TIC
DE
TE
CT
IO
N O
F B
RA
IN
TU
MO
R T
HR
OU
GH
MR
I
SE
GM
EN
TA
TIO
N
101
Tab
le 3
.7 P
erfo
rm
an
ce
An
aly
sis
of
Fil
ters
S.n
o
Fil
ters
P
SN
R
AS
NR
1
Med
ian F
ilte
r 0.9
1543
0.9
267
2
Wei
ghte
d M
edia
n F
ilte
r 0.9
2667
0.9
278
3
Adap
tive
Fil
ter
0.9
126
0.9
261
4
Sp
atia
l F
ilte
r 0.8
9120
0.8
991

CA
D S
YS
TE
M F
OR
AU
TO
MA
TIC
DE
TE
CT
IO
N O
F B
RA
IN
TU
MO
R T
HR
OU
GH
MR
I
SE
GM
EN
TA
TIO
N
102
Fig
ure
3.1
9 (
a)
Perf
orm
an
ce A
naly
sis
Fil
ters

CA
D S
YS
TE
M F
OR
AU
TO
MA
TIC
DE
TE
CT
IO
N O
F B
RA
IN
TU
MO
R T
HR
OU
GH
MR
I
SE
GM
EN
TA
TIO
N
103
Fig
ure
3.1
9(b
) P
erfo
rm
an
ce A
naly
sis
Fil
ters

CA
D S
YS
TE
M F
OR
AU
TO
MA
TIC
DE
TE
CT
IO
N O
F B
RA
IN
TU
MO
R T
HR
OU
GH
MR
I
SE
GM
EN
TA
TIO
N
104
Fig
ure
3.2
0 P
re-P
roces
sin
g

CA
D S
YS
TE
M F
OR
AU
TO
MA
TIC
DE
TE
CT
IO
N O
F B
RA
IN
TU
MO
R T
HR
OU
GH
MR
I
SE
GM
EN
TA
TIO
N
105
Fig
ure
3.2
1 E
nh
an
cin
g t
he
Image
CAD SYSTEM FOR AUTOMATIC DETECTION OF BRAIN TUMOR THROUGH MRI
SEGMENTATION
101
3.9 SUMMARY
This chapter has proposed a gradient based image enhancement method using
first derivative and local statistics and showed the validity of detection of MRI. Initially
the MRI brain image is acquired from MRI brain data set to MATLAB 7.1. After
acquisition the MRI is given to the preprocessing stage, here the film artifacts labels are
removed. Next, the high frequency components and noise are removed from MRI using
the following filters. Such as Median filter, Weighted Median filter, Adaptive filter and
Spatial filter. The Computational result is used to enhance the Image and the
performance of the system was investigated. Finally the best filter of weighted median
filter is identified and used for MR brain image enhancement. It is used for removing
noise from MRI brain images with high contrast. The merit of using Weighted Median
Filter can remove the noise without disturbing the edges.