chapter - iii methodology - information and library...
TRANSCRIPT
85
CHAPTER - III
METHODOLOGY
The present investigation was undertaken to find out the opinion of builders
regarding Green buildings, the extent of influence of reason, barriers faced by
the builders of Vadodara city and the level of knowledge of the home owners
regarding “Green Buildings”. The efficacy of the educational Programme was
also tested. In order to achieve the aims of the present study, a detailed plan
of work and sequential procedure followed are presented in this chapter under
the following sub-heading:
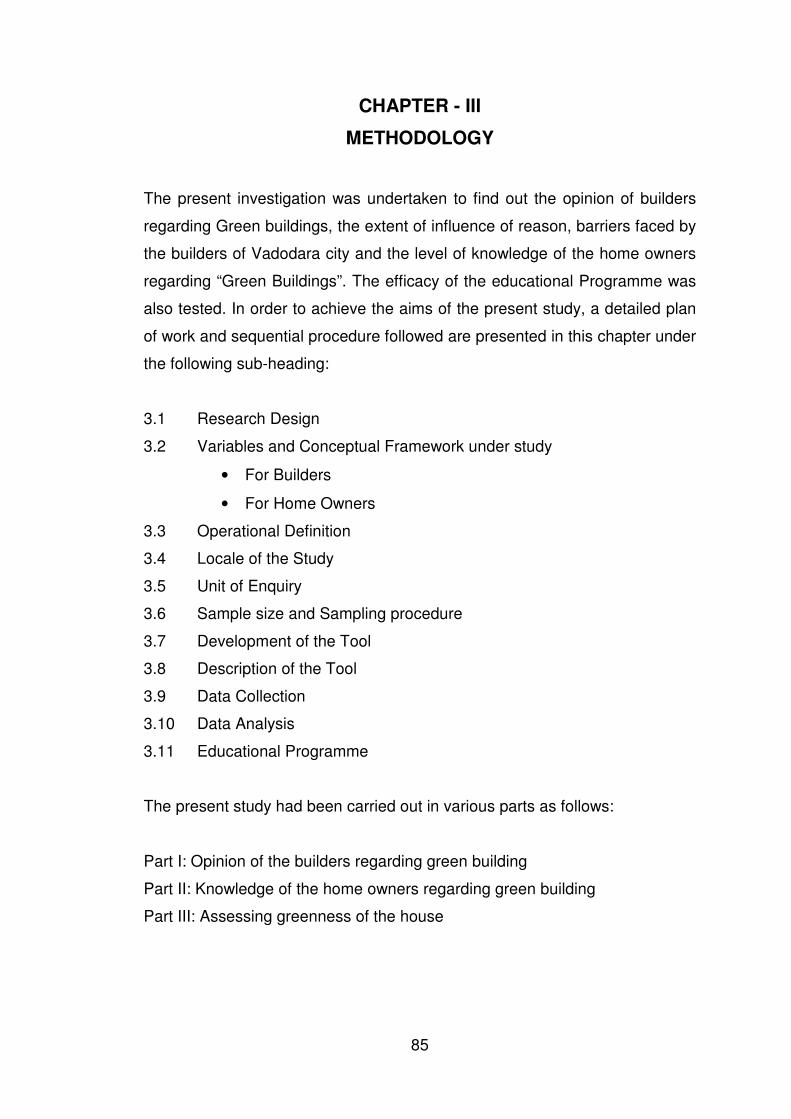
3.1 Research Design
3.2 Variables and Conceptual Framework under study
• For Builders
• For Home Owners
3.3 Operational Definition
3.4 Locale of the Study
3.5 Unit of Enquiry
3.6 Sample size and Sampling procedure
3.7 Development of the Tool
3.8 Description of the Tool
3.9 Data Collection
3.10 Data Analysis
3.11 Educational Programme
The present study had been carried out in various parts as follows:
Part I: Opinion of the builders regarding green building
Part II: Knowledge of the home owners regarding green building
Part III: Assessing greenness of the house
86
Research
Design
Descriptive
To find out
Demographic characteristics
Opinion of builders
regarding green
buildings
Reasons for adopting
green building
concepts
Barriers faced in adopting
green building
concepts
Knowledge regarding
green buildings
Extent of greenness of
selected houses
Experimental
To test the efficacy of the educational programme.
3.1 Research Design
Figure 1: Research Design of the Study
The research design for the present investigation was descriptive and
experimental in nature. Descriptive research design is concerned with the
conditions or relationships that exist, opinions that are held, processes that
are going on, effects that are evident, or trends that are developing. It is
primarily concerned with the present, although it often considers past events
and influences as they relate to current conditions (Best and Kahn, 1983). The
present study also aimed to find out and describe the demographic
characteristics and opinion of builders regarding Green buildings, reasons and
barriers faced by the builders in adoption Green building design and
construction. The knowledge of the home owners was also found and the
extent of greenness of the selected houses was assessed. Experimental
research design was chosen to test the efficacy of the educational
programme.
87
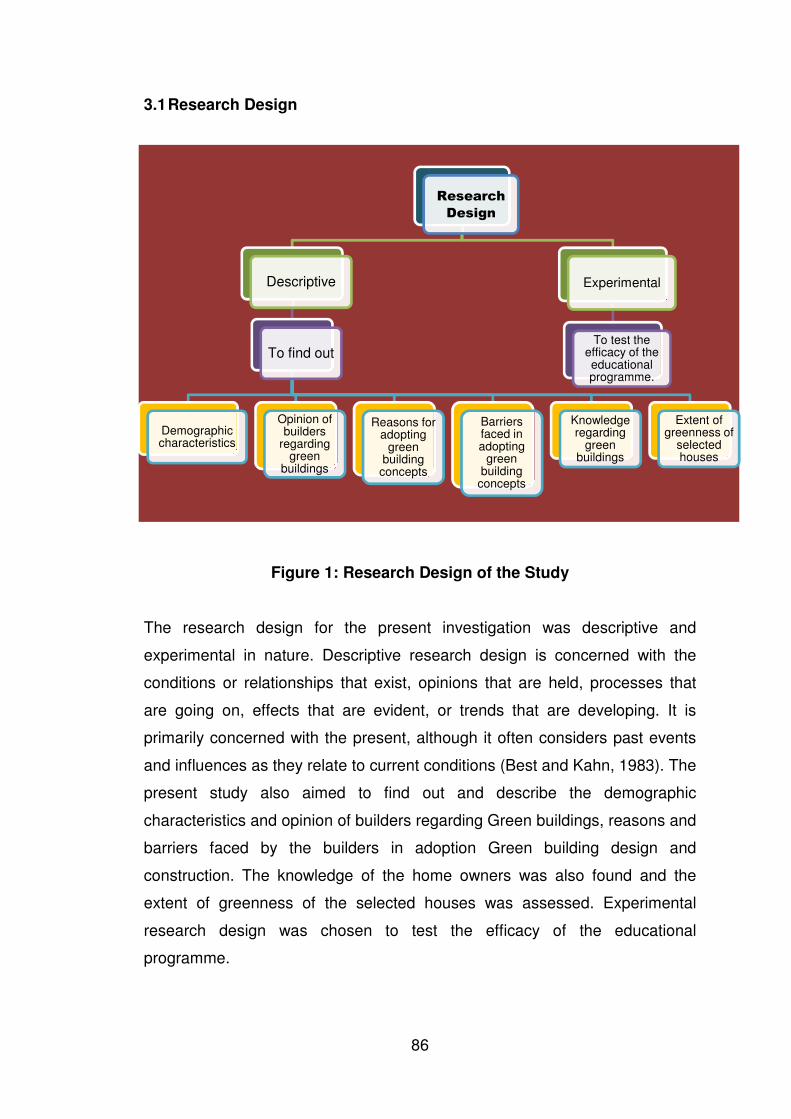
3.2 Variables and Conceptual Framework under study
The variables for the home owners and builders were considered separately
in the present research.
3.2.1 Variables for Selected Builders
The variables selected for builders were as follows:
Figure 2: Variables for Selected Builders
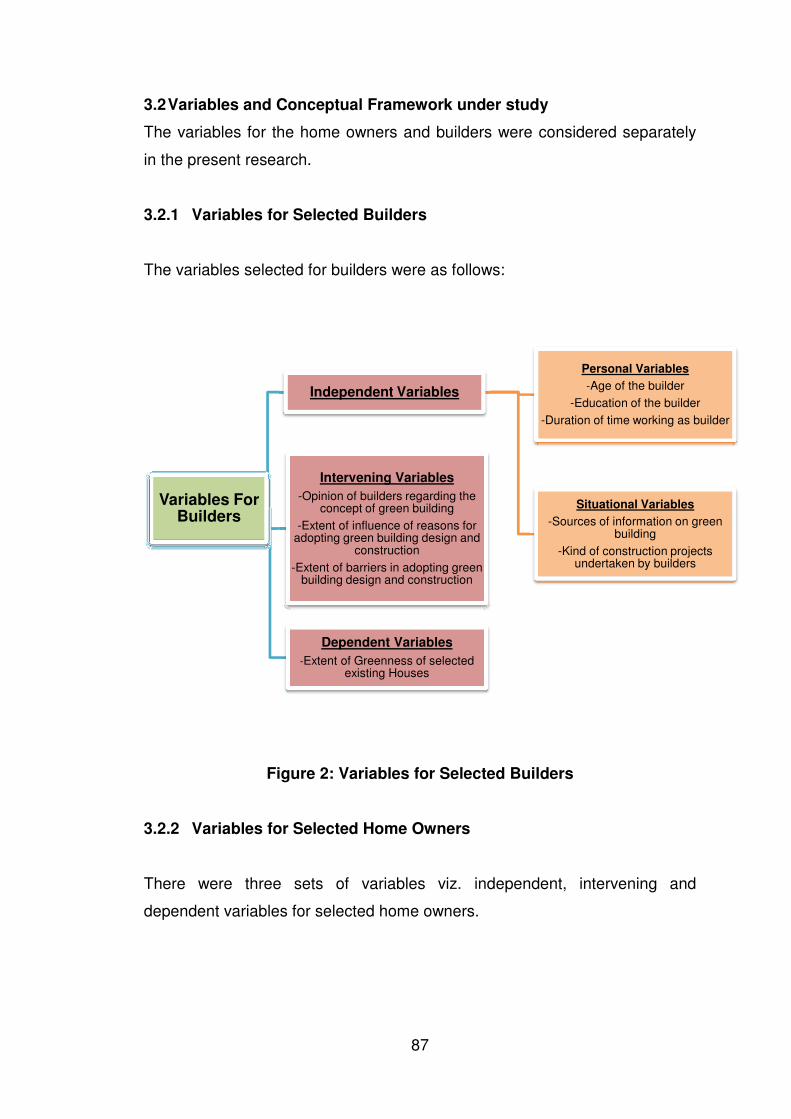
3.2.2 Variables for Selected Home Owners
There were three sets of variables viz. independent, intervening and
dependent variables for selected home owners.
Variables For Builders
Independent Variables
Personal Variables
-Age of the builder
-Education of the builder
-Duration of time working as builder
Situational Variables
-Sources of information on green building
-Kind of construction projects undertaken by builders
Intervening Variables
-Opinion of builders regarding the concept of green building
-Extent of influence of reasons for adopting green building design and
construction
-Extent of barriers in adopting green building design and construction
Dependent Variables
-Extent of Greenness of selected existing Houses
88
Figure 3: Variables for Selected Home Owners
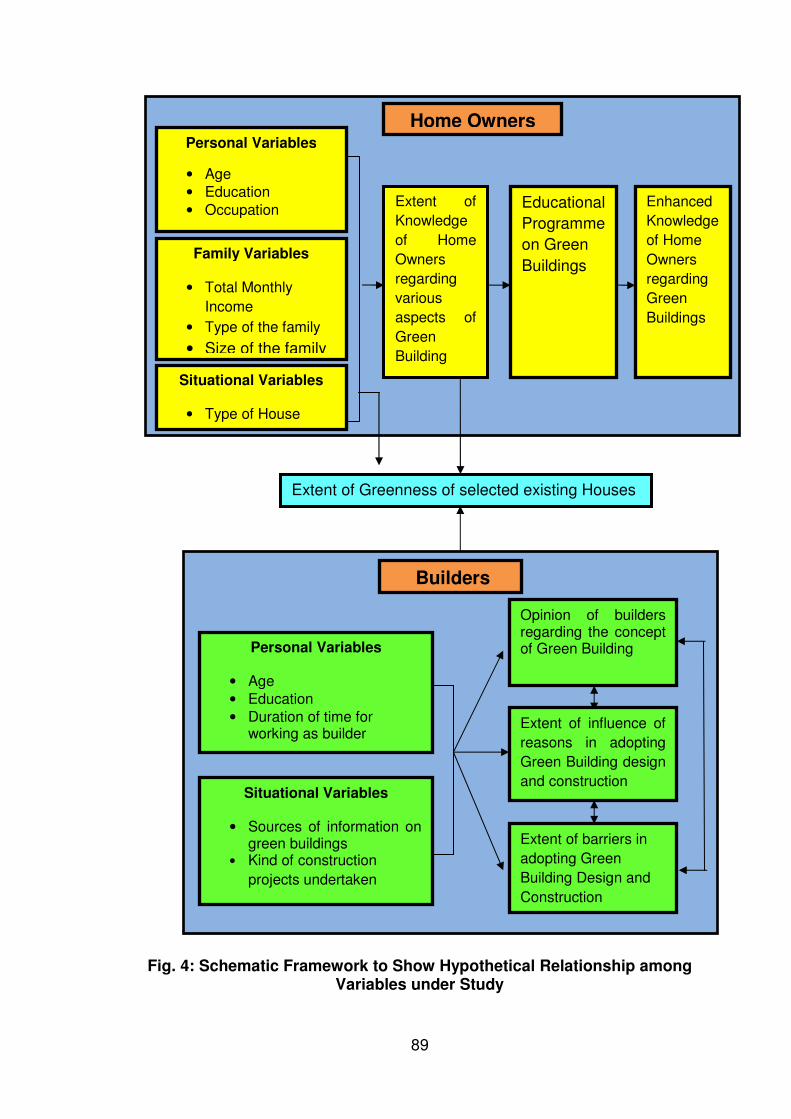
3.2.3. Hypothetical Relationship between Variables: A schematic
diagram (Fig. 4) showing hypothetical relationship between selected
variables for home owners and selected builders and its explanation
is presented here.
Variables For Home Owners
Independent Variables
Personal Variables
-Age of the Home Owners
-Education of the respondent
-Occupation of the respondent
Family Variables
-Total Monthly income of the family
-Type of the family
-Size of the family
Situational Variables
-Type of house
Intervening Variables
-Extent of Knowledge of home owners regarding various aspects
of Green Building
Dependent Variables
-Extent of Greenness of selected existing Houses
89
Fig. 4: Schematic Framework to Show Hypothetical Relationship among Variables under Study
Extent of barriers in
adopting Green
Building Design and
Construction
Extent of influence of
reasons in adopting
Green Building design
and construction
Opinion of builders regarding the concept of Green Building
Extent of Greenness of selected existing Houses
Extent of
Knowledge
of Home
Owners
regarding
various
aspects of
Green
Building
Situational Variables
• Sources of information on green buildings
• Kind of construction
projects undertaken
Builders
Personal Variables
• Age
• Education
• Duration of time for working as builder
Home Owners Personal Variables
• Age
• Education
• Occupation
Family Variables
• Total Monthly
Income
• Type of the family
• Size of the family
Situational Variables
• Type of House
Educational
Programme
on Green
Buildings
Enhanced
Knowledge
of Home
Owners
regarding
Green
Buildings

90
Explanation of Conceptual Framework
It was theorized that personal variables of the home owners such as age,
education and occupation, their family variables such as total monthly income,
type of the family and size of the family and their situational variable such as
type of house have influence on the extent of knowledge of the home owners
regarding green buildings and this might have influence on the extent of
greenness of the houses. It was also theorized that the educational
programme developed would enhance the knowledge of the home owners
regarding Green buildings through intervention programme.
It was also theorized that personal variables of the builders such as age,
education and duration of time working as builder and their situational barrier
such as sources of information on green building and kinds of projects
undertaken by the builders have direct influence on the reasons and barriers
faced by the builders in adopting green building design and construction as
well as on opinion of builders regarding green buildings. These variables have
influence on the extent of greenness of the house.
3.3 Operational Definitions
The terms used in the present study were operationally defined as follows:
3.3.1 Green Buildings: Green Building (house) was operationally defined as
the one which meets the standards for environmental performance of a
building for selected aspects viz. sustainable site selection, water
efficiency, energy efficiency, material and resources, indoor
environmental quality and innovative ideas.
Each of these aspects was operationally defined as follows:
a. Sustainable site selection: It is operationally defined as the
selection of site for construction of a residential unit (house) which
helps to have minimum adverse impact on the environment.

91
b. Water efficiency: It referred to as minimal use of water in and around
the house. It includes the management of water through the use of
water efficient fixtures, water meters, water level controller in water
tanks and economic use of water by the family members. Such plants
and trees were grown which consumed less amount of water for their
growth.
c. Energy efficiency: This referred to the minimal use of electricity and
enhanced use of non-conventional sources of energy. It included the
installation of CFC free equipments, Bureau of Energy Efficiency
(BEE) rated electrical fittings and energy meters in the building. The
energy efficiency within the building was enhanced by the installation
of T5 tube lights, LED lights, and weather shed on windows etc. Use
of solar energy in various ways was adopted to reduce the
dependence on electricity from grid.
d. Materials and resources: This referred to the maximum utilisation of
such materials and resources used in the construction which have
less impact on environment. It included the use of local and recyclable
building materials and reuse of renewable building materials,
provisions to separate the household waste and its effective
management.
e. Indoor environment quality: It referred to a healthy environment for
the occupants of buildings. Proper cross ventilation, placement of
exhaust systems in kitchen and bathrooms, proper placement of door
and window, low or no VOC paints, and Provision for maximum
daylighting all contribute in creating a quality indoor environment.
f. Innovative ideas: This referred to the new ideas, methods and
equipments used in the building so that adverse environmental impact
is reduced. In this provision are made for installation of rainwater
harvesting systems, Grey water treatment plant, efficient irrigation
systems etc. It encourages using new technologies and pushing the

92
market place into new and innovative areas of the green building
industry.
3.3.2 Extent of Greenness of existing Houses: It was operationally
defined as the extent to which the existing houses were environment
friendly as reflected on the selected parameters viz., Sustainable Site
Selection, Water Efficiency, and Energy Efficiency, Materials and
resources, Indoor Environment Quality and Innovative ideas.
3.3.3 Extent of knowledge of Home Owners regarding various aspects
of green buildings: It was operationally defined as the extent to
which the respondents had knowledge regarding various aspects of
Green buildings. It was assessed through a scale developed for the
purpose.
3.3.4 Extent of influence of reasons for adopting green building design
and construction: It was defined as the extent to which various
reasons influenced builders to adopt green building design and
construction.
This was reflected through summated rating scale where builders were
asked whether they were influenced by the given reasons to great
extent, to moderate extent and to low extent. These responses were
given scores of 3 to 1 respectively. Higher scores reflected high extent
of influence of reasons for adopting green building design and
construction.
3.3.5 Extent of barriers faced in adopting green building design and
construction: It was defined as the extent to which the builders faced
barriers in adopting green building design and construction.
This was reflected through summated rating scale where builders were
asked to state the extent to which they faced major, minor barriers or
no barriers. These responses were given scores of 3 to 1 respectively.

93
Higher scores reflected low extent of barriers faced in adopting green
building design and construction.
3.3.6 Opinion of builders regarding green buildings: It was defined as the
extent to which the builders had favourable opinion regarding green
buildings. This was reflected through summated rating scale where
builders were asked state the extent to which they strongly agree,
agree, were neutral, disagree and strongly disagree with the
statements reflecting their opinion regarding green building. These
responses were given scores of 5 through 1 respectively. Higher
scores reflected more favourable opinion towards green building.
3.3.7 Existing residential buildings: It was operationally defined as the
residential buildings which were constructed between 2005 and 2013
and were assessed on the basis of selected parameters for their
environment friendly features.
3.3.8 Sources of information on green buildings: This referred to the
various sources of information such as print, audio, audio-visual media,
personal or educational programmes etc. from which builders receive
information regarding Green Buildings.
3.4 Locale of the Study
The locale of the study was Vadodara city from where 220 houses
constructed during 2005 to 2013 by various builders were identified as
sample.
3.5 Unit of Inquiry
There were 2 units of enquiry
1. The selected builders. In case of group of builders in one company,
the one who was willing to answer was considered as the respondent
for the research.

94
2. Home Owners –Home owners of the selected existing houses. They
were the key decision makers regarding various aspects of the houses.
Figure 5: Unit of Inquiry
3.6 Sample size and Sampling procedure
A list of builders was obtained from Confederation of Real Estate Developers’
Association of India(CREDAI). Out of 300 builders of Vadodara City, seventy
five were selected through systematic random sampling. The housing
colonies which were constructed by these selected builders between 2005
and 2013 were selected. Through Snow ball sampling method, the housing
units (houses) were selected from these colonies. Houses from each of the
colonies ranging from 1 to 3 were selected. Thus 220 houses were
considered as sample for present study.
Unit Of Inquiry
Selected Builders Selected Home Owners
Total Builder members 300
Builders selected 75Systematic random sampling
Housing Colonies constructed by
selected builders133
Constructed between 2005 - 2013
Houses selected as sample
1 to 3 houses from each colony
Snow ball method
Total Houses 220 Total sample

95
Builder No.
No. of Residential Colonies of Builders
Selected Houses as sample
Builder No.
No. of Residential Colonies of Builders
Selected Houses as sample
Builder No.
No. of Residential Colonies of Builders
Selected Houses as sample
1 03 05 26 01 02 51 01 02
2 01 02 27 01 02 52 02 03
3 01 02 28 02 03 53 02 03
4 01 02 29 01 02 54 02 03
5 01 02 30 05 07 55 01 02
6 01 02 31 02 03 56 02 03
7 01 02 32 03 03 57 03 04
8 03 03 33 02 03 58 01 02
9 02 03 34 01 02 59 02 03
10 01 02 35 02 03 60 02 03
11 02 03 36 01 02 61 02 04
12 02 03 37 02 03 62 01 02
13 01 02 38 03 05 63 01 03
14 01 02 39 03 05 64 03 04
15 01 02 40 02 03 65 01 03
16 04 06 41 02 03 66 02 03
17 02 03 42 01 02 67 02 03
18 01 02 43 01 02 68 01 03
19 03 04 44 02 03 69 03 04
20 01 02 45 04 05 70 01 02
21 01 02 46 01 02 71 01 02
22 01 02 47 01 02 72 01 02
23 01 02 48 01 02 73 01 02
24 04 06 49 01 02 74 01 02
25 04 06 50 01 02 75 05 07 Total 44 72 Total 46 73 Total 43 75
Total Number of Builders as sample: 75
Total Number of Residential Colonies constructed by the builders considered as a sample: 133
Total Number of houses as sample: 220
3.7 Selection and Development of tool
3.7.1 Selection of the tool
For the present study, the data were collected through questionnaire from
builders and home owners. Observation checklist was used for the
assessment of the selected houses.
a) Part I: For builders and house owners
Questionnaire was used as an instrument for gathering data from house
owners and builders due to the following reasons:

96
1. It is free from the bias of the interviewer; answers are in
respondents’ own words.
2. Respondents have adequate time to give well thought out answers.
3. The sample size can be large thus the results can be made more
reliable.
4. Respondents may have greater confidence in their anonymity and
thus feel free to express their views.
b) Part II: For assessing the selected houses
A Checklist was used as an observation instrument for assessing the
greenness of the selected houses due to the following reasons:
1. The checklist is the simplest device prepared list of aspects/features.
2. The presence or absence of the aspect/feature of green building may
be indicated by checking ‘Yes’ or ‘No’.
3. The subjective bias is eliminated, if observation is done accurately.
4. This method is independent of respondents’ willingness to record and
as such is relatively less demanding of active cooperation on the part
of respondents.
3.7.2 Development of the tool
Based on the information collected through review of related literature,
questionnaire was prepared for the home owners and the builders. A care
was taken to include all such questions that would elicit the information
needed to attain the objectives of the study. Two separate questionnaires
were prepared, one for the home owners and the other for the builders. An
observation checklist was also prepared for the assessment of selected
houses for their greenness.
97
3.8 Description of the tool
The tool is described here:
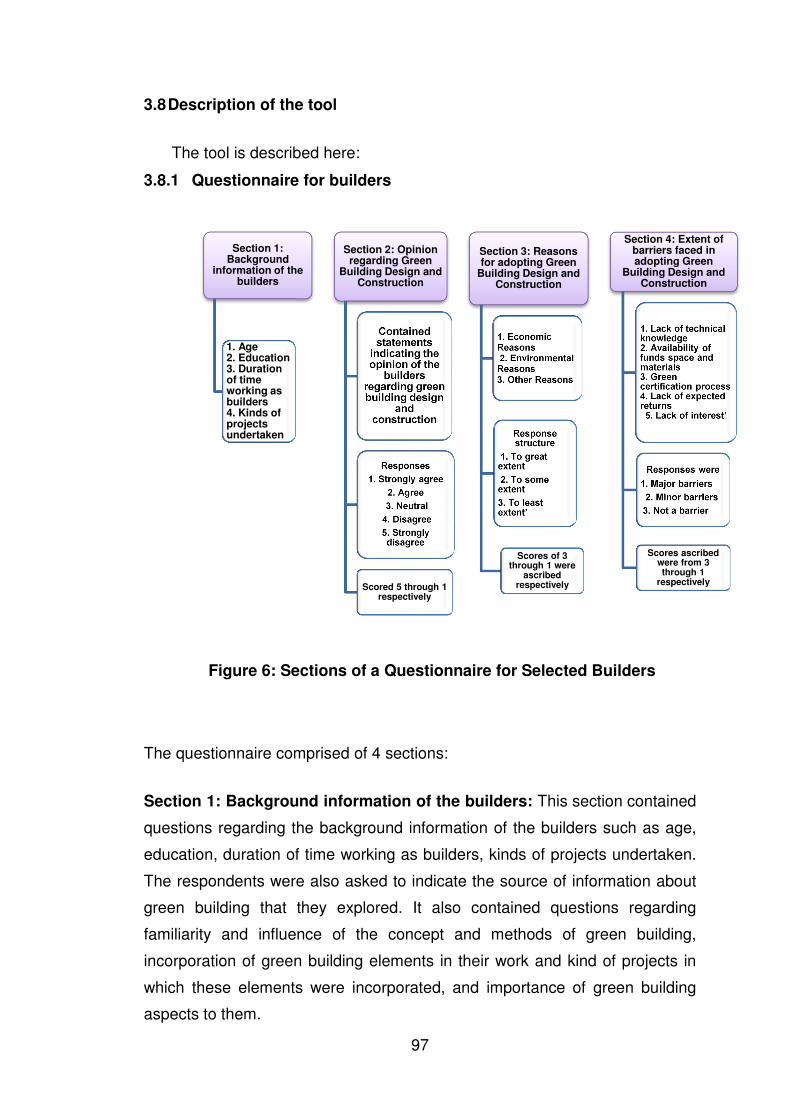
3.8.1 Questionnaire for builders
Figure 6: Sections of a Questionnaire for Selected Builders
The questionnaire comprised of 4 sections:
Section 1: Background information of the builders: This section contained
questions regarding the background information of the builders such as age,
education, duration of time working as builders, kinds of projects undertaken.
The respondents were also asked to indicate the source of information about
green building that they explored. It also contained questions regarding
familiarity and influence of the concept and methods of green building,
incorporation of green building elements in their work and kind of projects in
which these elements were incorporated, and importance of green building
aspects to them.
Section 1: Background
information of the builders
1. Age2. Education 3. Duration of time working as builders 4. Kinds of projects undertaken
Section 2: Opinion regarding Green
Building Design and Construction
Contained statements
indicating the opinion of the
builders regarding green building design
and construction
Responses
1. Strongly agree
2. Agree
3. Neutral
4. Disagree
5. Strongly disagree
Scored 5 through 1 respectively
Section 3: Reasons for adopting Green
Building Design and Construction
1. Economic Reasons2. Environmental Reasons3. Other Reasons
Response structure
1. To great extent
2. To some extent
3. To least extent’
Scores of 3 through 1 were
ascribed respectively
Section 4: Extent of barriers faced in adopting Green
Building Design and Construction
1. Lack of technical knowledge2. Availability of funds space and materials 3. Green certification process4. Lack of expected returns 5. Lack of interest’
Responses were
1. Major barriers
2. Minor barriers
3. Not a barrier
Scores ascribed were from 3 through 1
respectively
98
Section 2: Opinion regarding Green Building Design and Construction:
This section contained Likert type summated rating scale having statements
indicating the opinion of the builders regarding green building design and
construction. It had 5 point continuum for the responses ‘Strongly agree’,
‘Agree’, ‘Neutral’, ‘Disagree’ and ‘Strongly disagree’ which were scored 5
through 1 respectively for the positive statements and for the negative
statements the scoring was reversed. Higher scores reflected favourable
opinion of builders towards green buildings. It was developed by the
researcher and content validity and reliability were established.
Section 3: Reasons for adopting Green Building Design and
Construction: This section contained various statements depicting the
reasons for adopting green building design and construction. The reasons
were categorized as ‘Economic’ ‘Environmental’ and ‘Other’ reasons. The
respondents were required to state the extent to which they were influenced
by the listed reasons with a response structure of ‘To great extent’, ‘To some
extent’ and ‘To least extent’. Scores of 3 through 1 were ascribed respectively
to these responses. This was a Likert type of summated rating scale. It was
developed by the researcher and content validity and reliability were
established.
Section 4: Extent of barriers faced in adopting Green Building Design
and Construction: This section contained various statements regarding the
barriers faced by the builders while adopting green building design and
construction. The barriers were classified as ‘Lack of technical knowledge’,
‘Availability of funds, space and materials’, ‘Green certification process’, ‘Lack
of expected returns’ and ‘Lack of interest’. The responses were ‘Major
barriers’, ‘Minor barriers’ and ‘Not a barrier’ where the scores ascribed were
from 3 through 1respectively to these responses. High scores reflected high
extent of barriers faced by the builders in adopting green building design in
their construction projects undertaken. This summated rating scale was
developed by the researcher and content validity and reliability were
established.

99
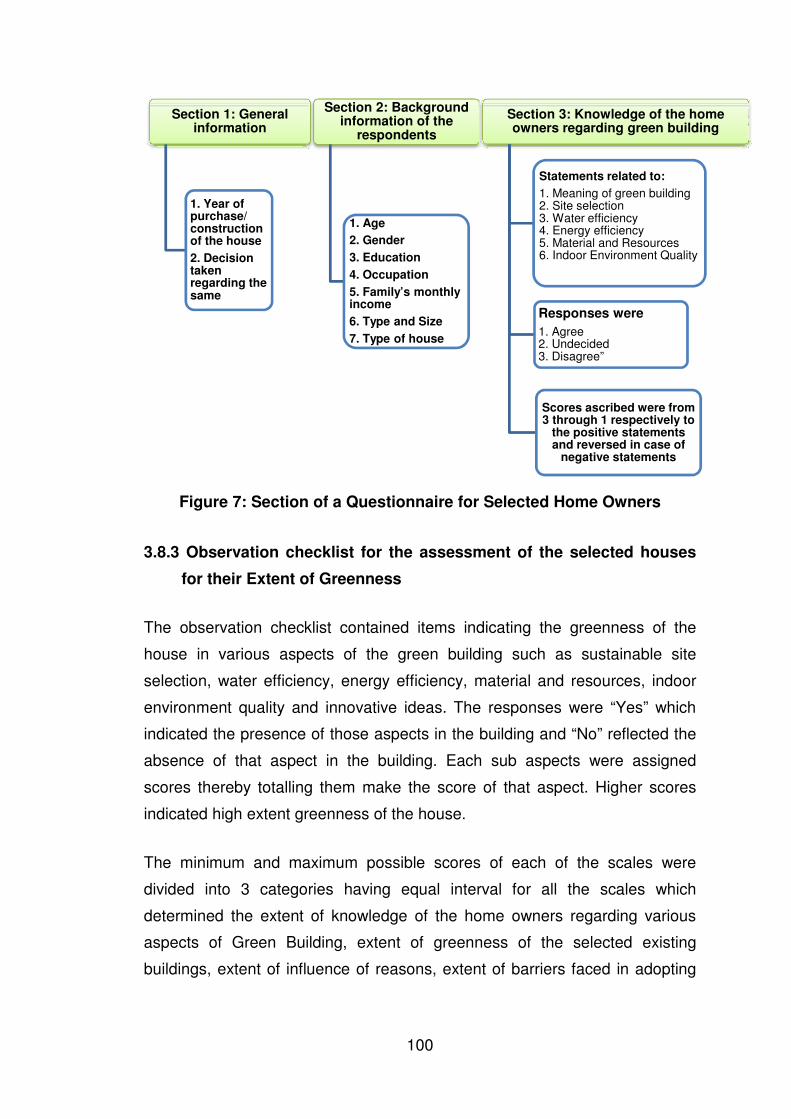
3.8.2 Questionnaire for house owners
Section 1: General information regarding the year of purchase/
construction of the house and decision taken regarding the same: In this
section respondents were asked to indicate the year of purchase or
construction of the house. The respondents were asked to tell the involvement
of family members in taking decisions for the purchase of the house.
Section 2: Background information of the respondents: This section
contained various questions regarding the background information of the
respondents such as age, gender, education, occupation, family’s monthly
income, type and size. It also contained question regarding their type of
house.
Section 3: Knowledge of the home owners regarding green building: It
comprised of a summated rating scale of Likert type having statements
related to meaning of green building and different aspects of green building
viz. site selection, water efficiency, energy efficiency, materials and indoor
environment quality. The respondents were asked to state whether they
“Agree”, “Undecided” and “Disagree” where the scores ascribed were from 3
through 1respectively to the positive statements. The scores were reversed in
case of negative statements. It was developed by the researcher and content
validity and reliability were established. Higher scores reflected higher extent
of knowledge.
100
Figure 7: Section of a Questionnaire for Selected Home Owners
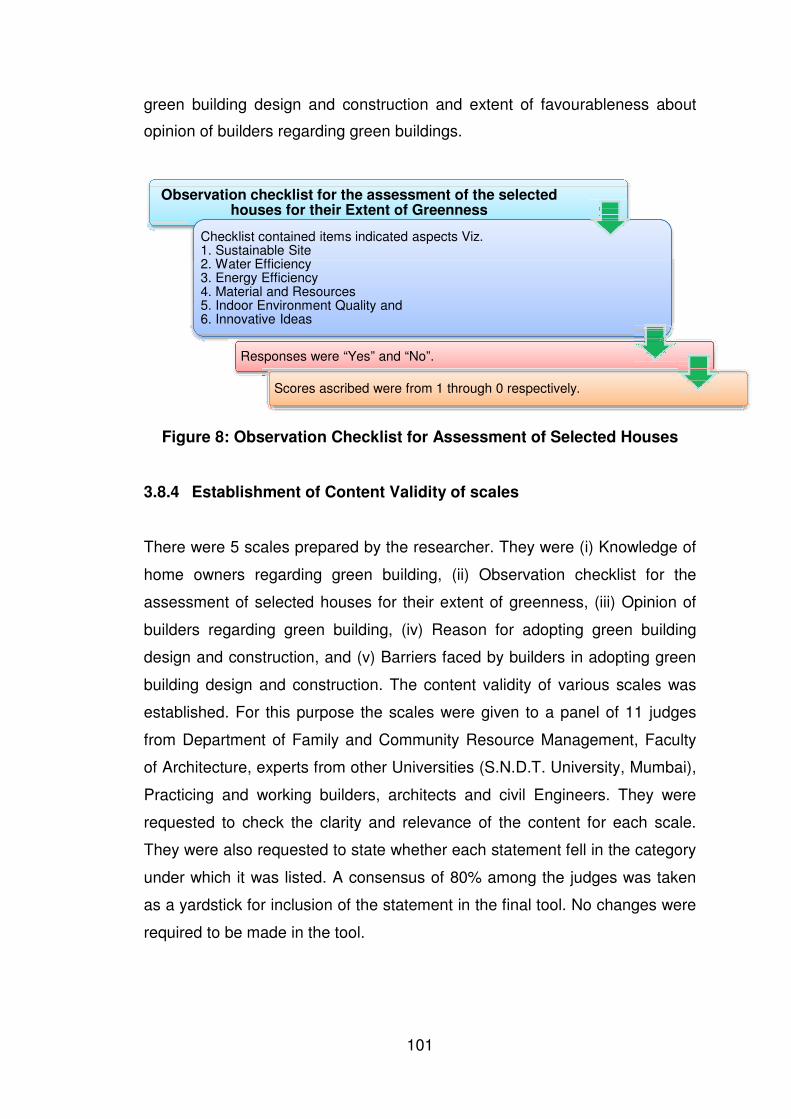
3.8.3 Observation checklist for the assessment of the selected houses
for their Extent of Greenness
The observation checklist contained items indicating the greenness of the
house in various aspects of the green building such as sustainable site
selection, water efficiency, energy efficiency, material and resources, indoor
environment quality and innovative ideas. The responses were “Yes” which
indicated the presence of those aspects in the building and “No” reflected the
absence of that aspect in the building. Each sub aspects were assigned
scores thereby totalling them make the score of that aspect. Higher scores
indicated high extent greenness of the house.
The minimum and maximum possible scores of each of the scales were
divided into 3 categories having equal interval for all the scales which
determined the extent of knowledge of the home owners regarding various
aspects of Green Building, extent of greenness of the selected existing
buildings, extent of influence of reasons, extent of barriers faced in adopting
Section 1: General information
1. Year of purchase/ construction of the house
2. Decision taken regarding the same
Section 2: Background information of the
respondents
1. Age
2. Gender
3. Education
4. Occupation
5. Family’s monthly income
6. Type and Size
7. Type of house
Section 3: Knowledge of the home owners regarding green building
Statements related to:
1. Meaning of green building2. Site selection3. Water efficiency4. Energy efficiency5. Material and Resources6. Indoor Environment Quality
Responses were
1. Agree2. Undecided3. Disagree”
Scores ascribed were from 3 through 1 respectively to
the positive statements and reversed in case of
negative statements
101
green building design and construction and extent of favourableness about
opinion of builders regarding green buildings.
Figure 8: Observation Checklist for Assessment of Selected Houses
3.8.4 Establishment of Content Validity of scales
There were 5 scales prepared by the researcher. They were (i) Knowledge of
home owners regarding green building, (ii) Observation checklist for the
assessment of selected houses for their extent of greenness, (iii) Opinion of
builders regarding green building, (iv) Reason for adopting green building
design and construction, and (v) Barriers faced by builders in adopting green
building design and construction. The content validity of various scales was
established. For this purpose the scales were given to a panel of 11 judges
from Department of Family and Community Resource Management, Faculty
of Architecture, experts from other Universities (S.N.D.T. University, Mumbai),
Practicing and working builders, architects and civil Engineers. They were
requested to check the clarity and relevance of the content for each scale.
They were also requested to state whether each statement fell in the category
under which it was listed. A consensus of 80% among the judges was taken
as a yardstick for inclusion of the statement in the final tool. No changes were
required to be made in the tool.
Observation checklist for the assessment of the selected houses for their Extent of Greenness
Checklist contained items indicated aspects Viz.1. Sustainable Site2. Water Efficiency3. Energy Efficiency4. Material and Resources5. Indoor Environment Quality and6. Innovative Ideas
Responses were “Yes” and “No”.
Scores ascribed were from 1 through 0 respectively.

102
Figure 9: Establishment of Content Validity of the Scales
3.8.5 Establishment of Reliability
a. Pretesting: A pilot study was conducted to find out the feasibility and
clarity of the scales developed. Therefore, the developed scales were
pre-tested on 35 non-respondents builders and home owners of the
selected houses of Vadodara city, who had similar characteristics as
those of final respondents of the study.
b. Reliability of the scales: The reliability of the scales was established
through split-half and test-retest methods. For split half method the
scales were divided in two using odd and even method. The coefficient
of correlation was found between the two halves. Spearman-Brown
correction formula was applied to estimate the reliability coefficient for
the entire scale.
For test-retest method the tool was given to the respondents and it was
administered to the respondents once again after a gap of 21 days.
Pearson’s Product Moment Formula was used to find out the
correlation in the scores between two administrations. The reliability
values were found to be high for all the scales as reported here.
Scales were given to a panel
of 11 judges
Department of Family and Community Resource
Management
Faculty of Architecture
Experts from other
Universities (S.N.D.T.
University, Mumbai),
Practicing and working
builders, architects and civil
Engineers

103
Sr.
No.
Scale Developed by Reliability
Method used Value
A. For Builders
1. Opinion of builders regarding
green buildings
Researcher Split half 0.746
2. Reasons for adopting green
building design and
construction
Researcher Split half 0.846
3. Extent of barriers faced in
adopting green building design
and construction
Researcher Split half 0.647
B. For Home owners
1. Knowledge of house owners
regarding green buildings
Researcher Split half 0.909
C. Assessment of selected
houses for their extent of
greenness
Researcher Test-Retest 0.786
3.9 Method of Data Collection
Data were gathered by the investigator from May to September, 2014. The
homes were identified through snow ball technique from the residential
colonies developed by the selected builders. The purpose of research was
explained and a rapport was built so as to get the true responses. The
investigator personally distributed and collected back the filled in
questionnaire. The rate of return was 100%. The observations were recorded
in the checklist by the researcher.
Parts Study Tool for data
collection
I Opinion, Reasons and Barriers of the builders
regarding green building
Questionnaire
II Knowledge of the home owners regarding
green building
Questionnaire
III Assessing greenness of the house Observation sheet
3.9.1 Apparatus and Tools used to measure certain information
1. Light Meter: Light meter was used to measure natural light in the
selected rooms viz. Living room, bed room, bathroom and kitchen. The

104
measurement was taken at the centre of the room during 11:00 am to
03:00 pm once only.
2. Measuring Tape: Measuring tape of metal was used to measure (i) the
land area, and vegetated land area (2) size of the room, walls, windows
and doors.
Plate 1: Light Meter Plate 2: Measuring Tape
3.10Data Analysis Procedure
The procedure used to analyse the data were categorization, coding,
tabulation and statistical analysis.
3.10.1 Formula used in assessing factors of Greenness during data
collection
Certain formula were used to find out the required inferences. They are as
follows:
1. For intensity of light and illumination level: In order to measure the
intensity of light in different rooms of a house, Lux meter was used.
The formula applied for its calculation was as follows:
DQ = Light intensity at measuring point (Ei) × 100
Light intensity in the open area
105
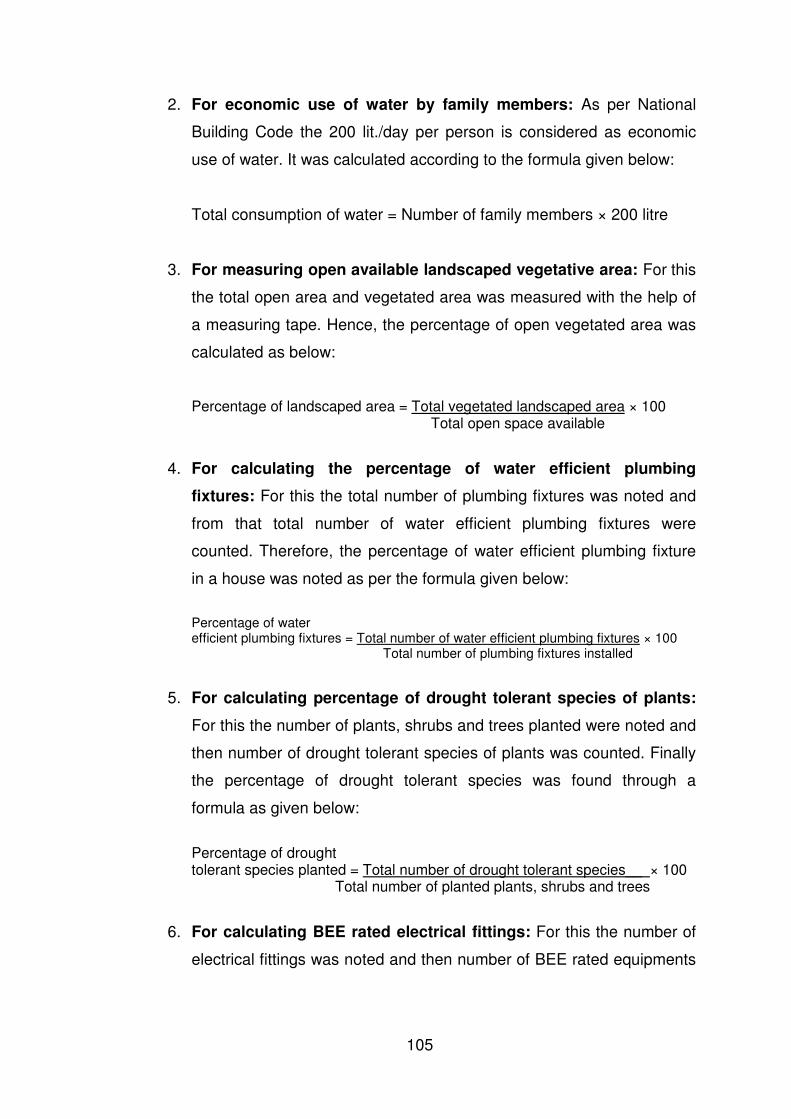
2. For economic use of water by family members: As per National
Building Code the 200 lit./day per person is considered as economic
use of water. It was calculated according to the formula given below:
Total consumption of water = Number of family members × 200 litre
3. For measuring open available landscaped vegetative area: For this
the total open area and vegetated area was measured with the help of
a measuring tape. Hence, the percentage of open vegetated area was
calculated as below:
Percentage of landscaped area = Total vegetated landscaped area × 100 Total open space available
4. For calculating the percentage of water efficient plumbing
fixtures: For this the total number of plumbing fixtures was noted and
from that total number of water efficient plumbing fixtures were
counted. Therefore, the percentage of water efficient plumbing fixture
in a house was noted as per the formula given below:
Percentage of water efficient plumbing fixtures = Total number of water efficient plumbing fixtures × 100
Total number of plumbing fixtures installed
5. For calculating percentage of drought tolerant species of plants:
For this the number of plants, shrubs and trees planted were noted and
then number of drought tolerant species of plants was counted. Finally
the percentage of drought tolerant species was found through a
formula as given below:
Percentage of drought tolerant species planted = Total number of drought tolerant species__ × 100
Total number of planted plants, shrubs and trees
6. For calculating BEE rated electrical fittings: For this the number of
electrical fittings was noted and then number of BEE rated equipments

106
was counted. Finally the percentage of BEE rated equipments were
found.
Percentage of BEE rated electrical fittings = Total number of BEE rated electrical fittings × 100
Total number of electrical fittings installed
7. For measuring provision for fresh ventilation in the living spaces,
Kitchen and Bathrooms: For this the percentage of percentage of
doors and windows on walls of a room was calculated as per the
following formula:
Provision for fresh air ventilation in a room = Total area of doors and windows in a room × 100 Total area of walls in a room
3.10.2Categorization
The under mentioned categories were made to enable the researcher to
analyze the data further for statistical application:
3.10.2.1 Categorization of the data for builders
The data gathered were categorized as follows:
i. Age of the builders: The obtained range of age of the respondents on the
basis of equal intervals as follows:
a) 21-35 years
b) 36-50 years
c) 51 years and above
ii. Education of the builders: The formal education obtained by the builders
was categorized as follows:
a) B. Arch.
b) B.A.
c) B.E. Civil
d) Diploma in civil Engineer
iii. Duration of time working as builder: It referred to the time period since
when they were working as builder. It was categorized as follows:
107
a) Less than 10 years
b) 11-20 years
c) 21-35 years
iv. Kind of projects undertaken by the builders: It referred to the kinds of
projects undertaken by the builders. It was categorized as follows:
A B C
Residential
Commercial
Institutional
Renovation
New construction
Private
Public
V. Extent of Exposure to different sources of information: It was judged
in terms of their exposure to different sources of information used for
gaining knowledge about green building. For each source of information
referred the builders were given one point. The responses were
summated and the extent of exposure to the different sources of
information was categorized as follows:
Extent of exposure Range of scores
High extent 9-12
Moderate extent 4-8
Low extent 0-3
Vi. Extent of Opinion of builders regarding green buildings: The
minimum and maximum possible scores were divided into 3 categories
on the basis of equal intervals as follows:
Opinion of builders Range of scores
Most favourable 52-70
Somewhat favourable 33-51
Least favourable 14-32
vii. Extent of Influence of reasons for adopting green building design
and construction: The possible range of score was divided into the
following categories having almost equal interval of numbers as follows:

108
Sr.
No.
Extent of influence of reasons for adopting green building design and construction
Range of scores of extent of influence of reasons
To a great extent
To some extent
To least extent
1. Economic reasons 8-9 5-7 3-4
2. Environmental reasons 22-27 15-21 9-14
3. Other reasons 22-27 15-21 9-14
4. Overall reasons 50-63 35-49 21-34
Viii. Extent of barriers faced while adopting green building design and
construction: The scores were summated and the possible ranges of
scores were divided into three categories having equal interval of
numbers as shown here.
Sr.
No.
Extent of barriers faced in adopting green building design and construction
Range of scores of extent of barriers
To a great extent
To some extent
To least extent
1. Technical knowledge 12-15 8-11 5-7
2. Availability of funds, space
and materials
8-9 5-7 3-4
3. Green certification process 10-12 7-9 4-6
4. Lack of expected returns 8-9 5-7 3-4
5. Lack of interest 10-12 7-9 4-6
6 Overall barriers 45-57 32-44 19-31
3.10.2.2 Categorization of the data about Home Owners
Data gathered about the home owners are as follows:
i. Age of the respondents: Based on the obtained information, the range
of years was categorized on the basis of equal interval as follows:
a) 21-35 years
b) 36-50 years
c) 51-65 years
ii Education of the respondents: Formal education obtained by the
respondents was categorized as follows:
b) Primary Education (Class V)
c) Middle School (Class VIII)
d) Higher Secondary/Intermediate

109
e) Graduate
f) Post Graduate
g) PhD or other Higher Degree
iii. Occupation of the respondents: It referred to the gainful employment
status of the respondents at the time of data collection and was
categorized as:
a) Service
b) Business
c) Self employed
d) Not employed
iv. Total monthly income of the family: It referred to the monthly monetary
income of the family acquired from various sources in the duration of a
month. It was categorized as follows:
a) ≤ Rs. 30,000
b) Rs. 30,001- Rs. 60,000
c) ≥ Rs. 60,001
v. Size of family: The size of the family was categorized on the basis of the
number of family members staying together under one roof at the time of
data collection was categorized as follows:
a) Small (2-5 members)
b) Medium (6-7 members)
c) Large (8-11 members)
vi. Type of house: It referred to the type of house in which respondents were
staying at the time of data collection. It was categorized as follows:
a) Tenement/ Twin duplex
b) Independent bungalow
vii. Extent of Knowledge of the home owners regarding various aspects
of Green Buildings: The minimum and maximum possible scores were
divided into 3 categories on the basis of equal intervals as shown here.

110
Sr.
No.
Aspects of green building Range of scores of extent of knowledge on various aspects of Green Buildings
High extent Moderate extent
Low extent
1. Meaning of green building 15-18 10-14 6-9
2. Site selection 10-12 7-9 4-6
3. Water efficiency 19-24 14-18 8-13
4. Energy efficiency 24-30 17-23 10-16
5. Materials 19-24 14-18 8-13
6. Indoor environment quality 10-16 17-23 10-16
7. Overall 108-138 77-107 46-76
3.10.2.3 Categorization of scale for extent of greenness of selected
houses
Data related to extent of greenness of the selected houses were
categorized for further analysis.
i. Extent of greenness of the selected houses: This section contained
statements featuring the aspects of green building. These aspects were
used to assess the extent of greenness of selected houses. The scores
were summated and the possible ranges of scores were divided into
three categories having equal intervals of numbers to denote the extent
of greenness. Higher the score more is the “Greenness”.
Sr.
No.
Aspects of green building used for assessing the selected houses
Range of scores of extent of greenness
High extent Somewhat extent
Least extent
1. Sustainable site 36-52 17-35 0-16
2. Water efficiency 13-19 6-12 0-5
3. Energy efficiency 33-49 16-32 0-15
4. Materials and resources 13-18 6-12 0-5
5. Indoor environment quality 20-28 9-19 0-8
6. Innovative ideas 12-16 6-11 0-5
7. Overall greenness 123-183 61-122 0-60
3.10.3Coding:Coding is the process whereby the data are assigned a
numerical code and value so that they can be more easily fitted into
111
appropriate categories (Bhattacharya, 2004). Code numbers were given to
each answer then the information from each questionnaire and observation
sheet were transferred on a coding sheet.
3.10.4Tabulation: Tabulation consists of counting the number of cases which
fall into the established categories (Bhattacharya, 2004). The data were
transferred from coding sheet into a tabular form to give a clear picture of
findings to facilitate the analysis of data. The tabulation was done with the
help of computer. The coded data of the present research were tabulated to
arrive at tables that were required for describing the data.
3.10.5Statistical Analysis: The data were analyzed employing descriptive as
well as relational statistics.
Descriptive statistics: The data were presented in frequencies, percentage,
mean and standard deviation.
Relational statistics: Analysis of Variance, t test and Co efficient of
Correlation were carried out to test the hypotheses postulated for the study.
3.11Educational Programme on “Green Buildings”
One of the objectives of the present research was the development of
educational package, to create awareness regarding Green Buildings among
the masses. It was prepared in print and audio-visual form. The home owners
of those houses which had low extent of greenness and those scored low on
knowledge scale were exposed to the educational programme.
3.11.1 Development of the Educational Programme
The title of the educational Programme was “Green Buildings: A Necessity for
Sustainable Development”.
3.11.1.1 Media for Educational Programme
Two media were selected for the educational Programme.

112
1. Audio Visual Media: Power point presentation was selected as a
media for the educational programme, as it has been observed that
audio-visual media is more effective on the audience due to its
attractiveness. The programme was prepared in English and Hindi
language so that maximum number of people can be made aware
regarding “Green Buildings”.
2. Print Media: A Booklet in English and Hindi language was also
prepared consisting of the same content in print form with supportive
pictures. This was prepared and distributed for their future reference.
3.11.1.2 Content of Educational Programme
Content regarding Green Buildings was developed based on the review of
literature collected on the following aspects:
• Present environmental condition
• Construction Facts
• Need of Green Buildings
• Definition of Green Building
• Meaning of Green Buildings
• Benefits of Green Buildings
• Green Rating Systems
• Features of Green Buildings
• Going Green in Existing Buildings by following guidelines:
1. Site selection
2. Water efficiency
3. Energy conservation
4. Material selection
5. Indoor Environmental Quality
The content prepared in English language was translated in Hindi language. It
was recorded in both the languages and the voice over was done with the
slides prepared thereby, making a movie of 30 minutes.
113
3.11.2Establishment of content validity of the Educational Programme
The educational programme was prepared by the researcher and was
subjected to establishment of content validity. The power point presentation
was shown to a panel of 5 judges from department of Family and Community
Resource Management, Faculty of Family and Community Sciences, The
Maharaja Sayajirao University of Baroda, Vadodara. They were requested to
judge the topics covered in the content, its relevance of the slide, clarity of text
in relation to slide, quality of visuals, sound quality and overall presentation. A
consensus of 80% among the judges was taken as a yardstick for inclusion of
content finally in the educational programme. Suggestion given by judges to
convert the content of the slides into Hindi language was incorporated.
3.11.3 Establishment of Reliability of the Educational Programme
The students of Department of Family and Community Resource
Management, Bachelor’s Degree Programme in Interior Design and Post
Graduate Diploma in Hotel Interiors were selected as sample for pretesting.
They were asked to fill questionnaire before and after the administration of the
educational programme. The paired t-test was computed. The t-value was
15.28 which were found to be significant at 0.01 level.
3.11.4 Administration of educational Programme to the Home Owners
Those home owners who scored moderate and low on the knowledge scale
regarding green buildings as well as those who scored low on the extent of
greenness on the existing houses were exposed to the educational
programme. They were gathered in the Dr. Mrunalini Devi Puar Auditorium of
Faculty of Family and Community Sciences. The movie was shown to them
and then immediately after that they were asked to fill the same knowledge
scale. This was done to test the efficacy of the educational programme
prepared and to test the change in knowledge level of the respondents
regarding “Green Buildings”. Paired t test was performed to test the efficacy of

114
the educational programme. The Paired t-test value (15.248) was found
significant at 0.01 level of significance.
Plate 3: Introduction about the educational programme
Plate 4: Explaining the process of filling the Knowledge scale
Plate 5: Exposure to the educational programme
Plate 6: Students filling up the knowledge scale before and after the exposure to the educational programme