chapter 8 selection of short-term intelligent …
TRANSCRIPT

The Federative Republic of Brazil Study on the Introduction of Intelligent Transport Systems Final Report
8-1
CHAPTER 8 SELECTION OF SHORT-TERM INTELLIGENT TRANSPORT SYSTEM MENUS
8.1 SELECTION POLICY FOR SHORT-TERM ITS PROJECTS The short-term projects, which hold the highest priority among the ITS projects in the ITS master
plan, were selected for the smooth introduction of ITS in Rio de Janeiro Metropolitan Area. The list of the short-term projects is shown in Figure 8-1 and the implementation schedule was defined based on the following:
1. Immediate effectivity
2. Operability in the short term
3. Achievement of smooth transportation for Rio 2016 Olympic Games
8.2 SHORT-TERM ITS PROJECTS Five of the highest priority ITS projects were selected based on the conditions described above.
Although Project Nos. 5, 7, and 10 were selected as priority projects in the implementation schedule, they are not considered essential to achieve smooth transport for the Olympic Games.
Source: JICA Study Team
Figure 8-1 Short-Term ITS Projects and Their Implementation Schedule
1Q 2Q 3Q 4Q 1Q 2Q 3Q 4Q 1Q 2Q 3Q 4Q 1Q 2Q 3Q 4Q 1Q 2Q 3Q 4Q 1Q 2Q 3Q 4Q 1Q 2Q 3Q 4Q
1 ITS Center2 Real Time Traffic/Transport Condition Information Processing3 Olympic Security and Transport Coordination Center
4 Bus Condition Information Provision
5 Dissemination of On-Board UNIT for more Integrated Transport6 Information Exchange of Road Operator
7 Information Exchange via ITS Center between Municipalities
8Improvement of Traffic/Transit Operational Center with Essential ITSEquipment at Rio de Janeiro Municipality Area
9Improvement of Traffic/Transit Operational Center with Essential ITSEquipment at Other Municipality Area in RMRJ
10 Emergency Vehicle Operating Management11 Commercial Vehicle Operation and Management12 Advanced Vehicle Safety Systems13 Deployment of X-band Radar
:Priority Project:Secondary Project:Further Expansion and Integration for Interaction Projects
PQ,TENDERING/ DD Construction/Deployment
Car Maker's Technological Development FieldNeed to confirm development policy for weather monitoring in RMRJ
Construction/DeploymentConstruction/Deployment
PQ,TENDERING/ DD Construction/Deployment
PQ,TENDERING/ DD Construction/Deployment
PQ,TENDERING/ DD Construction/Deployment Construction/Deployment
PQ,TENDERING/ DD Construction/Deployment
PQ,TENDERING/ DD Construction/Deployment PQ,TENDERING/ DD Construction/Deployment
PQ,TENDERING/ DD Construction/Deployment
PQ,TENDERING/ DD Construction/Deployment
PQ,TENDERING/ DD Construction/Deployment
2018 2019
PQ,TENDERING/ DD Construction/DeploymentPQ,TENDERING/ DD Construction/Deployment
ITS Project Name2013 2014 2015 2016 2017

The Federative Republic of Brazil Study on the Introduction of Intelligent Transport Systems Final Report
9-1
CHAPTER 9 PRELIMINARY DESIGN FOR SHORT-TERM PROJECT
9.1 OUTLINE OF THE PRELIMINARY DESIGN In accordance with the selection of short-term ITS projects mentioned in Chapter 8, the
preliminary design for the six projects shown below was conducted.
No.1 ITS Center No.2 Real Time Traffic/Transport Condition Information Processing No.3 Olympic Security and Transport Coordination Center No.4 Bus Condition Information Provision No.6 Information Exchange of Road Operator No.8 Improvement of Traffic/Transit Operational Center with Essential ITS Equipment in
Rio de Janeiro Municipal Area
Each project is an effective countermeasure against traffic congestion in Rio de Janeiro municipal area as mentioned in Chapter 7. However, Project Nos. 1, 2, 3 and 6 should be packaged into one project for more effective and efficient implementation. Therefore, the six projects above are proposed to be classified into three project packages as shown in Table 9-1.
The JICA Study Team has carried out a preliminary study for the three following project packages.
Table 9-1 Project Package Project Package No. ITS Project Project Package 1 No.1
No.2 No.3 No.6
ITS Center Real-time Traffic/Transport Condition Information Processing Olympic Security and Transport Coordination Center Information Exchange of Road Operator
Project Package 2 No.4 Bus Condition Information Provision Project Package 3 No.8 Improvement of Traffic/Transit Operational Center with Essential ITS
Equipment in Rio de Janeiro Municipal Area
Source: JICA Study Team
The overall system diagram in Figure 9-1 shows the classification of the project packages.

The Federative Republic of Brazil Study on the Introduction of Intelligent Transport Systems Final Report
9-2
Source: JICA Study Team
Figure 9-1 Overall System Diagram

The Federative Republic of Brazil Study on the Introduction of Intelligent Transport Systems Final Report
9-3
9.2 PROJECT COST Based on the preliminary design, the project costs of Project Package 1, Project Package 2, and
Project Package 3 are estimated as shown in Table 9-2.
This cost estimation is based on the following conditions and assumptions:
Equipment cost comes from rough order of magnitude (ROM) cost information based on system integrators, past projects’ contract price information, and the consultant’s experience.
Installation cost is assumed to be 10% of the equipment cost. Consultancy service is taken into consideration from the viewpoint of proper design,
schedule, and quality management of implementation during the design and procurement stages. Consultancy service cost is around 7% of the equipment procurement and installation cost.
Administration cost is assumed to be 5% of the equipment procurement and construction cost.
Price escalation is assumed to be 3% of the equipment procurement and construction cost. Contingency is assumed to be 10% of the project cost which consists of the equipment
procurement and construction cost, consultancy service cost, administration cost, and price escalation.
Costs for hardware, software and setup shall be included. Costs for the establishment of new organization for operation and land acquisition shall not
be included.

The Federative Republic of Brazil Study on the Introduction of Intelligent Transport Systems Final Report
9-4
Table 9-2 Project Cost
Source: JICA Study Team
9.3 IMPLEMENTATION PLAN Table 9-3 shows the project implementation schedule of Project Packages 1, 2 and 3. These three
project packages shall be completed before the commencement of the August 2016 Olympic Games in order to achieve smooth transportation for the games. However, there is insufficient time for a stepwise implementation of each project. Therefore, these projects shall be carried out simultaneously as shown in Table 9-3.
To start each project smoothly and for timely completion until the Olympic games, the following work preparations are essential:
Determination of counterpart agency for each project; and
Financial preparation.
One method for financial preparation is to consider the Olympic budget. Another option is to establish a concessionaire under a public-private partnership (PPP) scheme that will complete and operate the project.
The key milestones to complete the project successfully are as follows:
Financing shall be prepared by the end of 2013.
Tender preparation (e.g., detailed design ) shall be finished by the middle of 2014.
Tender shall start in the middle of 2014.
No. Item Amount (R$) Amount (JPY) Remarks
1 162,000,000 7,564,000,000
1-1
Project Package 1 ITS Center Real Time Traffic/Transport Condition Information Processing Olympic Security and Transport Coordination Center Information Exchange of road operators
66,000,000 3,085,000,000
1-2 Project Package 2 Bus Condition Information Provision
71,000,000 3,326,000,000
1-3Project Package 3 Improvement of Traffic/Transit Operation Center with Essential ITS Equipment atRio Municipality Area
25,000,000 1,153,000,000
2 11,340,000 529,480,000 1. x 7%
3 8,100,000 378,200,000 1. x 5%
4 Price Escalation 4,860,000 226,920,000 1. x 3%
5 Project Cost 186,300,000 8,698,600,000 1.+2.+3.+4.
6 Contingency 18,630,000 869,860,000 5. x 10%
TOTAL PROJECT COST 204,930,000 9,568,460,000 5. +6.
Equipment Procurement and Construction Cost
Consultancy Service (Design and Supervision)
Administration Cost

The Federative Republic of Brazil Study on the Introduction of Intelligent Transport Systems Final Report
9-5
Project Package 1 shall start by the end of 2014.
Overall testing for Project Packages 1, 2, and 3 shall be finished by June 2016.
For the PPP scheme, JICA has a scheme, i.e., public-private partnership feasibility study (PPP-FS), for the procurement of financial resources by utilizing private fund. Following this scheme, the financial resource for the detailed design will be prepared.
Table 9-3 Implementation Plan
Source: JICA Study Team
9.4 PROJECT PACKAGE 1 Project Package 1 consists of the following components:
ITS Center Real Traffic/Transport Condition Information Processing Olympic Security and Transport Coordination Information Exchange of Road Operator
Preparation stageFinance PreparationSelection of Consultant
Procurement stageDetail designTender (Package1)Negotiation/Contract (Package1)Tender (Package2)Negotiation/Contract (Package2)Tender (Package3)Negotiation/Contract (Package3)
Implementation Stage (Package1)Survey/Design ManufacturingInstallation
Implementation Stage (Package2)Survey/Design ManufacturingInstallation
Implementation Stage (Package3)Survey/Design ManufacturingInstallation
Over All Test
1st QT3rd QT
201520133rd QT 4th QT
Item1st QT 2nd QT 3rd QT 4th QT4th QT 2nd QT
2014 20161st QT 2nd QT 3rd QT 4th QT 1st QT 2nd QT
Oly
mpi
cOther Option (PPP case)

The Federative Republic of Brazil Study on the Introduction of Intelligent Transport Systems Final Report
9-6
9.4.1 Grand Design
(1) Objective The objectives of Project Package 1 are summarized as follows:
To collect and gather transport/transit-related data and information of the Rio de Janeiro municipal area in a centralized center (ITS Center);
To process vehicles positioning data (GPS), point data (speed, traffic volume, accident, construction information), transit information (current operation and positioning data), weather (road and area), and disaster information and put them into the GIS engine;
To provide information on all users and devices via web, FM, and digital broadcasting;
To exchange information between the ITS Center and security-related agencies (e.g., CICC) for the expansion and improvement of the function of the ITS Center;
To connect road operators in terms of traffic information;
To enhance essential information provision to road users; and
To ensure smoother traffic flow.
(2) Target Area The target area covered in Project Package 1 is focused on Rio de Janeiro municipal area
considering operability in the short term.
(3) Related Stakeholders There are 30 or more stakeholders related not only with transit/transportation but also with public
safety and meteorological observation. The related stakeholders are summarized as follows:
1) Road-related Agencies/Private Companies
ANTT, DNIT, DER-RJ, CET-RIO, SECONSERVA (Public/Government Company)
CCR Ponte, CCR-Vialagos Autopista Flminense, Lamsa (Private Company)
2) Transit/Transport-related Agencies
SETRANS, DETRO, CODERTE
COR, SMTR
Seaport Authority, Airport Authority

The Federative Republic of Brazil Study on the Introduction of Intelligent Transport Systems Final Report
9-7
3) Transit/Transport Operator
Rio Onibus, Central Coop (Syndicate and Consortium)
FETRANSPOR (Association)
Super VIA, METRO, CCR Barcas
Private Bus Companies
Bus Terminal (Socicam)
Radio Taxi, Chile Taxi, Coopamar (Taxi Companies)
4) Freight Operator
Utilissimo Tranportes LTDA
5) Public Safety Agencies
Civil Defense-SEDEC, SAMU-CBMERJ, BOMBEIRO-CBMERJ, SESEG, SMSDC
6) Weather/Air Pollution Monitoring Agency
INEA-SEA, SIMERJ-SEDEC, SMAC, SMO
7) Digital Broadcaster
Broadcaster (Ex) EBC, TV Globo, SBT, TV RECORD, BAND
(4) Definition of Data/Information to be Gathered and Data Gathering Process
Table 9-4 shows the type of data/information which the ITS Center should gather from each stakeholder. Table 9-5 also shows the gathering process that was clarified through interviews with each stakeholder. In this table, statements in red caption reflect the currently non-existing data or database. Statements in blue caption mean long-term projects. Statements in black caption state that the data/information is currently available.
Table 9-4 Definition of Data/Information Stakeholders Gathered and Collected Data/Information from Each Stakeholder
Road-related Agencies/Private Companies
ANTT -Federal concession road traffic/administrative information DNIT -Federal road traffic/administrative information DER-RJ -State road traffic/administrative information CCR-Vialagos -State road traffic/administrative information CET-RIO -Municipality road traffic/administrative information CCR Ponte -Niteroi Bridge traffic/administrative information Autopista Fluminense -Autopista Fluminense Road traffic/administrative information LAMSA -LAMSA Road traffic/administrative information SECONSERVA -Work zone info with longitude and latitude STP (Via Facil) ETC Operator
-Traffic volume information
Transit/Transport- DETRO -Interstate and intermunicipal bus operating information and GPS-based

The Federative Republic of Brazil Study on the Introduction of Intelligent Transport Systems Final Report
9-8
related Agencies positioning information (will be prepared by DETRO and each bus company)
CODERTE -Bus terminal information -Bus arrival information
Novo Rio (Socicam) -Bus terminal information -Bus arrival information
COR -Weather information, municipal road traffic/administrative information SMTR -Bus operation information from Rio Onibus Airport -Arrival/departure information Seaport -Arrival/departure pier information
Transit/Transport Operator
Rio Onibus -Bus/BRT operational information -Bus/BRT GPS data -Bus frequency information
FETRANSPOR -Bus/BRT stop location information -Bus/BRT lines information (bus network information) -Bus frequency information
Super VIA -Rail operational information -Rail timetable
METRO -METRO operation information -METRO timetable
CCR Barcas -Ferry operation information -Ferry timetable
Private Bus Companies -Bus operation information -Bus GPS data -Bus frequency information
Socicam -Bus terminal operation information -Bus arrival information
Central Coop -Taxi association Taxi Companies Radio Taxi, Chile Taxi, Coopamar
-Taxi GPS data (via Auto Cab, Smart Sys)
Air Operator INFRAERO -Flight information (departure, arrival, delay and accident) -Meteorological information -CCTV monitoring (airport, taxi parking)
Freight Operator Utilissimo Tranportes LTDA
-Freight operation information
Public Safety Agencies
Civil Defense-SEDEC -Emergency information with longitude and latitude SAMU-CBMERJ BOMBEIRO-CBMERJ SESEG SMSDC
Weather/Air Pollution Monitoring Agency
INEA-SEA, -Rain and water level data of rivers -Air pollution data with longitude and latitude
SIMERJ-SEDEC -Weather monitoring and rain monitoring data with longitude and latitude
SMAC -Air pollution data with longitude and latitude SMO (Civil Defense ALERTA Rio )
-Weather monitoring and rain monitoring data with longitude and latitude

The Federative Republic of Brazil Study on the Introduction of Intelligent Transport Systems Final Report
9-9
Table 9-5 Data Gathering Process Stakeholders Data Detail
Road-related Agencies/Private Companies
ANTT In the long term (due to lack of ITS equipment at present)
In the long term (due to lack of ITS equipment at present)
DNIT OCR (some) Point speed data (with longitude and latitude)
Autopista Fluminense 101 –Upcoming road to RJM-
CCTV Video (107) CCTV motion picture *Traffic volume *Point speed data (with longitude and latitude)
VMS (8) Condition of information provision (with longitude and latitude)
Mobile VMS (5) Condition of information provision (with longitude and latitude)
Speed Gun (23) Point speed data (with longitude and latitude)
MOE (2) Meteorological (with longitude and latitude)
GPS-Maintenance Vehicle Condition of distribution (with longitude and latitude)
Accident Information Accident point, section, level, and on time situation (with longitude and latitude)
Work Zone Information Work zone point, section, roadwork period (with longitude and latitude)
CCR-Ponte -Upcoming road to RJM-
CCTV Video (28) CCTV motion picture *Traffic volume *Point speed data (with longitude and latitude)
VMS (6) Condition of information provision (with longitude and latitude)
Mobile VMS (2 or 3) Condition of information provision (with longitude and latitude)
OCR (some) Point speed data (with longitude and latitude)
MOE (some) Meteorological (with longitude and latitude)
GPS-Maintenance Vehicle Condition of distribution (with longitude and latitude)
Accident Information Accident point, section, level, and on-time situation (with longitude and latitude)
Work Zone Information Work zone point, section, roadwork period (with longitude and latitude)
DER -Upcoming Road to RJM-
CCTV Video (12) CCTV motion picture *Traffic volume *Point speed data (with longitude and latitude)
VMS (5) Condition of information

The Federative Republic of Brazil Study on the Introduction of Intelligent Transport Systems Final Report
9-10
provision (with longitude and latitude)
OCR (32) Point speed data (with longitude and latitude)
Speed Gun (32+110+15+5) Point speed data (with longitude and latitude)
Traffic Count (5) Point traffic volume (with longitude and latitude)
Accident Information Accident point, section, level, and on-time situation (with longitude and latitude)
Work Zone Information Work zone point, section, roadwork period (with longitude latitude)
CCR-Vialagos –State Concessionaire Road-
In the long term (not included in Rio Municipality)
In the long term (not included in Rio Municipality)
LAMSA -Municipality Road Concessionaire-
CCTV Video (23)
CCTV motion picture *Traffic volume *Point speed data (with longitude and latitude)
VMS (4) Condition of information provision (with longitude and latitude)
Mobile VMS (2) Condition of information provision (with longitude and latitude)
Lane Signal (3) Lane signal provision condition (with longitude and latitude)
Air Pollution Observation Equipment (3)
Air pollution information (with longitude and latitude)
GPS-Maintenance Vehicle Condition of distribution (with longitude and latitude)
Accident Information Accident point, section, level, and on-time situation (with longitude and latitude)
Work Zone Information Work zone point, section, roadwork period (with longitude and latitude)
CET-Rio-Municipality Road- ESE
CCTV Video (705) CCTV motion picture *Traffic volume *Point speed data (with longitude and latitude)
VMS (34) Condition of information provision (with longitude and latitude)
Mobile VMS (14) Condition of information provision (with longitude and latitude)
Speed Gun (387) Point speed data (with longitude and latitude)
OCR (Many) Sectional travel speed data (with longitude and latitude)
Accident Information Accident point, section, level, and on-time situation (with longitude and latitude)
SECONSERVA
Work Zone Information Work zone point, section, roadwork period

The Federative Republic of Brazil Study on the Introduction of Intelligent Transport Systems Final Report
9-11
(with longitude and latitude) STP (Via Facil) -ETC Operator-
ETC Traffic Data Traffic volume data (with longitude and latitude)
Transit/Transport-related Agencies
DETRO Bus Stop Information Bus stop/terminal information (with longitude and latitude)
BUS GPS DATA (INTER)
Bus location information Bus lane
Indicator for checking performance of concessionaires
Concessionaire performance information
CODERTE
Bus Terminal Monitoring CCTV
Bus stop/terminal information (with longitude and latitude)
Bus Departure Information Bus departure information Socicam
Bus Terminal Monitoring CCTV
Bus stop/terminal information (with longitude and latitude)
SMTR
Indicator for checking the performance of concessionaires
Concessionaire performance information
Seaport Pier Arrival/Departure Information
Pier number in which ships depart from and arrive at
Airport CCTV Data CCTV motion picture data (with longitude and latitude or ID)
Arrival/Departure Information
Gate No., arrival/departure time and operational information (check-in, boarding, delay, etc.)
Transit/Transport Operator
Rio Onibus
Bus/BRT Stop Location Information
Bus/BRT stop location information for calculating arrival information of buses (with longitude and latitude)
Bus/BRT GPS Data Bus/BRT GPS information for calculating arrival information of buses. Also utilized for checking the performance of concessionaires (with longitude and latitude)
Bus Frequency Information Bus/BRT line information for calculating arrival information of buses. Also utilized for checking the performance of concessionaires for each line
CCTV Static Data Photo data (with longitude and latitude)
Private Bus Companies
Bus/BRT Stop Location Information
Bus/BRT stop location information for calculating arrival information of buses (with longitude and latitude)
Bus/BRT GPS Data Bus/BRT GPS information for calculating arrival information of buses. Also utilized for checking the performance of concessionaires (with longitude and latitude)
Bus Frequency Information Bus/BRT line information for calculating arrival information of

The Federative Republic of Brazil Study on the Introduction of Intelligent Transport Systems Final Report
9-12
buses. Also utilized for checking the performance of concessionaires for each line
CCTV Static Data Photo data (with longitude and latitude)
FETRANSPORT
Bus/BRT Stop Location Information
Bus/BRT stop location information for calculating arrival information of buses (with longitude and latitude)
-Bus/BRT Line Information (Bus Network Information)
Bus/BRT line information for calculating arrival information of buses. Also utilized for checking the performance of concessionaires (with longitude and latitude)
Bus Frequency Information Bus/BRT line information for calculating arrival information of buses. Also utilized for checking the performance of concessionaires for each line
Super VIA
CCTV Data CCTV motion picture data (with longitude and latitude or ID)
Rail Operation Information Delay, accident information (with longitude and latitude or section information)
Rail Timetable Information Timetable information METRO
CCTV Data CCTV motion picture data (with longitude and latitude or ID)
METRO Operation Information
Delay, accident information (with longitude and latitude or section information)
METRO Timetable Information
Timetable information
CCR Barcas
CCTV Data CCTV motion picture data (with longitude and latitude or ID)
Ferry Operation Information GPS data and operation information
Ferry Timetable Information Timetable information
Central Coop-Association of Taxi Companies-
None None
Taxi Companies - Radio Taxi - Chile Taxi - Coopamar
Taxi GPS Data *From Auto Cab, Smart Sys, etc.
Real-time congestion information with link
Airport CCTV Data CCTV motion picture data (with longitude and latitude or ID)
Arrival/Departure Information
Gate No.,,arrival/departure time, and operation information (check-in, boarding, delay, etc.)

The Federative Republic of Brazil Study on the Introduction of Intelligent Transport Systems Final Report
9-13
MOE Meteorological data on time (with longitude and latitude)
Freight Operator Utilissimo Tranportes LTDA
Cargo GPS Information Real-time congestion information with link
Public Safety Agencies -Civil Defense SESEC -SAMU-CBMERJ -BOMBEIROCBMERJ -SESEG -SMSDC
Data gathered at CICC shall be integrated
Data gathered at CICC shall be integrated
Weather/Air Pollution Monitoring Agency
INEA-SEA
Rain Gauge (11) Water Level Gauge (11) SOx, NOx, PM (37) Thermometer (37)
Rain, water level, SOx, Nox, PM, thermometer data on time (with longitude and latitude)
SIMERJ
Rain Gauge (11) Anemovane (11) Thermometer (11) Hygrometer (11) Aerotonometer (11) Solar Meter (11)
Rain, wind, temperature, humidity, atmosphere, solar data on time (with longitude and latitude)
SMAC Monitorar Rio SO2, NOx, PM10, O3, NO2 (8)
SO2, NOx, PM10, O3, NO2, air pollution data on time (with longitude and latitude)
SMO (Civil Defense ALERTA Rio)
Rain Gauge (31) Anemovane (2) Thermometer (2) Hygrometer (2) Aerotonometer (2) Solar Meter (2)
Rain, wind, temperature, humidity, atmosphere, solar data on time (with longitude and latitude)

The Federative Republic of Brazil Study on the Introduction of Intelligent Transport Systems Final Report
9-14
The gathered data shown in Table 9-5 above can be summarized in Table 9-6 as follows:
Table 9-6 Categorizing the Processed Data No. Input Data Processed Data at ITS Center Remark 1 CCTV Video (R) 1 Real-time road traffic volume
data Motion Picture Analysis (MPA)
Traffic volume data will be utilized for obtaining traffic conditions such as incoming and outgoing traffic, and hourly and daily traffic.
2 CCTV Video (R) 2 Real-time traffic speed data MPA This data shall be integrated with the probe data (No.13, 14, 15, 16, and 17).
3 VMS Information provision condition
Gathering information regarding provision condition in real time
4 Mobile VMS Information provision condition
Gathering information regarding provision condition in real time
5 OCR 1 Real-time traffic sectional speed data
This data shall be integrated with the probe data (No.13, 14, 15, 16, and 17).
6 OCR 2 Real-time traffic volume data Traffic volume data will be utilized for obtaining traffic conditions such as incoming and outgoing traffic density, and hourly and daily traffic.
7 Speed Gun Real-time traffic point speed data
This data shall be integrated with the probe data (No.13, 14, 15, 16, and 17).
8 Traffic Count Real-time traffic volume data Traffic volume data will be utilized for obtaining traffic conditions, such as incoming and outgoing traffic, and hourly and daily traffic .
9 Accident
Real-time accident incidence information
Accident information shall be provided on time such as location, category, level, and condition. This will be utilized for real-time traffic information.
10 Work Zone Information on work zone conditions
Work zone information shall be provided in advance such as location, category, level, and condition. This will be utilized for real-time traffic information.
11 Lane Signal Lane signal information To know the regulations of traffic direction in real time
12 ETC ETC-based real-time traffic data
Traffic volume data will be utilized for obtaining traffic conditions such as incoming and outgoing traffic, and hourly and daily traffic.
13 GPS-Maintenance Vehicle
GPS positioning data of maintenance vehicle
For the public Data shall be processed for checking the operating performance for agencies. A performance checking report shall be generated automatically, hourly, daily, and monthly.
14 GPS-Taxi GPS positioning data of taxi For the public and users Data shall be processed as real-time traffic congestion information, which is integrated with the point speed data and real-time traffic data.
Note: Taxi status data shall also be gathered in the ITS Center such as wiper movement information, with or without passenger, etc.
15 GPS-Bus GPS positioning data of bus For the public Data shall be processed for checking the operating performance for agencies. A performance checking report shall be generated automatically, hourly, daily, and monthly.
For users The data shall be processed as real-time traffic

The Federative Republic of Brazil Study on the Introduction of Intelligent Transport Systems Final Report
9-15
congestion information, which is integrated with the point speed data and real-time traffic data. Bus arrival information shall be calculated using digital road maps, line data of buses, terminal and bus stops, XY data, GPS online data and congestion data in real time generated by data number no. 14 and 15.
16 GPS-BRT GPS positioning data of BRT For the public Data shall be processed for checking the operating performance for agencies. A performance checking report shall be generated automatically, hourly, daily, and monthly.
For the users (some parts are already done) Bus arrival information shall be calculated using digital road maps, line data of buses, and terminal XY data.
17 GPS-Cargo Cargo GPS information For the public and users Data shall be processed as real-time traffic congestion information, which is integrated with the point speed data and real-time traffic data.
18 Flight Information Flight information Flight departure, arrival, delay and accident information
19 CCTV Video of Taxi Parking at Airport
Taxi demand and supply information
Installed CCTV images at taxi parking area shall be gathered for monitoring the current demand and supply status of taxis at the airport
20 CCTV Video at Transit-Public Transportation-
CCTV information for monitoring current condition
Installed CCTV images at public areas shall be gathered for monitoring the current conditions at public spaces for safety purposes
21 Air Pollution Data Real-time air pollution data Air pollution data shall be utilized to assess the effect of traffic on the air.
22 Weather Data Real-time weather data Real-time weather information shall be provided to users on time.
23 River Level data Real-time river level data Real-time river level information shall be provided to users on time.
The Federative Republic of Brazil Study on the Introduction of Intelligent Transport Systems Final Report
9-16
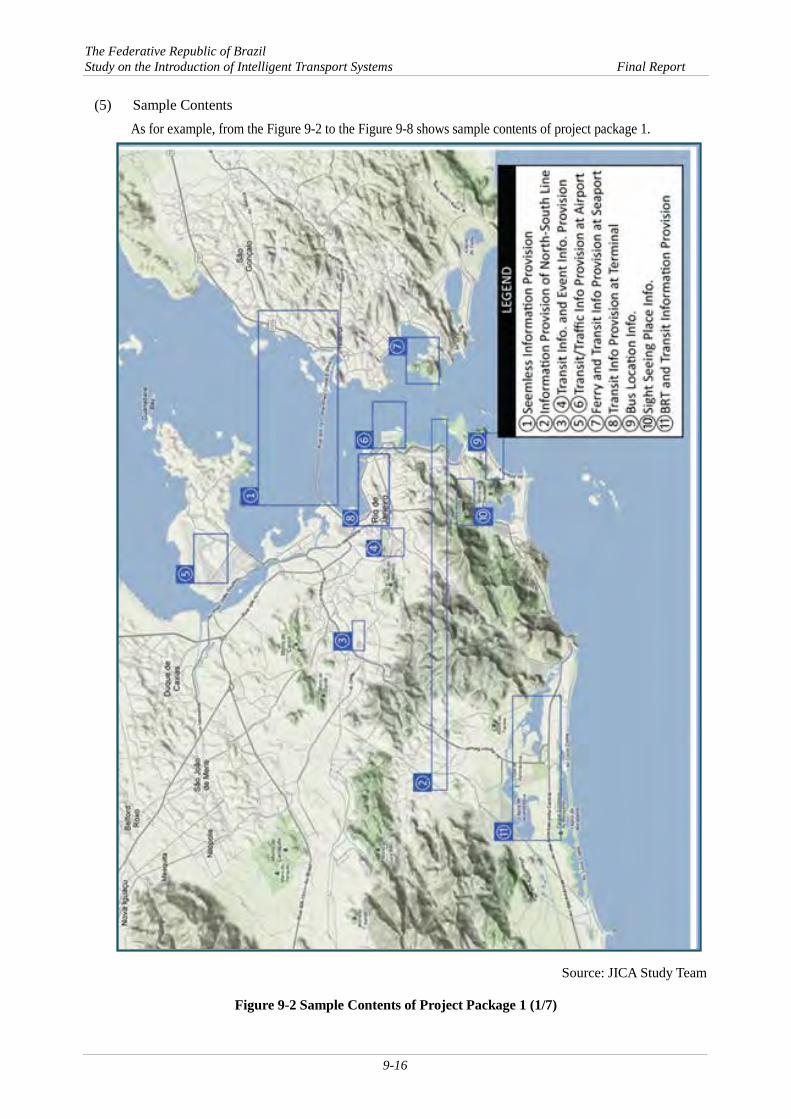
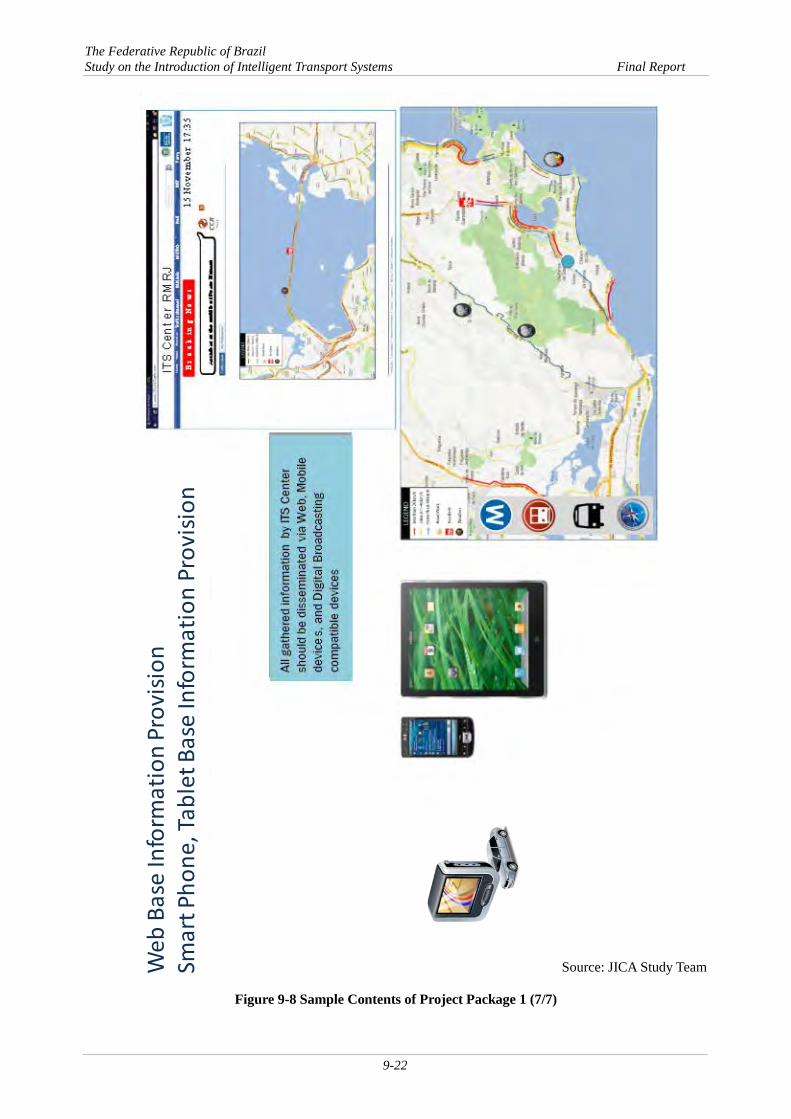
(5) Sample Contents As for example, from the Figure 9-2 to the Figure 9-8 shows sample contents of project package 1.
Source: JICA Study Team
Figure 9-2 Sample Contents of Project Package 1 (1/7)

The Federative Republic of Brazil Study on the Introduction of Intelligent Transport Systems Final Report
9-17
Source: JICA Study Team
Figure 9-3 Sample Contents of Project Package 1 (2/7)
①Se
amle
ssIn
form
atio
n Pr
ovisi
on(a
t sev
eral
road
ope
rato
rs ju
risdi
ctio
nal a
rea)
ITS
Cen
ter
Wor
k Zo
ne
Dat
aA
ccid
ent
Dat
aD
ata
Serv
er a
t IT
S ce
nte
r
Vol
um
e a
nd
Sp
eed
Dat
aG
PS D
ata
Met
rolo
gica
l Dat
a
Text
Info
Web
bas
e In
foA
PP b
ase
info
DB
bas
e In
fo
1
1
32
23
3
4
4
5
5
Map
bas
e In
fo

The Federative Republic of Brazil Study on the Introduction of Intelligent Transport Systems Final Report
9-18
Source: JICA Study Team
Figure 9-4 Sample Contents of Project Package 1 (3/7)
IT
S C
ente
r ca
n pr
ovid
e a
rout
e in
form
atio
n ba
sed
upon
the
pro
cess
ed r
eal -t
ime
cong
estio
n da
ta. D
rive
rs c
an d
ecid
e th
e fa
stes
t w
ay
dest
inat
ion.
②In
form
atio
nPr
ovisi
onN
orth
and
Sout
hLin
e

The Federative Republic of Brazil Study on the Introduction of Intelligent Transport Systems Final Report
9-19
Source: JICA Study Team
Figure 9-5 Sample Contents of Project Package 1 (4/7)
③④
Tran
sitan
dEv
entI
nfor
mat
ion
Prov
ision
atVe
nues

The Federative Republic of Brazil Study on the Introduction of Intelligent Transport Systems Final Report
9-20
Source: JICA Study Team
Figure 9-6 Sample Contents of Project Package 1 (5/7)
⑤⑥
Tran
sitan
dTr
affic
Info
rmat
ion
Prov
ision
atAi
rpor
t⑦
Ferr
yan
dTr
ansit
Info
rmat
ion
Prov
ision
atSe
apo
rt⑧
Tran
sitin
form
atio
nPr
ovisi
onat
Term
inal
⑨Bu
sLoc
atio
nIn
form
atio
nPr
ovisi
on,
⑩Si
ghts
eein
gPl
ace
Info
rmat
ion
Prov
ision
⑪BR
Tan
dTr
ansit
Info
rmat
ion
Prov
ision

The Federative Republic of Brazil Study on the Introduction of Intelligent Transport Systems Final Report
9-21
Source: JICA Study Team
Figure 9-7 Sample Contents of Project Package 1 (6/7)
The Federative Republic of Brazil Study on the Introduction of Intelligent Transport Systems Final Report
9-22
Source: JICA Study Team
Figure 9-8 Sample Contents of Project Package 1 (7/7)
Web
Base
Info
rmat
ion
Prov
ision
Smar
tPho
ne,T
able
tBas
eIn
form
atio
nPr
ovisi
on

The Federative Republic of Brazil Study on the Introduction of Intelligent Transport Systems Final Report
9-23
9.4.2 Basic Design
(1) Basic Requirement 1) Equipment
The ITS Center consists of several components which manage the system entirely and encourage data exchange with the stakeholder. The basic requirements of the ITS Center are as follows:
The ITS Center system shall gather all necessary information on a real-time basis. The ITS Center system shall store the gathered and processed data into the database so
that each data can be utilized as statistics. The ITS Center system shall be able to provide processed information through
terrestrial digital broadcasting and internet to users who have mobile phones, smart phones or personal computers.
The ITS Center system shall be able to monitor and manage the operational status of the equipment subsystem which is installed by each stakeholder.
The ITS Center system shall operate continuously, 24 hours a day and 7 days a week, with a redundant system configuration.
Each stakeholder shall be provided with a function to change the format of the information gathered by their subsystem. The information shall be made into a common protocol (NTCIP) to integrate the information into the ITS Center.
2) Network
It is essential to secure a reliable communication infrastructure between the ITS Center and the stakeholders for gathering and distributing real-time information.
The INFOVIA Network is a governmental communication infrastructure administered by PRODERJ of the Rio de Janeiro State Government. The network also has high reliability and stability. The INFOVIA Network is considered a reasonable and appropriate communication infrastructure to exchange information between the ITS Center and the stakeholders.

The Federative Republic of Brazil Study on the Introduction of Intelligent Transport Systems Final Report
9-24
Source: JICA Study Team
Figure 9-9 Conceptual Diagram of Communication Network
(2) Essential Equipment and Functional Requirement The essential equipment for the ITS Center were classified into:
Data Gathering System
Data Storage System
Processing System
Distribution System
Monitoring System
Power Supply System
A new building for the ITS Center is also required to securely install the equipment.
The essential equipment and functional requirement are shown in Table 9-7. The quantity of the equipment specified in Table 9-7 is aggregated as shown in Table 9-8.

The Federative Republic of Brazil Study on the Introduction of Intelligent Transport Systems Final Report
9-25
Table 9-7 Essential Equipment and Functional Requirement Class Essential
Equipment Functional Requirement
Data Gathering System
Data Gathering Server
[Functional Requirement] The server shall be deployed in each agency to gather essential data
for ITS Center operation. The data shall be changed into the NTCIP as a standard protocol to assure interoperability and interchangeability between the ITS Center and the stakeholders.
Information security measures such as firewall shall be prepared [Hardware Configuration] Rack-mounted server for the ITS Center Tower-type server for the stakeholders [Installation Location] Total: 30 sets
ITS Center: 1 set 29 Stakeholders: 1 set each
For data gathering servers installed in the 29 stakeholders, modification of existing system in each stakeholder shall be conducted to send the information to the data gathering server.
Data Storage System
Probe Data Storage Server
[Functional Requirement] The server shall contain all probe-related data for real-time
processing of traffic congestion information and past mining data. In addition, it is important that weather information, incident information and event information are tagged and stored as past probe data to conduct data mining process. Basically, the server shall gather the following items:
Taxi, Bus, and BRT GPS information - X,Y,Z geocoding data - Velocity and acceleration - Date, weather, and incidents (if possible)
The server shall store the data and information for at least 2 years and shall be able to backup the data in an external storage device.
[Hardware Configuration] Rack-mounted server [Installation Location] ITS Center: 1 set
Point Data Server [Functional Requirement] The probe data above shows congestion information as line data after
processing. Point data can show point speed and traffic volume at a specific location in terms of traffic.
The server stores not only traffic data but also the following data: - Point speed data (from OCRs or speedometers) - Traffic volume data (from OCRs or speedometers) - Meteorological data - Air pollution data - Field equipment condition such as VMS, arrow signals at
tunnels The server shall store data and information for at least 2 years and be
able to make a backup in an external storage device. [Hardware Configuration]

The Federative Republic of Brazil Study on the Introduction of Intelligent Transport Systems Final Report
9-26
Rack-mounted server [Installation Location] ITS Center: 1 set
Transit Data Server
[Functional Requirement] The role of the transit data server is to store all public
transportation-related information as follows: - Route/lines - Frequency/timetable - Fare - Contact information
[Hardware Configuration] Rack-mounted server [Installation Location] ITS Center: 1 set
Incident Monitoring Data Server
[Functional Requirement] The server shall store incident information via traffic/transportation
operators, road maintenance agencies or companies, and security monitoring agencies including the following: - Accident (type, location, duration) - Work zone (type, location, duration) - Disaster (type, location, level, duration)
The abovementioned data should be geocoded. The server shall store the data and information for at least 2 years and
be able to make a backup in an external storage device. [Hardware Configuration] Rack-mounted server [Installation Location] ITS Center: 1 set
Weather Monitoring Server
[Functional Requirement] Geocoded weather data shall be stored by the server. The server shall
gather and store the following data from related agencies: - Weather - Meteorological warning message
[Hardware Configuration] Rack-mounted server [Installation Location] ITS Center: 1 set
CCTV Data Server
[Functional Requirement] The server shall store fixed-type CCTV data on road network for
obtaining real-time velocity, traffic volume, and density of specific road network location. Other CCTV data shall be monitored at the ITS Center, although not necessary stored as database.
The server shall store the data and information for at least 2 years and be able to make a backup in an external storage device.
[Hardware Configuration] Rack-mounted server

The Federative Republic of Brazil Study on the Introduction of Intelligent Transport Systems Final Report
9-27
[Installation Location] ITS Center: 1 set
Processing System
Velocity Information Generating Server
[Functional Requirement] The server shall generate real-time velocity information on the road
network from several sources such as probe data, past probe data, point traffic, and speed data.
The server shall have the following functions: - Map matching function for GPS point data - Converting function from point to line data - Average speed calculating function from traffic volume and
speed based on traffic engineering theory - Data mining function from past data - Data fusion function of real-time data and past data
[Hardware Configuration] Rack-mounted server [Installation Location] ITS Center: 1 set
Traffic Volume Processing Server
[Functional Requirement] The server shall process real-time aggregated traffic volume. The
aggregation process shall be conducted for a certain period of time such as: - Per minute - Per 5 minutes - Per 60 minutes - Per 12 hours - Per 24 hours
All processed data should be tagged with geocoded data to monitor incoming/outgoing volume in the monitoring area to grasp current traffic condition.
[Hardware Configuration] Rack-mounted server [Installation Location] ITS Center: 1 set
Motion Picture Analysis Server
[Functional Requirement] The server shall process motion picture analysis on fixed CCTVs to
obtain real-time traffic volume and its aggregation. The aggregation process shall be conducted for a certain period of time such as: - Per minute - Per 5 minutes - Per 60 minutes - Per 12 hours - Per 24 hours
All processed data should be tagged with geocoded data to monitor incoming/outgoing volume in the monitoring area to grasp the current traffic condition.
As a result of motion picture analysis, the speed data of certain sections of the road can also be obtained. These data shall be integrated as point volume/speed data to analyze real-time traffic congestion monitoring by velocity information generating server

The Federative Republic of Brazil Study on the Introduction of Intelligent Transport Systems Final Report
9-28
[Hardware Requirement] Rack-mounted server [Installation Location] ITS Center: 1 set
Bus Arrival Information Calculation Server
[Functional Requirement] The server shall calculate the next bus arrival information based on
bus GPS information and real-time traffic information which is generated by the velocity information generating server.
If there is no congestion on the road network, the calculation shall be conducted using the regulatory speed and distance of the next bus stop from the current position.
[Hardware Configuration] Rack-mounted server [Installation Location] ITS Center: 1 set
Fixed Route Travel Time Calculation Server
[Functional Requirement] The server shall calculate real-time travel time information on several
important fixed routes on the road network,considering the real-time traffic congestion situation calculated by the velocity information generating server.
If there is no congestion on the road network, the calculation shall be conducted using the regulatory speed and distance of the starting point of the fixed route.
[Hardware Requirement] Rack mount type [Installation Location] ITS Center: 1 set
Weather Information Processing Server
[Functional Requirement] The server shall provide weather information with geocoded data,
chart and graphs. [Hardware Configuration] Rack-mounted server [Installation Location] ITS Center: 1 set
Incident Information Processing Server
[Functional Requirement] The server shall provide incident information with geocoded data,
chart and graphs. If there is CCTV near the incident, CCTV information shall be viewed on the monitoring display.
[Hardware Requirement] Rack-mounted server [Installation Location] ITS Center: 1 set
Report Generating Server
[Functional Requirement] The server shall generate daily and monthly reports depending on the

The Federative Republic of Brazil Study on the Introduction of Intelligent Transport Systems Final Report
9-29
–Concessionaires Monitoring -
contract. [Hardware Configuration] Rack-mounted server [Installation Location] ITS Center: 1 set
Distribution System
GIS Server [Functional Requirement] The server shall provide the following:
- Digital road map (basic map) - Digital road map (with arrow to provide traffic congestion) - Equipment location and current information provision situation
map - Real-time congestion information map - Real-time incident information map (accidents, work zone, and
disaster) - Real-time weather information map - Real-time public transport situation information map - Fixed important routes travel time information map
[Hardware Configuration] Rack-mounted server [Installation Location] ITS Center: 1 set
Web Server [Functional Requirement] The server shall provide web contents of ITS information upon the
request of clients using hyper text transfer protocol (HTTP). Information security measures such as firewall shall be prepared. [Hardware Configuration] Rack-mounted server [Installation Location] ITS Center: 1 set
Digital Broadcasting Data Converting Server
[Functional Requirement] The server shall enable the users to receive the ITS information
processed in the ITS Center through their mobile/smart phones with one-seg tuner or digital television with full-seg tuner.
The format of the contents to be broadcasted to the users will be Ginga-NCL, which is the standard specification on data broadcasting for Brazilian Terrestrial Digital TV. The contents shall be delivered to the broadcaster and treated as input of their broadcasting.
Information security measures such as firewall shall be prepared. [Hardware Configuration] Rack-mounted server [Installation Location] ITS Center: 1 set
Information Sharing Console
[Functional Requirement] The console shall access the web server to display processed
information such as: - Seamless traffic condition information
The Federative Republic of Brazil Study on the Introduction of Intelligent Transport Systems Final Report
9-30
- Route information based on processed real-time congestion - Transport information - Transit information - Bus location information - Weather information - Air pollution information
[Hardware Configuration] Desktop computer: 1 set [Installation Location] 78 stakeholders: 1 set each
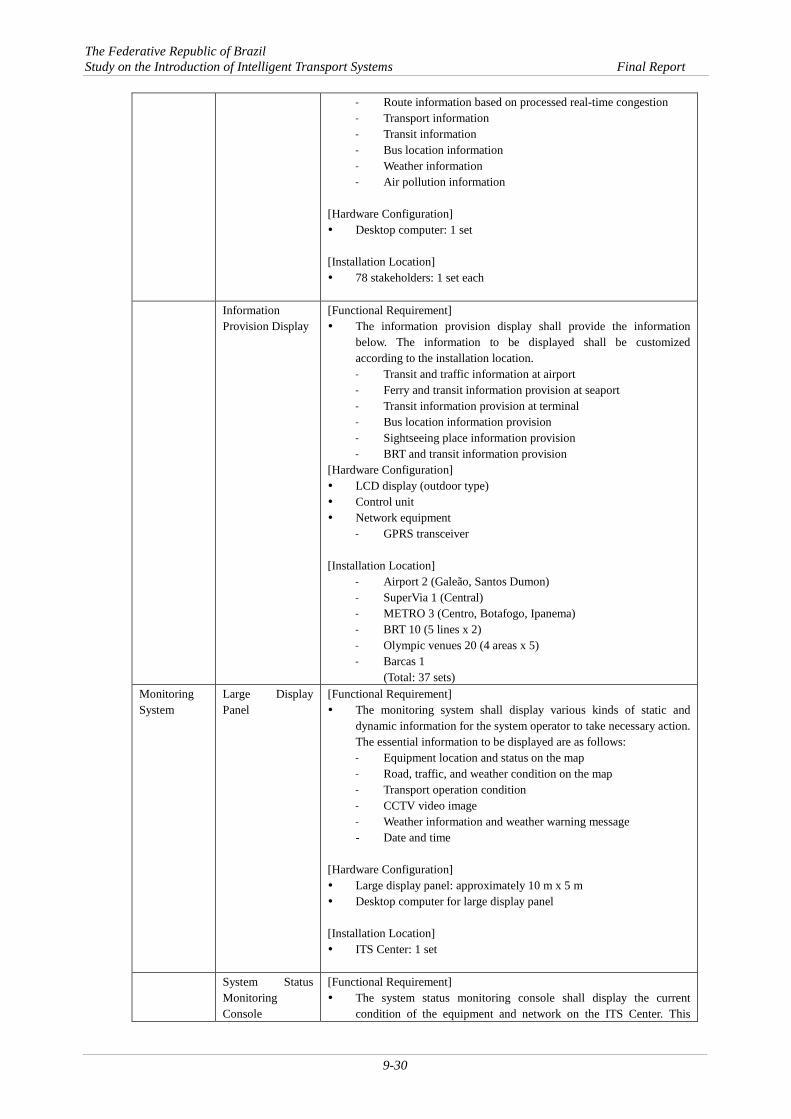
Information Provision Display
[Functional Requirement] The information provision display shall provide the information
below. The information to be displayed shall be customized according to the installation location. - Transit and traffic information at airport - Ferry and transit information provision at seaport - Transit information provision at terminal - Bus location information provision - Sightseeing place information provision - BRT and transit information provision
[Hardware Configuration] LCD display (outdoor type) Control unit Network equipment
- GPRS transceiver [Installation Location]
- Airport 2 (Galeão, Santos Dumon) - SuperVia 1 (Central) - METRO 3 (Centro, Botafogo, Ipanema) - BRT 10 (5 lines x 2) - Olympic venues 20 (4 areas x 5) - Barcas 1
(Total: 37 sets) Monitoring System
Large Display Panel
[Functional Requirement] The monitoring system shall display various kinds of static and
dynamic information for the system operator to take necessary action. The essential information to be displayed are as follows: - Equipment location and status on the map - Road, traffic, and weather condition on the map - Transport operation condition - CCTV video image - Weather information and weather warning message - Date and time
[Hardware Configuration] Large display panel: approximately 10 m x 5 m Desktop computer for large display panel [Installation Location] ITS Center: 1 set
System Status Monitoring Console
[Functional Requirement] The system status monitoring console shall display the current
condition of the equipment and network on the ITS Center. This

The Federative Republic of Brazil Study on the Introduction of Intelligent Transport Systems Final Report
9-31
system shall detect device failure and communication failure, and inform them to the operator in the ITS Center
[Hardware Configuration] Desktop computer for system status monitoring [Installation Location] ITS Center: 1 set
Power Supply System
[Functional Requirement] The power supply system shall provide reliable and stable electric
power to the equipment of the ITS Center. The system consists of an uninterrupted power supply (UPS) and a diesel engine generator. The UPS shall compensate stable power supply to the equipment when commercial power is down.
[Hardware Configuration] UPS for server room Diesel engine generator [Installation Location] ITS Center: 1 set
ITS Center (Physical)
[Functional Requirement] The center shall provide a secured space with air conditioning to
install the following equipment: - Servers and network equipment in the server room - Operation consoles in the operation room - UPS in the power supply room
Total floor area is assumed at approximately 30 m x 30 m.
Source: JICA Study Team

The Federative Republic of Brazil Study on the Introduction of Intelligent Transport Systems Final Report
9-32
Table 9-8 Quantity of Essential Equipment
Source: JICA Study Team
Air
Ope
rato
r
Freig
htO
pera
tor
Publ
icSa
fety
Age
ncy
ANTT
DNIT
DER-RJ
CET-RIO
CCR-PonteAutopista
Fluminense
Lamsa
SECONSERVA
DETRO
CODERATE
NovoRio (Sosicam)
COR
SMTR
Airport
Seaport
Rio OnibusPrivate BusCompany
FETRANSPORT
SuperVia
METRO
CCR-Barcas
Central Coop
Radio Taxi
Chile Taxi
Coopamar
INFRAERO
UtilissimoTransports LTDA
CICC
INEA-SEA
SIMERJ
SMAC
ALERTA Rio
Dat
a G
athe
ring
Syste
mD
ata
Gat
herin
g Se
rver
11
11
11
11
11
11
11
11
11
11
11
11
11
11
11
30
Prob
e D
ata
Stor
age
Serv
er1
1
Point
Dat
a Se
rver
11
Tran
sit D
ata
Serv
er1
1
Incid
ent M
onito
ring
Dat
a Se
rver
11
Wea
ther
Mon
itorin
g Se
rver
11
CC
TV D
ata
Ser
ver
11
Velo
city
infor
mat
ion
Gen
erat
ing S
erve
r1
1
Traf
fic V
olum
e Pr
oces
sing
Serv
er1
1
Mot
ion
Pict
ure
Ana
lysis
Serv
er1
1
Bus A
rriva
l Inf
orm
atio
n C
alcula
tion
Serv
er1
1
Fixe
dRo
ute
Trav
elTi
me
Calc
ulatio
nSe
rver
11
Wea
ther
Info
rmat
ion
Proc
essin
g Se
rver
11
Incid
ent I
nfor
mat
ion
Proc
essin
g Se
rver
11
Repo
rt G
ener
ating
Ser
ver
11
GIS
Ser
ver
11
WEB
Ser
ver
11
Digi
tal
Broa
dcas
ting
Dat
aC
onve
rting
Serv
er1
1
Info
rmat
ion
Shar
ingC
onso
lefo
rsta
keho
lder
s1
11
11
11
11
11
11
11
146
11
11
11
11
21
11
11
178
Info
rmat
ion
Prov
ision
Disp
lay a
t site
21
310
201
37
Larg
e D
isplay
Pan
el1
1
Syste
m S
tatu
s Mon
itorin
g C
onso
le1
1
Unin
terru
pted
Pow
er S
uppl
y1
1
Dies
el En
gine
Gen
erat
or1
1
ITS
Cen
ter (
Phys
ically
)1
1
Dist
ribut
ion
Syste
m
Total
Stak
ehol
der's
offi
ce o
r CC
O
Road
Rela
ted
Age
ncies
/Priv
ate
Com
panie
sTr
ansit
/Tra
nspo
rt Re
lated
Age
ncies
Tran
sit/T
rans
port
Ope
rato
r
Mon
itorin
g sy
stem
METRO Station
Olympic Venue
CCR Barcas Port
Dat
a St
orag
e Sy
stem
Pow
er S
uppl
y Sy
stem
Wea
ther
/Air
pollu
tion
Age
ncy
Syste
mSe
rver
BRT Station
ITS Center
Site
Airport
SuperVia Station
Proc
essin
g Sy
stem
This
is a
quan
tity o
f in
ner c
ity b
us
com
pani
es w
hich
bel
ong t
o R
io o
nibu
s
Dat
a Gat
herin
g Ser
ver i
n D
ETR
O sh
all
colle
ct t
he in
form
aito
n of
inte
rcity
bu
ses f
rom
inte
rcity
bus
copa
nies
.
Gal
eão
Aip
ort
Sant
os D
umon
Airp
ort
Bra
kedo
wno
f ab
ove q
uant
itis i
s re
ffere
d to
Tab
le 8
-7.

The Federative Republic of Brazil Study on the Introduction of Intelligent Transport Systems Final Report
9-33
(3) System Diagram The system diagram of Project Package 1 is shown in Figure 9-10. In Project Package 1, the
stakeholders transmit their information to the ITS Center through the INFOVIA Network. The ITS Center organizes the integrated information to provide it to users through various kinds of communication method such as the internet, smart phone, digital broadcasting, etc. The integrated information is also returned back to each stakeholder through web browsing on a personal computer (information sharing console) in Project Package 1.
Source: JICA Study Team
Figure 9-10 System Diagram of ITS Center and Related Systems
(4) Data Flow
i) Data Gathering Process for the ITS Center Figure 9-11 shows the flow of data gathering from the stakeholders. The stakeholders have
subsystems to manage their equipment. The information are then transmitted to the ITS Center through the INFOVIA Network. In order to transmit the information gathered by their subsystems, data gathering server shall be installed at each stakeholder for changing the format of the information from the subsystems into the NTCIP.

The Federative Republic of Brazil Study on the Introduction of Intelligent Transport Systems Final Report
9-34
Source: JICA Study Team
Figure 9-11 Flow of Data Gathering

The Federative Republic of Brazil Study on the Introduction of Intelligent Transport Systems Final Report
9-35
ii) Data Processing Flow in the ITS Center Data processing flow in the ITS Center is shown in Figure 9-12. Raw data such as GPS data
from probe cars, CCTVs, and speed meters, as well as point speed data and point traffic data from OCRs shall be forwarded to the processing system to calculate the average speed, density, real-time traffic congestion, and real-time travel time information. These processed information shall be utilized in the calculation of bus arrival information and fixed route travel time information. All processed data shall be geocoded for mapping its layout in the GIS server. The data storage system shall store and archive raw and past data. Such data shall be fed back for calculation of real-time traffic congestion information.

The Federative Republic of Brazil Study on the Introduction of Intelligent Transport Systems Final Report
9-36
Source: JICA Study Team
Figure 9-12 Flow of Data Processing
Data
Ga
ther
ing
Serv
er
Prob
e Dat
a St
orag
e Ser
ver
Poin
t Dat
a Ser
ver
Tran
sit D
ata
Serv
er
Repo
rt Ge
nera
ting
Serv
er
(Con
cess
iona
ires
Moni
torin
g)
Wea
ther
Mo
nito
ring
Serv
er
Traf
fic V
olum
e Pr
oces
sing
Serv
er
Bus A
rriva
l In
form
atio
n Se
rver
Incid
ent
Info
rmat
ion
Proc
essin
g Se
rver
GIS
Seve
r
Web
Ser
ver
Digi
tal
Broa
dcas
ting
Data
Co
nver
ting
Se
rver
Bus G
PS da
ta
Velo
city
Info
rmat
ion
Gath
erin
g Se
rver
Real
Time T
raffic
Volu
me
Bus
Loca
tion
Infor
matio
n
Aggr
egate
d in
Per 1
min
Per 5
min
Per 6
0min
Per 1
2hou
rsPe
r 24h
ours
Motio
n Pi
ctur
e An
alysis
Ser
ver
Fixe
d Ro
ute T
rave
l Ti
me C
alcul
atio
n Se
rver
Real
Time T
rave
l Tim
e Info
rmati
on
Daily
and M
onthl
y Rep
ort
Wea
ther
Mo
nito
ring
Serv
erW
eathe
r Info
rmati
on w
ith ge
ocod
ed da
ta, ch
art a
nd gr
aphic
Incide
nt Inf
orma
tion
Incide
nt Inf
orma
tion w
ith ge
ocod
ed da
ta, ch
art, g
raph
ic an
d CCT
V im
age
Follo
wing
inf
orma
tion i
s dis
playe
d on
Digit
al Ro
ad
Map
•Equ
ipmen
t Lo
catio
n and
Cu
rrent
Infor
matio
n•R
eal T
ime
Cong
estio
n Inf
orma
tion
Map
•Rea
l Tim
e W
eathe
r Inf
orma
tion
•Fixe
d Imp
ortan
t Ro
utes T
rave
l Tim
e
Moni
torin
g Di
splay
Co
ntro
l Sy
stem
Taxi
GPS
data
Bus G
PS da
ta BR
T GP
S da
ta
Point
Spe
ed da
ta
(from
OCR
s or
Spee
dmete
rs)Tr
affic
Volum
e da
ta (fr
om O
CRs
or S
peed
meter
s)
Meteo
rolog
ical d
ata
Air P
olluti
on da
ta
Field
Equip
ment
Cond
ition s
uch a
s VM
S, A
rrow
Sign
al at
Tunn
els
Route
/Line
s
Freq
uenc
y/ Tim
e Ta
bleFa
re
Contr
act
Infor
matio
n
Incid
ent
Moni
torin
g Se
rver
Accid
ent (
Type
, Lo
catio
n, Du
ratio
n)
Wor
k Zon
e(Ty
pe,
Loca
tion,
Dura
tion)
Disa
ster (
Type
, Lo
catio
n, Le
vel,
Dura
tion)
CCTV
Dat
a Ser
ver
Wea
ther
Infor
matio
n
Meteo
rolog
ical W
arnin
g Mes
sage
Fixed
-type
CCT
V im
age
With
X,Y
,Z
geoc
oding
data
veloc
ity an
d ac
celer
ation
PTZ
CCT
V im
age
Fixed
-type
CC
TV im
age
PTZ
CCTV
imag
e
Meteo
rolog
ical
War
ning M
essa
geW
eathe
r Info
rmati
on
Traff
ic Vo
lume d
ata
Taxi
GPS
data
Bus G
PS da
ta BR
T GP
S da
ta
Point
Sp
eed d
ata
Real
Time T
raffic
Volu
me
Aggr
egate
d in
Per 1
min
Per 5
min
Per 6
0min
Per 1
2hou
rsPe
r 24h
ours
Stak
ehold
ers
Route/ Lane
PTZ
CCT
V im
age
Fixed
-type
CCT
V im
age
Route
/Line
sFr
eque
ncy/
Time T
able
Fare
Contr
act
Infor
matio
n
Route
/Line
sFr
eque
ncy/
Time T
able
Fare
Contr
act
Infor
matio
n
Meteo
rolog
ical d
ataAi
r Poll
ution
data
Bus A
rriva
l /Dep
artur
e Inf
orma
tion
User
s
User
s
Proc
essin
g Sy
stem
Dist
ribut
ion
Syst
emMo
nito
ring
Syst
em
Data
Sto
rage
Sys
tem
Data
Gat
herin
g Sy
stem
【Le
gend
】
Point
Spe
ed D
ata
Point
Spe
ed D
ata
Real
Time T
raffic
Co
nges
tion
Monit
oring
,Tr
affic
Spee
d Pr
ovisi
on
Calcu
lation
of
-Ave
rage
Spe
ed
-Den
sity

The Federative Republic of Brazil Study on the Introduction of Intelligent Transport Systems Final Report
9-37
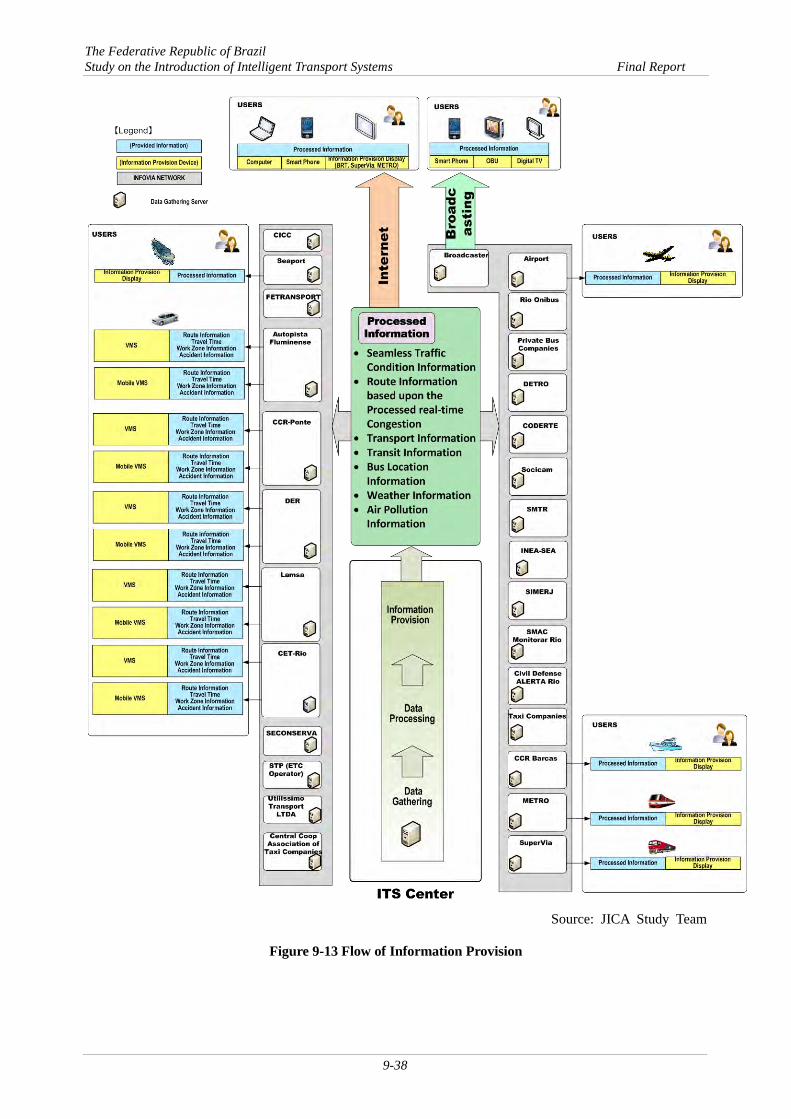
iii) Information Provision Process Figure 9-13 shows the flow of information provision from the ITS Center. Information processed
in the ITS Center shall be provided to the stakeholders and users through several different methods.
Firstly, the processed information is sent back to the stakeholders through the INFOVIA Network so that stakeholders can monitor the real-time condition of traffic and transportation in Rio de Janeiro Metropolitan Area. Based on the information, stakeholders shall operate their own information provision systems such as VMSs or information panels to provide useful and necessary information to the users.
Alternatively, there are two methods to provide the processed information to users. One method is through the internet and the other is through data broadcasting service provided by digital terrestrial broadcasting. The users can access their desired information anytime and anywhere by operating their computer, smart phone or through a digital TV or an on-board unit with digital TV tuner.
The Federative Republic of Brazil Study on the Introduction of Intelligent Transport Systems Final Report
9-38
Source: JICA Study Team
Figure 9-13 Flow of Information Provision

The Federative Republic of Brazil Study on the Introduction of Intelligent Transport Systems Final Report
9-39
(5) Cost Estimation Based on the essential equipment shown in Table 9-7 and their unit prices, the cost of Project
Package 1 is estimated in Table 9-9.
Table 9-9 Cost of Project Package 1
Source: JICA Study Team
Project Package 1 Exchange rate : BRL1=JPY 46.92 as of March 26, 2013
No. Item QuantitiesUnit Cost
(1000JPY)Total
(1000JPY)Total
(1000BRL)Remarks
1 Data Gathering System 1,240,000 26,4281-1 Data Gathering Server for ITS center 1 80,000 80,000 1,705 hardware/software1-2 Data Gathering Server for Stakeholders 29 20,000 580,000 12,361 hardware/software1-3 Modification of Existing System 29 20,000 580,000 12,361 software2 Data Storage System 300,000 6,394
2-1 Probe Data Storage Server 1 80,000 80,000 1,705 hardware/software2-2 Point Data Server 1 80,000 80,000 1,705 hardware/software2-3 Transit Data Server 1 50,000 50,000 1,066 hardware/software2-4 Incident Monitoring Data Server 1 20,000 20,000 426 hardware/software2-5 Weather Monitoring Server 1 20,000 20,000 426 hardware/software2-6 CCTV Data Server 1 50,000 50,000 1,066 hardware/software3 Processing System 490,000 10,443
3-1 Velocity information Generating Server 1 100,000 100,000 2,131 hardware/software3-2 Traffic Volume Processing Server 1 100,000 100,000 2,131 hardware/software3-3 Motion Picture Analysis Server 1 80,000 80,000 1,705 hardware/software3-4 Bus Arrival Information Calculation Server 1 50,000 50,000 1,066 hardware/software3-5 Fixed Route Travel Time Calculation Server 1 40,000 40,000 853 hardware/software3-6 Weather Information Processing Server 1 40,000 40,000 853 hardware/software3-7 Incident Information Processing Server 1 40,000 40,000 853 hardware/software3-8 Report Generating Server 1 40,000 40,000 853 hardware/software4 Distribution System 585,500 12,479
4-1 GIS Server 1 90,000 90,000 1,918 hardware/software4-2 WEB Server 1 60,000 60,000 1,279 hardware/software4-3 Digital Broadcasting Data Converting Server 1 80,000 80,000 1,705 hardware/software4-4 Information Sharing Console 78 1,000 78,000 1,662 hardware4-5 Information Provision Display 37 7,500 277,500 5,914 hardware5 Monitoring system 77,000 1,641
5-1 Large Display Panel 1 16,000 16,000 341 hardware5-2 Desktop computer for Large Display Panel 1 11,000 11,000 234 hardware/software5-3 System Status Monitoring System 1 50,000 50,000 1,066 hardware/software6 Power Supply System 30,000 639
6-1 Uninterrupted Power Supply 1 15,000 15,000 3206-2 Diesel Engine Generator 1 15,000 15,000 320
Sub total 2,722,500 58,024 1~6
7 Installation and Test 1 272,250 5,802 1~6 *10% Sub total 272,250 5,802
8 ITS Center (Physically)30m x30m 1 90,000 90,000 1,918 Sub total 90,000 1,918
3,084,750 65,745Total
Equipment
Civil Construction

The Federative Republic of Brazil Study on the Introduction of Intelligent Transport Systems Final Report
9-40
(6) Implementation Plan Table 9-10 shows the implementation schedule for Project Package 1 including preparation,
procurement and implementation stages, and commissioning test. The implementation plan is proposed on the basis of the following conditions:
1) Preparation Stage Financial preparation shall be completed by the end of 2013 and before the commencement
of the preparation of the financial source for procurement and implementation stages.
2) Procurement Stage The period for the procurement stage including detailed design, tender and contract is
expected to be ten months. This stage shall be completed by November 2014.
The location of the ITS Center is not yet determined. The location and acquisition of land for the construction of the ITS Center shall be conducted before the contract (by October 2014).
The following agreement shall be made by October 2014:
- Agreement with the stakeholders about the location of the equipment to be installed in the stakeholder’s premises
- Agreement with the broadcaster about data broadcasting to users
- Agreement with PRODERJ about the utilization of the INFOVIA Network
3) Implementation Stage Implementation will commence in December 2014 after the contract.
The implementation period will be 18 months, including survey and design (6 months), manufacturing (6 months), factory inspection (1 month), modification of existing system for the information gathering server (4 months), equipment installation (4 months), commissioning test (1 month), and trial operation and site training (1 month).
An organization for the operation of the ITS Center shall be established by August 2015, one year before the Olympic Games.
4) Overall Test The overall commissioning test shall be conducted in June 2016 before taking-over in order
to check the interconnection among the equipment of Project Package 1, Project Package 2, and Project Package 3.

The Federative Republic of Brazil Study on the Introduction of Intelligent Transport Systems Final Report
9-41
Table 9-10 Implementation Schedule for Project Package 1
Source: JICA Study Team
(7) Operation Plan
Operation and maintenance (O&M) work is necessary for the overall system including Project Package 1, Project Package 2, and Project Package 3. However, the JICA Study Team focused on the O&M tasks for the ITS Center in Project Package 1 because the ITS Center will be a newly established and built facility, and the O&M work for other facilities in Project Package 1, Project Package 2, and Project Package 3 will be included in the existing O&M tasks.
1) Operation and Maintenance Work for the ITS Center
i) Operation Work The ITS Center system is planned under the concept of disseminating ITS information
automatically from gathered data without human modification and decision. Therefore, the operation work for the ITS Center system involves supervising the functional health of the system by monitoring the system display. Once a problem is detected, the operator will make suitable and quick countermeasure according to the troubleshooting indication showed on the system monitoring display. The operator shall supervise the system for 24 hours continuously; two operators x four-shift system (three shifts + one day off ) are necessary.
Preparation stageFinance PreparationSelection of Consultant
Procurement stageDetail designTender Negotiation/Contract Preliminary Application for implementationAcquisition of Land for ITS CenterDiscussion and Agreement with StakeholdersDiscussion and Agreement with BroadcastersDiscussion and Agreement with Proderj
Implementation Stage SurveyDesign ManufacturingFactory InspectionApplication of Radio Frequency (If necessary)Modification of Existing system for Gathering Server
InstallationCommissioning TestTrial Operation and Site TrainingEstablishment of Organization for ITS center
Over All Test
: Work Item
:Work Item of Administrator
: Application period and Discussion
4th QT 1st QT 2nd QT 3rd QT 4th QT
Over All Test
2nd QT 3rd QT 4th QT 1st QT 2nd QT 3rd QTItem
2013 2014 2015 20161st QT 2nd QT 3rd QT 4th QT 1st QT
Olympic
Oly
mpi
c

The Federative Republic of Brazil Study on the Introduction of Intelligent Transport Systems Final Report
9-42
ii) Maintenance Work by Operator Other than the above operation work, the following maintenance tasks by operators are also
necessary to keep the performance of the ITS Center system, which controls the overall system of Project Package 1, Project Package 2, and Project Package 3.
Set up of basic ITS facility data of the system
The basic ITS facility data such as bus stop, VMS, director, etc. will be installed to meet the traffic volume and traffic situation needs. Therefore, such basic ITS facility data will be designed for easy set up by the operator. Changes in the basic ITS facility data shall be made according to the existing conditions and scheduled improvements of the ITS facility.
iii) Maintenance Work by Technical Engineer The following maintenance work shall be done by the technical engineer dispatched from the
contracted maintenance company.
Check the system periodically
To confirm that the system is functioning well and to prevent future problems, periodical checking by the technical engineer is important.
Emergency activity for recovering the system
Once a system problem is detected, the system shall be recovered as soon as possible. Emergency activity and countermeasures to recover the system by the technical engineer are necessary.
Update of map data
It is necessary for the map data to be consistent with the actual traffic situation as much as possible. Therefore, map data shall be updated to the latest version periodically by the technical engineer. The latest version of the procurement fee and installation fee (e.g., 2 engineers x 5 days) is included in the updating cost.
iv) Other Related Tasks for Operation Besides the above direct operation and maintenance tasks, the following supportive works are
also important:
Development of the system
System application shall be developed and improved in harmony with the needs of the ITS services. Two permanent staffs for the development of the ITS system is necessary.
Administrative tasks
Several administrative tasks including ordering from and contracting with the technical company for maintenance and some service company for training services are necessary.

The Federative Republic of Brazil Study on the Introduction of Intelligent Transport Systems Final Report
9-43
One office manager and one administrative staff are necessary.
Management tasks
Management tasks by one manager for all activities related to the ITS Center are necessary.
Training of staff
For transferring the technology to the new staff and improving their skills to operate the system more efficiently, timely and periodical training of staffs is very important. However, such work can be done by another existing division or other company.
The proposed organization for the ITS Center is shown in Figure 9-7 below.
Source: JICA Study Team
Figure 9-14 Proposed Organization for the ITS Center
2) Operation and Maintenance Cost of the System In consideration of the above operation and maintenance tasks, the following costs will be
estimated:
-Staff cost for operation work
-Staff cost for development work
-Staff cost for administrative work
-Staff cost for manager
-Maintenance cost for checking the system
-Maintenance cost for emergency activity
-Maintenance cost for updating the map data
Administrative work for ITS Center
Development of the System 2 staffs
Operation of the System 2 operators x 4 shifts = 8 operators
Manager of ITS Center 1 manager
Administrative Work for the ITS Center 1 office manager 1 administrative staff

The Federative Republic of Brazil Study on the Introduction of Intelligent Transport Systems Final Report
9-44
As major utility costs, the cost of the INFOVIA Network for communicating with related agencies and the cost of electric power for the ITS Center shall also be considered.
The cost for operation of the ITS Center is shown in Table 9-11.
Table 9-11 Cost for Operation Item Unit Cost
Set Cost
(BRL/year) 1) Operation work
2 operators x 4 shifts 2.000~3.000
R$/MM 8 MM x 12 months
192.000~288.000
2) Development work 2 staffs
5.000~7.000 R$/MM
2 MM x 12 months
120.000~168.000
3) Administrative work 1 office manager
5.000~7.000
1 MM x12 months
72.000~120.000
1 administrative staff 1.000~3.000 R$/MM
4) Management work 1 manager
13.000~15.000 R$/MM
1 MM x 12 months
156.000~180.000
5) Maintenance work
Periodical checking of the system 5.000 R$/day
10 days/year 50.000
Emergency activity for recovering the system (depending on the type of trouble)
5.000 R$/day
10 days/year 50.000
Update of map data (including installation) 50.000 R$/year
1 year 50.000
6) Other costs INFOVIA Network communication fee 10.000
R$/year 1 year 10.000
Electricity fee for ITS Center 100.000
R$/year 1 year 100.000
Total 800.000~1,016,000
Source: JICA Study Team

The Federative Republic of Brazil Study on the Introduction of Intelligent Transport Systems Final Report
9-45
9.5 PROJECT PACKAGE 2 Project Package 2 covers the following system:
Bus condition information provision in the Rio de Janeiro municipal area
9.5.1 Grand Design
(1) Objective The objective of Project Package 2 is summarized as follows:
To enhance passenger satisfaction by providing bus-related information to users at bus stops, terminals, and inside the bus.
Information provision via web, smart phone, and digital broadcasting shall be covered by the ITS Center (Project Package 1).
(2) Target Area
Project Package 2 shall cover only information provision system at bus stops, terminals, and inside the buses. The number and location to be deployed shall be clarified in Section 9.5.2.
(3) Related Stakeholders
The related stakeholders of Project Package 2 are mainly transit/transport-related agencies and operators as shown below.
1) Transit/Transport-related Agencies DETRO SMTR
2) Transit/Transport Operator FETRANSPOR (Association) Bus Terminal Operator Private Bus Companies
3) Others Mob TV
(4) Definition of Data/Information
Table 9-12 shows the kind of data/information which the ITS Center should gather from each stakeholder involved with Project Package 2.

The Federative Republic of Brazil Study on the Introduction of Intelligent Transport Systems Final Report
9-46
Table 9-12 Definition of Data/Information Stakeholders Gathered and Collected Data/Information
Transit/Transport- related Agencies
SMTR/DETRO Processed information shall be provided via the ITS Center
Transit/Transport Operator
FETRANSPOR Bus operating line data, bus stop/terminal geocoding data Private Bus Companies GPS data Bus Terminal Operators Bus departure timetable Mob TV Current bus position information provision inside bus
Information Provider ITS Center Traffic information, estimated bus arrival time information, transfer information, etc.
Source: JICA Study Team
(5) Sample Contents
As for example, the Figure 9-15 shows sample contents of project package 2.
Source: JICA Study Team
Figure 9-15 Sample Contents of Project Package 2
Bus Information Provision System

The Federative Republic of Brazil Study on the Introduction of Intelligent Transport Systems Final Report
9-47
9.5.2 Basic Design
The bus condition information provision system shall consist of the following equipment:
- Information provision board at bus stops
- Digital signage at terminals
- Bus location monitoring system
- Inside bus information monitor
(1) Number of Equipment to be Deployed
The target area of deployment is the central area of Rio de Janeiro to expand the provision of bus operation information to residents, visitors, and tourists. The number of equipment to be deployed is summarized in Table 9-13.
Table 9-13 Number of Equipment to be Deployed in the Short Term
Source: JICA Study Team
1) Information Provision Panel at Bus Stops [Existing]
There are 2,136 bus stops with shelter. However, no information provision board at bus stop is installed. [Proposed]
About 500 stops along arterial roads shall be selected. [For Short Term] Bus stops in the Centro and Copacabana areas are the only ones considered. (Note that bus stops along Av. Pres. Vargas are not selected because the Procopio Ferreira Terminal will provide the same information.) As a result, 46 stops are selected as shown in Table 9-14 below.
Equipment Installation Location Current Condition Target Information Panel at Bus Stops
Bus stops 0 stop 46 stops
Information Provision Display at Terminals
Bus terminals 1 terminal (Novo Rio)
4 terminals (including Novo Rio)
Bus Location Monitoring System Bus companies 0 company 30 companies
Inside Bus Information Display
Bus vehicles Not confirmed 567 vehicles
Centro, Copacabanaarea
Figure 9-16 Deployment of Information
Provision Panel at Bus Stop
Source: JICA Study Team

The Federative Republic of Brazil Study on the Introduction of Intelligent Transport Systems Final Report
9-48
Table 9-14 Proposed Bus Stops for Information Provision Panel no Latitude Longitude NAME
1 -22.90985 -43.16835 Av. General Justo, lado oposto ao Aeroporto Santos Dumont (PRACA) 2 -22.90733 -43.16840 Av. General Justo, No 365A 3 -22.90857 -43.16830 Av. General Justo, 160 4 -22.92730 -43.20937 Av. Paulo de Frontim, 619 5 -22.95692 -43.17762 Av. Lauro Sodre, em frente ao Shopping Rio Sul 6 -22.95687 -43.17763 Av. Lauro Sodre, em frente ao Shopping Rio Sul 7 -22.95680 -43.17767 Av. Lauro Sodre, em frente ao Shopping Rio Sul 8 -22.95672 -43.17765 Av. Lauro Sodre, em frente ao Shopping Rio Sul 9 -22.95633 -43.17752 Av. Lauro Sodre, em frente ao Shopping Rio Sul
10 -22.95630 -43.17752 Av. Lauro Sodre, em frente ao Shopping Rio Sul 11 -22.95625 -43.17752 Av. Lauro Sodre, em frente ao Shopping Rio Sul 12 -22.95615 -43.17747 Av. Lauro Sodre, em frente ao Shopping Rio Sul 13 -22.95593 -43.17752 Av. Lauro Sodre, em frente ao Shopping Rio Sul 14 -22.94280 -43.17680 Praca Nicaragua, Lado Oposto, Sentido Copacabana 15 -22.94330 -43.18057 Av. Das Nacoes Unidas, lado oposto Ed. Argentina Sentido Copacabana 16 -22.94593 -43.18187 Av. Das Nacoes Unidas, lado oposto ao No 316 Sentido Copacabana 17 -22.95298 -43.17243 Av. Pasteur, em frente ao Instituto Benjamin Constant 18 -22.95422 -43.16843 Av. Pasteur, No 458 19 -22.95307 -43.17177 Av. Pasteur, oposto ao No 280, em frente ao Iate Clube do RJ 20 -22.95223 -43.17342 Av. Pasteur, oposto ao No 350, em frente ao Iate Clube do RJ 21 -22.96322 -43.17432 Av. Princesa Isabel, No. 186b 22 -22.96262 -43.17462 Av. Princesa Isabel, No.254 23 -22.96243 -43.17472 Av. Princesa Isabel, No.282 24 -22.96202 -43.17495 Av. Princesa Isabel, No.334 25 -22.97787 -43.22277 Rua Mario Ribeiro No 193, Sentido Lagoa 26 -22.97783 -43.22270 Rua Mario Ribeiro No 193, Sentido Lagoa 27 -22.96890 -43.21735 Av. Borges de Medeiros, em frente ao Clube Naval 28 -22.96508 -43.21563 Av. Borges de Medeiros, lado oposto a Paroquia Sao Jose 29 -22.96795 -43.21758 Av. Borges de Medeiros, 2895, esquina com Rua General Garzon 30 -22.96407 -43.21450 Av. Borges de Medeiros ao lado da Igreja Sao Jose da Lagoa 31 -22.97230 -43.21748 Av. Borges de Medeiros, Sentido Sentro 32 Metros Antes do Posto Br 32 -22.96280 -43.20495 Av. Borges de Medeiros, 100 Mts antes da Av. Epitacio Pessoa (Baixo Bebe) 33 -22.96267 -43.20603 Av. Borges de Medeiros, L.O. ao no 74 da Rua Profo Abelardo Lobo 34 -22.99205 -43.23362 Av. Niemeyer, Lado do Mar, em frente ao Hotel Sheraton 35 -22.99815 -43.26572 Auto Estrada Lagoa Barra, Esquina com Rua Herbert Moses 36 -22.99902 -43.27065 Auto Estrada Lagoa Barra, sentido Barra, na baia do novo terminal 37 -22.99903 -43.27072 Auto Estrada Lagoa Barra, sentido Barra, na baia do novo terminal 38 -22.99903 -43.27078 Auto Estrada Lagoa Barra, sentido Barra, na baia do novo terminal 39 -22.99855 -43.25658 Av. Prefeito Mendes de Moraes, Proximo a Av. Niemeyer, Sentido Leblon 40 -22.91092 -43.21420 Pc da Bandeira, lado oposto a Defesa Civil Estadual 41 -22.91642 -43.25263 Rua Visconde de Santa Isabel, No 34, em frenta a 9a RA 42 -22.91648 -43.25330 Rua Visconde de Santa Isabel, No 56 43 -22.91702 -43.26115 Rua Visconde de Santa Isabel, canteiro central, lado oposto ao no 337 44 -22.91702 -43.26120 Rua Visconde de Santa Isabel, canteiro central, lado oposto ao no 337 45 -22.94813 -43.18118 Av. Nacoes Unidas, sentido centro, proximo a praca Pimentel Duarte na calcada da praia 46 -22.94375 -43.18062 Av. Nacoes Unidas, sentido Centro, proximo a passagem subterranea, na calcada da praia
2) Information Provision Board at Terminals
[Existing] Information provision boards shall be installed only at Novo Rio Terminal in Rio Municipality. Other than the Novo Rio Terminal, there are two interstate bus terminals in RMRJ, 18 intercity bus terminals in RMRJ, and 24 local terminals in Rio Municipality. [Proposed]
All terminals shall have an information provision board.

The Federative Republic of Brazil Study on the Introduction of Intelligent Transport Systems Final Report
9-49
[For Short Term] The following four major terminals in RMRJ and Rio Municipality, as shown in Figure 9-17, shall be selected:
Novo Rio Roberto Silveira (Niteroi) Procopio Ferreira (Central do Brasil) Misericordia (Praça XV)
Source: JICA Study Team
Figure 9-17 Deployment of Information Provision Board at Bus Terminals
3) Bus Location Monitoring System [Existing]
Only Rio Onibus operates a monitoring system to administer 46 bus companies in Rio Municipality. Meanwhile, there are 208 bus companies in RMRJ. [Proposed]
All bus companies in RMRJ shall have a bus location monitoring system. [For Short Term]
Bus companies which operate in Centro and Copacabana shall be considered. InterSul and InterNorte are major consortiums in the Centro and Copacabana areas with 30 bus companies belonging to these two consortiums. Therefore, 30 companies shall be selected.
Source: JICA Study Team
Figure 9-18 Jurisdiction Area of InterNorte and InterSul
Bus Terminals selected for Short Term Project

The Federative Republic of Brazil Study on the Introduction of Intelligent Transport Systems Final Report
9-50
4) Inside Bus Information Monitor [Existing]
The number of bus vehicles is 9,000. [Proposed]
About 3,000 of the 9,000 vehicles operating in the Centro and Copacabana areas where tourists mainly visit shall be selected. [For Short Term]
Vehicles which stop at bus stops are considered for the short-term project and those along Av. Pres. Vargas will be the target. Vehicles which belong to InterSul and InterNorte consortiums are selected. The number of vehicles is 567.
Figure 9-19 Buses Proposed for the Introduction of Inside Bus Information Monitor

The Federative Republic of Brazil Study on the Introduction of Intelligent Transport Systems Final Report
9-51
(2) Essential Equipment and Functional Requirement The functional requirement of the equipment is shown in Table 9-15
Table 9-15 Essential Equipment and Functional Requirement Essential Equipment Functional Requirement
Information Panel at Bus Stops [Functional Requirement] Information to be provided:
- Bus arrival information (destination, line number, and estimated arrival time)
- The information shall come from the ITS Center through GPRS.
[Hardware Configuration] Information panel (outdoor type)
- LED display Network equipment
- GPRS transceiver [Installation Location] Bus stop (46 stops)
Information Provision Board at Terminals
[Functional Requirement] Information to be provided:
- Bus arrival/departure information (destination, line number, bus stop number, and estimated arrival/departure time
- The information shall come from the ITS Center through GPRS.
[Hardware Configuration] LCD color display (outdoor type) Information provision display control unit Network equipment
- GPRS transceiver [Installation Location] Bus terminal (4 major terminals)
Bus Location Monitoring System [Functional Requirement] The bus location monitoring server shall have the following
functions so that the bus companies will manage bus operation: - Gathering the bus location using GPS data - Operational management
Vehicle No. Route Itinerary Number of passengers at each stop Name of bus driver and fare collector
- Reading the IC card data from the reader for billing management
- Displaying the location of the buses on the map - Storage database for bus stops, terminals bus, lines and
surrounding facilities [Hardware Configuration] Bus location monitoring server

The Federative Republic of Brazil Study on the Introduction of Intelligent Transport Systems Final Report
9-52
Wall-mounted display Network equipment
- GPRS transceiver
[Installation Location] Bus company (30 companies)
Inside Bus Information Display [Functional Requirement] Information to be provided:
- Next bus stop (provided according to GPS data) - Facility information close to the bus stop (provided
according to GPS data) [Hardware Configuration] Inside bus information display
- LCD color display Inside bus information display control unit
- Utilizing database of bus stops, terminals bus lines and surrounding facilities to provide facility information close to the bus stop when bus approaches the bus stop
[Installation Location] Bus (567 vehicles)
Source: JICA Study Team
(3) System Diagram/Data Flow
i) System Diagram Figure 9-20 shows the system diagram of bus information provision system. The equipment
highlighted in blue is the scope of Project Package 2. Information gathering from the bus companies to the ITS Center is covered in Project Package 1.
Source: JICA Study Team
Figure 9-20 System Diagram of Bus Condition Information Provision

The Federative Republic of Brazil Study on the Introduction of Intelligent Transport Systems Final Report
9-53
ii) Data Flow Figure 9-21 shows the data flow of the bus information provision system.
Source: JICA Study Team
Figure 9-21 Data Flow of Bus Condition Information Provision
(4) Cost Estimation Based on the essential equipment shown in Table 9-15 and their unit prices, the cost of Project
Package 2 is estimated in Table 9-16.
Table 9-16 Cost of Project Package 2
Source: JICA Study Team
ITS Center
Bus Company
Operation Center
BUS
Transmitter (GPRS)
BUS Stop
Information Panel
Receiver (GPRS)
Information Provision Display
Receiver (GPRS)
BUS Terminal
Bus Location Monitoring System
Receiver (GPRS)
INFOVIA NETWORK
Data Gathering Server
GPS Receiver
GPS
Information Display
Transimitter (GPRS)
Inside Bus Display Control Unit
Current Bus PositionNext Bus Stop
Weather Information
Bus Arrival Information
Bus Arrival Information
SMTR
DETRO FETRANSPOR
MOV TV
【Legend】
Scope of Project Package 1(ITS Center)
(Provided Information)
• Seamless Traffic Condition Information
• Route Information based upon the Processed real-time Congestion
• Transport Information• Transit Information• Bus Location
Information• Weather Information• Air Pollution
Information
Processed Information
Data Processing
(Gathered Information)
GPS Data
Information Sharing Console
WEB server
Project Package 2 Exchange rate : BRL1=JPY 46.92 as of March 26, 2013
No. Item QuantitiesUnit Cost
(1000JPY)Total
(1000JPY)Total
(1000BRL)Remarks
1 Information Panel at Bus stops 207,000 4,4121-1 Information Panel 46 4,000 184,000 3,9221-2 Network Equipment 46 500 23,000 4902 Information Provision Display at Terminals 30,000 639
2-1 Information Provision Display 4 5,000 20,000 4262-2 Information Provision Display Control Unit 4 2,000 8,000 1712-3 Network Equipment 4 500 2,000 433 Bus Location Monitoring System 915,000 19,501
3-1 Bus Location Monitoring Server 30 30,000 900,000 19,182 With wall-mounted Display
3-2 Network Equipment 30 500 15,000 3204 Inside Bus Information Provision System 1,871,100 39,879
4-1 Inside Bus Information Display 567 800 453,600 9,6684-2 Inside Bus Information Display Control Unit 567 2,000 1,134,000 24,1694-3 Network Equipment 567 500 283,500 6,042
Sub total 3,023,100 64,431
5 Installation and Test 1 302,310 6,443 1~4 *10% Sub total 302,310 6,443
3,325,410 70,874Total
Equipment

The Federative Republic of Brazil Study on the Introduction of Intelligent Transport Systems Final Report
9-54
(5) Implementation Plan Table 9-17 shows the implementation schedule for Project Package 2 including preparation,
procurement, implementation, and commissioning test. The implementation plan is proposed on the basis of the following conditions:
1) Preparation Stage Financial preparation shall be completed by the end of 2013 before commencement of the
preparation of the financial source for procurement and implementation stages.
2) Procurement Stage The period for the procurement stage including detailed design, tender, and contract is
expected to be 11 months and shall be completed by December 2014.
According to the information from a private broadcasting company, they have developed their bus location information provision system which includes inside bus information provision and bus arrival/departure information provision. They are currently promoting the system to bus companies. The consultant who will conduct the detailed design shall clarify the bus companies targeted for Project Package 2 according to further surveillance or interview with bus companies during the detailed design stage.
Preliminary application for installation of the equipment shall be made to related agencies, mobile operators, and bus companies.
3) Implementation Stage The implementation will commence in February 2015 after the contract.
The implementation period will be 15 months including the survey and design (5 months), manufacturing (6 months), factory inspection (1 month), equipment installation (2 months), commissioning test (1 month), and trial operation and site training (1 month).
4) Overall Test The overall commissioning test shall be conducted in June 2016 before taking-over to check
the interconnection among the equipment of Project Package 1, Project Package 2, and Project Package 3.

The Federative Republic of Brazil Study on the Introduction of Intelligent Transport Systems Final Report
9-55
Table 9-17 Implementation Schedule of Project Package 2
Source: JICA Study Team
Preparation stageFinance PreparationSelection of Consultant
Procurement stageDetail designTender Negotiation/Contract Preliminary Application for implementationDiscussion and Agreement with Bus Company
Implementation Stage SurveyDesign ManufacturingFactory InspectionInstallationCommissioning TestTrial Operation and Site Training
Over All Test
: Work Item
:Work Item of Administor
: Application period and Discussion
4th QT 1st QT 2nd QT 3rd QT 4th QT
Over All Test
2nd QT 3rd QT 4th QT 1st QT 2nd QT 3rd QTItem
2013 2014 2015 20161st QT 2nd QT 3rd QT 4th QT 1st QT
Olympic
Oly
mpi
c

The Federative Republic of Brazil Study on the Introduction of Intelligent Transport Systems Final Report
9-56
9.6 PROJECT PACKAGE 3 Project Package 3 covers the following system:
Improvement of the Traffic/Transit Operational Center with essential ITS equipment in the Rio de Janeiro municipal area.
The system has the following three components: 1) existing gathered data integration, 2) expansion of adaptive signal control, and 3) installation and control of additional variable message signboard (VMS) system.
9.6.1 Grand Design
(1) Objective of the Short-term Project The objective of Project Package 3 is summarized as follows:
To expand and improve the function of the existing ITS equipment for a smoother and smarter transportation and transit.
As presented above, component 1 will be covered by the ITS Center section of Project Package 1.
Therefore, this section covers components 2 and 3 only as part of the basic design of this project package. The three components are discussed below.
1) Existing Gathered Data Integration Utilization of OCR point speed data and traffic volume data, CCTV motion picture data (by
the ITS Center of Project Package 1)
Utilization of work zone point data information, tunnel monitoring data (by the ITS Center of Project Package 1)
Bus/BRT GPS information and operational information (by the ITS Center of Project Package 1)
Taxi dispatching GPS data (by the ITS Center of Project Package 1)
2) Expansion of Adaptive Signal Control Dynamic traffic signal optimization
3) Installation and Control of Additional VMS System Additional VMS for more information provision

The Federative Republic of Brazil Study on the Introduction of Intelligent Transport Systems Final Report
9-57
(2) Target Area The target locations of components 2 and 3 shall be in the Rio de Janeiro municipal area. Details
of the location are clarified in Section 9.6.2.
(3) Related Stakeholders
Related stakeholders of Project Package 3 are shown below.
1) Road-related Agencies/Private Companies Public/Government Company: CET-Rio, SECONSERVA
CET-Rio, SECONSERVA (Public/Government Company)
2) Transit/Transport-related Agencies
SMTR
3) Transit/Transport Operator
Rio Onibus, Central Coop (Syndicate and Consortium)
FETRANSPOR (Association)
Super VIA, METRO, CCR Barcas
Private Bus Companies
Socicam (Bus Terminal Operator)
Taxi Association
SMARTSIS (Taxi Dispatching System Operator)
Radio Taxi (Taxi Dispatching System Operator)

The Federative Republic of Brazil Study on the Introduction of Intelligent Transport Systems Final Report
9-58
(4) Sample Contents As for example, the Figure 9-22 shows sample contents of project package 3.
Source: JICA Study Team
Figure 9-22 Sample Contents of Project Package 3
Expansion of Adaptive Signal Control
Installing and Control more Variable Message Signboard System

The Federative Republic of Brazil Study on the Introduction of Intelligent Transport Systems Final Report
9-59
9.6.2 Basic Design
Project Package 3 consists of the following two components:
- Expansion of adaptive signal control
- Installation and control of additional VMS
(1) Number of Equipment to be Deployed The target area for deployment is the central area of Rio de Janeiro to expand the provision of
bus operation information to residents, visitors, and tourists in this area. The number of equipment to be deployed is summarized in Table 9-18.
Table 9-18 Number of Equipment to be Deployed in the Short Term
Source: JICA Study Team
1) Expansion of Adaptive Signal Control Existing
There are about 2265 intersections in Rio Municipality. Adaptive signal control system has already been deployed in 30 intersections. Proposed
Traffic signals at 435 intersections along the arterial road are proposed to be replaced with the adaptive signal control system as first priority based on the result of travel time survey conducted in this study. Furthermore, 995 intersections along other main roads are proposed as second priority. For Short Term
From the viewpoint of intersections extracted from congested areas, 44 intersections along the arterial roads are proposed to be replaced with adaptive signal control system in Project Package 3 as first priority. The proposed intersections are listed in Table 9-19 below.
Equipment Installation Location
Current Condition Target
Dynamic Signal Optimization System
Intersection 30 intersections +44 intersections
Variable Message Signboard System
Arterial Road 34 units 32 units operated by Rio Municipality 2 units operated by DER
+32 units in Rio Municipality
LegendFederal
State
Municipal(Arterial)
Federal (Planned)
State (Planned)
Municipal (Planned)
Concession Road
Congested section
Target Area
Figure 9-23 Deployment of Adaptive Signal
Control
Source: JICA Study Team

The Federative Republic of Brazil Study on the Introduction of Intelligent Transport Systems Final Report
9-60
Table 9-19 Proposed Intersections for Adaptive Signal Control No. Latitude Longitude Intersection
1 -22.96187 -43.20774 Av. Alexandre Ferreira x R. Maria Angelica 2 -22.90503 -43.17036 Av. Alfred Agache x Ladeira da Misericordia 3 -22.97545 -43.18762 Av. Atlantica x R. Bolivar 4 -22.97418 -43.18686 Av. Atlantica x R. Constante Ramos 5 -22.97124 -43.18427 Av. Atlantica x R. Figueiredo de Magalhaes 6 -22.98202 -43.18960 Av. Atlantica x R. Francisco Sa 7 -22.97770 -43.18866 Av. Atlantica x R. Miguel Lemos 8 -22.96819 -43.18032 Av. Atlantica x R. Republica do Peru 9 -22.96667 -43.17774 Av. Atlantica x R. Rodolfo Dantas
10 -22.97233 -43.18548 Av. Atlantica x R. Santa Clara 11 -22.97001 -43.18296 Av. Atlantica x R. Siqueira Campos 12 -22.96315 -43.21250 Av. Borges de Medeiros x Av. Lineu de Paula Machado 13 -22.96538 -43.21600 Av. Borges de Medeiros x R. Batista da Costa 14 -22.96496 -43.21567 Av. Borges de Medeiros x R. J J Seabra 15 -22.97723 -43.21938 Av. Borges de Medeiros x R. Mario Ribeiro 16 -22.96654 -43.21668 Av. Borges de Medeiros x R. Saturnino de Brito 17 -22.96442 -43.21487 Av. Borges de Medeiros x Trav. Ped. 18 -22.96303 -43.21011 Av. Borges de Medeiros x Trav. Ped. 19 -22.96315 -43.20724 Av. Borges de Medeiros x Trav. Ped. 20 -22.96279 -43.21181 Av. Borges de Medeiros x Via de Ligacao (Sem Codigo) 21 -22.97464 -43.21816 Av. Borges de Medeiros x Via de Ligacao (Sem Codigo) 22 -22.98657 -43.22218 Av. Delfim Moreira x Av. Bartolomeu Mitre 23 -22.98621 -43.21967 Av. Delfim Moreira x R. Cupertino Durao 24 -22.98681 -43.22362 Av. Delfim Moreira x R. Gal Venancio Flores 25 -22.98789 -43.22721 Av. Delfim Moreira x R. Jeronimo Monteiro 26 -22.96241 -43.20394 Av. Epitacio Pessoa x R. Frei Solano 27 -22.96261 -43.21193 Av. Lineu de Paula Machado x Via de Ligacao (Sem Codigo) 28 -22.96315 -43.21250 Av. Lineu de Paula Machado x Via de Ligacao (Sem Codigo) 29 -22.90229 -43.18401 Av. Mal. Floriano x R. Camerino 30 -22.99316 -43.25272 Av. Niemeyer x Av. Aquarela do Brasil 31 -22.99421 -43.23383 Av. Niemeyer x Subida do Vidigal - Av. Pres. Joao Goulart 32 -22.99930 -43.26696 Av. Pref Mendes de Morais x Trav. Ped. 33 -22.90188 -43.17937 Av. Rio Branco x Av. Pres. Vargas 34 -22.89636 -43.18140 Av. Rio Branco x Av. Rodrigues Alves 35 -22.97878 -43.22639 Av. Rodrigo Otavio x Av. Visc de Albuquerque 36 -22.99419 -43.25708 Etr. da Gavea x Trav. Ped. 37 -22.96145 -43.17475 R. Barata Ribeiro x Av. Princesa Isabel 38 -22.96067 -43.20314 R. Fonte da Saudade x Trav. Ped. 39 -22.98677 -43.19172 R. Francisco Otaviano x Trav. Ped. 40 -22.96032 -43.20367 R. Humaita x Trav. Ped. 41 -22.97806 -43.22244 R. Mario Ribeiro x R. Minist Raul Machado 42 -22.96301 -43.17500 R. Minist Viveiros de Castro x Av. Prado Junior 43 -22.96081 -43.20440 R. Prof Saldanha x R. Prof Abelardo Lobo 44 -22.98695 -43.19082 R. Raul Pompeia x R. Francisco Otaviano
Source: JICA Study Team

The Federative Republic of Brazil Study on the Introduction of Intelligent Transport Systems Final Report
9-61
2) Expansion of Variable Message Signboard System Existing
There are 36 VMSs in Rio Municipality (34 VMSs operated by Rio Municipality and 2 VMSs operated by DER). Proposed
It is proposed that additional 107 VMSs be installed for conducting sufficient information provision to road users. For Short Term
A total of 32 VMSs around the Olympic Lane shall be considered based on the result of travel time survey conducted in this study. The proposed location is listed in Table 9-20.
Table 9-20 Proposed Location of VMSs No. Latitude Longitude Street
1 -23.014889 -43.302660 Praca Jornalista Maria Filho2 -22.964989 -43.203764 Avenida Epitacio Pessoa3 -22.938208 -43.183209 Rua Pinheiro Machado 4 -22.962217 -43.357319 Avenida Ayrton Senna 5 -22.875170 -43.279136 Avenida Pastor Martin Luther King Junior 6 -22.965280 -43.394742 Avenida Salvador Allende 7 -22.884175 -43.405636 Avenida Marechal Fontenele 8 -22.865123 -43.421085 Avenida Brasil 9 -22.885138 -43.298441 Avenida Dom Helder Camara
10 -22.887328 -43.286545 Avenida Dom Helder Camara 11 -22.874802 -43.266093 [Minor Road] 12 -22.870466 -43.268232 Estrada do Timbo 13 -22.867575 -43.247554 [Minor Road] 14 -22.819343 -43.284489 Avenida Brasil 15 -22.823286 -43.313296 Avenida Meriti 16 -22.822629 -43.326273 [Minor Road] 17 -22.826310 -43.348235 [Minor Road] 18 -22.858508 -43.379609 Rua Joao Vicente 19 -22.867575 -43.413264 Estrada Sao Pedro de Alcantara 20 -22.969772 -43.187609 Rua Barata Ribeiro 21 -22.970823 -43.186611 Avenida Nossa Senhora de Copacabana 22 -22.972136 -43.185470 Avenida Atlantica 23 -22.972595 -43.184971 Avenida Atlantica 24 -22.977806 -43.223663 Rua Mario Ribeiro 25 -23.011019 -43.372117 Avenida Lucio Costa 26 -22.913121 -43.226779 [Minor Road] 27 -22.905294 -43.210361 [Minor Road] 28 -22.905228 -43.209577 Avenida Francisco Bicalho 29 -22.908381 -43.199951 Avenida Presidente Vargas 30 -22.907855 -43.200236 Avenida Presidente Vargas 31 -22.903849 -43.178061 Avenida Rio Branco 32 -22.908118 -43.172356 Avenida Presidente Antoio Carlos
Source: JICA Study Team
Proposal
VMS
LegendFederal
State
Municipal(Arterial)
Existing
Source: JICA Study TeamFigure 9-24 Deployment of VMS

The Federative Republic of Brazil Study on the Introduction of Intelligent Transport Systems Final Report
9-62
(2) Essential Equipment and Functional Requirement
i) Dynamic Signal Optimization
Table 9-21 Essential Equipment and Functional Requirement Essential Equipment Functional Requirement
Dynamic Signal Optimization System
[Functional Requirement] The detectors shall count the traffic volume, speed, and
vehicle type and send it to a traffic signal server in COR through signal controller at intersections.
[Hardware Configuration] Signal with signal controller Sensor
- Image recognition type (installed at intersection) - Loop-coil type or ultrasonic type (installed
approximately 200 m before the intersection. Specified clearance between the intersection and sensor shall be decided during the detailed design stage)
Network equipment - GPRS or fiber optic
[Installation Location] 44 intersections
Signal Control Server (Signal Optimization Software)
[Functional Requirement] The signal optimization software shall control the signal
dynamically according to traffic conditions in order to alleviate traffic congestion.
[Hardware Configuration] Server with display for server maintenance [Installation Location] COR: 1 set
Source: JICA Study Team
ii) Variable Message Signboard System
Table 9-22 Essential Equipment and Functional Requirement Essential Equipment Functional Requirement
Variable Message Signboard System (VMS system)
[Functional Requirement] Communication control function
- Communicating with the VMS server in COR through communication network
- Receiving display data from the VMS server and sending back the operating status data to the server
Display control function - Changing the contents on the display based on the
display data from the server Monitoring function
- Monitoring the display condition and sending it to the server.
Local operation function - Controlling the VMS manually at the site
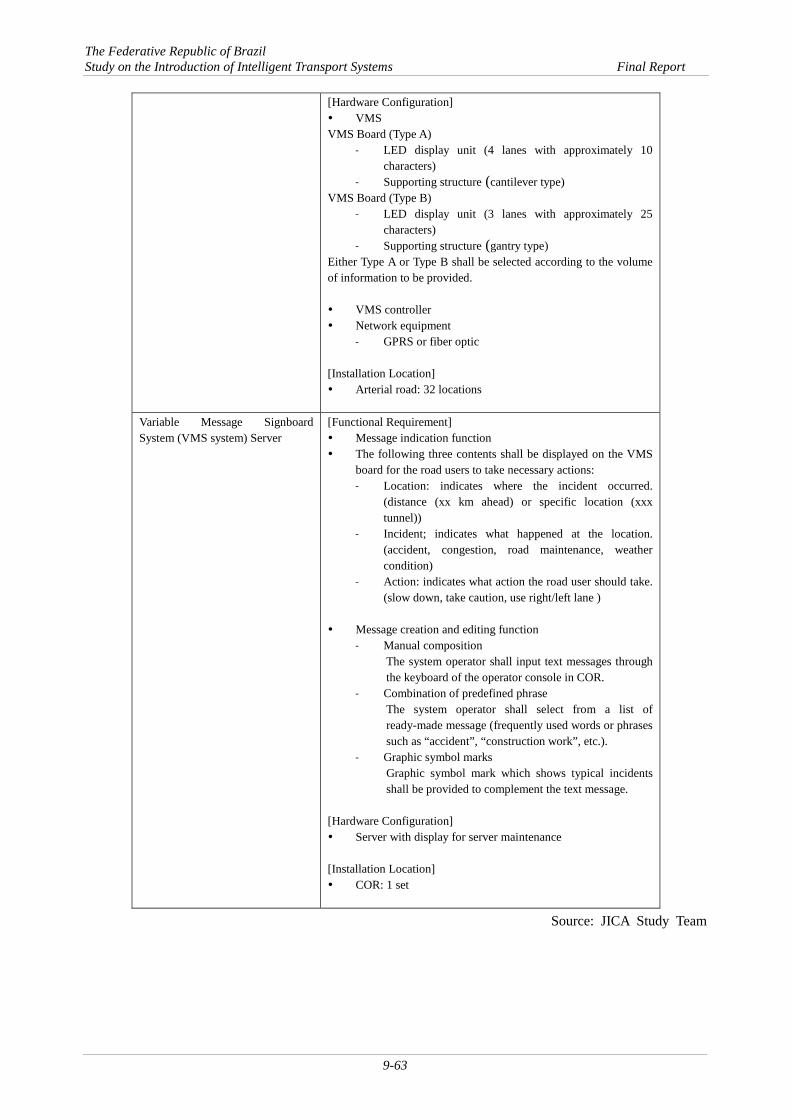
The Federative Republic of Brazil Study on the Introduction of Intelligent Transport Systems Final Report
9-63
[Hardware Configuration] VMS VMS Board (Type A)
- LED display unit (4 lanes with approximately 10 characters)
- Supporting structure (cantilever type) VMS Board (Type B)
- LED display unit (3 lanes with approximately 25 characters)
- Supporting structure (gantry type) Either Type A or Type B shall be selected according to the volume of information to be provided. VMS controller Network equipment
- GPRS or fiber optic [Installation Location] Arterial road: 32 locations
Variable Message Signboard System (VMS system) Server
[Functional Requirement] Message indication function The following three contents shall be displayed on the VMS
board for the road users to take necessary actions: - Location: indicates where the incident occurred.
(distance (xx km ahead) or specific location (xxx tunnel))
- Incident; indicates what happened at the location. (accident, congestion, road maintenance, weather condition)
- Action: indicates what action the road user should take. (slow down, take caution, use right/left lane )
Message creation and editing function
- Manual composition The system operator shall input text messages through the keyboard of the operator console in COR.
- Combination of predefined phrase The system operator shall select from a list of ready-made message (frequently used words or phrases such as “accident”, “construction work”, etc.).
- Graphic symbol marks Graphic symbol mark which shows typical incidents shall be provided to complement the text message.
[Hardware Configuration] Server with display for server maintenance [Installation Location] COR: 1 set
Source: JICA Study Team

The Federative Republic of Brazil Study on the Introduction of Intelligent Transport Systems Final Report
9-64
(3) System Diagram
Source: JICA Study Team
Figure 9-25 System Diagram of Dynamic Signal Optimization
Source: JICA Study Team
Figure 9-26 System Diagram of Variable Message Signboard System

The Federative Republic of Brazil Study on the Introduction of Intelligent Transport Systems Final Report
9-65
(4) Data Flow
Source: JICA Study Team
Figure 9-27 Data Flow of Dynamic Signal Optimization
Source: JICA Study Team
Figure 9-28 Data Flow of Variable Message Signboard System
(5) Cost Estimation
Based on the essential equipment shown in Table 9-21 and Table 9-22 and their unit prices, the cost of Project Package 3 is estimated in Table 9-23.
Adaptive Signal Control
Network Equipment
Traffic Signal Controller
Traffic Signal
Sonic Detector
CCTV Detector
ITS Center
COR
Traffic Signal Server
INFOVIA NETWORK
Data Gathering Server
【Legend】
Scope of Project Package 1(ITS Center)
(Provided Information)
Fiber Optic Network (CET-Rio)
orGPRS
Network Equipment
Central Coop Private Bus Companies
・・・
ITS Center
Data Gathering Sever
• Seamless Traffic Condition Information
• Route Information based upon the Processed real-time Congestion
• Transport Information• Transit Information• Bus Location
Information• Weather Information• Air Pollution
Information
Processed Information
Data ProcessingCCTV Image
Traffic Volume(Motion Picture Analysis)
Traffic Volume(Motion Picture Analysis)
Signal cycle is controlled by traffic
volume data.
Adaptive Signal Control
Network Equipment
Traffic Signal Controller
Traffic Signal
Sonic Detector
CCTV DetectorCCTV Image
Traffic Volume(Motion Picture Analysis)
Traffic Volume(Motion Picture Analysis)
Signal cycle is controlled by traffic
volume data.
(Gathered Information)FETRANSPOR SuperVia METRO CCR-Barcas
SMARTSIS RADIO CABSocicamTaxi Association
Rio OnibusCET-Rio SECONSERVA SMTR Central Coop
WEB server
Information Provision Console
COR
VMS
Network Equipment
VMS Server
INFOVIA NETWORK
VMS Controller
VMS Board
VMS
Network Equipment
VMS Controller
VMS Board
Fiber Optic Network (CET-Rio)
orGPRS
Network Equipment
・・・
Route InformationTravel Time
Work Zone InformationAccident Information
Route InformationTravel Time
Work Zone InformationAccident Information
Central Coop Private Bus CompaniesFETRANSPOR SuperVia METRO CCR-Barcas
SMARTSIS RADIO CABSocicamTaxi Association
Rio OnibusCET-Rio SECONSERVA SMTR Central Coop
ITS Center
【Legend】
Scope of Project Package 1(ITS Center)
(Provided Information)
ITS Center
Data Gathering Sever
• Seamless Traffic Condition Information
• Route Information based upon the Processed real-time Congestion
• Transport Information• Transit Information• Bus Location
Information• Weather Information• Air Pollution
Information
Processed Information
Data Processing
(Gathered Information)
WEB server
Information Provision Console

The Federative Republic of Brazil Study on the Introduction of Intelligent Transport Systems Final Report
9-66
Table 9-23 Cost of Project Package 3
Source: JICA Study Team
(6) Implementation Plan Table 9-24 shows the implementation schedule for Project Package 3 including preparation,
procurement, implementation, and commissioning test. The implementation plan is proposed on the basis of the following conditions:
1) Preparation Stage Financial preparation works shall be completed by the end of 2013. The works shall be
finished before the commencement of the preparation of the financial source for the procurement and implementation stages.
2) Procurement Stage The procurement period, which includes the detailed design, tender, and contract, will be 12
months and shall be completed by January 2015.
In this stage, preliminary application for the installation of equipment shall be made to CET-Rio.
3) Implementation Stage The implementation will commence in February 2015 after the contract.
The implementation period will be 15 months including survey and design (5 months), manufacturing (6 months), factory inspection (1 month), equipment installation (2 months), commissioning test (1 month), and trial operation and site training (1 month).
4) Overall Test The overall commissioning test shall be conducted in June 2016 before taking over to check
the interconnection among the equipment of Project Package 1, Project Package 2, and Project Package 3.
Project Package 3 Exchange rate : BRL1=JPY 46.92 as of March 26, 2013
No. Item QuantitiesUnit Cost
(1000JPY)Total
(1000JPY)Total
(1000BRL)Remarks
1 Dynamic Signal Optimization System 502,000 10,6991-1 Signal with Signal Controller (4sets) 44 6,000 264,000 5,6271-2 Sensor(Image recognition Type) (4sets) 44 2,000 88,000 1,8761-3 Sensor(Loop-coil Type or Ultrasonic Type) (4sets) 44 2,000 88,000 1,8761-4 Network Equipment 44 500 22,000 4691-5 Signal Control Server 1 40,000 40,000 8532 Variable Message Signboard System (VMS system) 546,000 11,637
2-1 VMS Board (4 lanes with 10 characters) 32 12,000 384,000 8,184 including supporting structure
2-2 VMS Controller 32 3,000 96,000 2,0462-3 Network Equipment 32 500 16,000 3412-4 Variable Message Signboard System (VMS system) Server 1 50,000 50,000 1,066
Sub total 1,048,000 22,336
3 Installation and Test 1 104,800 2,234 1~2 *10% Sub total 104,800 2,234
1,152,800 24,569Total
Equipment

The Federative Republic of Brazil Study on the Introduction of Intelligent Transport Systems Final Report
9-67
Table 9-24 Implementation Schedule of Project Package 3
Source: JICA Study Team
Preparation stageFinance PreparationSelection of Consultant
Procurement stageDetail designConfirmation of Exsiting EquipmentTender Negotiation/Contract Preliminary Application for implementation
Implementation Stage Survey/Design ManufacturingFactory InspectionInstallationCommissioning TestTrial Operation and Site Training
Over All Test
: Work Item
:Work Item of Administrator
: Application period and Discussion
4th QT 1st QT 2nd QT 3rd QT 4th QT
Over All Test
2nd QT 3rd QT 4th QT 1st QT 2nd QT 3rd QTItem
2013 2014 2015 20161st QT 2nd QT 3rd QT 4th QT 1st QT
Olympic
Oly
mpi
c

The Federative Republic of Brazil Study on the Introduction of Intelligent Transport Systems Final Report
9-68
As preliminary design for each ITS project, from the Figure 9-29 to the Figure 9-39 shows schematic diagram for each project package.
Source: JICA Study Team
Figure 9-29 Schematic Diagram of Preliminary Design for ITS Project (1/11)
Sche
mat
ic d
iagr
am o
f Pre
limin
ary
Des
ign
for I
TS P
roje
ct
Tabl
e of
Con
tent
s
Tota
l Sys
tem
Dia
gram
Pack
age1
ITS
Cen
ter S
yste
m D
iagr
am
Pack
age1
ITS
Cen
ter /
Ope
ratio
n C
ente
r /
Term
inal
Pack
age2
Sys
tem
Dia
gram
Pack
age2
Bus
Ope
rato
r Cen
ter/
Bus
Ter
min
al
Pack
age2
Bus
Sto
p / I
nsid
e B
us
Pack
age3
Sys
tem
Dia
gram
Pack
age3
CO
R in
CET
Pack
age3
VM
S
Pack
age3
Ada
ptiv
e Si
gnal
Con
trol
Pla
n
1 2 3 4 5 6 7 8 9 10
Nam
eN
oR
emar
ks

The Federative Republic of Brazil Study on the Introduction of Intelligent Transport Systems Final Report
9-69
Source: JICA Study Team
Figure 9-30 Schematic Diagram of Preliminary Design for ITS Project (2/11)

The Federative Republic of Brazil Study on the Introduction of Intelligent Transport Systems Final Report
9-70
Source: JICA Study Team
Figure 9-31 Schematic Diagram of Preliminary Design for ITS Project (3/11)

The Federative Republic of Brazil Study on the Introduction of Intelligent Transport Systems Final Report
9-71
Source: JICA Study Team
Figure 9-32 Schematic Diagram of Preliminary Design for ITS Project (4/11)

The Federative Republic of Brazil Study on the Introduction of Intelligent Transport Systems Final Report
9-72
Source: JICA Study Team
Figure 9-33 Schematic Diagram of Preliminary Design for ITS Project (5/11)

The Federative Republic of Brazil Study on the Introduction of Intelligent Transport Systems Final Report
9-73
Source: JICA Study Team
Figure 9-34 Schematic Diagram of Preliminary Design for ITS Project (6/11)

The Federative Republic of Brazil Study on the Introduction of Intelligent Transport Systems Final Report
9-74
Source: JICA Study Team
Figure 9-35 Schematic Diagram of Preliminary Design for ITS Project (7/11)
No.
Des
tinat
ion
Dep
artu
re
Tim
eC
ondi
tion
583
Cor
cova
do10
:13
Del
ay42
2N
itero
i10
:15
On-
Tim
e
451
Barra
da
Tiju
ca10
:18
On-
Tim
e
433
Cop
acab
ana
10:2
0D
elay
Bus
Sto
p / I
nsid
e B
usB
US
STO
P
Insi
de B
us
No
Nam
ePa
ckag
e N
ame
Pack
age
2 6
Loca
tion
of B
us S
top
Info
rmat
ion
Pane
l at B
us S
top
: 46
Info
rmat
ion
Dis
play
in th
e B
us :
567
Info
rmat
ion
Pane
l
Info
rmat
ion
Dis
play

The Federative Republic of Brazil Study on the Introduction of Intelligent Transport Systems Final Report
9-75
Source: JICA Study Team
Figure 9-36 Schematic Diagram of Preliminary Design for ITS Project (8/11)

The Federative Republic of Brazil Study on the Introduction of Intelligent Transport Systems Final Report
9-76
Source: JICA Study Team
Figure 9-37 Schematic Diagram of Preliminary Design for ITS Project (9/11)

The Federative Republic of Brazil Study on the Introduction of Intelligent Transport Systems Final Report
9-77
Source: JICA Study Team
Figure 9-38 Schematic Diagram of Preliminary Design for ITS Project (10/11)
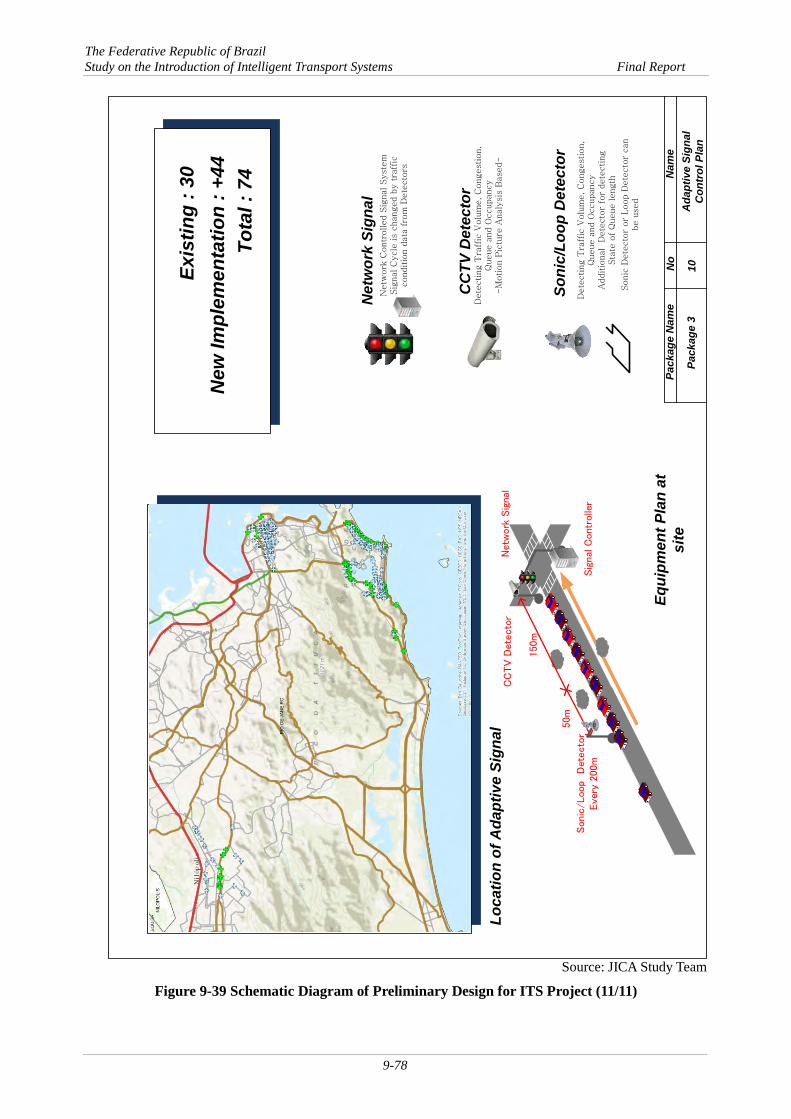
The Federative Republic of Brazil Study on the Introduction of Intelligent Transport Systems Final Report
9-78
Source: JICA Study Team
Figure 9-39 Schematic Diagram of Preliminary Design for ITS Project (11/11)
CC
TV
Dete
cto
r
150m
50m
Dete
cting T
raff
ic V
olu
me, C
ongestion,
Queue a
nd O
ccupancy
-M
otion P
ictu
re A
naly
sis
Based-
Netw
ork
Contr
olled S
ignal Syste
m
Sig
nal C
ycle
is c
hanged b
y t
raff
ic
conditio
n d
ata
fro
m D
ete
cto
rs
Sig
nal
Contr
olle
r
Netw
ork
Sig
nal
Exis
ting
: 30
New
Impl
emen
tatio
n : +
44
Tota
l : 7
4
Ada
ptiv
e Si
gnal
C
ontr
ol P
lan
No
Nam
ePa
ckag
e N
ame
Pack
age
3 10
Loc
atio
n of
Ada
ptiv
e Si
gnal
Net
wor
k Si
gnal
CC
TV D
etec
tor
Equi
pmen
t Pla
n at
si
te
Dete
cting T
raff
ic V
olu
me, C
ongestion,
Queue a
nd O
ccupancy
Additio
nal D
ete
cto
r fo
r dete
cting
Sta
te o
f Q
ueue length
Soni
c/Lo
op D
etec
tor
Sonic
Dete
cto
r or
Loop D
ete
cto
r can
be u
sed
Sonic
/Loop
Dete
cto
rEve
ry 2
00m

The Federative Republic of Brazil Study on the Introduction of Intelligent Transport Systems Final Report
10-1
CHAPTER 10 CLARIFICATION OF CURRENT ITS CONDITION IN THE FEDERAL DISTRICT
10.1 REGIONAL CHARACTERISTICS OF THE FEDERAL DISTRICT
10.1.1 Administration
The Federal District (Distrito Federal: DF) is located in the central area of Brazil, as shown in the map in Figure 10-1.
Source: Google Earth, Open Street Map
Figure 10-1 Location of DF
State Boundaries in Brazil
Sector Boundaries in the Federal District
Federal District (DF)
Federal District Federative Republic of Brazil

The Federative Republic of Brazil Study on the Introduction of Intelligent Transport Systems Final Report
10-2
The DF is divided into 31 administrative regions (Regiões Administrativas: RAs) as shown in Table 10-1. These RAs function as typical cities but they do not have mayors or municipal assemblies. Instead, DF RAs are managed by regional administrators and secretaries. Brasília is the main RA with the vast majority of jobs concentrated on it. Brasília also hosts the federal agencies, the Senate, Congress, and ministries.
Table 10-1 Administrative Division in DF Regiões Administrativas (RAs) Área (km²) Distrito Federal (DF) 5,789.16
RA I – Brasília 450.20
RA II – Gama 276.34
RA III – Taguatinga 105.00
RA IV – Brazlândia 474.83
RA V – Sobradinho 287.60
RA VI – Planaltina 1,534.69
RA VII – Paranoá 853.33
RA VIII – Núcleo Bandeirante 5.00
RA IX – Ceilândia 230.33
RA X – Guará 37.50
RA XI – Cruzeiro 2.80
RA XII – Samambaia 102.60
RA XIII – Santa Maria 215.86
RA XIV – São Sebastião 383.71
RA XV – Recanto das Emas 101.22
RA XVI – Lago Sul 183.39
RA XVII – Riacho Fundo 25.50
RA XVIII – Lago Norte 64.60
RA XIX – Candangolândia 6.61
RA XX – Águas Claras 31.50
RA XXI – Riacho Fundo II 30.60
RA XXII – Sudoeste / Octogonal 6.20
RA XXIII – Varjão 1.50
RA XXIV – Parque Way 64.20
RA XXV – SCIA (Estrutural) 29.00
RA XXVI – Sobradinho II 285.00
Jardim Botânico 0.00
RA XXVIII - Itapoá 0.00
S I A 0.00
Vicente Pires 0.00
Source: CODEPLAN Companhia de Planejamento do Distrito Federal – 2010

The Federative Republic of Brazil Study on the Introduction of Intelligent Transport Systems Final Report
10-3
The administrative division of Brazil consists of 26 states and one DF. Similarly, metropolitan regions, which are not political organizations, are defined by the Brazilian Institute of Geography and Statistics (Instituto Brasileiro de Geografia e Estatística: IBGE). The RIDE of DF and surrounding areas consist of the DF and 21 municipalities as shown in Figure 10-2 (See Table 2-1 of Chapter 2).
Source: Google earth
Figure 10-2 Administrative Boundaries of RIDE from DF and Surrounding Areas
Area [sq km] Brazil 8,514,861
RIDE 55,435
DF 5,802
Japan 377,950
Tokyo Prefecture
2,103
Source: IBGE, The Statistics
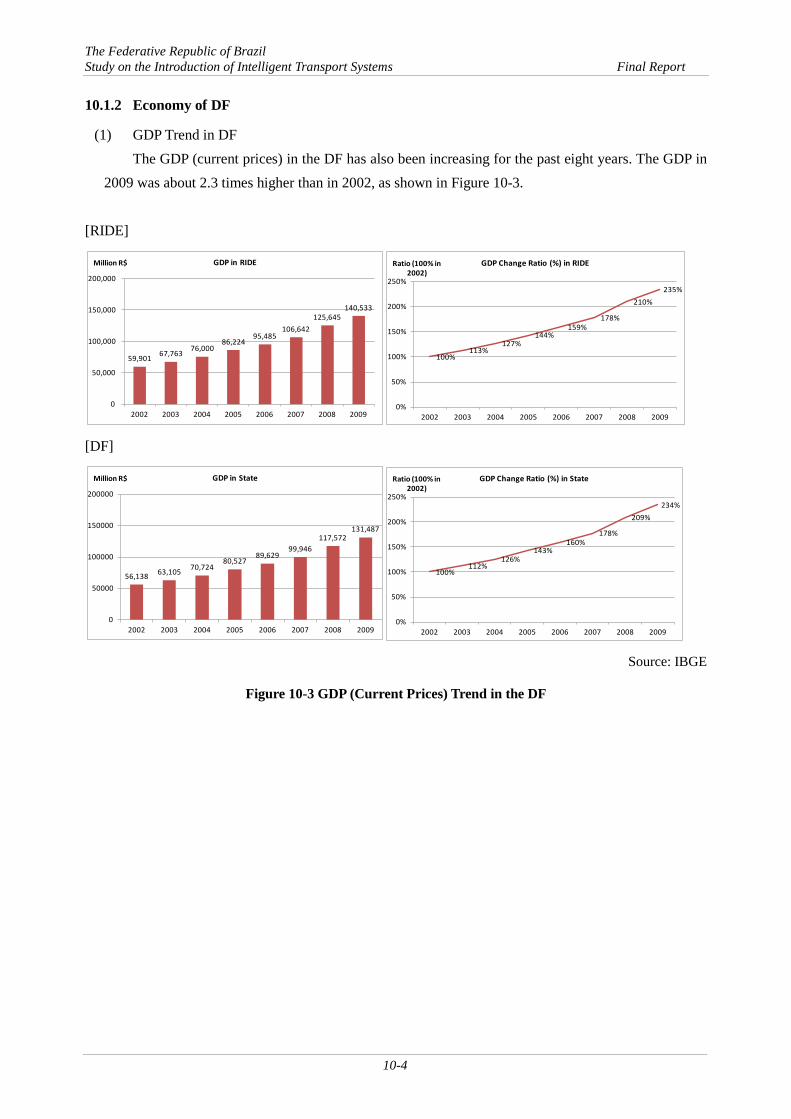
The Federative Republic of Brazil Study on the Introduction of Intelligent Transport Systems Final Report
10-4
10.1.2 Economy of DF
(1) GDP Trend in DF The GDP (current prices) in the DF has also been increasing for the past eight years. The GDP in
2009 was about 2.3 times higher than in 2002, as shown in Figure 10-3. [RIDE]
[DF]
Source: IBGE
Figure 10-3 GDP (Current Prices) Trend in the DF
59,901 67,76376,000
86,22495,485
106,642125,645
140,533
0
50,000
100,000
150,000
200,000
2002 2003 2004 2005 2006 2007 2008 2009
Million R$ GDP in RIDE
100%113%
127%144%
159%178%
210%235%
0%
50%
100%
150%
200%
250%
2002 2003 2004 2005 2006 2007 2008 2009
Ratio (100% in 2002)
GDP Change Ratio (%) in RIDE
56,138 63,105 70,72480,527
89,62999,946
117,572131,487
0
50000
100000
150000
200000
2002 2003 2004 2005 2006 2007 2008 2009
Million R$ GDP in State
100%112%
126%143%
160%178%
209%234%
0%
50%
100%
150%
200%
250%
2002 2003 2004 2005 2006 2007 2008 2009
Ratio (100% in 2002)
GDP Change Ratio (%) in State

The Federative Republic of Brazil Study on the Introduction of Intelligent Transport Systems Final Report
10-5
(2) GDP per Capita in DF 1) Trend in the DF
The GDP (current prices) per capita in the DF has also been increasing for the past eight years. GDP per capita in 2009 was almost double of that in 2002 as shown in Figure 10-4.
[RIDE]
[DF]
Source: IBGE
Figure 10-4 Trend of GDP (Current Prices) per Capita in the DF
The DF RAs GDP per capita is shown in Figure 10-5. It can be noted that Brasília and immediate
satellite cities (Lago Norte, Lago Sul, Sudoeste Octogonal, and Parque Way) are the richest areas. This reflects the job concentration in the region.
18,821 20,702 22,593 24,957 26,93330,409
34,36237,721
0
10000
20000
30000
40000
50000
60000
2002 2003 2004 2005 2006 2007 2008 2009
R$ GDP per Capita in RIDE
100% 110% 120%133%
143%162%
183%200%
0%
50%
100%
150%
200%
250%
2002 2003 2004 2005 2006 2007 2008 2009
Ratio (100% in 2002)
GDP per Capita Change Ratio (%) in RIDE
25,74728,282
30,99134,515
37,59940,696
45,97850,438
0
10000
20000
30000
40000
50000
60000
2002 2003 2004 2005 2006 2007 2008 2009
R$ GDP per Capita in State
100% 110%120%
134%146%
158%179%
196%
0%
50%
100%
150%
200%
250%
2002 2003 2004 2005 2006 2007 2008 2009
Ratio (100% in 2002)
GDP per Capita Change Ratio (%) in State

The Federative Republic of Brazil Study on the Introduction of Intelligent Transport Systems Final Report
10-6
Source: CODEPLAN Survey
Figure 10-5 2011 GDP per Capita in 2011 of the DF RAs
R$ -
R$ 1,000.00
R$ 2,000.00
R$ 3,000.00
R$ 4,000.00
R$ 5,000.00
R$ 6,000.00
R$ 7,000.00
RA
I - B
rasí
lia
RA
XV
I – L
ago
Sul
RA
XV
III –
Lag
o N
orte
R
A X
XII
– Su
does
te / …
R
A X
XIV
– P
arqu
e W
ay
RA
XX
VII
- Jar
dim
…
RA
II –
Gam
a R
A II
I – T
agua
tinga
R
A V
– S
obra
dinh
o R
A V
III –
Núc
leo …
R
A X
– G
uará
R
A X
I – C
ruze
iro
RA
XIX
– C
anda
ngol
ândi
a R
A X
X –
Águ
as C
lara
s R
A X
XV
I – S
obra
dinh
o II
Vic
ente
Pire
s R
A IV
– B
razl
ândi
a R
A V
I – P
lana
ltina
R
A IX
– C
eilâ
ndia
R
A X
II –
Sam
amba
ia
RA
XIII
– S
anta
Mar
ia
RA
XIV
– S
ão S
ebas
tião
RA
XV
II –
Ria
cho
Fund
o R
A X
XI –
Ria
cho
Fund
o II
S I A
R
A V
II –
Para
noá
RA
XV
– R
ecan
to d
as E
mas
R
A X
XIII
– V
arjã
o R
A X
XV
– S
CIA
…
RA
XX
VIII
- Ita
poã
DF RAs GDP per Capita
Renda Percapita

The Federative Republic of Brazil Study on the Introduction of Intelligent Transport Systems Final Report
10-7
2) Comparison of GDP Data in Brazil As shown in Figure 10-6, the DF GDP (current prices) per capita is the largest when compared
among the country and RIDE’s GDP per capita. In terms of trends, RIDE’s GDP per capita has grown faster than the DF and the country. Thus, this data shows that the DF and surrounding areas have a large potential for growth and are expanding economically.
Source: IBGE
Figure 10-6 Trend of GDP (Current Prices) per Capita in the DF
16,918
50,438
37,721
0
10,000
20,000
30,000
40,000
50,000
60,000
Country Distrito Federal RIDE
R$ GDP per Capita (2009)
100%
120%
140%
160%
180%
200%
220%
2002 2003 2004 2005 2006 2007 2008 2009
Ratio (100% in 2002) GDP per Capita Change Ratio (%)
RIDE
Distrito Federal
Country
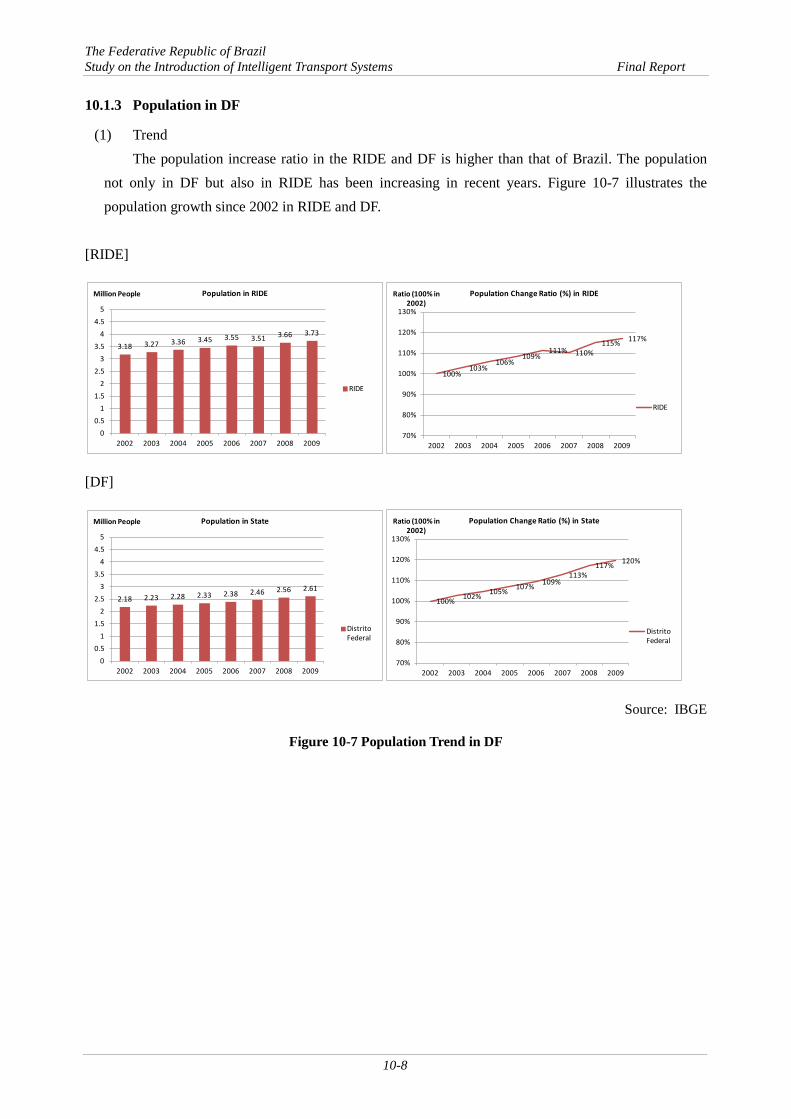
The Federative Republic of Brazil Study on the Introduction of Intelligent Transport Systems Final Report
10-8
10.1.3 Population in DF
(1) Trend The population increase ratio in the RIDE and DF is higher than that of Brazil. The population
not only in DF but also in RIDE has been increasing in recent years. Figure 10-7 illustrates the population growth since 2002 in RIDE and DF.
[RIDE]
[DF]
Source: IBGE
Figure 10-7 Population Trend in DF
3.18 3.27 3.36 3.45 3.55 3.51 3.66 3.73
00.5
11.5
22.5
33.5
44.5
5
2002 2003 2004 2005 2006 2007 2008 2009
Million People Population in RIDE
RIDE
100%103%
106%109%
111% 110%115% 117%
70%
80%
90%
100%
110%
120%
130%
2002 2003 2004 2005 2006 2007 2008 2009
Ratio (100% in 2002)
Population Change Ratio (%) in RIDE
RIDE
2.18 2.23 2.28 2.33 2.38 2.46 2.56 2.61
00.5
11.5
22.5
33.5
44.5
5
2002 2003 2004 2005 2006 2007 2008 2009
Million People Population in State
Distrito Federal
100% 102% 105% 107% 109%113%
117% 120%
70%
80%
90%
100%
110%
120%
130%
2002 2003 2004 2005 2006 2007 2008 2009
Ratio (100% in 2002)
Population Change Ratio (%) in State
Distrito Federal

The Federative Republic of Brazil Study on the Introduction of Intelligent Transport Systems Final Report
10-9
(2) Distribution The DF is the 20th largest state in terms of population in Brazil. The population growth ratio
between 2001 and 2011 of DF is in the range from 1.19 to 1.25, which is relatively high in Brazil. Figure 10-8 shows the growth around the main regions in Brazil. The population in RIDE is concentrated in the DF (Brasilia and satellite cities) and some surrounding cities such as Luziania and Aguas Lindas de Goias. In RIDE, the population share of the DF (Brasilia and satellite cities) is about 70% as shown in Figure 10-16.
Source: IBGE, Figure made by the JICA Study Team
Figure 10-8 Population Distribution of Cities in RIDE
69%5%
4%4%3%2% 2%
11%
Population 2010BRASILIA
LUZIANIA
AGUAS LINDAS DE GOIASVALPARAISO DE GOIASFORMOSA
NOVO GAMA
PLANALTINA
Others
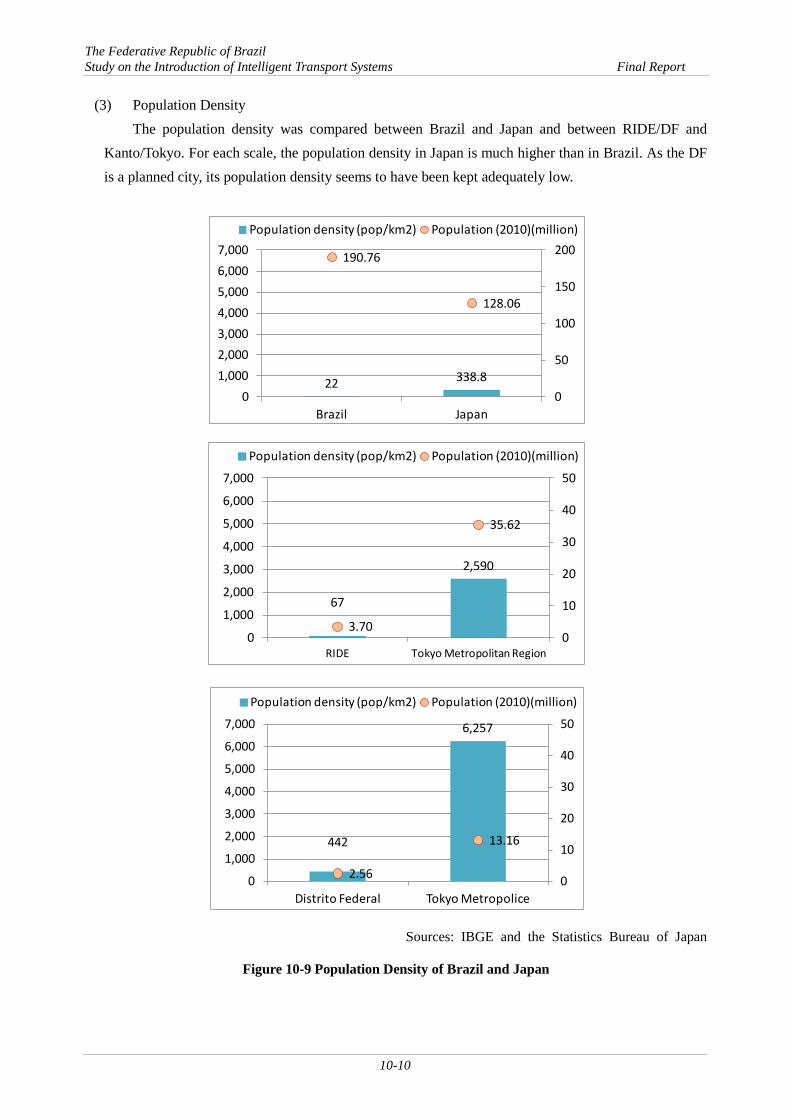
The Federative Republic of Brazil Study on the Introduction of Intelligent Transport Systems Final Report
10-10
(3) Population Density The population density was compared between Brazil and Japan and between RIDE/DF and
Kanto/Tokyo. For each scale, the population density in Japan is much higher than in Brazil. As the DF is a planned city, its population density seems to have been kept adequately low.
Sources: IBGE and the Statistics Bureau of Japan
Figure 10-9 Population Density of Brazil and Japan
22 338.8
190.76
128.06
0
50
100
150
200
01,0002,0003,0004,0005,0006,0007,000
Brazil Japan
Population density (pop/km2) Population (2010)(million)
67
2,590
3.70
35.62
0
10
20
30
40
50
0
1,000
2,000
3,000
4,000
5,000
6,000
7,000
RIDE Tokyo Metropolitan Region
Population density (pop/km2) Population (2010)(million)
442
6,257
2.56
13.16
0
10
20
30
40
50
0
1,000
2,000
3,000
4,000
5,000
6,000
7,000
Distrito Federal Tokyo Metropolice
Population density (pop/km2) Population (2010)(million)

The Federative Republic of Brazil Study on the Introduction of Intelligent Transport Systems Final Report
10-11
Table 10-2 shows the detailed population and density information for each DF RA. It can be noted that Ceilândia is the most populated city, with around 16% of DF’s population. On the other hand, Brasília only holds 8.2% percent of DF’s population.
Table 10-2 DF RAs Demographic Information Administrative Regions Population 2011 % Pop. 2011 Area (km²) Density (pop/km2)
Distrito Federal 2,556,149 100.0% 5,789.16 441.54 RA I – Brasília 209,926 8.2% 450.20 466.29
RA II – Gama 127,475 5.0% 276.34 461.30
RA III – Taguatinga 197,783 7.7% 105.00 1,883.65
RA IV – Brazlândia 49,418 1.9% 474.83 104.08
RA V – Sobradinho 59,024 2.3% 287.60 205.23
RA VI – Planaltina 161,812 6.3% 1,534.69 105.44
RA VII – Paranoá 42,427 1.7% 853.33 49.72
RA VIII – Núcleo Bandeirante 22,569 0.9% 5.00 4,513.80
RA IX – Ceilândia 404,287 15.8% 230.33 1,755.25
RA X – Guará 107,817 4.2% 37.50 2,875.12
RA XI – Cruzeiro 31,230 1.2% 2.80 11,153.57
RA XII – Samambaia 201,871 7.9% 102.60 1,967.55
RA XIII – Santa Maria 119,444 4.7% 215.86 553.34
RA XIV – São Sebastião 77,793 3.0% 383.71 202.74
RA XV – Recanto das Emas 124,755 4.9% 101.22 1,232.51
RA XVI – Lago Sul 29,677 1.2% 183.39 161.82
RA XVII – Riacho Fundo 35,268 1.4% 25.50 1,383.06
RA XVIII – Lago Norte 33,526 1.3% 64.60 518.98
RA XIX – Candangolândia 15,953 0.6% 6.61 2,413.46
RA XX – Águas Claras 109,935 4.3% 31.50 3,490.00
RA XXI – Riacho Fundo II 37,051 1.4% 30.60 1,210.82
RA XXII – Sudoeste/Octogonal 51,565 2.0% 6.20 8,316.94 RA XXIII – Varjão 9,021 0.4% 1.50 6,014.00
RA XXIV – Parque Way 19,648 0.8% 64.20 306.04
RA XXV – SCIA (estrutural) 32,148 1.3% 29.00 1,108.55
RA XXVI – Sobradinho II 94,279 3.7% 285.00 330.80
Jardim Botânico 23,856 0.9% 0.00 -
RA XXVIII - Itapoá 56,360 2.2% 0.00 -
S I A¹ 2,448 0.1% 0.00 -
Vicente Pires 67,783 2.7% 0.00 -
Source: CODEPLAN

The Federative Republic of Brazil Study on the Introduction of Intelligent Transport Systems Final Report
10-12
(4) Urban Sprawl and Shopping Center Location The population distribution in each RA is illustrated in Figure 10-10. The location of the main
shopping centers around DF is also shown. It can be noted that the population in DF is mainly distributed in the northeast, western, and southwest regions. Such distribution profile indicates an urban sprawl, although most jobs are located in Brasilia. In addition, majority of the shopping centers are located around Brasília, which is a concern during peak periods. Interviews with stakeholders indicated that such developments generated bottlenecks and queuing back up.
Source: JICA Study Team
Figure 10-10 Population and Main Shopping Centers of DF

The Federative Republic of Brazil Study on the Introduction of Intelligent Transport Systems Final Report
10-13
10.1.4 Sightseeing Resources and Statistics
(1) Sightseeing Resources Location On the website of the Ministério do Turismo, it is possible to search the main tourist destinations.
The sightseeing resources locations in the DF shown on the website are as follows:
Source: Ministério do Turismo
Figure 10-11 Main Sightseeing Locations in the DF
4
5
7
81
6
3 2

The Federative Republic of Brazil Study on the Introduction of Intelligent Transport Systems Final Report
10-14
(2) Inbound Tourists to DF The number of inbound international tourists to the DF is small but the increase in ratio between
2010 and 2011 is the highest in Brazil.
1) Origin Countries of Tourists The majority of international inbound tourists to the DF are from the United States and Portugal. In
addition, it should be noted that Spain and Italy are the third and fourth largest tourist origins to the DF.
Source: Ministério do Turismo
Figure 10-12 Inbound Tourists to the DF by Country of Origin
2) Monthly Tourist Arrivals
The DF has the monthly peak of inbound tourists in November and December.
Source: Ministério do Turismo
Figure 10-13 Monthly Tourist Arrivals to the DF
17,963 12,402
3,988 3,151 3,047 2,996
2,280 1,789
1,547 1,098
- 5,000 10,000 15,000 20,000
United States Portugal
Spain Italy
Argentina Peru
Germany France
Switzerland Canada
Total Tourists by Residence (2011)
0
1,000
2,000
3,000
4,000
5,000
6,000
7,000
Jan Feb Mar Apr May Jun Jul Aug Sep Oct Nov Dec
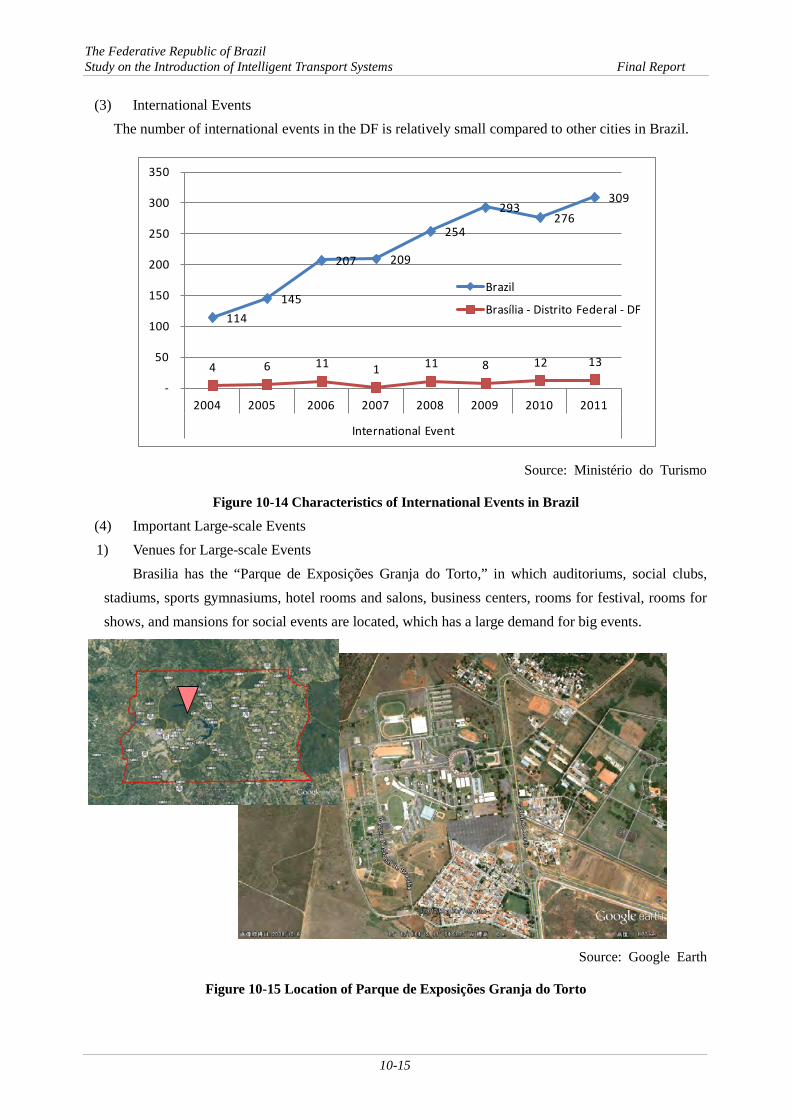
The Federative Republic of Brazil Study on the Introduction of Intelligent Transport Systems Final Report
10-15
(3) International Events The number of international events in the DF is relatively small compared to other cities in Brazil.
Source: Ministério do Turismo
Figure 10-14 Characteristics of International Events in Brazil
(4) Important Large-scale Events 1) Venues for Large-scale Events
Brasilia has the “Parque de Exposições Granja do Torto,” in which auditoriums, social clubs, stadiums, sports gymnasiums, hotel rooms and salons, business centers, rooms for festival, rooms for shows, and mansions for social events are located, which has a large demand for big events.
Source: Google Earth
Figure 10-15 Location of Parque de Exposições Granja do Torto
114 145
207 209
254
293 276
309
4 6 11 1 11 8 12 13
-
50
100
150
200
250
300
350
2004 2005 2006 2007 2008 2009 2010 2011
International Event
Brazil
Brasília - Distrito Federal - DF

The Federative Republic of Brazil Study on the Introduction of Intelligent Transport Systems Final Report
10-16
2) Upcoming Large-Scale Events Four large-scale events are scheduled in the DF for the next two years as shown in Table 10-3.
Table 10-3 Upcoming Large-scale Events in the DF No. Event Location Date No. of Visitors
1 FIFA Confederations Cup
Belo Horizonte, Brasília, Fortaleza, Recife, Rio de Janeiro, Salvador
15-30 June 2013 On average, more than 60,000 fans will watch each of the 16 matches
2 FIFA World Cup
Belo Horizonte, Brasília, Cuiabá, Curitiba, Fortaleza, Manaus, Natal, Porto Alegre, Recife, Rio de Janeiro, Salvador, São Paulo
12 June-13 July 2014 About 3.7 million tourists
Source: JICA Study Team
i) FIFA Confederations Cup (http://www.fifa.com/confederationscup/index.html) This competition is held every four years. In recent years, it has been seen as a warm-up event in the host country of the next FIFA World Cup. Brazil will host the next FIFA Confederations Cup in June, 2013. Matches will be held in six different cities including Brasilia.
ii) FIFA World Cup (http://www.copa2014.gov.br/en) The FIFA World Cup is one of the biggest sporting events held every four years. Brazil will host the next FIFA World Cup in 2014. Matches will be held in 13 cities including Brasilia.

The Federative Republic of Brazil Study on the Introduction of Intelligent Transport Systems Final Report
10-17
10.1.5 Geography and Natural Environment
(1) Geographic Conditions 1) Contours
Using the meshed altitude data derived from the Space Shuttle Radar contour, altitude figures were developed as shown in Figure 10-16. The RIDE is located in the inland mountainous region. The figures also show that the DF, especially Brasilia, is located on a plateau (also known as planalto central). In the central area of the DF, water bodies such as lakes and hills are located close to populated areas. [RIDE]
[DF]
Source: Shuttle Radar Topography Mission (SRTM) (http://www2.jpl.nasa.gov/srtm/)
Figure 10-16 Contours in RIDE and DF
(m)
(m)

The Federative Republic of Brazil Study on the Introduction of Intelligent Transport Systems Final Report
10-18
2) Topological Features in the DF Through spatial analysis, topological features such as hill shade and slope angle were calculated.
As shown in Figure 10-17, the DF is located on a plateau and surrounded by hills. In the case of torrential rain, this topological configuration could lead to potential flooding at nearby urban areas.
[Hills and Contour]
[Slope]
Source: Shuttle Radar Topography Mission (SRTM) (http://www2.jpl.nasa.gov/srtm/)
Figure 10-17 Topographic Characteristics of the DF
(m)

The Federative Republic of Brazil Study on the Introduction of Intelligent Transport Systems Final Report
10-19
(2) Weather Conditions The DF has mainly two seasons during the year: the rainy season and the dry season.
The rainy season occurs from October to April while the dry season occurs from May to September. During the rainy season, precipitation in the DF is higher than in Tokyo.
[Temperature]
Source: UNdata (United Nations Statistics Division)
Figure 10-18 Temperatures in DF and Tokyo
[Precipitation]
Source: UNdata (United Nations Statistics Division)
Figure 10-19 Precipitation Comparison in the DF and Tokyo
0
5
10
15
20
25
30
35
Jan
Feb
Mar
Apr
May Jun Jul
Aug
Sep
Oct
Nov
Dec
(℃)
Federal District
Maximum Dry Bulb Temperature
Minimum Dry Bulb Temperature
0
5
10
15
20
25
30
35
Jan
Feb
Mar
Apr
May Jun Jul
Aug
Sep
Oct
Nov
Dec
(℃)
Tokyo
Maximum Dry Bulb Temperature
Minimum Dry Bulb Temperature
0
50
100
150
200
250
Jan
Feb
Mar
Apr
May Jun Jul
Aug
Sep
Oct
Nov
Dec
(mm)
Federal District
Precipitation
0
50
100
150
200
250
Jan
Feb
Mar
Apr
May Jun Jul
Aug
Sep
Oct
Nov
Dec
(mm)
Tokyo
Precipitation
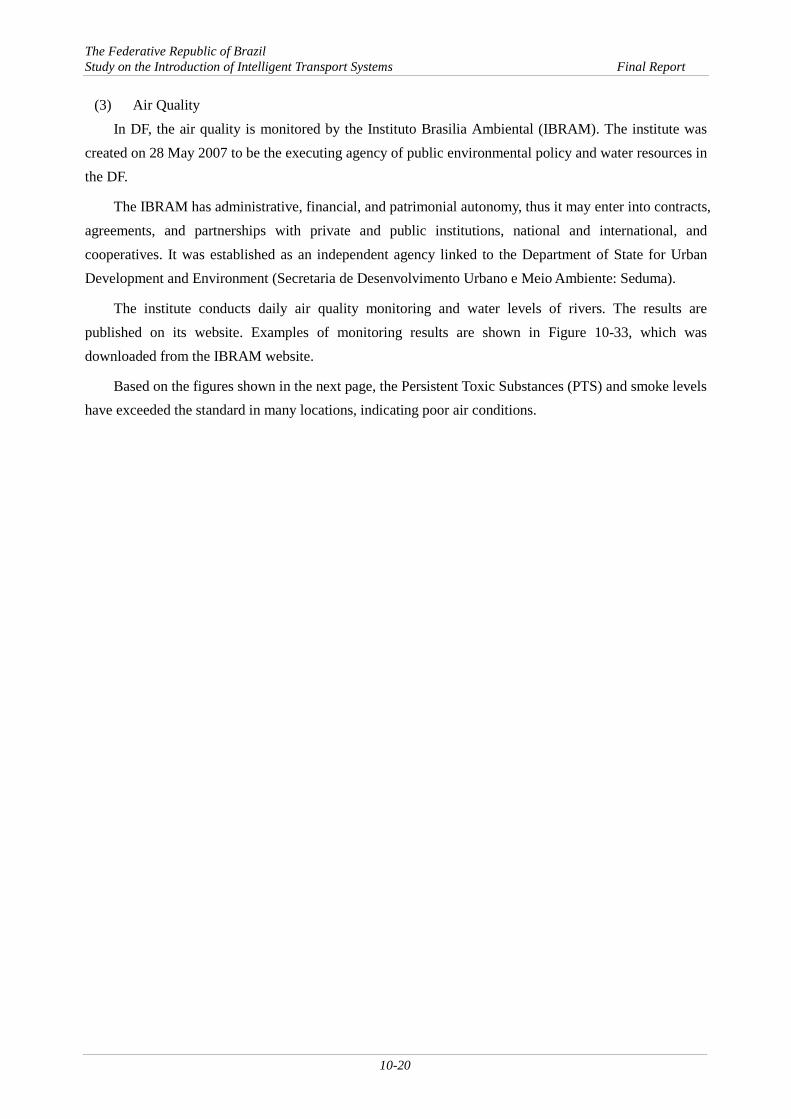
The Federative Republic of Brazil Study on the Introduction of Intelligent Transport Systems Final Report
10-20
(3) Air Quality In DF, the air quality is monitored by the Instituto Brasilia Ambiental (IBRAM). The institute was
created on 28 May 2007 to be the executing agency of public environmental policy and water resources in the DF.
The IBRAM has administrative, financial, and patrimonial autonomy, thus it may enter into contracts, agreements, and partnerships with private and public institutions, national and international, and cooperatives. It was established as an independent agency linked to the Department of State for Urban Development and Environment (Secretaria de Desenvolvimento Urbano e Meio Ambiente: Seduma).
The institute conducts daily air quality monitoring and water levels of rivers. The results are published on its website. Examples of monitoring results are shown in Figure 10-33, which was downloaded from the IBRAM website.
Based on the figures shown in the next page, the Persistent Toxic Substances (PTS) and smoke levels have exceeded the standard in many locations, indicating poor air conditions.

The Federative Republic of Brazil Study on the Introduction of Intelligent Transport Systems Final Report
10-21
Source: IBRAM
Figure 10-20 Air Quality Monitoring Result
143,54 154,69 167,72 162,66 152,73 156,14 172,54 179,60
0
50
100
150
200
250
300
jan/12 fev/12 mar/12 abr/12 mai/12 jun/12 jul/12 ago/12Conc
entr
ação
de
PTS (μ
g/m
3 )
Rodoviária do Plano Piloto
Médias mensais PTS Padrão primárioPadrão secundário
77,35 80,43
61,23
82,34 87,99
101,21
80,08
0
20
40
60
80
100
120
jan/12 fev/12 mar/12 abr/12 mai/12 jun/12 jul/12 ago/12Conc
entr
ação
de
Fum
aça (μ
g/m
3 )
Rodoviária do Plano Piloto
Médias mensais PTS Padrão primárioPadrão secundário
43,27 64,52 56,78 60,13 69,98
104,59 94,74
0
50
100
150
200
250
300
jan/12 fev/12 mar/12 abr/12 mai/12 jun/12 jul/12 ago/12
Conc
entr
ação
de
PTS (μ
g/m
3 ) Setor Comercial Sul
Médias mensais PTS Padrão primárioPadrão secundário
13,00 11,69 16,61 13,77 15,72
34,80
21,52
0
20
40
60
80
100
120
jan/12 fev/12 mar/12 abr/12 mai/12 jun/12 jul/12 ago/12
Conc
entr
ação
de
Fum
aça (μ
g/m
3 ) Setor Comercial Sul
Médias mensais PTS Padrão primárioPadrão secundário
250,68 246,93 270,21 267,22
242,65 250,90 232,25
250,80
0
50
100
150
200
250
300
jan/12 fev/12 mar/12 abr/12 mai/12 jun/12 jul/12 ago/12
Conc
entr
ação
de
PTS (μ
g/m
3 ) Taguatinga Centro
Médias mensais PTS Padrão primárioPadrão secundário
86,57 76,90
111,56 101,09
115,78 108,26
86,34
0
20
40
60
80
100
120
jan/12 fev/12 mar/12 abr/12 mai/12 jun/12 jul/12 ago/12Conc
entr
ação
de
Fum
aça (μ
g/m
3 )
Taguatinga Centro
Médias mensais PTS Padrão primárioPadrão secundário
170,18
232,99 210,27
158,71
258,33 243,71
274,41
0
50
100
150
200
250
300
jan/12 fev/12 mar/12 abr/12 mai/12 jun/12 jul/12 ago/12Conc
entr
ação
de
PTS (μ
g/m
3 )
Fercal I
Médias mensais PTS Padrão primárioPadrão secundário
42,69
25,36 30,77 35,89
55,69
70,99
43,60
0
20
40
60
80
100
120
jan/12 fev/12 mar/12 abr/12 mai/12 jun/12 jul/12 ago/12
Conc
entr
ação
de
Fum
aça (μ
g/m
3 ) Fercal I
Médias mensais PTS Padrão primárioPadrão secundário
384,39
714,23 676,67 702,15 828,35
1223,61 1240,02 1297,15
0
200
400
600
800
1000
1200
1400
jan/12 fev/12 mar/12 abr/12 mai/12 jun/12 jul/12 ago/12
Conc
entr
ação
de
PTS (μ
g/m
3 ) Ciplan
Médias mensais PTS Padrão primárioPadrão secundário
37,67 27,02
20,38
38,78
59,66 64,77
50,38
0
20
40
60
80
100
120
jan/12 fev/12 mar/12 abr/12 mai/12 jun/12 jul/12 ago/12Conc
entr
ação
de
Fum
aça (μ
g/m
3 ) Ciplan
Médias mensais PTS Padrão primárioPadrão secundário