chapter 8 school resources and student achievement: a review...
TRANSCRIPT
Chapter 8School Resources and StudentAchievement: A Review of Cross-CountryEconomic Research
Eric A. Hanushek and Ludger Woessmann
Abstract How do school resources affect students’ academic achievement? Thischapter provides a survey of economists’ work on the effect of expenditure andclass size on student achievement using different international student achievementtests, with a particular focus on the use of quasi-experimental research methods toaddress challenges of the identification of causal effects. Overall, the internationalevidence provides little confidence that quantitative measures of expenditure andclass size are a major driver of student achievement, across and within countries.The cross-country pattern suggests that class size is a relevant variable only insettings with low teacher quality. Among other school inputs, descriptive evidencesuggests that measures of the quality of inputs and, in particular, teachers are moreclosely related to student outcomes.
8.1 Introduction
How do school resources affect students’ academic achievement? A lot of work onthis question has emerged since Jan-Eric Gustafsson (2003) reviewed the literature.In particular, much research has used data from international student achievement
This is a slightly extended version of an extract from a much longer article previously publishedunder the title “The Economics of International Differences in Educational Achievement” in theHandbook of the Economics of Education, Vol. 3, edited by Eric A. Hanushek, Stephen Machin,and Ludger Woessmann, Amsterdam: North Holland, pp. 89–200, Copyright Elsevier (2011).We are grateful to Elsevier for granting us the right to reproduce the material here.
E.A. HanushekStanford University, NBER, and CESifo, Stanford, USAe-mail: [email protected]
L. Woessmann (&)University of Munich, Ifo Institute, CESifo, and IZA, Munich, Germanye-mail: [email protected]
© Springer International Publishing AG 2017M. Rosén et al. (eds.), Cognitive Abilities and Educational Outcomes,Methodology of Educational Measurement and Assessment,DOI 10.1007/978-3-319-43473-5_8
149
tests to shed new light on the question. Much of this research, in particular fromeconomists working in the field, has focused on challenges of the identification ofcausal effects by using quasi-experimental research methods. Some of the recentresearch is in line with the suggestion by Gustafsson (2007) that important analysiscould come from changes in the performance of different countries over time. Thischapter provides a survey of economists’ work on the effect of expenditure andclass size on student achievement using different international student achievementtests. Part of this research focusses on the challenge of overcoming possible bias incross-country estimation, part on the identification of causal effects withincountries.
Virtually all nations of the world today realize the research and policy value ofstudent performance data that come from testing the cognitive skills of students.While there is wide variation across nations in testing—differing by subject matter,grade level, purpose, and quality of testing—the idea of assessing what studentsknow as opposed to how long they have been in school has diffused around theworld, in part at the instigation of international development and aid agencies.Somewhat less known is that comparative cross-national testing has been going onfor a long time. Nations participated in common international assessments ofmathematics and science long before they instituted national testing programs.These common international assessments provide unique data for understandingboth the importance of various factors determining achievement and the impact ofskills on economic and social outcomes.
In the mid-1960s, international consortia started to develop and implementcomparisons of educational achievement across nations. Since then, the math,science, and reading performance of students in many countries have been tested onmultiple occasions using (at each occasion) a common set of test questions in allparticipating countries. By 2016, three major international testing programs aresurveying student performance on a regular basis: the Programme for InternationalStudent Assessment (PISA) testing math, science, and reading performance of15-year-olds on a three-year cycle since 2000, the Trends in InternationalMathematics and Science Study (TIMSS) testing math and science performance(mostly) of eighth-graders on a four-year cycle since 1995, and the Progress inInternational Reading Literacy Study (PIRLS) testing primary-school reading per-formance on a five-year cycle since 2001.
The research based on the international assessments goes in two differentdirections: research designed to understand the underlying determinants of cogni-tive skills and research focused on the consequences of skill differences. Here, wesimply focus on surveying the literature on school resources as one group ofdeterminants of international educational achievement, covering both evidenceacross countries and evidence within different countries. For research on studentbackground and institutional structures of the education system as two other groupsof possible determinants, see Sects. 4.2 and 4.4 in Hanushek and Woessmann(2011a). For the second line of research, see Sect. 5 in Hanushek and Woessmann(2011a), as well as Hanushek and Woessmann (2015). Furthermore, Sects. 1–3 inHanushek and Woessmann (2011a) provide a more detailed discussion of the
150 E.A. Hanushek and L. Woessmann
unique advantages of and concerns with the use of cross-country data, a briefeconomic motivation to frame the discussions and an overview and criticalassessment of the different available international datasets on educationalachievement.
The cross-country comparative approach provides a number of unique advan-tages over national studies: It can exploit institutional variation that does not existwithin countries; draw on much larger variation than is usually available within anycountry; reveal whether any result is country-specific or more general; test whethereffects are systematically heterogeneous in different settings; circumvent selectionissues that plague within-country identification by using system-level aggregatedmeasures; and uncover general-equilibrium effects that often elude studies in asingle country. The advantages come at the price of concerns about the limitednumber of country observations, the cross-sectional character of most availableachievement data, and possible bias from unobserved country factors like culture.
The standards of evidence throughout empirical economics have changed inrecent years, sometimes dramatically. The character of change also enters directlyinto our consideration of cross-country analyses. The analytical designs employedin the cross-country analyses we discuss have developed over time in a way thatparallels much of the related micro-econometric work within individual countries.The initial publications of comparative tests across nations by the organizations thatconducted the different studies tended to report bivariate associations. Subsequentanalyses performed multiple regressions in the form of educational productionfunctions that tried to address the most obvious perils of bias from interveningfactors by adding corresponding control variables. While initial studies estimatedinternational educational production functions at the aggregate country level, sub-sequent studies exploited the full variation of the international micro data.
More recently, several studies have started to employ econometric techniquessuch as instrumental-variable, regression-discontinuity, differences-in-differences,and different sorts of fixed-effects specifications in order to come closer to identi-fication of causal relationships in the international data on educational achievement.This applies both to the identification of causal effects within countries and to thechallenge of overcoming possible bias from unobserved country heterogeneity—e.g., in terms of cultural differences—in cross-country estimation. While thesedevelopments are far from complete at this time, we emphasize the issues ofidentification and interpretation in much of the discussion below.
We limit the coverage of this chapter to studies that make cross-country com-parisons. Based on this criterion, we cover only studies that estimate the samespecification for different countries or estimate a cross-country specification.Studies that use the international survey data for analysis within a single countrywill be referenced only insofar as they are directly relevant for the internationallycomparative approach.
8 School Resources and Student Achievement 151
8.2 International Evidence on Education ProductionFunctions
As is the case in the majority of the literature on educational production, the basicmodel underlying the literature on determinants of international educationalachievement resembles some form of the education production function:
T ¼ a0 þ a1Fþ a2Rþ a3Iþ a4Aþ e
where T is the outcome of the educational production process as measured, e.g., bytest scores of mathematics, science, and reading achievement. The vector F capturesfacets of student and family background characteristics, R is a vector of measures ofschool resources, I are institutional features of schools and education systems, andA is individual ability.
When estimating this equation within different countries, studies based oninternational data face the same methodological challenges as studies restricted to aspecific country (see Hanushek 1979, 2002; Todd and Wolpin 2003 for key issues inempirical identification of education production functions). The fundamental chal-lenge is that most inputs in the education production function are likely not to beexogenous in a statistical sense. Leading concerns derive from omitted variables,selection, and reverse causation. A key candidate of an omitted variable is studentability A, most dimensions of which tend to go unmeasured and are likely correlatedwith other inputs in important ways. An additional concern for research on most ofthe international tests is their cross-sectional structure which does not allow for panelor value-added estimations, so that temporally prior inputs are usually unobserved.School inputs will often be the outcome of choices of parents, administrators, andschools that are correlated with the error term of the production function. Given thissubstantial scope for endogeneity bias, least-squares estimates of the equation needto be interpreted with great care, even when they control for a large set of observableinput factors. This has led to the development of more elaborate techniques that try todraw on exogenous variation in the variables of interest.
In the following review of the literature, we will refer to the more descriptivestudies only briefly and mostly focus on studies trying to address the key identi-fication issues. There is, however, one specific aspect about making cross-countrycomparisons of estimates obtained from performing the same estimation in differentcountries: If one is willing to make the assumption that any bias is constant acrosscountries, then a cross-country comparison of estimates is feasible, even if inter-pretation of the size of each estimate is not.
The main challenges change when it comes to studies estimating cross-countryassociations. There are both unique advantages and specific concerns with usingcross-country data to estimate the determinants of educational achievement. At themost general level, cross-country estimation is able to get around the most pressingconcerns of bias from selection but introduces new kinds of omitted variableconcerns. Within-country variation is often subject to severe selection problems:
152 E.A. Hanushek and L. Woessmann
For example, students who choose to attend a well-equipped school may differalong both observable and unobservable dimensions from students taught in poorlyequipped schools. While many observable characteristics are often controlled for ineconometric analyses, thereby comparing students who are observationally equiv-alent, within-country estimates may still suffer from selection on unobservedcharacteristics. In cross-country analyses, one can aggregate the input variable ofinterest up to the country level, thereby circumventing the selection problem. Ineffect, the cross-country analysis then measures the impact of, for example, theaverage expenditure per student in a country on student achievement in the countryas a whole. Such cross-country analysis cannot be biased by standard issues ofselection at the individual level, as patterns of sorting cancel out at the system level.
The main cost to this—apart from the limited degrees of freedom at the countrylevel—is that unobserved heterogeneity at the country level may introduce newforms of omitted variable bias. For example, cultural factors such as “Asian values”may remain unobserved in the econometric model and correlate both with studentoutcomes and relevant inputs in the education production function. Educationsystems—and societies more generally—may also differ in other importantdimensions unobserved by the researcher. To address such concerns, the mainresults of cross-country studies should be checked for robustness to includingobvious correlates of the cultural factors as control variables at the country level.Another robustness check is to draw only on variation within major world regionsby including regional (continental) fixed effects. More fundamentally, somecross-country studies have started to adopt new techniques directly developed toaddress such issues of identification in particular contexts, and these studies will bethe main focus of the following review.
Early studies that employ the international student achievement tests to estimatesimilar education production function within different countries include Heynemanand Loxley (1983) and Toma (1996). Early studies using the cross-country varia-tion of international tests to estimate international education production functionson country-level observations include Bishop (1997), Hanushek and Kimko (2000),and Lee and Barro (2001). The first economic study to make use of the vastpotential of the international micro data on students’ achievement, family back-ground, and school inputs and of the broad array of institutional differences thatexists across countries to estimate extensive multivariate cross-country educationproduction functions is Woessmann (2003). While still subject to the prior issues ofcross-country identification, employing the rich student-level data on backgroundfactors allows to hold constant a large set of observable factors usually unavailablein national datasets.
Table 8.1 presents an example estimation of an international education pro-duction function.1 Using student-level data for 29 OECD countries from the 2003cycle of the PISA test of 15-year-olds, the model expresses individual studentachievement in math as a function of large set of input factors. While this is a basic
1See Woessmann et al. (2009) for additional background and robustness analyses.
8 School Resources and Student Achievement 153
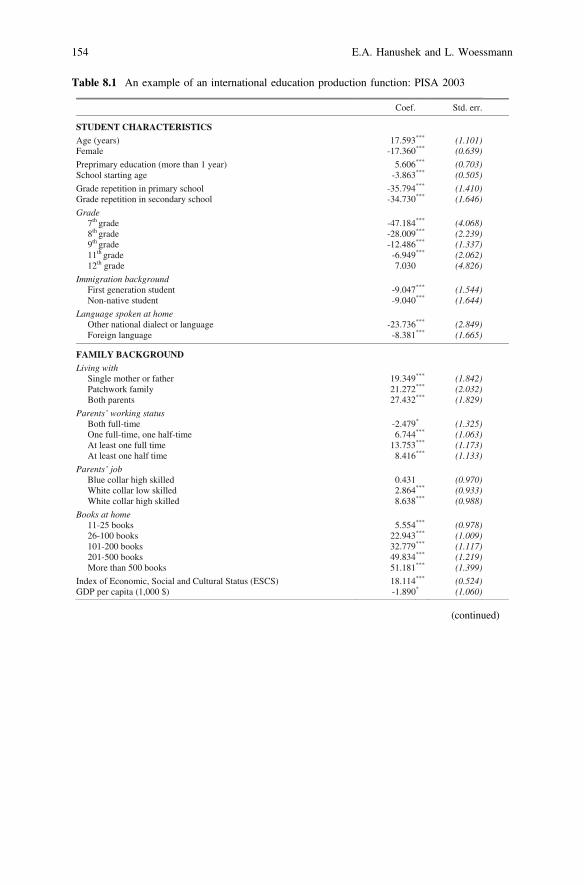
Table 8.1 An example of an international education production function: PISA 2003
Coef. Std. err.
STUDENT CHARACTERISTICS Age (years) 17.593*** (1.101)
063.71-elameF *** (0.639)
606.5)raey1nahterom(noitacudeyramirperP *** (0.703) 368.3-egagnitratsloohcS *** (0.505)
497.53-loohcsyramirpninoititeperedarG *** (1.410) 037.43-loohcsyradnocesninoititeperedarG *** (1.646)
Grade 7th grade -47.184*** (4.068) 8th grade -28.009*** (2.239) 9th grade -12.486*** (1.337) 11th grade -6.949*** (2.062) 12th grade 7.030 (4.826)
Immigration background 740.9-tnedutsnoitarenegtsriF *** (1.544) 040.9-tnedutsevitan-noN *** (1.644)
Language spoken at home 637.32-egaugnalrotcelaidlanoitanrehtO *** (2.849)
Foreign language -8.381*** (1.665)
FAMILY BACKGROUND Living with
943.91rehtafrorehtomelgniS *** (1.842) 272.12ylimafkrowhctaP *** (2.032) 234.72stneraphtoB *** (1.829)
Parents’ working status 974.2-emit-llufhtoB * (1.325) 447.6emit-flaheno,emit-llufenO *** (1.063) 357.31emitllufenotsaeltA *** (1.173) 614.8emitflahenotsaeltA *** (1.133)
Parents’ job 134.0dellikshgihralloceulB (0.970) 468.2dellikswolrallocetihW *** (0.933) 836.8dellikshgihrallocetihW *** (0.988)
Books at home 455.5skoob52-11 *** (0.978) 349.22skoob001-62 *** (1.009) 977.23skoob002-101 *** (1.117) 438.94skoob005-102 *** (1.219) 181.15skoob005nahteroM *** (1.399)
411.81)SCSE(sutatSlarutluCdnalaicoS,cimonocEfoxednI *** (0.524) GDP per capita (1,000 $) -1.890* (1.060)
(continued)
154 E.A. Hanushek and L. Woessmann

Coef. Std. err.
SCHOOL INPUTS School’s community location
622.3)000,001-000,3(nwoT * (1.531) 287.01)000,000,1-000,001(ytiC *** (1.890) 598.7elpoepnoillim1>htiwyticegraL *** (2.378)
471.1)$000,1(tnedutsreperutidnepxelanoitacudE *** (0.405) 474.1)scitamehtam(ezisssalC *** (0.067)
Shortage of instructional materials 081.01-llatatoN *** (2.576) 027.6ylgnortS *** (1.300) 530.0)keewrepsetunim(emitnoitcurtsnI *** (0.005)
Teacher education (share at school) 517.9srehcaetdeifitrecylluF *** (3.422)
Tertiary degree in pedagogy 6.573*** (2.010)
INSTITUTIONS Choice
585.75noitarepoetavirP *** (8.355) 938.18gnidnuftnemnrevoG *** (22.327)
Accountability 833.52smaxetixelanretxE * (10.054)
Assessments used to decide about students’ retention/promotion 12.185*** (1.631) Monitoring of teacher lessons by principal 4.557*** (1.343) Monitoring of teacher lessons by external inspectors 3.796*** (1.415) Assessments used to compare school to district/national performance 2.134* (1.259) Assessments used to group students -6.065*** (1.301)
Autonomy and its interaction with accountability Autonomy in formulating budget -9.609*** (2.178) External exit exams x Autonomy in formulating budget 9.143*** (3.119)
236.8-seiralasgnitratsgnihsilbatseniymonotuA *** (3.251) External exit exams x Autonomy in establishing starting salaries 5.868 (3.980)
Autonomy in determining course content 0.175 (1.907) External exit exams x Autonomy in determining course content 3.224 (2.858)
956.02srehcaetgnirihniymonotuA *** (2.249) External exit exams x Autonomy in hiring teachers -28.935*** (3.365)
497,912stnedutSSchools 8,245 Countries 29 R2 (at student level) 0.390 R2 (at country level) 0.872
Notes: Dependent variable: PISA 2003 international mathematics test score. Least-squares regressions weighted by students’ sampling probability. The models additionally control for imputation dummies and interaction terms between imputation dummies and the variables. Robust standard errors adjusted for clustering at the school level in parentheses (clustering at country level for all country-level variables, which are private operation, government funding, external exit exams, GDP per capita, and expenditure per student). Significance level (based on clustering-robust standard errors): *** 1 percent, ** 5 percent, * 10 percent.
Source: Own calculations based on Woessmann et al. (2009), who provide additional background details.
Table 8.1 (continued)
8 School Resources and Student Achievement 155
model that does not fully exploit the potential of the international data, the modelspecification already documents the rich set of background factors available fromthe student and school background questionnaires. Moreover, the international datadisplay wide variation in many of the potential inputs to achievement, thus allowingfor more precise estimation of any effects. At the individual level, the factorsinclude student characteristics such as age, gender, immigration, and preprimaryeducational attendance and family-background measures such as socio-economicstatus, parental occupation, family status, and the number of books in the home. Atthe school level, the model includes resource measures such as class size andshortage of materials, instruction time, teacher education, community location, andinstitutional factors such as a set of measures of teacher monitoring and studentassessment, different dimensions of school autonomy, and their interaction withaccountability measures. At the country level, this basic model includes a country’sGDP per capita, educational expenditure per student, and the institutional factors ofexternal exit exams, share of privately operated schools, and average governmentfunding of schools.
While the cross-sectional nature of this estimation allows for a descriptiveinterpretation only, it is worth noting that many measures of students’ individualand family background are systematically related to their achievement, as areseveral measures of the institutional structure of the school system. By contrast, thepoint estimate on class size, the classical measure of quantitative school inputs, iscounterintuitive,2 and the estimates on the more qualitative school inputs, whilepositive, are more limited than the background and institutional estimates. Themodel accounts for 39 % of the achievement variation at the student level and for87 % at the country level. That is, while unobserved factors such as ability dif-ferences are important at the individual level, the model is able to account statis-tically for most of the between-country variation in academic achievement. Thesebasic result patterns are broadly common to all studies of international educationproduction functions estimated on the different international student achievementtests. Here, we focus on one specific group of determinants, namely school inputs.Sections 4.2 and 4.4 in Hanushek and Woessmann (2011a) discuss the literature onthe other two groups of determinants—student and family background, as well asinstitutional structures of the education system—in greater detail.
2The coefficient on country-level spending is very small. While it is statistically significant,identification here comes from a very particular margin, as the correlation between spending andper-capita GDP (whose coefficient is negative here) in this model is as high as 0.93. Other studiestend to find a significant positive coefficient on GDP per capita, but not on spending. SeeHanushek and Woessmann (2011a) for more extensive discussion.
156 E.A. Hanushek and L. Woessmann
8.3 Evidence on School Inputs Across Countries
We start with research that uses variation in school inputs across countries.3 Thestudies reveal that in general, the cross-country association of student achievementwith resources tends to be relatively weak.
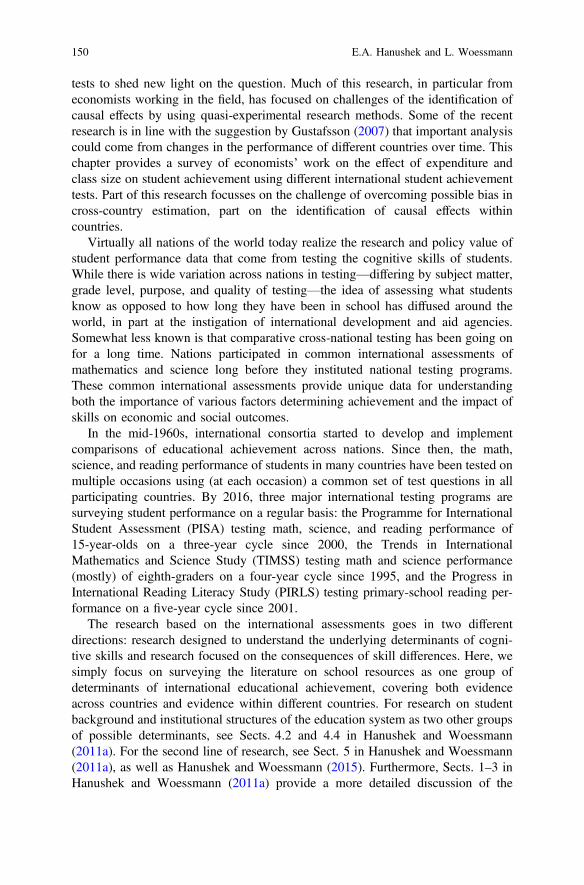
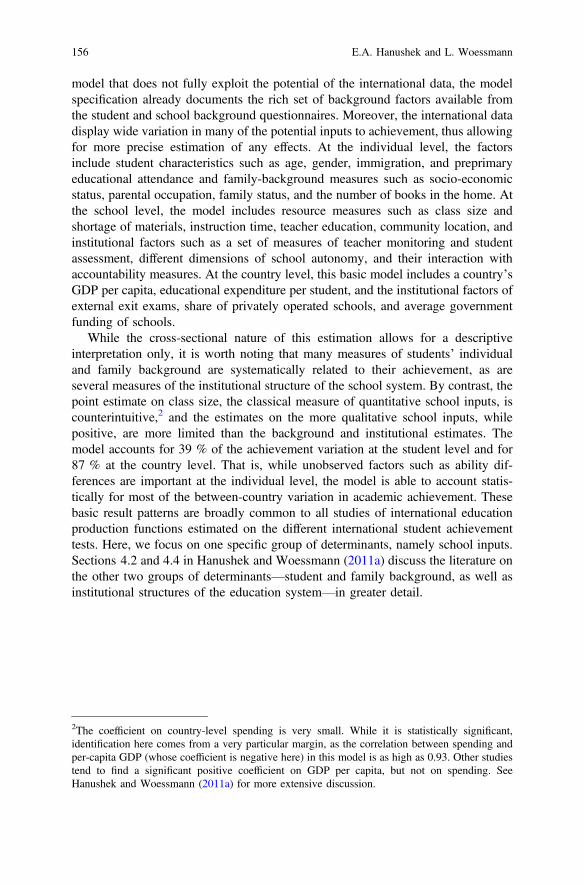
When looking across countries, the most straightforward starting point is thesimple association between the aggregate financial measure of average expenditureper student and average achievement. Figure 8.1 presents the international associ-ation between cumulative spending per student from age 6 to 15 and the averagemath achievement of 15-year-olds on the 2003 PISA test. Without considering thestrong outliers of Mexico and Greece, there is no association between spendinglevels and average achievement across countries.4 At the most basic level, countries
350
400
450
500
550
0 10000 20000 30000 40000 50000 60000 70000 80000
Mat
h pe
rfor
man
ce in
PIS
A 2
003
Cumulative educational expenditure per student
Mexico
Belgium
Iceland
FranceSweden
SwitzerlandDenmark
AustriaNorway
USA
ItalyPortugal
Spain
Korea
GermanyIreland
Czech Rep.
HungaryPoland
Slovak Rep.
Greece
Finland
NetherlandsCanada
Japan
Australia
R 2 = 0.15
R 2 = 0.01
Fig. 8.1 Expenditure per student and student achievement across countries. Notes Associationbetween average math achievement in PISA 2003 and cumulative expenditure on educationalinstitutions per student between age 6 and 15, in US dollars, converted by purchasing powerparities. Dark line regression line for full sample. Light line regression line omitting Mexico andGreece. Source Woessmann (2007)
3For a general overview of such studies see Table 2.6 in Hanushek and Woessmann (2011a).4With the two outliers, there is a weak positive association as long as other effects are ignored.Taken literally, the full-sample association suggests that $60,000 per student in additionalexpenditure (a quadrupling of spending in the low spending countries) is associated with about ahalf standard deviation improvement in scores. However, once a country’s GDP per capita iscontrolled for, the cross-country association between student achievement and expenditure losesstatistical significance and even turns negative, suggesting that the bivariate association is drivenby the omitted factor of average socio-economic status.
8 School Resources and Student Achievement 157
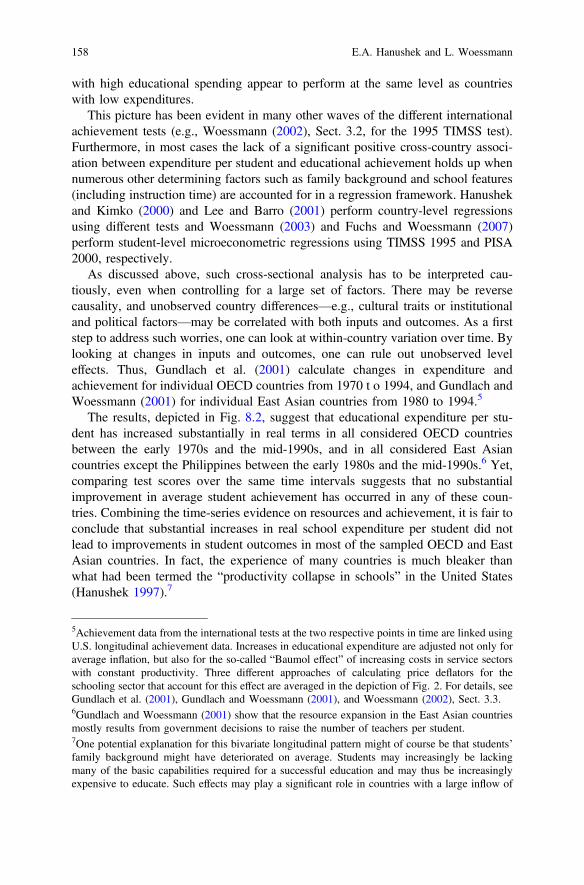
with high educational spending appear to perform at the same level as countrieswith low expenditures.
This picture has been evident in many other waves of the different internationalachievement tests (e.g., Woessmann (2002), Sect. 3.2, for the 1995 TIMSS test).Furthermore, in most cases the lack of a significant positive cross-country associ-ation between expenditure per student and educational achievement holds up whennumerous other determining factors such as family background and school features(including instruction time) are accounted for in a regression framework. Hanushekand Kimko (2000) and Lee and Barro (2001) perform country-level regressionsusing different tests and Woessmann (2003) and Fuchs and Woessmann (2007)perform student-level microeconometric regressions using TIMSS 1995 and PISA2000, respectively.
As discussed above, such cross-sectional analysis has to be interpreted cau-tiously, even when controlling for a large set of factors. There may be reversecausality, and unobserved country differences—e.g., cultural traits or institutionaland political factors—may be correlated with both inputs and outcomes. As a firststep to address such worries, one can look at within-country variation over time. Bylooking at changes in inputs and outcomes, one can rule out unobserved leveleffects. Thus, Gundlach et al. (2001) calculate changes in expenditure andachievement for individual OECD countries from 1970 t o 1994, and Gundlach andWoessmann (2001) for individual East Asian countries from 1980 to 1994.5
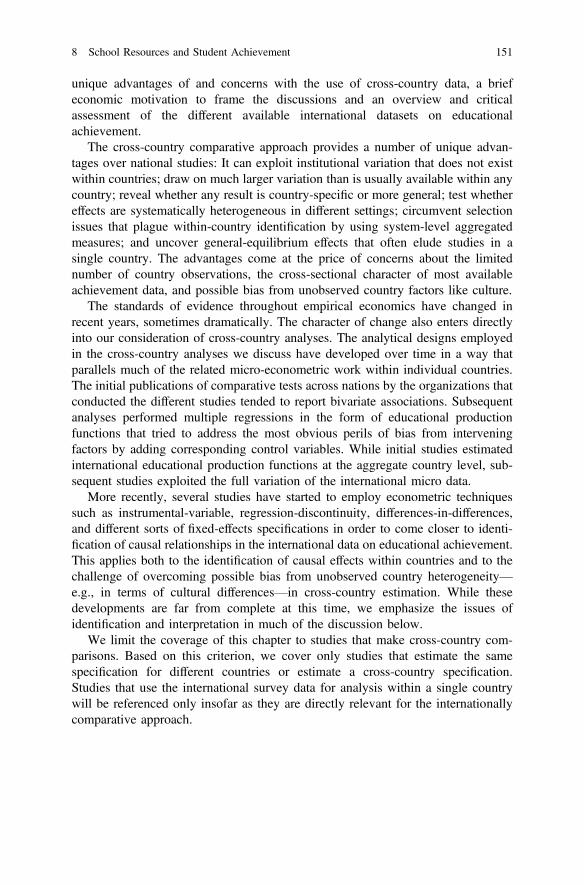
The results, depicted in Fig. 8.2, suggest that educational expenditure per stu-dent has increased substantially in real terms in all considered OECD countriesbetween the early 1970s and the mid-1990s, and in all considered East Asiancountries except the Philippines between the early 1980s and the mid-1990s.6 Yet,comparing test scores over the same time intervals suggests that no substantialimprovement in average student achievement has occurred in any of these coun-tries. Combining the time-series evidence on resources and achievement, it is fair toconclude that substantial increases in real school expenditure per student did notlead to improvements in student outcomes in most of the sampled OECD and EastAsian countries. In fact, the experience of many countries is much bleaker thanwhat had been termed the “productivity collapse in schools” in the United States(Hanushek 1997).7
5Achievement data from the international tests at the two respective points in time are linked usingU.S. longitudinal achievement data. Increases in educational expenditure are adjusted not only foraverage inflation, but also for the so-called “Baumol effect” of increasing costs in service sectorswith constant productivity. Three different approaches of calculating price deflators for theschooling sector that account for this effect are averaged in the depiction of Fig. 2. For details, seeGundlach et al. (2001), Gundlach and Woessmann (2001), and Woessmann (2002), Sect. 3.3.6Gundlach and Woessmann (2001) show that the resource expansion in the East Asian countriesmostly results from government decisions to raise the number of teachers per student.7One potential explanation for this bivariate longitudinal pattern might of course be that students’family background might have deteriorated on average. Students may increasingly be lackingmany of the basic capabilities required for a successful education and may thus be increasinglyexpensive to educate. Such effects may play a significant role in countries with a large inflow of
158 E.A. Hanushek and L. Woessmann
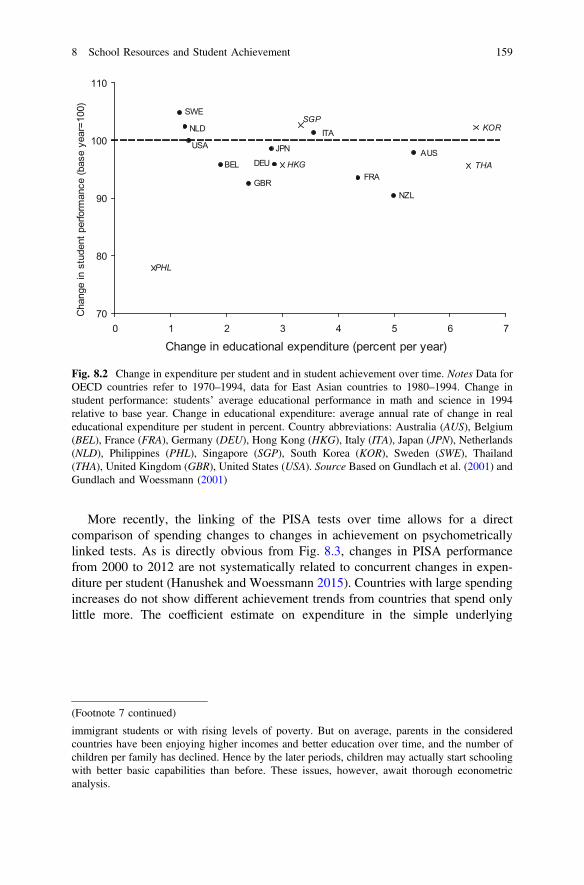
More recently, the linking of the PISA tests over time allows for a directcomparison of spending changes to changes in achievement on psychometricallylinked tests. As is directly obvious from Fig. 8.3, changes in PISA performancefrom 2000 to 2012 are not systematically related to concurrent changes in expen-diture per student (Hanushek and Woessmann 2015). Countries with large spendingincreases do not show different achievement trends from countries that spend onlylittle more. The coefficient estimate on expenditure in the simple underlying
70
80
90
100
110
0 1 2 3 4 5 6 7
Change in educational expenditure (percent per year)
AUS
FRAGBR
BEL
JPN
DEU
SWE
NLD ITAUSA
Cha
nge
in s
tude
nt p
erfo
rman
ce (b
ase
year
=10
0)
KOR
THAHKG
SGP
PHL
NZL
Fig. 8.2 Change in expenditure per student and in student achievement over time. Notes Data forOECD countries refer to 1970–1994, data for East Asian countries to 1980–1994. Change instudent performance: students’ average educational performance in math and science in 1994relative to base year. Change in educational expenditure: average annual rate of change in realeducational expenditure per student in percent. Country abbreviations: Australia (AUS), Belgium(BEL), France (FRA), Germany (DEU), Hong Kong (HKG), Italy (ITA), Japan (JPN), Netherlands(NLD), Philippines (PHL), Singapore (SGP), South Korea (KOR), Sweden (SWE), Thailand(THA), United Kingdom (GBR), United States (USA). Source Based on Gundlach et al. (2001) andGundlach and Woessmann (2001)
(Footnote 7 continued)
immigrant students or with rising levels of poverty. But on average, parents in the consideredcountries have been enjoying higher incomes and better education over time, and the number ofchildren per family has declined. Hence by the later periods, children may actually start schoolingwith better basic capabilities than before. These issues, however, await thorough econometricanalysis.
8 School Resources and Student Achievement 159
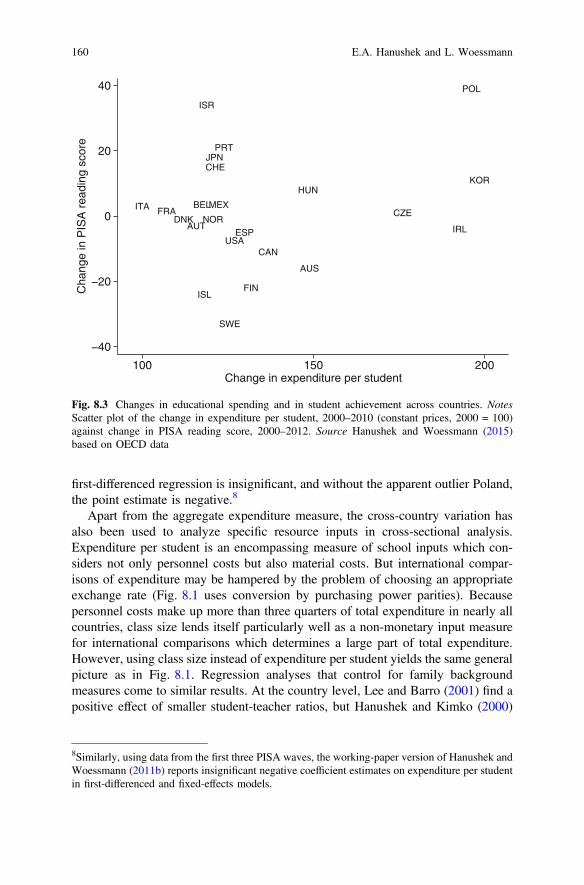
first-differenced regression is insignificant, and without the apparent outlier Poland,the point estimate is negative.8
Apart from the aggregate expenditure measure, the cross-country variation hasalso been used to analyze specific resource inputs in cross-sectional analysis.Expenditure per student is an encompassing measure of school inputs which con-siders not only personnel costs but also material costs. But international compar-isons of expenditure may be hampered by the problem of choosing an appropriateexchange rate (Fig. 8.1 uses conversion by purchasing power parities). Becausepersonnel costs make up more than three quarters of total expenditure in nearly allcountries, class size lends itself particularly well as a non-monetary input measurefor international comparisons which determines a large part of total expenditure.However, using class size instead of expenditure per student yields the same generalpicture as in Fig. 8.1. Regression analyses that control for family backgroundmeasures come to similar results. At the country level, Lee and Barro (2001) find apositive effect of smaller student-teacher ratios, but Hanushek and Kimko (2000)
AUS
AUT
BEL
CAN
CZEDNK
FIN
FRA
HUN
ISL
IRL
ISR
ITA
JPN
KOR
MEX
NOR
POL
PRT
ESP
SWE
CHE
USA
−40
−20
0
20
40C
hang
e in
PIS
A r
eadi
ng s
core
100 150 200Change in expenditure per student
Fig. 8.3 Changes in educational spending and in student achievement across countries. NotesScatter plot of the change in expenditure per student, 2000–2010 (constant prices, 2000 = 100)against change in PISA reading score, 2000–2012. Source Hanushek and Woessmann (2015)based on OECD data
8Similarly, using data from the first three PISA waves, the working-paper version of Hanushek andWoessmann (2011b) reports insignificant negative coefficient estimates on expenditure per studentin first-differenced and fixed-effects models.
160 E.A. Hanushek and L. Woessmann

find no such relationship.9 However, country-level analysis may suffer fromaggregation bias (Hanushek et al. 1996), as Fertig and Wright (2005) show that theprobability of finding statistically significant and correctly signed class-size effectsincreases with the level of aggregation. Student-level analyses that use data on theactual size of the class of the tested students, rather than ratios of teachers tostudents at some level, tend to find counterintuitive signs of the coefficient on classsize that are often statistically significant (e.g., Woessmann 2003; Fuchs andWoessmann 2007; Table 8.1).
The latter studies also take indicators of the shortage of instructional material,usually reported by school principals, into account. Shortage of material tends to benegatively associated with student outcomes. Measures of instruction time also tendto be significantly related to achievement. By contrast, in multivariate analyses theavailability of computers at school is not related to student outcomes, and intensivecomputer use is negatively related to test scores (Fuchs and Woessmann 2004).
In the student-level studies, measures of teacher education tend to show positiveassociations with student achievement in cross-country analyses. Drawing oninformation from teacher background questionnaires in TIMSS, Woessmann (2003)finds positive associations of student achievement with teacher experience andfemale gender and a negative one with teacher age. In their country-level analysis,Lee and Barro (2001) find a positive effect of teacher salary levels. Similarly,Woessmann (2005b) reports a significant positive coefficient on a country-levelmeasure of teacher salary when added to an international student-level regression.Dolton and Marcenaro-Gutierrez (2011) pool country-level data from internationaltests in 1995–2006 to show that teacher salaries—both when measured in absoluteterms and relative to wages in each country—are positively associated with studentachievement, even after controlling for country fixed effects.
In sum, the general pattern of the cross-country analyses suggests that quanti-tative measures of school inputs such as expenditure and class size cannot accountfor the cross-country variation in educational achievement. By contrast, severalstudies tend to find positive associations of student achievement with the quality ofinstructional material and the quality of the teaching force. While thesecross-country associations reveal to what extent different input factors candescriptively account for international differences in student achievement, studiesthat focus more closely on the identification of causal effects have reverted to usingthe within-country variation in resources and achievement. This literature is mostadvanced for the estimation of class-size effects. In the following, we discuss threeapproaches that have been suggested to estimate causal class-size effects oninternational data: a combination of school fixed effects with instrumental variables,a regression discontinuity approach that makes use of variation stemming frommaximum class-size rules, and a subject fixed effects approach.
9Using country-level data for data envelopment analysis, Afonso and St. Aubyn (2006) findindications of substantial inefficiencies in the use of teachers per student in most countries.
8 School Resources and Student Achievement 161
8.4 Evidence on School Inputs Within Different Countries
The initial within-country studies have used conventional least-squares techniquesto focus on developing countries and their comparison to developed countries, aparticular advantage of using international data.10 Relying on data from earlyinternational tests, Heyneman and Loxley (1983) suggested that school resourcestend to be more closely related to student achievement in developing countries thanin developed countries. Hanushek and Luque (2003) did not corroborate thisconclusion using the more recent TIMSS data. Michaelowa (2001) uses the regionalPASEC data to provide conventional evidence for five countries in FrancophoneSub-Saharan Africa.11
The problem with such conventional estimates is that resources in general, andclass sizes in particular, are not only a cause but also a consequence of studentachievement or of unobserved factors related to student achievement. Many fea-tures may lead to the joint and simultaneous determination of class size and studentachievement, making class size endogenous to student achievement. For example,schools may reduce class sizes for poorly performing students and policymakersmay design compensatory funding schemes for schools with large shares of stu-dents from poor backgrounds (see West and Woessmann 2006 for internationalevidence). In both cases, class sizes are allocated in a compensatory manner,biasing the class-size coefficient upwards. In contrast, policymakers may also havehigh-performing students taught in special small classes to support elite perfor-mance. Likewise, parents who particularly care for the education of their childrenmay both make residential choices to ensure that their children are taught in schoolswith relatively small classes and support their children in many other ways, leadingthem to be relatively high performers. In these cases, class sizes are allocated in areinforcing manner, biasing the class-size coefficient downwards. In short, parents,teachers, schools, and administrators all make choices that might give rise to anon-causal association between class size and student achievement even aftercontrolling extensively for family background. Conventional estimates of class-sizeeffects may thus suffer from endogeneity bias, the direction of which is ambiguous apriori.
To identify causal class-size effects, two quasi-experimental strategies have beenapplied to the international test data (cf. Woessmann 2005b). The firstquasi-experimental approach draws on exogenous variation in class size caused bynatural fluctuations in the size of subsequent student cohorts of a school (similar toHoxby 2000). In this case, the quasi-experiment results from the idea that naturalfluctuations in student enrollment lead to variations in average class size in two
10See Table 2.7 in Hanushek and Woessmann (2011a) for an overview of within-country studieson school inputs.11Using PIRLS data, Woessmann (2010) estimates a quasi-value-added model, controlling forretrospective information on pre-school performance, for primary-school students in two LatinAmerican and several comparison countries.
162 E.A. Hanushek and L. Woessmann
adjacent grades in the same school. Natural birth fluctuations around the cut-off datethat splits students into different grade levels occur randomly. Therefore, they leadto variation in class size that is driven neither by students’ educational achievementnor by other features that might jointly affect class size and student achievement.
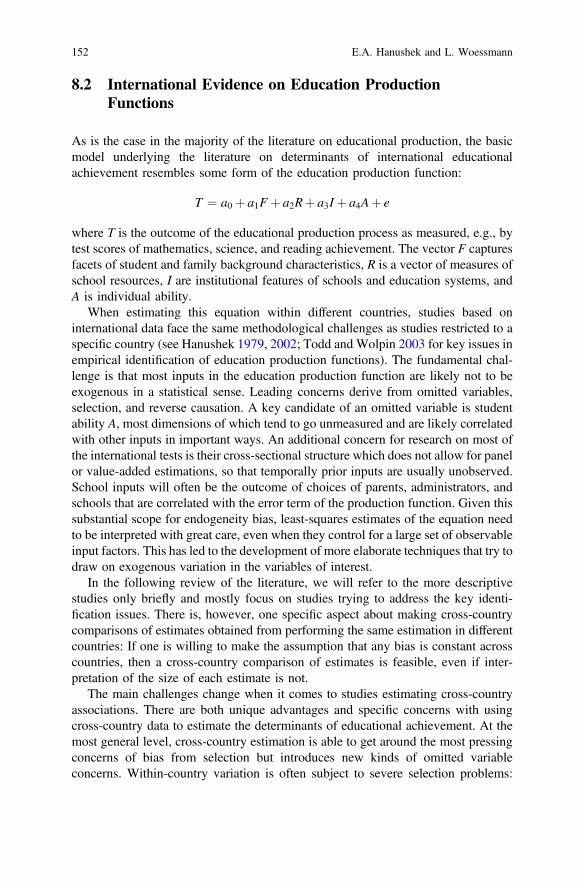
Woessmann and West (2006) develop a variant of this identification strategy thatexploits specific features of the TIMSS database. The sampling design of the firstTIMSS study, which tested a complete 7th-grade class and a complete 8th-gradeclass in each school, enables them to use only the variation between two adjacentgrades in individual schools. This strategy aims to exclude biases from nonrandombetween-school and within-school sorting through a combination of school fixedeffects and instrumental variables using grade-average class sizes as instruments.The rationale of this approach is as follows. Any between-school sorting is elim-inated in a first step by controlling for school fixed effects, restricting the analysissolely to variation within individual schools. Within schools, the allocation ofstudents to different classes in a grade may also be non-random. Within-schoolsorting is filtered out in a second step by instrumenting actual class size by theaverage class size in the relevant grade in each school. Within-school variation inclass size is thus used only insofar as it is related to variation in average class sizebetween the 7th and 8th grade of a school. The identifying assumption is that suchvariation is not affected by student sorting but reflects random fluctuations inbirth-cohort size between the two grades in the catchment area of each school.Thus, causal class-size effects are identified by relating differences in the relativeachievement of students in 7th and 8th grade within individual schools to that partof the between-grade difference in class size in the school that reflectsbetween-grade differences in average class size.
Figure 8.4 illustrates the basic intuition behind this identification strategy for theexample of math achievement in Singapore. The top panel indicates thatclass-average test scores are positively associated with class size, as is the case inmost countries—likely reflecting ability sorting of students between and withinschools. The middle panel plots the achievement difference between the 7th-gradeand 8th-grade class in each school against the same grade difference in class size,which is equivalent to including school fixed effects in a regression framework.Overcoming effects of between-school sorting by removing any difference inoverall achievement levels between schools, the size of the positive correlation isreduced substantially, but remains statistically significant. The reduction suggeststhat poorly performing students tend to be sorted into schools with smaller classesin Singapore. The final step of the identification strategy, illustrated in the bottompanel, additionally eliminates any effects of within-school sorting by using only thatpart of the between-grade variation in actual class sizes that can be predicted byvariation in grade-average class sizes. The picture suggests that class size has nocausal effect on student achievement in math in Singapore. Rather, weaker studentsseem to be consistently placed in smaller classes, both between and within schools.
8 School Resources and Student Achievement 163

R 2 = 0.40400
450
500
550
600
650
700
750
0 10 20 30 40 50Class size
Tes
t sco
reT
est s
core
Tes
t sco
re
× Seventh grade o Eighth grade
T = 435.94 + 5.47 S(0.41)
R 2 = 0.14-100
-50
0
50
100
150
200
250
-20 -10 0 10 20 30
Class size
T = 29.63 + 2.69 S(0.58)
R 2 = 0.00-100
-50
0
50
100
150
200
250
-20 -10 0 10 20 30Class size
T = 53.03 - 0.23 S (0.97)
(a)
(b)
(c)
Fig. 8.4 Identifying class-size effects: Singapore as an illustrative example. Source Woessmann(2007) a All classes, b grade difference and c grade difference, instrumented
164 E.A. Hanushek and L. Woessmann
Woessmann and West (2006) implement this identification strategy in microe-conometric estimations of education production functions for 11 countries aroundthe world.12 In line with Fig. 8.4, their results suggest that conventional estimatesof class-size effects tend to be severely biased. They find sizable beneficial effects ofsmaller classes in Greece and Iceland, but reject the possibility of even small effectsin four countries and of large beneficial effects in an additional four countries.Additional specification tests support the identifying assumption that students andteachers are not systematically sorted between grades within individual schools.There are no systematic differences at all in the observable characteristics of stu-dents or teachers between the two grades in schools in which one of the twoadjacent grades has substantially larger average class sizes than the other; there areno systematic differences in the estimated class-size effects between expanding,stable, and contracting schools; and there are no systematic differences in theestimated class-size effects between countries where 7th grade is the first grade of aparticular school and countries where it is not so that grade-average class sizesmight have been adjusted based on schools’ experience with the particular students.
The basic pattern of results is corroborated by a second quasi-experimentalidentification strategy based on rule-induced discontinuities. Following the study byAngrist and Lavy (1999) for Israel, Woessmann (2005b) exploits the fact that manycountries have maximum class-size rules that induce a nonlinear associationbetween the number of students in a grade of a school and average class size. Inparticular, the association has sharp discontinuities at multiples of the maximumclass size that can be exploited to identify variation in class sizes that is exogenousto student achievement. The TIMSS data suggest that 10 West European schoolsystems implement national maximum class-size rules reasonably strictly and withenough sharpness to enable an empirical implementation of this instrumentalvariable strategy.13 In all 10 countries, results from identification by rule-induceddiscontinuities rule out the possibility of large causal class-size effects in lowersecondary school. The only statistically significant, but small estimates are, again,in Iceland and, marginally, in Norway.
Woessmann (2005b) shows that these results are robust to several specificationtests. Some models control for peer effects, in terms of the mean achievement andfamily background of each student’s classmates, to exclude bias from peer sorting.Controlling for any continuous association between grade enrollment and studentachievement by adding enrollment in the specific grade and its squared term asadditional controls does not lead to substantive changes in results. When applyingthe specification to a discontinuity sample of students whose grade enrollment iswithin a margin of plus or minus 5 or 6 students of the rule-based discontinuities, sothat identification does not come from observations far off the discontinuities, the
12Additional evidence based on the same identification strategy for countries in West Europe, EastEurope, and East Asia is presented in Woessmann (2005b), Ammermueller et al. (2005), andWoessmann (2005a), respectively.13The ten West European school systems that employ maximum class-size rules are: Denmark,France, Germany, Greece, Iceland, Ireland, Norway, Spain, Sweden, and Switzerland.
8 School Resources and Student Achievement 165
instrument gets weak in about half the countries, while results remain robust in theother half. Excluding especially large schools in each country (of a size three or fourtimes the maximum class size) does not lead to a substantive change in results.14
However, as discussed by Woessmann (2005b), some reservations remain withthis regression-discontinuity identification strategy (cf. also Urquiola andVerhoogen 2009). In particular, intentional exploitations of the rule by systematicbetween- and within-school choices might lead to remaining endogeneity in the rulediscontinuity approach. Thus, it is possible that parents and schools “play thesystem”: parents particularly keen to ensure low class sizes for their children maymake their enrollment decisions—and school principals their acceptance decisions—on the basis of expected class size, and those decisions may be related to studentachievement. Still, in the end both quasi-experimental identification strategies cometo a very similar pattern of results. Moreover, the source of the potentiallyremaining biases differs in the two cases, adding confidence that any remaining biasin each strategy is of second-order magnitude.
Both identification strategies reach the conclusion that class size is not a majorforce in shaping achievement in lower secondary school in any of the countriesconsidered. There is no single country for which any of the specifications showed astatistically significant and large class-size effect. In every case where one of themethods leads to a reasonably precise estimate, a large effect size can be ruled outwith considerable statistical confidence. There is only one country, Iceland, whereresults create confidence that a causal class-size effects exists. However, in bothspecifications the estimates are relatively small and estimated precisely enough toreject the possibility of a large effect.
The unique value of cross-country research, however, lies in analyses of whetherthe cross-country differences in estimated class-size effects are systematicallyrelated to underlying features of the school systems. Such analyses can improve ourunderstanding of the particular circumstances under which class sizes matter or not.Although causal class-size effects are small at best in all the countries considered,there are still differences across countries. The international evidence shows that theestimated effect size does not vary systematically for children from differing familybackgrounds or for countries with different levels of average achievement, eco-nomic development, average class size, or educational spending (Woessmann andWest 2006; Woessmann 2005b). But the existence of class-size effects is system-atically associated with the salary and education level of the teaching force. In bothstudies, class-size effects were detected only in countries with relatively low teachersalaries and education. The pattern is similar within countries in which the edu-cation level of teachers varies. In these countries, the estimated class-size effecttends to be larger in classes that are taught by teachers with lower education.Interpreting average teacher salary and teacher education as proxies for averageteacher quality, the results suggest that relatively capable teachers do as well whenteaching large classes as when teaching small classes. By contrast, less capable
14The size of the induced discontinuity in class size is smaller when grade enrollment is larger.
166 E.A. Hanushek and L. Woessmann

teachers do not seem to be up to the job of teaching large classes, while doingreasonably well in small classes. Consequently, the pattern of international effectheterogeneity suggests that class-size effects occur only when the quality of theteaching force is relatively low.
A third approach to the identification of causal class-size effects tries to avoidbias from non-random sorting of students by using variation within individualstudents. If the same student is taught two different academic subjects in differentlysized classes, the within-student between-subject variation can be used for identi-fication (cf. Dee 2005; Dee and West 2011). The inclusion of student fixed effects,implemented by differencing across subjects, effectively excludes bias fromsubject-invariant student, family, and school characteristics, observable and unob-servable. Unobserved characteristics that vary by subject and are correlated withclass size, such as subject-specific fast-track or enrichment classes or teachercharacteristics, could, however, still bias this research design. Altinok and Kingdon(2012) implement this identification strategy to estimate class-size effects in up to45 countries using TIMSS 2003 data, which provide test scores in math and sciencefor each student. Their results provide little support for class-size effects, with onlyfew countries showing significant and sizeable positive effects of smaller classes.Analyzing the cross-country variation in class-size effects, they confirm thatclass-size effects are larger where teacher qualifications are lower, and also findindication of larger class-size effects in developing countries.
Beyond class-size effects, Ammermueller and Dolton (2006) use the samecross-subject identification strategy to estimate the effect of teacher-student genderinteraction in England and the United States using TIMSS and PIRLS data. In mostspecifications (with the exception of one in England), they find little evidence of asignificant effect of the interaction between student and teacher gender on studentachievement. Schwerdt and Wuppermann (2011) use the same cross-subject iden-tification with student fixed effects to identify the effects of teaching practices onTIMSS data in the United States. At a more descriptive level, Bratti et al. (2008) usethe PISA data to estimate the association of student achievement with cooperativeand competitive attitudes towards learning at the individual and school level.
8.5 Conclusions and Outlook
The economic literature on determinants of international differences in educationalachievement has applied two main approaches. The first approach exploits thecross-country variation for identification of cross-country associations. The secondapproach estimates the same association within different countries in order toenhance understanding of whether a factor’s importance differs systematically indifferent settings. Part of the existing work is descriptive in nature, estimating theassociation of student achievement with certain factors after controlling for the richset of possible inputs into educational production available in the internationalbackground data. But quasi-experimental work has been developed to identify some
8 School Resources and Student Achievement 167
of the underlying causal mechanisms both in the cross-country and in thewithin-country approach.
All in all, the international evidence on the role of school inputs in educationalproduction provides little confidence that quantitative measures of expenditure andclass size are a major driver of student achievement, across and within countries.Studies using different methods to identify causal class-size effects consistently findno strong effects of class size in most countries. Among school inputs, descriptiveevidence suggests that measures of the quality of inputs and, in particular, teachersare more closely related to student outcomes. However, research in this area awaitsmore work to identify the underlying causal links.15
A particular opportunity of the international research is that it can unveil whethercertain effects differ systematically across countries. For example, the internationalpattern suggests that significant class-size effects are only present in systems withrelatively low teacher quality. This result raises the cost-effectiveness question ofwhether student achievement is best served by reducing class size or by increasingthe low teacher quality even in the countries where class-size effects are present.
Due to the limited role of differences in expenditures and class size in explainingcross-country achievement differences, it may be tempting to conclude that schoolsystems do not matter so much for student achievement, after all. Nothing could bemore wrong than that. Evidence that differences in teacher quality and instructiontime do matter suggests that what matters is not so much the amount of inputs thatschool systems are endowed with, but rather how they use them. Correspondingly,international differences in institutional structures of school systems such asexternal exams, school autonomy, private competition, and tracking have beenfound to be able to account for a substantial part of the cross-country variation instudent achievement (see Woessmann 2016 for a recent review).
As the economic literature on international evidence on educational achievementhas emerged only relatively recently, there is obviously still considerable scope forfuture advances. A topic unexplored by economists is the international tests innon-traditional subjects, such as foreign languages, civic education, and informa-tion technology. More generally, some of the rich background information con-tained in the international studies could be explored further, and part of it mayprovide information on relevant non-cognitive skills. For example, Falck andWoessmann (2013) attempt to derive measures of entrepreneurial intentions fromthe international background data, and Chap. 6 in Woessmann et al. (2009) exploressuch measures of non-cognitive outcomes as student morale and commitment,non-disruptive behavior, disciplinary climate, and tardiness. Further information onnon-cognitive skills may be derived from the international background question-naires. As a more distant outlook, international testing of non-cognitive skills wouldbe an obvious challenge.
15More recently, Hanushek et al. (2014) show effects of teacher cognitive skills on internationaldifferences in student achievement.
168 E.A. Hanushek and L. Woessmann
As more and more countries participate in the international tests, the opportu-nities grow for future research on the determinants of international educationalachievement. With the additional variation, the international research will be able todraw on more experience with different inputs and start to analyze additionalspecific features beyond the broad concepts of input variables analyzed so far.There is also considerable scope for future research to advance identification inquasi-experimental research settings. Furthermore, as more regular tests with rea-sonable comparability over time become available, a panel structure of internationaltests emerges that provides longitudinal information within countries. This willallow future research to exploit educational reforms in different countries over time(see Hanushek et al. 2013 for a recent first example). A limiting factor remains thelack of individual-level panel data in the international tests.
In the more distant future, it is tempting to envision what research will be able todo with the sort of achievement data that will be available in 20–30 years fromnow. The number of participating countries is as high as 52 in TIMSS 2011 and 65in PISA 2012, and additional countries have signed up to participate in the mostrecent cycles. With these sets of comparable achievement data for extensive sam-ples of countries being linked to subsequent economic growth, and with theemerging long panels of regular achievement data for large samples of countries,the outlook for future research in the economics of international differences ineducational achievement is clearly bright.
References
Afonso, A., & St. Aubyn, M. (2006). Cross-country efficiency of secondary education provision:A semi-parametric analysis with non-discretionary inputs. Economic Modelling, 23(3), 476–491.
Altinok, N., & Kingdon, G. (2012). New evidence on class size effects: A pupil fixed effectsapproach. Oxford Bulletin of Economics and Statistics, 74(2), 203–234.
Ammermueller, A., & Dolton, P. (2006). Pupil-teacher gender interaction effects on scholasticoutcomes in England and the USA. ZEW discussion paper 06-060. Mannheim: Centre forEuropean Economic Research.
Ammermueller, A., Heijke, H., & Woessmann, L. (2005). Schooling quality in Eastern Europe:Educational production during transition. Economics of Education Review, 24(5), 579–599.
Angrist, J. D., & Lavy, V. (1999). Using Maimondides’ rule to estimate the effect of class size onscholastic achievement. Quarterly Journal of Economics, 114(2), 533–575.
Bishop, J. H. (1997). The effect of national standards and curriculum-based examinations onachievement. American Economic Review, 87(2), 260–264.
Bratti, M., Checchi, D., & Filippin, A. (2008). Should you compete or cooperate with yourschoolmates? IZA discussion paper 3599. Bonn, Germany: Institute for the Study of Labor.
Dee, T. S. (2005). A teacher like me: Does race, ethnicity, or gender matter? American EconomicReview, 95(2), 158–165.
Dee, T. S., & West, M. R. (2011). The non-cognitive returns to class size. Educational Evaluationand Policy Analysis, 33(1), 23–46.
Dolton, P., & Marcenaro-Gutierrez, O. D. (2011). If you pay peanuts do you get monkeys? Across-country analysis of teacher pay and pupil performance. Economic Policy , 26(65), 5–55.
8 School Resources and Student Achievement 169
Falck, O., & Woessmann, L. (2013). School competition and students’ entrepreneurial intentions:International evidence using historical Catholic roots of private schooling. Small BusinessEconomics, 40(2), 459–478.
Fertig, M., & Wright, R. E. (2005). School quality, educational attainment and aggregation bias.Economics Letters, 88(1), 109–114.
Fuchs, T., & Woessmann, L. (2004). Computers and student learning: Bivariate and multivariateevidence on the availability and use of computers at home and at school. Brussels EconomicReview, 47(3/4), 359–385.
Fuchs, T., & Woessmann, L. (2007). What accounts for international differences in studentperformance? A re-examination using PISA data. Empirical Economics, 32(2–3), 433–462.
Gundlach, E., & Woessmann, L. (2001). The fading productivity of schooling in East Asia.Journal of Asian Economics, 12(3), 401–417.
Gundlach, E., Woessmann, L., & Gmelin, J. (2001). The decline of schooling productivity inOECD countries. Economic Journal, 111(471), C135–C147.
Gustafsson, J.-E. (2003). What do we know about effects of school resources on educationalresults? Swedish Economic Policy Review, 10(3), 77–110.
Gustafsson, J.-E. (2007). Understanding causal influences on educational achievement throughanalysis of differences over time within countries. In T. Loveless (Ed.), Lessons learned: Whatinternational assessments tell us about math achievement (pp. 37–63). Washington, DC:Brookings Institution Press.
Hanushek, E. A. (1979). Conceptual and empirical issues in the estimation of educationalproduction functions. Journal of Human Resources, 14(3), 351–388.
Hanushek, E. A. (1997). The productivity collapse in schools. In W. J. Fowler Jr. (Ed.),Developments in School Finance, 1996 (pp. 185–195). Washington, DC: National Center forEducation Statistics.
Hanushek, E. A. (2002). Publicly provided education. In A. J. Auerbach & M. Feldstein (Eds.),Handbook of Public Economics (Vol. 4, pp. 2045–2141). Amsterdam, the Netherlands: NorthHolland.
Hanushek, E. A., & Kimko, D. D. (2000). Schooling, labor force quality, and the growth ofnations. American Economic Review, 90(5), 1184–1208.
Hanushek, E. A., Link, S., & Woessmann, L. (2013). Does school autonomy make senseeverywhere? Panel estimates from PISA. Journal of Development Economics, 104, 212–232.
Hanushek, E. A., & Luque, J. A. (2003). Efficiency and equity in schools around the world.Economics of Education Review, 22(5), 481–502.
Hanushek, E. A., Piopiunik, M., & Wiederhold, S. (2014). The value of smarter teachers:International evidence on teacher cognitive skills and student performance. NBER workingpaper no. 20727. Cambridge, MA: National Bureau of Economic Research.
Hanushek, E. A., Rivkin, S. G., & Taylor, L. L. (1996). Aggregation and the estimated effects ofschool resources. Review of Economics and Statistics, 78(4), 611–627.
Hanushek, E. A., & Woessmann, L. (2011a). The economics of international differences ineducational achievement. In E. A. Hanushek, S. Machin, & L. Woessmann (Eds.), Handbookof the Economics of Education (Vol. 3, 89–200). Amsterdam, the Netherlands: North Holland.
Hanushek, E. A., & Woessmann, L. (2011b). How much do educational outcomes matter inOECD countries? Economic Policy, 26(67), 427–491.
Hanushek, E. A., & Woessmann, L. (2015). The knowledge capital of nations: Education and theeconomics of growth. Cambridge, MA: MIT Press.
Heyneman, S. P., & Loxley, W. (1983). The effect of primary school quality on academicachievement across twenty-nine high and low income countries. American Journal ofSociology, 88(6), 1162–1194.
Hoxby, C. M. (2000). The effects of class size on student achievement: New evidence frompopulation variation. Quarterly Journal of Economics, 115(3), 1239–1285.
Lee, J.-W., & Barro, R. J. (2001). Schooling quality in a cross-section of countries. Economica, 68(272), 465–488.
170 E.A. Hanushek and L. Woessmann
Michaelowa, K. (2001). Primary education quality in francophone Sub-Saharan Africa:Determinants of learning achievement and efficiency considerations. World Development, 29(10), 1699–1695.
Schwerdt, G., & Wuppermann, A. C. (2011). Is traditional teaching really all that bad? Awithin-student between-subject approach. Economics of Education Review, 30(2), 365–379.
Todd, P. E., & Wolpin, K.I. (2003). On the specification and estimation of the production functionfor cognitive achievement. Economic Journal, 113(485), F3–F33.
Toma, E. F. (1996). Public funding and private schooling across countries. Journal of Law andEconomics, 39(1), 121–148.
Urquiola, M., & Verhoogen, E. (2009). Class-size caps, sorting, and the regression-discontinuitydesign. American Economic Review, 99(1), 179–215.
West, M. R., & Woessmann, L. (2006). Which school systems sort weaker students into smallerclasses? International evidence. European Journal of Political Economy, 22(4), 944–968.
Woessmann, L. (2002). Schooling and the quality of human capital. Berlin, Germany: Springer.Woessmann, L. (2003). Schooling resources, educational institutions, and student performance:
The international evidence. Oxford Bulletin of Economics and Statistics, 65(2), 117–170.Woessmann, L. (2005a). Educational production in East Asia: The impact of family background
and schooling policies on student performance. German Economic Review, 6(3), 331–353.Woessmann, L. (2005b). Educational production in Europe. Economic Policy, 20(43), 446–504.Woessmann, L. (2007). International evidence on expenditure and class size: A review. In
Brookings papers on education policy 2006/2007 (pp. 245–272). Washington D.C.: Brookings.Woessmann, L. (2010). Families, schools, and primary-school learning: Evidence for Argentina
and Colombia in an international perspective. Applied Economics, 42,(21), 2645–2665.Woessmann, L. (2016). The importance of school systems: Evidence from international differences
in student achievement. Journal of Economic Perspectives, 30(3), 3–31.Woessmann, L., Luedemann, E., Schuetz, G., & West, M. R. (2009). School accountability,
autonomy, and choice around the world. Cheltenham, UK: Edward Elgar.Woessmann, L., & West, M. R. (2006). Class-size effects in school systems around the world:
Evidence from between-grade variation in TIMSS. European Economic Review, 50(3), 695–736.
8 School Resources and Student Achievement 171