the failure of input-based schooling...
TRANSCRIPT

THE FAILURE OF INPUT-BASED SCHOOLING POLICIES*
Eric A. Hanushek
In an effort to improve the quality of schools, governments around the world have dramaticallyincreased the resources devoted to them. By concentrating on inputs and ignoring the in-centives within schools, the resources have yielded little in the way of general improvement instudent achievement. This paper provides a review of the US and international evidence on theeffectiveness of such input policies. It then contrasts the impact of resources with that ofvariations in teacher quality that are not systematically related to school resources. Finally,alternative performance incentive policies are described.
Academic and policy interest in improving schools has followed directly fromrecognition of the importance of human capital formation to both individuals andsociety. Much of the motivation comes from theoretical and empirical analyses ofthe relationship between income, productivity, and economic growth and thequantity of schooling of individuals – the most common proxy for human capitallevels. For the most part, however, policy initiatives do not focus on the quantity ofschooling but instead on the quality of schooling. It is here that controversy aboutresearch into the determinants of quality has led to ambiguities about policy. Thisdiscussion reviews basic evidence on student performance and puts it into thecontext of contemporary policy debates. The central conclusion is that the com-monly used input policies – such as lowering class sizes or tightening the re-quirements for teaching credentials – are almost certainly inferior to alteredincentives within the schools.
The general arguments about schooling in the US and elsewhere in the worldhave a simple structure. First, the high returns to additional schooling are noted.In the US these returns have grown dramatically over the past 20 years, particularlyfor a college education. During the 1990s, for example, an average collegegraduate earned in excess of a 70% premium above the average high schoolgraduate, e.g., Pierce and Welch (1996). Schooling returns in other countries,while varying, have also been high (Psacharopoulos, 1989, 1994; OECD, 2001).Second, having noted the individual returns to schooling, the policy discussionquickly shifts to the necessity to invest further in human capital, which is translateddirectly into an argument for providing more public funding for schools. Whileagain there is some variation depending on each country’s school attainment rates,the arguments for increased funding generally do not revolve around supportingmore years of schooling for individuals but instead concentrate on improving thequality of the existing years of schooling. Embedded in this shift are a number ofpresumptions that are widely held. One is that quality has the same payoffs asquantity of schooling. Another is that greater funding will lead to improvedquality. This paper considers the latter presumption – that spending and qualityare closely related – in detail.
* This research has been supported by a grant from the Packard Humanities Institute.
The Economic Journal, 113 (February), F64–F98. � Royal Economic Society 2003. Published by BlackwellPublishing, 9600 Garsington Road, Oxford OX4 2DQ, UK and 350 Main Street, Malden, MA 02148, USA.
[ F64 ]

Before entering into the central discussion, however, it is useful to establishsome facts about the value of ‘quality’. There is mounting evidence that quality –generally measured by test scores – is related to individual earnings,1 productivity,and economic growth. While focusing on the estimated returns to years ofschooling, early studies of wage determination tended to indicate relatively modestimpacts of variations in cognitive ability after holding constant quantity ofschooling. More recent direct investigations of cognitive achievement, however,have suggested generally larger labour market returns to measured individualdifferences in cognitive achievement. For example, Bishop (1989, 1992), O’Neill(1990), Grogger and Eide (1993), Blackburn and Neumark (1993, 1995), Murn-ane et al. (1995), Neal and Johnson (1996), Murnane et al. (2000), and Murnaneet al. (2001) each find that the earnings advantages to higher achievement onstandardised tests are quite substantial.2 International evidence is less plentiful butalso demonstrates a labour market return to cognitive skills (Currie and Thomas,2000; Boissiere et al., 1985). The difficulty of separating cognitive skills from pureschooling has nonetheless made this estimation very difficult (Cawley et al., 2000;Heckman and Vytlacil, 2001) and thus leaves ambiguity about the exact magnitudeof effects.
Similarly, society appears to gain in terms of productivity. Hanushek and Kimko(2000) demonstrate that quality differences in schools have a dramatic impact onproductivity and national growth rates. This study of growth rates incorporatesinformation on international mathematics and science examinations into standardcross-country growth regressions. It finds a very strong relationship between testperformance and national growth and a smaller relationship between quantity ofschooling and growth. A series of investigations of the structure suggests a causalrelationship.
An additional part of the return to school quality comes through continuationin school. There is substantial US evidence that students who do better in school,either through grades or scores on standardised achievement tests, tend to go
[ F E B R U A R Y 2003] F65F A I L U R E O F I N P U T - B A S E D S C H O O L I N G P O L I C I E S
1 While human capital has been central to much of labour economics for some four decades, itsmeasurement has been more problematic. The most commonly employed measure is simply the years ofschool completed, but this measure neglects any quality differences arising from both school andnonschool differences across individuals. The most commonly employed measure of quality involvescognitive test scores, although the adequacy of this measure has not been fully investigated; see, forexample, Murnane et al. (2001). Early analyses of earnings employing test scores generally treated themas fixed measures of ability difference, e.g., Griliches (1974). Considerable evidence, however, includingsome presented below indicates that the typical cognitive tests are very much dependent on bothfamilies and schools.
2 These results are derived from quite different approaches. Bishop (1989) considers the measure-ment errors inherent in most testing situation and demonstrates that careful treatment of that problemhas a dramatic effect on the estimated importance of test differences. O’Neill (1990), Grogger and Eide(1993), Bishop (1991), and Neal and Johnson (1996) on the other hand simply rely upon more recentlabour market data along with more representative sampling and suggest that the earnings advantage tomeasured skill differences is larger than that found in earlier time periods and in earlier studies (evenwithout correcting for test reliability). Murnane et al. (1995) considering a comparison over time,demonstrate that the results of increased returns to measured skills hold regardless across simpleanalysis and error-corrected estimation. Murnane et al. (2000) and Murnane et al. (2001) employrepresentative samples but introduce other measures of individual skill. Blackburn and Neumark (1993,1995), like much of the early literature, concentrate mainly on any bias in the estimated rates of returnto schooling when ability measures are omitted.
� Royal Economic Society 2003

farther in school; see, for example, Dugan (1976); Manski and Wise (1983). Rivkin(1995) finds that variations in test scores capture a considerable proportion of thesystematic variation in high school completion and in college continuation, so thattest score differences can fully explain black-white differences in schooling. Bishop(1991) and Hanushek et al. (1996) find that individual achievement scores arehighly correlated with school attendance. Behrman et al. (1998) find strongachievement effects on both continuation into college and quality of college;moreover, the effects are larger when proper account is taken of the endogeneityof achievement. Hanushek and Pace (1995), using the High School and Beyonddata, find that college completion is significantly related to higher test scores at theend of high school.
Quality is nonetheless virtually impossible to dictate through policy. The questfor improved quality has undoubtedly contributed to recent expansions in theresources devoted to schools in the US and other countries. Eager to improvequality and unable to do it directly, government policy typically moves to what isthought to be the next best thing – providing added resources to schools. Broadevidence from the experience in the US and the rest of the world suggests that thisis an ineffective way to improve quality.
This Feature both points to interest in the topic and highlights some of theinterpretive issues that arise. The discussion of school policy frequently involves anintensity not common to many other academic debates, because the results ofanalyses of schools at times have direct influence on policy. Thus, for example, thearguments for reduced class size in Krueger (2002), largely reproduced in thisFeature as Krueger (2003), have already provided fuel for advocates of loweringclass sizes.3 And the Dustmann et al. (2003) article will similarly find a waitingpolicy audience as teacher employment policies are debated around the globe.What makes the issues more complicated is the difficulty of interpreting results,based as they are on imperfect data and incomplete description of the underlyingstructure (Todd and Wolpin, 2003).
Because class size policies are currently being broadly discussed, attention toother significant dimensions of input policy decisions tends to be neglected. Thefollowing article presents the available evidence on a broad set of resource policiesin schools. While some of the evidence is less reliable than others, the overallpicture is remarkably consistent. Even discounting significant portions of theavailable evidence, one is left with the clear picture that input policies of the typetypically pursued have little chance of being effective.
1. School Inputs and Outcomes
Much of the policy discussion throughout the world concentrates on schoolinginputs, a seemingly natural focus. And, with the longstanding importance that hasbeen attached to schooling, considerable change has occurred in the levels of
3 Hanushek (2002) provides a critique of Krueger (2002), which differs inconsequentially from theFeature version. Specifically, in searching for alternative weightings of the results, the Feature versionreweights estimates by the ‘impact index’ of journals instead of by citations. As Krueger notes, this hasminimal effect on the estimates.
F66 [ F E B R U A R YT H E E C O N O M I C J O U R N A L
� Royal Economic Society 2003

common inputs. Class sizes have fallen, qualifications of teachers have risen, andexpenditures have increased. Unfortunately, little evidence exists to suggest thatany significant changes in student outcomes have accompanied this growth inresources devoted to schools. Because many find the limited relationship betweenschool inputs and student outcomes surprising and hard to believe, this sectiondelves into the evidence available on this score in some detail.
These data on aggregate cost and performance provide strong prima facie evi-dence that simple resource policies are not generally effective. Much of the cur-rent policy discussion argues that with additional resources it would be possible toimplement programmes or approaches that lift student achievement. Of course,these are precisely the same arguments made over the past decades. The validity ofcurrent proposals rests on these current proposals being notably superior to thepolicies of the past (which were hypothesised at the time also to be superiorpolicies).
1.1. Aggregate US Data
The simplest and perhaps clearest demonstration of the resource story is found inthe aggregate US data over the past few decades. The US, operating under a systemthat is largely decentralised to the 50 separate states, has pursued the conven-tionally advocated resource policies vigorously. Table 1 tracks the patterns of pupil-teacher ratios, teacher education, and teacher experience. Between 1960 and2000, pupil-teacher ratios fell by almost 40%. The proportion of teachers with amaster’s degree or more over doubled so that a majority of all US teachers todayhave at least a master’s degree. Finally, median teacher experience – which is moredriven by demographic cycles than active policy – increased significantly, almostdoubling since its trough in 1970.
American teachers are heavily unionised, and the most common structure ofteacher contracts identifies teacher education levels and teacher experience as thedriving force behind salaries. Thus, as teacher inputs rise and as the numbers ofstudents per teachers decline, expenditure per pupil rises. As seen in the bottomrow of Table 1, real expenditures per pupil more than tripled over this period.4 Infact, this period is not special in US schools. Over the entire 100 years of 1890-1990, real spending per pupil rose by at a remarkably steady pace of 3½% per year(Hanushek and Rivkin, 1997). Over this longer period, real per student expen-diture in 1990 dollars goes from $164 in 1890 to $772 in 1940 to $4,622 in 1990 –roughly quintupling in each 50 year period.5
4 The calculation of real expenditures deflates by the Consumer Price Index. If the alternative of awage deflator were employed, the calculated rate of real increase over this period would not changemuch. Baumol’s disease (Baumol, 1967) is frequently cited at this point to explain increases in inputcosts without increasing real inputs. Specifically, if service sectors are ones where productivity growth isnecessarily low – say, for technological reasons – they will face cost pressures in the hiring of inputs,putting the service sector (technologically backward) at a disadvantage. Over this period, however, suchpressures cannot explain the patterns of inputs and outputs to schooling (Hanushek, 1997b).
5 These calculations differ from those in Table 1 both in using a different deflator (GDP deflator in1990 dollars) and in calculating spending per pupil on a membership rather than an attendance basis.
2003] F67F A I L U R E O F I N P U T - B A S E D S C H O O L I N G P O L I C I E S
� Royal Economic Society 2003

The question remains, what was obtained for these spending increases? Sincethe early 1970s, a random sample of students in the US has been given tests atdiffering ages in various subjects under the auspices of the National Assessment ofEducational Progress, or NAEP. These tests have been designed to provide aconsistent measure of performance over time. Figure 1 gives performance data forthe same period as the previously described input data. In this Figure the patternof average performance by 17-year-olds is traced for reading, mathematics, andscience. The performance of students in mathematics and reading is ever so
Table 1
Public School Resources in the US, 1960–2000
1960 1970 1980 1990 2000
Pupil-teacher ratio 25.8 22.3 18.7 17.2 16.0% teachers with master’s degree or more 23.5 27.5 49.6 53.1 56.2*median years teacher experience 11 8 12 15 15*current expenditure/ADA (2000/2001 $s) $2,235 $3,782 $5,124 $6,867 $7,591
Note: *Data pertain to 1995. The statistical data of the National Education Association on characteristicsof teachers was discontinued.Source: US Department of Education (2002).
280
290
300
310
1969 1974 1979 1984 1989 1994 1999
year
reading mathematics science
Fig. 1. Scores by 17-year-olds on National Assessment of Educational Progress, 1969–99
F68 [ F E B R U A R YT H E E C O N O M I C J O U R N A L
� Royal Economic Society 2003

slightly higher in 1999 than 30 years before when spending was dramatically low-er.6 The performance of students in science is significantly lower in 1999 than itwas in 1970. Writing performance (not shown) was first tested in 1984 anddeclined steadily until 1996 when testing was discontinued.
The only other test that provides a national picture of performance over a longperiod of time is the Scholastic Aptitude Test, or SAT. This college admissions testhas the advantage of providing data going back to the 1960s but the disadvantageof being a voluntary test taken by a selective subset of the population.7 Scores onthis test actually plunged from the mid-1960s until the end of the 1970s, suggestingthat the NAEP scores that begin in the 1970s may understate the magnitude of theperformance problem.8
In simplest terms, input policies have been vigorously pursued over a longperiod of time, but there is no evidence that the added resources have improvedstudent performance, at least for the most recent three decades when it has beenpossible to compare quantitative outcomes directly. This evidence suggests that theefficacy of further input-based policies depends crucially on improved use of re-sources compared to past history.
Two arguments are made, however, for why the simple comparison of expen-ditures and student performance might be misleading:
1. The characteristics of students may have changed such that they are moredifficult (and expensive) to educate now than in the past:
2. Other expansions of the requirements on schools have driven up costs butwould not be expected to influence observed student performance.
1.1.1. Changes in studentsOne simple explanation for why added resources yield no apparent performanceimprovement is that students are more poorly prepared or motivated for schoolover time, requiring added resources just to stay even. For example, there havebeen clear increases in the proportion of children living in single-parent familiesand, relatedly, in child poverty rates – both of which are hypothesised to lead tolower student achievement. Between 1970 and 1990, children living in povertyfamilies rose from 15 to 20%, while children living with both parents declinedfrom 85 to 73%. The percentage of children not speaking English at home alsorose from 9% in 1980 to 17% in 2000. But, there have also been other trends thatappear to be positive forces on student achievement. Family sizes have fallen and
6 The cumulative nature of the educational process implies that scores will reflect both current andpast spending. A 17-year-old in 1970, for example, would have entered school in the late 1950s, implyingthat the resource growth in Table 1 that goes back to 1960 is relevant for comparison with the NAEPperformance data.
7 NAEP samples are not tainted by selection. The school completion rate and the rate of attendanceof private schools have been essentially constant over the period of the NAEP tests and testing involves arandom sample of public school children.
8 Analyses of the changes in SAT scores suggest that a portion of the decline in scores comes fromincreases in the rate of test taking but that the decline also has a real component of lesser averageperformance over time (Wirtz, 1977; Congressional Budget Office, 1986).
2003] F69F A I L U R E O F I N P U T - B A S E D S C H O O L I N G P O L I C I E S
� Royal Economic Society 2003

parental education levels have improved. Among all families with children, thepercentage with three or more children fell from 36 to 20%. Moreover, over thesame period, adults aged 25–29 with a high school or greater level of schoolingwent from 74 to 86% (up from 61% in 1960). Finally, enrollment in kindergartenand pre-school increased dramatically over the period.
It is difficult to know how to net out these opposing trends with any accuracy.Extensive research, beginning with the Coleman Report (Coleman et al., 1966) andcontinuing through today (Hanushek, 1997a), has demonstrated that differencesin families are very important for student achievement. Most of these studies havenot focused their primary attention on families, however, and thus have not delvedvery far into the measurement and structure of any family influences. Grissmer et al.(1994) attempt to sort out the various factors in a crude way. That analysis useseconometric techniques to estimate how various family factors influence children’sachievement at a point in time. It then applies these cross-sectionally estimatedregression coefficients as weights to the trended family background factors iden-tified above. Their overall findings are that black students performed better overtime than would be expected from the trends in black family factors. They at-tribute this better performance to improvements in schools. On the other hand,white students, who make up the vast majority, performed worse over time thanwould be expected, leading presumably to the opposite conclusion that schools forthe majority of students actually got worse over time.
While there are reasons to be sceptical about these precise results, they do suggestthat the spending-performance relationship is not driven in any simple way bychanges in student preparation.9 Changes in family inputs have occurred over time,making it possible that a portion of the increased school resources has gone to offsetadverse factors. The evidence is nonetheless quite inconclusive about even the di-rection of any trend effects, let alone the magnitude. The only available quantitativeestimates indicate that changing family effects are unable to offset the large observedchanges in pupil-teacher ratios and school resources and may have even worked inthe opposite direction, making the performance of schools appear better than it was.
1.1.2. Exogenous cost increasesThe most discussed cost concern involves ‘special education’, programmes to dealwith students who have various disabilities. The issue is that these programmes are
9 Scepticism about the results from Grissmer et al. (1994) comes from methodological problems.First, they do not observe or measure differences in schools but instead simply attribute unexplainedresidual differences in the predicted and observed trends to school factors. In reality any factor thataffects achievement, that is unmeasured, and that has changed over their analysis period would bemixed with any school effects. Second, in estimating the cross-sectional models that provide the weightsfor the trending family factors, no direct measures of school inputs are included. In the standardanalysis of misspecified econometric models, this omission will lead to biased estimates of the influenceof family factors if school factors are correlated with the included family factors in the cross-sectionaldata that underlie their estimation. For example, better educated parents might systematically tend toplace their children in better schools. In this simple example, a portion of the effects of schools will beincorrectly attributed to the education of parents, and this will lead to inappropriate weights for thetrended family inputs. Third, one must believe either that the factors identified are the true causalinfluences or that they are stable proxies of the true factors, but there is doubt about this (Mayer, 1997).
F70 [ F E B R U A R YT H E E C O N O M I C J O U R N A L
� Royal Economic Society 2003

expensive but the recipients tend not to take standardised tests. Thus, even if specialeducation programmes are effective (Hanushek et al., 2002), the increased expen-ditures on special education will not show up in measured student performance.
Concerns about the education of children with both physical and mental dis-abilities were translated into federal law with the enactment of the Education forAll Handicapped Children Act in 1975. This Act prescribed a series of diagnostics,counselling activities, and educational services to be provided for handicappedstudents. To implement this and subsequent laws and regulations school systemsexpanded staff and programmes, developing entirely new administrative structuresin many cases to handle ‘special education’. The general thrust of the educationalservices has been to provide regular classroom instruction where possible(‘mainstreaming’) along with specialised instruction to deal with specific needs.The result has been growth of students classified as the special education popu-lation even as the total student population fell. Between 1977 and 1999, the per-centage of students classified as disabled increases from 9.3 to 13.0%. Moreover,the number of special education teachers increases much more rapidly than thenumber of children classified as disabled.
The magnitude of special education spending and its growth, however, are in-sufficient to reconcile the cost and performance dilemma. Using the best availableestimate of the cost differential for special education – 2.3 times the cost of regulareducation (Chaikind et al., 1993), the growth in special education students be-tween 1980 and 1990 can explain less than 20% of the expenditure growth(Hanushek and Rivkin, 1997). In other words, while special education pro-grammes have undoubtedly influenced overall expenditures, they remain a relat-ively small portion of the total spending on schools.
Direct estimates of other exogenous programmes and changes resulting fromother academic aspects of schools such as language instruction for immigrants ornonacademic programmes such as sports, art, or music are not readily available.Nonetheless, no evidence suggests that these can explain the magnitude ofspending growth.
1.2. Aggregate International Data
Most other countries of the world have not tracked student performance over anylength of time, making analyses comparable to the US discussion impossible.Nonetheless, international testing over the past four decades permits an overviewof spending across countries. Seven different mathematics and science tests havebeen given between the early 1960s and 1995 to students at different grade levelsin a varying set of voluntarily participating nations. (Only the US and the UKparticipated in all testing.) The test performance across time, updated fromHanushek and Kimko (2000), is summarised in Figure 2. In this Figure the scoresfor each test have been aggregated across grade levels and subtests and the worldaverage in each year is set to 50.10 While the tests were not designed to track
10 A description of the individual tests and the aggregation of scores is given in Hanushek and Kim(1995). The figure drops off the first year of testing (1965) when there are questions about represen-tativeness of the sampling. It also does not include the most recent testing (TIMSS-R in 1999).
2003] F71F A I L U R E O F I N P U T - B A S E D S C H O O L I N G P O L I C I E S
� Royal Economic Society 2003

performance over time and while they have been taken by varying countries, theycan be equated using the patterns of US test performance reported in Figure 1.This alternative normalisation does not affect the pattern because the pattern ofperformance of US students is essentially the same on both national and inter-national exams.
Performance bears little relationship to the patterns of expenditure across thecountries. Table 2 provides the distribution of 1998 primary and secondaryschool spending per pupil across a set of countries participating in the recentThird International Mathematics and Science Study (TIMSS). These countriesare sorted by order of aggregate performance on TIMSS, and a quick glance atthe Table highlights the incongruity of spending and performance.11 The simple
1970 1981 1985 1988 1991
2
80Japan
50 FranceBelgiumItaly
New Zealand
HungaryAustralia
Germany
SwedenUnited Kingdom
FinlandUnited StatesNetherlands
Thailand
Chile
IndiaIran
Japan
Netherlands
Hong Kong
FranceFinland
BelgiumSweden
United Kingdom
New Zealand
CanadaIsrael
Hungary
United States
LuxembourgThailand
Swaziland
Nigeria
Netherlands
Hong Kong
FinlandSweden
United Kingdom
Canada
Hungary
United States
Thailand
Philippines
Italy
Australia
PolandNorway
Singapore
JapanKorea Korea
CanadaUnited Kingdom
Spain
Ireland United States
ChinaKorea
SwitzerlandTaiwan
HungarySSURItaly
France
Israel United Kingdom
CanadaSpain
United StatesSloveniaIreland
Portugal
Jordan
Brazil
Mozambique
1995
SingaporeKoreaJapan
BelgiumHong KongNetherlands
AustriaSlovak Republic
AustraliaSweden
United KingdomGermany
New ZealandRussian Federation
NorwayFrance
ThailandDenmarkLativaSpainIcelandGreece
RomaniaItaly
CyprusPortugalLithuania
Iran
Colombia
South Aftica
Israel
Kuwait
Czech Republic
Slovenia
IrelandSwitzerlandHungary
United States
Test year
Agg
rega
te te
st s
core
(sc
aled
)
Fig. 2. Performance on International Mathematics and Science Examinations
11 Data from OECD (2001) provide a consistent set of spending figures converted to US dollars on apurchasing power parity basis. A total of 23 TIMSS countries have reported spending figures.
F72 [ F E B R U A R YT H E E C O N O M I C J O U R N A L
� Royal Economic Society 2003

correlation between secondary school spending and TIMSS score is an insigni-ficant 0.06.
International comparisons, of course, amplify the problems of possible con-tamination of the influence of factors other than schools that was consideredpreviously in the case of the US. As a preliminary attempt to deal with some ofthese issues, Hanushek and Kimko (2000) estimate models that relate spending,family backgrounds, and other characteristics of countries to student performancefor the tests prior to 1995.12 This estimation consistently indicates a statisticallysignificant negative effect of added resources on performance after controlling forother influences.
Gundlach et al. (2001) consider changes in scores of a set of developed nationsbetween 1970 and 1995 and their relationship to spending changes. They con-clude that productivity of schools has fallen dramatically across these countries.Woessman (2000, 2001) also performs a related analysis that relies on just the1995 performance information from TIMSS. His analysis suggests that traditional
Table 2
Primary and Secondary School Spending per Pupil in 1998, Sorted by Overall TIMSSPerformance (United States dollars in purchasing power parity)
Country Primary School Spending Secondary School Spending
Korea 2,838 3,544Japan 5,075 5,890Belgium* 3,771 6,104Netherlands 3,795 5,304Austria 6,065 8,163Australia 3,981 5,830Sweden 5,579 5,648Czech Republic 1,645 3,182Ireland 2,745 3,934Switzerland 6,470 9,348Hungary 2,028 2,140United States 6,043 7,764United Kingdom 3,329 5,230Germany 3,531 6,209Norway 5,761 7,343France 3,752 6,605Thailand 1,048 1,177Denmark 6,713 7,200Spain 3,267 4,274Greece 2,368 3,287Italy 5,653 6,458Portugal 3,121 4,636Israel 4,135 5,115
* Flemish and French speaking Belgium combined into single average expenditure.Source: OECD (2001).
12 The estimation includes average schooling of parents, population growth rates, school participa-tion rates, and separate intercepts for each of the different tests. Several measures of school resourcesincluding spending as a proportion of GNP, current expenditures per student, and class size in ele-mentary and secondary schools were also included.
2003] F73F A I L U R E O F I N P U T - B A S E D S C H O O L I N G P O L I C I E S
� Royal Economic Society 2003
resource measures bear little consistent relationship to differences in scoresamong the 39 nations participating in TIMSS for 13-year-olds.
1.3. Conclusions from Aggregate Data
Analysis of aggregate performance data is subject to a variety of problems. Anyrelationship between resources and student achievement – whether within a singlecountry or across different countries – might be distorted by other influences onperformance. Nonetheless, the variations in resources are huge, suggesting thatany effect should be apparent in even crude comparisons. No significant effect ofspending comes through in the aggregate, even when consideration of familybackground differences is introduced.
Any claim that a given set of estimated resource effects provides support forbroad increases in specific inputs – such as argued by Krueger (2002, 2003) – mustbe reconciled with the aggregate data that show no past effects of extensive pursuitof such policies.
2. Econometric Evidence
The aggregate story is supported by an extensive body of direct evidence comingfrom detailed econometric analyses of student achievement. This evidence hasbeen motivated by a monumental governmental study of US achievement thatwas conducted in the mid-1960s. The ‘Coleman Report’ (Coleman et al., 1966)presented evidence that was widely interpreted as saying that schools did notmatter. The most important factor in achievement was the family, followed bypeers in school. This study led to a great amount of research – research that hassupported part of the Coleman study but, more importantly, has clarified theinterpretation.
2.1. US Estimates
The statistical analyses relevant to this work have a common framework that hasbeen well-understood for some time (Hanushek, 1979). Student achievement at apoint in time is related to the primary inputs: family influences, peers, and schools.The educational process is also cumulative, so that both historical and contem-poraneous inputs influence current performance.
With the exception of the Coleman Report, the subsequent analysis seldom hasrelied on data collected specifically for the study of the educational process. In-stead, it has tended to be opportunistic, employing available data to gain insightsinto school operations. The focus of much of this work has been the effect ofvarying resources on student achievement. This focus flows from the underlyingperspective of production functions; from its obvious relevance for policy; andfrom the prevalence of relevant resource data in the administrative records thatare frequently used.
The summary of production in US schools begins with all of the separateestimates of the effects of resources on student performance, and then
F74 [ F E B R U A R YT H E E C O N O M I C J O U R N A L
� Royal Economic Society 2003

concentrates on a more refined set of estimates.13 The underlying work includesall published analyses prior to 1995 that include one of the resource measuresdescribed below, that have some measure of family inputs in addition to schools,and that provides the sign and statistical significance of the resource relation-ship with a measurable student outcome. The 89 individual publications thatappeared before 1995 and that form the basis for this analysis contain 376separate production function estimates. While a large number of analyses wereproduced as a more or less immediate reaction to the Coleman Report, half ofthe available estimates have been published since 1985. Of course, a number ofsubsequent analyses have also appeared since 1995. While not formally assessed,it is clear that including them would not significantly change any of the resultsreported here, given their mixed results and the large number of prior esti-mates.
Understanding the character of the underlying analyses is important for thesubsequent interpretation. Three-quarters of the estimates rely on studentperformance measured by standardised tests, while the remainder uses a varietyof different measures including such things as continuation in school, dropoutbehaviour, and subsequent labour market earnings. Not surprisingly, testscore performance measures are more frequently employed for studying edu-cation in primary schools, while a vast majority of the analyses of otheroutcomes relate to secondary schools. The level of aggregation of the schoolinput measures is also an issue considered in detail below. One-quarter of theestimates consider performance in individual classrooms, while 10% focus onschool inputs only at the level of the state. Moreover, fully one-quarter of theestimates employing nontest measures rely solely on interstate variations inschool inputs.
Table 3 presents the overall summary of basic results about the key resourcesthat form the basis for most overall policy discussions.14 The standard hypothesisdriving policy initiatives is that each of these resources should have a positive
13 Individual publications typically contain more than one set of estimates, distinguished by differentmeasures of student performance, by different grade levels, and frequently by entirely differentsampling designs. If, however, a publication includes estimates of alternative specifications employingthe same sample and performance measures, only one of the alternative estimates is included. As ageneral rule, the tabulated results reflect the estimates that are emphasised by the authors of theunderlying papers. In some cases, this rule did not lead to a clear choice, at which time the tabulationemphasised statistically significant results among the alternatives preferred by the original author. Analternative approach, followed by Betts (1996), aggregates all of the separate estimates of a commonparameter that are presented in each individual paper. Still another approach, followed by Krueger(2002, 2003), aggregates all estimates in a given publication into a single estimate, regardless of theunderlying parameter that is being estimated (see discussion below).
14 A more complete description of the studies can be found in Hanushek (1997a), which updates theanalysis in Hanushek (1986). The tabulations here correct some of the original miscoding of effects inthese publications. They also omit the estimates from Card and Krueger (1992b). In reviewing all of thestudies and estimates, it was discovered that the results of that paper were based on models that did notinclude any measures of family background differences and thus could not be interpreted as identifyingany resource parameter. As a minimal quality criterion, tabulated estimates must come from statisticalmodels that include some measure of family background, since omission will almost certainly lead tobiased resource estimates. Family backgrounds have been shown to be quite generally correlated withschool resources and have been shown to have strong effects on student outcomes.
2003] F75F A I L U R E O F I N P U T - B A S E D S C H O O L I N G P O L I C I E S
� Royal Economic Society 2003
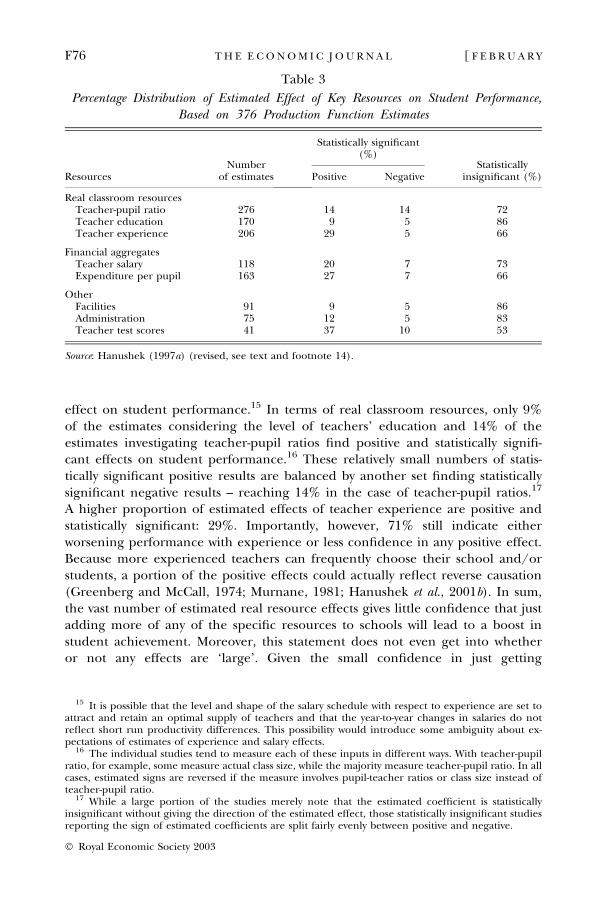
effect on student performance.15 In terms of real classroom resources, only 9%of the estimates considering the level of teachers’ education and 14% of theestimates investigating teacher-pupil ratios find positive and statistically signifi-cant effects on student performance.16 These relatively small numbers of statis-tically significant positive results are balanced by another set finding statisticallysignificant negative results – reaching 14% in the case of teacher-pupil ratios.17
A higher proportion of estimated effects of teacher experience are positive andstatistically significant: 29%. Importantly, however, 71% still indicate eitherworsening performance with experience or less confidence in any positive effect.Because more experienced teachers can frequently choose their school and/orstudents, a portion of the positive effects could actually reflect reverse causation(Greenberg and McCall, 1974; Murnane, 1981; Hanushek et al., 2001b). In sum,the vast number of estimated real resource effects gives little confidence that justadding more of any of the specific resources to schools will lead to a boost instudent achievement. Moreover, this statement does not even get into whetheror not any effects are ‘large’. Given the small confidence in just getting
Table 3
Percentage Distribution of Estimated Effect of Key Resources on Student Performance,Based on 376 Production Function Estimates
ResourcesNumber
of estimates
Statistically significant(%)
Statisticallyinsignificant (%)Positive Negative
Real classroom resourcesTeacher-pupil ratio 276 14 14 72Teacher education 170 9 5 86Teacher experience 206 29 5 66
Financial aggregatesTeacher salary 118 20 7 73Expenditure per pupil 163 27 7 66
OtherFacilities 91 9 5 86Administration 75 12 5 83Teacher test scores 41 37 10 53
Source: Hanushek (1997a) (revised, see text and footnote 14).
15 It is possible that the level and shape of the salary schedule with respect to experience are set toattract and retain an optimal supply of teachers and that the year-to-year changes in salaries do notreflect short run productivity differences. This possibility would introduce some ambiguity about ex-pectations of estimates of experience and salary effects.
16 The individual studies tend to measure each of these inputs in different ways. With teacher-pupilratio, for example, some measure actual class size, while the majority measure teacher-pupil ratio. In allcases, estimated signs are reversed if the measure involves pupil-teacher ratios or class size instead ofteacher-pupil ratio.
17 While a large portion of the studies merely note that the estimated coefficient is statisticallyinsignificant without giving the direction of the estimated effect, those statistically insignificant studiesreporting the sign of estimated coefficients are split fairly evenly between positive and negative.
F76 [ F E B R U A R YT H E E C O N O M I C J O U R N A L
� Royal Economic Society 2003

noticeable improvements, it seems somewhat unimportant to investigate the sizeof any estimated effects.
The financial aggregates and other inputs provide a similar picture. There is veryweak support for the notion that simply providing higher teacher salaries orgreater overall spending will lead to improved student performance. Per pupilexpenditure has received the most attention, but only 27% of the estimated co-efficients are positive and statistically significant. In fact, 7% even suggest someconfidence in the fact that spending more would harm student achievement. Inreality, as discussed below, analyses involving per pupil expenditure tend to be thelowest quality, and there is substantial reason to believe that even these resultsoverstate the true effect of added expenditure.
2.1.1. Study qualityThe tabulated analyses of educational performance clearly differ in quality andtheir potential for yielding biased results. Two elements of quality, both related tomodel specification and estimation, are particularly important. First, educationpolicy in the US is made chiefly by the separate 50 states, and the resultingvariations in spending, regulations, graduation requirements, testing, labourlaws, and teacher certification and hiring policies are large. These importantdifferences – which are also the locus of most current policy debates – imply thatany estimates of student performance across states must include descriptions of thepolicy environment of schools or else they will be subject to standard omittedvariables bias. The misspecification bias of models that ignore variations in stateeducation policy (and other potential state differences) will be exacerbated byaggregation of the estimation sample. Second, as noted, education is a cumulativeprocess, but a majority of analyses are purely cross-sectional with only contem-poraneous measures of inputs. In other words, when looking at performance at theend of secondary schooling, many analyses include just measures of the currentteachers and school resources and ignore the dozen or more prior years of inputs.Obviously, current school inputs will tend to be a very imperfect measure of theresources that went into producing ending achievement. This mismeasurement isstrongest for any children who changed schools over their career (a sizable ma-jority in the US) but also holds for students who do not move because of theheterogeneity of teachers within individual schools; see Hanushek et al. (2001a);Rivkin et al. (2001). Even if contemporaneous measures were reasonable proxiesfor the stream of cumulative inputs, uncertainty about the interpretation andpolicy implications would remain. But there is little reason to believe that they aregood proxies.
While judgments about study quality often have a subjective element, it ispossible to make straightforward distinctions based on violations of these twoproblems. We begin with the issue of measuring the policy environment. Statesdiffer dramatically in their policies, and ignoring any policies that have a directimpact will bias the statistical results if important policies tend to be correlatedwith the resource usage across states. While the direction of any bias dependson the magnitude and sign of correlation, under quite general circumstances,the severity will increase with the level of aggregation of the school inputs.
2003] F77F A I L U R E O F I N P U T - B A S E D S C H O O L I N G P O L I C I E S
� Royal Economic Society 2003

That is, any bias will tend to be more severe if estimation is conducted atthe state level than if conducted at the classroom level (Hanushek et al.,1996).18
Table 4 provides insight into the pattern and importance of the specific omittedvariables bias resulting from lack of information about key educational policydifferences. This Table considers two input measures: teacher-pupil ratio and ex-penditure per pupil. These inputs, on top of being important for policy, are in-cluded in a sufficient number of analyses at various levels of aggregation that theycan point to the potential misspecification biases. As discussed previously, theoverall percentage of all estimates of teacher-pupil ratios that are statistically sig-nificant and positive is evenly balanced by those that are statistically significant andnegative. But this is not true for estimates relying upon samples drawn entirelywithin a single state, where the overall policy environment is constant and thuswhere any bias from omitting overall state policies is minimised or eliminated. Forsingle state estimates, the statistically significant effects are disproportionatelynegative. Yet, as the samples are drawn across states, the relative proportion pos-itive and statistically significant rises. For those aggregated to the state level wherethe expected bias is largest, almost two-thirds of the estimates are positive and
Table 4
Percentage Distribution of Estimated Effect of Teacher-Pupil Ratio and Expenditureper Pupil by State Sampling Scheme and Aggregation
Level of aggregationof resources
Numberof estimates
Statistically significant(%)
Statisticallyinsignificant (%)Positive Negative
a. Teacher-Pupil RatioTotal 276 14 14 72Single state samples* 157 11 18 71Multiple state samples� 119 18 8 74
Disaggregated within states� 109 14 8 78State level aggregation§ 10 60 0 40
b. Expenditure per pupilTotal 163 27 7 66Single state samples* 89 20 11 69Multiple state samples� 74 35 1 64
Disaggregated within states� 46 17 0 83State level aggregation§ 28 64 4 32
*Estimates from samples drawn within single states.�Estimates from samples drawn across multiple states.�Resource measures at level of classroom, school, district, or country, allowing for variation within eachstate.§Resource measures aggregated to state level with no variation within each state.
18 The discussion of aggregation is part of a broader debate trying to reconcile the findings of Cardand Krueger (1992a) with those presented here. For a fuller discussion, see Burtless (1996). Of par-ticular relevance is Heckman et al. (1996a, b), which raises other issues with the Card and Kruegerestimation. Specifically, their key identifying assumption of no selective migration is violated. Similarly,assumptions about homogeneity of effects across schooling categories are found not to hold.
F78 [ F E B R U A R YT H E E C O N O M I C J O U R N A L
� Royal Economic Society 2003

statistically significant. The pattern of results also holds for estimates of the effectsof expenditure differences (which are more likely to come from highly aggregateanalyses involving multiple states).19
This pattern of results is consistent with expectations from considering specifi-cation biases when favourable state policies tend to be positively correlated withresource usage. The initial assessment of effects indicated little reason to beconfident about overall resource policies. This refinement on quality indicates thata number of the significant effects may further be artifacts of the sampling andmethodology.
The second problem, improper consideration of the cumulative nature of theeducational process, is a different variant of model specification. Relating the levelof performance at any point in time just to the current resources is likely to be verymisleading. The standard approach for dealing with this is the estimation of value-added models where attention is restricted to the growth of achievement over alimited period of time (where the flow of resources is also observed). By concen-trating on achievement gains over, say, a single grade, it is possible to control forinitial achievement differences, which will be determined by earlier resources andother educational inputs. In other words, fixed but unmeasured factors are elim-inated.
Table 5 displays the results of estimates that consider value-added models forindividual students. The top panel shows all such results, while the bottom panelfollows the earlier approach of concentrating just on estimates within an individualstate. With the most refined investigation of quality, the number of analyses getsquite small and selective. In these, however, there is no support for systematicimprovements through increasing teacher-pupil ratios and hiring teachers withmore graduate education. The effects of teacher experience are largely unaffectedfrom those for the universe of estimates.
The highest quality estimates indicate that the prior overall results about theeffects of school inputs were not simply an artifact of study quality. If anything, thetotal set of estimates understates the ineffectiveness of pure resources differencesin affecting student outcomes.
The methodology of Krueger (2002, 2003) takes a different approach is tabu-lating the results – recording a single composite estimate for each publication.20
He implies that he is making overall quality judgments in his tabulations when heselectively contrasts a few publications with both a large number of estimates andpotentially damaging statistical problems with an analysis that has both a small
19 Expenditure studies virtually never direct analysis at performance across different classrooms orschools, since expenditure data are typically available only at the district level. Thus, they begin at amore aggregated level than many studies of real resources. An alternative explanation of the strongerestimates with aggregation is that the disaggregated studies are subject to considerable errors-in-measurement of the resource variables. The analysis in Hanushek et al. (1996), however, suggests thatmeasurement error is not the driving force behind the pattern of results.
20 A separate approach to aggregating the econometric results, referred to as ‘meta-analysis’, hasbeen proposed by Greenwald et al. (1996). Instead of just tabulating results, they propose formalstatistical analysis. This approach, however, typically considers the wrong hypothesis for policy discus-sions (i.e. that all estimated coefficients for a given parameter are simultaneously zero). Further, theseapproaches invariably lack the necessary statistical information when they rely on just published results:see Hanushek (1996).
2003] F79F A I L U R E O F I N P U T - B A S E D S C H O O L I N G P O L I C I E S
� Royal Economic Society 2003

number of estimates and better statistical modelling (Summers and Wolfe, 1977).This impression is, however, very deceptive, and the mechanical tabulationapproaches simply do not provide any effective overall quality assessment.21
A review of the available estimates clarifies how Krueger’s tabulation of teacher-pupil ratio results differs: 17 of the 59 publications (29%) contained a singleestimate of the effect of the teacher-pupil ratio — but these estimates are only 6%of the 277 total available estimates.22 Krueger wants to increase the weight on these17 estimates (publications) and commensurately decrease the weight on the re-maining 260 estimates. Note, however, that over 40% of the single-estimate pub-lications use state aggregate data, compared to only 4% of all estimates. Relatedly,the single-estimate publications are more likely to employ multistate estimates(which consistently ignore any systematic differences in state policies) than thepublications with two or more estimates. Weighting by publications rather thanseparate estimates, as Krueger promotes, heavily weights low-quality estimates thatsuffer from the two major quality problems discussed above.
The implications of the different weighting schemes are perhaps easiest seen bynoting the effect on the weights attached to his own estimates (Card and Krueger,1992a, b). Each of these state-level analyses contributes one positive and sta-tistically significant estimate of teacher-pupil ratios (although, as noted, Card andKrueger (1992b) should not be included because it lacks any measure of family
Table 5
Percentage Distribution of Other Estimated Influences on Student Performance,Based on Value-added Models of Individual Student Performance
ResourcesNumber
of estimates
Statistically significant(%)
Statisticallyinsignificant (%)Positive Negative
a. All estimatesTeacher-pupil ratio 79 11 9 80Teacher education 41 0 10 90Teacher experience 62 37 2 61
b. Estimates within a single stateTeacher-pupil ratio 24 4 17 79Teacher education 34 0 9 91Teacher experience 37 41 3 56
21 A central motivation for Krueger (2002) is the assertion that publications containing more esti-mates will have smaller sample sizes and thus will typically have larger standard errors. Sample sizes donot, however, fall on average with the number of estimates. The median sample size for estimates inpublications with just one is indistinguishable from that for publications with 8 or more estimates(Hanushek, 2002). The single estimate in Card and Krueger (1992a), for example, is based on just 147state aggregate data points, placing its sample size at less than half used by the median of all of theestimates of the effects of teacher-pupil ratios. Moreover, if one took seriously that results should beweighted by sample size, such calculations can be easily done instead of relying on the impre-cise weighting of the number of estimates in each publication.
22 Note, to facilitate comparisons with Krueger (2003), this discussions includes the estimate of theeffects of pupil-teacher ratios in Card and Krueger (1992b) that was excluded from the tabulationspreviously displayed; see footnote 14. This one estimate in fact has a huge impact on the Kruegercalculations because it comes from a frequently cited publication with a single estimate.
F80 [ F E B R U A R YT H E E C O N O M I C J O U R N A L
� Royal Economic Society 2003

background). On the basis of available estimates, these would represent 0.7% ofthe findings. This rises to 3.4% based on weighting by publications. But, on thebasis of citations, these estimates go to a remarkable 17% of the weighted findings;see Hanushek (2002).
The explicit quality considerations made in the bottom panel of Table 5 in facteliminate all of the publications and estimates Krueger identifies as being prob-lematic (i.e. the nine publications with eight or more estimates) – although theyare eliminated on grounds of statistical quality and not because they simply pro-vided too many separate estimates of class size effects. That panel does include theSummers and Wolfe (1977) estimate, along with a number of other equally highquality analyses of student achievement. But, most importantly, it also eliminatesthe 11 highly problematic estimates that come from estimates of the effect ofteacher-pupil ratios using state level analyses that ignore differences in the statepolicy environment. These latter estimates have a disproportionate impact on eachof his tabulations even though they are arguably the poorest estimates of the effectof class size on student performance.
In sum, Krueger’s re-analysis of the econometric evidence achieves differentresults by emphasising low-quality estimates. The low-quality estimates are dem-onstrably biased toward finding significant positive effects of class size reductionand of added spending. His discussion tries to suggest that one is caught on thehorns of a dilemma: either weight heavily the estimates from the nine publicationswith the most estimates (as in the overall estimates of Table 3) or weight heavilythe low-quality state aggregate estimates (as he favours). In reality, another optionis available: weight neither heavily because both suffer from serious statisticalproblems, as shown in the bottom of Table 5. Instead, concentrate on the highestquality studies.
Remarkably, just re-weighting by the Krueger technique still provides weaksupport for the overall class size reduction policies that Krueger advocates. Mostof the estimates, no matter how tabulated, are not statistically different from zeroat conventional levels. Even weighting by publications instead of estimates, three-quarters of the estimates are insignificant or have the wrong sign, and barelymore than half the results indicate a positive effect of smaller classes. Thus, evenwhen heavily weighting low-quality estimates, he can only achieve his rhetoricalpurpose of emphasising that ‘class size is systematically related to student per-formance’ by giving equal weight to statistically insignificant and statisticallysignificant results and discarding estimates where the sign of insignificant esti-mates is unavailable.
2.1.2. Overall econometric specificationA key issue in considering the results of the educational production functionanalyses is whether they provide the necessary guidance for policy purposes.Specifically, while they show a pattern of association, is it reasonable to infer thatthey identify causal relationships?
The issue is particularly important when put into the context of educationalpolicy. Resource allocations are determined by a complicated series of politicaland behavioural choices by schools and parents. The character of these choices
2003] F81F A I L U R E O F I N P U T - B A S E D S C H O O L I N G P O L I C I E S
� Royal Economic Society 2003

could influence the estimates of the effectiveness of resources. Consider, forexample, the result of systematically assigning school resources in a compen-satory manner. If low achieving kids are given extra resources – say smallerclasses, special remedial instruction, improved technology, and the like – thereis an obvious identification problem. Issues of this kind suggest bothcare in interpretation of results and the possible necessity of alternativeapproaches.
Before continuing, however, it is important to be more precise about thenature and potential importance of these considerations. Funding responsibilityfor schools in the US tends on average to be roughly equally divided betweenstates and localities with the federal government contributing only 7% of overallspending. Huge variation in funding levels and formulae nonetheless existsacross states. In most state funding of schools in the US, the distribution ofexpenditure does not depend on the actual performance of individual students,but instead (inversely) on the wealth and income of the community. In modelsof achievement that include the relevant family background terms (such aseducation, income, or wealth), this distribution of state resources would simplyincrease the correlations among the exogenous variables but would not suggestany obvious simultaneity problems for the achievement models. In fact, whilethe compensatory nature of funding often motivates some concerns, even thiscorrelation of background and resources is not clear. Much of the fundingdebate in the US has revolved around a concern that wealthier communitiesand parents can afford to spend more for schools, and in fact almost all statefinancing formula are designed to offset this tendency at least partially. Thus,the actual correlations of resources and family backgrounds often are not veryhigh.23
At the individual student level, correlations with aggregate district resourcesthrough either formula allocations or community decisions are not a majorcause of concern. The individual classroom allocations may, however, be aconcern. For example, within a school, low achievers may be placed in smallerclasses, suggesting the possibility of simultaneity bias. Any such problems shouldbe largely ameliorated by value-added models, which consider the student’sprior achievement directly. The only concern then becomes allocations made onthe basis of unmeasured achievement influences that are unrelated to priorachievement.
Particularly in the area of class size analysis, a variety of approaches do go furtherin attempting to identify causal effects, and the results are quite varied. Hoxby(2000) used de-trended variations in the size of birth cohorts to identify exogenouschanges in class size in small Connecticut towns. Changes in cohort sizes, coupled
23 The distribution of state funds varies across the states, but one fairly common pattern is that majorportions of state funds are distributed inversely to the property wealth of the community. Becausecommunity wealth includes the value of commercial and industrial property within a community, thecorrelation of community wealth with the incomes of local residents tends to be low and sometimeseven negative.
F82 [ F E B R U A R YT H E E C O N O M I C J O U R N A L
� Royal Economic Society 2003

with the lumpiness of classes in small school districts, can provide variations inclass size that are unrelated to other factors.24 Other estimates have also explicitlyconsidered exogenous factors affecting class size within the context of instru-mental variables estimators for the effects of class size (Akerhielm, 1995; Boozerand Rouse, 1995). Unfortunately, identification of truly exogenous determinantsof class size, or resource allocations more generally, is sufficiently rare that othercompromises in the data and modelling are frequently required. These coinci-dental compromises jeopardise the ability to obtain clean estimates of resourceeffects and may limit the generalisability of any findings. Rivkin et al. (2001),employing an approach similar in spirit to that used by Hoxby, make use of exo-genous variations in class sizes within Texas schools across multiple cohorts ofvarying sizes.25 They find some small class size effects, but the effects vary signifi-cantly across grades and specifications.
These alternative approaches yield inconsistent results both in terms of class sizeeffects and in terms of the effects of alternative methodologies. The results in eachof these analyses tend to be quite sensitive to estimation procedures and to modelspecification. Further, they are inconsistent in terms of statistical significance,grade pattern, and magnitude of any effects. As a group, the results are more likelyto be statistically significant with the expected sign than those presented previouslyfor all estimates, but the typical estimate (for statistically significant estimates)tends to be very small in magnitude (see below).
2.2. International Econometric Evidence
The evidence for countries other than the US is potentially important for a varietyof reasons. Other countries have varying institutional structures, so differentfindings could help to identify the importance of organisation and overall in-centives. Moreover, other countries frequently have much different levels of re-sources and exhibit larger variance in resource usage, offering the prospect ofunderstanding better the importance of pure resource differences. For example,one explanation of the lack of relationship between resources and performance inthe US is its schools there are generally operating in an area of severe diminishingmarginal productivity, placing most on the ‘flat of the curve’. Thus, by observingschools at very different levels of resources, it would be possible to distinguishbetween technological aspects of the production relationship and other possibleinterpretations of the evidence such as imprecise incentives for students andteachers.
24 While pertaining directly to the international evidence below, in a related approach Angrist andLavy (1999) note that Maimonides’ Rule requires that Israeli classes cannot exceed forty students, sothat, again, the lumpiness of classrooms may lead to large changes in class size when the numbers ofstudents in a school approaches multiples of forty (and the preferred class size is greater than forty).They formulate a regression discontinuity approach to identify the effects of class size, but many of theirestimates also use class size variation other than that generated by the discontinuities. Similarly, Caseand Deaton (1999) concentrate on the impact of white decision making on black schools in SouthAfrica (where endogeneity from compensatory policies is arguably less important). They conclude thatsmaller classes have an impact on student outcomes in that setting.
25 The nature of this analysis is discussed further below in the section on teacher quality.
2003] F83F A I L U R E O F I N P U T - B A S E D S C H O O L I N G P O L I C I E S
� Royal Economic Society 2003

While the international evidence has been more limited, this situation is likely tobe reversed profitably in the future. A key problem has been less available per-formance data for different countries, but this lack of information is being cor-rected. As student outcome data become more plentiful – allowing investigationof value added by teachers in schools in different environments, internationalevidence can be expected to grow in importance.
2.2.1. Developing countriesExisting analyses in less developed countries have shown a similar inconsistency ofestimated resource effects as that found in the US. While these estimates typicallycome from special purpose analyses and are frequently not published in refereedjournals, they do provide insights into resource use at very different levels ofsupport. Table 6 provides evidence on resource effects from estimates completedby 1990.26 Two facets of these data compared to the previous US data stand out: (i)in general, a minority of the available estimates suggests much confidence that theidentified resources positively influence student performance; (ii) there is gener-ally somewhat stronger support for these resource policies than that existing in USanalyses. Thus, the data hint that the importance of resources may vary with thelevel of resources, a natural presumption. Nonetheless, the evidence is not con-clusive that pure resource policies can be expected to have a significant effect onstudent outcomes.
2.2.2. Developed countriesThe evidence on developed countries outside of the US is more difficult to com-pile. The review by Vignoles et al. (2000) points to a small number of analysesoutside of the US and shows some variation them similar to that already reportedamong estimates elsewhere. Dustman et al. (2003) provide an additional set ofestimates.
Table 6
Percentage Distribution of Estimated Expenditure Parameter Coefficients from 96Educational Production Function Estimates: Developing Countries
InputNumber
of estimates
Statistically Significant(%)
StatisticallyInsignificant (%)Positive Negative
Teacher/Pupil Ratio 30 27 27 46Teacher Education 63 56 3 41Teacher Experience 46 35 4 61Teacher Salary 13 31 15 54Expenditure/Pupil 12 50 0 50Facilities 34 65 9 26
Source: Hanushek (1995).
26 This compilation of results from Hanushek (1995) incorporates information from Fuller (1985),Harbison and Hanushek (1992), and a variety of studies during the 1980s.
F84 [ F E B R U A R YT H E E C O N O M I C J O U R N A L
� Royal Economic Society 2003

One set of consistent estimates for the TIMSS data is presented in Hanushekand Luque (2003). They employ the data on variations in scores across schoolswithin individual countries. The 17 countries with complete data for 9-year-oldsand the 33 countries with complete data for 13-year-olds are weighted toward moredeveloped countries but do include poor countries. As shown in Table 7, they findlittle evidence that any of the standard resource measures for schools are related todifferences in mathematics scores within countries, although a majority of the classsize results for the youngest age group do have the expected negative sign. Anextension of the estimation considers the possibility of compensatory allocation ofstudents to varying class sizes. Specifically, estimation for rural schools with a singleclassroom – where compensatory placement is not feasible – yields little change inthe overall results.27 The lack of significant resource effects when corrected forselection does differ from the findings of Angrist and Lavy (1999) and of Case andDeaton (1999), which find more significant resource effects in Israel and SouthAfrica (see footnote 24 for details).
Moreover, there is no evidence in this consistent work that there are differenteffects of resources by income level of the country or by level of the resources.Thus, contrary to the conclusions of Heyneman and Loxley (1983), schools do notappear relatively more important for poorer countries.
Woessman (2000, 2001) looks at cross national differences in TIMSS mathe-matics and science scores and concludes that the institutional structure mattersimportantly for achievement. By pooling the individual student test scores acrosscountries and estimating models that include both school and national charac-teristics, he finds suggestive evidence that the amount of competition from privateschools and the amount of decentralisation of decision making to individualsschools have significant beneficial impacts, while union strength is detrimentaland standard differences in resources across countries are not clearly related tostudent performance. The limited number of national observations for institutionsnevertheless leaves some uncertainty about the estimates and calls for replicationin other samples that permit, say, variations within individual countries in the keyinstitutional features.
3. Project STAR and Experimental Data28
A different form of evidence – that from random assignment experiment – hasrecently been widely circulated in the debates about class size reduction. Inassessing resource effects, concern about selection frequently remains, even in theinstrumental approaches. Following the example of medicine, one large scaleexperimental investigation in the State of Tennessee in the mid-1980s (ProjectSTAR) pursued the effectiveness of class size reductions. Random-assignmentexperiments in principle have considerable appeal. The underlying idea is that wecan obtain valid evidence about the impact of a given well-defined treatment by
27 An additional check analyses whether smaller classes in a given grade seem to be allocated oncompensatory or elitist grounds and finds countries split on this. The impact of such considerations onthe estimated effects is nonetheless minimal.
28 For a more extensive discussion of Project STAR, see Hanushek (1999a, b).
2003] F85F A I L U R E O F I N P U T - B A S E D S C H O O L I N G P O L I C I E S
� Royal Economic Society 2003

Table 7
Distribution of Estimated Production Function Parameters across Countries and Age Groups, by Sign and Statistical Significance(10% level) Dependent variable: classroom average TIMSS mathematics score
Age 9 population Age 13 population
Negative Positive Negative Positive
SignificantNot
significantNot
significant SignificantNumber
of countries SignificantNot
significantNot
significant SignificantNumber
of countries
Class Size 3 11 2 0 17 2 8 6 17 33Teacher with at least abachelor’s degree
0 3 12 0 15 2 11 12 2 32
Teacher with special training 0 7 4 1 12 0 12 11 2 25Teacher experience 0 7 6 4 17 3 9 17 4 33
Note: Number of statistically significant results with the expected sign of the effect shown in italics. Because these estimates rely on actual class size, the expected signis negative (and not reversed as for teacher-pupil ratios in the prior tables).Source: Hanushek and Luque (2003).
F86
[F
EB
RU
AR
YT
HE
EC
ON
OM
IC
JO
UR
NA
L
�R
oyal
Eco
no
mic
Society
2003

randomly assigning subjects to treatment and control groups, eliminating thepossible contaminating effects of other factors and permitting conceptually clea-ner analysis of the outcomes of interest across these groups. With observationsderived from natural variations in individual selection, one must be able to dis-tinguish between the treatment and other differences that might directly affect theobserved outcomes and that might be related to whether or not they receive thetreatment. Randomisation seeks to eliminate any relationship between selectioninto a treatment programme and other factors that might affect outcomes. (See,however, the caution provided in Todd and Wolpin (2003)).
Project STAR was designed to begin with kindergarten students and to followthem for four years. Three treatments were initially included: small classes (13–17students); regular classes (22–25 students); and regular classes (22–25 students)with a teacher’s aide. Schools were solicited for participation, with the stipulationthat any school participating must be large enough to have at least one class ineach treatment group. The initial sample included 6,324 kindergarten pupils, splitbetween 1,900 in small classes and 4,424 in regular classes. (After the first year, thetwo separate regular class treatments were effectively combined, because therewere no perceived differences in student performance. The result about the in-effectiveness of classroom aides has received virtually no attention.) The initialsample included 79 schools, although this subsequently fell to 75. The initial 326teachers grew slightly to reflect the increased sample size in subsequent grades,although of course most teachers are new to the experiment at each new grade.
The results of the Project STAR experiment have been widely publicised. Thesimplest summary is that:
1. Pupils in small classes perform better than those in regular classes orregular classes with aides starting in kindergarten;
2. The kindergarten performance advantage of small classes widens a smallamount in first grade but then either remains quantitatively the same(reading) or narrows (mathematics) by third grade; and,
3. Taking each grade separately, the difference in performance between smalland regular classes is statistically significant.
This summary reflects the typical reporting, focusing on the differences inperformance at each grade and concluding that small classes are better than large,e.g., Finn and Achilles (1990); Mosteller (1995). But, it ignores the fact that underthe common conceptual discussions one would expect the differences in per-formance to become wider through the grades because they continue to get moreresources (smaller classes) and that should keep adding an advantage. This issuewas first raised by Prais (1996), who framed the discussion in terms of the value-added. As Krueger (1999) demonstrates, the small class advantage is almost ex-clusively obtained in the first year of being in a small class – suggesting that theadvantages of small classes are not generalisable to any other grades.
Importantly, this pattern of effects is at odds with the normal rhetoric aboutsmaller classes permitting more individualised instruction, allowing improved classroom interactions, cutting down on disruptions, and the like. If these were theimportant changes, small classes should confer continuing benefits in any grades
2003] F87F A I L U R E O F I N P U T - B A S E D S C H O O L I N G P O L I C I E S
� Royal Economic Society 2003

where they are employed. Instead, the results appear more consistent with soci-alisation or introduction into the behaviour of the classroom – one time effectsthat imply more general class size reduction policies across different grades willnot be effective – or with simple problems in the randomisation and implemen-tation of the experiment.
The actual gains in performance from the experimental reduction in class sizewere relatively small (less than 0.2 standard deviations of test performance), es-pecially when the gains are compared to the magnitude of the class size reduction(around 8 students per class). Thus, even if Project STAR is taken at face value, ithas relatively limited policy implications.
While the experimental approach has great appeal, the actual implementationin the case of Project STAR introduces considerable uncertainty into these esti-mates (Hanushek, 1999b). The uncertainty arises most importantly from questionsabout the quality of the randomisation over time. In each year of the experiment,there was sizable attrition from the prior year’s treatment groups, and these stu-dents were replaced with new students. Of the initial experimental group startingin kindergarten, 48% remained in the experiment for the entire four years. Noinformation, such as pretest scores before entry to the experiment, is available toassess the quality of student randomisation for the initial experimental sample orfor the subsequent additions to it. Throughout the four years of the experimentthere was substantial and nonrandom treatment group crossover (about 10% ofthe small class treatment group in grades 1–3). There is also substantial, non-random test taking over the years of the experiment, exceeding 10% on some tests.Most important, the results depend fundamentally on the choice of teachers.While the teachers were to be randomly assigned to treatment groups, there islittle description of how this was done. Nor is it easy to provide any reliable analysisof the teacher assignment, because only a few descriptors of teachers are found inthe data and because there is little reason to believe that they adequately measuredifferences in teacher quality.29 The schools themselves were self-selected and areclearly not random. Small schools were precluded from the study, as were thoseschools that were unwilling to provide their own partial funding to cover the fullcosts. (This issue is also important, because the STAR experiment heavily over-sampled urban and minority schools where the response to the programme isthought to be largest.)30 The net result of each of these effects is difficult toascertain, but there is prima facie evidence that the total impact is to overstate theimpact of reduced class size (Hanushek, 1999b). Hoxby (2000) further points outthat because teachers and administrators knew they were participating in anexperiment that could have significant implications for future resources, theirbehaviour in the experiment could be affected.
29 The teacher data include race, gender, teaching experience, highest degree, and position on theTennessee career ladder. While there is no information about the effect of career ladder position onstudent performance, as summarised above, none of the other measures have been found to be reliableindicators of quality. For estimates of the magnitude of variation in teacher quality, see below.
30 Krueger (1999) identifies significantly stronger effects for disadvantaged students, which will thenbe overweighted in calculating programme average treatment effects.
F88 [ F E B R U A R YT H E E C O N O M I C J O U R N A L
� Royal Economic Society 2003

The importance of the methodology does deserve emphasis. Because of ques-tions about effectiveness and causality in the analysis of schools, further use ofrandom assignment experimentation would have high value. As Todd and Wolpin(2003) point out, random assignment experiments do not answer all of the policyquestions. Nonetheless, it would seem natural to develop a range of experimentsthat could begin to provide information about what kinds of generalisations can bemade.
The one limited and flawed experiment in Tennessee cannot be taken asproviding the definitive evidence needed for policy changes that cost billions ofdollars annually. At best it provides evidence about the potential impact of verylarge changes in class size applied to kindergarten students, and there is directevidence that these findings do not generalise to other grades and other situa-tions.
4. Interpreting the Resource Evidence
A wide range of analyses indicate that overall resource policies have not led todiscernible improvements in student performance. It is important to understandwhat is and is not implied by this conclusion. First, it does not mean that moneyand resources never matter. There clearly are situations where small classes oradded resources have an impact. It is just that no good description of when andwhere these situations occur is available, so that broad resource policies such asthose legislated from central governments may hit some good uses but also hit baduses that generally lead to offsetting outcomes. Second, this statement does notmean that money and resources cannot matter. Instead, as described below, alteredsets of incentives could dramatically improve the use of resources.
The evidence on resources is remarkably consistent across countries, both de-veloped and developing. Had there been distinctly different results for somesubsets of countries, issues of what kinds of generalisations were possible wouldnaturally arise. Such conflicts do not appear particularly important.
There is a tendency by researchers and policy makers to take a single studyand to generalise broadly from it. By finding an analysis that suggests a signi-ficant relationship between a specific resource and student performance, theyconclude that, while other resource usage might not be productive, the usagethat is identified would be, e.g, Grissmer et al. (2000). If this is so, it leads to anumber of important questions. Why is that schools have failed to employ sucha policy? Is it just that they do not have the information that the researcherhas? That of course seems unlikely since schools in fact constantly experimentwith a variety of approaches and resource patterns. Alternatively, consistent withthe discussion below, it seems more likely that schools have limited incentivesto seek out and to employ programmes that consistently relate to studentachievement.
It is just this tendency to overgeneralise from limited evidence that lies behindthe search for multiple sources of evidence on the effectiveness of different re-source usage. That broader body of evidence provides little support for the inputpolicies that continue to be the most common approach to decision making.
2003] F89F A I L U R E O F I N P U T - B A S E D S C H O O L I N G P O L I C I E S
� Royal Economic Society 2003

5. Teacher Quality
Starting with the Coleman Report on Equality of Educational Opportunity (Colemanet al., 1966), many have argued that schools do not matter and that only familiesand peers affect performance. Unfortunately, that report and subsequent inter-pretations of it have generally confused ‘measurability’ with true effects. Specif-ically, as described above for more recent work, characteristics of schools andclassrooms were not closely related to student performance – leading to the con-clusion that schools do not matter. This conclusion not only led to the extensivesubsequent research but also probably more than anything else to a prevailing viewthat differences among schools are not very important.
The extensive research over the past 35 years has made it clear that there arevery important differences among teachers and, by implication, schools. Thisfinding, of course, does not surprise many parents who are well aware of qualitydifferences of teachers but it eluded many researchers.
The simple definition of teacher quality used here is an output based measurethat focuses on student performance, instead of the more typical input measuresbased on characteristics of the teacher and school. High quality teachers are oneswho consistently obtain higher than expected gains in student performance, whilelow quality teachers are ones who consistently obtain lower than expected gains.Using that definition, variations in teacher quality can be obtained by estimatingfixed effects models of student performance after conditioning on entering stu-dent performance and other factors that affect achievement gains. When thisapproach has been used in studying US schools, large variations in performancehave been uncovered, e.g., Hanushek (1971, 1992); Murnane (1975); Murnaneand Phillips (1981); Armor et al. (1976); Rivkin et al. (2001).31 The only relatedstudy internationally pertains to rural Brazil, where similarly large differencesamong teachers are found (Harbison and Hanushek, 1992).
The magnitude of differences in teacher quality is impressive. Looking at therange of quality for teachers within a single large urban district, teachers near thetop of the quality distribution can get an entire year’s worth of additional learningout of their students compared to those near the bottom (Hanushek, 1992).32
That is, a good teacher will get a gain of 1½ grade level equivalents while a badteacher will get ½ year for a single academic year.
A second set of estimates comes from recent work on students in Texas (Rivkinet al., 2001). The analysis follows several entire cohorts of students and permits
31 In the general fixed effect formulation, identification and interpretation of teacher and schooleffects is nonetheless complicated. For example, teacher effects, school effects and classroom peereffects are not separately identified if the estimates come from a single cross section of teachers.Hanushek (1992), however, demonstrates the consistency of individual teacher effects across gradesand school years, thus indicating that the estimated differences relate directly to teacher quality and notthe specific mix of students and the interaction of teacher and students. Rivkin et al. (2001) removeseparate school and grade fixed effects and observe the consistency of teacher effects across differentcohorts – thus isolating the impact of teachers.
32 These estimates consider value-added models with family and parental models. The sample in-cludes only low income minority students, whose average achievement in primary school is below thenational average. The comparisons given compare teachers at the 5th percentile with those at the95th percentile.
F90 [ F E B R U A R YT H E E C O N O M I C J O U R N A L
� Royal Economic Society 2003

multiple observations of different classes with a given teacher. We look at just thevariations in performance from differences in teacher quality within a typicalschool and do not consider any variations across schools, making them very mucha lower bound on teacher effects. The variation in teacher quality is large: movingfrom an average teacher to one at the 85th percentile of teacher quality (i.e.,moving up one standard deviation in teacher quality) implies that the teacher’sstudents would move up more than 4 percentile rankings in the given year. (For avariety of reasons, these are lower bounds estimates of variations in teacher quality.Any variations in quality across schools would add to this. Moreover, the estimatesrely on a series of conservative assumptions which all tend to lead to understate-ment of the systematic teacher differences.)
A third indication of magnitude is found in the Project STAR results. Theaverage difference in performance of students in small kindergartens has been thefocus of all attention, but the results actually differed widely by classroom. In only40 out of 79 schools did the kindergarten performance in the small classroomexceed that in the regular classrooms (with and without aides). The moststraightforward interpretation of this heterogeneity is that variations in teacherquality are extraordinarily important.
The teacher differences estimated in Texas are huge compared to any of theestimates for measured teacher and school attributes. For example, a one standarddeviation reduction in class size implies a 0.01–0.03 standard deviation improve-ment in student achievement (Rivkin et al., 2001). The lower bound estimate onteacher quality summarised implies a one standard deviation change in qualityleads to a 0.11 standard deviation increase in achievement. The fact that even thelower bound estimate of teacher quality effects dwarfs either class size or experi-ence effects should give policy makers pause.
These estimates of teacher quality can also be related to the popular argumentthat family background is overwhelmingly important and that schools cannot beexpected to make up for bad preparation from home. The latter estimates ofteacher performance suggest that having five years of good teachers in a row (onestandard deviation above average, or at the 85th quality percentile) would over-come the average achievement deficit between low income kids (those on free orreduced price lunch) and others from higher income families. In other words,high quality teachers can make up for the typical deficits that we see in the pre-paration of kids from disadvantaged backgrounds.
We do not tend to observe these deficits disappearing, however, because thecurrent school system does not ensure any streaks of such high quality teachers –particularly for disadvantaged students. In fact, it is currently as likely that thetypical student gets a run of bad teachers – with the symmetric achievementlosses – as a run of good teachers.
6. Policy Alternatives
Much of economic analysis is built on a presumption that higher expenditure yieldsbetter outcomes. Thus, many people are surprised to find evidence that schoolresources are not closely related to student performance. Indeed, a variety of
2003] F91F A I L U R E O F I N P U T - B A S E D S C H O O L I N G P O L I C I E S
� Royal Economic Society 2003

mechanisms might conceptually push schools toward better resource use. Parentsundoubtedly care about the performance of their children. Democratic politicalpressures might force responsive government actions. Household locational deci-sions allow families some latitude to select schools that are performing well.
But this is not a frictionless market with knowledgeable consumers making de-cisions with perfect information. We are considering government provision of aservice whose quality is difficult to judge. Moving one’s residence or forcing bettergovernmental performance in a specific service area is difficult and expensive.Moreover, it is frequently difficult to separate the quality of the school from thequality of the students. We know that parents as well as students exert a powerfulinfluence on student achievement. In order to make quality judgments, it is ne-cessary to separate the school from the nonschool influences. Parents can gener-ally tell the differences among the different teachers within a given school, butcomparing the average quality of teachers in one school to those in another is amore difficult task. It is especially difficult because residential and school choicedecisions frequently involve an element of sorting along socio-economic lines and,on average, along lines of student preparation. Conventionally defined ‘goodschools’ are often schools with the best-prepared students going into them butnot necessarily ones where the value-added of the school is particularly high andvice versa for ‘bad schools’.
The clearest contrast in policy perspectives is between input policy and output,or incentive, policies. In the US and elsewhere, for example, a very popular recentpolicy is funding or mandating smaller class sizes. But, as the evidence indicates,this is an expensive and generally unproductive policy.
In recognition of the importance of quality teachers, a variety of recommen-dations and policy initiatives have been introduced. Unfortunately, the currentlymost popular proposals in the US are likely to lower teacher quality rather thanimprove it. The idea that has been picked up by US policy makers at all levels is toincrease the requirements to become a teacher. The notion is simple: if we caninsist on better prepared and more able teachers, teacher quality will necessarilyrise, and student performance will respond. This argument – at least as imple-mented – proves as incorrect as it is simple. The range of options being pushedforward include raising the course work requirement for teacher certification,testing teachers on either general or specific knowledge, requiring specific kindsof undergraduate degrees, and requiring master’s degrees. Each of these hassurface plausibility, but little evidence exists to suggest that these are stronglyrelated to teacher quality and to student achievement.
More pernicious, these input requirements almost certainly act to reduce thesupply of teachers. In other words, while the proposed requirements do little ornothing to ensure high quality teachers, they do cut down on the group of peoplewho might enter teaching. Teacher certification requirements are generally ad-vertised as making sure that there is some minimum floor on quality, but, if therequirements end up keeping out high quality teachers who do not want to takethe specific courses required, they instead act more like a ceiling on quality.
A related policy proposal is to raise teacher salaries in order to compensate for anycosts of added preparation or simply to attract a larger group of higher quality
F92 [ F E B R U A R YT H E E C O N O M I C J O U R N A L
� Royal Economic Society 2003

people into teaching. By itself, however, such an undifferentiated pay policy woulddo little to ensure that the quality of teaching would improve, at least for a long time.Current teachers, both good and bad, would be encouraged not to leave teaching,and any specific shortages such as of high quality teachers or of teachers in moretechnical areas would not be relieved unless these salaries could be targeted.
The alternative set of potential policies emphasises performance incentives. Fewemployees of US public schools find that their jobs are at all dependent on theperformance of students. Pay, promotion, retention in a job, and the like appear tobe little different for high quality teachers and low quality teachers. Similarly jobsfor school principals or other administrative and support personnel do not seemclosely related to any student outcomes. A simple idea that pervades economics isthat incentives have powerful effects. In the case of schools few incentives relate tothe object of interest – student performance. Thus, it should not be particularlysurprising if added resources do not translate into better performance, becausethere is little feedback from performance.
Much of the larger debate about school policy actually revolves around proposedchanges in the structure of school incentives. The range of incentive policiescurrently under debate fall into three generic types.33 First, merit pay for teach-ers – such as that recently introduced into British schools – or rewards to entireschools imply moving to a direct pay-for-performance relationship. Second, pri-vatisation or contracting arrangements involve hiring private firms to provide gi-ven academic or nonacademic functions with their rewards based upon outcomes.Finally, expanded choice of schools by students relies on the underlying idea thatschools that do well will attract more students and those that do poorly will losestudents and that this mechanism will provide incentives to improve student per-formance (Friedman, 1962). (Choice actually comes in different forms identifiedchiefly by whether or not private schools can compete with public schools.)
Each of these generic approaches has considerable appeal compared to thecurrent system. Each focuses attention on what is desired, instead of trying to guessat a set of inputs that will lead to the desired result. Contrary to the currentstructure, the general outline of each of the incentive structures makes economicsense.
Designing good incentives, however, is not easy. For example, voucher oppo-nents point to a variety of issues including the prospect of further racial andeconomic segregation in schools; the chance that schools offer undesirablecourses of study; and the possibility that the competition does not have muchimpact on public schools. Similarly, merit pay opponents argue that there is littleresearch supporting positive outcomes (Cohen and Murnane, 1986); that its awardis likely to be too subjective and political; and that individual rewards lead toundesirable competition among teachers.
In most cases, it would be possible to design incentive schemes that circumventthe largest problems, at least if the problems are anticipated. Unfortunately, in-centive contracts can be very complicated, and some of the reactions to the spe-cified incentives might be surprising. For example, an early experiment with
33 An expanded discussion of such incentives can be found in Hanushek et al. (1994).
2003] F93F A I L U R E O F I N P U T - B A S E D S C H O O L I N G P O L I C I E S
� Royal Economic Society 2003

performance contracting (that involved hiring private firms to teach basic subjectsto disadvantaged students and paying the firms based on results) failed to yieldmuch information because of fundamental flaws in the incentive contract(Gramlich and Koshel, 1975).34 In other cases, such as the limited exploration ofthe use of vouchers in Milwaukee, Wisconsin, a single highly constrained schemewas employed and even then considerable controversy over the outcomes con-tinues (Peterson et al., 1996; Greene et al., 1998; Rouse, 1998; Witte, 1999).35
In sum, there is ample evidence that the currently employed input policies arefailures. No one, of course, argues that they wish to pursue the failed policies of thepast. Typically, proponents of input policies either argue they have new ideas that arenot repeating the mistakes of the past policies. However, these new policies, likethose in the past, are seldom based on evidence of superiority. An alternative formused is to say that ‘money spent wisely will yield favourable outcomes,‘ but this istautological.
At the same time the generic incentive approaches, with the exception of certainspecific kinds of merit pay schemes, have not been tried very often, so there is littleexperience with developing good contracts. Moreover, no systematic approach todeveloping information about incentives has been employed. Therefore, the su-periority of using performance incentives instead of relying on just input policiesremains largely untapped.
A significant issue in the discussion of incentives is the slowness with whichevidence accumulates. There is not a strong scientific evaluation tradition withineducation. Further, because education is such a potent political issue, there areconstant pressures to go immediately to new universal policies without worryingtoo much about the evidence supporting them. This has two features. First, manymistakes are made (leading to the results described previously). Second, no newevidence accumulates to aid in making future decisions.
The State of California provides an informative if discouraging case study. In1997, the State provided financial incentives to school districts to reduce class size.This politically popular programme, offered to all districts simultaneously, defiesany evaluation because no baseline performance data are available and because alldistricts received the same treatment. It continues with appropriations of $1.5billion annually with no information about its effectiveness.
If educational policies are to be improved, much more serious attention must begiven to developing solid evidence about what things work and what things do not.Developing such evidence means that regular high quality information aboutstudent outcomes must be generated. In particular, it must be possible to infer thevalue-added of schools. Improvement also would be advanced significantly by theintroduction and general use of random assignment experiments and other
34 The experimental contract did not offer firms a fair chance to make a profit, provided no paymentto the firms if achievement gains were below the national average, and capped the maximum reward.These provisions provided poor incentives and led firms to do a variety of educationally inappropriatethings.
35 Assessment controversies have arisen over the length of time before achievement gains should beexpected, over the appropriate comparison groups, and over the costs of private schooling.
F94 [ F E B R U A R YT H E E C O N O M I C J O U R N A L
� Royal Economic Society 2003

well-defined evaluation methods. Without incentives and without adequate eval-uation, there should be no expectation that schools improve, regardless of theresources added to the current structure.
Stanford University and NBER
References
Akerhielm, K. (1995). ‘Does class size matter?’, Economics of Education Review, vol. 14 (3) (September),pp. 229–41.
Angrist, J.D., and Lavy, V. (1999). ‘Using Maimonides’ rule to estimate the effect of class size onscholastic achievement’, Quarterly Journal of Economics, vol. 114 (2) (May), pp. 533–75.
Armor, D.J., Conry-Oseguera, P., Cox, M., King, N., McDonnell, L., Pascal, A., Pauly, E. and Zellman, G.(1976). Analysis of the School Preferred Reading Program in Selected Los Angeles Minority Schools. SantaMonica, CA: Rand Corp.
Baumol, W.J. (1967). ‘Macroeconomics of unbalanced growth: the anatomy of urban crisis’, AmericanEconomic Review, vol. 57 (3) (June), pp. 415–26.
Behrman, J.R., Kletzer, L.G., McPherson, M.S. and Schapiro, M.O. (1998). ‘The microeconomics ofcollege choice, careers, and wages: measuring the impact of higher education’, Annals of theAmerican Academy of Political and Social Science, vol. 559 (September), pp. 12–23.
Betts, J.R. (1996). ‘Is there a link between school inputs and earnings? Fresh scrutiny of an old litera-ture’, in (G. Burtless, ed.) Does Money Matter? The Effect of School Resources on Student Achievement andAdult Success, pp. 141–191. Washington, DC: Brookings.
Bishop, J. (1989). ‘Is the test score decline responsible for the productivity growth decline?’, AmericanEconomic Review, vol. 79 (1) pp. 178–97.
Bishop, J. (1991). ‘Achievement, test scores, and relative wages’, in (M.H. Kosters, ed.) Workers and Theirwages, pp. 146–86. Washington, DC: The AEI Press.
Bishop, J. (1992). ‘The impact of academic competencies of wages, unemployment, and job perform-ance’, Carnegie-Rochester Conference Series on Public Policy, vol. 37 (December), pp. 127–94.
Blackburn, M.L. and Neumark, D. (1993). ‘Omitted-ability bias and the increase in the return toschooling’, Journal of Labor Economics, vol. 11 (3) (July), pp. 521–44.
Blackburn, M.L., and Neumark, D. (1995). ‘Are OLS estimates of the return to schooling biaseddownward? Another look’, Review of Economics and Statistics, vol. 77 (2) (May), pp. 217–30.
Boissiere, M.X., Knight, J.B., and Sabot, R.H. (1985). ‘Earnings, schooling, ability, and cognitive skills’,American Economic Review, vol. 75 (5), pp. 1016–30.
Boozer, M.A., and Rouse, C. (1995). ‘Intraschool variation in class size: patterns and implications’,NBER Working Paper 5144, June.
Burtless, G. (1996). Does Money Matter? The Effect of School Resources on Student Achievement and AdultSuccess. Washington, DC: Brookings.
Card, D. and Krueger, A.B. (1992a). Does school quality matter? Returns to education and the char-acteristics of public schools in the United States’, Journal of Political Economy, vol. 100 (1) (February),pp. 1–40.
Card, D. and Krueger, A.B. (1992b). ‘School quality and black-white relative earnings: a direct assess-ment’, Quarterly Journal of Economics, vol. 107 (1) (February), pp. 151–200.
Case, A. and Deaton, A. (1999). ‘School inputs and educational outcomes in South Africa’, QuarterlyJournal of Economics, vol. 114 (3) (August), pp. 1047–84.
Cawley, J., Heckman, J.J., Lochner, L. and Vytlacil, E. (2000). ‘Understanding the role of cognitiveability in accounting for the recent rise in the economic return to education’, in (K. Arrow,S. Bowles and S. Durlauf, eds.) Meritocracy and Economic Inequality, pp. 230–65. Princeton,NJ: Princeton University Press.
Chaikind, S., Danielson, L.C. and Brauen, M.L. (1993). ‘What do we know about the costs of specialeducation? A selected review’, Journal of Special Education, vol. 26 (4), pp. 344–70.
Cohen, D.K. and Murnane, R.J. (1986). ‘Merit pay and the evaluation problem: understanding why mostmerit pay plans fail and a few survive’, Harvard Educational Review, vol. 56 (1) (February), pp. 1–17.
Coleman, J.S., Campbell, E.Q., Hobson, C.J., McPartland, J., Mood, A.M., Weinfeld, F.D. and York, R.L.(1966). Equality of Educational Opportunity. Washington, D.C.: U.S. Government Printing Office.
Congressional Budget Office. (1986). Trends in Educational Achievement. Washington, D.C.: Congres-sional Budget Office.
Currie, J. and Thomas, D. (2000). ‘Early test scores, socioeconomic status, school quality, and futureoutcomes’, Department of Economics, UCLA (mimeo) (September).
2003] F95F A I L U R E O F I N P U T - B A S E D S C H O O L I N G P O L I C I E S
� Royal Economic Society 2003

Dugan, D.J. (1976). ‘Scholastic achievement: its determinants and effects in the education industry’, in(J.T. Froomkin, D.T. Jamison and R. Radner, eds.) Education as an Industry, pp. 53–83. Cambridge,MA: Ballinger.
Dustmann, C., Rajah, N. and van Soest, A. (2003). ‘Class size, education and wages’, Economic
Journal, vol. 113, pp. F99–120.Finn, J.D. and Achilles, C.M. (1990). ‘Answers and Questions about class size: a statewide experiment’,
American Educational Research Journal, vol. 27 (3) (Fall), pp. 557–77.Friedman, M. (1962). Capitalism and Freedom, Chicago: University of Chicago Press.Fuller, B. (1985). Raising School Quality in Developing Countries: What Investments Boost Learning?
Washington, DC: The World Bank.Gramlich, E.M. and Koshel, P.P. (1975). Educational Performance Contracting. Washington, D.C.: The
Brookings Institution.Greenberg, D. and McCall, J. (1974). ‘Teacher mobility and allocation’, Journal of Human Resources,
vol. 9(4) (Fall), pp. 480–502.Greene, J.P., Peterson, P.E. and Du, J. (1998). ‘School choice in Milwaukee: a randomized experiment’,
in (P.E. Peterson and B.C. Hassel, eds.) Learning from School Choice, pp. 335–56, Washington, DC:Brookings Institution.
Greenwald, R., Hedges, L.V. and Laine, R.D. (1996). ‘The effect of school resources on studentachievement’, Review of Educational Research, vol. 66 (3) (Fall), pp. 361–96.
Griliches, Z. (1974). ‘Errors in variables and other unobservables’, Econometrica, vol. 42 (6) (November),pp. 971–98.
Grissmer, D.W., Flanagan, A., Kawata, J. and Williamson, S. (2000). Improving Student Achievement: WhatNAEP State Test Scores Tell Us, Santa Monica, CA: Rand Corporation.
Grissmer, D.W., Kirby, S.N., Berends, M. and Williamson, S. (1994). Student Achievement and the ChangingAmerican Family, Santa Monica, CA: Rand Corporation.
Grogger, J.T. and Eide, E. (1993). ‘Changes in college skills and the rise in the college wage premium’,Journal of Human Resources, vol. 30 (2) (Spring), pp. 280–310.
Gundlach, E., Woessmann, L. and Gmelin, J. (2001). ‘The decline of schooling productivity in OECDcountries’, Economic Journal, vol. 111 (May), pp. C135–47.
Hanushek, E.A. (1971). ‘Teacher characteristics and gains in student achievement: Estimation usingmicro data’, American Economic Review, vol. 60 (2) (May), pp. 280–8.
Hanushek, E.A. (1979). ‘Conceptual and empirical issues in the estimation of educational productionfunctions’, Journal of Human Resources, vol. 14 (3) (Summer), pp. 351–88.
Hanushek, E.A. (1986). ‘The economics of schooling: production and efficiency in public schools’,Journal of Economic Literature, vol. 24 (3) (September), pp. 1141–77.
Hanushek, E.A. (1992). ‘The trade-off between child quantity and quality’, Journal of Political Economy,vol. 100 (1) (February), pp. 84–117.
Hanushek, E.A. (1995). ‘Interpreting recent research on schooling in developing countries’, World BankResearch Observer, vol. 10 (2) (August), pp. 227–46.
Hanushek, E.A. (1996). ‘A more complete picture of school resource policies’, Review of EducationalResearch, vol. 66 (3) (Fall), pp. 397–409.
Hanushek, E.A. (1997a). ‘Assessing the effects of school resources on student performance: an update’,Educational Evaluation and Policy Analysis, vol. 19 (2) (Summer), pp. 141–64.
Hanushek, E.A. (1997b). ‘The productivity collapse in schools’, in (W.J. Fowler, Jr., ed.) Developments inSchool Finance, 1996, pp. 185–95, Washington, DC: National Center for Education Statistics.
Hanushek, E.A. (1999a). ‘The evidence on class size’, in (S.E. Mayer and P.E. Peterson, eds.) Earningand Learning: How Schools Matter, pp. 131–68. Washington, DC: Brookings Institution.
Hanushek, E.A. (1999b). ‘Some findings from an independent investigation of the Tennessee STARexperiment and from other investigations of class size effects’, Educational Evaluation and PolicyAnalysis, vol. 21 (2) (Summer), pp. 143–63.
Hanushek, E.A. (2002). ‘Evidence, politics, and the class size debate’, in (L. Mishel and R. Rothstein,eds.) The Class Size Debate, pp. 37–65. Washington, DC: Economic Policy Institute.
Hanushek, E.A., Kain, J.F. and Rivkin, S.G. (2001a). ‘Disruption versus Tiebout improvement: the costsand benefits of switching schools’, WP 8479, National Bureau of Economic Research (September).
Hanushek, E.A., Kain, J.F. and Rivkin, S.G. (2001b). ‘Why public schools lose teachers’, WP 8599,National Bureau of Economic Research (November).
Hanushek, E.A., Kain, J.F. and Rivkin, S.G. (2002). ‘Inferring program effects for specialized popula-tions: does special education raise achievement for students with disabilities?’ Review of Economicsand Statistics, vol. 84 (4) (November), pp. 584–99.
Hanushek, E.A. and Kim, D. (1995). ‘Schooling, labor force quality, and economic growth’, WorkingPaper 5399, National Bureau of Economic Research (December).
Hanushek, E.A. and Kimko, D.D. (2000). ‘Schooling, labor force quality, and the growth of nations’,American Economic Review, vol. 90 (5) (December), pp. 1184–208.
F96 [ F E B R U A R YT H E E C O N O M I C J O U R N A L
� Royal Economic Society 2003

Hanushek, E.A. and Luque, J.A. (2003). ‘Efficiency and equity in schools around the world’, Economics ofEducation Review, vol. 22 (4) (August), forthcoming.
Hanushek, E.A. and others, (1994). Making Schools Work: Improving Performance and Controlling Costs,Washington, DC: Brookings Institution.
Hanushek, E.A. and Pace, R.R. (1995). ‘Who chooses to teach (and why)?’, Economics of Education Review,vol. 14 (2) (June), pp. 101–17.
Hanushek, E.A. and Rivkin, S.G. (1997). ‘Understanding the twentieth-century growth in U.S. schoolspending’, Journal of Human Resources, vol. 32 (1) (Winter), pp. 35–68.
Hanushek, E.A., Rivkin, S.G. and Taylor, L.L. (1996). ‘Aggregation and the estimated effects of schoolresources’, Review of Economics and Statistics, vol. 78 (4) (November), pp. 611–27.
Harbison, R.W. and Hanushek, E.A. (1992). Educational Performance of the Poor: Lessons from RuralNortheast Brazil, New York: Oxford University Press.
Heckman, J.J., Layne-Farrar, A. and Todd, P. (1996a). ‘Does measured school quality really matter?An examination of the earnings-quality relationship’, in (G. Burtless, ed.) Does Money Matter? TheEffect of School Resources on Student Achievement and Adult Success, pp. 192–289. Washington, DC:Brookings.
Heckman, J.J., Layne-Farrar, A. and Todd, P. (1996b). ‘Human capital pricing equations with an ap-plication to estimating the effect of schooling quality on earnings’, Review of Economics and Statistics,vol. 78(4) (November), pp. 562–610.
Heckman, J.J. and Vytlacil, E. (2001). ‘Identifying the role of cognitive ability in explaining the levelof and change in the return to schooling’, Review of Economics and Statistics, vol. 83 (1) (February),pp. 1–12.
Heyneman, S.P. and Loxley, W. (1983). ‘The effect of primary school quality on academic achievementacross twenty-nine high and low income countries’, American Journal of Sociology, vol. 88 (May),pp. 1162–94.
Hoxby, C.M. (2000). ‘The effects of class size on student achievement: new evidence from populationvariation’, Quarterly Journal of Economics, vol. 115 (3) (November), pp. 1239–85.
Krueger, A.B. (1999). ‘Experimental estimates of education production functions’, Quarterly Journal ofEconomics, vol. 114 (2) (May), pp. 497–532.
Krueger, A.B. (2002). ‘Understanding the magnitude and effect of class size on student achievement’, in(L. Mishel and R. Rothstein, eds.) The Class Size Debate, pp. 7–35. Washington, DC: Economic PolicyInstitute.
Krueger, A.B. (2003). ‘Economic considerations and class size’, Economic Journal, vol. 113,pp. F34–63.
Manski, C.F. and Wise, D.A. (1983). College Choice in America, Cambridge: Harvard University Press.Mayer S.E. (1997). What Money Can’t Buy: Family Income and Children’s Life Chances, Cambridge,
MA: Harvard University Press.Mosteller, F. (1995). ‘The Tennessee study of class size in the early school grades’, The Future of Children,
vol. 5 (2) (Summer/Fall), pp. 113–27.Murnane, R.J. (1975). Impact of School Resources on the Learning of Inner City Children, Cambridge, MA:
Ballinger.Murnane, R.J. (1981). ‘Teacher mobility revisited’, Journal of Human Resources, vol. 16 (1) (Winter),
pp. 3–19.Murnane, R.J. and Phillips, B. (1981). ‘What do effective teachers of inner-city children have in com-
mon?’, Social Science Research, vol. 10 (1) (March), pp. 83–100.Murnane, R.J., Willett, J.B., Braatz, M.J. and Duhaldeborde, Y. (2001). ‘Do different dimensions of male
high school students’ skills predict labor market success a decade later? Evidence from the NLSY’,Economics of Education Review, vol. 20 (4) (August), pp. 311–20.
Murnane, R.J., Willett, J.B., Duhaldeborde, Y. and Tyler, J.H. (2000). ‘How important are the cognitiveskills of teenagers in predicting subsequent earnings?’, Journal of Policy Analysis and Management,vol. 19 (4) (Fall), pp. 547–68.
Murnane, R.J., Willett, J.B. and Levy, F. (1995). ‘The growing importance of cognitive skills in wagedetermination’, Review of Economics and Statistics, vol. 77 (2) (May), pp. 251–66.
Neal, D.A. and Johnson, W.R. (1996). ‘The role of pre-market factors in black-white differences’, Journalof Political Economy, vol. 104 (5) (October), pp. 869–95.
O’Neill, J. (1990). ‘The role of human capital in earnings differences between black and white men’,Journal of Economic Perspectives, vol. 4 (4) (Fall), pp. 25–46.
OECD. (2001). Education at a Glance, Paris: OECD.Peterson, P.E., Greene, J.P. and Noyes, C. (1996). ‘School choice in Milwaukee’, Public Interest, vol. 125
(Fall), pp. 38–56.Pierce, B. and Welch, F. (1996). ‘Changes in the structure of wages’, in (E.A. Hanushek and D.W.
Jorgenson, eds.) Improving America’s Schools: The Role of Incentives, pp. 53–73. Washington, DC:National Academy Press.
2003] F97F A I L U R E O F I N P U T - B A S E D S C H O O L I N G P O L I C I E S
� Royal Economic Society 2003

Prais, S.J. (1996). ‘Class-size and learning: the Tennessee experiment – what follows?’, Oxford Review ofEducation, vol. 22 (4) pp. 399–414.
Psacharopoulos, G. (1989). ‘Time trends of the returns to education: cross-national evidence’, Economicsof Education Review, vol. 8 (3), pp. 225–31.
Psacharopoulos, G. (1994). ‘Returns to investment in education: a global update’, World Development,vol. 22, pp. 1325–44.
Rivkin, S.G. (1995). ‘Black/white differences in schooling and employment’, Journal of Human Resources,vol. 30 (4) (Fall), pp. 826–52.
Rivkin, S.G., Hanushek, E.A. and Kain, J.F. (2001). ‘Teachers, schools, and academic achievement’,Working Paper No. 6691, National Bureau of Economic Research (revised).
Rouse, C.E. (1998). ‘Private school vouchers and student achievement: an evaluation of the MilwaukeeParental Choice Program’, Quarterly Journal of Economics, vol. 113 (2), (May), pp. 553–602.
Summers, A.A. and Wolfe, B.L. (1977). ‘Do schools make a difference?’, American Economic Review, vol. 67(4) (September), pp. 639–52.
Todd, P.E. and Wolpin, K.I. (2003). ‘On the specification and estimation of the production function forcognitive achievement’, Economic Journal, vol. 113, pp. F3–33.
U.S. Department of Education. (2002). Digest of Education Statistics, 2001, Washington, DC: NationalCenter for Education Statistics.
Vignoles A., Levacic, R., Walker, J., Machin, S. and Reynolds, D. (2000). ‘The relationship betweenresource allocation and pupil attainment: a review’, DPUQ, Centre for the Economics of Educa-tion, LSE (November).
Wirtz, W. (1977). On Further Examination: Report of the Advisory Panel and the Scholastic Aptitude Test ScoreDecline, NY: College Entrance Examination Board.
Witte, J.F., Jr. (1999). The Market Approach to Education, Princeton, NJ: Princeton University Press.Woessmann, L. (2000). ‘Schooling resources, educational institutions, and student performance: the
international evidence’, Kiel Working Paper No. 983, Kiel Institute of World Economics, Kiel,(December).
Woessmann, L. (2001). ‘Why students in some countries do better’, Education Matters, vol. 1 (2)(Summer), pp. 67–74.
F98 [ F E B R U A R Y 2003]T H E E C O N O M I C J O U R N A L
� Royal Economic Society 2003