chapter 8: project quality management - heng sovannarith · pdf file• define project...
TRANSCRIPT

1
Chapter 8: Project Quality Management

2
Learning Objectives
• Understand the importance of project quality management for information technology products and services
• Define project quality management and understand how quality relates to various aspects of information technology projects
• Describe quality planning and its relationship to project scope management
• Discuss the importance of quality assurance
• List the three outputs of the quality control process
• Understand the tools and techniques for quality control, such as Pareto analysis, statistical sampling, Six Sigma, quality control charts, and testing

3
Learning Objectives • Describe important concepts related to Six Sigma and
how it helps organizations improve quality and reduce costs
• Summarize the contributions of noteworthy quality experts to modern quality management
• Understand how the Malcolm Baldrige Award and ISO 9000 standard promote quality in project management
• Describe how leadership, cost, organizational influences, and maturity models relate to improving quality in information technology projects
• Discuss how software can assist in project quality management

4
Quality of Information Technology Projects
• Many people joke about the poor quality of IT products If GM Cars Were Like Microsoft OS Computers (p. 262) – For No Reason Your Car Would Crash Twice a Day. – The Airbag Would Say “Are You Sure” Before Going Off. – Your Car Won’t Let You In Because Your Key Expired. (This is
my own)
• People seem to accept systems being down occasionally or needing to reboot their PCs
• There are many examples in the news about quality problems related to IT (See What Went Wrong?)
• But quality is very important in many IT projects

5
What is Quality?
• Car Quality
– Ride, Reliability, Fit and Finish, Audio System?
• Food Quality
– Taste, Smell, Color, Texture, Freshness?
• Shoe Quality
– Fit, Stitching, Comfort, Wear?
• Baby Furniture Quality
– Safety, Goo Proof, Durability, Easy to Assemble?

6
What Is Quality?
• The International Organization for Standardization (ISO) defines quality as the totality of characteristics of an entity that bear on its ability to satisfy stated or implied needs
• Other experts define quality based on
– Conformance to requirements: meeting written specifications.
– Fitness for use: ensuring a product can be used as it was intended.

7
Purpose of Project Quality Management
• To Ensure that the Project Will Satisfy the Needs for Which it was Undertaken.
– Scope
– Cost
– Performance
– Meet or Exceed Customer Satisfaction
• The Customer Ultimately Decides if Quality is Acceptable. Period.

8
Project Quality Management Processes
1. Quality planning: identifying which quality standards are relevant to the project and how to satisfy them
2. Quality assurance: evaluating overall project performance to ensure the project will satisfy the relevant quality standards
3. Quality control: monitoring specific project results to ensure that they comply with the relevant quality standards while identifying ways to improve overall quality

9
IS Technology Quality
• Functionality and Features – Function is Does the System Performa As Intended
– Feature is How it Does the Function • Graphic Interface, On-Line Help, ect
• System Outputs – Screens and Reports
• Performance – System Functions as Customer Intends to Use it,
• Reliability and Maintainability – Mean Time Between Essential Function Failure (MTBESF)

10
Quality Planning • It is important to design in quality and
communicate important factors that directly contribute to meeting the customer’s requirements
• Design of experiments helps identify which variables have the most influence on the overall outcome of a process
• Many scope aspects of IT projects affect quality like functionality, features, system outputs, performance, reliability, and maintainability

11
Quality Assurance • Quality assurance includes all the activities
related to satisfying the relevant quality standards for a project
• Another goal of quality assurance is continuous quality improvement
• Benchmarking can be used to generate ideas for quality improvements
• Quality audits help identify lessons learned that can improve performance on current or future projects

12
Quality Assurance Plan

13
Quality Assurance Plan

14
Quality Control
• The main outputs of quality control are – acceptance decisions
– rework
– process adjustments
• Some tools and techniques include – Pareto analysis
– statistical sampling
– Six Sigma
– quality control charts
15
Pareto Analysis
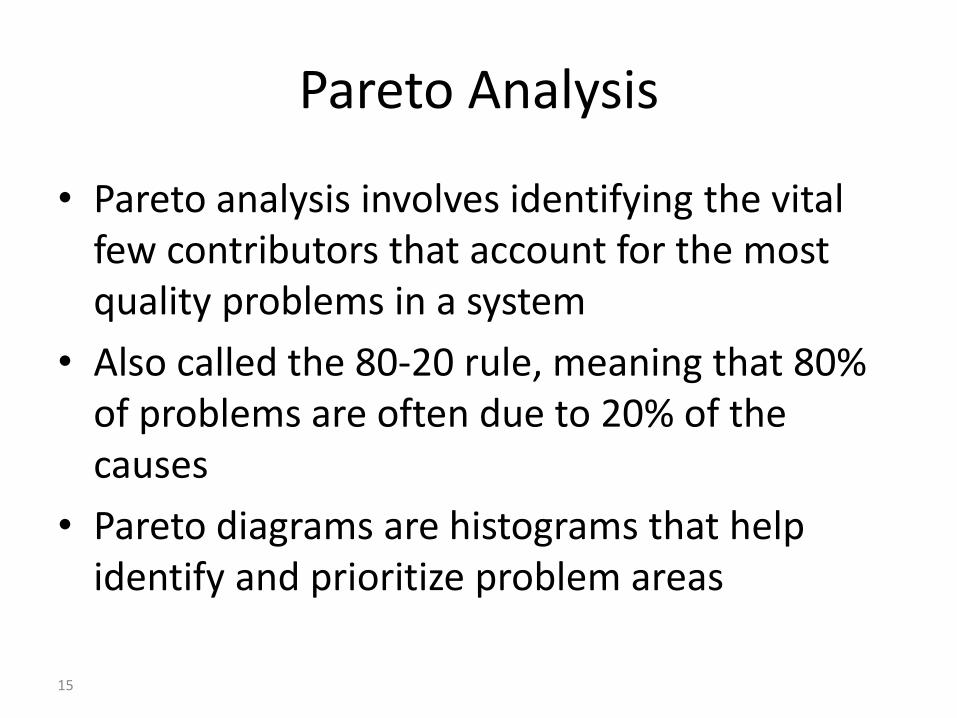
• Pareto analysis involves identifying the vital few contributors that account for the most quality problems in a system
• Also called the 80-20 rule, meaning that 80% of problems are often due to 20% of the causes
• Pareto diagrams are histograms that help identify and prioritize problem areas

16
Figure 8-1. Sample Pareto Diagram Total of all Complaints
80% of Complaints Minor Problem

17
Statistical Sampling and Standard Deviation
• Statistical sampling involves choosing part of a population of interest for inspection
• The size of a sample depends on how representative you want the sample to be
• Sample size formula: Sample size = .25 X (certainty Factor/acceptable error)2

18
Table 8-2. Commonly Used Certainty Factors
Desired Certainty Certainty Factor
95% 1.960
90% 1.645
80% 1.281
95% certainty: Sample size = 0.25 X (1.960/.05) 2 = 384 90% certainty: Sample size = 0.25 X (1.645/.10)2 = 68 80% certainty: Sample size = 0.25 X (1.281/.20)2 = 10
Example: Want 95% Certainty a Sample of EDI Invoices Would Contain no Variation.
Sample Size= .25x (1.960/.05)sq =384

19
Six Sigma Defined • Six Sigma is “a comprehensive and flexible
system for achieving, sustaining and maximizing business success. Six Sigma is uniquely driven by close understanding of customer needs, disciplined use of facts, data, and statistical analysis, and diligent attention to managing, improving, and reinventing business processes.”*
*Pande, Peter S., Robert P. Neuman, and Roland R. Cavanagh, The Six Sigma Way. New York: McGraw-Hill, 2000, p. xi

20
Basic Information on Six Sigma
• The target for perfection is the achievement of no more than 3.4 defects per million opportunities
• The principles can apply to a wide variety of processes
• Six Sigma projects normally follow a five-phase improvement process called DMAIC

21
DMAIC • Define: Define the problem/opportunity, process,
and customer requirements • Measure: Define measures, collect, compile, and
display data • Analyze: Scrutinize process details to find
improvement opportunities • Improve: Generate solutions and ideas for
improving the problem • Control: Track and verify the stability of the
improvements and the predictability of the solution

22
How is Six Sigma Quality Control Unique?
• It requires an organization-wide commitment
• Six Sigma organizations have the ability and willingness to adopt contrary objectives, like reducing errors and getting things done faster
• It is an operating philosophy that is customer-focused and strives to drive out waste, raise levels of quality, and improve financial performance at breakthrough levels

23
Examples of Six Sigma Organizations
• Motorola, Inc. pioneered the adoption of Six Sigma in the 1980s and saved about $14 billion
• Allied Signal/Honeywell saved more than $600 million a year by reducing the costs of reworking defects and improving aircraft engine design processes
• General Electric uses Six Sigma to focus on achieving customer satisfaction

24
Six Sigma and Project Management • Joseph M. Juran stated that “all improvement takes place
project by project, and in no other way”
• It’s important to select projects carefully and apply higher quality where it makes sense
• Six Sigma projects must focus on a quality problem or gap between current and desired performance and not have a clearly understood problem or a predetermined solution
• After selecting Six Sigma projects, the project management concepts, tools, and techniques described in this text come into play, such as creating business cases, project charters, schedules, budgets, etc.

25
Six Sigma and Statistics
• The term sigma means standard deviation
• Standard deviation measures how much variation exists in a distribution of data
• Standard deviation is a key factor in determining the acceptable number of defective units found in a population
• Six Sigma projects strive for no more than 3.4 defects per million opportunities, yet this number is confusing to many statisticians

26
Standard Deviation
• A small standard deviation means that data cluster closely around the middle of a distribution and there is little variability among the data
• A normal distribution is a bell-shaped curve that is symmetrical about the mean or average value of a population

27
Figure 8-2. Normal Distribution and Standard Deviation
ó 1
ó 2
= One Std Deviation From the Mean
Mean=Average

28
Table 8-3. Six Sigma and Defective Units
Specification Range
(in +/- Sigmas)
Percent of
Population
Within Range
Defective Units
Per Billion
1 68.27 317,300,000
2 95.45 45,400,000
3 99.73 2,700,000
4 99.9937 63,000
5 99.999943 57
6 99.9999998 2

29
Table 8-4: Six Sigma Conversion Table
The Six Sigma convention for determining defects is based on the above conversion table. It accounts for a 1.5 sigma shift to account for time and measures defects per million opportunities, not defects per unit.

30
Bottom Line on Six Sigma
• Make the Customer Happy.
– Customer Focused Management
– Customer Focused Project Selection
– Customer Focused Product
– Customer Focused Manufacturing
– Customer Focused Quality
– Customer Focused Opportunity
• When Customer is Happy, We Make Money.
31
Quality Control Charts and the Seven Run Rule
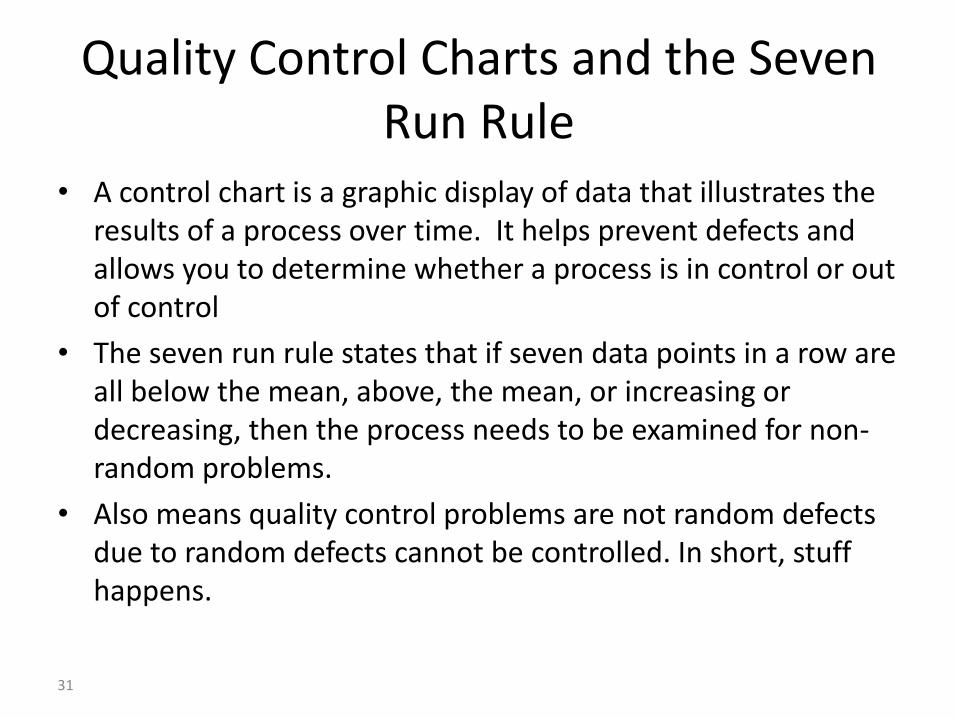
• A control chart is a graphic display of data that illustrates the results of a process over time. It helps prevent defects and allows you to determine whether a process is in control or out of control
• The seven run rule states that if seven data points in a row are all below the mean, above, the mean, or increasing or decreasing, then the process needs to be examined for non-random problems.
• Also means quality control problems are not random defects due to random defects cannot be controlled. In short, stuff happens.

32
Figure 8-3. Sample Quality Control Chart
Producing 12 inch rulers with Quality Control Limits of 12.10 to11.90
7 run rule

33
Testing
• Many IT professionals think of testing as a stage that comes near the end of IT product development
• Testing should be done during almost every phase of the IT product development life cycle

34
Figure 8-4. Testing Tasks in the Software Development Life Cycle
35
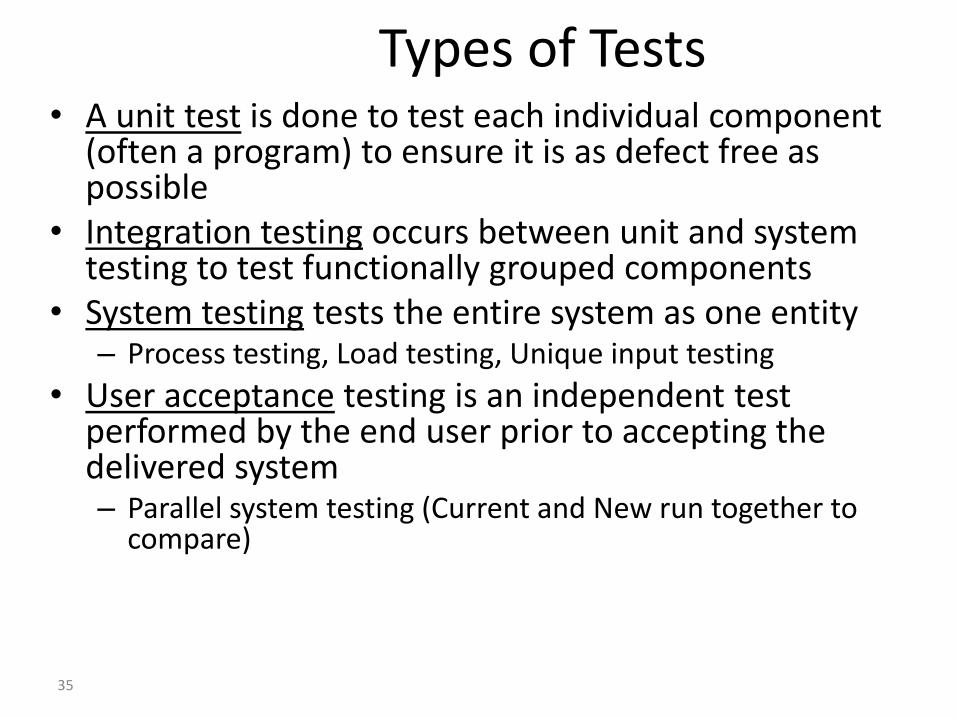
Types of Tests • A unit test is done to test each individual component
(often a program) to ensure it is as defect free as possible
• Integration testing occurs between unit and system testing to test functionally grouped components
• System testing tests the entire system as one entity – Process testing, Load testing, Unique input testing
• User acceptance testing is an independent test performed by the end user prior to accepting the delivered system – Parallel system testing (Current and New run together to
compare)

36
Figure 8-5. Gantt Chart for Building Testing into a Systems Development Project Plan

37
Modern Quality Management
• Modern quality management
– requires customer satisfaction
– prefers prevention to inspection
– recognizes management responsibility for quality
• Noteworthy quality experts include Deming, Juran, Crosby, Ishikawa, Taguchi, and Feigenbaum

38
Quality Experts • Deming was famous for his work in rebuilding Japan car industry
and his 14 points. See pg 284** • Juran wrote the Quality Control Handbook and 10 steps to quality
improvement. • Re-defined quality focused on the customer’s view, fitness for use not
the manufacture’s view, conformance to requirements. • Crosby wrote Quality is Free and suggested that organizations strive
for zero defects • Looked at the total cost of poor quality.
• Ishikawa developed the concept of quality circles and pioneered the use of Fishbone diagrams
• Taguchi developed methods for optimizing the process of engineering experimentation – Quality should be built in not inspected in.
• Feigenbaum developed the concept of total quality control – Quality is responsibility of people who do the work.

39
Figure 8-6. Sample Fishbone or Ishikawa Diagram
Trace Problem Back to the Source
40
Malcolm Baldrige Award and ISO 9000
• The Malcolm Baldrige Quality Award was started in 1987 to recognize companies with world-class quality
• ISO 9000 provides minimum requirements for an organization to meet their quality certification standards

41
Improving Information Technology Project Quality
• Several suggestions for improving quality for IT projects include
– Leadership that promotes quality
– Understanding the cost of quality
– Focusing on organizational influences and workplace factors that affect quality
– Following maturity models to improve quality

42
Leadership
• “It is most important that top management be quality-minded. In the absence of sincere manifestation of interest at the top, little will happen below.” (Juran, 1945)
• A large percentage of quality problems are associated with management, not technical issues

43 IT Project Management, Third Edition
Chapter 8
Common to All Approaches
• Quality is an organizational change not a just a process change.
• Quality is holistic not just a department
• Quality is lead by leadership
• Quality is implemented by workers
• Motivate for quality not just production and profit
• Quality can make a profit
44
The Cost of Quality
• The cost of quality is
– the cost of conformance or delivering products that meet requirements and fitness for use
– the cost of nonconformance or taking responsibility for failures or not meeting quality expectations

45
Table 8-5. Costs Per Hour of Downtime Caused by Software Defects
Business Cost per Hour Downtime
Automated teller machines (medium-sized bank) $14,500
Package shipping service $28,250
Telephone ticket sales $69,000
Catalog sales center $90,000
Airline reservation center (small airline) $89,500

46
Five Cost Categories Related to Quality
1. Prevention cost: the cost of planning and executing a project so it is error-free or within an acceptable error range
Costs less to prevent during development than fix later in the life cycle
2. Appraisal cost: the cost of evaluating processes and their outputs to ensure quality
3. Internal failure cost: cost incurred to correct an identified defect before the customer receives the product
4. External failure cost: cost that relates to all errors not detected and corrected after customer receives the product.
5. Measurement and test equipment costs: capital cost of equipment used to perform prevention and appraisal activities

47
Organization Influences, Workplace Factors, and Quality
• A study by DeMarco and Lister showed that organizational issues had a much greater influence on programmer productivity than the technical environment or programming languages
• Programmer productivity varied by a factor of one to ten across organizations, but only by 21% within the same organization
• The study found no correlation between productivity and programming language, years of experience, or salary
• A dedicated workspace and a quiet work environment were key factors to improving programmer productivity

48
Maturity Models
• Maturity models are frameworks for helping organization improve their processes and systems – Software Quality Function Deployment model focuses
on defining user requirements and planning software projects
– The Software Engineering Institute’s Capability Maturity Model provides a generic path to process improvement for software development
– Several groups are working on project management maturity models, such as PMI’s Organizational Project Management Maturity Model (OPM3)

49
Project Management Maturity Model
1. Ad-Hoc: The project management process is described as disorganized, and occasionally even chaotic. The organization has not defined systems and processes, and project success depends on individual effort. There are chronic cost and schedule problems.
2. Abbreviated: There are some project management processes and systems in place to track cost, schedule, and scope. Project success is largely unpredictable and cost and schedule problems are common.
3. Organized: There are standardized, documented project management processes and systems that are integrated into the rest of the organization. Project success is more predictable, and cost and schedule performance is improved.
4. Managed: Management collects and uses detailed measures of the effectiveness of project management. Project success is more uniform, and cost and schedule performance conforms to plan.
5. Adaptive: Feedback from the project management process and from piloting innovative ideas and technologies enables continuous improvement. Project success is the norm, and cost and schedule performance is continuously improving.

50
Using Software to Assist in Project Quality Management
• Spreadsheet and charting software helps create Pareto diagrams, Fishbone diagrams, etc.
• Statistical software packages help perform statistical analysis
• Specialized software products help manage Six Sigma projects or create quality control charts
• Project management software helps create Gantt charts and other tools to help plan and track work related to quality management