chapter 7 : the standard cost accounting system …spartan.ac.brocku.ca/~pscarbrough/chapters...
TRANSCRIPT

CHAPTER 7
THE STANDARD COST ACCOUNTING SYSTEM PART I: SETTING STANDARDS PAGE 229
s
Chapter 7 : The Standard Cost Accounting System Part I: Chapter 7 : The Standard Cost Accounting System Part I: Chapter 7 : The Standard Cost Accounting System Part I: Chapter 7 : The Standard Cost Accounting System Part I: Setting StandardsSetting StandardsSetting StandardsSetting Standards
LEARNING OBJECTIVES
After studying this chapter, you should be able to:
1. Describe the role of the modern management accountant and the CAS in cost management.
2. Define the components of a standard cost card, and list its benefits for cost management.
3. Calculate the standard price and quantity for direct materials and direct labor, and understand the issues
involved in these calculations.
4. Calculate the standard costs for variable and fixed overhead, and understand the issues involved in set-
ting these standards.
5. Discuss the need for a manufacturing cost equation.
6. Prepare a list of attributes needed in a relational database to capture Standard costing information in an
REA environment.
INTRODUCTION
What does the management accountant do? The management accountant provides a product: information.
Who are the management accountant's customers? People within organizations. Thus, management
accounting is concerned with providing information for organizational members.
In running a business or providing a service, people in different specialties within the enterprise must
make many different types of decisions. In doing so, they use cost accounting system (CAS) information.
The fact that CAS information is used inside the organization has three implications:
1. People inside the company need more detailed and specific information than do people outside the firm
who make investment decisions about the firm as a whole.
2. Because so many different types of decisions are made within a company, cost management reporting
formats have to be more flexible than the somewhat more rigid formats used for financial
accounting.
3. When CAS information is used within the firm, no externally imposed rules and procedures are
required as is the case when financial accounting reports are prepared.
The two preceding chapters presented cost accounting systems that mainly accumulated actual costs,
either by job (JOCAS) or by department (PCAS). When production costs were assigned to jobs or depart-
ments, the actual direct materials and direct labor costs were used with an estimated amount of overhead
(normal costing). The difference between actual and applied overhead (over/under applied ending over-
head account balance) was closed to COGS at year-end. Thus, all actual costs ended up in COGS. Actual
costs are required for financial and tax reporting purposes.
But, if this is all the information a CAS reports, it is not as useful as it could be in budgeting, controlling
operations, and evaluating performance.1 Benchmarks, or standards, are needed to compare against actual

Page 230 COST AND MANAGEMENT ACCOUNTING
costs. This need for more detailed information, which can be reported in various ways (flexibility), was
demonstrated in the discussions of the ICBIS and construction cost estimates in Chapter 5, where job order
cost reports were expanded to include budget, actual, and variance information.
The purpose of the remaining chapters in Parts II and III of this text is to investigate the CAS’s role in
modern cost management. This chapter examines the basis for creating standards. The next chapter shows
how these standards can be used in designing a standard cost accounting system (SCAS) for cost manage-
ment reporting. The following chapters build off this basic cost management framework, addressing more
sophisticated aspects of modern cost management.
THE COST MANAGEMENT ENVIRONMENT AND THE ROLE OF THE MANAGEMENT ACCOUNTANT
LEARNING OBJECTIVE 1
Describe the role of the mod-ern manage-ment accountant and the CAS in cost management.
One of the most difficult transitions the traditional management accountant will have to make is to remem-
ber that management accounting does not just provide information to managers. With the advent of new
types of manufacturing technologies, many workers are required to perform cost management tasks that
have traditionally been thought of as belonging within the roles of managers.
For example, JIT production lines and quality circles (dedicated production cells) require workers who
make the product to also be involved in quality control and testing. When problems occur, workers should
communicate with each other, even when they are in different departments or cells, and coordinate activi-
ties to solve the problems. Workers in these new production environments must now perform two types of
tasks; (1) make the product and (2) control the production process. The latter has traditionally been consid-
ered management's task.
Before accountants can figure out what kind of information workers and managers need, they should
understand the types of decisions made. Some decisions are automatic (e.g., taking a breath versus not
breathing), while others are semi-automatic (e.g., getting up when the alarm clock sounds versus pressing
the “snooze” control for a few more minutes of sleep). Many decisions concerning cost management
require thought, reasoning, and a choice of a specific action.
in making such decisions, the decision makers, whether workers or managers, have two objectives. First,
each person in an organization needs to make good decisions individually. Second, each person needs to
communicate and coordinate actions with others in the organization who might be affected. This second
objective involves “group” decision making.
DECISION MAKING, RATIONALITY, AND GOAL CONGRUENCEDECISION MAKING, RATIONALITY, AND GOAL CONGRUENCEDECISION MAKING, RATIONALITY, AND GOAL CONGRUENCEDECISION MAKING, RATIONALITY, AND GOAL CONGRUENCE
This section will set out some definitions and ideas that will be used throughout the remaining chapters to
help evaluate what management accountants do and why. A decision is a choice of actions between two or
more problem solution alternatives. A problem is simply the difference between what a person wants and
what that person has. It is the difference between goals and reality. In cost management, a problem is called
a cost variance; it is the difference between budgeted costs and actual costs. Technically speaking, a cost
variance is the financial result of a problem.
Cost variance reports are simply reports about the problems of a department or JIT cell. Reporting about
problems is part of the management accountant's role under a management-by-exception control philoso-
phy. Management-by-exception involves focusing attention on one's problems. The basic premise is, “I
don't need control information about what's going right. I don't need to fix those things. Instead, tell me
about my problems. Identify and isolate them for me so that I can correct them and prevent them in the
future.”
Implementing this control philosophy, however, requires a balancing act by the management accountant,
especially in world-class enterprises. Reporting cost variances to the shop floor can result in a short-run
focus on achieving standards, but attention may not be given to improving on those standards. As Chapters
1 and 2 pointed out, kaizen, the philosophy of continuous improvement, is a fundamental characteristic of
world-class enterprises. Instead of focusing only on what is wrong, the WCM shop floor believes nothing
1. Usability is one of the five characteristics of high-quality information discussed in Chapter 1.

CHAPTER 7
THE STANDARD COST ACCOUNTING SYSTEM PART I: SETTING STANDARDS PAGE 231
is right and everything can be improved. The implication for the modern management accountant is that
reports (at least annually) measuring the improvement in standards over time are just as important as
short-run reporting about cost variances. The long-run focus is especially necessary in planning and group
decision-making (activities. The short-run focus on achieving current standards is important in both opera-
tional control and performance evaluation.2
Not all decisions are “good” decisions. Simply stated, a good decision is a “rational” decision. Rational
decisions are goal-directed decisions. Thus, good (rational) decisions are actions (choices) that lead to
accomplishing goals. Goals differ from objectives. Objectives are long-range statements of what is
wanted; goals are short-run targets that if accomplished will lead to the realization of an objective. Goals
are for a specified time period, and goal-related performance can be measured. Reporting this information
is one of the management accountant's tasks.
For example, an accounting major may have the objective of becoming a certified management accountant
(a CMA). One goal is passing the CMA exam. Successfully finishing this course, as it is part of the educa-
tional base needed to become a CMA, is rational, because it leads to realizing this goal. But rational deci-
sion making is not an end in itself. Consider the example on the next page.
In the Johnson Foundry example, it's rational to cancel the maintenance because this will lead to the goal
of remaining within budget. However, cancelling maintenance is not in the best interests of the company
in the long run.
This is an example of what is called a “myopic focus” on short-run profits. Overemphasis on short-run
profits (like minimizing cost variances) is not always in the best interests of the organization. Instead, the
firm wants workers and foremen to make goal-congruent decisions and take actions that lead to its goals.
Choices that lead to an individual's goals, but not to the organization's goals, are called suboptimal or dys-
functional. This issue, first discussed in Chapter 1, is probably the key problem faced by the management
accountant in designing an SCAS for cost management.
The role of the management accountant in this case is to provide enough flexibility and detail in perfor-
mance reports so that suboptimal behavior does not occur. For example, a Johnson Foundry report for
Mike Himes’s department showing a budget of $100,000 and actual expenditures of $100,000, with no
cost variance, would not be professionally ethical. The cost variance report should show a $5,000 “unfa-
vorable” variance for labor usage (assume that was the real problem) and a $5,000 “favorable” variance
for maintenance. Thus, both problems, if they occurred, would be reported.
Good decisions are rational decisions, but because each manager is a member of a larger organization,
rationality must be tempered with goal congruence and ethics throughout all of the managers' and workers'
decision-making functions. These include planning (for the future), monitoring and controlling (the pres-
ent), and evaluating (past performance). The role of the management accountant, then, is to provide infor-
mation that helps people in an organization (individually and as team members) to plan, control, and
evaluate their areas of responsibility better.
THE STANDARD COST ACCOUNTING SYSTEM'S ROLE IN THE STANDARD COST ACCOUNTING SYSTEM'S ROLE IN THE STANDARD COST ACCOUNTING SYSTEM'S ROLE IN THE STANDARD COST ACCOUNTING SYSTEM'S ROLE IN RESPONSIBILITY ACCOUNTINGRESPONSIBILITY ACCOUNTINGRESPONSIBILITY ACCOUNTINGRESPONSIBILITY ACCOUNTING
Responsibility accounting has two aspects: functional and behavioral. From the functional perspective,
responsibility accounting is concerned with measuring how well organizational members are achieving
the organization's goals. From the behavioral perspective, responsibility accounting systems are a subset
of the organizational control system. The control system's role is to provide the rewards that will motivate
individuals to make goal-congruent decisions.
THE FUNCTIONAL SIDE OF RESPONSIBILITY ACCOUNTING. As explained earlier, people
within organizations share two common decision-making objectives (individual and group), and they all
have three decision-making functions (planning, control, and evaluation). The specific types of
decisions they make, though, depend on their responsibilities. By looking at the management hierarchy,
three basic responsibility levels can be identified:
• Cost centers. Cost center employees are responsible for planning, controlling, and evaluating activities
that create costs. A factory foreman, or a JIT cell's work team, are good examples. Mike Himes is respon-
sible for budgeting, controlling, and evaluating the costs of his department. His responsibilities are to hit a
2. This topic will be discussed further in the “Revising Standards” section later in this chapter. Cost variance reports are dis-
cussed in Chapter 8. Other types of reports for long-run total quality management are discussed in Chapter 12.
Page 232 COST AND MANAGEMENT ACCOUNTING
production quota,3 produce quality output, and do this within budgeted costs (minimize cost variances).4
He does not have any responsibilities for sales and marketing decisions, though. Thus, this responsibility
level is not concerned with revenue (and profit) creation, but only with cost management.
• Profit centers. Profit center managers are one step above cost center managers in the firm's hierarchy.
These managers have an added level of responsibility. In addition to controlling costs, they also are respon-
sible for generating revenues. A product line manager is a good example. At this level, obtaining budgeted
revenues, while containing costs within budget, leads to the achievement of target profits.
• Investment centers. Investment center managers can be considered the top management in a firm. The
new responsibility added at this level is over investment decisions. At this level, responsibilities include
obtaining budgeted profits, capital budgeting, and financing asset acquisitions.5
Since all three levels must ultimately be concerned with cost management, the SCAS has a multiple report-
ing obligation. In other words, there are multiple users, with different information needs. How cost vari-
ance reports can be designed to serve these different needs will be illustrated in the next chapter. All levels
need to be involved in the setting of standards, though. This process has many behavioral implications that
require the involvement of all workers and all levels of management, from the shop floor worker to the
CEO.
BEHAVIORAL DIMENSIONS TO RESPONSIBILITY ACCOUNTING. If the responsibility
accounting system is to function properly in its motivational role, it must be accepted by the people being
evaluated. This means that employees must internalize the company's goals as their own. Proper motiva-
tion requires a reward system that employees believe will allow them to satisfy their individual needs if
they make decisions in the best interests of the firm (goal congruent behavior). To distribute these rewards,
firms need to evaluate performance. This need, in turn, creates five criteria for the responsibility account-
ing system:
• The planning criterion: participative budgeting. First, it must communicate the organization's objectives
and goals to the employees, allowing them to participate in setting their own goals consistent with the
company's.
• The operational control criterion: decision usefulness. Second, it should provide timely, relevant infor-
mation so that managers can make the best individual and group decisions possible on a day-to-day
basis. In other words, it should be a high-quality information system.
• The short-run performance evaluation criterion: management-by-exception. Third, it should evaluate
performance by comparing planned outcomes against actual results.
• The long-run performance evaluation criterion: continuous improvement. Fourth, it should evaluate
long-run improvement in standards over time.
• The overall performance evaluation criterion: controllability. Fifth, it should distinguish (for proper per-
formance evaluation) those activities over which a worker, manager, or JIT cell team has been given con-
trol.
The organization designs control systems by recognizing the following linkages:
• Control requires that people in the organization be properly motivated to take actions that will lead to the
firm's goals.
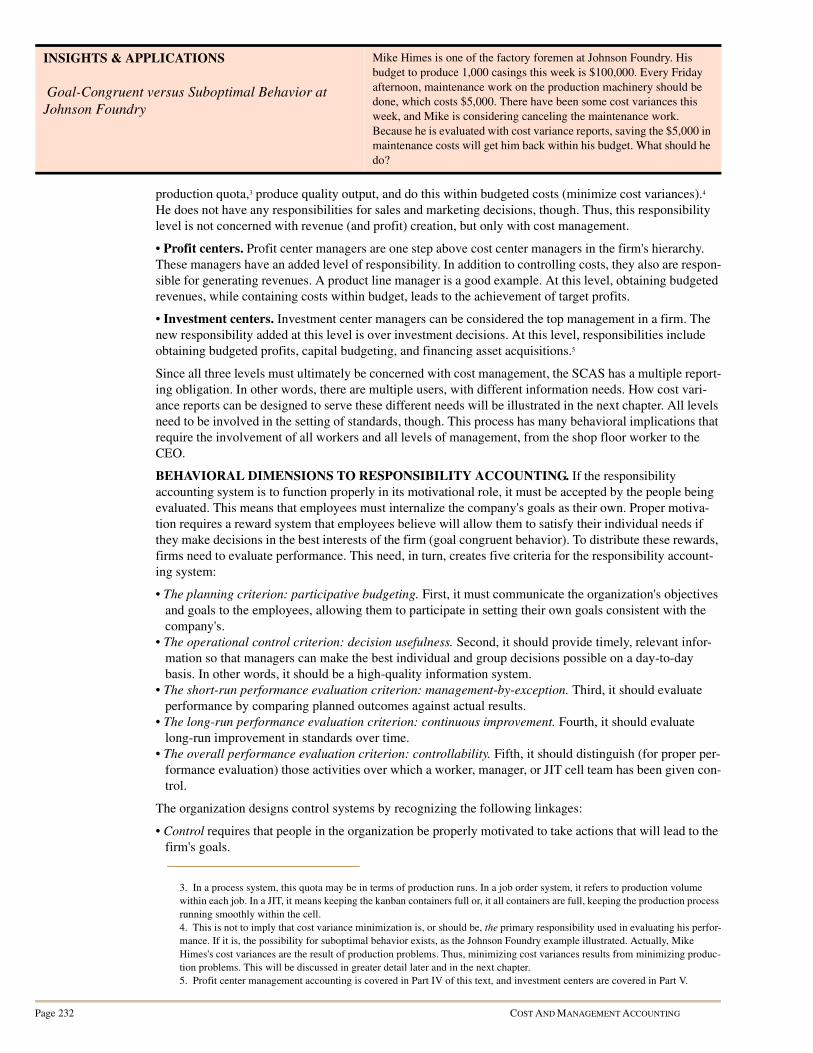
INSIGHTS & APPLICATIONS
Goal-Congruent versus Suboptimal Behavior at
Johnson Foundry
Mike Himes is one of the factory foremen at Johnson Foundry. His
budget to produce 1,000 casings this week is $100,000. Every Friday
afternoon, maintenance work on the production machinery should be
done, which costs $5,000. There have been some cost variances this
week, and Mike is considering canceling the maintenance work.
Because he is evaluated with cost variance reports, saving the $5,000 in
maintenance costs will get him back within his budget. What should he
do?
3. In a process system, this quota may be in terms of production runs. In a job order system, it refers to production volume
within each job. In a JIT, it means keeping the kanban containers full or, it all containers are full, keeping the production process
running smoothly within the cell.
4. This is not to imply that cost variance minimization is, or should be, the primary responsibility used in evaluating his perfor-
mance. If it is, the possibility for suboptimal behavior exists, as the Johnson Foundry example illustrated. Actually, Mike
Himes's cost variances are the result of production problems. Thus, minimizing cost variances results from minimizing produc-
tion problems. This will be discussed in greater detail later and in the next chapter.
5. Profit center management accounting is covered in Part IV of this text, and investment centers are covered in Part V.

CHAPTER 7
THE STANDARD COST ACCOUNTING SYSTEM PART I: SETTING STANDARDS PAGE 233
• Motivation requires knowing what organizational members want and providing a reward system to give
it to them.
• The reward system requires an evaluation system.
• The evaluation system requires organizational goals to use as benchmarks in measuring performance.
• Performance measurement requires the assignment of responsibilities.
• Responsibility requires controllability over the factors measured and evaluated.
• Controllability requires the ability to influence both the standards that represent the goals to be accom-
plished and actual events (decisions) related to those goals.
What is the role of the responsibility accounting system within the firm's control system? It is only one
part of the overall control system. The motivation to control operations comes from employees knowing
that they will receive acceptable rewards for making goal-congruent decisions. This is the role of the
reward system. To successfully motivate employees to accept the organization's goals as their own, the
budgeting process must communicate the firm's goals and allow the employees to participate in setting the
standards used in their performance evaluations. The accounting system must also evaluate performance
in a way that is acceptable to the people being evaluated. Performance should be evaluated against the
standards set, and employees should only be evaluated on the activities they control. The motivation to
control operations comes from employees accepting the legitimacy of the planning and evaluation compo-
nents of the responsibility accounting system, which they perceive as being linked to an adequate reward
system.
ETHICAL CONSIDERATIONS WITHIN THE MANAGEMENT ACCOUNTANT'S ETHICAL CONSIDERATIONS WITHIN THE MANAGEMENT ACCOUNTANT'S ETHICAL CONSIDERATIONS WITHIN THE MANAGEMENT ACCOUNTANT'S ETHICAL CONSIDERATIONS WITHIN THE MANAGEMENT ACCOUNTANT'S ROLE IN CONTROLROLE IN CONTROLROLE IN CONTROLROLE IN CONTROL
Ethics concern right and wrong behavior. Because management accountants are professionals, they should
practice a code of ethics. The Institute of Management Accountants (IMA) has published “Standards of
Ethical Conduct for Management Accountants” (SMA #1C, 1983).6 Management accountants are also
members of an organization, the company employing them. Thus, they also have an ethical responsibility
to it. According to the IMA, ethical behavior is evidenced in four areas: competence, objectivity, confi-
dentiality, and integrity.
If management accountants are competent, they will design responsibility accounting systems that are
based on participative budgeting, distinguish between controllable and uncontrollable costs, and report
variances in an understandable and useful way. Objectivity requires disclosing the information needed by
employees to make goal-congruent decisions (completeness and fairness). Because this is confidential
financial information, the management accountant also has the ethical responsibility to maintain that con-
fidentiality. Information should not be used for personal gain at the expense of the firm. Integrity means
avoiding actual or apparent conflicts of interest professionally or as a member of the company. Controlla-
bility of standards and variances are important considerations when designing the SCAS.
STANDARDS AND THE STANDARD COST CARD
LEARNING OBJECTIVE 2
Define the compo-nents of a standard cost card, and the list its benefits for cost management.
A standard cost is the budgeted cost of a particular input item (cost element) used in making one unit of a
product. For example, how much should be spent on chocolate used in a one-pound box of chocolate can-
dies? Obviously, this depends on the price of chocolate and the quantity of chocolate needed.
Each cost element has its own standard cost. The standard costs for a particular product are summarized
on a standard cost card, such as the one displayed in Exhibit 7-1.
THE COMPONENTS OF A STANDARD COSTTHE COMPONENTS OF A STANDARD COSTTHE COMPONENTS OF A STANDARD COSTTHE COMPONENTS OF A STANDARD COST
A standard price is the amount of money budgeted for one unit of an input item. In Exhibit 7-1, for
example, the standard price of raw (bulk) chocolate is projected at $1.50 per pound.
A standard quantity is the budgeted amount of an input item needed to make one unit of output. In
Exhibit 7-1, SweetTooth budgets one and one-third pounds of raw chocolate as the amount that should be
needed to produce a one-pound box of chocolates.
6. Refer back to Chapter 1 for the detailed discussion of ethical behavior.
Page 234 COST AND MANAGEMENT ACCOUNTING
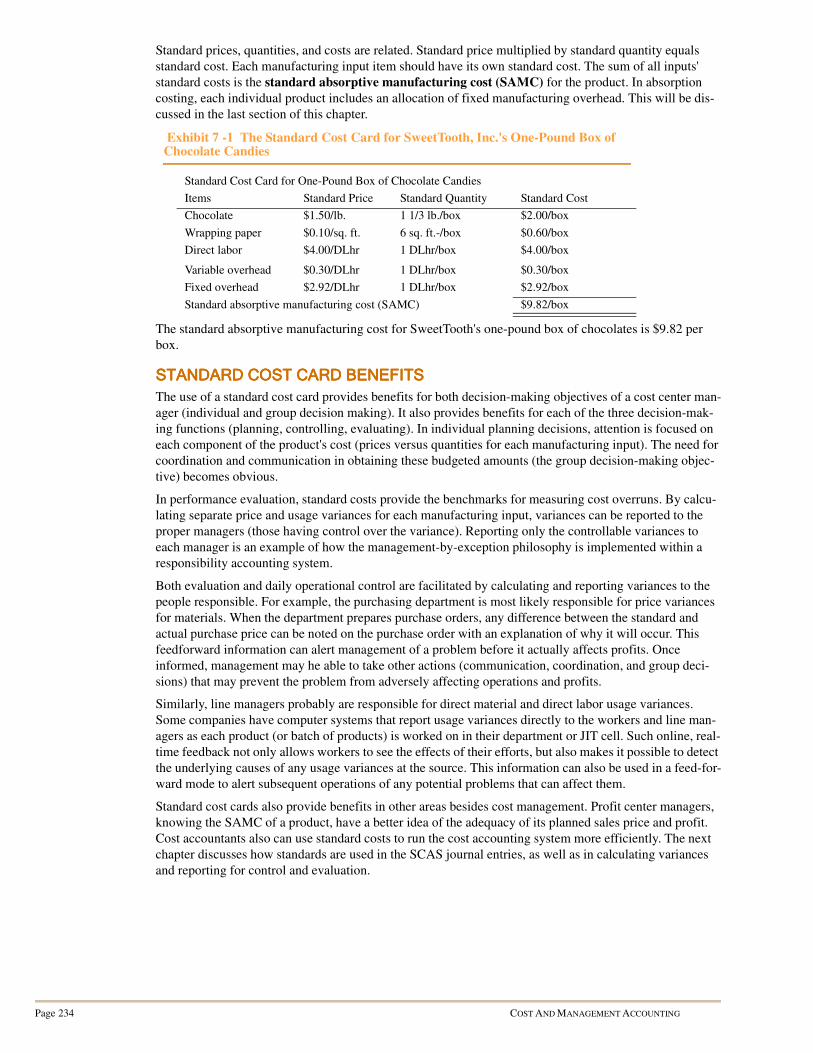
Standard prices, quantities, and costs are related. Standard price multiplied by standard quantity equals
standard cost. Each manufacturing input item should have its own standard cost. The sum of all inputs'
standard costs is the standard absorptive manufacturing cost (SAMC) for the product. In absorption
costing, each individual product includes an allocation of fixed manufacturing overhead. This will be dis-
cussed in the last section of this chapter.
The standard absorptive manufacturing cost for SweetTooth's one-pound box of chocolates is $9.82 per
box.
STANDARD COST CARD STANDARD COST CARD STANDARD COST CARD STANDARD COST CARD BENEFITSBENEFITSBENEFITSBENEFITS
The use of a standard cost card provides benefits for both decision-making objectives of a cost center man-
ager (individual and group decision making). It also provides benefits for each of the three decision-mak-
ing functions (planning, controlling, evaluating). In individual planning decisions, attention is focused on
each component of the product's cost (prices versus quantities for each manufacturing input). The need for
coordination and communication in obtaining these budgeted amounts (the group decision-making objec-
tive) becomes obvious.
In performance evaluation, standard costs provide the benchmarks for measuring cost overruns. By calcu-
lating separate price and usage variances for each manufacturing input, variances can be reported to the
proper managers (those having control over the variance). Reporting only the controllable variances to
each manager is an example of how the management-by-exception philosophy is implemented within a
responsibility accounting system.
Both evaluation and daily operational control are facilitated by calculating and reporting variances to the
people responsible. For example, the purchasing department is most likely responsible for price variances
for materials. When the department prepares purchase orders, any difference between the standard and
actual purchase price can be noted on the purchase order with an explanation of why it will occur. This
feedforward information can alert management of a problem before it actually affects profits. Once
informed, management may he able to take other actions (communication, coordination, and group deci-
sions) that may prevent the problem from adversely affecting operations and profits.
Similarly, line managers probably are responsible for direct material and direct labor usage variances.
Some companies have computer systems that report usage variances directly to the workers and line man-
agers as each product (or batch of products) is worked on in their department or JIT cell. Such online, real-
time feedback not only allows workers to see the effects of their efforts, but also makes it possible to detect
the underlying causes of any usage variances at the source. This information can also be used in a feed-for-
ward mode to alert subsequent operations of any potential problems that can affect them.
Standard cost cards also provide benefits in other areas besides cost management. Profit center managers,
knowing the SAMC of a product, have a better idea of the adequacy of its planned sales price and profit.
Cost accountants also can use standard costs to run the cost accounting system more efficiently. The next
chapter discusses how standards are used in the SCAS journal entries, as well as in calculating variances
and reporting for control and evaluation.
Exhibit 7 -1 The Standard Cost Card for SweetTooth, Inc.'s One-Pound Box of Chocolate Candies
Standard Cost Card for One-Pound Box of Chocolate Candies
Items Standard Price Standard Quantity Standard Cost
Chocolate $1.50/lb. 1 1/3 lb./box $2.00/box
Wrapping paper $0.10/sq. ft. 6 sq. ft.-/box $0.60/box
Direct labor
Variable overhead
$4.00/DLhr
$0.30/DLhr
1 DLhr/box
1 DLhr/box
$4.00/box
$0.30/box
Fixed overhead $2.92/DLhr 1 DLhr/box $2.92/box
Standard absorptive manufacturing cost (SAMC) $9.82/box

CHAPTER 7
THE STANDARD COST ACCOUNTING SYSTEM PART I: SETTING STANDARDS PAGE 235
SETTING DIRECT MATERIALS AND DIRECT LABOR STANDARDS
LEARNING OBJECTIVE 3
Calculate the stan-dard price and quantity for direct materials and direct labor, and under-stand the issues involved in these calculations.
Before standards can be used, they have to be created. The first question the management accountant
should ask is, “Which costs do we want to include within the direct materials and labor standards?” How a
firm budgets for particular costs will determine the general ledger accounts that will have to be debited
and credited when these costs are incurred. Thus, it will affect how certain costs are reported and con-
trolled.
BUDGETING THE STANDARD PRICE OF DIRECT MATERIALSBUDGETING THE STANDARD PRICE OF DIRECT MATERIALSBUDGETING THE STANDARD PRICE OF DIRECT MATERIALSBUDGETING THE STANDARD PRICE OF DIRECT MATERIALS
The direct material standard price is its budgeted net delivered purchase price. For example, the standard
price of raw chocolate for SweetTooth's one-pound box of chocolates is $1.50 per pound. This is calcu-
lated as follows:
Standard prices can be stable or unstable, and easy or hard to budget, depending on the supply environ-
ment of the enterprise. For example, seafood prices for a restaurant located on the wharf at San Francisco
can vary daily. In contrast, a fast-food restaurant franchisee may have a long-term contract with its fran-
chisor and very stable prices to use as standards. Characteristically, WCMs using JITs negotiate long-term
supply contracts with vendors, possibly administered through an EDI system.
As prices change, it is important to adjust standards and sales prices if possible. To illustrate, the budgeted
price for a lobster dinner charged to customers at the San Francisco Bay Inn is $25, based on a standard
price of $5 per lobster at the wharf. If the actual wholesale price increases to $7, the restaurant will want to
adjust the price of the meal to $27.
Standard direct material prices can be important in service enterprises as well as in merchandising and
manufacturing firms. For example, to justify a request for increased funding, a welfare agency may want
to identify the standard direct materials and labor needed for each case. These direct materials may include
multiple file folders, special forms, photocopies, and the like. Direct labor can include special travel time
to a client's home and meetings with other agencies to coordinate day-care services or special education
and training courses. A children's dentist may budget rubber gloves, bite-wing X-rays, and lollipops in the
cost of each patient.
BUDGETING THE STANDARD PRICE OF DIRECT LABORBUDGETING THE STANDARD PRICE OF DIRECT LABORBUDGETING THE STANDARD PRICE OF DIRECT LABORBUDGETING THE STANDARD PRICE OF DIRECT LABOR
The price of labor includes more than just the gross wage rate paid to workers. To employ workers, com-
panies must incur payroll and fringe benefits costs. Because the costs can be directly traced to, and are
directly caused by, individual workers, payroll burden and fringe benefits should be included in the stan-
dard price. This is consistent with the accounting for labor costs in any CAS. In journal entry 2, the total
(gross) wages are charged to the gross wages clearing account in the general ledger. Journal entry 3 adds
the employer's payroll taxes and fringe benefits into the gross wages account. Thus, when direct labor is
assigned to product costs (via jobs or departments), it includes both labor-related costs.
Because cost elements should be budgeted and accounted for in the same way, the direct labor standard
price for SweetTooth's one-pound box of chocolates is calculated as follows:
Labor rates, payroll taxes, and fringe benefits costs are fairly stable in most enterprises. In union shop
manufacturers, multi-year union contracts provide specific wage rates and certain fringe benefits costs for
up to three years. In WCMs and JITs, many enterprises have long-term employment agreements, bonuses,
and profit-sharing plans. In service firms, such as a CPA firm, the annual salaries of various accountants
Gross purchase price $1.37/lb.
Less purchase discount of 5% <0.07>
Net purchase price $1.30/lb.
Add freight-in 0.20/lb.
Standard price for chocolate $ 1.5/ 1b.
Budgeted gross wage rate $3.00/DLhr
Add payroll taxes and fringe benefits(10% and 23%, respectively) 1.00/DLhr
Standard price for direct labor $4.00/DLhr

Page 236 COST AND MANAGEMENT ACCOUNTING
arc broken down into an hourly rate, with time cards (or logs) used to trace hours worked directly on each
client engagement. The hourly rates plus burden costs determine in part the billing rates charged to clients
by CPA firms, legal firms, engineering firms, and the like. In non-profit service agencies, such as a grant
administration office of a state government, standard direct labor prices can be used to calculate how much
the state can bill the grant program for administration costs.
BUDGETING DIRECT MATERIALS STANDARD QUANTITIESBUDGETING DIRECT MATERIALS STANDARD QUANTITIESBUDGETING DIRECT MATERIALS STANDARD QUANTITIESBUDGETING DIRECT MATERIALS STANDARD QUANTITIES
Production processes (both the equipment and the people) are seldom perfect. This means that not all of
the materials or labor input into production will find its way into the product. The amount of a particular
input that is lost during production is called scrap. There are two kinds of scrap: anticipated (normal) and
excess (abnormal). Notice in Exhibit 7-1 that SweetTooth budgeted for one and one-third pounds of raw
chocolate to be input into a one-pound box of chocolates. This was because 25 percent of the raw choco-
late put into the process is lost during production (25 percent of 1 1/3 pounds is 1/3 pound, so the result is
exactly one pound of completed output--a finished one--pound box of chocolates).
The standard quantity is not the amount of an input required to be in the product when it is complete and
ready to sell. This amount is called an output specification (also called an engineering or marketing
specification). An output specification is the amount of an input that must be in the completed product for
it to be salable. In contrast, a standard quantity is the amount of that input that must be placed into the pro-
duction process at the beginning, so that salable output can result.
To budget standard quantities properly, the output specification and normal scrap rate (more generally, the
normal input loss percentage) must be known. The following formula is used to calculate standard quan-
tity:
Standard quantity = Output specification / (I Normal scrap percentage)
= 1 lb. per box / (1 - 25%)
= 1 lb. per box / (1 -.25)
= 11/3 lb. per box
Many people when budgeting standard quantities mistakenly focus on the product (the output) rather than
on the input item. Continuing the SweetTooth example, the error that results goes like this:
1. One pound of chocolate is needed in the final product.
2. Since normal input loss equals 25 percent, this means 25 percent of one pound (the output specification)
or one-fourth pound will be lost.
3. Therefore, one and one-fourth pounds (the standard quantity) of raw chocolate should be purchased per
box of chocolates.
To demonstrate this error to the managers and workers responsible for budgeting these costs, the manage-
ment accountant might want to present the following simple “proof”:
Amount to input (standard quantity) 1.25 lb.
Less normal input loss @ 25% <.31> lb.
Amount in finished product (output specification) 0.94 lb.
Not enough chocolate is in the box! The problem is that the 25 percent that is lost is lost from the input, not
from the output. Or, to put it differently, the output is three-fourths of the amount input into the production
process at the beginning. If managers have trouble with this, the management accountant might draw them
a simple picture like this:
BUDGETING DIRECT LABOR STANDARD QUANTITIESBUDGETING DIRECT LABOR STANDARD QUANTITIESBUDGETING DIRECT LABOR STANDARD QUANTITIESBUDGETING DIRECT LABOR STANDARD QUANTITIES
Normal input loss also exists for labor. This can be thought of as “downtime.” Notice that the standard
quantity for direct labor in Exhibit 7-1 was one hour per box of chocolates. However, only 48 minutes of
direct labor time is needed to make a box. The 48 minutes can be labelled “productive time.” On average,
12 minutes per hour are needed for activities other than directly working on the product. Thus, SweetTooth
needs to input 60 minutes of “paid” labor time to make a box of chocolates. The 12 minutes per hour
downtime is a 20 percent loss of this input. It is calculated as follows:
Downtime per day:
The 96 minutes per day is 20 percent of an eight hour day. As a result, 20 percent of paid direct labor time
(on average) is not available for producing chocolates. The 48 minutes of direct productive time needed to
make a box is an output specification. Given a 20 percent normal input loss ratio:

CHAPTER 7
THE STANDARD COST ACCOUNTING SYSTEM PART I: SETTING STANDARDS PAGE 237
Standard quantity = Output specification / (1 - Normal input loss percentage)
=48 minutes per box / (1 - 20%)
= 60 minutes per box
In other words, the standard labor quantity is the amount of time that should be purchased and input into
the production process so that enough productive time is available to make one box of chocolates. Relat-
ing the direct labor standard quantity to paid time produces the following equation:
Paid time = Downtime + Productive time 60 minutes per box
= 12 minutes + 48 minutes
The standard quantity calculation for direct labor can be shown in the same manner used to illustrate direct
materials. Both are presented in Exhibit 7-2.
THEORETICAL VERSUS PRACTICAL STANDARDSTHEORETICAL VERSUS PRACTICAL STANDARDSTHEORETICAL VERSUS PRACTICAL STANDARDSTHEORETICAL VERSUS PRACTICAL STANDARDS
The degree of difficulty in achieving a standard is known as tightness. The more difficult a standard is to
attain, the tighter it is said to be. Tight standards can promote positive behavior if they motivate employees
to strive for excellence through continuous improvement. Alternatively, they can cause dysfunctional
behavior if they are too difficult or impossible to achieve. Standards that are too loose, however, may not
motivate employees to perform at their best because such standards can be achieved too easily. Moreover,
such standards do not support continuous improvement.
Implicit in the setting of standard quantities is the concept of an acceptable level of performance corre-
sponding to management's goals. That is, does management want to maintain the status quo or build a
world-class enterprise? Because standards are goals that are used to judge actual performance, a key ques-
tion is, “Just how demanding should standards be?” Should they assume theoretical perfection, or should
they assume various factors that prevent perfect performance, at least in the short run?
THEORETICAL STANDARDS. Theoretical standards (often called ideal standards) are based on the
best performance possible under existing operating conditions and with existing equipment. Such stan-
dards assume an ideal situation in which both people and equipment work at peak efficiency 100 percent
of the time and in which it is possible to produce with no waste. The standards may include allowances for
rest periods and personal needs of employees but usually do not include any allowances for scrap, lost
time, or any nonvalue-added activities. An ideal standard quantity for raw chocolate would not include the
• Two 15 minute breaks 30 minutes/day
• Setup time in morning 25 minutes/day
• Cleanup time at night 20 minutes/day
• Miscellaneous downtime 21 minutes/day
Total downtime per day 96 minutes/day
Exhibit 7 -2 Standard Quantities and Normal Input Loss

Page 238 COST AND MANAGEMENT ACCOUNTING
one-third pound normally lost in production (normal scrap) that was included in SweetTooth's box of choc-
olates. An ideal standard quantity for direct labor would not include setup and cleanup time and may or
may not include bathroom time.
The standards are set as goals toward which employees work for continuous improvement, a concept of
world-class manufacturing. Variances from theoretical standards will probably always be unfavorable, but
continuous improvement will result in these variances becoming smaller over time.
PRACTICAL STANDARDS. Practical standards (also called currently attainable standards) are
tight but achievable standards. They do not tolerate abnormal scrap and downtime, although they allow for
normal machine down-time, employee rest periods, and currently necessary, but nonvalue-added activities.
They are closely akin to theoretical standards in that they are future oriented and are used as a basis for
continuous improvement. Unlike theoretical standards, practical standards can be achieved and even sur-
passed on occasion when operations are being performed at high levels of efficiency. They are within the
achievable range of most employees, yet difficult enough that when they are attained employees feel as
though something of value has been accomplished. The standard quantities budgeted for SweetTooth's box
of chocolates are practical standards.
Employees are motivated by practical standards, especially if they've had input into their development, and
will normally put forth their best efforts to achieve them. Moreover, practical standards can serve several
purposes. In addition to indicating abnormal variances in costs, they can also be used in estimating and
planning, whereas theoretical standards do not allow for normal inefficiencies and therefore may result in
unrealistic budgeting data.
Variances from practical standards are very useful to management because they provide information about
how well operations are improving. Generally, such standards have also been considered to be more useful
than theoretical standards in determining how effectively and efficiently present operations are being car-
ried out.
Some authorities, however, believe practical standards demand too little because such standards may be
based more on the past than the future. Certain inefficiencies may be built into the standards. Therefore,
some managers believe theoretical standards are more useful for continuous improvement because of their
future orientation.
Such managers do not want to include costs for idle capacity, setup times, material movement, inspection,
and other nonvalue-added activities in an SCAS. When nonvalue-added activities are built into the stan-
dard quantities, the existence of waste may never be questioned. The goal is zero waste and inventory.
Management may never achieve such a lofty goal, but by pursuing it, substantial cost savings will occur.
PRODUCTIVITY IMPROVEMENT, STANDARDS, AND NONVALUE-ADDED ACTIVITIES.
Whether ideal or practical standards are used, the modern management accountant needs to report
improvements in productivity. With ideal standards, the change in variances over time measures the move-
ment toward the theoretical optimum. While ideal standards will almost always result in unfavorable usage
variances, continuous improvement is evidenced by a reduction in the variances over time. In other words,
as actual productivity improves, the difference between the ideal standard quantity and actual results will
decrease.
When practical standards are used, reporting the change (reduction) over time in standard quantities and
costs, as nonvalue-added activities are eliminated from them, will provide the same type of information to
INSIGHTS & APPLICATIONS
Emphasizing the Achievable
Put a 5-foot- 10-inch person into 6 feet 3 inches of water, and odds
are he'll learn to swim. He may sputter and spit a bit, but he can
always hop up off the bottom and get air. Put that same person in 7
feet 4 inches of water, and you may have a dead body on your
hands.
The 6 feet 3 inches of water forces the 5-foot-l0-inch person to stretch.
The stretching provides a sense of accomplishment. It's challenging,
but achievable. Field Marshal Bernard Montgomery and General
George Patton, although different in style, had something in common.
Both inherited winless and dispirited armies. And both rapidly
reversed these armies' fortunes using exactly the same technique to
begin the turnaround. Both focused on the instantly “doable.” A first
“stretch goal” was to demand spotless uniforms and to launch an
intensive physical fitness program. Both officers were able to convert
demoralized losers into winnersa
a.From Thriving on Chaos by Tom Peters, Copyright © 1987 by Excel, a California Limited Partnership. Reprinted by permission of Alfred A. Knopf,
Inc.
CHAPTER 7
THE STANDARD COST ACCOUNTING SYSTEM PART I: SETTING STANDARDS PAGE 239
management. For example, as the amount of raw chocolate lost in production goes down, the standard
quantity can be reduced. A decreasing standard quantity over time signals continuous improvement.
Care has to be taken in interpreting measurements developed with practical standards. Where, for exam-
ple, are the nonvalue-added activities and costs in the direct materials standard quantity for SweetTooth,
Inc.? They are in the inefficiencies in production that cause a normal scrap rate of 25 percent. Eliminating
this scrap can save SweetTooth $0.50 per box (the standard price of $1.50 per pound multiplied by the
one-third pound normally lost).
Where are the nonvalue-added activities in direct labor? They are potentially in the output specification
and the downtime. As with materials, the labor time lost due to setup and cleanup may be eliminated by
redesigning the production process. Many firms have reported significant savings through changing oper-
ations from traditional batch production processes involving multiple functional departments to JITs. Har-
ley-Davidson cut inventory by $20 million, increased inventory turns from 6 to 20, decreased setup times
by 75 percent, and reduced warranty claims and defects by 24 percent.7 The “Ditch Witch” example on the
next page provides another example of the benefits that can be realized from JIT conversions.
PRODUCTIVITY IMPROVEMENTS, STANDARDS, AND LEARNING CURVES. The second
avenue for labor productivity improvement for SweetTooth, Inc. is in the output specification of 48 min-
utes per box of chocolates. As workers become more experienced, learning takes place. Learning how to
do the job better usually results in doing it faster, at least over the short run. As experience increases, then,
the amount of productive time needed goes down. Practically speaking, it currently takes 48 minutes of
productive time to make a box of chocolates. Ideally, however, an experienced worker should be able to
make a box in 45 minutes. The ideal output specification would be 45 minutes, but the practical output
specification is 48 minutes.
How does the modern management accountant measure the effects of learning on the standard labor quan-
tity? In production and operations management, formulas are available for measuring and predicting the
effects of learning over time. For example, consider a general contractor who builds expansion bridges for
the federal interstate highway system. As each bridge is finished, workers become more efficient. The
engineer calculates that the learning curve is a 10 percent reduction in total direct labor time for the next
bridge each time. one is finished.
Using this information with the standard labor cost for the first bridge, the management accountant can
budget the standard labor cost for the second and subsequent bridges to be bid. To illustrate, 10,000 man-
hours were budgeted for the productive time to build the first bridge. Normal downtime is 20 percent.
Therefore, the standard labor quantity for the first bridge was 12,500 man-hours. Using the 10 percent
learning curve projection, the second bridge should only require 90 percent of the productive time bud-
geted for the first bridge, or 9,000 man-hours of productive time and 11,250 man-hours as the standard
quantity.
REVISING STANDARDS. Learning raises the issue of how frequently standards should be revised_ in
many traditional enterprises, goals are set and budgets prepared annually. Consider the standards and cost
variances that the SCAS would produce at Carslaw International (see next page).
Setting and revising standards, whether theoretical or practical, can foster significant improvements in
making a product or rendering a service in future periods. The setting of standard costs should, therefore,
include the following:
• A careful selection of materials based on both price and quality
• A comprehensive study and evaluation of all activities
• An engineering study of equipment and other manufacturing facilities
The careful setting of standards is likely to uncover inefficiencies in operations. By reducing or eliminat-
ing these, the total enterprise will benefit.
To achieve maximum effectiveness, standards must be accepted by those who will carry them out.
Employees should believe that standards are both fair and achievable, or they will tend to sabotage,
ignore, or circumvent them. Participation in the standard-setting process will encourage acceptance of
standards and increase understanding of their measures, meanings, and purposes by those affected.
7. Peter Reid, Well Made in America, Lessons from Harley-Davidson on Being the Best (New York: McGraw-Hill, 1990), pro-
vides interesting, in depth reading. Other examples, cited in Chapter 2, include General Electric, Hewlett-Packard, Cincinnati
Milacron, General Motors, and Michelin.
Page 240 COST AND MANAGEMENT ACCOUNTING
SETTING VARIABLE AND FIXED OVERHEAD STANDARDS
LEARNING OBJECTIVE 4
Calculate the stan-dard costs for vari-able and fixed overhead, and understand the issues involved in setting these stan-dards
The activities that cause short-run variable overhead costs are often different from those causing fixed
overhead items. For example, the cost of nails for a general contractor depends on the number and size of
houses built. But, the cost of a supervisor for a tract home subdivision, many permits and fees, bonds, and
insurance may be a set amount for the project. Because variable and fixed overhead costs are caused by
different activities, they should be accounted for separately. This is necessary for identifying controllability
accurately and assigning responsibility in performance evaluation. It also facilitates more effective and
efficient budgeting.
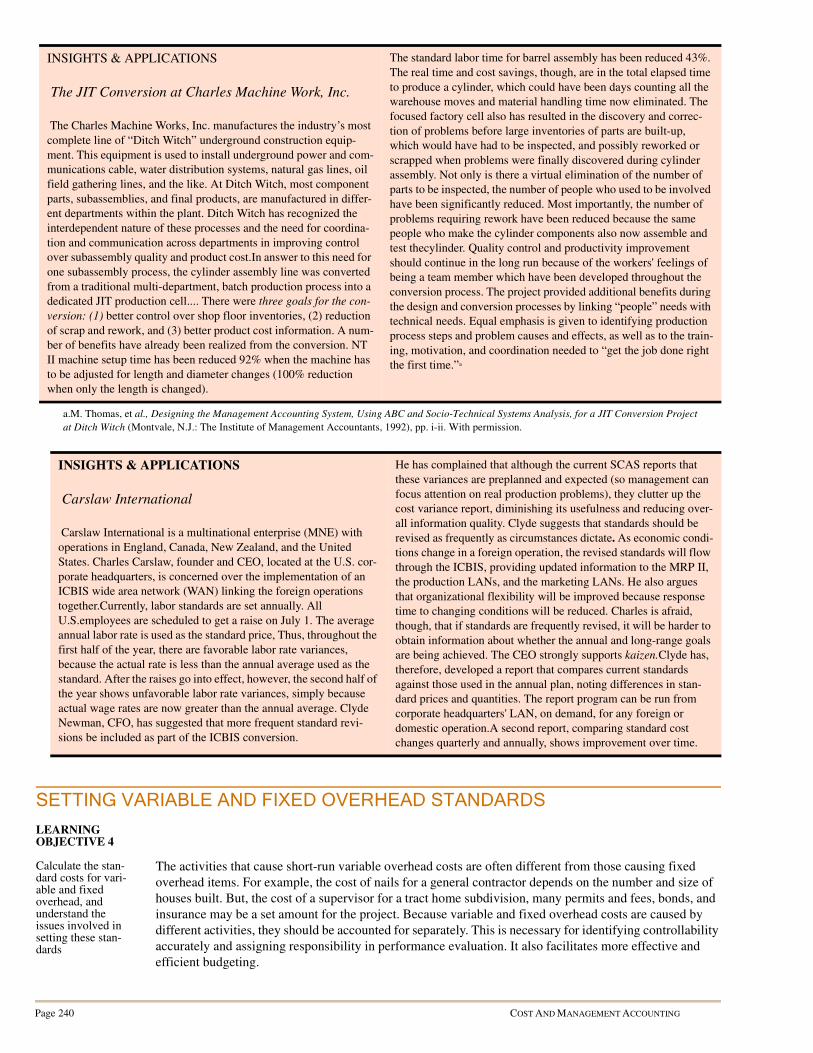
INSIGHTS & APPLICATIONS
The JIT Conversion at Charles Machine Work, Inc.
The Charles Machine Works, Inc. manufactures the industry’s most
complete line of “Ditch Witch” underground construction equip-
ment. This equipment is used to install underground power and com-
munications cable, water distribution systems, natural gas lines, oil
field gathering lines, and the like. At Ditch Witch, most component
parts, subassemblies, and final products, are manufactured in differ-
ent departments within the plant. Ditch Witch has recognized the
interdependent nature of these processes and the need for coordina-
tion and communication across departments in improving control
over subassembly quality and product cost.In answer to this need for
one subassembly process, the cylinder assembly line was converted
from a traditional multi-department, batch production process into a
dedicated JIT production cell.... There were three goals for the con-
version: (1) better control over shop floor inventories, (2) reduction
of scrap and rework, and (3) better product cost information. A num-
ber of benefits have already been realized from the conversion. NT
II machine setup time has been reduced 92% when the machine has
to be adjusted for length and diameter changes (100% reduction
when only the length is changed).
The standard labor time for barrel assembly has been reduced 43%.
The real time and cost savings, though, are in the total elapsed time
to produce a cylinder, which could have been days counting all the
warehouse moves and material handling time now eliminated. The
focused factory cell also has resulted in the discovery and correc-
tion of problems before large inventories of parts are built-up,
which would have had to be inspected, and possibly reworked or
scrapped when problems were finally discovered during cylinder
assembly. Not only is there a virtual elimination of the number of
parts to be inspected, the number of people who used to be involved
have been significantly reduced. Most importantly, the number of
problems requiring rework have been reduced because the same
people who make the cylinder components also now assemble and
test thecylinder. Quality control and productivity improvement
should continue in the long run because of the workers' feelings of
being a team member which have been developed throughout the
conversion process. The project provided additional benefits during
the design and conversion processes by linking “people” needs with
technical needs. Equal emphasis is given to identifying production
process steps and problem causes and effects, as well as to the train-
ing, motivation, and coordination needed to “get the job done right
the first time.”a
a.M. Thomas, et al., Designing the Management Accounting System, Using ABC and Socio-Technical Systems Analysis, for a JIT Conversion Project
at Ditch Witch (Montvale, N.J.: The Institute of Management Accountants, 1992), pp. i-ii. With permission.
INSIGHTS & APPLICATIONS
Carslaw International
Carslaw International is a multinational enterprise (MNE) with
operations in England, Canada, New Zealand, and the United
States. Charles Carslaw, founder and CEO, located at the U.S. cor-
porate headquarters, is concerned over the implementation of an
ICBIS wide area network (WAN) linking the foreign operations
together.Currently, labor standards are set annually. All
U.S.employees are scheduled to get a raise on July 1. The average
annual labor rate is used as the standard price, Thus, throughout the
first half of the year, there are favorable labor rate variances,
because the actual rate is less than the annual average used as the
standard. After the raises go into effect, however, the second half of
the year shows unfavorable labor rate variances, simply because
actual wage rates are now greater than the annual average. Clyde
Newman, CFO, has suggested that more frequent standard revi-
sions be included as part of the ICBIS conversion.
He has complained that although the current SCAS reports that
these variances are preplanned and expected (so management can
focus attention on real production problems), they clutter up the
cost variance report, diminishing its usefulness and reducing over-
all information quality. Clyde suggests that standards should be
revised as frequently as circumstances dictate. As economic condi-
tions change in a foreign operation, the revised standards will flow
through the ICBIS, providing updated information to the MRP II,
the production LANs, and the marketing LANs. He also argues
that organizational flexibility will be improved because response
time to changing conditions will be reduced. Charles is afraid,
though, that if standards are frequently revised, it will be harder to
obtain information about whether the annual and long-range goals
are being achieved. The CEO strongly supports kaizen.Clyde has,
therefore, developed a report that compares current standards
against those used in the annual plan, noting differences in stan-
dard prices and quantities. The report program can be run from
corporate headquarters' LAN, on demand, for any foreign or
domestic operation.A second report, comparing standard cost
changes quarterly and annually, shows improvement over time.

CHAPTER 7
THE STANDARD COST ACCOUNTING SYSTEM PART I: SETTING STANDARDS PAGE 241
Thus, a high-quality responsibility accounting system needs to identify the different activities that cause
both variable and fixed overhead. As a first step, variable and fixed overhead will be separated here. Chap-
ter 9 will discuss the need for multiple variable and fixed overhead accounts for production and nonpro-
duction (support services) departments. Finally, Chapters 9 and 10 will look at multiple overhead accounts
and allocations for all the overhead activities involved in production.
CHOOSING BASES TO BUDGET AND APPLY VARIABLE OVERHEAD CHOOSING BASES TO BUDGET AND APPLY VARIABLE OVERHEAD CHOOSING BASES TO BUDGET AND APPLY VARIABLE OVERHEAD CHOOSING BASES TO BUDGET AND APPLY VARIABLE OVERHEAD COSTS TO PRODUCTS OR SERVICESCOSTS TO PRODUCTS OR SERVICESCOSTS TO PRODUCTS OR SERVICESCOSTS TO PRODUCTS OR SERVICES
In any CAS, overhead is accumulated in a separate WIP subsidiary ledger account and periodically
applied to products. Whether journal entry 7 applies overhead to jobs (JOCAS) or products in a depart-
ment (PCAS), the amount is determined by multiplying an overhead rate by the base's volume. For exam-
ple, in a normal JOCAS, overhead might be applied at a rate of $5 per direct labor hour times the actual
number of hours worked on a job. If 20 direct labor hours are worked on a job, a normal JOCAS would
apply $100 of overhead to its cost. A normal JOCAS uses a predetermined (budgeted) overhead rate (a
POR), or in other words, a standard price.
In an SCAS, the standard price for overhead is the POR. For variable overhead (VOH), the VOH POR is
calculated by the following formula:
VOH POR = Estimated VOH costs / Estimated direct labor hours
This VOH POR uses direct labor hours as the basis for estimating and applying overhead to products.
Refer back to the SweetTooth box of chocolates in Exhibit 7-1. SweetTooth management set a standard
price for variable overhead (a VOH POR) of $0.30 per direct labor hour. One direct labor hour per box
was budgeted as the standard labor quantity, so the standard cost for variable overhead was $0.30 per box.
A variety of bases can be used for estimating and applying variable overhead costs to products or services.
Typical bases include the following:
• Direct labor cost
• Direct labor hours
• Machine hours
• Units of product on a basis of weight or volume
• Direct materials weight or volume
In choosing the proper base to use, the management accountant's primary goal is to select a base that rep-
resents a cause-effect relationship between the overhead costs and the activities that cause these costs. For
example, if the overhead costs in question are predominantly related to the supervision and use of labor,
then the proper base probably is direct labor cost or direct labor hours.
Although these two bases have been widely used by traditional enterprises, in recent years increased auto-
mation has led to a trend away from them. In automated environments, these two bases are unlikely to
have a strong cause-effect relationship to the incurrence of manufacturing overhead. In labor-intensive
operations, however, these labor bases may he the most appropriate bases to use. If the overhead costs are
predominantly related to operation of machinery, a machine hour base is more appropriate. If the overhead
costs relate to the handling of materials, then the direct materials cost base may be best, and so forth.
VOH POR USING A DIRECT LABOR DOLLAR BASE. Applying overhead as a percentage of direct
labor cost is one of the oldest methods. Estimated overhead costs are divided by the estimated dollar
amount of direct labor and converted to a percentage. Variable overhead may be applied as, for example,
200 percent of the product or service direct labor cost. Stated differently, VOH may be applied at the rate
of $2 for every $1 of labor cost traced directly to a product or service.
The direct labor dollar base is simple and easy to use. All the data necessary to use this method are avail-
able from the payroll system. If more VOH is incurred by the more highly skilled and paid employees, the
VOH FOR should be based on direct labor costs. If varying wage rates reflect differences in the speed or
quality of work, it may be proper to assume that higher-paid workers use more VOH items. Budgeting
VOH in this way, the direct labor cost-based VOH POR properly applies proportionately different
amounts of overhead costs when these different workers are used on a job or service.
VOH POR USING A DIRECT LABOR HOUR BASE. If the major factor. if production is labor, and
overhead is caused uniformly by all types of employees, then the direct labor hour method represents a
better base for budgeting and applying variable overhead costs. Like the direct labor dollar base, it is easy
to use. But unlike the direct labor dollar base, the direct labor hour base makes use of a time factor. There-
fore, it overcomes a major objection of the direct labor dollar base, because operations taking the same

Page 242 COST AND MANAGEMENT ACCOUNTING
time should incur, and are costed with, the same overhead, although the workers may be receiving different
rates of pay. But as stated earlier, when the different rates of pay accurately reflect different skills, quality,
or different speeds of operation, it may be proper to budget and apply more overhead costs for the higher-
paid direct labor. In this situation, the direct labor dollar base is more appropriate. Like the direct labor dol-
lar base, the direct labor hour base should not be used in operations where direct labor plays a minor role in
production.
VOH POR USING A MACHINE HOUR BASE. In operations where machinery is the major factor of
production, the major components of VOH may be maintenance and power, while the major components
of fixed overhead may be depreciation and insurance. In these environments, the machine hour base is nor-
mally the best basis for budgeting and applying variable overhead costs. The drawback to using this base is
that the machine hours expected and actually used may not be readily available. This drawback can be
overcome by installing timing devices on the machinery. Machinery manufacturer specifications and engi-
neering studies can also assist in determining a standard machine time (a standard quantity).
VOH POR USING A UNIT OF PRODUCT BASE. Application of VOH costs on the basis of the num-
ber of units of product made or the number of service jobs rendered during the period is the simplest
method for applying overhead, although it may not be the best method for budgeting VOH costs. The VOH
POR is computed as follows:
VOH cost per unit (or job) = Estimated VOH costs / Estimated number of units of products or services
The unit of product base is limited to situations where only one product or a few closely related products (a
product family) using the same overhead activities are produced. If this is not the case, the unit of product
base is not recommended.
Two popular variations of the unit of product base are the:
• Weight base
• Volume base
The weight base is used in applying overhead in mining and certain other industries where the natural unit
of output is ounces, pounds, or tons. The volume base for applying overhead costs is sometimes used by
water, pipeline, petroleum companies, or other enterprises that measure output in gallons, barrels, bushels,
and the like. The volume base is also used in companies that produce a single product packaged in various
sized containers easily differentiated by volume.
VOH POR USING A DIRECT MATERIALS COST BASE. In some companies, VOH involves costs
related to the purchase, inspection, storage, and movement of materials. A VOH POR using direct materi-
als weight or volume is calculated as follows:
Overhead application based on weight, volume, or other physical output is simple and useful where only
one product or a few closely related products are produced. They can be used, however, only when output
can be measured in one common denominator, such as pounds, tons, gallons, bushels, barrels, and so forth.
Even then they provide accurate estimates only when actual overhead activities are closely related to that
physical base.
ESTIMATING VARIABLE OVERHEAD AND FIXED OVERHEADESTIMATING VARIABLE OVERHEAD AND FIXED OVERHEADESTIMATING VARIABLE OVERHEAD AND FIXED OVERHEADESTIMATING VARIABLE OVERHEAD AND FIXED OVERHEAD
Once the cause-effect linkage of overhead activities to overhead costs is determined (the VOH POR's
denominator basis), total variable overhead and total fixed overhead (FOH) can be budgeted. To do this,
however, the management accountant must understand cost behavior patterns. This understanding needs to
be communicated to all those involved in the standard-setting process.
CLASSIFYING COSTS ACCORDING TO THEIR BEHAVIOR PATTERNS. Cost behavior is the
movement of total cost in response to changes in volume or activity, such as an increase or decrease in
amount of units produced or direct labor hours worked. Four general types of cost behavior patterns exist:
• Variable cost
• Fixed cost
• Mixed cost
VOH cost per some unit of measure (e.g.,
pounds, tons, gallons, barrels)
(Estimated direct materials
handling overhead costs)=
(Estimated weight (or volume)
of direct materials)

CHAPTER 7
THE STANDARD COST ACCOUNTING SYSTEM PART I: SETTING STANDARDS PAGE 243
• Step cost
Management accountants relate these costs to a narrow band of volume or level of activity called the rele-
vant range. Within these bands, the assumptions about cost behavior patterns are valid. Exhibit 7-3 pres-
ents graphical examples of these cost behavior patterns.
VARIABLE COSTS. Variable costs increase in total in direct proportion to increases in volume or level
of activity. If the level of activity doubles, then the variable cost will double as well. If the level of activity
decreases by 20 percent, then the variable cost will decrease by 20 percent. Direct materials and direct
labor are examples of variable costs.
For variable costs to change in total in direct proportion to changes in the level of volume or activity, they
must be constant on a per unit basis. To illustrate, Sporty Car Company installs one engine for each car it
produces. The engines cost $300 each. On a per car basis, the cost remains constant at $300. But the total
cost of engines changes in direct proportion to the number of cars produced. If 200 cars are produced, the
total engine cost will be $60,000 (200 cars x $300 per engine).
As long as Sporty acquires 100 to 300 engines, the band of the relevant range, the cost per engine will be
$300. Should Sporty acquire less than 100 or more than 300 engines, the cost per unit may be different
because of such things as quantity discounts or surcharges on minimal orders. This is why knowledge of
the relevant range is important in budgeting variable costs. The standard price may change outside the rel-
evant range.
FIXED COSTS. Fixed costs are costs that remain constant in total for a period of time regardless of vol-
ume or level of activity. To continue with the Sporty Car Company example, assume that the firm builds a
factory to handle production volume of between 100 and 300 cars. The total cost of the factory is
Exhibit 7 -3 Cost Behavior Patterns

Page 244 COST AND MANAGEMENT ACCOUNTING
$1,000,000, and it has a useful life of five years with no salvage value. If the building is depreciated on a
straight-line basis, the depreciation is $200,000 per year.
Because fixed costs remain constant in total, the amount of cost computed on a per unit basis will get pro-
gressively smaller the greater the number of cars produced. Assume factory depreciation is the only fixed
overhead cost. If Sporty manufactures only 100 cars in a year, the $200,000 factory building depreciation
cost will result in an FOH standard cost of $2,000 per car. If 200 cars are produced, the FOH standard cost
will decrease to $1,000 per car.
The management accountant concentrates on the behavior of fixed costs within the relevant range. Fixed
costs are based on an expected band of volume or level of activity. Outside this band, fixed costs in total
can increase or decrease just as variable costs per unit can.
As long as Sporty's manufacturing activity level stays within the relevant range of 100 to 300 cars pro-
duced per year over the next five years, the budgeted FOH cost of $200,000 stemming from factory build-
ing depreciation will remain constant. If the activity level increases beyond 300 cars produced per year, the
building will have to be expanded, increasing factory building depreciation.
Other fixed costs may also increase. For example, production volume beyond the relevant range may
require that another production shift be added, calling for another supervisor and additional insurance.
MIXED COSTS. Mixed costs are composed of both variable and fixed cost components. Utility cost is a
good example of a mixed cost. Generally, it consists of a fixed service charge plus a variable charge for
usage beyond a certain amount. Telephone charges, for example, have a fixed cost per month plus long-
distance toll charges.
The cost behavior in the mixed cost graph can be described by the following equation:
Y = TFC + (VCU x X)
where, Y is total cost, and:
TFC = Total fixed costs
VCU = Variable cost per unit
X = Volume or activity level in units
Assume that an overhead item, for example, the rent on a mainframe computer, is $10,000 per month plus
$100 per hour of central processing time used, and the enterprise plans on 70 hours of central processing
unit (CPU) time. Then the budgeted rent is computed as follows:
Monthly computer rent = $10,000 + ($100 per CPU hour x 70 CPU hours)
= $10,000 + $7,000
= $17,000
If the company does not use the computer during a month, the rent is calculated as follows:
STEP COSTS. Step costs are costs that are constant in total only over small ranges of volume within the
relevant range. Supervisory payroll can be a step cost. As the work force is increased, an additional super-
visor must be hired for each specified increment of workers. Step costs are difficult to incorporate in the
budgeted overhead amount for calculating PORs. Usually, the management accountant assumes they are
variable or fixed. If the steps are very narrow, as in Exhibit 7-3d, little budgeting accuracy may be lost by
treating them as variable costs. If, on the other hand, the steps are wide, treating this cost element as a fixed
cost may be sufficiently accurate for budgeting overhead.
The modern management accountant is a member of a team, getting out of the office and onto the shop
floor to obtain the information necessary from the people who know. Shop floor personnel can be expected
to know the activity that cause variable and fixed overhead. With the help of the management accountant,
engineers, and others, overhead standard prices (PORs) and standard quantities can be estimated. This can
be done through direct observation and/or special engineering studies by the team.
Historically, some traditional enterprises expected the management accountant to identify a basis for bud-
geting and applying overhead and to prepare the overhead standards independently. Financial accounting
systems dominated the attention of accountants. In these systems, direct materials, direct labor, and total
overhead were separately accounted for, but variable and fixed overhead did not need to be differentiated.8
Monthly computer rent = $10,000 + ($100 per CPU hour x 0 hours)
= $10,000 + $0
= $10,000

CHAPTER 7
THE STANDARD COST ACCOUNTING SYSTEM PART I: SETTING STANDARDS PAGE 245
To satisfy external reporting requirements, the primary goal became the selection of a base that resulted in
a reasonable application of overhead. Many times a simple base to measure, such as direct labor hours,
was chosen. As long as all the overhead was applied in some systematic fashion to all the products, then
GAAP was satisfied.
Being isolated in the accounting department and lacking the necessary information about overhead activi-
ties and their “cost drivers” (bases), the management accountant was forced to prepare estimated costs
from historical cost information using quantitative techniques. Since these techniques still appear on the
professional certification exams, they will be reviewed in the following section.
QUANTITATIVE METHODS FOR ESTIMATING VARIABLE AND FIXED QUANTITATIVE METHODS FOR ESTIMATING VARIABLE AND FIXED QUANTITATIVE METHODS FOR ESTIMATING VARIABLE AND FIXED QUANTITATIVE METHODS FOR ESTIMATING VARIABLE AND FIXED OVERHEAD COSTS FROM HISTORICAL DATAOVERHEAD COSTS FROM HISTORICAL DATAOVERHEAD COSTS FROM HISTORICAL DATAOVERHEAD COSTS FROM HISTORICAL DATA
In traditional CASs, having only one total overhead account resulted in overhead being treated as a mixed
cost. Thus, the management accountant had to calculate an equation to predict total overhead, such as the
equation previously used to predict mainframe computer rental cost. The following methods can be used
to estimate the relationship between volume or level of activity and total overhead costs:
• Scattergraph method
• High-low method
• Regression methods
THE SCATTERGRAPH METHOD. The scattergraph method (also called scatterplot or scatter dia-
gram) of identifying variable and fixed overhead costs consists of plotting data on a graph and fitting a
line to the data by visual inspection. To illustrate, assume that maintenance costs for Moran industries
have been compiled as shown in Exhibit 7-4 . This data sample consists of 12 monthly observations of
maintenance costs and production volume. While the management accountant believed that machine
usage (hours used) caused overhead, no information was available from the traditional CAS on this base.
Further, believing that production volume caused machine usage, the management accountant used this as
the basis for building an overhead cost equation and budgeting overhead costs. These data will be used to
demonstrate the Scattergraph method as well as the high-low and regression methods.
The type of correlation between maintenance cost and production volume can be understood from the pat-
terns of the observations on the graph. The patterns, and the types of correlations they indicate, are illus-
trated in Exhibit 7-5.
The line fitted to the data by visual inspection in Exhibit 7-6 can be expressed as a linear equation. Total
maintenance cost is plotted on the vertical, or y, axis. The units produced are plotted on the horizontal, or
x, axis. The average variable cost per product is represented by the slope of the line, and the total fixed
8. This is one of the reasons why only the total overhead POR was calculated in Chapter 4. In modern CASs required in
WCMs, multiple VOH and FOH accounts are necessary. These refinements will be incorporated into CAS design in Chapters 9
and 10.
Exhibit 7 -4 Compilation of Maintenance Cost Incurred over Twelve Months at Moran Industries
Month Units of Product Produced Maintenance Cost Incurred
January 500 $ 700
February 700 960
March 600 750
April 750 900
May 650 780
June 850 1,050
July 800 950
August 650 800
September 750 880
October 750 920
November 700 900
December 550 700

Page 246 COST AND MANAGEMENT ACCOUNTING
costs are represented by the point where the line intersects the cost axis (the intercept). Generally, the line
is placed so that the number of points falling above and below it are approximately equal.
Because the line intersects the cost axis at $250, that amount represents the fixed cost element in total
overhead. If 500 products are budgeted to be made in the next month, the corresponding cost at this vol-
ume is $700. The variable cost element is then calculated as follows:
Exhibit 7 -5 Types of Correlation between Data
Exhibit 7 -6 A Completed Scattergraph Identifying Variable and Fixed Cost Elements for Mainte-nance Cost at Moran Industries

CHAPTER 7
THE STANDARD COST ACCOUNTING SYSTEM PART I: SETTING STANDARDS PAGE 247
Thus, the scattergraph method yields the following cost formula for maintenance:
Total monthly maintenance cost = $250 + $0.90 per unit
For a month with a production quota of 600 products, total maintenance cost is estimated as:
Total monthly maintenance cost = $250 + ($0.90 per unit X 600 units) = $790
The scattergraph method offers the following advantages:
• It is relatively quick and easy to develop.
• A deviation in cost behavior is easily spotted, and that observation can he ignored when visually fitting
the line.
• The resulting cost equation may be good enough for the intended use (e.g., the cost to be estimated is rel-
atively unimportant, and the decision made from this information would not be seriously affected by
more sophisticated analyses).
The disadvantage is that different people given the same data will probably draw different lines and, thus,
have different estimates of variable and fixed costs.
THE HIGH-LOW METHOD. The high-low method uses only two observations from the data, at the
high and low levels of volume or activity.9 Variable cost per unit (the slope) is equal to the difference in
cost divided by the difference in volume or activity. In Exhibit 7-4, June was the month with the highest
production volume, while January was the lowest.
This formula indicates that two points are being chosen, each of which is a volume-cost pair. These two
points are chosen on the basis of highest and lowest volume, not on the basis of highest and lowest cost.
Activity volume is used to determine high and low points because the activity is expected to drive (cause)
maintenance costs.
Having determined that the variable rate is $1 per unit, the management accountant can now calculate the
total fixed overhead cost (the intercept). This is done by taking total cost at either the high or low point
and deducting the total variable cost calculated for that volume. In the following calculation, total cost at
the high point of volume or activity is used:
The cost of maintenance can now be estimated using the following cost equation from the high-low
method:
Monthly maintenance cost = $200 + $1.00 per unit produced
If 600 products are planned for a month, then the high-low cost equation yields the following estimated
cost:
Exhibit 7-7 shows the relationships graphically. Maintenance cost is known as the dependent variable
because the amount of maintenance cost incurred during a period will be dependent on the level of volume
or activity for the period. As the level of volume or activity increases, maintenance cost will also increase.
The level of volume or activity is called the independent variable because it is used to predict the amount
of maintenance cost that will be incurred during a period.
The advantages of the high-low method include the following:
Total maintenance cost at 500 units produced $700
Less the fixed cost element <250>
Total estimated variable maintenance cost $450
$450 - 500 units = $0.90 per unit produced
9. The high-low method is the “slope-intercept method of calculating a straight line” learned in elementary school.
Variable rate = (High cost - Low cost) / (High volume - Low volume)
= ($1,050 - $700) / (850 units - 500 units)
= $1.00 per unit produced
Fixed cost element = Total cost - Variable cost element
= $1,050 - ($1.00 per unit x 850 units)
= $200
Total monthly maintenance cost = $200 + ($1.00 per unit X 600 units)
= $800

Page 248 COST AND MANAGEMENT ACCOUNTING
• It is easy to calculate.
• It is easy to understand.
• It is objective (everyone will calculate the same cost equation).
But there are two disadvantages:
• It uses only two data points, so if either data point is extreme, the results will be skewed, and estimated
costs may not be accurate.
• Only one independent variable is considered (this is also a disadvantage of the scattergraph method).10
THE UNIVARIATE LEAST SQUARES REGRESSION METHOD. The most statistically precise
method of fitting the data to a linear equation is the least squares method. The regression line is based on
the same type of cost equation used in the previous methods. To illustrate, refer back to the data in Exhibit
7-4. These data are entered into a hand-held business calculator. The calculations involve solving simulta-
neous equations for two variables. The slope (variable maintenance cost per unit) and the intercept (the
total fixed maintenance cost) values from the calculator are used in the cost formula:
Monthly maintenance cost = $161.08 + $1.01 per unit produced
If 600 products are expected to be produced next month, the expected maintenance cost will be:
Monthly maintenance cost = $161.08 + ($1.01 per unit X 600 units) = $767.08
The increased statistical precision of the least squares method is an advantage over the other two methods.
If the calculations are done manually, this method will take more time, which can be a disadvantage,
depending on the importance of the cost estimate and the amount of time available.
Exhibit 7 -7 High-Low Method of Identifying Variable and Fixed Cost Elements for Maintenance at Moran Industries
10. Maryanne M. Mowen, Accounting for Costs as Fixed and Variable (Montvale, NJ: Institute of Management Accountants,
formerly the National Association of Accountants, 1986), p. 13. With permission.

CHAPTER 7
THE STANDARD COST ACCOUNTING SYSTEM PART I: SETTING STANDARDS PAGE 249
COMPARING THE METHODS' PREDICTED COSTS. Exhibit 7-8 compares the cost equations and
cost estimates from the three methods. The differences between the predicted costs do not appear to be
significant, due in part to the small amount of maintenance costs per month.
Which method is better? For a very simple and relatively unimportant cost, the quickest method may be
best. However, with the availability of LANs, PC software (like spreadsheet programs), and even hand-
held calculators, regression analysis may not require any more time than the other two methods, and by
accessing SCAS database information, it may even be faster.
CORRELATION ANALYSIS. A second reason for the closeness of the cost predictions in Exhibit 7-8 is
the high positive correlation between production volume (the independent, predictor variable) and
monthly maintenance cost (the dependent variable being predicted).
Correlation analysis measures how well production volume predicts monthly maintenance cost. The coef-
ficient of correlation, r, is a statistic that evaluates how closely production volume and monthly mainte-
nance cost move together. If monthly maintenance cost rises as production volume rises, there is a positive
correlation. If monthly maintenance cost falls as production volume rises, there is a negative correlation.
When there is no discernible pattern, there is no correlation. Refer back to Exhibit 7-5 for graphical illus-
trations.
The values for r can range from -1 (perfect negative correlation) to 1 (perfect positive correlation). Values
close to zero denote no correlation. Continuing the Moran Industries monthly maintenance cost example, r
equals 0.939, indicating that production volume and maintenance cost are highly positively correlated.
If r is squared, it denotes the percentage of variation in the dependent variable explained by the indepen-
dent variable. The coefficient of determination, r2, ranges from zero (no variation is explained) to 1 (all
variations in the dependent variable are explained by the independent variable). In this example, r equals
0.881; that is, 88.1 percent of the variation in the dependent variable is explained by the independent vari-
able. It can be concluded that the independent variable, production volume, is a good predictor of mainte-
nance cost, at least for Moran Industries.
STANDARD ERROR OF THE ESTIMATE. The standard error of the estimate, Se, indicates the degree
of dispersion of actual observations from estimated values. It indicates the average difference between
actual observations and expected results. Putting it another way, Se, is the measure of the scatter of the
actual observations about the regression line.
When each actual value of the dependent variable falls on the regression line, the standard error of the esti-
mate is zero, indicating that the regression equation provides perfect estimations for that set of data. As the
standard error of the estimate increases, the strength of the relationship between the two variables
declines, and the regression equation will produce progressively less precise cost estimates.
Exhibit 7 -8 Comparison of Cost Equations and Predictions for the Scattergraph, High-Low, and Least Squares Methods
Scattergraph Method:
Total monthly maintenance cost
Budgeting total overhead for 600 products:
Total monthly maintenance cost
High-Low Method:
Total monthly maintenance cost
Budgeting total overhead for 600 products:
Total monthly maintenance cost
Least Squares Regression Method:
Total monthly maintenance cost
Budgeting overhead for 600 products.
Total monthly maintenance cost
= $250 + $0.90 per unit
= $250 + ($0.90 per unit X 600 units) = $790.00
= $200 + $1.00 per unit produced
= $200 + ($1.00 per unit X 600 units) = $800.00
= $161.08 + $1.01 per unit produced
= $161.08 + ($1.01 per unit x 600 units)
= $767.08

Page 250 COST AND MANAGEMENT ACCOUNTING
MULTIPLE REGRESSION ANALYSIS. Often, overhead is caused by more than one independent vari-
able (“cost driver”). Moran Industries' maintenance cost might be predicted even more accurately if the
cost equation contained two predictor variables, such as production volume and age of the machinery.
Multiple regression analysis is a statistical method that creates cost equations containing multiple predic-
tor variables. The maintenance cost equation for Moran industries could be:
Monthly maintenance cost = $110.56 + $0.71 per unit produced + $0.84 per each additional month of age
When overhead costs are caused by multiple factors, this method should produce a more reliable cost pre-
diction, evidenced by a higher coefficient of determination and a smaller standard error of the estimate.
This advantage may, or may not, be greater than the effort involved in using this method, which requires
computer software. If the statistical program is loaded into a microcomputer or is available within a LAN,
this method may be as efficient as least squares or any other.
Another potential advantage of multiple regression is that the total overhead cost equation can be pro-
grammed for budgeting purposes. In the Moran Industries example, only maintenance cost is being pre-
dicted, but the equations for all the overhead costs could be combined into one for computer calculations in
the cost accounting entity.11 As part of the management accountant's group decision-making role, the indi-
vidual cost equations may provide more useful information to the shop floor during the budgeting process.
As those responsible for various overhead costs prepare their budgets and standards, the information can
be input into the budgeting program. As enterprises develop more sophisticated technology platforms and
ICBISs, data for the separate equations will be needed for the manufacturing resource planning entity
(MRP II).
UNDERSTANDING THE RAMIFICATIONS OF USING STATISTICAL UNDERSTANDING THE RAMIFICATIONS OF USING STATISTICAL UNDERSTANDING THE RAMIFICATIONS OF USING STATISTICAL UNDERSTANDING THE RAMIFICATIONS OF USING STATISTICAL ESTIMATING METHODSESTIMATING METHODSESTIMATING METHODSESTIMATING METHODS
A variety of software packages exist that can perform regression calculations quickly and easily. Entering
data into a computer without understanding how the method works and what its ramifications are, how-
ever, may lead to misapplications or wrong conclusions.
It is important to understand that the regression equation is based on a relational situation, not necessarily a
causal one. The predictor variables used should make sense to those responsible for budgeting, controlling,
and evaluating various overhead costs. For example, an MIT statistics professor can very accurately pre-
dict whether the Boston Celtics will win a basketball game at home based on the stage of the moon.12
If the analysis indicates a predictive relationship between the independent and dependent variables, can the
management accountant, and the users of CAS output, assume that the sampled data are relevant to the
future? This raises the issue of the relevant range of production volumes over which a univariate or multi-
variate linear equation may provide accurate estimated costs.
Should the parameters of the equations be adjusted for changing economic factors expected during the
time period budgeted? Prices and labor rates may change over time, as may the technology being used.
Both manufacturers and service companies are automating their operations as they shift toward capital-
intensive production. Increased automation means increased investment in equipment, which results in
higher fixed overhead costs (depreciation or lease charges, insurance, property taxes, and the like). Invest-
ments also grow each year because of the continuing investment in new technology by world-class enter-
prises as they develop computer-integrated manufacturing, robotics, ICBISs, and EDI systems.
Direct labor costs, which traditionally have been treated as strictly variable, are becoming more fixed.
Union contracts, company policies, and government regulations are factors tending to make direct labor a
fixed cost. Many workers are paid on the basis of a salary, which is a fixed compensation paid on a regular
basis (e.g., weekly, biweekly, or monthly). Implementation of JIT and cellular manufacturing also results
in direct labor becoming a fixed cost.13
Another question that arises is whether the sample is truly representative of the overhead activity or pro-
cess being budgeted. Data sampling is critical to the effective use of estimating methods. Carelessly col-
11. The cost accounting entity, displayed in an entity relationship diagram, includes programs to budget overhead costs. This
was discussed in Chapter 3.
12. This (probably fictitious) statement was made in the bar on an episode of the “Cheers” television show.
13. Data relevance also depends on a number of statistical properties and problems such as serial (auto) correlation, heterosce-
dasticity and multicollinearity. To cope with the modern environment, the management accountant needs to be familiar with
many knowledge areas. In this case, consulting a statistics text is appropriate.

CHAPTER 7
THE STANDARD COST ACCOUNTING SYSTEM PART I: SETTING STANDARDS PAGE 251
lected data may lead to erroneous cost relationships and “had” decisions. Although statistical sampling is
beyond the scope of this book, several important considerations in collecting data are presented here:
• During the data collection period, the process or activity from which the data are collected should not
undergo significant changes. For example, a change in a maintenance activity from a primarily manual
process to a machine-intensive process would lead to two sets of fundamentally different observations.
• If data are drawn from more than one activity, the underlying characteristics of the different activities
must be the same. For example, if some maintenance costs are incurred in a U-shaped manufacturing
cell with cross-trained workers, and some from a sequential, department-based manufacturing process
with no cross training of workers, sample data from the two activities will probably give substantially
different results.
• A sufficient number of observations must be collected. If proper sampling techniques are used, such as
simple random sampling, a sample size of 20 to 40 observations from a very large population is nor-
mally adequate.
• Each observation must be produced by a random process (e.g., simple random sample).
Although regression methods yield mathematically better results, these methods must be used with cau-
tion. Often, equations and complex calculations give both the management accountant and shop floor per-
sonnel a false impression of accuracy. For example, a scattergraph may be as good as the least squares
method for analyzing cost behavior. By actually plotting the data, the management accountant gains a per-
spective on cost behavior that he or she would not get from simply outputting a regression equation from a
computer program. Indeed, data should always be graphed before any quantitative or statistical method is
considered.
COMPLETING THE STANDARD COST CARDCOMPLETING THE STANDARD COST CARDCOMPLETING THE STANDARD COST CARDCOMPLETING THE STANDARD COST CARD
The overhead budgeting process just described results in an equation for predicting total overhead costs.
After adjusting the equation parameters for any changing factors that are relevant, the VOH and FOH
PORs can be calculated. To illustrate, refer back to the SweetTooth one-pound box of chocolate candies
standard cost card in Exhibit 7-1. Assume that the overhead cost equation is:
Budgeted annual total overhead cost = $58,400/year + $0.30/DLhr
THE VARIABLE OVERHEAD STANDARD COST CARD LINE. Because SweetTooth, Inc., pro-
duces handmade chocolate confections, the shop floor personnel and the management accountant discov-
ered that the direct labor hours worked on each product cause the amount of VOH costs incurred. Direct
labor usage is the independent variable and the basis for overhead application to the products. The variable
cost component of overhead is the slope of the total overhead cost equation. Thus, it is the VOH POR and
the standard price for variable overhead. Since one direct labor hour is budgeted for each box, this is the
standard quantity.
THE FIXED OVERHEAD STANDARD COST CARD LINE. The annual production quota is 20,000
one-pound boxes of chocolates. The intercept of the total overhead cost equation is $58,400 per year. The
intercept is the budgeted fixed overhead cost. Dividing it by the production quota yields the fixed over-
head standard cost:
Because direct labor hours are used to apply variable overhead, this basis is also used to apply fixed over-
head to the products. Working backwards, the FOH standard cost is divided by the standard quantity to
calculate the FOH POR (standard price.)14
Fixed overhead standard cost = Budgeted FOH cost / Production quota
= $58,400 / 20,000 boxes
= $2.92 per box
14. Standard price times standard quantity equals standard cost. Therefore, standard cost divided by standard quantity equals
standard price. A different approach to preparing the FOH line is to directly calculate the standard price. If the production quota
is 20,000 boxes per year, and the standard direct labor quantity is 1 DLhr per box, then 20,000 DLhr will be budgeted for the
year. This is the volume of the overhead basis and the denominator volume of the FOH POR:
FOH POR = $58,400 budgeted FOH cost / 20,000 budgeted direct labor hours =$2.921 DLhr
The FOH POR multiplied by the direct labor standard quantity equals the FOH standard cost.

Page 252 COST AND MANAGEMENT ACCOUNTING
ABSORPTION VERSUS VARIABLE COSTING
Two different views exist as to whether fixed production costs should be included in the standard product
cost. The pervasive view for external reporting is that product costs should include all production costs:
• Direct materials
• Direct labor
• Overhead, both variable and fixed
For internal reporting, the pervasive view is that product costs should include only variable costs:
• Direct materials
• Direct labor
• Variable overhead
DEFINING THE OPPOSING COSTING METHODSDEFINING THE OPPOSING COSTING METHODSDEFINING THE OPPOSING COSTING METHODSDEFINING THE OPPOSING COSTING METHODS
Absorption costing (also called full costing) treats all costs of production as product costs, regardless of
whether they are variable or fixed. Absorption costing is currently required for tax purposes and for exter-
nal reporting under GAAP. Absorption costing is also required in government contracting. The defense
industry, for example, uses absorption costing.
Some management accounting authorities believe that absorption costing is appropriate for internal report-
ing in automated plants and service organizations because of the higher level of fixed costs and lower lev-
els of variable costs. In fact, in highly automated environments, the only variable cost is direct materials
because it is the only cost element that is volume-dependent. Therefore, the allocation of all fixed costs, in
this case labor and overhead, would lead to better product-related decisions. Consequently, many manage-
ment accountants in automated environments use absorption costing, especially those who work for aero-
space, computer, and scientific equipment manufacturers. At the Charles Machine Works, Inc., makers of
“Ditch Witch” underground trenching equipment, the SAMC is used to cost subassemblies produced in JIT
cells, as well as in pricing them for field repair work.15
Variable costing (sometimes called direct costing) is a management accounting tool used to provide man-
agement with information about cost, volume, and profit relationships in a form that is easy to understand.
Under variable costing, only the variable costs are included in the product's standard cost. All fixed pro-
duction costs are written off to COGS in total. The key advantage f variable costing is that the method
facilitates profit planning, cost management, and decision making. To illustrate, at Ditch Witch the stan-
dard variable cost is used for costing rejected subassemblies during final assembly. This allows the SCAS
to provide information on the costs of internal failures. The labor and related overhead standard costs
involved in replacing a bad subassembly plus the standard variable cost of the subassembly is the cost to
correct this failure. If enough failures occur over time, and management is considering purchasing subas-
semblies (outsourcing) rather than continuing to make them, the standard variable cost provides relevant
information for that decision.16 The Ditch Witch SCAS is an example of the need for flexibility in the
design of modern high-quality information systems.17 That system reports both the standard variable cost
and the SAMC.
ADVANTAGES OF A STANDARD COST CARDADVANTAGES OF A STANDARD COST CARDADVANTAGES OF A STANDARD COST CARDADVANTAGES OF A STANDARD COST CARD
The standard cost card for SweetTooth's one-pound box of chocolates (Exhibit 7-1) provides a number of
benefits:
• Separate standard prices and quantities arc required for each cost element. This emphasizes the need for
coordination, communication, and group decision-making in the standard-setting process. Participation
by those who are responsible for controlling the costs can increase their motivation to make goal-congru-
ent decisions and seek continuous improvements.
• Separate standard prices and quantities provide information for daily operational control if used in a real-
time mode to calculate cost variances. This information needs to he available to the shop floor as produc-
tion problems happen.
• Standard prices and quantities are needed for cost variance calculations used in performance evaluation.
15. Thomas, et al., op cit.
16. Ibid.
17. Flexibility is a characteristic of world-class systems, as discussed in Chapter 1. Flexibility allows for more relevant and
usable information, two characteristics of high-quality information, also discussed in Chapter 1.

CHAPTER 7
THE STANDARD COST ACCOUNTING SYSTEM PART I: SETTING STANDARDS PAGE 253
Calculating and reporting cost variances are covered in the next chapter.
• The SAMC is useful in setting sales prices by profit center managers. The sales price has to be high
enough to cover the variable costs of making a product as well as covering (“absorbing”) a fair share of
the fixed overhead.
• The SAMC is useful in making journal entries in the SCAS. An SCAS may be more efficient to operate
than an actual or normal CAS. How to use standard costs in journal entries is discussed in the next chap-
ter.
DISADVANTAGES OF STANDARD ABSORPTIVE MANUFACTURING COSTDISADVANTAGES OF STANDARD ABSORPTIVE MANUFACTURING COSTDISADVANTAGES OF STANDARD ABSORPTIVE MANUFACTURING COSTDISADVANTAGES OF STANDARD ABSORPTIVE MANUFACTURING COSTLEARNING OBJECTIVE 5,
Discuss the need for a manufactur-ing cost equation.
There are two problems with absorption costing. First, the SAMC cannot be used to budget total produc-
tion costs. To do this, the variable and fixed costs need to be separately accounted for. Variable costs need
to be known on a per unit basis and fixed costs in total. These relationships are captured in the product's
cost equation.
BUDGETING TOTAL MANUFACTURING COSTS. In the SweetTooth box of chocolates example
(Exhibit 7-I), the total overhead cost equation was:
Budgeted annual total overhead cost = $58,400/year + $0.30/DLhr
A similar equation needs to be created for all the manufacturing costs involved in making the box of choc-
olates. The variable standard cost is $6.90 per box, which includes:
• The standard raw chocolate cost of $2.00/box
• The standard wrapping paper cost of $0.60/box
• The standard direct labor cost of $4.00/box
• The standard variable overhead cost of $0.30/box
The budgeted fixed overhead cost in total (from the overhead cost equation) is $58,400 per year. Combin-
ing these amounts into a cost equation to predict the total manufacturing costs for this product:
Budgeted annual mfg. cost for 1-pound boxes of chocolates = $58,400/yr. + $6.90/box
The usefulness of the cost equation becomes apparent when budgeting for one box to be produced in a
year and then for 10,000 boxes in a year:
What happens if the standard absorptive manufacturing cost is used to budget total production costs?
In budgeting costs, cost behavior patterns must be known for accurate budgets to result. The problem with
using an absorption cost is that the fixed overhead appears to be a variable cost on the standard cost card.
The management accountant must communicate this, properly explaining cost behaviors and budgeting to
the shop floor personnel involved in planning decisions. Obviously, the fixed costs in total will be incurred
regardless of the production volume (within the relevant range). If one box of candy is all that will be
made next year, $58,400 of fixed overhead still will be incurred. If the sales price is to recapture all the
costs of production, then it will have to be set above $58,406.90!18
If one box is all that is produced:
Budgeted annual manufacturing cost for one-pound boxes of chocolates = $58,400/yr. + $6.90/box
= $58,400 + ($6.90 x 1 box)
= $58,406.90
If 10,000 boxes are produced:
Budgeted annual manufacturing cost for one-pound boxes of chocolates = $58,400 + ($6.90 x 10,000 boxes)
= $127,400
If one box is all that is produced:
Budgeted annual manufacturing cost for one-pound boxes of chocolates = $9.82 /box x 1 box
= $9.82
If 10,000 boxes are produced:
Budgeted annual manufacturing cost for one-pound boxes of chocolates = $9.82/box x 10,000 boxes
= $98,200
18. Budgeting total costs is discussed in more detail in Chapter 17.

Page 254 COST AND MANAGEMENT ACCOUNTING
CHOICE OF A PRODUCTION VOLUME FOR FIXED OVERHEAD STANDARD COST. The sec-
ond problem with using an absorption cost (i.e., including fixed overhead in the standard cost of the prod-
uct) is with the production volume used in calculating the FOH standard cost. There are four commonly
used production volumes:
• Theoretical capacity
• Practical capacity
• Normal capacity
• Expected annual capacity
The theoretical capacity (also referred to as ideal capacity) is the production volume that could be
achieved under 100 percent operating efficiency. It is the estimated absolute maximum production poten-
tial at all times. There are no delays, shutdowns on weekends or holidays, or machine breakdowns. Theo-
retical capacity cannot be achieved in a real-world situation and, accordingly, is seldom used. It is an ideal
standard. Although it has been recommended as a target of kaizen, continuous improvement, in world-class
enterprises, it is an unrealistic assumption in many organizations.
Practical capacity is a feasible level of output. The practical capacity of a plant or department is the theo-
retical capacity less ordinary, regular, and unavoidable operating interruptions. The level of efficiency indi-
cated by practical capacity is difficult but not impossible to achieve.
Normal capacity is the long-term (usually three to ten years) average output of the enterprise. It takes into
consideration idle time brought about by year-to-year fluctuations and economic cycles. It represents the
practical capacity less the estimated idle capacity. An advantage of using normal capacity in calculating the
fixed overhead standard cost is that it represents a level of activity that the enterprise can reasonably expect
to achieve on average over some long-range planning period.
Expected annual capacity is the level of activity budgeted for the upcoming year. Expected annual capac-
ity will result in product or service costs that more closely reflect their actual annual costs if costs are prop-
erly controlled. The 20,000 boxes of chocolates in the SweetTooth, Inc., example is the production quota
based on the sales forecast for the year.
Which capacity measure should the management accountant use to set the FOH standard cost? The answer
is the capacity measure that best motivates management and workers to achieve the goals of the company.
Motivation, though, depends on the individual personalities involved. Additionally, enterprises have short-
run and long-range goals. So, there is no simple answer. To illustrate some of the problems involved,
Exhibit 7-9 presents the FOR standard costs for SweetTooth, Inc., using the four different production vol-
umes.
The larger the volume (denominator), the smaller the FOH standard cost, and the less fixed overhead cost
included (applied) in each product's, job's, or service's SAMC. Theoretical capacity, which is the absolute
capacity, provides the largest denominator.
From a short-term viewpoint, the standard cost from expected annual capacity is probably closest to the
“true” product cost if the annual production quota is achieved. This standard cost will probably he most
relevant to marketing managers setting sales prices because it reflects the amount of fixed overhead that
will need to be covered in the sales price, given the current annual sales forecast and production quota.
With expected annual capacity, a pricing problem may develop between years, however. If next year the
sales forecast drops because of worsening economic conditions, the FOH standard cost will increase. Some
marketing managers may interpret this as an increase in fixed overhead costs and attempt to raise prices at
just the time when economic events suggest otherwise.
From a long-term viewpoint, the normal capacity probably provides the “truest” total product cost as it
represents the long-range average fixed overhead cost per unit. However, if sales prices are based on the
Exhibit 7 -9 Fixed Overhead Standard Costs Using Various Production Volumes for SweetTooth, Inc.’s 1-pound Box of Chocolate Candies
Budgeted FOH Cost / Production Volume = Standard FOH Cost
Expected: $58,400 20,000 boxes $2.92 /box
Normal: $58,400 25,000 boxes $2.34 /box
Practical: $58,400 30,000 boxes $1.95 /box
Theoretical: $58,400 35,000 boxes $1.67 / box

CHAPTER 7
THE STANDARD COST ACCOUNTING SYSTEM PART I: SETTING STANDARDS PAGE 255
SAMC, they will be too low in years when the sales forecast is less than “normal” and too high in years
when expected sales exceed the long-run normal volume.
Generally, the use of theoretical and practical capacity may result in underpricing products. Further, some
management accountants believe that there is little sense in using these volumes if they represent more
products than can be sold. Considering behavioral (motivational) issues, they also believe that in many
cases theoretical capacity may demand too much. At the other extreme, normal and expected annual
capacity demand too little, because unit costs are calculated at a capacity level based on anticipated sales
demand with no regard for available capacity. Finally, some authorities argue that fixed overhead standard
costs should be based on practical or theoretical capacity because these volumes stress a fuller utilization
of available resources and a kaizen philosophy of continuous improvement.
The volume ultimately chosen will depend on the consensus of upper management, shop floor personnel,
and the management accountant. The management accountant's role is to assure that relevant costing, pric-
ing, and motivational issues are considered so that the decision is a rational, goal-directed one.
The SweetTooth box of chocolates is a very simple example. If different overhead items are caused by dif-
ferent cost elements (i.e., direct labor hours, machine hours, direct materials, and so forth), then the man-
agement accountant may want to have separate cost card lines for each subset of overhead. For example,
RMI costs may be allocated based on direct materials purchases. Materials purchasing department costs
may be allocated using the number of purchase orders projected. Indirect materials and indirect labor may
use a direct labor hour basis. Electricity may be caused by machine hours worked. All this does is add
complexity to the standard cost card. Now, there will be multiple standard cost card lines for the different
elements of overhead.19
Notice that there are already multiple lines for direct materials (raw chocolate and wrapping paper). Simi-
larly, in a standard PCAS, there are multiple production departments. Each department's direct labor may
have a separate standard cost and cost card line. As products become more complex, they will have many
individual cost elements and standard cost card lines. For example, how many different direct materials,
labor, and overhead items go into the making of an automobile or a jet aircraft? At one time, the controller
of a major soft drink company reported that 27 different PORs were used in measuring the standard cost of
one of their soft drinks!
The standard-setting process, and budgeting in general, is not an easy task. Effective budgeting, however,
is fundamental in designing an effective responsibility accounting system. The standards set affect prices
and profits. They affect the motivation of organizational members to achieve the firm's goals by affecting
how performance is evaluated. If standards are too tight or too loose, daily operational control activities
may not happen, and continuous, long-run productivity improvement may not result. Without a doubt, the
modern management accountant's role in the standard-setting process is one of the most difficult aspects
of his or her job.
Attributes Needed For A Job Cost ReportAttributes Needed For A Job Cost ReportAttributes Needed For A Job Cost ReportAttributes Needed For A Job Cost Report
Assuming you are in a company with a relational database driven accounting system, what attributes do
you need to add to the basic database tables in order to produce the Job Cost reports? Using the generic
REA template in Exhibit 5-22 to work on your answer. Include both the attribute and the table it would be
from.
SUMMARY OF LEARNING OBJECTIVES
The major goals of this chapter were to enable you to achieve five learning objectives:
Learning objective 1. Describe the role of the modern management accountant and the CAS in cost management.
The modern management accountant is part of a team that plans for the future, monitors and controls the
present, and evaluates past performance. Planning requires communication and coordination across func-
tional levels within an organization and across hierarchical levels. It starts with top management commu-
nicating objectives and goals. The management accountant works with different responsibility centers
19. These issues are considered in depth in Chapters 9 and 10 and in Part 111 of the text.

Page 256 COST AND MANAGEMENT ACCOUNTING
(cost, profit, investment) to establish budgets reflecting these goals. Cost management is concerned with
establishing standard costs, which motivate organizational members to control operations and strive for
continuous improvement.
Control and performance evaluation require that standards be used as benchmarks in identifying problems
and their resultant cost variances. The cost variance information should be reported in a timely and under-
standable way to those having responsibility and control over the variances. Operational control is facili-
tated by reporting cost variances in a real-time mode. Performance evaluation will more likely be accepted
by those being evaluated if they participated in setting the standards and believe the standards are attain-
able. Of course, any performance evaluation method must lead to rewards acceptable to those being evalu-
ated. Thus, the CAS is only one component of the organization's control system.
Traditionally, a management-by-exception philosophy has been used. This results in reporting cost vari-
ances. WCMs, and their management accountants, though, believe that the improvement in standards over
time should also be reported and used in performance evaluation to promote kaizen, continuous improve-
ment.
Learning objective 2. Define the components of a standard cost card, and list its benefits for cost management.
A standard cost is the budgeted cost for a manufacturing input item (cost element) to make one product, or
used in providing a service. Each cost element has its own standard cost. The sum of all cost elements'
standard costs is the standard absorptive manufacturing cost (SAMC). The standard cost of any input item
is calculated by multiplying its standard price by its standard quantity. The standard price is the budgeted
price to obtain one unit of that input (i.e., the budgeted price per pound for raw chocolate, or the budgeted
price for one hour of direct labor time). A standard quantity is the budgeted amount of an input to make
one product or provide a service.
Standard cost cards provide five benefits in cost management. First, setting standards focuses individuals
and groups on prices and quantities. Their efforts to eliminate non-value-added activities and learn how to
do things better promote kaizen. Second, standards provide the basis for performance evaluation. Third,
operational control is promoted by real-time reporting of variances from standards to those responsible for
controlling the activities causing the variances. Fourth, profit center managers need the standard absorptive
manufacturing cost to set sales prices. Fifth, the SAMC can be used in running the SCAS.
Learning objective 3. Calculate the standard price and quantity for direct materials and direct labor, and understand the issues involved in these calculations.
Exhibit 7 -10
InsideAgent
OutsideAgent
Event (-)
Event (+)
Duality
Stockflow
Resource
Resource
Stockflow
Control
Control
Agent
AgentOutside
Inside

CHAPTER 7
THE STANDARD COST ACCOUNTING SYSTEM PART I: SETTING STANDARDS PAGE 257
The standard price is the net delivered purchase price budgeted for direct materials. The direct labor stan-
dard price (rate) includes both the budgeted wage rate and the employer's payroll taxes and fringe benefits
associated with an hour of labor time. The standard quantity for materials and labor is calculated with the
following formula:
Standard quantity = Output specification / (1 - Normal input loss percentage)
Normal input loss is the anticipated scrap rate for direct materials and downtime for direct labor. This
standard quantity formula results in a practical standard. A theoretical, or ideal, standard quantity does not
include any allowance for normal input loss.
Ideal standards provide a benchmark for measuring continuous improvement over time, but may not moti-
vate employees if they do not believe the standards are attainable. For example, if the technology (equip-
ment) is not perfect, some material loss may always result. This is outside the control of the workers, and
they may not accept the use of an ideal standard to evaluate their performance as legitimate. Similarly, an
ideal standard for labor time may not include any allowance for necessary control activities that the orga-
nization really wants the workers to do. Further, ideal standards may lead to unrealistic budgets.
If the standard quantities include too much loss, though, they may be so loose that attaining them does not
support continuous improvement. Management and workers also may come to accept normal loss as a
condition that cannot be changed, inhibiting continuous improvement. When workers have been allowed
to participate in continuous improvement activities, companies have realized tremendous increases in pro-
ductivity.
Learning objective 4. Calculate the standard costs for variable and fixed overhead, and understand the issues involved in setting these standards.
Separate standard costs should be calculated for variable and fixed overhead because they are caused by
different decisions. Variable overhead is caused by short-run activities such as the number of purchase
orders that will have to be issued in the upcoming year (for purchasing department costs), the machine
time planned (for electricity and equipment repairs and maintenance), or the production quota (for VOH
costs such as indirect materials and labor). Thus, determining cause-effect relationships is the first step in
budgeting VOH costs.
Fixed overhead is often caused by long-run decisions, such as the size of the factory (building deprecia-
tion, insurance, and taxes) or the equipment and computer technologies in place (equipment depreciation,
insurance, taxes, and salaries of support labor). Identifying the individual FOH items is the first step in
budgeting these costs.
Once the causal bases for VOH and FOH are identified, their total costs can be budgeted. Usually, the
same basis is used for applying VOH and FOH to individual products. For example, if VOH is caused by
machine usage, then this basis may be used to apply VOH and FOH to products. Thus, both the VOH and
FOH PORs are calculated using budgeted VOH and FOH divided by budgeted machine hours. The stan-
dard quantity for VOH and FOH will then he the standard machine time for making a product.
Obtaining this information requires the coordinated and co-operative efforts of many organizational mem-
bers. When these group activities and decisions do not occur, the management accountant may have to
estimate VOH and FOH costs individually using historical cost data from the CAS. In many traditional
CASs, quantitative methods have been used to extrapolate historical data. These methods include the scat-
tergraph, high-low method, univariate (least squares) regression, and multivariate regression.
In budgeting total overhead with these quantitative methods, the management accountant must understand
the differences between variable, fixed, mixed, and step costs. Also, the resulting overhead cost equations
may have to be adjusted for changes in costs and technology over time. Finally, an understanding of the
various statistical problems associated with these methods is required.
Learning objective 5. Discuss the need for a manufacturing cost equation.
Although standard cost cards offer a number of benefits for budgeting and provide motivation to control
costs, if based on absorption costing, they cannot be used to budget total manufacturing costs. This costing
method includes a fixed overhead standard cost for each product. Fixed overhead does not behave in the
same manner as VOH. It is constant in total, whereas VOH is constant per unit. To budget total overhead
and the total costs of manufacturing a product (or providing a service), fixed and variable costs need to be
accounted for separately. This is accomplished by creating a cost equation as the second output of the cost
budgeting process. When the cost equation is combined with the standard cost card (the first output of the

Page 258 COST AND MANAGEMENT ACCOUNTING
cost budgeting process), the management accountant will have the necessary information to budget costs
and report on cost management activities.
Learning objective 6. Prepare a list of attributes needed in a relational database to capture Standard Costing information in an REA environment.
Developing a Standard Costing Accounting System in a relational database involves adding a number of
attributes to the basic tables and writing the reports. In this chapter we concentrate on learning about the
information needed for the SCAS. These should be seen as extensions of the basic model.
IMPORTANT TERMS
Absorption costing (full costing) A costing method that includes all costs of production, both variable
and fixed, in the cost of an individual product or service.
Cost behavior How costs change with changes in the activity volumes that cause those costs. The four
basic patterns are variable, fixed, mixed, and step costs.
Cost centers A responsibility center in which the manager has the authority to incur costs and is evaluated
on the basis of how well these costs are controlled.
Cost variance The difference between a standard cost and an actual cost. It is the financial measure of a
problem.
Cost variance reports Reports from an SCAS that compare standard and actual costs.
Decision The choice between two or more alternatives.
Dependent variable A variable that is predicted by an independent variable.
Expected annual capacity The level of activity (output) budgeted for the forthcoming year.
Fixed costs Costs that are constant in total, but decrease per unit as some activity basis (such as production
volume) increases.
High-low method A statistical technique that uses some measure of activity (an independent variable) to
predict cost (a dependent variable) based on the highest and lowest observations from a sample of
activity-cost observations.
Independent variable An activity that can be used to predict something else, such as a cost, that depends
upon its occurrence.
Investment centers Parts of an enterprise whose members are responsible for making investment deci-
sions. These centers are usually considered to be the highest level of management in the organiza-
tion's hierarchy.
Least squares method A statistical technique for predicting cost that uses all the cost-activity observa-
tions from a sample to create a univariate regression equation.
Management-by-exception A philosophy of reporting and control based on the belief that managers only
need information about what is going wrong within their responsibility centers, such as a cost
variance report. Its goal is to focus attention on problems.
Mixed costs Costs that are part variable and part fixed.
Multiple regression analysis A statistical technique that predicts something (a dependent variable) by cre-
ating an equation that uses more than one predictor (independent) variable.
Normal capacity The long-term, average output of the total enterprise.
Output specification (engineering or marketing specification) The amount of an input (cost element)
that should be in a completed product or service. It is also sometimes called an engineering or
marketing specification.
Practical capacity A feasible level of output of a department or plant, which is theoretical capacity less
ordinary, regular, and unavoidable operating interruptions.
Practical standards (currently attainable) These are achievable goals that can be accomplished with
effort.
Problem The difference between what is desired and what actually occurs. In cost accounting, it is a cost
variance.
Profit centers Responsibility centers of an enterprise whose members are responsible for cost manage-
ment and revenue generation, but not for investment decisions.
Rational decisions Alternative choices that lead to accomplishing a goal. Decisions can be rational but
also dysfunctional if they are not congruent with the goals of the organization.
Relevant range The range of activity (such as production volume) over which variable costs are assumed
to be constant per unit and fixed costs constant in total.

CHAPTER 7
THE STANDARD COST ACCOUNTING SYSTEM PART I: SETTING STANDARDS PAGE 259
Responsibility accounting An information system that reports on how well organizational members are
achieving the firm's goals.
Scattergraph method (scatterplot or scatter diagram) A method of estimating a cost equation by visu-
ally drawing a line through a plot (graph) of observations.
Standard absorptive manufacturing cost (SAMC) The sum of all the standard costs in making a prod-
uct or providing a service, including the standard fixed overhead cost.
Standard cost How much is budgeted for a particular input item (cost element) to make one product or
provide a service (i.e., one unit of output).
Standard cost card A document that reports the individual standard costs in making a product. Each
product or service should have its own standard cost card.
Standard price The budgeted price for one unit of an input, i.e., the budgeted net delivered purchase price
for direct materials, or the budgeted wage rate plus fringe benefits per hour, or the VOH POR and
FOH POR.
Standard quantity The budgeted amount of a cost element to make one product or render a service.
Step costs Costs that arc constant in total (fixed), but only over a short segment of the relevant range.
Theoretical capacity (ideal capacity) The estimated absolute maximum potential output of a department
or plant for a period.
Theoretical standards (ideal standards) Standards based on the best performance possible under exist-
ing operating conditions and with existing equipment.
Variable costs Costs that are constant per unit but increase in total with changes in some activity basis
such as production volume.
Variable costing (direct costing) A costing method that includes only variable manufacturing costs in the
cost of a product.
DEMONSTRATION PROBLEMS
DEMONSTRATION PROBLEM 1 Preparing the standard cost card and manufacturing cost equa-
tion.
As the new management accountant, you are required to prepare a standard cost card for the Donchalikeit
Candy Company's three-pound box of chocolates. You have gathered the following information from the
purchasing agent and personnel manager:
Historically, one-third of all chocolate input into the production process is lost during production. One
square foot of wrapping paper can make (produce) six cups (for chocolates). There are 30 cups in a three-
pound box of chocolates. Eighteen minutes of productive labor time is needed to make a box of candy.
Employees work eight hours a day and are allowed two 15-minute breaks plus 18 minutes to clean up each
day. Budgeted production volume is 17,833 boxes per year.
There are two overhead subsidiary general ledger accounts within WIP inventory, one for the entire fac-
tory's variable overhead and one for the entire factory's fixed overhead. Machine usage is the cost driver
for both overhead accounts. Forty-five minutes of machine time are budgeted to produce one box. The
controller obtained the following annual overhead information from her SCAS LAN, intending to use the
high-low method to perform a total overhead cost analysis:
Required:
a. Prepare the standard cost card for a box of chocolates.
Chocolate costs $1.50/lb.
Wrapping paper costs $0.10/square-foot sheet
Direct labor costs $6.00/DLhr
YEAR MACHINE HOURS COSTS
1988 8,000 $54,000
1989 7,500 61,000
1990 7,500 60,500
1991 10,000 61,750
1992 7,000 60,500
1993 11,000 67,000
1994 12,000 65,500
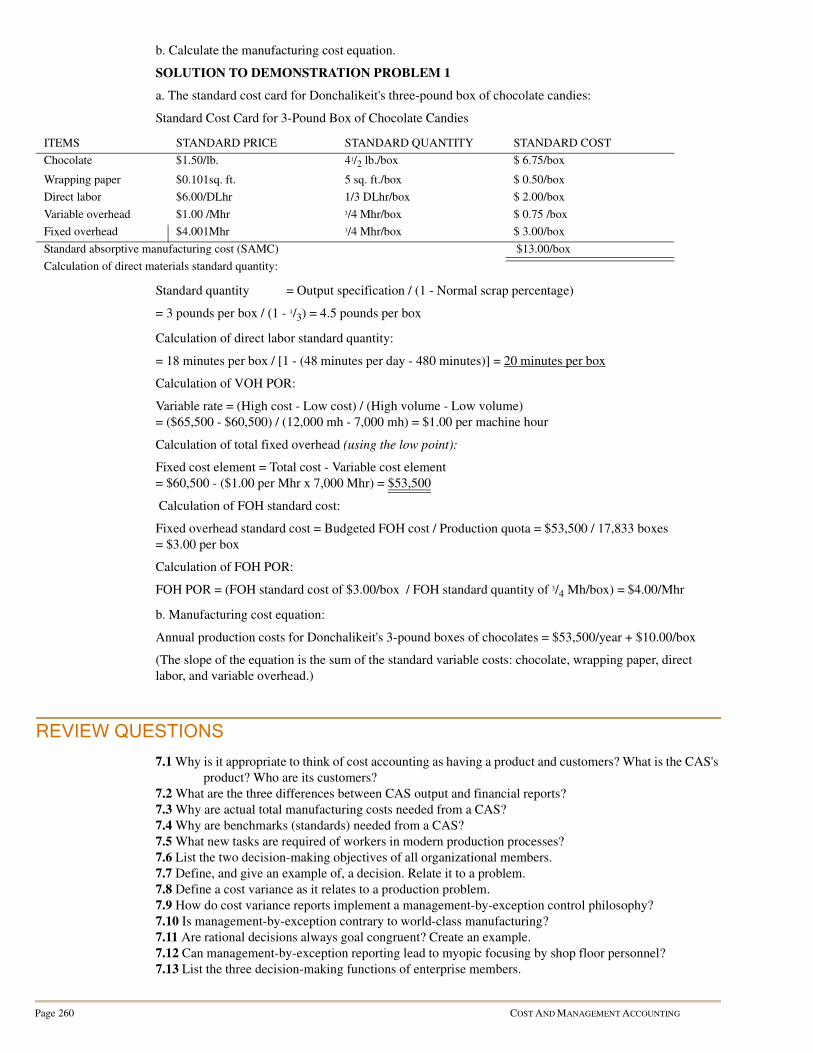
Page 260 COST AND MANAGEMENT ACCOUNTING
b. Calculate the manufacturing cost equation.
SOLUTION TO DEMONSTRATION PROBLEM 1
a. The standard cost card for Donchalikeit's three-pound box of chocolate candies:
Standard Cost Card for 3-Pound Box of Chocolate Candies
Standard quantity = Output specification / (1 - Normal scrap percentage)
= 3 pounds per box / (1 - 1/3) = 4.5 pounds per box
Calculation of direct labor standard quantity:
= 18 minutes per box / [1 - (48 minutes per day - 480 minutes)] = 20 minutes per box
Calculation of VOH POR:
Variable rate = (High cost - Low cost) / (High volume - Low volume)
= ($65,500 - $60,500) / (12,000 mh - 7,000 mh) = $1.00 per machine hour
Calculation of total fixed overhead (using the low point):
Fixed cost element = Total cost - Variable cost element
= $60,500 - ($1.00 per Mhr x 7,000 Mhr) = $53,500
Calculation of FOH standard cost:
Fixed overhead standard cost = Budgeted FOH cost / Production quota = $53,500 / 17,833 boxes
= $3.00 per box
Calculation of FOH POR:
FOH POR = (FOH standard cost of $3.00/box / FOH standard quantity of 3/4 Mh/box) = $4.00/Mhr
b. Manufacturing cost equation:
Annual production costs for Donchalikeit's 3-pound boxes of chocolates = $53,500/year + $10.00/box
(The slope of the equation is the sum of the standard variable costs: chocolate, wrapping paper, direct
labor, and variable overhead.)
REVIEW QUESTIONS
7.1 Why is it appropriate to think of cost accounting as having a product and customers? What is the CAS's
product? Who are its customers?
7.2 What are the three differences between CAS output and financial reports?
7.3 Why are actual total manufacturing costs needed from a CAS?
7.4 Why are benchmarks (standards) needed from a CAS?
7.5 What new tasks are required of workers in modern production processes?
7.6 List the two decision-making objectives of all organizational members.
7.7 Define, and give an example of, a decision. Relate it to a problem.
7.8 Define a cost variance as it relates to a production problem.
7.9 How do cost variance reports implement a management-by-exception control philosophy?
7.10 Is management-by-exception contrary to world-class manufacturing?
7.11 Are rational decisions always goal congruent? Create an example.
7.12 Can management-by-exception reporting lead to myopic focusing by shop floor personnel?
7.13 List the three decision-making functions of enterprise members.
ITEMS STANDARD PRICE STANDARD QUANTITY STANDARD COST
Chocolate $1.50/lb. 41/2 lb./box $ 6.75/box
Wrapping paper $0.101sq. ft. 5 sq. ft./box $ 0.50/box
Direct labor $6.00/DLhr 1/3 DLhr/box $ 2.00/box
Variable overhead $1.00 /Mhr 3/4 Mhr/box $ 0.75 /box
Fixed overhead $4.001Mhr 3/4 Mhr/box $ 3.00/box
Standard absorptive manufacturing cost (SAMC) $13.00/box
Calculation of direct materials standard quantity:

CHAPTER 7
THE STANDARD COST ACCOUNTING SYSTEM PART I: SETTING STANDARDS PAGE 261
7.14 What is the SCAS's role in responsibility accounting?
7.15 Distinguish between the three functional responsibility levels of management.
7.16 Explain the five criteria an SCAS must meet to be a high-quality responsibility accounting system.
7.17 What role does the SCAS play in control motivation?
7.18 In designing an SCAS, what ethical considerations arise?
7.19 Define a standard cost and its components.
7.20 What is the difference between a standard cost and a standard absorptive manufacturing cost?
7.21 List five benefits of a standard cost card.
7.22 Make up a product and calculate the standard price for one of its direct materials.
7.23 Are standard prices only useful in manufacturing enterprises?
7.24 Using the example product from Question 7.22, calculate the standard labor rate.
7.25 How does an output specification differ from a standard quantity?
7.26 What is the formula for a standard quantity based on an output specification?
7.27 Discuss the relationships between paid time, downtime, and productive time.
7.28 What is the difference between an ideal and a practical standard? Give an example of how they would
be different for direct labor.
7.29 List four reasons why practical standards support a high-quality SCAS.
7.30 What factors should be considered in determining how tight standards should be set? Discuss some of
the problems that may occur when standards are set too tight or too loose.
7.31 Explain why ideal standards support continuous improvement. Explain why practical standards may
not support continuous improvement.
7.32 Create an example of a nonvalue-added item that is included in a practical direct material standard
quantity.
7.33 How do learning curves affect the direct labor standard quantity?
7.34 How often would you revise a standard cost card?
7.35 Why should VOH and FOH be budgeted for separately?
7.36 What is the relationship between the VOH POR and the standard VOH price?
7.37 List five common causes of VOH. Give an example of a VOH item that could be caused by each of
these activities (bases for applying VOH to products).
7.38 In choosing an overhead budgeting and application base, what is the primary goal in SCAS design?
7.39 Why are CASs moving away from a direct labor application base for overhear?
7.40 Distinguish between and give an example of each of the four types of cost behavior patterns.
7.41 Why is a relevant range important in budgeting variable and fixed costs?
7.42 Create an example of a mixed cost. Make up some values and predict its total cost for some particular
volume you made up.
7.43 How does a step cost differ from a fixed cost?
7.44 Describe the four quantitative methods for analyzing past total overhead costs. Rank order them in
terms of quality predictions. Why is your order valid?
7.45 What is the difference between a dependent and an independent variable?
7.46 How do you determine the standard quantity for VOH and FOH?
7.47 What is the formula for a FOH standard cost based on budgeted production volume? Make up an
example.
7.48 Explain the difference between a standard variable manufacturing cost and a standard absorptive
manufacturing cost.
7.49 List two disadvantages of using a standard absorptive manufacturing cost in the budgeting process.
7.50 Distinguish between the four commonly used production volumes in the FOH standard cost. Which
would you choose for a high-quality SCAS?
CHAPTER-SPECIFIC PROBLEMS
These problems require responses based on concepts and techniques presented in the text.
7.51 Standard cost card. Define, relate and create a simple example of the components of a standard
absorptive manufacturing cost.
7.52 Ideal versus practical standards. Can ideal and practical standard quantities differentially affect cost
management and operational control motivations? Do you think the difference between them is really
important in designing a high-quality SCAS?

Page 262 COST AND MANAGEMENT ACCOUNTING
7.53 VOH allocation bases. Cite an example variable overhead cost that could result from each of the five
common allocation bases. Why are the bases appropriate for your examples?
7.54 Direct materials and labor standard costs. The production of one five-gallon container of Quikill
insecticide requires the use of direct materials as follows:
One container of Quikill also requires one direct labor hour in Department 1 and two direct labor hours in
Department 2. These are the productive times required in each department.
Required:
Calculate the standard cost card lines for direct materials and direct labor.
7.55 Direct materials and labor standard costs. The production of one seven-gallon container of Quikill
insecticide requires the use of direct materials as follows:
One container of Quikill also requires one and one-half direct labor hours in Department 1 and three direct
labor hours in Department 2.
Required:
Calculate the standard cost card lines for direct materials and direct labor.
7.56 Preparing a standard cost card. You are required to prepare a standard cost card for the Donchalikeit
Candy Company's one-pound box of chocolates. You have gathered the following information from the
purchasing agent and personnel manager:
The controller has prepared the following annual total overhead analysis for use with the high-low
method:
Historically, one-fourth of all chocolate input into the production process is lost during production. One
square foot of wrapping paper can make (produce) five cups (for chocolates). There are 30 cups in a one-
pound box of chocolates. Ninety-six minutes of a day's labor are non-productive time, and 12 minutes of
productive time is needed to make a box of candy. Budgeted production volume is 20,000 boxes per year.
MATERIAL A MATERIAL B
Output specification 6 lb 2 lb
Allowance for waste .5% .10%
Purchase price per pound $3.50 $5.00
Purchase discount 10% 5%
Delivery costs per pound $0.85 $1.25
DEPARTMENT 1 DEPARTMENT 2
Estimated hourly wages per employee $10.50 $13.12
Fringe benefits 25% 25%
Downtime (minutes per day): Setup 15 5
Cleanup 15 25
Breaks 30 30
MATERIAL X MATERIAL Y
Output specification 4 lb. 3 lb.
Allowance for waste 10% 5%
Purchase price per pound $6.50 $8.25
Purchase discount 2% 4%
Delivery costs $0.63 $0.08
DEPARTMENT 1 DEPARTMENT 2
Estimated wages per employee $8.75 $12.25
Fringe benefits 20% 30%
Downtime (minutes per day): Setup 20 30
Cleanup 25 30
Breaks 30 30
Chocolate costs $1.50/1b.
Wrapping paper costs $0.10/square-foot sheet
Direct labor costs $4.00/DLhr

CHAPTER 7
THE STANDARD COST ACCOUNTING SYSTEM PART I: SETTING STANDARDS PAGE 263
Required:
Calculate the manufacturing cost equation and prepare the standard cost card for a box of candy. Round all
calculations to the nearest cent.
7.57 Preparing a standard cost card. You are required to prepare a standard cost card for the Donchalikeit
Candy Company's basic lollipop. A completed lollipop has 4 ounces of candy mix in it and takes 36 min-
utes of productive time to make. Twenty percent of the candy mix input gets spilled before the lollipop is
formed. Candy mix costs $1.60 per pound. Laborers are paid $6 per hour and work eight hours per day.
They are allowed two 15-minute breaks each day, 5 minutes to setup in the morning, 5 minutes to cleanup
at night, and 8 minutes for other miscellaneous activities.
The controller has prepared the following annual total overhead analysis. Overhead is caused by machine
usage, and the standard quantity for machine time is one-half hour per lollipop. Annual production volume
is budgeted at 10,000 lollipops.
Required:
a. Prepare the standard cost card for a basic lollipop.
b. Calculate the manufacturing cost equation. Use the high-low method.
7.58 Questions about VOH and FOH standards. Describe the four capacity measures. What effect does
the capacity used to develop and apply overhead costs have on product costs? Explain your answer to each
of the following questions:
1. The numerator in the predetermined overhead rate is:
a. Estimated overhead costs.
b. Volume or level of activity.
c. Actual overhead costs.
d. Service department costs.
2. There are several alternative activity bases for overhead. Which activity base is not commonly used?
a. Direct labor cost.
b. Direct labor hours.
c. Machine hours.
d. Sales value.
3. Which capacity measure (production volume) results in the lowest fixed over-head standard cost?
a. Theoretical capacity.
b. Practical capacity.
c. Normal capacity.
d. Expected annual capacity.
4. In a labor-intensive company where more overhead costs are incurred by the more highly skilled and
paid employees, which activity base would he appropriate for budgeting a VOH POR?
YEAR DIRECT LABOR HOURS COSTS
1988 8,000 $54000
1989 12,000 62,000
1990 7,500 60,500
1991 10 000 61,750
1992 7,000 60,500
1993 11,000 62,500
1994 7,500 61,000
YEAR MACHINE HOURS COST
1988 12,500 $62,500
1989 12,000 62,000
1990 6,500 56,500
1991 10,000 61,750
1992 7,250 50,500
1993 11,000 62,750
1994 7,500 61,000

Page 264 COST AND MANAGEMENT ACCOUNTING
a. Direct labor hours.
b. Direct labor dollars (cost).
c. Machine hours.
d. Sales value.
7.59 Determination of the overhead rates. Tastee-Treat Company prepares, packages, and distributes six
frozen vegetables in two different sized containers. The different vegetables and different sizes are pre-
pared in large batches. The company employs a job order costing system. Manufacturing overhead is
assigned to batches by a predetermined rate on the basis of direct labor hours. The manufacturing overhead
costs incurred by the company during two recent years (adjusted for changes using current prices and wage
rates) are presented below:
Required:
a. Determine the total overhead cost equation using the high-low method.
b. What will the total overhead be for a 2,300,000 direct labor hour level of activity in 20x5?
c. Calculate the VOH, FOR, and TOH PORs.
d. Repeat Requirements (a. - c.) using your professional judgment instead of the high-low method.
Employee benefits are proportionately related to indirect labor and supervision.
[CMA adapted]
7.60 Regression analysis. The Pilot Shop is a catalogue business that provides a wide variety of aviation
products to pilots throughout the United States. Maynard Shephard, the recently hired management
accountant, has been assigned the task of developing a cost function to forecast shipping costs. The previ-
ous management accountant had forecast Shipping Department costs each year by plotting cost data
against direct labor hours for the most recent 12 months and visually fitting a straight line through the
points. The results have not been satisfactory.
After discussions with the Shipping Department personnel, Shephard decided that shipping costs may be
more closely related to the number of orders filled. Shephard based his conclusion on the fact that ten
months ago the Shipping Department added some automated equipment.
Furthermore, Shephard believed that using linear regression analysis would improve the forecasts of ship-
ping costs. Weekly cost data for the Shipping Department have been accumulated for the last 25 years and
adjusted for inflation. Shephard ran two regression analyses of the data, one using direct labor hours and
one using the number of cartons shipped. The information obtained from the two linear regressions fol-
lows:
The meanings of the notations used in the equations are as follows:
• SC = Total Shipping Department costs
• DL = Total direct labor hours
• NR = Number of cartons shipped
20x3 20x4
Direct labor hours worked 2,760,000 2,160,000
Manufacturing overhead costs incurred (adjusted for
changes in current prices and wage rates):
Indirect labor $11,040,000 $ 8,640,000
Employee benefits 4,140,000 3,240,000
Supplies 2,760,000 2,160,000
Power 2,208,000 1,728,000
Heat and light 552,000 552,000
Supervision 2,865,000 2,625,000
Depreciation 7,930,000 7,930,000
Property taxes and insurance 3,005,000 3,005,000
Total overhead costs $34,500,000 $29,880,000
EQUATION 1 EQUATION 2
Equation SC = 804.3 + 15.68DL SC = 642.9 + 3.92NR
Coefficient of correlation .604 .854
Coefficient of determination .365 .729
Standard error of the estimate 2.652 1.884

CHAPTER 7
THE STANDARD COST ACCOUNTING SYSTEM PART I: SETTING STANDARDS PAGE 265
Required:
a. Identify which cost function the Pilot Shop should adopt for forecasting total Shipping Department
costs and explain why.
b. If the Pilot Shop projects that 600 cartons will be shipped in the coming week, calculate the total Ship-
ping Department cost using the appropriate regression equation.
c. Explain why linear regression analysis is better than a scatter diagram of the data points for forecasting
total Shipping Department costs.
7.61 Cost behavior patterns. Review the following graphs. The vertical axes of the graphs represent total
cost, and the horizontal axes represent activity or production volume. Choose the appropriate cost behav-
ior pattern for each of the ten cost elements that follow.
Note: two of the graphs actually violate graphing theory. Can you identify them? For the questions below
assume that they are drawn correctly.
1. Depreciation of equipment, where the amount of depreciation charged is computed by the machine
hours method.
2. Electricity bill - a flat fixed charge, plus a variable cost after a certain number of kilowatt hours are
used.
3. City water bill, which is computed as follows:
• First 1,000,000 gallons or less $1.000 flat fee
• Next 10,000 gallons 0.003 per gallon used
• Next 10,000 gallons 0.006 per gallon used
• Next 10,000 gallons 0.009 per gallon used
4. Cost of lubricant for machines, where cost per unit decreases with each pound of lubricant used (for
example, if one pound is used, the cost is $10; if two pounds are used, the cost is $19.98; if three
pounds are used, the cost is $29.94; with a minimum cost per pound of $9.25).
5. Depreciation of equipment, where the amount is computed by the straightline method. When the depre-
ciation rate was established, it was anticipated that the obsolescence factor would be greater than
the wear and tear factor.
6. Rent on a factory building donated by the city, where the agreement calls for a fixed fee payment unless
200,000 labor hours are worked, in which case no rent needs to be paid.
7. Salaries of repair crew, where one repair person is needed for every 1,000 hours of machine time or less
(that is, 0 to 1,000 hours requires one repair person, 1,001 to 2,000 hours requires two, and so
on).
8. Federal unemployment compensation taxes for the year, where the labor force is constant in number
throughout the year (average annual salary is $10,000 per worker). Only the first $4,200 earned is
subject to tax.
9. Cost of raw material used.
10. Rent on a factory building donated by the county, where the agreement calls for rent of $100,000 less
$1 for each direct labor hour worked in excess of 200,000 hours, but a minimum rental payment
a b c d
e f g h
i j k l

Page 266 COST AND MANAGEMENT ACCOUNTING
of $20,000 must be paid.
[AICPA adapted]
7.62 High-low method. Joel Corporation has gathered the following data on the cost of electricity and
direct labor hours worked for the past six months:
Required:
Using the high-low method, calculate the overhead cost equation for electricity.
7.63 High-low method for estimating costs. The Tahoe Hotel's guest-days of occupancy and custodial
supplies costs over the last six months were as follows:
Required:
a. Using the high-low method, determine the cost equation for custodial supplies cost.
b. What amount of custodial cost would you expect to be incurred at an occupancy level of 11,500 guest-
days?
7.64 High-low method and scattergraph method. The following data relating to units shipped and total
shipping cost have been collected by the management accountant at the Clarkson Company:
Required:
a. Using the high-low method, determine the cost equation for shipping costs.
b. For the scattergraph method, do the following:
1. Prepare a scattergraph using the data given. Fit a line to your plotted data points by visual
inspection.
2. Using the data from your scattergraph, determine the approximate variable cost per unit shipped
and the approximate fixed cost per month.
7.65 Simple regression analysis. The management accountant finds that the intersection of the line of best
fit for total overhead with the y-axis is $10,000. The slope of the regression line is .20. The independent
variable, direct labor cost, amounts to $600,000 for the month.
Month Cost Of Electricity Direct Labor Hours
January $ 15,000 3,000
February 14,000 2,200
March 17,000 2,800
April 20,000 3,800
May 17,500 2,700
June 18,300 2,900
Totals $101,800 17,400
Month Guest-days Of
Occupancy
Custodial Sup-
plies Cost
January 4,400 $ 8,000
February 6,800 9,000
March 8,200 11,200
April 10,800 12,800
May 12,400 14,200
Julie 9,400 11,800
Month Units
Shipped
Total Shipping
Cost
March 400 $2,000
April 700 2,800
May 500 1,900
June 600 2,500
July 800 3,000
August 900 3,750
September 300 1,800
October 490 2,100

CHAPTER 7
THE STANDARD COST ACCOUNTING SYSTEM PART I: SETTING STANDARDS PAGE 267
Required:
What is the estimated total overhead for the month?
7.66 Simple regression analysis. The management accountant at Gilland Company derived the following
cost relationship from a regression analysis of the company's monthly manufacturing overhead costs:
Monthly manufacturing overhead costs = $90,000 + $10/Mhr
The standard error of the estimate of the regression line is $5,000. The standard time required to manufac-
ture one six-unit case of Gilland's single product is four machine hours. Gilland applies manufacturing
overhead to production on the basis of machine hours, and its normal annual production is 60,000 cases.
Required:
a. Estimate the total manufacturing overhead cost for a month in which scheduled production is 5,000
cases.
b. What is Gilland's predetermined fixed manufacturing overhead rate?
c. What is the VOH standard cost?
7.67 Variable and fixed costs estimating methods. Barco has a separate maintenance department that per-
forms all routine and major repair work on the company's machines. The maintenance cost is primarily a
function of machine hours worked in various production departments. The maintenance cost incurred and
the actual machine hours worked during the first six months of 20x3 are as follows:
Required:
a. Draw a scattergraph depicting the preceding data.
b. Compute the VOH FOR for maintenance cost per machine hour and fixed maintenance cost per month
using the high-low method.
c. Compute VOH POR for maintenance cost per machine hour and fixed maintenance cost per month
using the least squares method from a calculator or spreadsheet program.
7.68 Regression analysis. In preparing the annual profit plan for the coining year, Wilkens Company
wants to determine the cost behavior pattern of its maintenance costs. Wilkens has decided to use linear
regression. The prior year's data regarding maintenance hours and costs and the results of the regression
analysis are as follows:
Month Maintenance Cost
(Y)
Machine Hours
(X)
January $4,000 900
February 4,000 1,000
March 2,000 500
April 6,000 1,500
May 5,000 1,200
June 3,000 600
Month Hours Of
Activity
Maintenance
Costs
January 480 $ 4,200
February 320 3.000
March 400 3,600
April 300 2,820
May 500 4,350
June 310 2,960
July 320 3,030
August 520 4,470
September 490 4,260
October 470 4,050
November 350 3,300
December 340 3,160

Page 268 COST AND MANAGEMENT ACCOUNTING
Required:
a. In the standard regression equation Y = a + bX, the letter “b” is best described as a(n):
• 1. Independent variable.
• 2. Dependent variable.
• 3. Constant coefficient.
• 4. Variable coefficient.
• 5. Coefficient of determination.
b. The letter “X” in the standard regression equation is best described as a(n):
• 1. independent variable.
• 2. Dependent variable.
• 3. Constant coefficient.
• 4. Variable coefficient.
• 5. Coefficient of determination.
c. Based upon the data derived from the regression analysis, 420 maintenance hours in a month would
mean the maintenance cost (rounded to the nearest dollar) would be budgeted at:
• 1. $3,780.
• 2. $3,600.
• 3. $3,790.
• 4. $3,746.
• 5. $3,756.
d. The percentage of the total variance that can be explained by the regression equation is:
• 1. 99.724%.
• 2. 69.613%.
• 3. 80.982%.
• 4. 99.862%.
• 5. Some amount other than those given above.
[CMA adapted]
THINK-TANK PROBLEMS
Although these problems are based on chapter material, reading extra material, reviewing previous chap-
ters, and using creativity may be required to develop workable solutions.
7.69 Accounting for production problems with cost variances. Define a cost variance, and create an
example of how a production problem causes multiple cost variances. Make up some simple costs, and
demonstrate how the total cost variance from your example problem can be calculated and reported to the
shop floor. What type of technology platform and ICBIS would you design to support shop floor opera-
tional control, performance evaluation, and future budgeting?
7.70 CAS ERD and motivation. It an entity relationship diagram of the control process was prepared, what
would be its entities, given the goal of supporting a kaizen motivation? What role does the SCAS play in
the motivation cause-effect chain?
Totals 4,800 $43,200
Average 400 $ 3,600
Average cost per hour $ 9.00
a 684.65
b 7.2884
Standard error of a 49.515
Standard error of b .12126
Standard error of the estimate 34.469
r2 .99724
CHAPTER 7
THE STANDARD COST ACCOUNTING SYSTEM PART I: SETTING STANDARDS PAGE 269
7.71 High-quality information. Consider the characteristics of high-quality information, the two decision-
making objectives, and the three decision-making functions of all employees. How can a standard cost
card support a high-quality SCAS?
7.72 Statistical analysis of overhead. Discuss the ramifications of using statistical methods to analyze past
overhead costs. Why are these methods used? What would you do to overcome these potential problems in
designing a high-quality SCAS?
7.73 Standards in nonmanufacturing enterprises. Explain how an SCAS is applicable in an enterprise
that routinely manufactures the same products or performs the same services. Are standard costs applica-
ble to companies that make an array of unique products or perform one-of-a-kind services? Are standard
costs useful for construction companies, consultants, repair shops, and hospitals?
7.74 Participation of workers in setting standards. Reid Corporation, a diversified manufacturing firm,
has been experiencing decreasing profits and market share for the past two years. The company president,
Kristin Johnson, has hired a management accounting consultant to report on the operations of three of
Reid's manufacturing plants. The consultant has made several visits to each of the plants and has recently
compiled his findings in a report to Johnson. The consultant observed that the levels of employee partici-
pation vary considerably throughout the organization and presented the following examples:
• At the western plant, where small appliances are manufactured, a standard cost system was recently
implemented. The steps used by the plant manager to establish the standards provided for employee par-
ticipation at all points during the process. Despite these efforts, the employee perception is that the final
standards were imposed by top management to satisfy some overall corporate goal.
• At the southern plant, where heavy equipment is assembled, stop buttons have been installed on the
assembly line to allow workers to correct problems immediately. This enables the employees to have
greater control over their work, and, as a consequence, the workers perceive greater involvement in all
facets of decision making.
• At the northern plant, a metal-stamping facility, costs have risen and product quality has declined to the
point where the products are no longer competitive. The employees have little sense of commitment to
the company as most jobs are routine and uninteresting. The plant is experiencing high employee turn-
over and excessive absenteeism. Some plant workers have suggested that the formation of quality circles
might improve the situation.
Required:
a. Describe four factors that generally determine the level of employee participation in an organization's
control systems.
b. Recommend ways to modify the standard cost system at the western plant in order to increase employee
participation and gain wider acceptance of the standards.
c. Other than those mentioned above, describe the benefits that have accrued to the southern plant from the
installation of the stop buttons on the assembly line. (Review Jidoka in Chapter 2.)
d. Explain how the northern plant and its employees could benefit from the introduction of quality circles.
[CMA adapted]
7.75 Characteristics of a standard cost system.[CMA adapted] Some executives believe that it is
extremely important to manage “by the numbers.” This form of management requires that all employees
with departmental or divisional responsibilities spend time understanding the company's operations and
how they are reflected in the company's financial reports. As a manager's comprehension of the financial
reports and the activities that they represent increases, his or her subordinates will become more attuned to
the meaning of financial reports and the important signposts that can be detected in them. Companies uti-
lize a variety of numerical measurement systems including standard costs, financial ratios, human
resource forecasts, and operating budgets.
Required:
a. Respond to the following:
• 1. Discuss the characteristics that should be present in a standard cost system in order to encourage posi-
tive employee motivation.
• 2. Discuss how a standard cost system should be implemented to positively motivate employees,
b. The use of variance analysis often results in management-by-exception.
• 1. Explain the meaning of management-by-exception.
• 2. Discuss the behavioral implications of management-by-exception.

Page 270 COST AND MANAGEMENT ACCOUNTING
c. Explain how employee behavior could be adversely affected when “actual to budget” comparisons.are
used as the basis for performance evaluation.
7.76 Advantages and disadvantages of a standard cost system. [CMA adapted] Mark-Wright, Inc. (MWI)
is a specialty frozen-food processor located in the midwestern states. Since its founding in 1992, MWI has
enjoyed a loyal local clientele that is willing to pay premium prices for the high-quality frozen foods it pre-
pares from specialized recipes. In the last two years, the company has experienced rapid sales growth in its
operating region and has had many inquiries about supplying its products on a national basis. To meet this
growth, MWI expanded its processing capabilities, which resulted in increased production and distribution
costs. Furthermore, MWI has been encountering pricing pressure from competitors outside its normal mar-
keting region.
As MWI desires to continue its expansion, Jim Condon, CEO, has engaged a consulting firm to assist the
company in determining its best course of action. The consulting firm concluded that, while premium pric-
ing is sustainable in some areas, if sales growth is to be achieved, MWI must make some price conces-
sions. Also, in order to maintain profit margins, costs must be reduced and controlled. The consulting firm
recommended the institution of a standard cost system that would also facilitate a flexible budgeting sys-
tem to better accommodate the changes in demand that can be expected when serving an expanding market
area.
Condon met with his management team and explained the recommendations of the consulting firm. Con-
don then assigned the task of establishing standard costs to his management team. After discussing the sit-
uation with their respective staffs, the management team met to review the matter.
Jane Morgan, purchasing manager, advised that meeting expanded production would necessitate obtaining
basic food supplies from other than MWI's traditional sources. This would entail increased raw material
and shipping costs and may result in lower-quality supplies. Consequently, these increased costs would
have to be made up by the processing department if current cost levels are to be maintained or reduced.
Stan Walters, processing manager, countered that the need to accelerate processing cycles to increase pro-
duction, coupled with the possibility of receiving lower-grade supplies, can be expected to result in a slip
in quality and a greater product rejection rate. Under these circumstances, per unit labor utilization cannot
be maintained or reduced, and forecasting future unit labor costs becomes very difficult.
Tom Lopez, production engineer, advised that if the equipment is not properly maintained and thoroughly
cleaned at prescribed daily intervals, it can be anticipated that the quality and unique taste of the frozen-
food products will be affected. Jack Reid, vice president of sales, stated that if quality cannot be main-
tained, MWI cannot expect to increase sales to the levels projected.
When Condon was apprised of the problems encountered by his management team, he advised them that if
agreement could not be reached on appropriate standards, he would arrange to have the standards set by
the consulting firm and everyone would have to live with the results.
Required:
a.
• 1. List the major advantages of using a standard cost system.
• 2. List disadvantages that can result from using a standard cost system.
b.
• 1. Identify those who should participate in setting standards and describe the benefits of their participa-
tion in the standard-setting process.
• 2. Explain the general features and characteristics associated with the introduction and operation of a
standard cost system that make it an effective tool for cost control.
c. What could be the consequences if Jim Condon, CEO of MWI, has the standards set by the outside con-
sulting firm?
7.77 Standard costs and ethics. [CMA adapted] Quincy Farms is a producer of items made from local
farm products that are distributed to supermarkets. For many years, Quincy's products have had strong
regional sales on the basis of brand recognition; however, other companies have begun marketing similar
products in the area, and price competition has become increasingly important. Doug Gilbert, the manage-
ment accountant, is planning to implement a standard cost system for Quincy arid has gathered consider-
able information from his co-workers on production and material requirements for Quincy's products.

CHAPTER 7
THE STANDARD COST ACCOUNTING SYSTEM PART I: SETTING STANDARDS PAGE 271
Gilbert believes that the use of standard costing will allow Quincy to improve cost control and make better
pricing decisions.
Quincy's most popular product is strawberry jam. The jam is produced in ten-gallon batches, and each
batch requires six quarts of good strawberries. The fresh strawberries are sorted by hand before entering
the production process. Because of imperfections in the strawberries and normal spoilage, one quart of
berries is discarded for every four quarts of acceptable berries. Three minutes is the standard direct labor
time for the sorting that is required to obtain one quart of acceptable strawberries. The acceptable straw-
berries are then blended with the other ingredients; blending requires 12 minutes of direct labor time per
batch. After processing, the jam is packaged in quart containers. Gilbert has gathered the following infor-
mation from Joe Adams, Quincy's cost accountant, relative to processing the strawberry jam:
• Quincy purchases strawberries at a cost of $0.80 per quart. All other ingredients cost a total of $0.45 per
gallon.
• Direct labor is paid at the rate of $9.00 per hour.
• The total cost of material and labor required to package the jam is $0.38 per quart.
Adams has a friend who owns a strawberry farm that has been losing money in recent years. Because of
good crops, there has been an oversupply of strawberries, and prices have dropped to $0.50 per quart.
Adams has arranged for Quincy to purchase strawberries from his friend and hopes that $0.80 per quart
will put his friend's farm in the black.
Required:
a. Develop the standard cost for the direct cost components of a ten-gallon batch of strawberry jam. The
standard cost should identify the following for each direct cost component of a batch of strawberry jam:
• 1. Standard quantity.
• 2. Standard rate.
• 3. Standard cost per batch.
b. Citing the specific standards of competence, confidentiality, integrity, and/or objectivity from Standards
of Ethical Conduct for Management Accountants, explain why Joe Adams's behavior regarding the cost
information provided to Doug Gilbert is unethical.
7.78 Regression analysis. [CMA adapted] Elisko, Inc., is a major book distributor that ships books
throughout the United States. Elisko's Shipping Department consists of a manager plus ten other perma-
nent positions-four supervisors and six loaders. The four supervisors and six loaders provide the minimum
staff and frequently must be supplemented by additional workers, especially during the weeks when the
volume of shipments is heavy. Thus, the number of people shipping the orders frequently averages over 30
per week, i.e., 10 permanent employees plus 20 temporary workers. The temporary workers are hired
through a local agency.
Elisko must use temporary workers to maintain a minimum daily shipment rate of 95% of orders pre-
sented for shipping. The loss of efficiency from using temporary workers is minimal, and the $10.00 per
hour cost of temporary workers is less than the $15.00 per hour for the loaders and $22.50 per hour for the
supervisors on Elisko's permanent staff. The agency requires Elisko to utilize each temporary worker for
at least four hours each day.
Jim Locter, shipping manager, schedules temporary help based on forecasted orders for the coming week.
Supervisors serve as loaders until temporary help is needed. A supervisor stops loading when the ratio of
loaders to supervisors reaches 7: 1. Locter knows that he will need temporary help when the forecasted
average daily orders exceed 300. Locter has frequently requested from two to four extra temporary work-
ers per day to guard against unexpected rush orders. If there was not enough work, he would dismiss the
extra people at noon after four hours of work.
The agency has not been pleased with Locter's practice of overhiring and has notified Elisko that it is
changing its policy. From now on, if a person is dismissed before an eight-hour assignment is completed,
Elisko will still be charged for an eight-hour day plus mileage back to the agency for reassignment. This
policy will go into effect the following week.
Paula Brand, general manager, called Jim Locter to her office when she received the notice from the
agency. She told Locter, “Your staffing has to be better. This penalty could cost us up to $300-$500 per
week in labor cost for which we receive no benefit. Why can't you schedule better?”

Page 272 COST AND MANAGEMENT ACCOUNTING
Locter replied, “I agree that the staffing should be better, but I can't do it accurately when there are rush
orders. By being able to lay off people at noon, I have been able to adjust for the uncertain order schedule
without cost to the company. Of course, the agency's new policy changes this.”
Locter and Brand contacted Elisko's controller, Mitch Berg, regarding the problem of how to estimate the
number of people needed each week. Berg realized that Locter needed a quick solution until he could study
the work flow. Berg suggested a regression analysis using the number of orders shipped as the independent
variable and the number of workers (permanent plus temporary) as the dependent variable. Berg indicated
that data for the past year were available and that the analysis could be done quickly on the Accounting
Department's PC.
Berg completed the two regression analyses presented below. The first regression was based on the data for
the entire year. The second regression excluded the weeks when only the 10 permanent employees were
used; these weeks were unusual and appeared to be out of the relevant range.
Regression Equation W = a + bS
Where: W = Total workers (permanent plus temporary) S = Orders shipped
Locter was not familiar with regression analysis and, therefore, was unsure of how to implement this tech-
nique. He wondered which regression data he should employ, i.e., which one was better. When Locter rec-
ognized that the regression was based on actual orders shipped by week, Berg told him he could use the
forecasted shipments for the week to determine the number of workers needed.
Required:
a. Using Regression 1 based on data from a full year, calculate the number of temporary workers Jim
Locter would plan to hire for a forecast indicating 1,200 shipments per day.
b. Which of the two regressions appears to be better? Explain your answer.
c. Explain the circumstances under which Jim Locter can use the regression in his planning for temporary
workers.
d. Explain whether the regression analysis that Elisko employed in this situation could he improved. If it
cannot be improved, explain why.
7.79 Spreadsheet program for standard cost card. Refer to the spreadsheet program in Exhibit 8-11. It
contains a current standard cost card and a manufacturing cost equation. Create a spreadsheet program to
produce this part of the report. Use the information in Problems 7.56 and 7.57 to test the program.
Regression 1 (Daily Data
For 52 Weeks)
Regression 2 (Daily Data
for 38 Weeks)
a 5.0620 0.4890
b 0.0230 0.0280
Standard error (Se) of the estimate for W 2.0120 0.4320
95% confidence for W 3.9430 0.8480
Coefficient of determination (r2) 0.9620 0.9980
Standard error of coefficient (Sb) 0.0007 0.0002