chapter 66: highway asset management - freefreeit.free.fr/the civil engineering handbook,2003/0958...
TRANSCRIPT

66Highway Asset
Management
66.1 Introduction66.2 Financial Accounting Issues
The Modified Approach for Highway Asset Valuation • The Depreciation Approach for Highway Asset Valuation
66.3 Dimensions of Highway Asset Management Highway Physical Facilities • Operational Functions • System Objectives
66.4 Component Management Systems for Highway Asset ManagementPavement Management Systems • Bridge Management Systems • Maintenance Management Systems • Congestion Management System • Safety Management System
66.5 General Requirements of Highway Asset Management SystemConclusion
66.1 Introduction
The United States has nearly 4 million miles of highways and streets and more than 550,000 bridges ofat least a 20-ft span. Constituting the largest government-owned asset in the country, highways areassociated with annual investment levels exceeding $1 trillion [FHWA and AASHTO, 1996]. Transpor-tation agencies at all levels of government have the responsibility of effectively managing the performanceand usage of their physical assets so that such assets can be kept in acceptable condition to providedesirable levels of service with available resources. Given the ever-increasing commercial and personaltravel demands vis-à-vis limited resources, this task is more critical than ever before. Management ofhighways has come of age because of changes in the transportation environment, changes in publicexpectations, and extraordinary advances in technology. Defined as a systematic process of maintaining,upgrading, and operating physical assets cost-effectively [FHWA, 1999], highway asset managementcombines engineering principles with sound business practices and economic theory and provides a toolto facilitate a more organized, logical, and integrated approach to decision making. The recent issuanceof Governmental Accounting Standards Board Statement 34 (GASB34) established new financial report-ing requirements for state and local governments to ensure safekeeping and appropriate use of publicresources and operational accountability [GASB, 1999]. GASB34 therefore helped usher in a new era inhighway asset management. While most state and local highway asset management systems are in theirnascent stages of development, the various component management systems that will ultimately constitutean overall highway management system are fairly well developed in most states. These include pavement,bridge, maintenance, traffic, and safety management systems. A discussion of the three dimensions
Zongzhi LiPurdue University
Samuel LabiPurdue University
Kumares C. SinhaPurdue University
© 2003 by CRC Press LLC
66
-2
The Civil Engineering Handbook, Second Edition
(physical facilities, operational functions, and system objectives) that are associated with the variousmanagement systems is presented in this chapter.
66.2 Financial Accounting Issues
Historically, public agencies have not calculated the value of their infrastructure for three reasons:(i) provision of the infrastructure was for the benefit of individuals and groups external to the providingagency, (ii) agencies were not held accountable for the stewardship of the value of their infrastructure,and (iii) revenue was not often linked to maintaining the value of the infrastructure. GASB34 provideda new financial model for state and local governments and required all such agencies to provide a valueof the infrastructure assets, among others. Considered the most significant pronouncement in the historyof government financial reporting, GASB34 constitutes a vital part of overall financial accounting stan-dards and government accounting standards. These standards are aimed at assessing public accountabilityfor resources collected and spent, identifying how the choices of state and local governments affect theirfinancial positions, assessing the levels of service that can be provided, and determining whether thegovernments can meet obligations when they are due.
It is expected that GASB34 will result in the generation of useful information that will educate andguide the public, including issuers, auditors, and users of government financial reports — citizens andtheir representatives, the municipal bond industry, and investors among them. The relationship betweenGASB34 and highway asset management is reflected in the requirement that government-wide financialstatements should include a statement of net assets that includes highway infrastructure. Furthermore,highway infrastructure expenditure is no longer treated as sunk costs but is considered as a capital costor expense item, therefore providing a new accounting perspective of such costs. The key elements ofinfrastructure reporting for GASB are an inventory of the assets (type and extent) and a valuation of theassets. The valuation of highway assets, apart from satisfying the requirements of GASB34, is expectedto ensure accountability of stewardship responsibilities of such assets, enable cross-category investmentcomparisons, ensure budget justification and requests, and foster strategic investment decision making[Maze, 2001]. There are two major approaches for assessing the value of highway assets: the modifiedapproach and the depreciation approach [GASB, 1999].
The Modified Approach for Highway Asset Valuation
This approach assumes that the asset is preserved approximately at or above prescribed condition standardsthrough timely maintenance and rehabilitation. Agencies that use this approach do not have to accountfor depreciation if they can demonstrate that the asset is being preserved. For financial reporting purposes,initial construction and major improvement costs are capitalized, while preservation and maintenanceoutlays are treated as expenses. This approach focuses attention on asset management practices andpreservation outcomes. It is expected that asset preservation can be demonstrated by maintaining up-to-date records of the inventory, condition, and costs (budgeted and incurred) to preserve the assets.
The Depreciation Approach for Highway Asset Valuation
This approach assumes gradual deterioration of the asset over its service life and consequently reducesthe recorded value of the asset on the balance sheet through depreciation. In this approach, initialconstruction, improvement, and preservation costs are capitalized, while maintenance is considered anexpense. The current value of the asset is established using an appropriate deterioration function. Thedepreciation approach requires data such as initial costs, estimated salvage value, expected service life,current age of the asset, and remaining service life.
Summing up, it is apparent that GASB34 provides a major impetus for applying financial assetmanagement practices to state and local infrastructure and has far-reaching implications on the man-agement of highway assets. For instance, it is envisaged that state and local governments will demand
© 2003 by CRC Press LLC

Highway Asset Management
66
-3
greater authority over allocation of federal aid funds and that valuation-based securitization of infra-structure expenditure will help pay for compliance efforts and rehabilitation [Dornan, 2001]. Further-more, the establishment of a common framework for developing a comprehensive database and decisionsupport system is foreseen. Through such developments, it is expected that highway asset managementwill support economic development in a more visible and cost-effective manner. It is also envisaged thathighway assets will be better planned, designed, and maintained to ensure maximum possible levels ofservice at minimum possible life cycle cost (LCC). Other expectations are that bond financing for highwayassets will become more feasible as the value of the assets become known, predictions of life cycle costswill be more reliable, and private sector financial discipline can be infused into highway asset manage-ment. Finally, as the public sector gets more and more involved in highway asset management throughoutsourcing of line functions, financial participation, or possible asset ownership or operation, overallcosts could be lowered and funding for asset repair or replacement would be made more available.
66.3 Dimensions of Highway Asset Management
Sinha and Fwa [1989] defined the concept of a comprehensive highway system management, which canbe considered in terms of a three-dimensional matrix structure, with dimensions representing highwayfacilities, operational functions, and system objectives, as shown in Fig. 66.1.
Highway Physical Facilities
Any highway system involves a number of physical facilities, such as pavements, bridges, drainage struc-tures, traffic control devices, and roadside elements. Each facility plays a unique role in the delivery oftransportation services. For instance, pavements, bridges, and drainage structures carry traffic. Trafficcontrol devices foster smooth traffic flow and safety, and roadside elements enhance convenience andaesthetics. Each highway physical facility is associated with one or more component management systemsof highway asset management. Activities performed on pavements, bridges, and drainage structuresunavoidably affect flows of traffic and cause delay to road users. Maintenance and rehabilitation activitiesrelated to roadside elements and some traffic control devices may, however, be managed without majortraffic disruption. The differences between highway facilities are reflected in their life cycle spans. Thevaried life cycle spans among the facilities, coupled with the differences in the types of services theyprovide, necessitate the adoption of different management strategies for each facility. Consequently, it iscommon practice in field operations to consider management of different facilities independently. Fur-thermore, the multiple-element structure of highway facilities implies that several facilities compete forfunds and other resources available to a highway agency. The overall effectiveness of the highway systemdepends on the levels of service provided by the individual facilities. As resources are limited, optimal
FIGURE 66.1 Three-dimensional matrix structure of a highway asset management system.
Func
tion
1Fu
nctio
n 2
Func
tion
3Fu
nctio
n 4
Func
tion
5Fu
nctio
n 6
Func
tion
7
Facility 1Facility 2Facility 3
Facility 4
Objective 1
Objective 2
Objective 3
Objective 4
Objective 5
Objective 6
© 2003 by CRC Press LLC

66
-4
The Civil Engineering Handbook, Second Edition
allocation among the various facilities must be ensured. Any activity on each facility element has animpact in the realization of system objectives of highway asset management. Therefore, the relativeimportance of each facility element needs to be assessed for a logical resource allocation.
Operational Functions
An operational function is an activity carried out on or related to a highway facility in order to achievea system objective. In the management of each highway facility element, the following operationalfunctions are involved: planning, design, construction, condition and usage monitoring and evaluation,maintenance, rehabilitation, and data management. Each operational function is related to one or morecomponent management systems of highway asset management. The planning phase involves the prep-aration of capital expenditure programs for highways based on overall network needs, such as facilityexpansion and system preservation. This phase also covers demand analysis and estimation of facilityneeds to accommodate the current and future traffic. There are several priority programming methodsavailable for selecting highway capital projects. However, project selection is currently often carried outon the basis of historical trends or regional needs estimates. The operational functions associated withdesign generate alternative facility configurations, analyze the alternatives, and evaluate and select theoptimal configuration. Construction involves the management of funds, time, manpower, materials, andequipment to transform designs into physical realities. The major aspects of the construction functionare preparation of specifications and contract documents, scheduling of construction activities, controlof costs and quality of construction, and monitoring of work progress. Operational functions relating tofacility condition and usage monitoring and evaluation, as well as to facility maintenance and rehabili-tation, are currently the main focus of most facility management systems in the United States. Conditionevaluation includes facility condition survey, analysis and prediction of facility performance, and decisionanalysis on actions required.
System Objectives
System objectives are specified levels of selected performance indicators relating to the condition or usageof the physical facility. The highway asset management process is associated with multiple objectives.Such objectives include specified levels of service for traffic congestion and safety, preservation of thefacility condition at or above a desired level, minimization of agency and user costs, maximization ofsocioeconomic benefits, and minimization of energy use and environmental impacts. To facilitate thetask of highway management programming, system objectives may be assessed quantitatively by meansof highway performance indicators. As performance indicators provide indications of the degree offulfillment of system objectives, priority ranking of facilities can be established based on the relativevalues of performance indicators. Such indicators may be used for comparison of the effectiveness oradequacy of alternative strategies within pavement, bridge, safety, or congestion management. They canalso easily be incorporated into a mathematical optimization programming model for highway manage-ment. As in any complex multiple objective system, difficulties may exist in achieving desired levels ofsystem objectives within a given period of time.
Within each of its component management systems, highway asset management incorporates infor-mation from each of the three dimensions to select specific operational functions (e.g., maintenance) tobe carried out on a physical facility (e.g., pavements) such that maximum possible levels of systemobjectives (e.g., minimize total network roughness) are realized within given constraints. For this task tobe carried out properly, it is necessary, among other requirements, to determine any trade-off relation-ships that may exist between various operational functions for a given facility or across facility types. Anexample is the tradeoff between rehabilitation frequency and maintenance expenditure [Labi, 2001].Given its multidimensional nature and the multiplicity of elements in each dimension, it is vital that theideal highway management system be comprehensive and coordinated yet flexible and sensitive enoughto adjust to changes in the highway transportation environment and public perceptions. Management
© 2003 by CRC Press LLC
Highway Asset Management
66
-5
systems that developed over the last two decades and play a role similar to asset management, albeit ina disintegrated fashion, are described below.
66.4 Component Management Systems for Highway Asset Management
In a bid to enhance their ability to diagnose existing and potential problems throughout the entire surfacetransportation network, and to evaluate and prioritize alternative strategies, several states have developedvarious management systems. These management systems include the pavement management system(PMS), bridge management system (BMS), traffic congestion management system (CMS), highway safetymanagement system (SMS), and intermodal management system (IMS). In addition, many states havedeveloped maintenance management systems (MMS) to aid in planning and evaluating in-house main-tenance work on pavements and bridges. PMS, BMS, and MMS are oriented toward the physical stateof the highway assets, as their primary purpose is to inventory, track, and address the conditions of thevarious components of the highway network and assist in establishing cost-effective strategies to sustainacceptable conditions of such facilities. On the other hand, SMS and CMS focus on the operation andperformance of the transportation network.
The integration of the various component management systems for overall highway asset managementhas been aptly recognized, implicitly or explicitly, by various researchers [Sinha and Fwa, 1989; Markow et al.,1994]. With effective coordination among various component management systems, it is expected that theimpacts and tradeoffs of current and future alternative policies or investments within or across managementsystems can be evaluated. The various management systems are described in the following sections.
Pavement Management Systems
A pavement management system is a set of tools that assist decision makers in finding optimum strategiesfor providing and maintaining pavements in a serviceable condition over a given period of time. In itsbroad sense, pavement management includes all activities involved in planning and programming, design,construction, maintenance, and rehabilitation of the pavement element of a highway. There are threeprincipal components in a PMS: data collection and management, analysis, and feedback and updates[Haas et al., 1994]. The function of a PMS is to improve the efficiency of decision making, expand thescope of the decisions, provide feedback on the consequences of decisions, facilitate the coordination ofactivities within the agency, and ensure the consistency of decisions made at different management levelswithin the same organization. Pavement management must be capable of being used in whole or in partby various technical and administrative levels of management in making decisions regarding individualprojects or entire highway networks. At the network level, agency-wide programs for new construction,maintenance, or rehabilitation are developed such that overall cost-effectiveness is maximized over a givenanalysis period. At the project level, detailed consideration is typically given to alternative design, con-struction, maintenance, or rehabilitation activities for a particular section or project within the overallprogram that will provide the desired benefits or service levels at the least total cost over the analysis period.
Usefulness of Pavement Management Systems
PMS outputs required at various levels are considerably different in detail and format. Midlevel end usersof PMS outputs typically require detailed information, while top-level management requires informationthat is relatively more concise and graphic in nature, highlighting only salient features such as overall(or average) pavement condition and expenditure by functional class, spatial and temporal trends inpavement condition and expenditure, monetary backlogs, and amount of travel and user costs. PMSoutputs are useful for identifying pavement network extent, usage, and other pavement-related attributesand also for analyzing current and historical pavement conditions as well as the impacts of alternativefunding options. A PMS generates data that are needed for the development of single- and multiyearprograms, establishing treatment selection methodologies, applications in construction, design and materials,
© 2003 by CRC Press LLC

66
-6
The Civil Engineering Handbook, Second Edition
applications in maintenance, and applications in research. Other uses of a PMS include its role in effectivepavement-related decision making and marketing, interaction between top management and politicians,and interaction between the public, legislators, and top management.
Legislators have final authority over allocation of funding for state operation, including rehabilitationof highway infrastructure. As representatives of their constituencies, they also have the responsibility torepresent their constituencies in the best manner possible and to ensure that their road network is ingood condition and deficient roads are rehabilitated. Legislators and state management are ultimatelyaccountable to the public for their actions, especially those in regard to money and priorities. Therefore,top-level state highway management needs to be responsive to the political environment and its ownpublic image. In that regard, a PMS can be a useful tool by providing a means of marketing pavementneeds, demonstrating accountability, and justifying project priorities; it can also help in image buildingand in the credibility of management.
A PMS produces a single- or multiyear rehabilitation program through various methodologies. Thesimpler ones include ranking by at least one distress type, prioritization, and optimization. All suchmethodologies seek to develop a program that represents the best value for the money, often called anoptimum program. As state and local PMS evolve over time, their database modules accumulate perfor-mance and other pavement-related data. Such data have led to a better understanding of the performanceof various rehabilitation treatments on different types of existing pavement structures and are thereforeuseful for pavement maintenance and rehabilitation decision making. Decision mechanisms are thenused by highway districts or central offices to recommend rehabilitation treatments for various roadsegments. Performance data can also be, in turn, fed back into the PMS to make future predictions andapplications of the system more accurate and reliable. With regard to pavement construction, a PMSenables the evaluation of the effectiveness of various alternative construction techniques and materials.Regarding pavement design, a PMS can be used for the evaluation of different pavement rehabilitationdesigns and to generate data for the design of new pavement structures. Pavement maintenance activitiesaffect pavement performance and, consequently, service life. Information obtained from a pavementmanagement system is vital in the determination of tradeoffs between maintenance expenditure andrehabilitation cycle length. Such tradeoffs are important aspects of overall highway asset management.
Data Collection and Management
As a PMS database is a critical part of the PMS decision support system, PMS data requirements haveto be properly identified. Therefore, a statistically adequate data collection system needs to be establishedto meet these requirements, and a database structure has to be designed, followed by acquisition of thenecessary hardware and software for the database operation. The physical and logical design of thedatabase should ensure data integrity, reliability, and security.
PMS Data TypesThe data items to be collected and included in the database will depend on the management analysisneeds of the agency, which in turn will depend on the types of infrastructure, the available resources,and the organizational units that will use the data. Data needs of a typical PMS are classified as follows:
Road inventory data: Road classification data include items such as functional class of road, identifi-cation codes, location, and reference points. Such data may also include geometric characteristicssuch as number of lanes, lane widths, and shoulder widths.
Pavement structure and subgrade data: Pavement data items include pavement type, layer thickness,and material characteristics. Subgrade characteristics such as drainage coefficients, modulus ofresilience, particle size distribution, and consistency limits and indices should also be taken intoaccount. Data may also include groundwater levels and moisture content.
Traffic-related data: Traffic volume and classification data are obtained from traffic counts and surveys.Such data include annual average daily traffic (AADT), vehicle classifications, lane distribution,and directional distribution. Also, available data on the axle load levels and distributions shouldbe included in the database.
© 2003 by CRC Press LLC
Highway Asset Management
66
-7
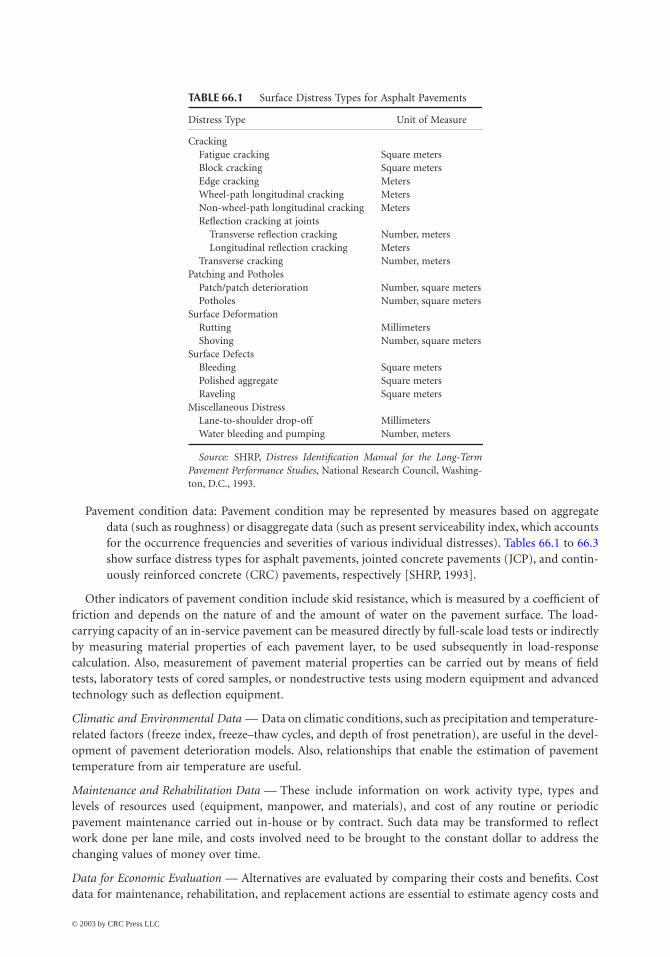
Pavement condition data: Pavement condition may be represented by measures based on aggregatedata (such as roughness) or disaggregate data (such as present serviceability index, which accountsfor the occurrence frequencies and severities of various individual distresses). Tables 66.1 to 66.3show surface distress types for asphalt pavements, jointed concrete pavements (JCP), and contin-uously reinforced concrete (CRC) pavements, respectively [SHRP, 1993].
Other indicators of pavement condition include skid resistance, which is measured by a coefficient offriction and depends on the nature of and the amount of water on the pavement surface. The load-carrying capacity of an in-service pavement can be measured directly by full-scale load tests or indirectlyby measuring material properties of each pavement layer, to be used subsequently in load-responsecalculation. Also, measurement of pavement material properties can be carried out by means of fieldtests, laboratory tests of cored samples, or nondestructive tests using modern equipment and advancedtechnology such as deflection equipment.
Climatic and Environmental Data — Data on climatic conditions, such as precipitation and temperature-related factors (freeze index, freeze–thaw cycles, and depth of frost penetration), are useful in the devel-opment of pavement deterioration models. Also, relationships that enable the estimation of pavementtemperature from air temperature are useful.
Maintenance and Rehabilitation Data — These include information on work activity type, types andlevels of resources used (equipment, manpower, and materials), and cost of any routine or periodicpavement maintenance carried out in-house or by contract. Such data may be transformed to reflectwork done per lane mile, and costs involved need to be brought to the constant dollar to address thechanging values of money over time.
Data for Economic Evaluation — Alternatives are evaluated by comparing their costs and benefits. Costdata for maintenance, rehabilitation, and replacement actions are essential to estimate agency costs and
TABLE 66.1 Surface Distress Types for Asphalt Pavements
Distress Type Unit of Measure
CrackingFatigue cracking Square metersBlock cracking Square metersEdge cracking MetersWheel-path longitudinal cracking MetersNon-wheel-path longitudinal cracking MetersReflection cracking at joints
Transverse reflection cracking Number, metersLongitudinal reflection cracking Meters
Transverse cracking Number, metersPatching and Potholes
Patch/patch deterioration Number, square metersPotholes Number, square meters
Surface DeformationRutting MillimetersShoving Number, square meters
Surface DefectsBleeding Square metersPolished aggregate Square metersRaveling Square meters
Miscellaneous DistressLane-to-shoulder drop-off MillimetersWater bleeding and pumping Number, meters
Source: SHRP, Distress Identification Manual for the Long-TermPavement Performance Studies, National Research Council, Washing-ton, D.C., 1993.
© 2003 by CRC Press LLC

66
-8
The Civil Engineering Handbook, Second Edition
budget requirements. For activities performed in-house, data on benefits can be combined with unit costdata to obtain estimates of costs of alternatives. Benefits include user and nonuser benefits. User benefitsinclude reductions in vehicle operating costs, travel time, delay, accidents, and pollution. Data regarding
TABLE 66.2 Surface Distress Types for Jointed Portland Cement Concrete Pavements
Distress Type Unit of Measure
CrackingCorner breaks NumberD cracking Number of slabs, square metersLongitudinal cracking MetersTransverse cracking Number, meters
Joint DeficienciesTransverse joint seal damage NumberLongitudinal joint seal damage Number, metersSpalling of longitudinal joints MetersSpalling of transverse joints Number, meters
Surface DefectsMap cracking Number, square metersScaling Number, square metersPolished aggregate Square metersPop outs Number, square meters
Miscellaneous DistressBlowups NumberFaulting of transverse joints and cracks MillimetersLane-to-shoulder drop-off MillimetersLane-to-shoulder separation MillimetersPatch/patch deterioration Number, square metersWater bleeding and pumping Number, meters
Source: SHRP, Distress Identification Manual for the Long-Term PavementPerformance Studies, National Research Council, Washington, D.C., 1993.
TABLE 66.3 Surface Distress Types for Continuously Reinforced Concrete Pavements
Distress Type Unit of Measure
CrackingD cracking Number of slabs, square metersLongitudinal cracking MetersTransverse cracking Number, meters
Surface DefectsMap cracking Number, square metersScaling Number, square metersPolished aggregate Square metersPop outs Number, square meters
Miscellaneous DistressBlowups NumberTransverse construction joint deterioration NumberLane-to-shoulder drop-off MillimetersLane-to-shoulder separation MillimetersPatch/patch deterioration Number, square metersPunch-outs NumberSpalling of longitudinal joints MetersWater bleeding and pumping Number, metersLongitudinal joint seal damage Number, meters
Source: SHRP, Distress Identification Manual for the Long-Term Pavement Per-formance Studies, National Research Council, Washington, D.C., 1993.
© 2003 by CRC Press LLC

Highway Asset Management
66
-9
the different components of vehicle operating costs, as well as travel time, delay, crashes, and pollution,are used to estimate user benefits.
Sampling Techniques for Data CollectionDue to the typical large size and wide coverage of state highway networks, it is often considered impracticalto collect data for the entire network. It is common practice to apply the statistical sampling theory indata collection so that a sufficient number of pavement segments representative of the overall networkare determined for survey and testing [Mahoney and Lytton, 1978]. Some of the common samplingtechniques are as follows:
Simple random sampling method: In this method, all highways considered in a survey are first dividedinto segments of either equal length or uniform pavement characteristics. Each pavement segmentconstitutes a sampling unit in the sampling process. A random sampling is then carried out toselect the pavement segments for the survey. Each segment has an equal probability of beingchosen. This method is more likely to be used at the project level, where pavement segments withsimilar characteristics are usually involved.
Systematic random sampling method: This method requires all sampling units of equal length or ofuniform pavement characteristics to be randomly ranked, and every rth element of the ranked listis selected. The first sampling unit is sampled at random between 1 and r, say the mth unit. Thefinal sample will therefore consist of sample unit number m, (r + m), (2r + m), (3r + m), and soon. The use of this method is associated with limitations similar to those with simple randomsampling.
Stratified random sampling method: This method first divides all pavement segments into differentgroups or strata on the basis of certain selected characteristics, such as function class or pavementtype. The next step involves random sampling within each stratum to select the desired numberof pavement segments. This method ensures that pavements of all highway functional classes andpavement types are represented in the sample.
Single-stage cluster sampling method: This method involves two steps. First, pavement segments aregrouped into different clusters. Next, a random sampling process selects the clusters to be includedin the survey. The pavement segments in the selected clusters are sampled. This method is usefulfor selecting subdivisions of a network for a survey.
Multistage cluster sampling method: This is an extension of the single-stage cluster sampling method.After clusters are randomly selected in the first step, another random sampling is performed withineach selected cluster to sample subclusters for the survey. This process can be carried out repeatedlyas desired.
Sample Size Requirements for Data CollectionThe objective of sample size selection is to achieve a balance between data precision and cost of collectingdata. There is no clear-cut criterion for the selection of optimum sample size, as it depends on theprecision set by the pavement agency as well as the level of funds available [Mahoney and Lytton, 1978].
Sample Size for Time Variation of Pavement Condition — Time variations of different pavement condi-tion measurements are an important consideration in pavement management. The time rate of changeof a pavement condition measure provides useful information to engineers involved in decision makingconcerning pavement maintenance and rehabilitation. Therefore, the magnitude of sample size selectedmust be able to detect a certain minimum variation at the confidence level. The following equations canbe used as a guide:
mZ
P P
nm
m NN
=-( )
=+
ÊËÁ
ˆ¯̃
2
1 2
22
© 2003 by CRC Press LLC

66
-10
The Civil Engineering Handbook, Second Edition
where Pi = the proportion of the total road mileage studied at time period i that has a distress greaterthan the acceptable level, a ride quality lower than the specified minimum, or a skidresistance lower than the minimum level ( i = 1, 2, …)
n = the number of pavement segments required to detect a change equal to (P1 – P2) of specifiedpavement condition
N = the total number of pavement segments consideredZ = the normal distribution statistics, equal to 0, 1.645, and 1.96 for confidence levels of 50,
90, and 95%, respectively.
Number of Tests Required per Pavement Segment — In order to provide a sufficiently precise estimate ofthe mean and standard deviation of the pavement response investigated, the number of test measurementsto be conducted in each pavement segment need to be decided. More precise estimates can be achievedby increasing the number of tests, but at a higher cost. The statistical relationship between precision andthe number of tests can be expressed mathematically as
where Ra = a measure of the limit of precision at significance level a, 0 < a < 1Za = the standard normal statistics = the standard deviation of the pavement response being consideredn = the number of test measurements
The above equation implies that if –x is the mean pavement response from the n test measurements, thenthe confidence that the true mean of the pavement response lies within the range of –x ± Ra is 100(1 – a)%.
Defining Pavement Segments for Data CollectionPavement data are collected and stored for discrete units typically referred to as segments. For data tobe compatible, it is necessary for such segments to be well defined. Two approaches for defining pavementsegments are generally used: the equal length method and the uniform characteristics method.
Equal Length Pavement Segments — The use of equal length pavement segments is convenient both fordata collection purposes and for representation in the database. However, it is possible that some segmentshave unequal lengths. For network-level analyses, the characteristics of equal length segments are uniformenough within each segment to obtain results of sufficient accuracy. For project-level analyses, moreaccuracy is required. Therefore, shorter segment lengths or segments with uniform characteristics shouldbe used.
Pavement Segments with Uniform Characteristics — There are a number of approaches to identify pave-ment segments with uniform characteristics: the pavement classification–based approach, the pavementresponse–based approach, and the cumulative difference approach. With the classification-basedapproach, pavement characteristics are chosen and segments are identified so that the pavement charac-teristics are uniform within each segment. Usually these are characteristics that influence the deteriorationof the segment and the type of rehabilitation action to be applied to the segment. Such pavementcharacteristics are pavement type, material type, layer thickness, subgrade type, highway classification,and traffic loading. An advantage of this approach is that pavement segments delineated on this basisretain their uniform characteristics over time, until major rehabilitation or reconstruction changes suchcharacteristics. Figure 66.2 gives an example of pavement segment delineation with the classification-based approach.
With the response-based approach, a number of pavement response variables are chosen and segmentsare identified so that the response variables remain fairly constant within each segment. Pavementresponse variables that can be chosen include roughness, rut depth, skid resistance, some surface dis-tresses, and structural characteristics such as deflection. These variables are chosen according to their
R Zn
a as= Ê
ËÁˆ¯̃
© 2003 by CRC Press LLC

Highway Asset Management 66-11
importance for predicting pavement deterioration and for determining the type of rehabilitation actionto be implemented. Because these characteristics change over time, this approach has the disadvantagethat segments might have to be redefined regularly. Statistical tests can be used to test whether thecharacteristics of adjacent segments are different enough to classify them as separate segments. Assumingthe characteristics are normally distributed in both segments with the same variance, the following t testcan be used to test for statistically significant difference:
where–X1 = the average characteristic for segment 1–X2 = the average characteristic for segment 2s1 = the sample standard deviation of segment 1s2 = the sample standard deviation of segment 2n1 = the sample size of segment 1n2 = the sample size of segment 2
The calculated t value can be compared with the critical t value, tn1 + n2 – 2, a/2, at a significance levelof a. If –tn1 + n2 – 2, a/2 < t < tn1 + n2 – 2, a/2, the characteristic is not significantly different between the twosegments and the segment can be combined. Figure 66.3 presents an example of pavement segmentdelineation with the response-based approach. The response used in this illustration is pavement deflection.
The cumulative difference approach identifies the boundary between adjacent segments as the pointwhere the cumulative pavement characteristic versus distance function changes slope. It is recommendedby the American Association of State Highway and Transportation Officials (AASHTO) for pavementsegment delineation. Figure 66.4(a) shows how pavement characteristics may change with distance along
FIGURE 66.2 Pavement segment delineation with the classification-based approach.
tX X
n s n s
n n n n
= -
-( ) + -( )+ -
È
ÎÍÍ
˘
˚˙˙
+ÊËÁ
ˆ¯̃
1 2
1 12
2 22
1 2 1 2
1 1
2
1 1
© 2003 by CRC Press LLC

66-12 The Civil Engineering Handbook, Second Edition
FIGURE 66.3 Pavement segment delineation with the response-based approach.
FIGURE 66.4 Pavement segment delineation with the cumulative difference approach.
© 2003 by CRC Press LLC

Highway Asset Management 66-13
the length of a pavement, while Fig. 66.4(b) shows the cumulative value of the characteristic along thelength of the pavement. For a continuous function, the cumulative function is given by
Pavement characteristics are usually measured at discrete points. The cumulative function can becalculated by using the trapezium rule as follows:
where n = the total number of measurementsfi = the characteristic value of the ith measurement
fi –1 = the characteristic value of the (i – 1)th measurementxi = the distance along the pavement of the ith measurement
xi –1 = the distance along the pavement of the (i – 1)th measurement
Figure 66.4(b) also shows a broken line connecting the cumulative function values at the two endpoints.The slope of this line therefore represents the average characteristic value over the length of pavement.If
–A(x) denotes the cumulative value given by the broken line, the cumulative difference index Z(x) is
then given by Z(x) ∫ A(x) ––A(x).
Figure 66.4(c) shows a plot of Z(x) versus distance. The boundaries of pavement segments are givenby the points where the slope of the Z(x) distance plot changes sign. The boundaries and their stabilityover time will depend on the characteristic chosen for segment delineation.
Data Collection TechnologiesSpecialized equipment is used to determine position, measure pavement friction, and determine ridequality or roughness, pavement distress, and structural properties.
Location Determination — Systems with mileposts or mile reference markers are common. The vehiclefor pavement condition collection has the ability to determine distance fairly accurately. After the nec-essary corrections, relative distances are used to determine the positions of points where condition datameasurements are made. A newer development is the Global Positioning System (GPS), which candetermine position automatically and accurately with radio signals and satellites. This technology holdseven more promise when combined with the Geographic Information System (GIS).
Pavement Friction Measurement — The locked wheel friction tester is the most common device used tomeasure pavement friction. Disadvantages are low testing speed, high testing costs, and high wear andtear of equipment. Alternative equipment in use or in development are the mu-meter, the locked-wheelskid tester, the spin-up tester, and various devices for collecting and processing video and laser imagesof pavement texture [FHWA, 1989].
Pavement Roughness — There are various measures of roughness and, consequently, various equipmenttypes for roughness measurements. Basic methods include the rod and level survey and the dipstickprofiler. As the use of such manual devices is very time consuming, they are mostly used to profileroughness calibration segments to calibrate other types of devices.
Profilographs are mostly used for construction quality control of portland concrete cement (PCC)pavements. Response-type road roughness meters (RTRRMs) measure the dynamic response of amechanical system with specified characteristics traveling at a specified speed over the pavement, as ameasure of pavement roughness. The disadvantages of RTRRM equipment are that they do not directly
A x f s ds x x
f s ds f s ds x x x
x
x
x
x
( ) = ( ) £ £
= ( ) + ( ) £ £
ÚÚ Ú
10
1
10
2 1 2
0
1
1
for
for
A x f f x xi i i i
i
n
( ) = +( ) -( )- -=
Â1
2 1 1
1
© 2003 by CRC Press LLC

66-14 The Civil Engineering Handbook, Second Edition
measure pavement profile, but rather dynamic response as a proxy, and that they require frequentcalibration to obtain consistent relationships between pavement characteristics and dynamic responses.
A number of profiling devices have been developed that measure pavement profile. Most of suchdevices consist of accelerators (which are used to determine relative vertical displacement with time), adistance-measuring instrument to measure distance along the vehicle path, and an ultrasonic, optical,or laser system to measure the height of the device above the pavement surface. The pavement profilep(x) at any point x along the vehicle path is then given by device vertical displacement y(x) minus theheight of the device above the pavement surface h(x), or p(x) = y(x) – h(x). Raw data are noisy and mustbe smoothed or filtered and then processed further to convert the profile data to the required roughnessindices. Software packages have been developed to carry out such tasks [FHWA, 1991].
Rut Depth — Rut depths are measured using basically the same technology used for profiling pavementsurfaces. Most equipment types have a transverse rut bar with three or five ultrasonic or laser sensors.Laser sensors are more accurate and reliable than ultrasonic sensors but are much more expensive. Theheights between the sensors and the pavement surface are measured at regular intervals. The transverseprofile and a measure of rutting can then be constructed using the height measurements for each crosssection [FHWA, 1991].
Various Surface Distresses — Most surface distress data are collected with visual inspections. These manualmethods are time consuming, are expensive, and rely on subjective evaluations. Efficiency can be improvedwith clear and standardized manuals, training of inspectors, and inspection aids such as portable com-puters and specialized survey keyboards. A number of technologies using laser, radar, or video are beingdeveloped to improve inspections. Laser devices can detect some cracking but are less reliable andrepeatable and do not produce visual records [FHWA, 1991]. Radar devices help to identify locations andsizes of voids under PCC pavements. Video equipment can be used to detect distresses such as surfacecracks, potholes, and rutting. Video equipment is easier to use, is inexpensive, and involves reusable storagemedia. In the use of such technologies, much effort is expended in processing of recorded images for dataextraction. As such, research is being carried out to automate image processing tasks [FHWA, 1989].
Structural Capacity — Pavement structural capacity influences the sizes of permissible loading patternson a pavement and is therefore an important factor influencing the remaining service life of a pavement.Deflection of the pavement under various static and dynamic loads is usually taken as a measure ofpavement structural capacity. Pavement deflection is influenced by many factors, including size andduration of the load; pavement type; stiffness of the pavement; local defects such as joint cracks, moisture,frost, and temperature; and proximity of structures, which have to be taken into account when analyzingdeflection data. Types of deflection equipment are static deflection, steady-state dynamic deflection, andimpulse deflection equipment.
Static deflection equipment measures pavement deflection under slowly applied loads. The best knowndevice of this type is the Benkelman beam, which yields a single deflection measurement. Other staticdeflection devices are the curvature meter and plate-bearing test equipment. Other equipment includesautomated beam equipment, such as the traveling deflectometer. Steady-state dynamic deflection equip-ment applies a steady-state sinusoidal force to the pavement after the application of a static preload. Thechange in deflection (vibration) is then measured and compared with the amplitude of the dynamicforce. The Dynaflect and the more versatile Road Rater are well-known devices of this type. Limitationsof this equipment are the limited amplitudes of the dynamic loads compared with the static preloads.Impulse deflection equipment applies an impulsive force to the pavement, usually with a falling weight.The size of the force can be varied by varying the drop height and the mass of the weight. The DynatestFalling Weight Deflectometer is a widely used device of this type [FHWA, 1989].
The collection and analysis of pavement condition data form the foundation of any effective PMS, asdecisions based on objective data are vital for proper budgeting. Current trends in pavement datacollection and analysis point to increasing use of automation, therefore decreasing the element of sub-jectivity in pavement condition monitoring while ensuring the safety of condition-monitoring personneland road users during such data collection.
© 2003 by CRC Press LLC

Highway Asset Management 66-15
Management Strategy Development
Program Development ProcessesEach year, state highway agencies are faced with the task of developing a single-year program thatoptimizes resources allocated to that year. In order to achieve this objective, projects are prioritized forthe year under consideration. Every organization has a process by which it develops a program. Theprocess, which generally reflects the management style within the organization, typically fits into anyone of the following three organizational structures [AASHTO, 1990]:
Centralized program development process: The most often used process for developing a program isone in which the central office programming unit develops a program with some consultationwith the districts. The rules and goals of the central office generally prevail in this type of a program.
Semidecentralized program development process: In this process, the districts in a state are asked torank projects and recommend a program of construction for projects that the districts would liketo see implemented. Such ranked lists are often developed by considering projects that could notbe carried out in previous years, in addition to projects that meet the programming criteria inthe current year. In this type of organizational structure, the central office may use rules and goalsthat are different from those of individual districts. Rules and goals may also vary from one districtto another.
Decentralized program development process: In this process, districts are considered autonomousunits. A budget is allocated to each district by the central office. Each district is completely freeto develop its program according to its own set of rules and goals.
Project Selection MethodsSingle-Year Prioritization — The first step in developing a single-year program is to determine whatpavement segments should be considered for rehabilitation that year. In most cases, the managers of anetwork establish pavement condition criteria that will trigger minor or major rehabilitation. The secondstep in the program development process is to determine what factors will be used to identify a projectthat is in need of rehabilitation. Some of the criteria used by different highway agencies for this purposeinclude a project’s overall condition (such as distress index, roughness, and performance index), a project’sindividual distress (such as cracking, rutting, spalling, etc.), and the rate of deterioration of the project.The level of current condition at which an agency considers a pavement as a candidate for a specificaction is referred to as a “trigger point.” Trigger points may vary according to the importance, use, orclassification of a facility. A district may use additional criteria to determine trigger points for the selectionof candidate projects. For instance, maintenance requirements of a project may be at such high levelsthat rehabilitation would be more appropriate. Also, preventive action at an early point in a pavement’slife may save a large expenditure of funds over the life of the project. General practice is such that acombination of many the above objectives are used as trigger points to select candidate projects in asingle-year prioritization program.
After current needs have been identified through the use of trigger points, the next step in the programdevelopment process is to determine what treatment should be applied to each project. There are severalmethods of treatment selection that are currently in use. These include various combinations of thefollowing: policy and experience, decision trees, design methods, initial cost, least-present cost, and costeffectiveness. For each set of candidate projects, the best treatment for each candidate project is identifiedand the corresponding cost is determined. The next step involves prioritization of the candidate projectsaccording to a given set of rules or guidelines. Certain methods of ranking include prioritization byparameters such as distress or performance, or by composite criteria (such as a ranking function com-bining condition, geometry, traffic, maintenance, safety factors, etc.), initial costs, least-present costs,and benefit–cost ratio or cost effectiveness. The treatment selection procedure and the ranking proceduremake available a ranked list of projects to be carried out, the treatment and costs associated with eachproject, and a cutoff line that is established based on the level of funding available.
© 2003 by CRC Press LLC

66-16 The Civil Engineering Handbook, Second Edition
Deficiencies of Single-Year Prioritization — As alternative treatment timings are not considered insingle-year prioritization, the long-term impacts of the decisions are not adequately addressed. Therefore,the true costs of the rehabilitation approach over time may not be given due consideration. Currently,many agencies use this approach to program their pavement repair activities.
Multiyear Prioritization — Multiyear prioritization is a more sophisticated approach to project selectionthat is closer to an optimized solution for addressing pavement network scheduling and budgeting needs.This method requires the use of performance prediction models or remaining service life estimates. Italso requires the definition of trigger points to identify needs and provisions that allow the accelerationor deferral of treatments during the analysis period. There are three common approaches used to performthis prioritization: marginal cost-effectiveness approach, incremental benefit–cost approach, and remain-ing service life analysis.
Cost-Effectiveness Approach — The cost-effectiveness approach is a method of assessing the trade-offs of a project by providing information about costs, benefits, and impacts in such a manner as tofacilitate prudent, broad-based decisions. This approach first identifies feasible treatments for eachanalysis based on the projected condition and established trigger levels and then calculates the respectiveeffectiveness (area under performance curve multiplied by some function of traffic) and costs in termsof net present values of costs of each combination and selects the treatment alternative and the time foreach segment with the highest cost-effectiveness ratio. The marginal benefit–cost approach, whichinvolves determination of costs and benefits (effectiveness), is considered superior to the benefit–costapproach.
Incremental Benefit–Cost Approach — The main difference between the incremental benefit–costapproach and the marginal cost-effectiveness approach is the monetary aspect that is placed on thebenefits. In the incremental benefit–cost approach, not only are the costs associated with a projectconsidered, but also the benefits. As it is typically difficult to determine the monetary benefits of roadrepair investments, specified values are assigned to such benefits on the basis of how long the benefitsare expected to last. In this approach, the efficiency frontier represented by successive line segments, withwhich the slopes are the incremental ratios of benefits and costs from one strategy to the next, isestablished.
Remaining Service Life Approach — This approach uses the expected remaining life of the pavementas an indirect measure of the work needed on a pavement. In this approach, the relationship betweenremaining service life and life cycle costs is established. The network life cycle costs are considered thesum of the annual preservation costs that are accumulated over the life cycle analysis period. They arecalculated based on the need of an agency to minimize the total costs of pavement preservation and theneed to control the relationship between costs of preservation and the network’s condition over longperiods of time.
Multiyear prioritization differs from single-year prioritization in a number of ways. First, a numberof different strategy alternatives (treatment types and timings) are considered in multiyear prioritization.The use of a benefit calculation generally identifies the treatment that provides the most benefit to anagency, while a single-year prioritization approach typically considers only one assigned option for aspecified condition level. Another difference lies in the complexity of analysis. In a single-year prioriti-zation, the most common factors considered are the current condition and the existing traffic levels. Ina multiyear prioritization, an agency is able to simulate future conditions through the use of performanceprediction models and to consider other factors in the analysis. Furthermore, with the multiyear prior-itization, the option of timing of maintenance, rehabilitation, and reconstruction can be included in theanalysis process. Also, the capability of finding an optimum combination of projects, alternatives, andtiming for any budget level can be incorporated. The impact of various funding levels also can be assessed.Naturally, the reliability of the results of multiyear prioritization is dependent on the predictive accuracyof the performance models.
Optimization — Through the use of mathematical programming methods, such as linear program-ming, dynamic programming, discrete optimization, and multicriteria optimization, optimal solutions
© 2003 by CRC Press LLC

Highway Asset Management 66-17
are developed in accordance with goals established, such as maximizing total agency benefits or mini-mizing agency costs to achieve certain condition levels. Optimization analysis, unlike prioritization, yieldsoutputs that are provided in terms of percentage of miles of roads that should be mobilized from onecondition to another rather than in terms of identification of specific projects. The optimization approachaddresses several important considerations that are not covered in prioritization analysis, such as theincorporation of interproject trade-off analyses during strategy selection. Furthermore, optimizationguarantees that the selection of strategies adheres to budgetary limits. Also, optimization allows theconduction of multiyear network-level planning and programming aimed at moving the overall systemtoward a defined performance level.
Performance AnalysisPrediction models are developed to predict future pavement condition, and ultimately to assist in theestimation of the type and timing of maintenance activities and optimization of the pavement condition,for life cycle cost analysis. Pavement performance is generally predicted using deterministic and proba-bilistic models through regression analysis, Markov transition probabilities, and Bayesian methodology[FHWA, 1991]. These modeling techniques are briefly described below.
Regression Analysis — Regression is a statistical tool that is used to derive a relationship between two ormore variables. Important parameters that can be used to judge how well an equation fits the actual dataor the predictive power of the model include coefficient of determination, root mean square error, andhypothesis tests on regression coefficients. An advantage of regression analysis is that it provides a simplemathematical method to analyze performance data and to develop performance prediction models thatcan be updated using future analysis results and engineering judgment. However, regression analysisrequires an accurate and abundant set of data and needs to consider all significant variables affectingpavement deterioration.
Markov Transition Probabilities — The basic Markov assumption is that current pavement condition isdependent only on its prior condition. Furthermore, future pavement condition is dependent only oncurrent pavement condition. Probability transition matrices developed upon these premises can be usedto estimate probabilistic performance prediction models. The advantages of such models lie in theirrelatively simplicity of implementation and in their ability to provide a network-level assessment offacility condition. Their greatest disadvantage, however, is that the major assumption associated with thedevelopment of the transition matrices may be invalid.
Bayesian Methodology — This methodology allows both subjective data (opinions) and objective data(generated from mechanistic models) to be combined to develop and predictive (regression) equations.In traditional regression analysis, the unknown regression coefficients are based on the observed dataand are assumed to have unique values. In Bayesian regression analysis, the regression parameters areassumed to be random variables with associated probability distributions analogous to a mean and astandard deviation.
Institutional IssuesCommunication within an agency is one of the most important items in a PMS. Without effectivecommunication, decisions would be made without all of the information needed. The main objective isto ensure rapid and effective flow of information within the agency and to aid the decision makers inmaking cost-effective decisions. A good PMS enhances flexibility in the reporting of information.
Bridge Management Systems
A bridge management system is a systematic approach to assist in making decisions regarding cost-effective maintenance, rehabilitation, and replacement plans for bridges. Such systems seek to identifycurrent and future deficiencies, estimate the backlog of investment requirements, and project futurerequirements. A BMS also helps to identify the optimal program of bridge investments over time periods,given particular funding levels. With a BMS, substantial savings for both agency and user costs can be
© 2003 by CRC Press LLC

66-18 The Civil Engineering Handbook, Second Edition
achieved and bridge improvement programs can be readily and effectively explained to the public,legislative bodies, and budget decision makers. Also, BMSs play an important role in risk management,as evidence to counter possible claims alleging negligence for the agency’s failure to upgrade a bridge inlight of changed conditions and current design standards can be provided. A BMS includes four basiccomponents: a database, cost and deterioration models, optimization models for analysis, and updatingfunctions. The database component contains information from regular field inspections. Deteriorationmodels predict the future condition of bridge elements. Agency cost models are associated with main-tenance and improvement of bridge components, while user cost models relate more directly to bridgesafety and serviceability. Using results from the cost and deterioration modeling, an optimization modeldetermines the least-cost maintenance and improvement strategies for bridge elements. A life cycle costanalysis considers bridge improvements over its entire service life.
A top-down or bottom-up approach can be used to optimize a BMS. The top-down approach deter-mines the desired goals for the entire network and then selects individual bridge projects. The bottom-up approach determines the optimal action for each bridge and then selects which projects will becompleted based on the network optimization. The top-down approach typically works faster becausethe individual projects are determined after the network goals are set, but it requires a large number offacilities (bridges) to provide meaningful results. The bottom-up approach uses more computer time tooptimize the individual bridge projects and often proves cumbersome for a large number of bridges.Finally, the BMS generates summaries and reports for planning and programming processes. Deteriora-tion and cost models need to be continually updated to represent current conditions.
Data Needs, Data Collection, and Database for BMS
Data TypesSelection of data items needed to operate a BMS on the intended functions of the system generally consistsof the following four categories [Sinha et al., 1991]:
Inventory data: To provide a bridge inventory, data items such as location, number and length of spans,structure and material, type of deck, superstructure, substructure, and age are needed.
Condition and usage data: Data on bridge condition, environmental conditions, and traffic load arerequired for condition monitoring, evaluation, and prediction.
Agency cost data: To estimate agency costs, the above inventory and condition data, as well as data onmaintenance, rehabilitation, and reconstruction dates, types, and costs, are needed.
User cost data: To compute user costs, data on the distribution of vehicle types, heights, and weightson various road functional classes; vehicle operating costs; average lengths of detours; and bridge-related accident rates and costs are required.
Data Collection and Database DevelopmentSome of the above data items need not be collected by a data collection effort dedicated to acquiringBMS information but can be obtained from existing data sources, such as statewide traffic countsconducted under the highway traffic monitoring system, PMS databases, or published information. Dataitems related to implemented maintenance, rehabilitation, and reconstruction actions are typically col-lected as the actions are performed. Bridge condition data are typically collected during regular bridgeinspections.
A BMS database typically contains all bridge-related information necessary for project selection andfor preparing various network summary reports. BMS data items can also be categorized into fourmodules: condition rating, bridge traffic and safety, improvement activities, and impact identification[Kleywegt and Sinha, 1994].
Condition Rating Module — The bridge condition rating is a key parameter in determining types ofrepairs needed for a bridge. This, together with other inspection data, constitutes basic input data neededfor the ranking and optimization procedures. It is important that the condition rating be carried out ina consistent manner for all bridges. In this module, a bridge is divided into three major components:
© 2003 by CRC Press LLC

Highway Asset Management 66-19
deck, superstructure, and substructure. This approach of reducing a complex structure into simplerelements is called the problem reduction approach in knowledge engineering. The subdivision of a bridgeinto simpler subcomponents can be accomplished by adopting the bridge items listed in a standard fieldinspection form. Finally, as a result of objective measurements (such as measured values of subcomponentcondition) and subjective judgment (such as importance factors for the subcomponents using a fuzzyset approach), consistent condition ratings of state-owned bridges can be derived and kept in this module.
Bridge Traffic Safety Evaluation Module — Traffic safety can be one of the factors for recommendingbridge improvement activities. Bridge traffic safety can be affected by many factors, and subjectivejudgments are often made to assess it. The overall traffic safety rating of a bridge hinges on the bridgeinspector’s assessment of the importance of the safety evaluation factors considered and the actual safetydeficiencies of the components of a bridge.
During bridge inspection, each of the safety factors can be assigned a safety rating depending onspecific conditions of the bridge. The rating may be one of the following terms: very critical, critical,moderately critical, not critical, and highly not critical. The weight of each of the safety factors can beassessed through a questionnaire survey of the district bridge inspectors. The ratings and weights of allthe factors can then be combined to obtain the weighted average rating or bridge safety index. Factorsto compute safety index may include roadway width, shoulder width, vertical clearance, approach guard-rails and bridge rails, approach sight distance, approach roadway curvature, approach gradient, vol-ume–capacity ratio, truck percentage, lighting, signing and delineation, presence of nearby ramps orintersections, and presence of nearby lane drops or pavement transitions.
Improvement Activity Identification Module — Severity and extent of distresses present at the bridgestructure call for specific types of improvement. In order to develop a computerized improvementalternative selection process, it is necessary to develop distress improvement relations by highway class,condition rating, and traffic volume. For this purpose, a database must be created that can accumulatethe information of all improvement activities performed for each bridge in the system over a period oftime. The improvement activity recording and monitoring module, based on the activity history database,would serve as the data bank for future analysis.
Impact Identification Module — The use of a structurally deficient or functionally obsolete bridge hassignificant impacts on the highway agency, road user, and surrounding community. To the highwayagency, the effect of a structurally deficient bridge would be measured in terms of the cost of an immediateinvestment to upgrade the bridge. The highway user is impacted directly by the relatively longer distancesand travel time and increased potential for traffic accidents associated with detour roads. The impactson the surrounding people involve the inconvenience created by a sudden upsurge of local traffic volumes.These impacts are considered significant due to the typically long construction period for bridge reha-bilitation or replacement. To assist in the identification of magnitudes of various impacts and to translatesuch impacts into qualitative and quantitative effects, detour length is a necessary data item.
Data Analysis
Condition Data AnalysisThe condition of a bridge can be represented in several ways. One of the most common methods is toconstruct condition indices, which aggregate data on the condition of component bridge elements toobtain indices for larger elements, such as a deck, superstructure, or substructure, or for a bridge or anetwork of bridges. The level of aggregation will be determined by the purpose of the indices, especiallythe intended users or audience [Jiang and Sinha, 1990]. Prediction of future condition and remainingservice life can be carried out using any of several statistical techniques.
Regression Analysis — Regression analysis is applied in many areas of bridge management systems. Equa-tions are estimated to predict the future conditions of bridge elements as a function of the currentcondition, the age of the element, material types, maintenance practices, environmental features anddeicing chemical use, traffic volume, and past rehabilitation actions. These predicted conditions are then
© 2003 by CRC Press LLC

66-20 The Civil Engineering Handbook, Second Edition
used to estimate future agency and user costs, to evaluate different rehabilitation and replacementalternatives, to choose strategies under budget and other constraints, to predict the impacts of differentbudgets, and to plan work over the medium and longer term. A commonly used form of equation inregression analysis, due to the ease with which the parameters of such an equation can be estimated, isthe linear regression equation
where Y = the dependent variableXi = the independent variables, i = 1, 2, …, nbi = the unknown parameter to be estimated, i = 1, 2, …, n
e = the random error
The dependent variable might be the future condition of a bridge component, and independentvariables might include the current condition, time since the previous major rehabilitation, type ofrehabilitation implemented, material type, and environmental features. The random error term isincluded since the equation will never be a perfect representation of the underlying phenomenon.Different methods can be used to obtain parameter estimates that will make the equations fit the dataas well as possible. The simplest and most common method is ordinary least squares (OLS). A moreversatile method is maximum likelihood. The “goodness of fit” of the regression model can be evaluatedin different ways. The most popular statistic used for model evaluation is the coefficient of determination,which measures the closeness of the observed data to the theoretical model.
Markov Chains — If the conditions of bridge elements are classified into discrete states, the deteriorationprocess can be modeled as a Markov chain. A Markov chain describes a process that undergoes transitionsfrom a state at one stage to a state at the next stage. The state of each element or the proportion ofelements in each state can be measured during an inspection. An underlying assumption of Markovchains is that given the present state of the process, the future states are independent of the past. Thisassumption might not be satisfied if the state of an element is defined based on the condition of theelement only, because the probabilities of the deterioration, and therefore transition probabilities, willbe influenced not only by the current condition of the element but also by such factors as age of theelement, past rehabilitation of the element, condition of other elements, and traffic loading. To makebetter use of Markov chains for condition prediction, the states of an element would have to be definedon the basis of the current condition of the element and the factors significantly influencing the element’sdeterioration. In order to make provision for changing transition probabilities over an element’s age,different transition matrices can be used for elements of different ages. One approach is to estimateregression models having the state as a dependent variable, assume a probability distribution for therandom error term, and then convert interval probabilities to transition probabilities. To use a Markovchain, individual states must be defined as intervals on a continuum. Alternative models like multinomiallogit models can also be used. Another approach, as suggested by the developers of the PONTIS bridgemanagement system, is to use subjective judgment of bridge maintenance experts to obtain estimates oftransition probabilities in Markov chains and to update and improve the initial estimates based on regularinspections using the Bayesian estimation technique [FHWA, 1987].
Bayesian Estimation — Bayesian estimation can be used for updating the estimate probabilities of futureconditions. It is particularly well suited for updating the estimates of transition probabilities in Markovchain analysis as additional data become available with inspection. Under suitable assumptions, theupdated estimate (called posterior mean) equals a weighted average of the previous estimate (called priormean) and the mean of the new data. The weights represent the value attached to the data from whichthe prior mean is estimated relative to the new data. Usually, the relative numbers of observations areused as weights. If the prior mean was estimated from judgmental methods, as suggested by PONTIS, ithas to be valued as an equivalent number of observations, representing the amount of data on which
Y X X Xn n= + + + º + +b b b b e0 1 1 2 2
© 2003 by CRC Press LLC

Highway Asset Management 66-21
the expert’s judgment is based. When the estimates are later updated, the posterior values become theprior values for the new estimates. In this way, the effects of initial estimates are reduced as new databecome available.
Fuzzy Set Theory — Many bridge inspection data items are of a subjective nature. The quality of thesesubjective data can be improved through better training of bridge inspectors, carefully designed uniformprocedures and measures, quality control and quality assurance programs, and better inspection manuals.An innovative technique is the theory of fuzzy sets. Unlike classical set theory where an element is eithera member of a set or not, degrees of membership are provided for in fuzzy set theory. For instance, abridge element can be in both a fair and a poor condition, and to different degrees. This technique yieldsa more realistic and flexible method to represent the subjective ratings of bridge elements.
Latent Variable Approach in Regression Analysis — The approach of latent variables considers the infra-structure condition as a set of unobservable or latent variables that depend on other variables, such asprevious maintenance, environmental features, and traffic loading. The observed characteristics, such asthe measured distresses, in turn simultaneously depend on the underlying latent variables. Becausevariables such as various distresses and structural capacity are measured with a large degree of error, theobserved variables can be modeled as functions of the true values as well as stochastic measurementerrors. The model also can be enhanced by using lagged variables and by simultaneously modelingdeterioration and maintenance. This treatment is especially important in that deterioration tends toincrease with decreasing maintenance, all other factors held constant. However, maintenance tends toincrease with increasing deterioration.
Latent Markov Decision Process — This method explicitly takes into account uncertainty associatedwith facility inspection and incorporates this into a Markov decision process framework. It augmentsthe definition of states to incorporate all information available up to each stage, including all previouslymeasured conditions and implemented actions. This causes the state space to grow very rapidly with thenumber of stages, making this method computationally very cumbersome. This approach is required toenable the recursive calculation of the conditional probabilities of the actual condition, given all infor-mation up to that stage. With an appropriate cost function based on element condition and implemen-tation action, the strategy selection problem can be formulated as a dynamic programming problem tofind the optimal solution over a finite horizon with no budget constraints.
Life Cycle Cost AnalysisTo manage bridge infrastructure efficiently, the cost implications of alternative actions have to be con-sidered. These costs are used in the comparison of alternatives for project-level decisions and also inranking and optimization routines for network-level decisions. For a system of bridges, overall costsinclude direct and indirect costs incurred by the agency and the road users. Regression analysis has beenfound useful for estimating agency and user costs as functions of bridge element conditions, deficiencies,and traffic loading. Agency costs include costs associated with materials, manpower, and equipment usedin bridge-related repair activities (maintenance, rehabilitation, and replacement). To estimate the costsof these activities, a good cost-accounting system is essential. The type of action performed on eachbridge element, the costs incurred for the bridge element, and the condition of the bridge element beforeand after each repair activity should be recorded.
Maintenance Costs — The costs associated with routine maintenance of bridge elements can be estimateddirectly or indirectly. These costs could be estimated directly as a function of the material type, condition,location, traffic, highway classification, and other important factors for each bridge element. On the otherhand, such costs could be estimated indirectly by first estimating the quantity of different routinemaintenance activities performed on a type of element per year, as a function of element condition,material type, traffic, highway classification, environment, and other factors. The unit cost of each typeof maintenance activity is also estimated as a function of material type, highway classification, and otherfactors. Then the overall routine maintenance costs are determined given the level and unit costs ofroutine maintenance activities.
© 2003 by CRC Press LLC

66-22 The Civil Engineering Handbook, Second Edition
Element Rehabilitation Costs — The costs associated with the rehabilitation of bridge elements are typi-cally estimated for different types of elements and their respective rehabilitation alternatives. A cost-accounting database provides accurate and up-to-date cost estimates classified by individual elementrehabilitation activity. Unit costs of deck reconstruction and overlay alternatives can be estimated usingregression analysis as a function of climate, road functional class, traffic volume, bridge length, deck area,percent of area needing patched, and other variables.
Element Replacement Costs — Unlike the case for bridge rehabilitation, bridge element replacement costsare estimated separately. Superstructure replacement costs can be modeled for different superstructuretypes as a function of bridge length and deck width, while substructure replacement costs can be modeledfor different substructure types as a function of bridge length, deck width, and vertical clearance.Approach construction costs can be calculated as a function of approach length and earthwork quantity.
Bridge Replacement Costs — Bridge replacement cost can be estimated by decomposing the total projectinto its constituent cost items and then using historical contract costs for similar items on similar projects.Bridge replacement costs depend on bridge dimensions, number of spans, material and type of super-structure and substructure, and bridge location and the crossing feature, i.e., road, rail, or river.
Additional User Costs — User costs include all additional costs incurred by road users over those costs thatwould have been incurred if the bridge system had been in a specific predefined “ideal” status. User costsare therefore incurred even if there is no bridge in place and when a bridge suffers from structural orfunctional deficiencies. Additional user costs can be incurred to the road users by detouring made necessaryby insufficient vertical clearance or loading capacity. To estimate the additional user costs due to detoursfor life cycle cost analysis, future traffic is estimated using regression techniques based on time series data.Then loading capacity is predicted directly using either regression techniques or Markov chains or indirectlyby using these techniques to predict the conditions of the applicable structural elements and then to derivethe load capacity from these element conditions. Elementary descriptive statistics can be used to estimatethe distribution of different vehicle types on different routes, the distribution of vehicle weight and heightfor each vehicle type, the number of different types of vehicles detoured due to insufficient vertical clearanceor bridge loading capacity, the vehicle operating costs per distance for different types and weights of vehicles,and the additional vehicle operating costs and time costs because of bridge deficiencies.
Crash Costs — To estimate bridge-related crash costs, the rates of occurrence of various crashes and theircorresponding costs need to be estimated. The expected rates of different crash types at each bridge asa function of its deficiencies is typically estimated based on highway crash statistics. The costs of thedifferent types of crashes related to bridges can be estimated by separately considering the direct andindirect crash costs. Direct costs include more “tangible” costs, such as medical, property damage, andlegal costs. Indirect costs include the value of the more intangible losses, such as pain, loss of quality oflife, and loss in future production and income. The rates of different crash types and their associatedcosts together give an estimate of the expected crash costs due to bridge deficiencies.
Additional User Costs during Bridge Work — Bridge repair activities typically influence traffic flow on thebridge as well as surrounding roads. Congestion levels associated with various alternatives differ in termsof severity, duration, and frequency. For instance, routine maintenance may cause less severe and short-lived congestion compared to rehabilitation or replacement, which leads to more frequent congestion.Additional user costs are incurred by road users on the bridge and the surrounding road network dueto congestion arising from bridge repair activities. Furthermore, the additional use of alternative routesduring bridge repair may lead to accelerated deterioration of pavements and bridges on such routes.
Identification of Promising AlternativesMore than one bridge maintenance, rehabilitation, and replacement alternative may be feasible for eachscenario (combination of deficiencies, element material types, bridge structural types, climatic feature,and traffic volume). For practical purposes it is desirable to develop a reduced list of more promising
© 2003 by CRC Press LLC

Highway Asset Management 66-23
alternatives for each situation. Each alternative is then analyzed with its activity profiles and cash flowsfor project-level decisions or with the promising alternatives of other bridge projects for network-leveldecisions. The detail with which alternatives are formulated will depend on the level permitted by availabledata and the level at which one alternative is considered distinct from the other.
Activity Profiles and Cash FlowsThe next step in analyzing different alternatives is to construct the activity profile associated with eachalternative. This involves collating the results of the analyses described above. The current condition andtraffic volume influence current agency and user costs as well as the identification of currently feasiblealternatives. The models developed to predict condition are used to predict the long-term conditiontrends associated with each alternative. These are then used with the models for agency and user coststo estimate the associated costs for each alternative activity profile and to derive the corresponding cashflow. The cash flow of each activity profile is then analyzed with the techniques of interest accounting.
Impact AnalysisEven with programs for systematic data collection and analysis in place, it may take many years beforesufficient data is collected to apply techniques such as regression analysis, Markov chains, or Bayesianestimations. Simplified impact estimation techniques are therefore needed to support decisions that haveto be taken as a BMS gradually evolves. A common approach is to obtain the judgment of bridge expertsregarding the impact of alternatives.
Priority RankingRanking methods developed to assist in priority setting for bridge repair activities typically involve theuse of a composite ranking index or indices for each bridge or each project. Priority ranking for bridgerepair can also be conducted according to the level of service based on deficiency points. More advancedproject selection tools for bridge management include concordance analysis, linear programming, andanalytic hierarchy processes. Such methods may be cumbersome when dealing with a large number ofalternatives but are greatly facilitated by the use of computer technology.
Assignment of Relative WeightsThe analytic hierarchy process (AHP) constructs a hierarchy and uses pair-wise comparisons at each levelof the hierarchy [Saaty, 1977]. System goals, objectives, criteria, and alternatives are related by thehierarchy. Relative weights are assigned to activities on the same level in the hierarchy for measuringtheir contribution to an activity on an adjacent higher level. For a BMS, the first level may be the goalto maximize system effectiveness. The second level may consist of objectives based on achievement ofthe goal to be measured, such as bridge condition, agency costs, user costs, and external impacts. Thethird level may involve the criteria in terms of which each objective is measured. The criteria for usercosts may consist of additional vehicle operating costs due to detours, excess loss in travel time, and crashcosts. The fourth level may be composed of individual alternative projects. A unique feature of the AHPmethod lies in the derivation of relative weights. The activities at each level are compared in a pair-wisefashion to produce relative weights. Then these relative weights are arranged in a reciprocal matrix foreach higher level activity. If the pair-wise comparisons are consistent, an eigenvector corresponding tothe largest eigenvalue will yield a set of relative weights for all of the activities.
Utility Functions — As bridge management typically involves the evaluation of several alternatives, thetask of pair-wise comparison can be enormous. This problem can be resolved by developing utilityfunctions for the bridge characteristics, such as remaining service life, which will be impacted by alter-natives. To compare alternative projects, the characteristics of the bridge can be directly converted toutility values without having to resort to pair-wise comparison between the alternatives.
Optimization — The purpose of optimization is to find the optimal set of actions to be implemented ona network of bridges, at various points in time and subject to a variety of constraints. Some commonlyused approaches are briefly discussed below.
© 2003 by CRC Press LLC
66-24 The Civil Engineering Handbook, Second Edition
Minimization of Life Cycle Costs — One approach is to conduct a life cycle cost analysis for each bridgeor type of bridges in the system for each promising alternative that can be employed at each programmingperiod. However, this approach does not find a true global optimum strategy, because it does notsimultaneously take into account network-wide effects such as budget constraints. Furthermore, futurechoices and their impacts are unknown at the time of selecting the best alternative. Therefore, the choiceof the “optimum” alternative under such conditions is associated with simplifying assumptions aboutfuture alternatives.
Linear and Mixed-Integer ProgrammingOne of the most versatile optimization techniques is linear programming (LP) [Sherali et al., 1992]. Insuch a program the values of decision variables are sought that will maximize or minimize a linearobjective function, subject to linear constraints such as budget constraints. The decision variables shouldbe such that they can realistically be regarded as continuous variables. Often the decision variables arediscrete, such as whether an alternative will be implemented or not (represented by 0/1 integers), resultingin mixed-integer programming (MIP). In such problems, the objective functions and constraints areassumed to be linear functions of the decision variables. In reality, such assumptions may be undulyrestrictive. However, formulating the optimization problem as a nonlinear one with nonlinear objectivefunctions and constraints significantly complicates the problem computationally.
Dynamic ProgrammingAn optimization approach with more desirable computational properties is dynamic programming (DP)[Denardo, 1981]. It is based on the principle of optimality that in this context means that optimalalternatives or policies over time consist of optimal subalternatives or subpolicies over shorter periodsof time. In general, this is true in bridge management. Thus, optimal policies can be constructed byrecursively finding optimal subpolicies for successive programming periods. One method of applyingDP is to do the analysis over a finite, but long, time horizon. A terminal value or cost is assigned to eachstate at the end of the analysis period. A cost is associated with being in each state at each stage and withthe implementation of each alternative in each state. The optimal alternative can be calculated recursivelyfor each state at each stage. The transition probabilities can be given as the transition matrix of a Markovchain, as long as the underlying assumptions of a Markov chain are satisfied.
Network and Heuristic MethodDue to the computational complexity of the optimization models described above, heuristic approachesmay be used. An example is the implementation of lexicographic optimization proposed for an invest-ment-staging model for bridge replacement [Garcia-Diaz and Liebman, 1983]. This model specificallyaddresses the replacement and scheduling of rural bridges, which explicitly takes into account the usercosts of alternative routes due to bridge loading capacity deficiencies. By separately scheduling bridgereplacement projects over different subhorizons, the road user cost–minimizing problem subject toagency budget constraints is approximated by this form of decomposition. The subhorizons are thenordered in a priority sequence.
Bridge management is a continuous process and seeks to adapt to changes that occur in the transpor-tation and technological environments. For instance, deteriorating bridge elements are maintained,rehabilitated, or replaced; traffic levels change over time; costs change; and available resources change.Data collection and performance modeling should be carried out on a regular basis so that the BMS canyield outputs that are effective and economically sound for overall highway asset management.
Maintenance Management Systems
Infrastructure maintenance carried out in-house by highway agencies is associated with significant levelsof resources. Maintenance management systems seek to utilize limited resources for in-house maintenancecost effectively and to improve the coordination of maintenance and rehabilitation programs so thattradeoffs between maintenance and rehabilitation actions can be evaluated. MMS activities are performed
© 2003 by CRC Press LLC
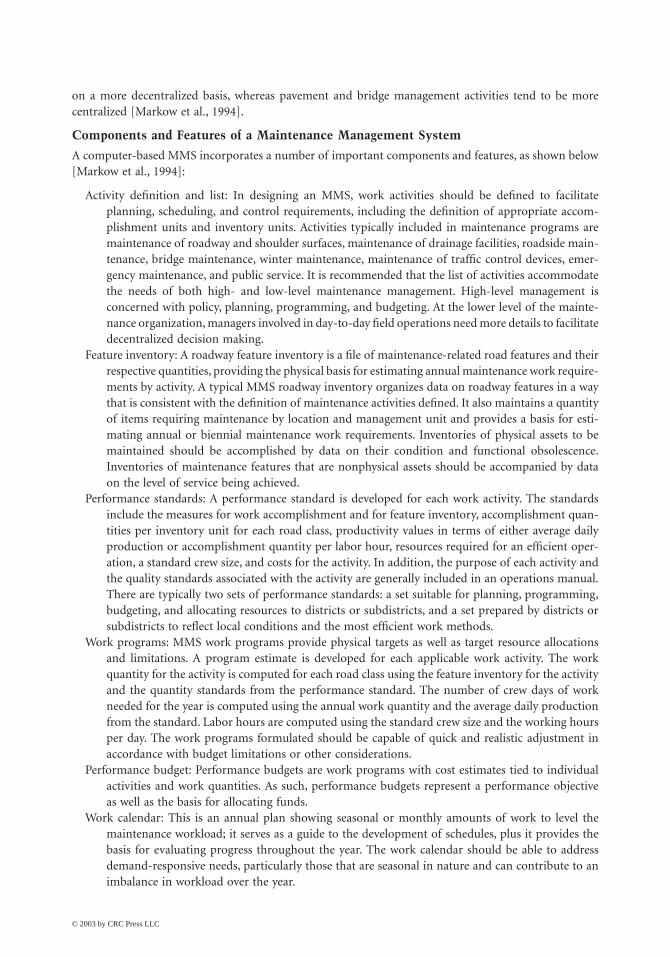
Highway Asset Management 66-25
on a more decentralized basis, whereas pavement and bridge management activities tend to be morecentralized [Markow et al., 1994].
Components and Features of a Maintenance Management System
A computer-based MMS incorporates a number of important components and features, as shown below[Markow et al., 1994]:
Activity definition and list: In designing an MMS, work activities should be defined to facilitateplanning, scheduling, and control requirements, including the definition of appropriate accom-plishment units and inventory units. Activities typically included in maintenance programs aremaintenance of roadway and shoulder surfaces, maintenance of drainage facilities, roadside main-tenance, bridge maintenance, winter maintenance, maintenance of traffic control devices, emer-gency maintenance, and public service. It is recommended that the list of activities accommodatethe needs of both high- and low-level maintenance management. High-level management isconcerned with policy, planning, programming, and budgeting. At the lower level of the mainte-nance organization, managers involved in day-to-day field operations need more details to facilitatedecentralized decision making.
Feature inventory: A roadway feature inventory is a file of maintenance-related road features and theirrespective quantities, providing the physical basis for estimating annual maintenance work require-ments by activity. A typical MMS roadway inventory organizes data on roadway features in a waythat is consistent with the definition of maintenance activities defined. It also maintains a quantityof items requiring maintenance by location and management unit and provides a basis for esti-mating annual or biennial maintenance work requirements. Inventories of physical assets to bemaintained should be accomplished by data on their condition and functional obsolescence.Inventories of maintenance features that are nonphysical assets should be accompanied by dataon the level of service being achieved.
Performance standards: A performance standard is developed for each work activity. The standardsinclude the measures for work accomplishment and for feature inventory, accomplishment quan-tities per inventory unit for each road class, productivity values in terms of either average dailyproduction or accomplishment quantity per labor hour, resources required for an efficient oper-ation, a standard crew size, and costs for the activity. In addition, the purpose of each activity andthe quality standards associated with the activity are generally included in an operations manual.There are typically two sets of performance standards: a set suitable for planning, programming,budgeting, and allocating resources to districts or subdistricts, and a set prepared by districts orsubdistricts to reflect local conditions and the most efficient work methods.
Work programs: MMS work programs provide physical targets as well as target resource allocationsand limitations. A program estimate is developed for each applicable work activity. The workquantity for the activity is computed for each road class using the feature inventory for the activityand the quantity standards from the performance standard. The number of crew days of workneeded for the year is computed using the annual work quantity and the average daily productionfrom the standard. Labor hours are computed using the standard crew size and the working hoursper day. The work programs formulated should be capable of quick and realistic adjustment inaccordance with budget limitations or other considerations.
Performance budget: Performance budgets are work programs with cost estimates tied to individualactivities and work quantities. As such, performance budgets represent a performance objectiveas well as the basis for allocating funds.
Work calendar: This is an annual plan showing seasonal or monthly amounts of work to level themaintenance workload; it serves as a guide to the development of schedules, plus it provides thebasis for evaluating progress throughout the year. The work calendar should be able to addressdemand-responsive needs, particularly those that are seasonal in nature and can contribute to animbalance in workload over the year.
© 2003 by CRC Press LLC
66-26 The Civil Engineering Handbook, Second Edition
Resource requirements: This is a month-by-month listing of resources needed, including labor andequipment by classes and materials by types, to guide the allocation of specific labor, equipment,and materials. The MMS should be capable of adjusting the resource requirements based on thedegree of contracting expected to occur.
Scheduling: The scheduling systems generally provide ways for supervisors to make field notes of workthat needs to be done and to match these needs with the work program and calendar. Thesesystems also provide for the supervisors to decide specifically when and where each activity is tobe performed and in combination with what other activities on a given day to make effective useof personnel and equipment. Many of the systems use crew-day cards as an aid to scheduling andthereby enable maintenance supervisors to select activities from the work calendar, to request forservice or emergency work, and to address leftovers from previous schedule periods.
Work reporting: The essential information to be entered into an MMS is the actual resources usedand the accomplishments for each item of work. The crew-day card is often used for this purpose,with the added advantage of allowing for an easy and immediate review of progress. All of theworking reports, including accomplishments, resource usage, time sheets, and roadway featureinventory updates, are typically generated from the crew-day cards. However, it is often recom-mended that such information be entered locally to facilitate local use.
Management reports: An MMS provides numerous reporting options. In general, these reports aredivided into two categories: planning and evaluation. Planning reports describe the results of thework planning process and present planned activities, quantities of work to be performed, requiredresources, and the budget for the work program. The planning reports include work program andbudget, deferred maintenance, workload distribution, work calendar, resource requirements, activ-ity listing, etc. Evaluation reports compare planned work with actual accomplishments. Mostevaluation reports contain current month and period-to-date performance values and costs. Theevaluation reports include performance, on-screen activity performance, budget status, workcalendar status, resource utilization, location maintenance, and work request completion analysis.
Database Development
To ensure consistency integrity, data needed for maintenance management should be incorporated intothe overall highway asset management database. In this way, highway network inventory data used forpavement management are available for maintenance management and condition data collected as partof the routine maintenance process become available for pavement and bridge management, as well.Other types of data needed for maintenance management include condition, level-of-service character-istics of maintainable elements, traffic volumes and composition, accident statistics, budget and costparameters for labor, materials, equipment, etc. These data are used in conjunction with inventory andcondition information to develop, analyze, and evaluate work plans to be carried out by the maintenancestaff.
The inventory information for an MMS should reside in databases, photo logs, or plan sheets, usinglocation for referencing inventory data elements. The Geographic Information Systems would provideconsistent and accurate representation of maintenance on the road network, including data pertainingto its location, coverage, and elements involved. The creation of highly accurate cartographic base mapsfor GIS generally depends on improved mapping technology, especially that based on the satellite GlobalPositioning System. For example, the exact location of a unique road segment or structure can beestablished by coupling its latitude and longitude coordinates obtained using GPS.
Maintenance Needs Assessment
The first step of maintenance needs assessment is an inspection or a condition survey of physical highwayassets. Such data should be incorporated into an agency’s regular data collection program. Next, giventhe collected condition and other data, appropriate maintenance activities can be chosen. The mostappropriate treatment may depend on the condition, traffic loading, climate features, available resources,and competing maintenance requirements. Maintenance managers need to be able to identify proposed
© 2003 by CRC Press LLC

Highway Asset Management 66-27
maintenance expenditures whose benefits exceed costs, regardless of funding availability. As a result, ashort list of proven cost-effective alternatives can be compiled and standardized for all maintenance unitsof the highway agency. Scarce resources are taken into account during the priority setting and optimizationphase (namely, constrained analysis phase) of the management process.
Resource Needs Assessment
For the purposes of cost estimation, priority setting, optimization, programming and scheduling, andbudgeting, it is necessary to estimate the resources needed to perform each of the identified maintenancealternatives. One approach is to first identify a measurement unit of each maintenance treatment. Next,estimates are obtained for the types and size of manpower needed, the number of man-hours for eachlabor type or the number of crew days, the types and quantities of equipment needed, and the types andquantities of materials needed, per unit of the maintenance activity. These standard resource requirementsshould be incorporated into the database to ensure automated resource needs and cost estimation.
Cost Analysis
Cost analysis for MMS involves the combination of the level of maintenance activity, types and amountsof resources needed per unit of the maintenance activity, and the unit costs of each type of resource.Unit costs should be incorporated in the database and kept up to date to ensure the reliability of costestimates.
Optimal Programming and Scheduling
Due to limited resources, usually it will not be possible to perform all of the required maintenanceactivities. A scheme for priority setting and optimization is therefore needed to effectively allocate scarceresources. Similar to the priority setting and optimization for pavement and bridge management, suchprocedures as benefit–cost analysis (e.g., incremental benefit–cost analysis and cost-effectiveness analysis)and mathematical programming (linear programming, mixed-integer programming, dynamic program-ming, multicriteria optimization, etc.) can also be used for maintenance management [Steuer, 1986].Typical constraints to be incorporated into mathematical programming models include minimum andmaximum maintenance production requirements, manpower availability, equipment availability, mate-rials availability, budget constraints, and constraints to coordinate maintenance and rehabilitation pro-grams. One way of coordinating these programs is by suspending routine maintenance activities a certaintime period before scheduled major rehabilitation work is to commence on the same facility.
Programming, Scheduling, and Budgeting
The results of the above phases of the maintenance management process provide the input for theprogramming and scheduling of maintenance activities at all levels, as well as for compiling budgets atboth the decentralized and centralized levels.
The Evolving Roles of Highway Maintenance Management
Recent trends in highway programs suggest that maintenance will occupy an increasingly important role,entailing a more sophisticated treatment in future roadway management, operations, data collection, andresearch [Markow et al., 1994; Reno et al., 1994]. Existing maintenance systems have been an importantand effective mechanism over the past two decades in helping to plan, budget, monitor, and controlmaintenance work and in establishing standard and productivity guidelines. However, many changeshave occurred since then — in the highway programs themselves, in the road managers’ expectations,and in the state of the art of managing the transportation network in terms of techniques, tools, andtechnology now available. These systems need to continuously make changes to accommodate theseadditional categories of information and to build on emerging management capabilities.
IntegrationAt the strategic planning and operational levels, MMSs need to be more integrated with other types ofplanning and decision making regarding capital improvements and operations. For instance, MMSs rely
© 2003 by CRC Press LLC

66-28 The Civil Engineering Handbook, Second Edition
on the assumption of steady-state work requirements from one year to the next, as embodied in thequantity standards. Whereas pavement and bridge programming systems may employ a decision-makingprocedure that balances the costs of a project against its benefits, MMSs make no attempt to quantifythe benefits of the work performed. Also, PMSs analyze long-term alternatives in pavement actions andrecommend not only the appropriate capital rehabilitation and reconstruction projects and their timingand location but also the appropriate level of routine and periodic maintenance. These recommendationscould be included into the MMSs as planning and budgeting guidelines. One key change to MMSs thatwill allow for better integration is incorporating the ability to consider specific road segments in planningand scheduling. Another is to base maintenance work planning on an expended set of information,including condition ratings, traffic and accident levels, treatment histories, and planned constructionproject status.
Decentralization and the Use of TechnologyData processing and reporting methods in current MMSs are time consuming for field personnel andunable to produce sufficient timely reporting of results for effective management use. There is a need toshift planning and management responsibility to levels closer to the subdistricts where the work isaccomplished. Many states have done so, but there is also the need to provide interactive computerizedtools to assist maintenance personnel in the subdistricts to carry out their tasks more efficiently.
FlexibilityEffective linkages among budgets, work plans, and work accomplishments in the existing MMSs are vital.With time, however, there is a need to allow for possible replanning of work and for granting greaterfreedom to maintenance managers to reschedule activities or shift resources across categories of activities.Such increased flexibility would also allow for easier coordination with nonmaintenance activities inhighway asset management.
SophisticationFeature inventories should be expended to include additional information such as condition ratings,types of damages, traffic conditions, congestion levels, accident histories, and past treatments that affectmaintenance decision making. Currently, MMS performance standards in most states represent averageconditions and need to be refined to take into account different work circumstances, as reflected in anexpended feature inventory. In addition to engineering and managerial tools now being used, improvedoperational planning and scheduling methods and economic analysis need to be introduced to the MMS.The details are discussed below:
Maintenance capital tradeoffs: The tradeoffs between maintenance expenditure and the level or fre-quency of capital improvement of pavements and bridges need to be explored by life cycle costanalysis.
Level-of-service tradeoffs: The advantages and disadvantages of maintenance expenditure on nonphys-ical assets such as ditch cleaning and deicing should be addressed by analytical procedures suchas utility analysis and conjoint analysis for assessing level-of-service tradeoffs.
Agency and user cost analysis: Agency costs may be estimated on the basis of historical data and expertjudgment. User costs are important for assessing delays associated with maintenance work zonesand for calculating benefits of road and bridge improvements.
Optimal resource allocation: Methods for determining the best set of maintenance and improvementactions over time, given a budget constraint, can provide estimates of optimal future spending.Additional problems such as short-term scheduling of labor, materials and equipment for dailymaintenance operations, and the optimal level of service for various maintenance activities, givena budget constraint, can also be addressed.
Maintenance management systems play a useful role in overall highway asset management. This isbecause the operational functions associated with this management system have far-reaching implicationson other management systems, including risk management.
© 2003 by CRC Press LLC

Highway Asset Management 66-29
Congestion Management System
Traffic congestion has become a major concern on existing highways, and the situation is deterioratingat an alarming rate. Detrimental consequences of traffic congestion include longer travel time, higherfuel consumption, and increased air pollution and are associated with annual congestion costs exceeding$70 billion [TTI, 1998]. Obviously, highway asset management needs to include the management ofcongestion; otherwise, many system objectives of asset management will not be realized. Many stateshave established congestion management systems to combat the problem of traffic congestion. A CMSis defined as “a systematic process that provides information on transportation system performance andalternative strategies to alleviate congestion and enhance mobility of persons and goods” [NARA, 1993].Congestion management implies a direct customer orientation to planning and investment and can betailored to provide a mechanism to measure the economic and environmental consequences of currentsystem performance and proposed future investments.
A CMS is generally composed of nine elements:
1. identification of targeted CMS locations or networks2. definition of congestion performance measures3. selection of performance objectives and standards4. system monitoring and evaluation5. identification of system deficiencies6. selection and evaluation of appropriate congestion mitigation strategies7. implementation of selected strategies8. effectiveness evaluation of implemented strategies9. establishment of a process to periodically update a CMS
CMS is often described as a unique management system because it provides a direct formal link toplanning required under the 1990 Clean Air Act amendments.
Possible congestion mitigation measures related to physical assets may include road or lane widening,high-occupancy vehicle (HOV) facilities, traffic signals and related devices, and Intelligent TransportationSystems technologies, including detectors, sensors, and traffic control centers. Choocharukul and Sinha[2000] provide a congestion management system geared to physical assets. As changes in roadway facilitiescan affect the level of service and vice versa, there is a direct connection between CMS and othermanagement systems.
Safety Management System
High rates of highway crashes make it necessary to identify highway facility problem areas so thatnecessary remedial safety-enhancing investments can be carried out. Regulation of highway use throughpolicy formulation and implementation is another way to enhance highway safety but is of less relevanceto highway asset management than investments made on physical facilities. Also, SMS integrates vehicle,driver, and roadway elements into a comprehensive approach to solving highway safety problems. How-ever, the role of roadway elements is of particular relevance to highway asset management. Many stateshave developed safety management systems to address the issue of highway safety. An example is thehighway safety management system developed for the state of Indiana [Farooq et al., 1995].
An SMS is defined as a systematic process that has the goal of reducing the number and severity oftraffic crashes by ensuring that all opportunities to improve highway safety are identified, considered,implemented as appropriate, and evaluated in all phases of highway planning, design, construction,maintenance, and operation, and by providing information for selecting and implementing effectivehighway safety strategies and projects [NARA, 1993].
SMSs typically seek to promote widespread collaboration around highway safety issues and broadenthe range of organizations involved in such efforts by including public health, emergency medical services(EMS), and law enforcement agencies in the development and implementation of the systems. A safetymanagement system generally consists of the following elements: definition of safety performance measures
© 2003 by CRC Press LLC

66-30 The Civil Engineering Handbook, Second Edition
and standards, identification of existing and potential safety problems, identification and evaluation ofsafety-enhancing measures, evaluation of the effectiveness of implemented measures, and review of theSMS on a continuing basis.
From the operational function dimension of asset management (Fig. 66.1), activities carried out onhighway facilities with the objective of enhancing safety include the construction or repair of road signsand guardrails, the laying of new pavement surfaces to improve friction, and pothole repair. Safetymanagement systems provide not only decision support tools for policy makers to allocate resources tosolve safety-related highway problems but also data that enable the conduction of tradeoff analysesbetween investments in highway safety on one hand and investments in highway facility condition orother areas of highway usage on the other. Furthermore, costs and occurrence levels of various highwaycrash types are monitored using SMS databases to determine the extent to which asset managementsystem objectives, such as highway safety, are being achieved.
Closely related to highway safety management is risk management. A risk management system is acollection of operational procedures to minimize loss due to tort liability. Risk management systems havebeen developed to address the rapid upsurge in tort claims following the loss of sovereign immunity [Yuand Demetsky, 1992; Gittings, 1989]. Risk management operational procedures include facility improve-ment, legal measures, and highway policy implementation. Of these procedures, facility improvement islinked directly to highway asset management.
66.5 General Requirements of Highway Asset Management System
The primary function of a highway asset management system is to serve as a decision-making tool forhighway agencies. Toward this end, the system must satisfy the following criteria [Sinha and Fwa, 1989;FHWA and AASHTO, 1996]:
Comprehensiveness: A highway asset management system must address all major issues affecting theperformance of highways. Elements from each dimension of the asset management matrix struc-ture should be considered. Because of the multiobjective nature of the system, solutions developedfor individual subsystems or for a single objective are unlikely to be globally optimal for the totalhighway asset management system.
Flexibility: The management system must be flexible to accommodate variations in different regions ofa highway network. Such variations include highway functional class, unit costs of highway activities,priorities among system objectives, preferences over different highway functional activities, differ-ences in climatic and environmental conditions, and so on. Management system needs also changewith time as responsibilities shift, infrastructure elements change, organization and budget compo-sitions are restructured, and new technologies are developed. A management system should thereforebe capable to the type of agency it is intended to serve and flexible to changing requirements.
Sensitivity: To be a good strategic decision-making aid, the highway asset management system mustbe capable of analyzing the impacts of changing macroeconomic factors such as inflation, energyprice and availability, changes in automobile and truck characteristics, and changes in type andintensity of traffic loadings. It should also be capable of analyzing the implications of differenthighway policy decisions.
Coordination: Most state highway agencies currently operate management systems that could providevaluable information for highway asset management. These systems are intended to cyclicallymonitor the condition, measure real-life performance, predict future trends, recommend candidateprojects and preservation treatments, and monitor the implications of investments (or lackthereof) on system objectives, such as safety and congestion.
In a primer for asset management [FHWA, 1999], it is stated that asset management should be guidedby principles of customer focus, system orientation, long-term planning, and flexibility, among others.
© 2003 by CRC Press LLC

Highway Asset Management 66-31
Conclusion
Highway asset management combines the various management systems into a single integrated system,thus enabling the evaluation of impacts of operational function decisions made in one system onperformance measures in another system. For instance, it makes possible the determination of system-wide increases in crash rates if annual expenditure on roadside safety–enhancing facilities is decreasedin favor of pavement repair. Highway asset management systems provide decision-making tools toimprove highway transportation services with limited resources. As transportation needs and facilitiesof communities differ vastly, so do the management systems of their highway agencies. Important factorsinfluencing the type and scope of management systems are the nature of the facilities to be provided andmaintained and the available funds, equipment, and manpower. Highway asset management is an evo-lutionary process that is expected to be responsive to the needs of road users and highway agencies.Operational functions such as data collection, analysis, optimization, and strategy selection should bepursued continuously, and tools and technologies used in asset management need to be regularly updatedand improved. The component management systems of asset management need to be updated as needed,such as improvements in data quality and relationships to other management systems. It is importantthat highway asset management systems are flexible, keeping abreast of the changing needs of highwaytransportation, yet robust enough to be applicable in a wide variety of areas related to asset management.
Defining Terms
Asset valuation — The use of depreciation or other approaches to determine the value of a highwayasset at a given point in time.
Bayesian estimates — A statistical technique used to update estimates when new data become available.Cash flow — The sequence of benefits and costs over time, associated with an alternative (not all of
which need to involve monetary transactions).Distress — Deterioration in the condition of a physical highway asset, such as cracking or rutting of a
highway pavement.Dynamic programming — The technique used to formulate and solve optimization problems by recur-
sively solving subproblems.Geographic Information Systems — A database with capabilities to manipulate, analyze, and display
spatial data.Global Positioning System — Technology developed by the military that uses satellites to determine
the latitude and longitude of a position anywhere in the world.Heuristic optimization — Techniques used to find satisfactory, not necessarily optimal, solutions to
optimization problems. Some heuristic techniques provide solutions with values that differfrom the optimal solution value by not more than a provable bound.
Linear programming — The techniques used to formulate and solve optimization problems in whichthe decision variables are continuous and the objective function and constraints are linear.
Location referencing system — A system that uniquely describes the geographical location of a featurewith respect to some projection or other position referencing system.
Markov chain — A stochastic process in which the present state of the system determines the futureevolution of the process independently of the past.
Mixed-integer programming — The techniques used to formulate and solve optimization problemsin which at least some decision variables are discrete and the objective function and constraintsare linear.
Network-level analysis — The evaluation of dependent or independent alternatives for a set of highwayasset facilities.
Network-level optimization — The techniques used to formulate and solve optimization problems insuch a way that the polynomial time algorithms developed for some network problems can beused.
© 2003 by CRC Press LLC

66-32 The Civil Engineering Handbook, Second Edition
Ordinary least squares — A technique for calculating the regression equation that minimizes the sumof the squares of the error terms, that is, the differences between the observed and predictedvalues for the dependent variable.
Pavement profile — The vertical shape of the pavement surface.Pavement segment — A length of pavement that forms the basic unit for which data is collected, stored,
and analyzed and for which alternatives are evaluated and decisions are taken.Programming — The determination and scheduling of activities to be performed and the resources
needed to implement the program.Project-level analysis — The evaluation of mutually exclusive alternatives for a single physical highway
asset.Regression analysis — The technique of mathematically estimating the parameters of functions
describing a process to fit the functions to data.Sampling technique — The method used to choose units of physical highway assets to include in the
sample, with the objective of obtaining a statistically adequate, representative sample at reason-able costs.
Abbreviations
References
American Association of State Highway and Transportation Officials (AASHTO), AASHTO Guidelinesfor Pavement Management Systems, Washington, D.C., 1990.
Choocharukul, K. and Sinha, K.C., Development of a Congestion Management System Methodology forIndiana, Draft Final Report, Joint Transportation Research Program, Purdue University, WestLafayette, IN, 2000.
Denardo, E.V., Dynamic Programming: Models and Applications, Prentice Hall, Englewood Cliffs, NJ, 1981.Dornan, D., What Is GASB34 and How Is It Related to Asset Management?, paper presented at 4th
National Asset Management Conference, Madison, WI, 2001.
AADT Annual average daily trafficAASHTO American Association of State Highway and Transportation OfficialsAHP Analytic hierarchy processBMS Bridge management systemCMS Congestion management systemCRC Continuously reinforced concreteDP Dynamic programmingFHWA Federal Highway AdministrationGASB Governmental Accounting Standards BoardGIS Geographical Information SystemsGPS Global Positioning SystemJCP Jointed concrete pavementLCC Life cycle costLOS Level of serviceLP Linear programmingMIP Mixed-integer programmingMMS Maintenance management systemOLS Ordinary least squaresPCC Portland cement concretePMS Pavement management systemRTRRM Response-type road roughness meterSMS Safety management system
© 2003 by CRC Press LLC

Highway Asset Management 66-33
Farooq, O. et al., Development of a Highway Safety, Management System for Indiana: Phase I, JointTransportation Research Program, Purdue University, West Lafayette, IN, 1995.
Federal Highway Administration, Bridge Management Systems, Demonstration Project 71, U.S. Depart-ment of Transportation, Washington, D.C., 1987.
Federal Highway Administration, Automated Pavement Condition Data Collection Equipment, U.S. Depart-ment of Transportation, Washington, D.C., 1989.
Federal Highway Administration, Advanced Course on Pavement Management, U.S. Department of Trans-portation, Washington, D.C., 1991.
Federal Highway Administration, Asset Management Primer, Office of Asset Management, U.S. Depart-ment of Transportation, Washington, D.C., 1999.
Federal Highway Administration (FHWA) and American Association of State Highway and Transporta-tion Officials (AASHTO), Asset Management: Advancing the State of the Art into the 21st Centurythrough Public-Private Dialogue, U.S. Department of Transportation and AASHTO, Washington,D.C., 1996.
Garcia-Diaz, A. and Liebman, J.S., Optimal strategies for bridge replacement, Transp. Eng. J. ASCE, 109, 1983.Gittings, G.L., Attacking tort liability through an improved risk management process: a state perspective,
Transp. Q., 43, 1989.Governmental Accounting Standards Board (GASB), GASB Statement No. 34: Basic Financial Statements
and Management’s Discussion and Analysis for State and Local Governments, Norwalk, CT, 1999.Haas, R., Hudson, W.R., and Zaniewski, J., Modern Pavement Management, Krieger Publishing, Malabar,
FL, 1994.Jiang, Y. and Sinha, K.C., The Development of Optimal Strategy for Maintenance, Rehabilitation and
Replacement of Highway Bridges, Final Report Volume 6: Performance and Optimization, JointTransportation Research Program, Purdue University, West Lafayette, IN, 1990.
Kleywegt, A.J. and Sinha, K.C., Tools for Bridge Management Data Analysis, Transportation ResearchCircular 423 (Characteristics of Bridge Management Systems), Transportation Research Board,National Research Council, Washington, D.C., 1994.
Labi, S., Impact Evaluation of Highway Pavement Maintenance Activities, Ph.D. dissertation, PurdueUniversity, West Lafayette, IN, 2001.
Mahoney, J.P. and Lytton, R.L., Measurement of Pavement Performance Using Statistical Sampling Tech-niques, Research Report 207-2, Texas Transportation Institute, Texas A&M University, CollegeStation, TX, 1978.
Markow, M.J. et al., Role of Highway Maintenance in Integrated Management Systems, NCHRP Report363, National Academy Press, Washington, D.C., 1994.
Maze, T.H., Valuing Transportation Assets: What Are the Possible Approaches?, paper presented at 4thNational Asset Management Conference, Madison, WI, 2001.
National Archives and Records Administration (NARA), Interim Final Rule, Federal Register, Vol. 58,No. 229, Washington, D.C., December 1, 1993.
Reno, A.T., Shaw, and Hyman, W.A., NCHRP Synthesis of Highway Practice 366: Guidelines for EffectiveMaintenance Budgeting Strategies, Transportation Research Board, National Research Council,Washington, D.C., 1994.
Saaty, T.L., A scaling method for priorities in hierarchical structures, J. Math. Psychol., 15, 1977.Sherali, H.D., Jarvis, J.J., and Bazaraa, M.S., Linear Programming and Network Flows, John Wiley & Sons,
Inc., New York, 1992.Strategic Highway Research Program (SHRP), Distress Identification Manual for the Long-Term Pavement
Performance Studies, National Research Council, Washington, D.C., 1993.Sinha, K.C. and Fwa, T.F., On the Concept of Total Highway Management, Transportation Research
Record 1229, Transportation Research Board, National Research Council, Washington, D.C., 1989.Sinha, K.C. et al., The Development of Optimal Strategy for Maintenance, Rehabilitation and Replace-
ment of Highway Bridges, Final Report Volume 1: The Elements of the Indiana Bridge ManagementSystem, Joint Transportation Research Program, Purdue University, West Lafayette, IN, 1991.
© 2003 by CRC Press LLC

66-34 The Civil Engineering Handbook, Second Edition
Steuer, R., Multiple Criteria Optimization: Theory, Computation, and Application, John Wiley & Sons,Inc., New York, 1986.
Texas Transportation Institute, Urban Roadway Congestion Annual Report 1998, College Station, TX,1998.
Yu, K. and Demetsky, M.J., A Framework for Evaluation of Risk Management Programs in State Depart-ments of Transportation: Risk Management Systems Volume III, Transportation Research Record1345, Transportation Research Board, National Research Council, Washington, D.C., 1992.
© 2003 by CRC Press LLC