chapter 6: bond primer
TRANSCRIPT
Chapter 6 1
CHAPTER 6Bond Primer
This chapter explores the basis of bond pricing and portfolio management. This chapter is organized into the following sections:
1. Yield Concepts
2. Bond Market Instruments
3. Principles of Bond Price Movements
4. Duration
5. Term Structure of Interest Rates
6. Bond Portfolio Immunization
Chapter 6 2
Yield Concepts
Pure Discount Bond (Zero Coupon Bond)
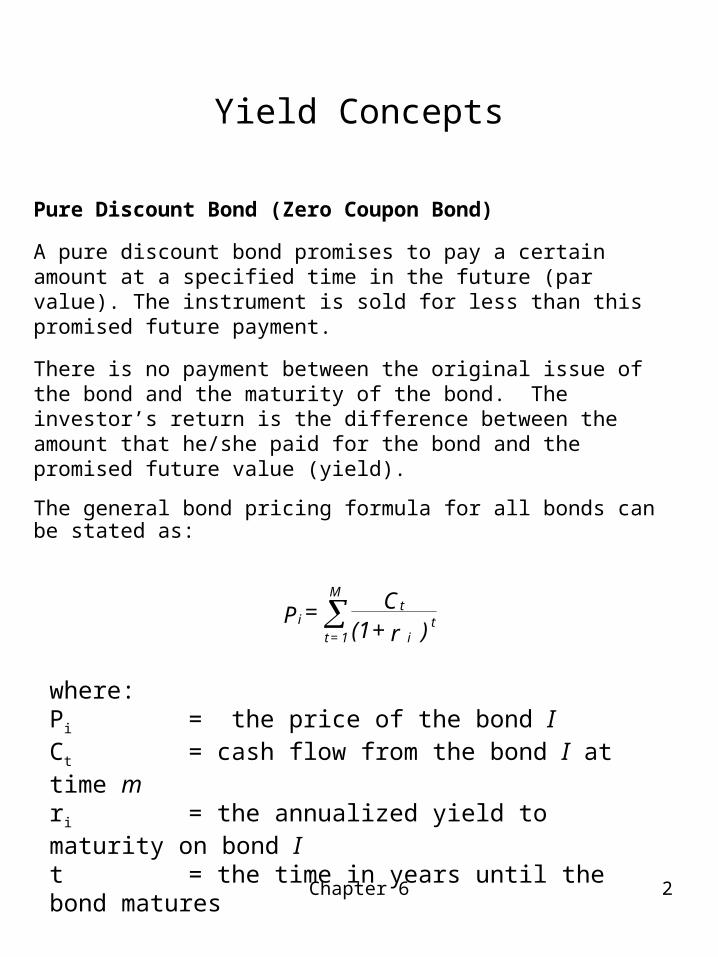
A pure discount bond promises to pay a certain amount at a specified time in the future (par value). The instrument is sold for less than this promised future payment.
There is no payment between the original issue of the bond and the maturity of the bond. The investor’s return is the difference between the amount that he/she paid for the bond and the promised future value (yield).
The general bond pricing formula for all bonds can be stated as:
)r + (1C = P t
i
tM
1 = ti
where:Pi = the price of the bond ICt = cash flow from the bond I at time mri = the annualized yield to maturity on bond It = the time in years until the bond matures
Chapter 6 3
Yield Concepts
Bond Discount
The bond discount is the difference between the par value and the selling price.
Yield to Maturity
The yield is the promised payment that the bond holder will realize after buying and holding the bond until maturity.
The appropriate current price of a bond is determined by calculating the present value of the par value.
In order to calculate the present value of the par value, we must first know the appropriate interest rate.
The interest rate is dependent upon general interest rate levels in the economy, and the riskiness of the bond. That is, the probability that the investor receives the par value as promised.

Chapter 6 4
Pure Discount Bond
Suppose you have a pure discount bond that agrees to pay $1,000 five years from today. The bond discount rate is 12%.
What is the appropriate price for this bond?
43.567$12.1
1000$5
) ( = P
0 5
?? $1,000
)r + (1C = P t
i
m i

Chapter 6 5
Pure Discount Bond
Bond Discount = Face Value –Current Price
Bond Discount = $1,000-$567.43
Bond Discount = $432.57
0 5
-$567.43 $1,000Price Par Value
Chapter 6 6
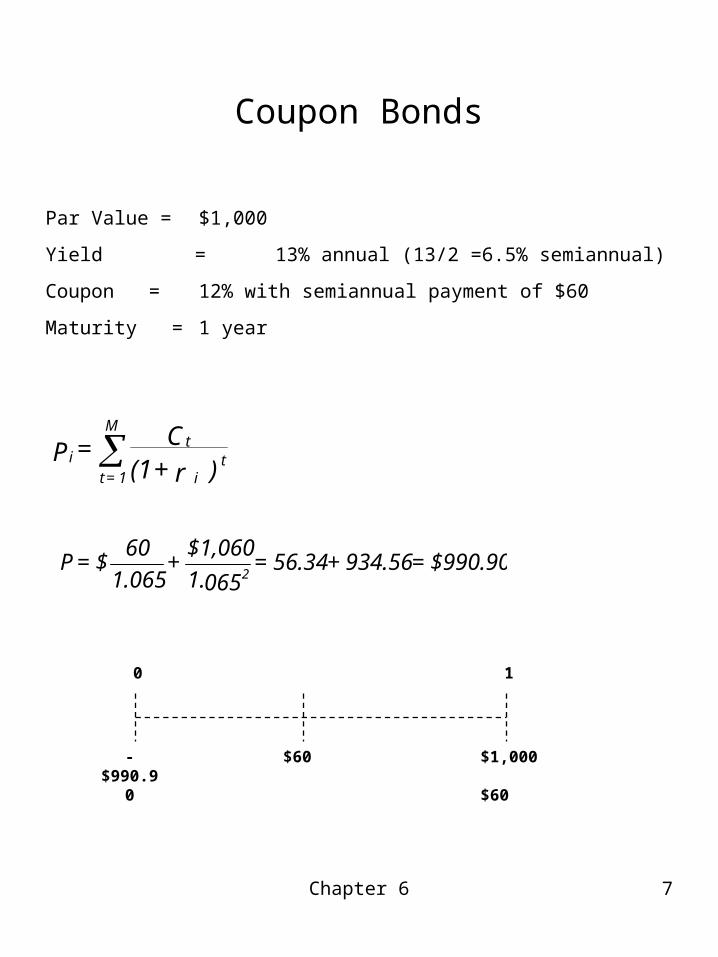
Coupon Bonds
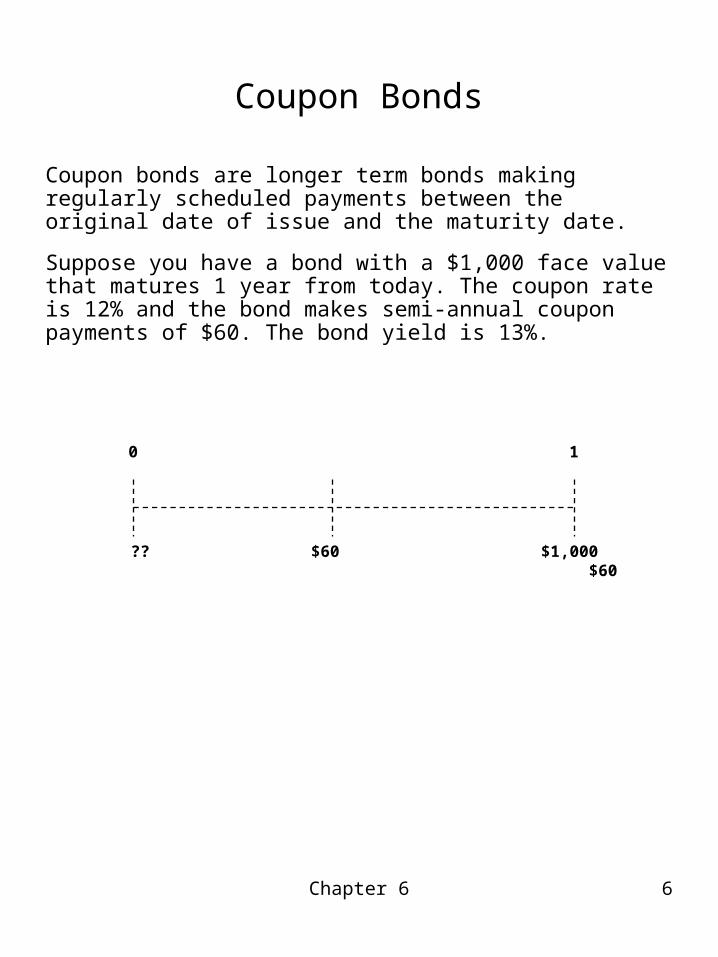
Coupon bonds are longer term bonds making regularly scheduled payments between the original date of issue and the maturity date.
Suppose you have a bond with a $1,000 face value that matures 1 year from today. The coupon rate is 12% and the bond makes semi-annual coupon payments of $60. The bond yield is 13%.
0 1
?? $1,000 $60
$60
Chapter 6 7
Coupon Bonds
Par Value = $1,000
Yield = 13% annual (13/2 =6.5% semiannual)
Coupon = 12% with semiannual payment of $60
Maturity = 1 year
)r + (1C = P t
i
tM
1 = ti
$990.90 = 934.56 + 56.34 = 0651.
$1,060 + 1.065
60$ = P2
0 1
-$990.90 $1,000 $60
$60

Chapter 6 8
Accrued Interest
Accrued interest is portion of the next coupon payment that has been earned at the time of purchase.
The accrued interest (AI) is calculated using the following formula:
paymentscoupon between dayspaymentcoupon last since daysPayment Coupon = AI
Chapter 6 9
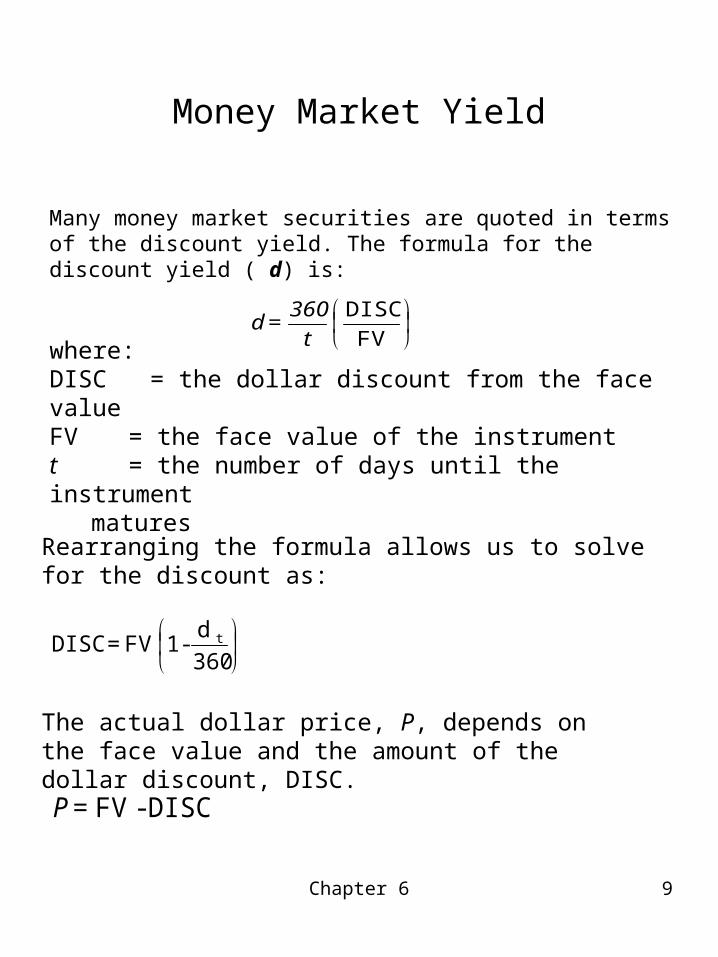
Money Market Yield
Many money market securities are quoted in terms of the discount yield. The formula for the discount yield ( d) is:
FVDISC
t360 = d
where:DISC = the dollar discount from the face valueFV = the face value of the instrumentt = the number of days until the instrument
matures
DISC - FV = P
360 d - 1 FV = DISC t
Rearranging the formula allows us to solve for the discount as:
The actual dollar price, P, depends on the face value and the amount of the dollar discount, DISC.

Chapter 6 10
Money Market Yield
Example: 90-Day Money Market
Par value = $1,000,000
Discount yield = 11%
$27,500 = 360
(90) .11 $1,000,000 = DISC
P = FV - DISC = $1,000,000 - $27,500 = $972,500
Chapter 6 11
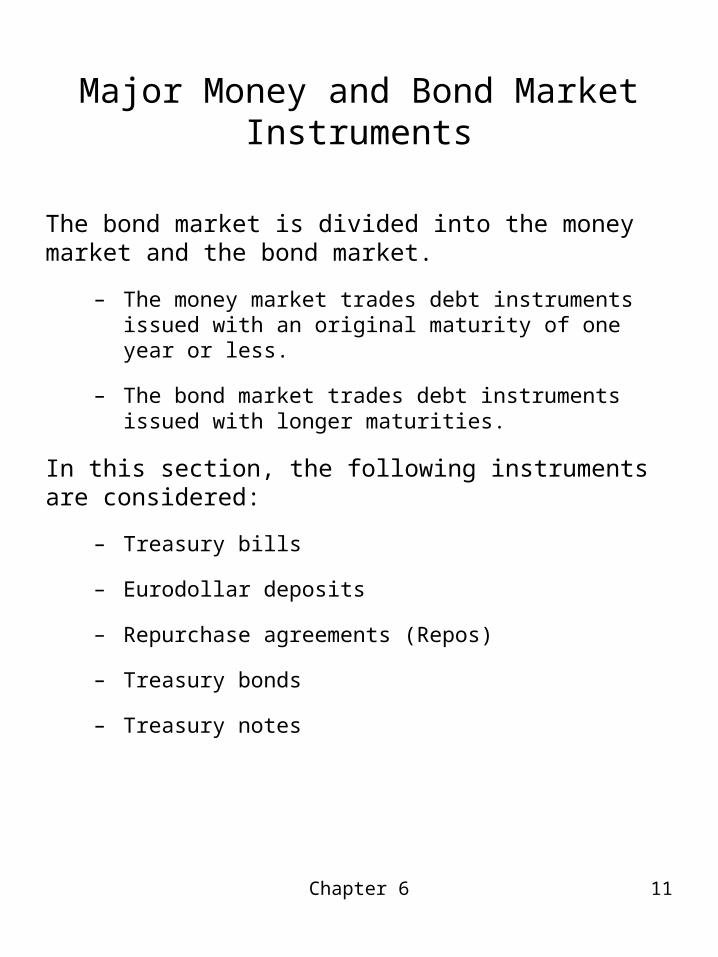
Major Money and Bond Market Instruments
The bond market is divided into the money market and the bond market.
– The money market trades debt instruments issued with an original maturity of one year or less.
– The bond market trades debt instruments issued with longer maturities.
In this section, the following instruments are considered:
– Treasury bills
– Eurodollar deposits
– Repurchase agreements (Repos)
– Treasury bonds
– Treasury notes
Chapter 6 12
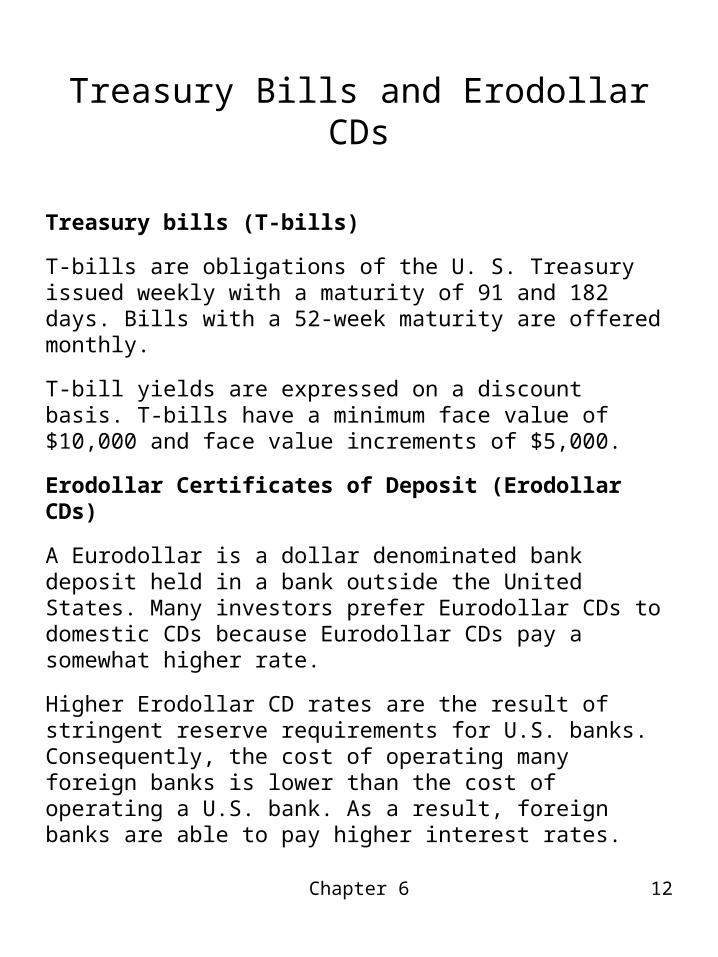
Treasury Bills and Erodollar CDs
Treasury bills (T-bills)
T-bills are obligations of the U. S. Treasury issued weekly with a maturity of 91 and 182 days. Bills with a 52-week maturity are offered monthly.
T-bill yields are expressed on a discount basis. T-bills have a minimum face value of $10,000 and face value increments of $5,000.
Erodollar Certificates of Deposit (Erodollar CDs)
A Eurodollar is a dollar denominated bank deposit held in a bank outside the United States. Many investors prefer Eurodollar CDs to domestic CDs because Eurodollar CDs pay a somewhat higher rate.
Higher Erodollar CD rates are the result of stringent reserve requirements for U.S. banks. Consequently, the cost of operating many foreign banks is lower than the cost of operating a U.S. bank. As a result, foreign banks are able to pay higher interest rates.
Chapter 6 13
Repurchase Agreement
Repurchase agreements arise when one party sells a security to another party and agrees to buy it back (repurchase it) at a specified time and at a specified price.
The Wall Street Journal, Money Rates section has the yield quotations on money market instruments.
Insert Figure 6.1 here
Money Rates
Chapter 6 14
Treasury Bond and Treasury Notes
T-bonds, and T-notes are issued by the Treasury Department. Both T-bonds and T-notes pay semiannual coupon payments. Most T-bonds are callable, with the first call date coming five years before the bond matures (a call feature allows the issuer to pay off the loan early).
T-bonds and T-notes are referenced as follows:
Ten-and-three-eights of 2007 to 2012.
This notation refers to a bond that has:
Coupon Rate = 10-3/8%
Maturity = 2012
Callable = Beginning 2007
T-bonds are quoted as in 32nds of par. Thus, a bond having a quoted price of 98:20 is trading for 98.625% of par value.
Figure 6.2 illustrates T-bond and T-notes quotations.
Chapter 6 15
Treasury Bond and Treasury Notes
Insert Figure 6.2 here

Chapter 6 16
Bond Price Changes Due to The Passing of Time
At maturity the price of a bond must equal its par value. Because of this, bond prices change due merely to the passage of time. Bonds can be classified as:
Premium Bond: Price exceeds its face value Price must fall over its life
Par Bond: Price equals its face value Price may remain the same over time
Discount Bond Prices below its face value Price must rise to reach par value at
maturity.
To examine the price path of bonds over time, we consider three bonds. Assume that the interest rates are a constant 10%, so bond 1 is a premium bond, bond 2 is a par bond, and bond 3 is a discount bond.
Interest rates: 10% constantBond 1: 20-year 12% couponBond 2: 20-year 10% couponBond 3 20-year 8% coupon
Chapter 6 17
Bond Price Changes due to The Passing of Time
Figures 6.3 illustrates the time path of these bond prices.
Insert figure 6.3 here
Chapter 6 18
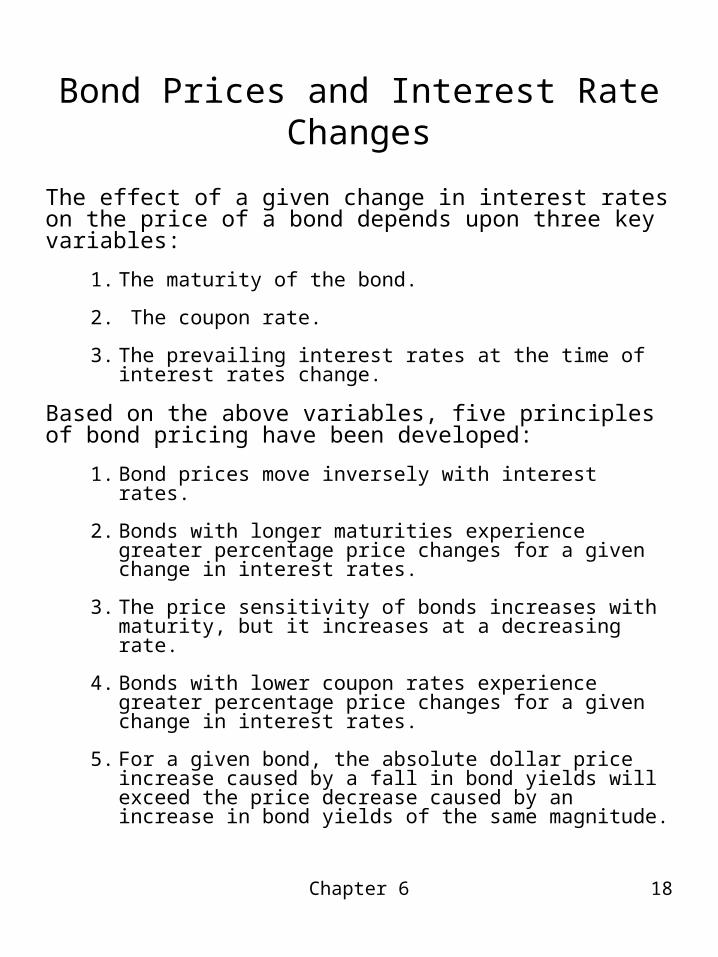
Bond Prices and Interest Rate Changes
The effect of a given change in interest rates on the price of a bond depends upon three key variables:
1. The maturity of the bond.
2. The coupon rate.
3. The prevailing interest rates at the time of interest rates change.
Based on the above variables, five principles of bond pricing have been developed:
1. Bond prices move inversely with interest rates.
2. Bonds with longer maturities experience greater percentage price changes for a given change in interest rates.
3. The price sensitivity of bonds increases with maturity, but it increases at a decreasing rate.
4. Bonds with lower coupon rates experience greater percentage price changes for a given change in interest rates.
5. For a given bond, the absolute dollar price increase caused by a fall in bond yields will exceed the price decrease caused by an increase in bond yields of the same magnitude.

Chapter 6 19
Bond Prices and Interest Rate Changes
The following example illustrates the sensitivity of bonds to interest rates changes.
Consider two bonds. Both bonds initially have a 10% discount rates.
Notice that when the discount rate increases to 12%, the price of Bond B changes more than the price of Bond A.
This example illustrates three important bond characteristics:
1. Bond prices move inversely with interest rates.
2. Bonds with longer maturities experience greater percentage price changes for a given change in interest rates.
3. Bonds with lower coupon rates experience greater percentage price changes for a given change in interest rates.
Bond Maturity Coupon Rate
Price at 10%
Price at 12%
% of Change
Bond A 5 years 10% $1,000 $926.40 7.36% Bond B 30 years 6% $ 661.41 $515.16 17.10%

Chapter 6 20
Bond Prices and Interest Rate Changes
Table 6.1
Price Sensitivity of Bonds C and D
Bond C
15Byear, 8% Coupon
Bond D
20BYear 8% Coupon
Yield Change
Yield (%)
Price
($)
% Price Change
Yield (%)
Price
($)
% Price Change
B2%
9.94
86.68
+16.01
11.73
73.38
+16.01 Before Change
11.94
74.66
0.00
13.73
63.25
0.00
+2%
13.94
65.06 B12.87
15.73
55.15
B12.80
This example shows two important points:
– Holding coupon and maturity constant, a bond with a higher yield has a lower price sensitivity.
– Coupon and maturity are generally not equal across bonds.
Table 6.1 examines two bonds that are similar in all respect except bond C has 15 years to maturity while Bond D has 20 years to maturity.
Chapter 6 21
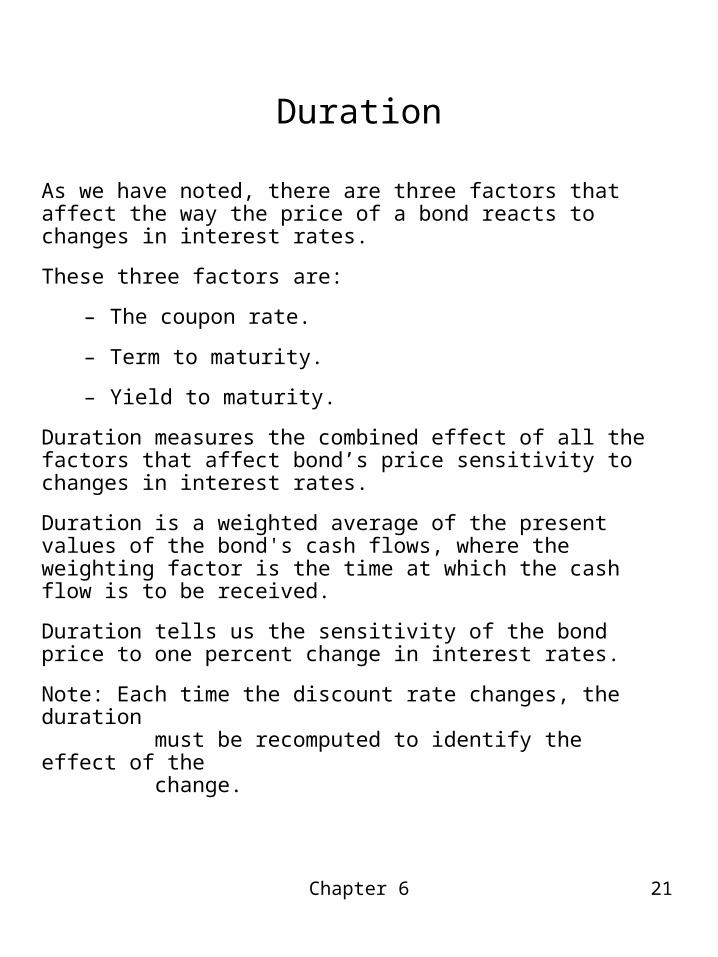
Duration
As we have noted, there are three factors that affect the way the price of a bond reacts to changes in interest rates.
These three factors are:
– The coupon rate.
– Term to maturity.
– Yield to maturity.
Duration measures the combined effect of all the factors that affect bond’s price sensitivity to changes in interest rates.
Duration is a weighted average of the present values of the bond's cash flows, where the weighting factor is the time at which the cash flow is to be received.
Duration tells us the sensitivity of the bond price to one percent change in interest rates.
Note: Each time the discount rate changes, the duration must be recomputed to identify the effect of the change.
Chapter 6 22
Duration
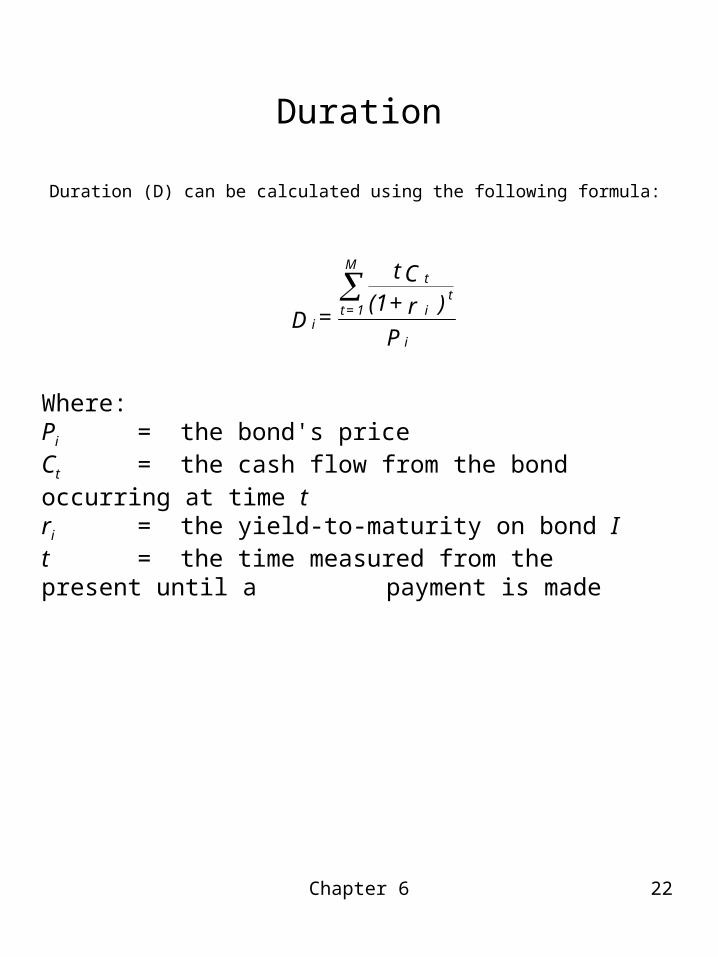
Duration (D) can be calculated using the following formula:
Where:Pi = the bond's priceCt = the cash flow from the bond occurring at time tri = the yield-to-maturity on bond It = the time measured from the present until a
payment is made
P)r + (1
C t = D
i
t i
t M
1 = ti

Chapter 6 23
Duration
To illustrate the calculations of duration, consider a 5-year bond paying an annual coupon rate of 10%. The bond yields 14% and has a part value of $1,000. Currently the bond is priced at $862.69.
Table 6.2 shows the cash flows and calculations of this bond’s duration.
Table 6.2
The Calculation of Duration
t
1
2
3
4
5
Ct
$100.00
$100.00
$100.00
$100.00
$1,100.00 Ct /(1 + r)t
87.72
76.95
67.50
59.21
571.31
t [Ct /(1 + r )t ]
87.72
153.90
202.50
236.84
2,856.55 Di = (87.72 + 153.90 + 202.50 + 236.84 + 2,856.55)/862.69 = 3,537.51/862.69 = 4.10

Chapter 6 24
Duration
The following equation expresses duration as the negative of elasticity of the bond's price with respect to a change in the discount factor (1 + r).
Where: dP = change in the priced(1 + r) = change in the interest rate
Duration gives a single measure of the bond price change for a change in the discount factor (1 + r).
Rearranging the above equation give us:
P )r + (1)r + (1 d D - = dP i
i
i i i
The change in bond price associated with a one time shift in the interest rates.
r
rdP
dP
D
11

Chapter 6 25
Duration
Using a duration of 4.10, assume that yields suddenly fell from 14 to 12 percent. The bond's price would rise. The amount of the change in price is computed as:
$62.05 + = $862.69 1.14
.02- 4.10 - = dP
With this change in price, the new price should be the old price plus the price change.
New Price = 862.69 + 62.05 = $924.74
Bond investors can compare the price movement sensitivities of different bonds by simply comparing their durations.
Chapter 6 26
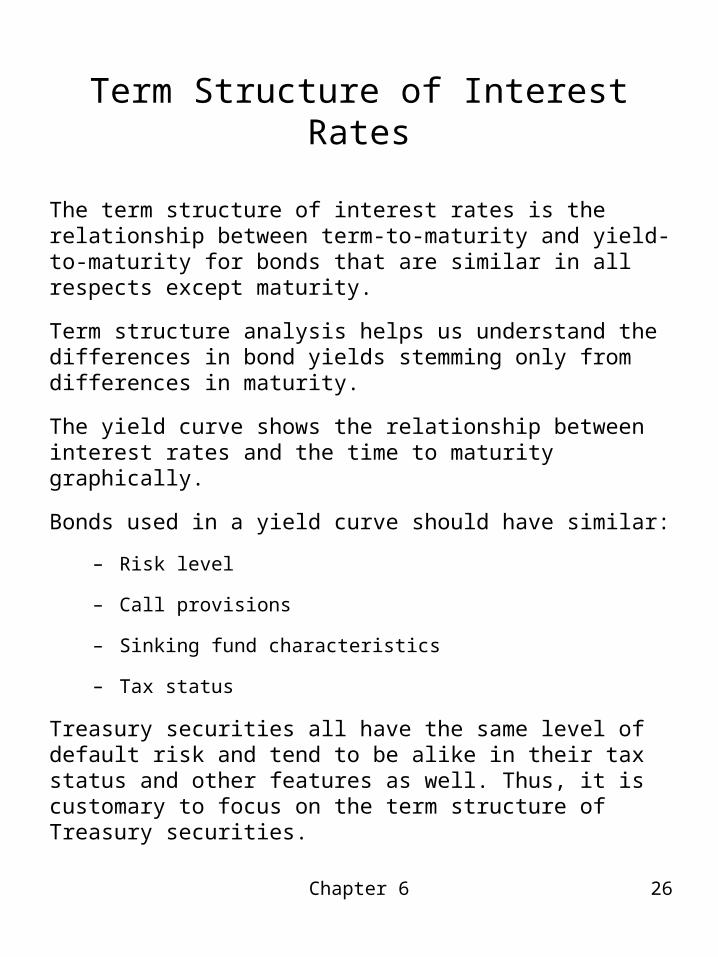
Term Structure of Interest Rates
The term structure of interest rates is the relationship between term-to-maturity and yield-to-maturity for bonds that are similar in all respects except maturity.
Term structure analysis helps us understand the differences in bond yields stemming only from differences in maturity.
The yield curve shows the relationship between interest rates and the time to maturity graphically.
Bonds used in a yield curve should have similar:
– Risk level
– Call provisions
– Sinking fund characteristics
– Tax status
Treasury securities all have the same level of default risk and tend to be alike in their tax status and other features as well. Thus, it is customary to focus on the term structure of Treasury securities.
Chapter 6 27
Treasury Yield Curve
The Treasury yield curve as displayed in Figure 6.4 provides the basic yield curve.
Insert figure 6.4 here
Chapter 6 28
Treasury Yield Curve
At various times, the yield curve takes on different shapes as illustrated in Figure 6.5.
Insert figure 6.5 here

Chapter 6 29
Forward Rates
Forward rates of interest are rates which cover future time periods. Forward rates occur if the time covered begins after time = 0.
A spot rate is a yield prevailing at a given moment in time on a security. Forward rates are implied by currently available spot rates.
Bond Yield Notation:
the rate to prevail on a bond for the period beginning at time “x” and maturing at time “y”
Present time is = 0
If today is Jan 1, 2007, we would denote a bond covering a period from January 1, 2008 through January 1, 2009 as R1,2.
yxR ,

Chapter 6 30
Forward Rates
Principle of calculation for Forward Rates
Examples
r0,5= spot rate for an instrument maturing in 5 years.
r2,5 = forward rate covering a 3-year period beginning 2 years from now.
0 52
Spot rate instrument expires 2 yrs.Rate known today
Spot rate instrument expires 5 yrs.Rate known today
Future rate instrument expires 3 yrs?Rate unknown today
Forward rates are calculated on the assumption that returns over a given period of time are all equal, no matter which maturities of bonds are held over that span of time.
Chapter 6 31
Forward Rates
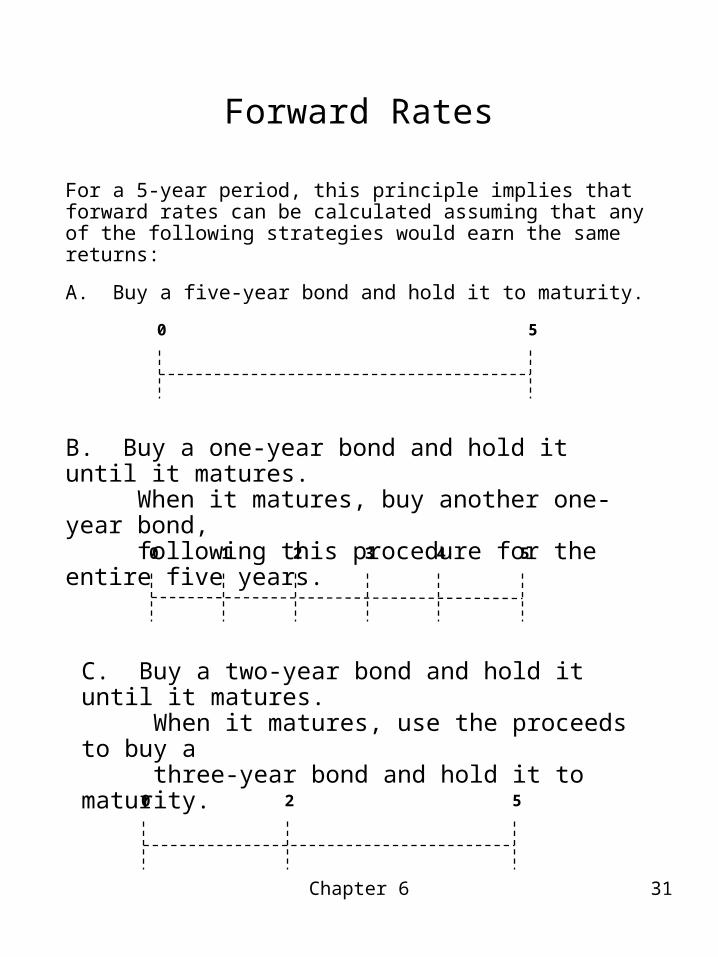
For a 5-year period, this principle implies that forward rates can be calculated assuming that any of the following strategies would earn the same returns:
A. Buy a five-year bond and hold it to maturity.
B. Buy a one-year bond and hold it until it matures. When it matures, buy another one-year bond, following this procedure for the entire five years.
C. Buy a two-year bond and hold it until it matures. When it matures, use the proceeds to buy a three-year bond and hold it to maturity.
0 5
0 51 2 3 4
0 52

Chapter 6 32
Forward Rates Forward Rates
These three strategies can be expressed as:
1. Hold one five-year bond for five years:
Total Return = (1 + r0,5)5
2. Hold a sequence of one-year bonds:
Total Return = (1 + r0,1)(1 + r1,2)(1 + r2,3)(1 + r3,4)(1 + r4,5)
3. Hold a two-year bond followed by a three-year bond:
Total Return = (1+r0,2)2(1+r2,5)3
Chapter 6 33
Forward Rates
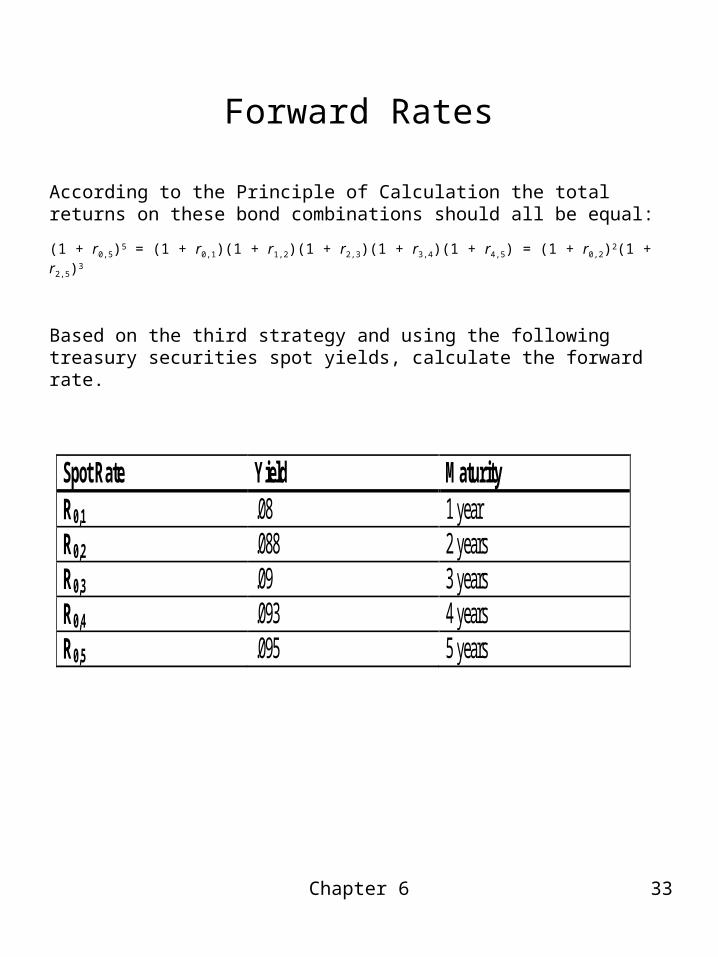
According to the Principle of Calculation the total returns on these bond combinations should all be equal:
(1 + r0,5)5 = (1 + r0,1)(1 + r1,2)(1 + r2,3)(1 + r3,4)(1 + r4,5) = (1 + r0,2)2(1 + r2,5)3
Based on the third strategy and using the following treasury securities spot yields, calculate the forward rate.
Spot Rate Yield Maturity R0,1 .08 1 year R0,2 .088 2 years R0,3 .09 3 years R0,4 .093 4 years R0,5 .095 5 years

Chapter 6 34
Forward Rates
Comparing strategies 1 to strategy 3, we have:
(1 + r0,5)5 = (1 + r0,2)2(1 + r2,5)3
Using the spot rates given above:
(1.095)5 = (1.088)2 (1 + r2,5)3
Solving for the forward rate:
r2,5 = .0997 = 9.97%
Notice the small difference in yield between holding the 5-year bond and the combination of the 2-year and 3-year bonds.

Chapter 6 35
Theories of The Term Structure
This section explores three theories of the term structure:
1. The Pure Expectations Theory
2. The Liquidity Premium Theory
3. The Market Segmentation Theory
Chapter 6 36
The Pure Expectations Theory
The Pure Expectations Theory states that forward rates are unbiased estimators of future interest rates, or that forward rates equal expected future spot rates of interest.
In other words, the Pure Expectations Theory claims that, on average, today's forward rate equals the future spot rate for the period corresponding to the forward rate.
This theory assumes that many investors don’t have strong maturity preferences.
In our previous example, the forward rate was 9.97%
The Pure Expectations Theory would say that 9.97% is a good estimate of the spot rate that will prevail on a three-period bond two periods from now.
Chapter 6 37
The Liquidity Premium Theory
The Liquidity Premium Theory holds that forward rates are upwardly biased estimators of expected future spot rates. The theory asserts that the estimates are too high and that forward rates exceed expected future spot rates. This theory rejects the claim that there are numerous investors who are indifferent about the maturities of the bonds that they hold.
Forward rates exceed expected future spot rates of interest by the amount of the liquidity premium. Therefore, forward rates are biased predictors of future spot rates.
The defenders of this theory assert that investors prefer to hold short-term bonds rather than long-term bonds, and that investors are willing to pay more for short-term bonds.
The extra amount paid is referred to as a liquidity premium. Thus, long-term bonds must pay a greater return than short-term bonds to induce investors to commit their funds to the long-term bonds.
Chapter 6 38
The Liquidation Premium Theory Example
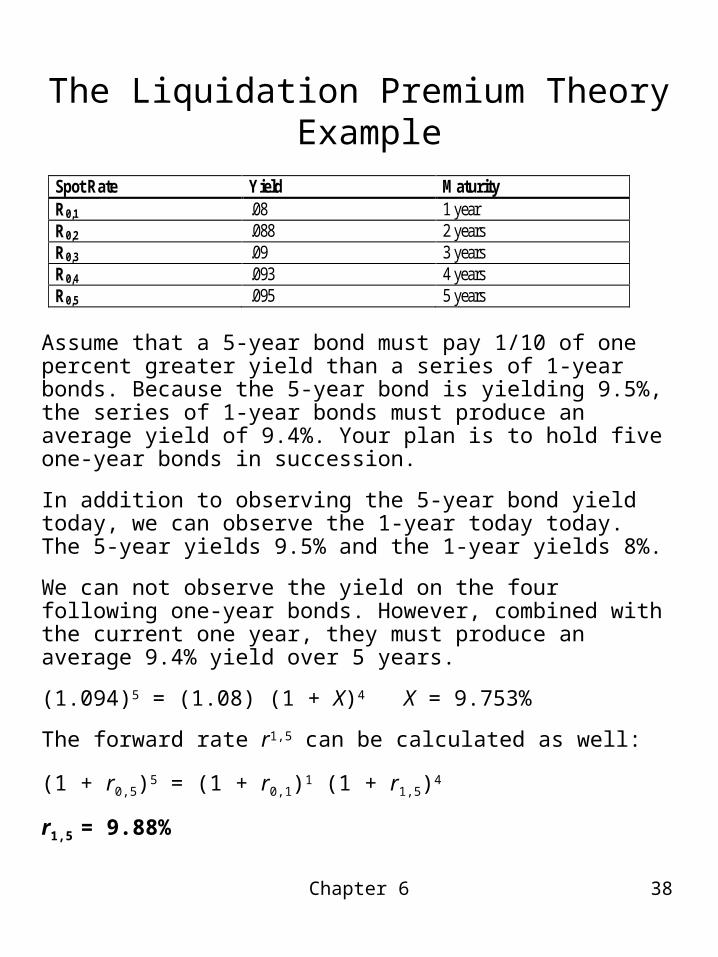
Spot Rate Yield Maturity R0,1 .08 1 year R0,2 .088 2 years R0,3 .09 3 years R0,4 .093 4 years R0,5 .095 5 years
Assume that a 5-year bond must pay 1/10 of one percent greater yield than a series of 1-year bonds. Because the 5-year bond is yielding 9.5%, the series of 1-year bonds must produce an average yield of 9.4%. Your plan is to hold five one-year bonds in succession.
In addition to observing the 5-year bond yield today, we can observe the 1-year today today. The 5-year yields 9.5% and the 1-year yields 8%.
We can not observe the yield on the four following one-year bonds. However, combined with the current one year, they must produce an average 9.4% yield over 5 years.
(1.094)5 = (1.08) (1 + X)4 X = 9.753%
The forward rate r1,5 can be calculated as well:
(1 + r0,5)5 = (1 + r0,1)1 (1 + r1,5)4
r1,5 = 9.88%
Chapter 6 39
The Market Segmentation Theory
The Market Segmentation Theory says the yield curve that exists at any one time reflects the actions and preferences of certain major participants in the bond market.
These major participants have preferred maturity ranges, but attractive yields in different maturities lead these participants to accept maturities outside the preferred range.

Chapter 6 40
Bond Portfolio Maturity Strategies
When an investor holds only a single bond, it is easy to understand and manage the maturity of the investment. However, when an individual holds multiple bonds, management of the average maturity can be difficult. There are two basic strategies for managing portfolio maturity:
The Laddered Strategy: funds in the bond portfolio are distributed approximately evenly over the range of maturities.
Advantage
– It is easy to maintain the same kind of maturity distribution with very little transaction cost.
Disadvantage
– Difficulty in changing the maturity composition of the portfolio.
The Dumbbell or Barbell Strategy: the funds in the bond portfolio are committed just to short maturity and to very long maturity bonds.
Advantages
– It is easy to change the maturity composition of the portfolio.
Disadvantages
– Requires greater management effort and higher transaction costs.

Chapter 6 41
Portfolio Immunization Techniques
In recognition of the inability to predict interest rates, many bond managers protect their portfolios from undesirable effects due to changes in interest rates by immunizing their portfolios.
A bond portfolio is immunized if its investment performance is not sensitive to changes in interest rates. A bond portfolio is immunized if its duration is equal to zero.
Immunization techniques fall into two categories which rely on the idea of duration:
1. The bank immunization case
2. The planning period case

Chapter 6 42
Bank Immunization Case
Commercial banks borrow money by accepting deposits and use those funds to make loans. The portfolio of deposits and the portfolio of loans may both be viewed as bond portfolios, with the deposit portfolio constituting the liability portfolio and the loan portfolio constituting the asset portfolio.
If a bank’s deposits and loans have different maturities, the bank may lose money in the event of an overall change in interest rate levels.
To eliminate this risk, banks may wish to immunize their portfolio. A portfolio is immunized if the value of the portfolio is not affected by a change in interest rates.
Immunization is accomplished by managing the duration of the portfolio.
Chapter 6 43
Bank Immunization Case
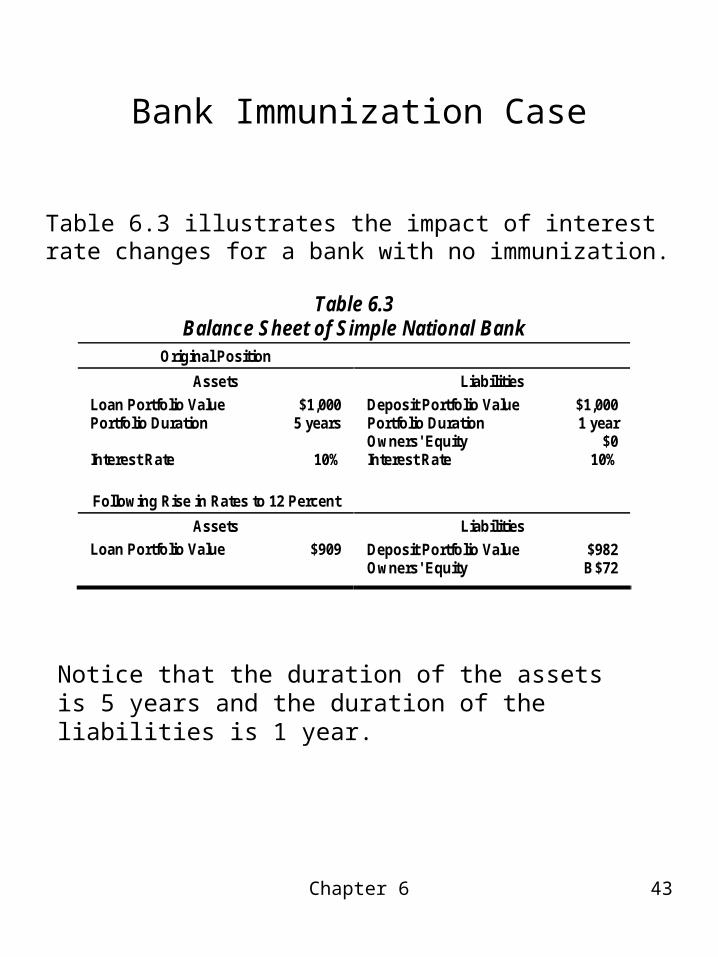
Table 6.3 illustrates the impact of interest rate changes for a bank with no immunization.
Table 6.3
Balance Sheet of Simple National Bank
Original Position
Assets
Liabilities Loan Portfolio Value $1,000 Portfolio Duration 5 years Interest Rate 10%
Deposit Portfolio Value $1,000 Portfolio Duration 1 year Owners' Equity $0 Interest Rate 10%
Following Rise in Rates to 12 Percent
Assets
Liabilities
Loan Portfolio Value $909 Deposit Portfolio Value $982 Owners' Equity B $72
Notice that the duration of the assets is 5 years and the duration of the liabilities is 1 year.
Chapter 6 44
Bank Immunization Case
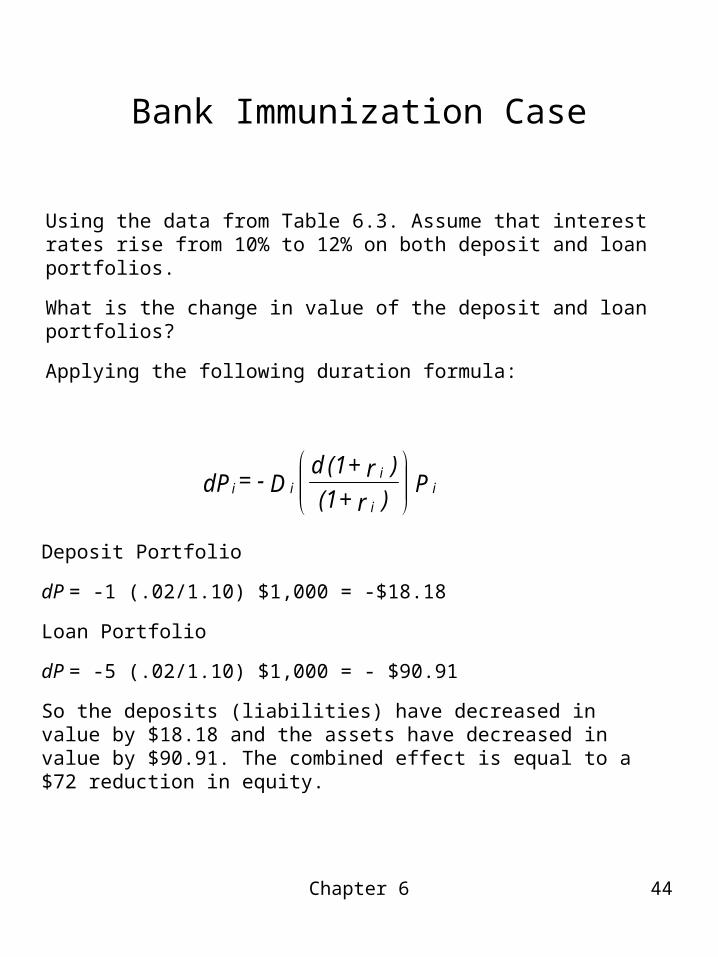
Using the data from Table 6.3. Assume that interest rates rise from 10% to 12% on both deposit and loan portfolios.
What is the change in value of the deposit and loan portfolios?
Applying the following duration formula:
P )r + (1)r + (1 d D - = dP i
i
i i i
Deposit Portfolio
dP = -1 (.02/1.10) $1,000 = -$18.18
Loan Portfolio
dP = -5 (.02/1.10) $1,000 = - $90.91
So the deposits (liabilities) have decreased in value by $18.18 and the assets have decreased in value by $90.91. The combined effect is equal to a $72 reduction in equity.
Chapter 6 45
Bank Immunization Case
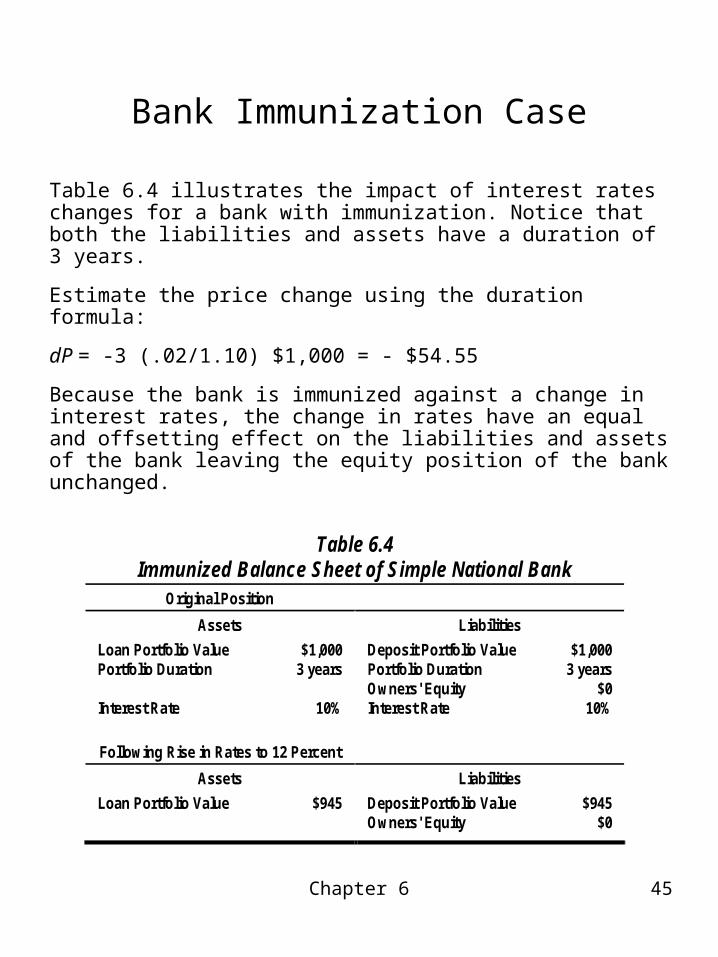
Table 6.4 illustrates the impact of interest rates changes for a bank with immunization. Notice that both the liabilities and assets have a duration of 3 years.
Estimate the price change using the duration formula:
dP = -3 (.02/1.10) $1,000 = - $54.55
Because the bank is immunized against a change in interest rates, the change in rates have an equal and offsetting effect on the liabilities and assets of the bank leaving the equity position of the bank unchanged.
Table 6.4
Immunized Balance Sheet of Simple National Bank
Original Position Assets
Liabilities
Loan Portfolio Value $1,000 Portfolio Duration 3 years Interest Rate 10%
Deposit Portfolio Value $1,000 Portfolio Duration 3 years Owners' Equity $0 Interest Rate 10%
Following Rise in Rates to 12 Percent
Assets
Liabilities
Loan Portfolio Value $945 Deposit Portfolio Value $945 Owners' Equity $0

Chapter 6 46
The Planning Period Case
The planning period involves managing a portfolio toward a horizon date with the goal of achieving a target value for the portfolio at the end of the planning period (e.g. pension fund management). This approach is also useful for an individual wishing to have a certain amount of funds available by the time he/she retires.
Bond managers deal with issues concerning the effect of changing interest rates on the immediate value of the bond portfolio and on the reinvestment rate.
The reinvestment rate is the rate at which cash thrown off by the bond portfolio can be reinvested. That is, when you receive a coupon payment from a bond, you will need to reinvest the funds. The funds are invested at the reinvestment rate.
Chapter 6 47
The Planning Period Case
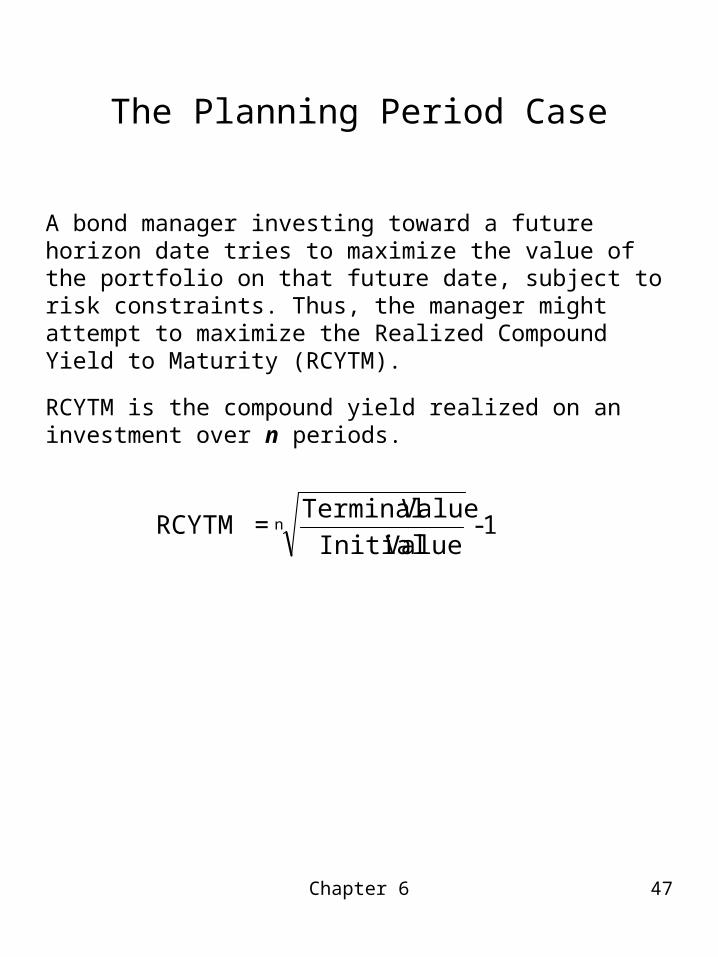
A bond manager investing toward a future horizon date tries to maximize the value of the portfolio on that future date, subject to risk constraints. Thus, the manager might attempt to maximize the Realized Compound Yield to Maturity (RCYTM).
RCYTM is the compound yield realized on an investment over n periods.
1 - Value Initial
Value Terminal = RCYTM n

Chapter 6 48
The Planning Period Case
Example
For a bond portfolio with an initial value of $500,000 that is managed for 8 years with a resulting terminal value of $900,000. What is the RCYTM?
.0762 = 1 - $500,000$900,000 = 1
Value InitialValue Terminal = RCYTM 8n
What would be the impact on RCYTM of a change in interest rates during the planning period?
Or equivalently
0762.0181
000,500000,9001
1
Value InitialValue TerminalRCYTM )()( n
Chapter 6 49
The Planning Period Case
To demonstrate how a change in interest rates can affectthe RCYTM, we will examine the following scenarios:
1. Calculate the RCYTM for single bond.
Recalculate the RCYTM after interest rates drop from 10% to 8%.
2. Calculate the RCYTM for two bonds with different maturities.
Recalculate the RCYTM after interest rates drop from10% to 8%.
Chapter 6 50
The Planning Period Case
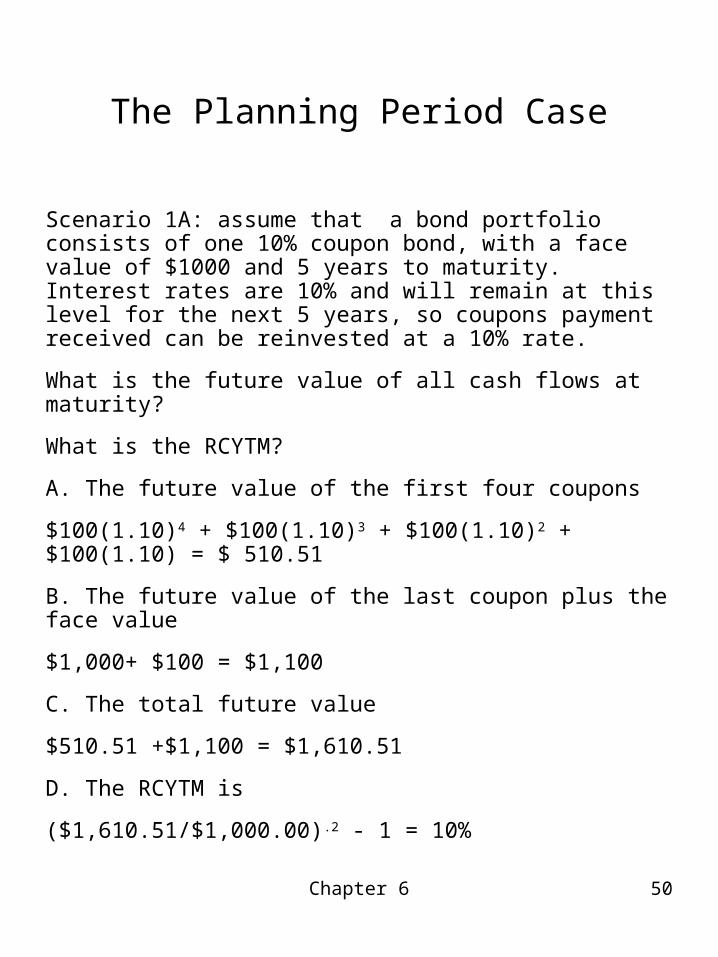
Scenario 1A: assume that a bond portfolio consists of one 10% coupon bond, with a face value of $1000 and 5 years to maturity. Interest rates are 10% and will remain at this level for the next 5 years, so coupons payment received can be reinvested at a 10% rate.
What is the future value of all cash flows at maturity?
What is the RCYTM?
A. The future value of the first four coupons
$100(1.10)4 + $100(1.10)3 + $100(1.10)2 + $100(1.10) = $ 510.51
B. The future value of the last coupon plus the face value
$1,000+ $100 = $1,100
C. The total future value
$510.51 +$1,100 = $1,610.51
D. The RCYTM is
($1,610.51/$1,000.00).2 - 1 = 10%

Chapter 6 51
The Planning Period Case
Scenario1B: now assume that interest rates drop from 10% to 8%.
What is the future value of all cash flows at maturity?
What is the RCYTM?
A. The future value of the first four coupons
$100(1.08)4 + $100(1.08)3 + $100(1.08)2 + $100(1.08) = $486.66
B. The future value of the last coupon plus the face value
$1,000 +$100 = $1,100
C. The total future value
$486.66 + $1,100.00 = $1,586.66
D. The RCYTM is
($1,586.66/$1,000.00) .2 -1 = 9.67%
Notice the drop in RCYTM associated with the drop in interest rates.
Chapter 6 52
The Planning Period Case
The problem with scenario 1B occurred because the duration of the bond was less than the planning period.
The duration (D): 4.17
The planning period: 5 years
If the duration of the portfolio equals the number of years in the planning period, the portfolio will be immunized. Thus, a shift in interest rates will not affect the RCYTM or the terminal value.
Chapter 6 53
The Planning Period Case
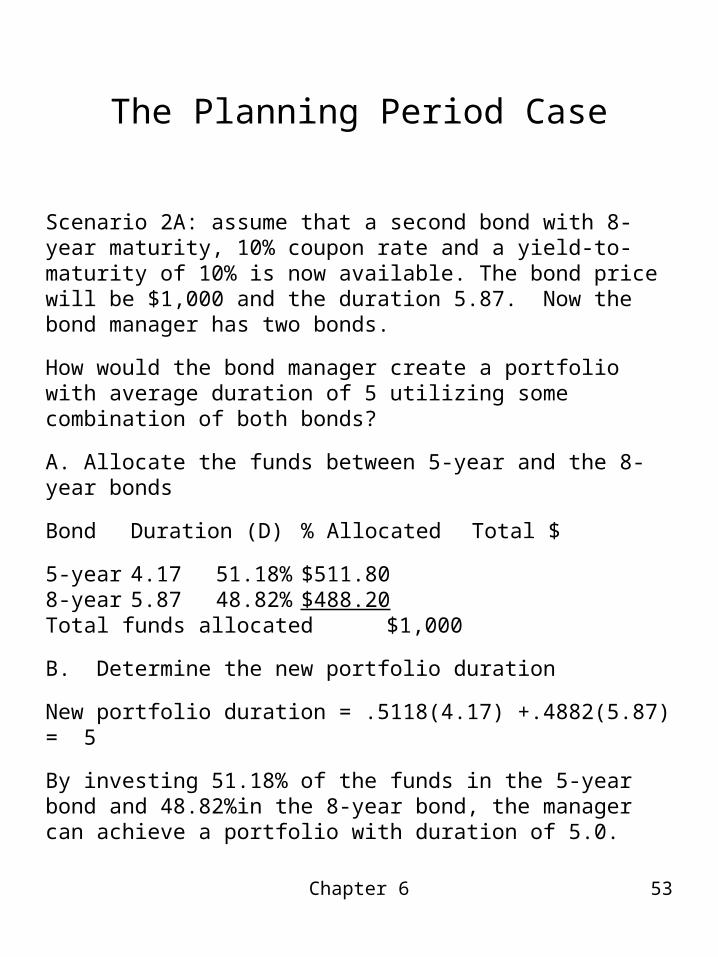
Scenario 2A: assume that a second bond with 8-year maturity, 10% coupon rate and a yield-to-maturity of 10% is now available. The bond price will be $1,000 and the duration 5.87. Now the bond manager has two bonds.
How would the bond manager create a portfolio with average duration of 5 utilizing some combination of both bonds?
A. Allocate the funds between 5-year and the 8-year bonds
Bond Duration (D) % Allocated Total $
5-year 4.17 51.18% $511.808-year 5.87 48.82% $488.20Total funds allocated $1,000
B. Determine the new portfolio duration
New portfolio duration = .5118(4.17) +.4882(5.87) = 5
By investing 51.18% of the funds in the 5-year bond and 48.82%in the 8-year bond, the manager can achieve a portfolio with duration of 5.0.

Chapter 6 54
The Planning Period Case
What is the future value of all cash flows at maturity? And What is the RCYTM?
A. The future value of the bonds
The total future value at year 5 will come from 4 sources.
1. Future value of reinvested coupons received year 1-4.
$486.66
2. Future value of payoff on the 5-year bond
.5118($1,000+$100) =$562.98
3. The coupon payment at year 5 on the 8-year loan
$100(.4882) = $48.82
4. Sale at year 5 of the 8-year bond
($1,100-$48.82).4882 = $513.36
The total future value
$486.66 +$562.98+$48.82+$513.36 = $1,611.82

Chapter 6 55
The Planning Period Case
B. RCYTM
RCYTM = ($1,611.82/$1,000).2-1 = 10.02%
Scenario 2B: now assume that interest rates drop from 10% to 8%.
What is the new value of the portfolio, today?
What is the future value of all cash flows at maturity?
What is the RCYTM?
Chapter 6 56
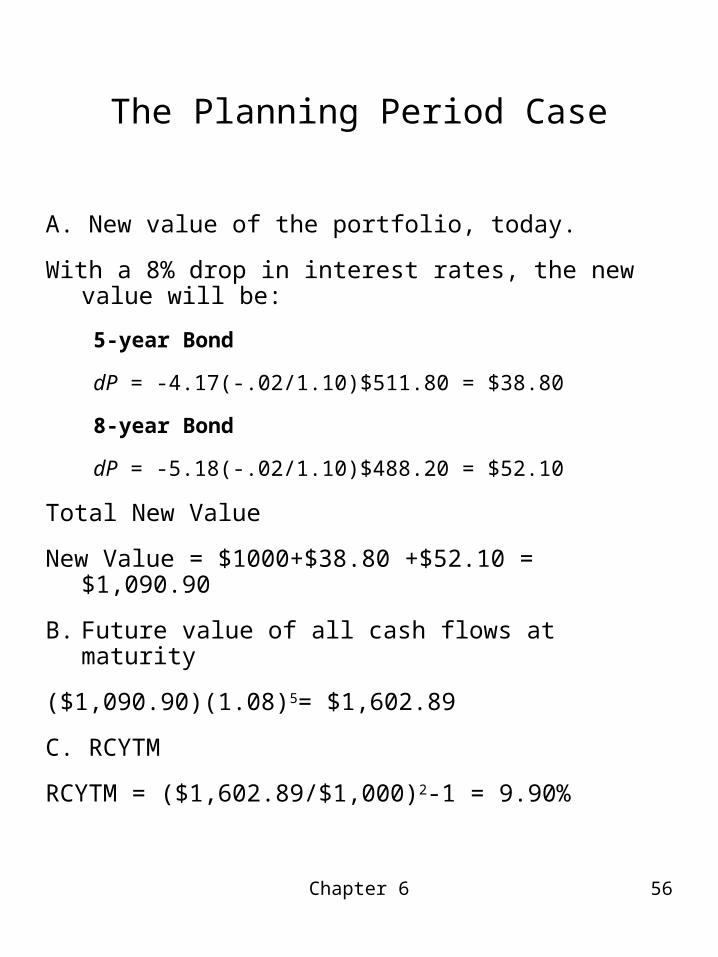
The Planning Period Case
A. New value of the portfolio, today.
With a 8% drop in interest rates, the new value will be:
5-year Bond
dP = -4.17(-.02/1.10)$511.80 = $38.80
8-year Bond
dP = -5.18(-.02/1.10)$488.20 = $52.10
Total New Value
New Value = $1000+$38.80 +$52.10 = $1,090.90
B. Future value of all cash flows at maturity
($1,090.90)(1.08)5= $1,602.89
C. RCYTM
RCYTM = ($1,602.89/$1,000)2-1 = 9.90%

Chapter 6 57
Immunization Issues
First, immunization assumes that interest rates change by the same amount for all different maturities. This is the same as assuming that any change in the yield curve is merely a parallel shift.
Second, immunization results hold only for a single change in interest rates, even when rates change by the same amount for all maturities. Thus, each time interest rates change, you must re-compute the duration.