chapter 5 updated 04, 2009 panko’s business data networks and telecommunications, 6th edition...
TRANSCRIPT

Chapter 5
Updated 04, 2009
Panko’sBusiness Data Networks and Telecommunications, 6th edition
Copyright 2007 Prentice-HallMay only be used by adopters of the book
Wireless LANs (WLANs)

5-2
Orientation
• LANs Are Governed by Layer 1 and 2 Standards– So they are governed by OSI Standards
• Wired LAN Standards– Chapter 3 (UTP and optical fiber transmission)– Chapter 4 (Ethernet 802.3 Layer 1 and 2 standards)
• Chapter 5– Wireless LAN (WLAN) Standards– Physical layer wireless transmission– Wireless data link layer operation– Management
5-3
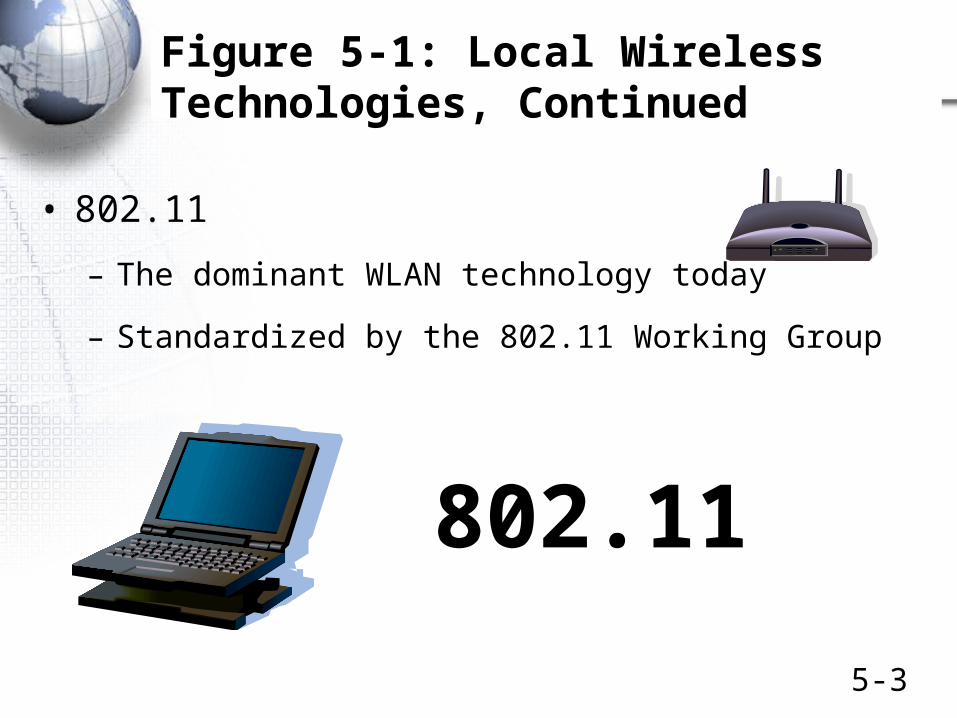
Figure 5-1: Local Wireless Technologies, Continued
• 802.11
– The dominant WLAN technology today
– Standardized by the 802.11 Working Group
802.11

5-4
Figure 5-2: Wireless LAN (WLAN) Access Point
Server
Internet
Router
Ethernet Switch
LaptopMobileClient
WirelessAccessPoint
Large Wired Ethernet LAN
UTP RadioTransmission
Wireless access point (WAP) bridges wireless stations to resources on wired LAN—servers and routers for Internet access
Communication

5-5
Figure 5-3: Access Router with Wireless Access Point and Wireless NICs
PC CardWNIC
for a NotebookComputer
InternalWNIC
For Desktop PC
USB WNIC
Access Routerwith Access Point

5-6
Figure 5-1: Local Wireless Technologies, Continued
• 802.11 Wireless LANs
– Today, mostly speeds of tens of megabits per second with distances of 30 to 100 meters or more
• Can serve many users in a home or office
– Increasingly, 100 Mbps to 600 Mbps with 802.11n
– Organizations can provide coverage throughout a building or a university campus by installing many access points

5-7
Test Your understanding
• Page 237
• 1 d) e)
• 2

Radio Propagation

5-9
Figure 5-5: Frequency Measurement
• Frequency
– Light waves are measured in wavelengths (Ch. 3)
– Radio waves are measured in terms of frequency
– Measured in hertz (Hz)—the number of complete cycles per second
1 Second
Two cycles in 1 second, so frequency is two Hertz (Hz).

5-10
Figure 5-5: Frequency Measurement, Continued
• Measuring Frequencies
– Frequency measures increases by factors of 1,000 (not 1,024)
– Kilohertz (kHz) [Note the lower-case k]
– Megahertz (MHz)
– Gigahertz (GHz)
5-11
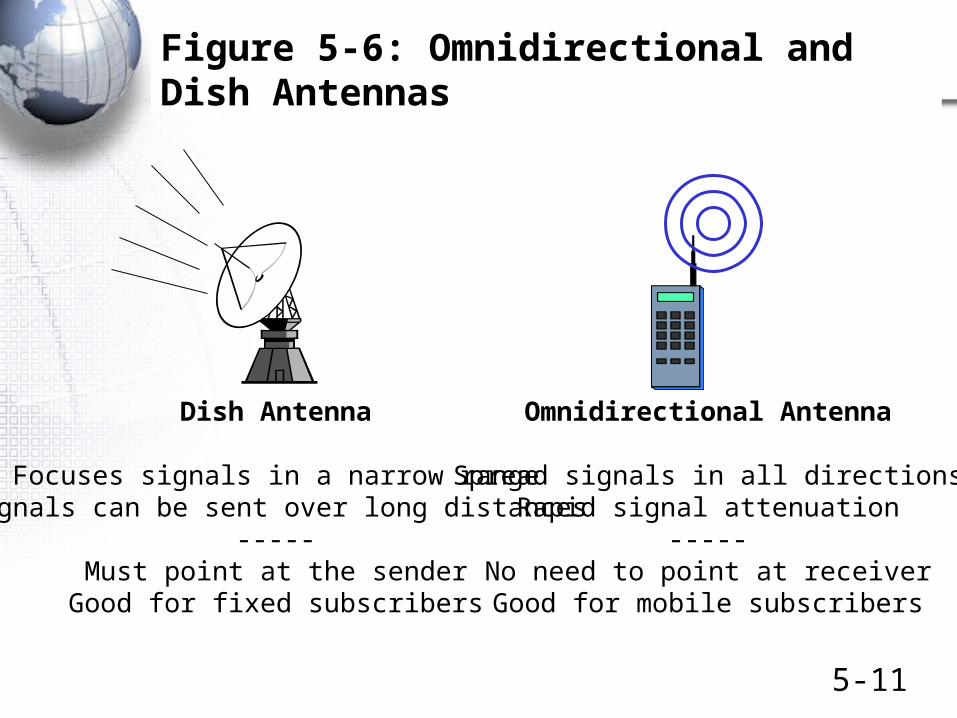
Figure 5-6: Omnidirectional and Dish Antennas
Omnidirectional Antenna
Spread signals in all directionsRapid signal attenuation
-----No need to point at receiverGood for mobile subscribers
Dish Antenna
Focuses signals in a narrow rangeSignals can be sent over long distances
-----Must point at the sender
Good for fixed subscribers

5-12
Test Your understanding
• Page 239
• 5 b) c) d)

5-13
Figure 5-7: Wireless Propagation Problems
2.Attenuation: signal getsweaker with distance
3.Shadow
Zone(Dead Spot)
1.Electromagnetic
Interference(EMI) from
Other stations,Microwaveovens, etc.
BlockingObject

5-14
Figure 5-7: Wireless Propagation Problems
Reflected Signal
LaptopDirect Signal
4. MultipathInterference
Direct and reflected signals may interfere
BlockingObject

5-15
Inverse Square Law Attenuation
• Inverse square law attenuation
– To compare relative power at two distances
• Divide the longer distance by the shorter distance
• Square the result; this is the relative power ratio
– Examples
• 100 mW (milliwatts) at 10 meters
• At 20 meters, 100 / (20/10)2 = 100 mW / 4 = 25 mW
• At 30 meters, 100 / (30/10)2 = 100 mW / 9 = 11 mW
– Much faster attenuation than UTP or fiber

5-16
Frequently-Depended Propagation Problem
• Some Problems are Frequency-Dependent
– Higher-frequency signals attenuate faster
• Absorbed more rapidly by water in the air
– Higher-frequency signals blocked more by obstacles
• At lower frequencies, signal refract (bend) around obstacles like an ocean wave hitting a buoy
• At higher frequencies, signals do not refract; leave a complete shadow behind obstacles

5-17
Test Your understanding
• Page 241
• Which of the following has faster attenuation with distance?
– a. UTP.
– b. Radio transmission.
– c. Both have about equally fast attenuation.
• 6 c) e) f) g) h)

5-18
• Which of the following increases with frequency?
– a. EMI.
– b. Multipath interference.
– c. Both of the above.
– d. Neither a. nor b.

5-19
Figure 5-8: The Frequency Spectrum, Service Bands, and Channels
Channel 5, Signal A
Channel 1, Signal E
Channel 2, No Signal
Channel 3, Signal B
Channel 4, Signal D
0 Hz
2.ServiceBand
(FM Radio,Cellular
Telephony,etc.)
1.FrequencySpectrum(0 Hz toInfinity)
3.MultipleChannelswithin aServiceBand; eachChannelcarries adifferentsignal
4.Signals in different channels do not
interfere with one another

5-20
Figure 5-9: Channel Bandwidth and Transmission Speed (Study Figure)
• Signal Bandwidth
– Chapter 3 discussed a wave operating at a single frequency
– However, most signals are spread over a range of frequencies
– The higher the speed, the greater the spread of frequencies
Amplitude
Frequency
Signal

5-21
Figure 5-9: Channel Bandwidth and Transmission Speed (Study Figure)
• Channel Bandwidth
– Higher-speed signals need wider-bandwidth channels
– Channel bandwidth is the highest frequency in a channel minus the lowest frequency
– An 88.0 MHz to 88.2 MHz channel has a bandwidth of 0.2 MHz (200 kHz)
88.0 MHz 88.2 MHz
Bandwidth = 0.2 MHz = 200 kHz
Amplitude
Frequency

5-22
Figure 5-9: Channel Bandwidth and Transmission Speed (Study Figure)
• Shannon Equation
– Specifies the connection between channel bandwidth and the channel’s maximum signal transmission speed
– C = B [ Log2(1+S/N) ]
• C = Maximum possible transmission speed in the channel (bps)
• B = Bandwidth (Hz)
• S/N = Signal-to-Noise Ratio
– Measured as a ratio– If given in dB, must convert to ratio

5-23
Figure 5-9: Channel Bandwidth and Transmission Speed (Study Figure)
• Shannon Equation
– C = B [ Log2 (1+S/N) ]
• Note that doubling the bandwidth doubles the maximum possible transmission speed
• Increasing the bandwidth by X increases the maximum possible speed by X
– Wide bandwidth is the key to fast transmission
– Increasing S/N helps slightly but usually cannot be done to any significant extent

5-24
Figure 5-9: Channel Bandwidth and Transmission Speed (Study Figure)
• Broadband and Narrowband Channels
– Broadband means wide channel bandwidth and therefore high speed
– Narrowband means narrow channel bandwidth and therefore low speed
– Narrowband is below 200 kbps
– Broadband is above 200 kbps

5-25
Figure 5-9: Channel Bandwidth and Transmission Speed (Study Figure)
• Channel Bandwidth and Spectrum Scarcity
– Why not make all channels broadband?
– There is only a limited amount of spectrum at desirable frequencies
– Making each channel broader than needed would mean having fewer channels or widening the service band
– Service band design requires tradeoffs between speed requirements, channel bandwidth, and service band size

5-26
Figure 5-9: Channel Bandwidth and Transmission Speed (Study Figure)
• The Golden Zone
– Most organizational radio technologies operate in the golden zone in the high megahertz to low gigahertz range
– At higher frequencies,propagation problemsare severe
– At lower frequencies,there is not enoughtotal bandwidth
Golden Zone
Higher Frequency
Lower Frequency

5-27
Test Your understanding
• Page 245
• 9 b) c)
• 10 c)

Spread Spectrum Transmission

5-29
Figure 5-11: Spread Spectrum Transmission (Study Figure)
• Unlicensed Bands
– WLANs operate in unlicensed service bands
• You do not need a license to have or move your stations
– Two unlicensed bands are widely used: the 2.4 GHz band and the 5 GHz band
• 5 GHz has worse propagation characteristics
• 2.4 GHz has fewer available channels

5-30
Test Your understanding
• Page 247
• 11 b) c) e)

5-31
Figure 5-11: Spread Spectrum Transmission, Continued
• Spread Spectrum Transmission
– You are REQUIRED BY LAW to use spread spectrum transmission in unlicensed bands
• Spread spectrum transmission uses much larger channels than transmission speed requires
• Spread spectrum transmission is required to reduce propagation problems at high frequencies
• Especially multipath interference
– Spread spectrum transmission is NOT used for security in WLANs
• This surprises many people

5-32
Figure 5-11: Spread Spectrum Transmission, Continued
• There are Several Spread Spectrum Transmission Methods (Figure 5-13)
– Older Techniques
• Frequency Hopping Spread Spectrum (FHSS) up to 4 Mbps (The book says 2 Mbps)
• Direct Sequence Spread Spectrum (DSSS) up to 11 Mbps
– Orthogonal Frequency Division Multiplexing (OFDM) is used at 54 Mbps
– MIMO for speeds of 100 Mbps to 600 Mbps
Not Usedin 802.11

5-33
Figure 5-13: Spread Spectrum Transmission Methods
Frequency HoppingSpread Spectrum
(FHSS)
Signal only uses its normal bandwidth, but it jumps around within a much wider channel
If there are propagation problems at specific frequencies, most of the transmission will still get through
Limited to low speeds of about 4 Mbps; used by Bluetooth (later)
Only used inOld 802.11 systems
And Bluetooth
5-34
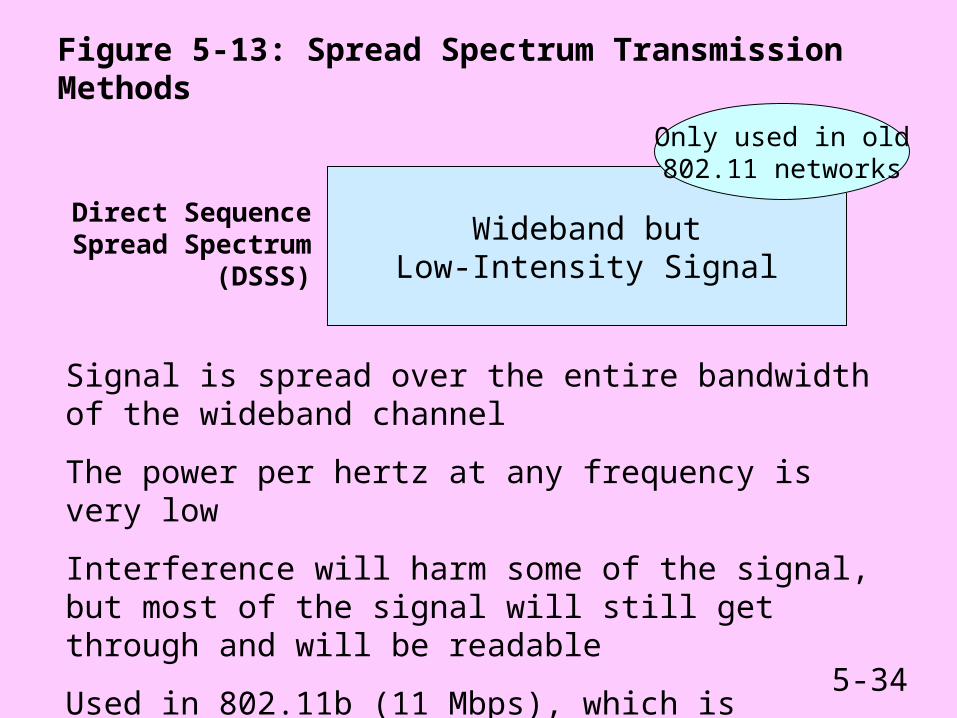
Figure 5-13: Spread Spectrum Transmission Methods
Wideband butLow-Intensity Signal
Direct SequenceSpread Spectrum
(DSSS)
Signal is spread over the entire bandwidth of the wideband channel
The power per hertz at any frequency is very low
Interference will harm some of the signal, but most of the signal will still get through and will be readable
Used in 802.11b (11 Mbps), which is discussed later
Only used in old802.11 networks
5-35
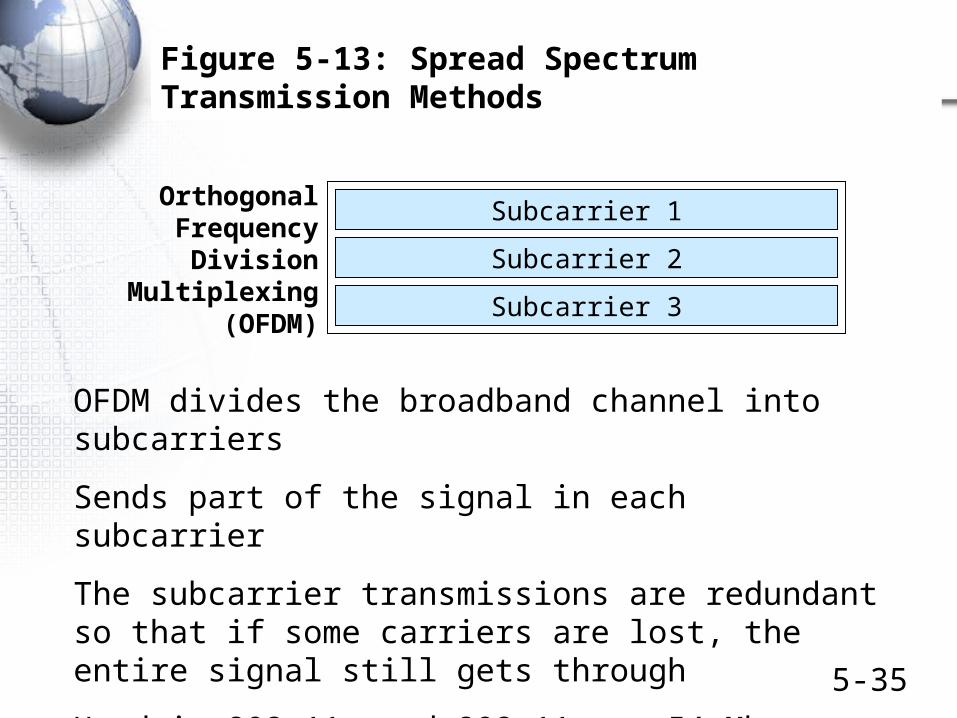
Figure 5-13: Spread Spectrum Transmission Methods
OrthogonalFrequency
DivisionMultiplexing
(OFDM)
Subcarrier 1
Subcarrier 3
Subcarrier 2
OFDM divides the broadband channel into subcarriers
Sends part of the signal in each subcarrier
The subcarrier transmissions are redundant so that if some carriers are lost, the entire signal still gets through
Used in 802.11a and 802.11g at 54 Mbps (later)
5-36
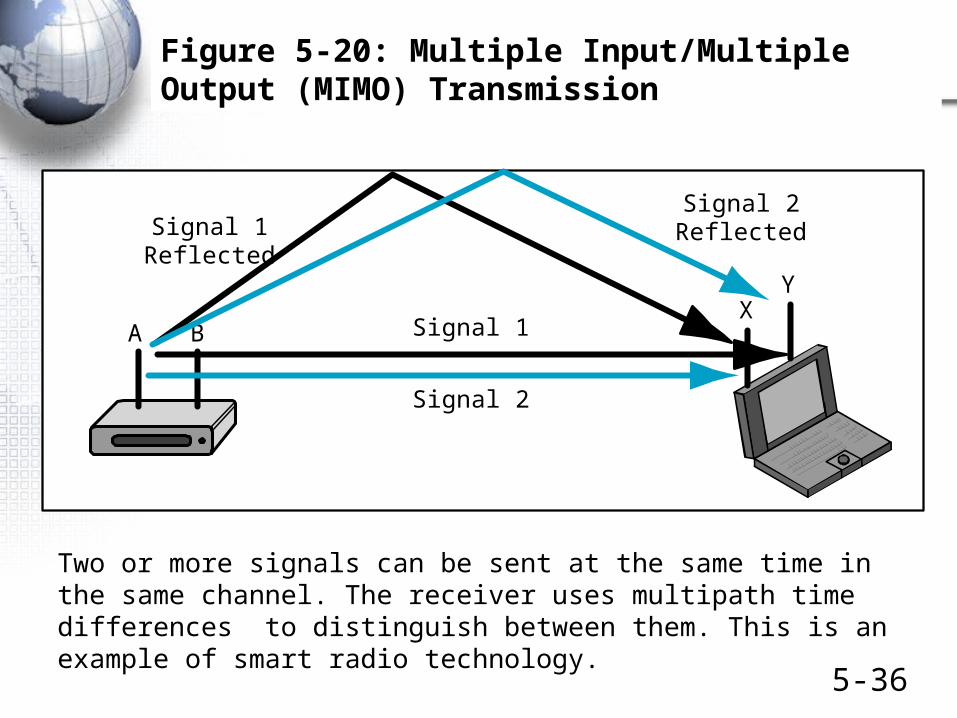
Figure 5-20: Multiple Input/Multiple Output (MIMO) Transmission
A BX
Y
Signal 2
Signal 1Reflected
Signal 2Reflected
Signal 1
Two or more signals can be sent at the same time in the same channel. The receiver uses multipath time differences to distinguish between them. This is an example of smart radio technology.

802.11 WLAN Operation

5-38
Figure 5-14: Typical 802.11 WLAN Operation
Server
EthernetSwitch
LaptopWAP
Large Wired LAN
Client PC
UTP RadioTransmission
802.11 Frame802.3 Frame
802.3 Frame
Wireless access points (WAPs) bridge the networks (translate between the 802.11 wireless frame and the Ethernet 802.3 frame used within the LAN)

5-39
Figure 5-14: Typical 802.11 WLAN Operation, Continued
Server
EthernetSwitch
LaptopWAP
A
Large Wired LAN
Client PCWAP
B
UTP
Handoff (转移 ) or Roaming (漫游 )(if mobile computermoves to another
access point,it switches service
to that access point)
802.11 Frame802.3 Frame

5-40
Figure 5-15: Stations and Access Points Transmit in a Single Channel
Laptop
AccessPoint B
Switch
Client PC
Laptop
The access point and all the stations it serves transmit in asingle channel. If two devices transmit at the same time, theirsignals will collide, becoming unreadable. Media access control(MAC) methods govern when devices transmit so that onlyone device transmits at a time.
Collision if 2Devices send
Simultaneously
5-41
Test Your understanding
• Page 253
• 14 c) d) f)

5-42
Media Access Control
• Only one station or the access point can transmit at a time
• To control access (transmission), two methods can be used
– CSMA/CA+ACK (mandatory)
– RTS/CTS (optional unless 802.11b and g stations share an 802.11g access point)
Box参见附加材料 .ppt
5-43
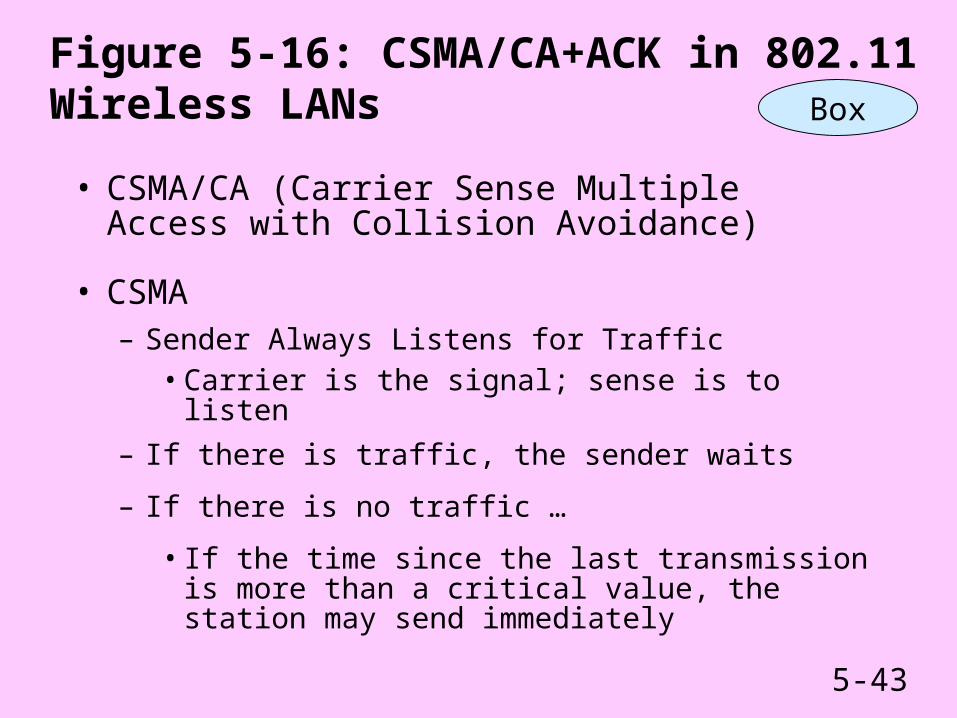
Figure 5-16: CSMA/CA+ACK in 802.11 Wireless LANs
• CSMA/CA (Carrier Sense Multiple Access with Collision Avoidance)
• CSMA– Sender Always Listens for Traffic
• Carrier is the signal; sense is to listen
– If there is traffic, the sender waits
– If there is no traffic …
• If the time since the last transmission is more than a critical value, the station may send immediately
Box
5-44
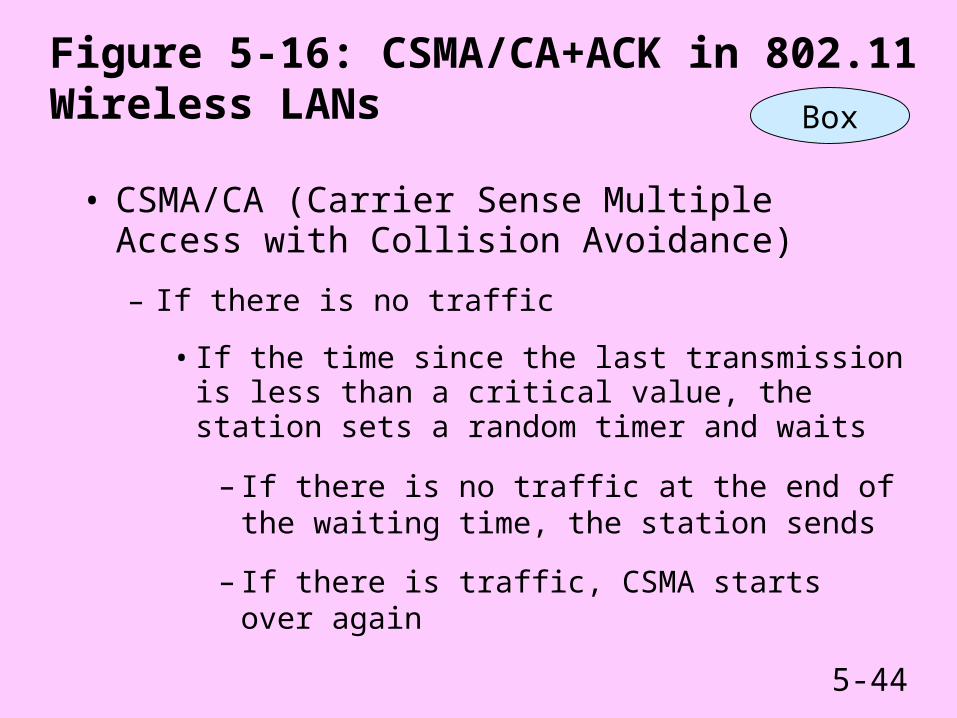
Figure 5-16: CSMA/CA+ACK in 802.11 Wireless LANs
• CSMA/CA (Carrier Sense Multiple Access with Collision Avoidance)
– If there is no traffic
• If the time since the last transmission is less than a critical value, the station sets a random timer and waits
– If there is no traffic at the end of the waiting time, the station sends
– If there is traffic, CSMA starts over again
Box

5-45
Figure 5-16: CSMA/CA+ACK in 802.11 Wireless LANs
• ACK (Acknowledgment)
– Receiver immediately sends back an acknowledgment when it receives a frame
• Does not wait to send an ACK
• This avoids interference with other stations, which must wait
– If sender does not receive the acknowledgment, it retransmits the frame using CSMA/CA
– 802.11 with CSMA/CA+ACK is a reliable protocol!
Box

5-46
Figure 5-17: Request to Send/Clear to Send (RTS/CTS)
Server
Switch
LaptopAccessPoint B
Large Wired LAN
RadioLink
Client PC
RTS
1. Device that wishesto transmit may send a
Request-to-Send message
Box

5-47
Figure 5-17: Request to Send/Clear to Send (RTS/CTS)
Server
Switch
May SendFrames
WAP
Large Wired LAN
RadioLink
Client PC
2. Wireless access point broadcastsa Clear-to-Send message.Station that sent the RTSmay transmit unimpeded.
Other stations hearing the CTS must wait
CTS
Box
Must Wait

5-48
Recap
• CSMA/CA+ACK is mandatory
• RTS/CTS is optional
– However, it is mandatory if 802.11b and 802.11g NICs share the same 802.11g access point
Box

5-49
Test Your understanding
• Page 253
• 15 b)
• Page 255
• 16 a)
• Page 256
• 17 a) b)

802.11 WLAN Standards

5-51
Figure 5-18: Specific 802.11 Wireless LAN Standards
802.11b 802.11g
802.11gif 802.11g
accesspoint
serves an802.11bstation
2.4 GHz 2.4 GHz 2.4 GHzUnlicensed Band
Lower Lower LowerAttenuation
Yes
802.11a
5 GHz
Higher
No Yes YesCrowded Band?
Lower Lower LowerPrice Higher
Higher LowerMarket Acceptance Very Low High

5-52
Figure 5-18: Specific 802.11 Wireless LAN Standards
802.11b 802.11g
802.11gif 802.11g
accesspoint
serves an802.11bstation
11 Mbps 54 MbpsNot
SpecifiedRated Speed*
6 Mbps 25 Mbps 12 MbpsThroughput, 3 m
6 Mbps
802.11a
54 Mbps
25 Mbps
12 Mbps 20 Mbps 11 MbpsThroughput, 30 m
Source for throughput data: Broadband.com
802.11a, operating ata higher frequency,
has more attenuationThan 802.11b
*Maximum rated speed. There are slower modes if propagation is poor.

5-53
Figure 5-18: Specific 802.11 Wireless LAN Standards, Continued
• Transmission Speed and Distance– As a station moves away from an access point,
transmission speed falls
• There are several modes of operation specified in each standard
• The fastest mode only works with a very strong signal
• As the user moves away, the signal strength becomes too low
• That station and the access point switch to a slower mode
• This slows things down for all users

5-54
Figure 5-18: Specific 802.11 Wireless LAN Standards
802.11b 802.11a 802.11g
802.11gif 802.11g
accesspoint
serves an802.11bstation
3 Up to 24 3 3Number of Non-Overlapping Channels
2.4 GHz 5 GHz 2.4 GHz 2.4 GHzUnlicensed Band
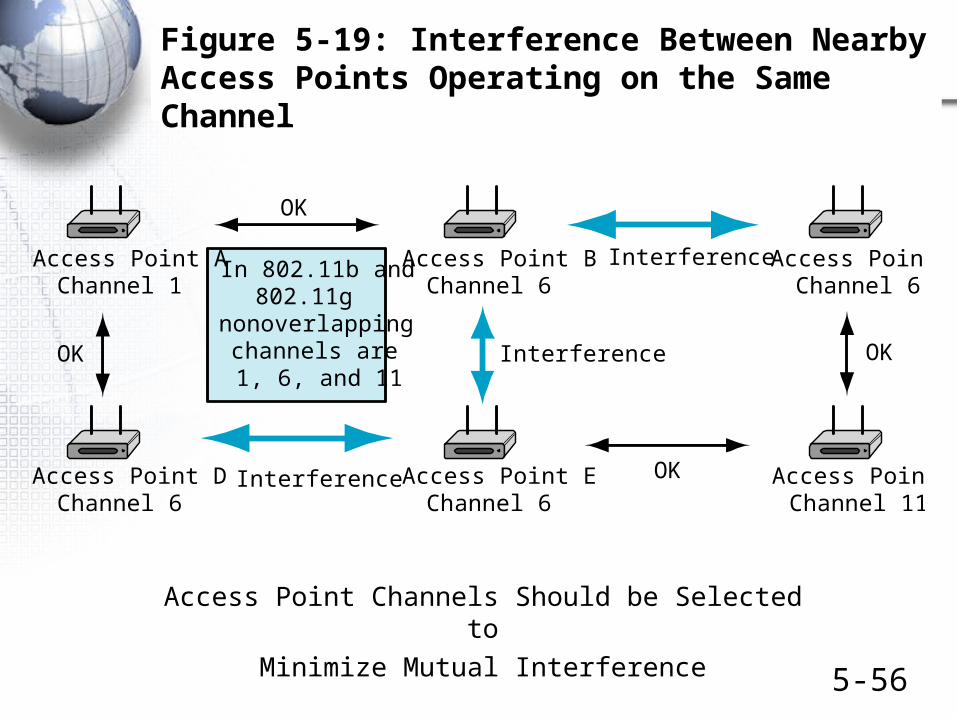
2.4 GHz non-overlapping channels are 1, 6, and 11

5-55
Test Your understanding
• Page 256
• 18
• Page 258
• 19 c)
• Page 259
• 21 a)
5-56
Figure 5-19: Interference Between Nearby Access Points Operating on the Same Channel
Access Point AChannel 1
Access Point BChannel 6
Access Point CChannel 6
Access Point DChannel 6
Access Point EChannel 6
Access Point FChannel 11
OK
OK
OK
OK
Interference
Interference
Interference
In 802.11b and802.11g
nonoverlappingchannels are1, 6, and 11
Access Point Channels Should be Selected to
Minimize Mutual Interference

5-57
802.11n
• Under Development
– Rated speeds of 100 Mbps to 600 Mbps
– Will operate in both the 2.4 GHz and 5 GHz bands
– May use twice current bandwidth per channels (~20 MHz) to roughly double speed
– Will use MIMO
– Currently a draft standard

WLAN Security

5-59
Figure 5-21: WLAN Security Threats (Study Figure)
• Drive-By Hackers
– Sit outside the corporate premises and read network traffic
– Can send malicious traffic into the network
– Easily done with readily available downloadable software
• War Drivers
– Merely discover unprotected access points–become drive-by hackers only if they break in

5-60
Figure 5-21: WLAN Security Threats, Continued
• Rogue Access Points
– Unauthorized access points set up by department or individual
– Often have very poor security, making drive-by hacking easier
– Often operate at high power, attracting many clients

5-61
Figure 5-21: WLAN Security Threats, Continued
• Evil Twin Access Points
– Create a fake access point outside walls of firm using a PC
– Legitimate internal client associates with the evil twin access point, which operates at high power
Evil Twin APLegitimate
Client
LegitimateAP
Duped Association

5-62
Figure 5-21: WLAN Security Threats, Continued
• Evil Twin Access Points
– Evil twin then associates with a legitimate internal access point masquerading as the internal clients
– This connects the evil twin to the firm’s internal network
Evil Twin APLegitimate
Client
LegitimateAP
1. Associates
2.Associates
As LegitimateClient

5-63
Figure 5-21: WLAN Security Threats, Continued
• Evil Twin Access Points
– Evil twin can then read all traffic, even if the sender and receive encrypt their messages because the evil twin steals authentication credentials passed between the clients and the legitimate access point
– Also can insert traffic
– Classic man-in-the-middle attack
Evil Twin APLegitimate
ClientLegitimate
AP
5-64
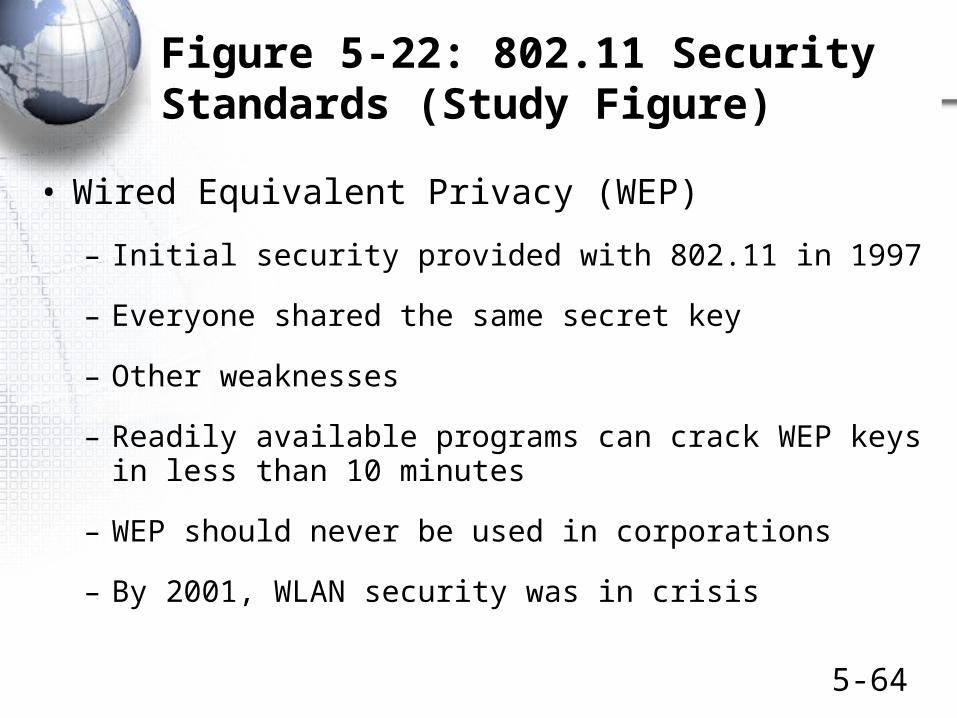
Figure 5-22: 802.11 Security Standards (Study Figure)
• Wired Equivalent Privacy (WEP)
– Initial security provided with 802.11 in 1997
– Everyone shared the same secret key
– Other weaknesses
– Readily available programs can crack WEP keys in less than 10 minutes
– WEP should never be used in corporations
– By 2001, WLAN security was in crisis

5-65
Figure 5-22: 802.11 Security Standards, Continued
• Wireless Protected Access (WPA)
– The Wi-Fi Alliance normally certifies interoperability of 802.11 equipment
– Created WPA as a stop-gap security standard in 2002 until the IEEE 802.11i standard discussed next was finished
– WPA lightened 802.11i security so that older access points and wireless NICs could be upgraded to WPA

5-66
Figure 5-22: 802.11 Security Standards, Continued
• 802.11i
– Created by the IEEE
– Uses powerful AES-CCMP encryption with 128-bit keys for confidentiality and key management
– Wi-Fi Alliance calls 802.11i “WPA2”
– Should be used if equipment supports it.
– Vendor support has been slow in coming.

5-67
Modes of Operation
• Both 802.11i and WPA (as a subset of 802.11i) operate in two modes
– 802.1X mode and
– Preshared Key (PSK) Mode
WPA 802.11i(WPA2)
Can use 802.1XMode?
Yes Yes
Can use PSKMode?
Yes Yes

5-68
Figure 5-22: 802.11 Security Standards, Continued
• Pre-Shared Key (PSK) Mode
– Only for firms with a single access point
– Access point does all authentication and key management
– All users must know an initial pre-shared key (PSK)• Each, however, is later given a unique key
– If the pre-shared key is weak, it is easily cracked• Pass phrases are used to generate keys; must be at
least 20 characters long
– Wi-Fi Alliance calls this “personal mode”
5-69
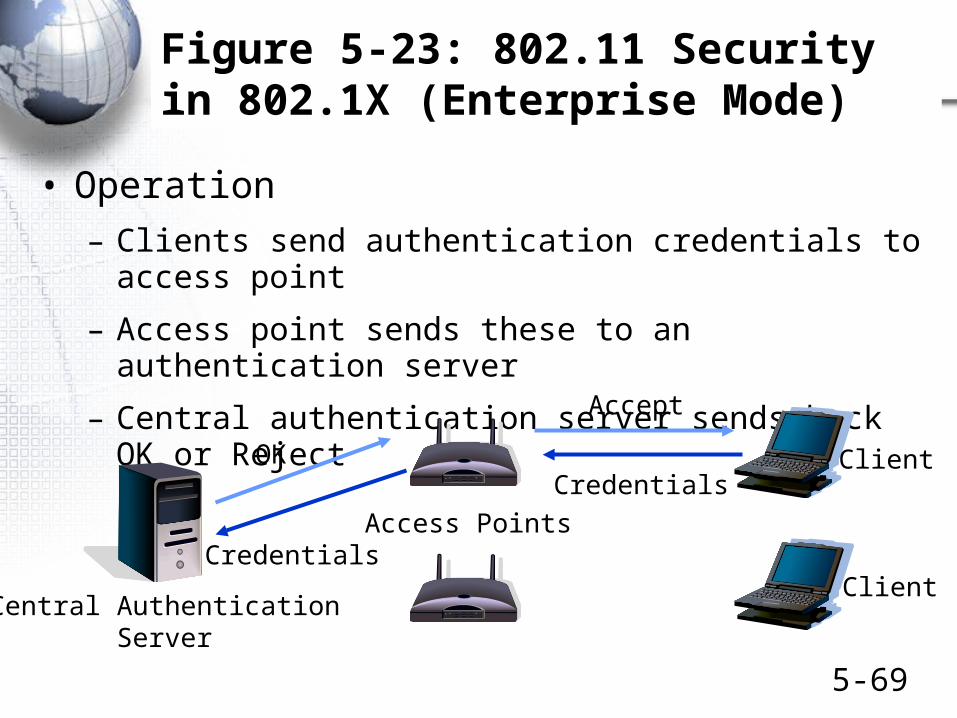
Figure 5-23: 802.11 Security in 802.1X (Enterprise Mode)
• Operation
– Clients send authentication credentials to access point
– Access point sends these to an authentication server
– Central authentication server sends back OK or Reject
Central AuthenticationServer
Access Points
Client
Client
Credentials
Credentials
OK
Accept

5-70
Figure 5-23: 802.11 Security in 802.1X (Enterprise Mode)
• Central Authentication Server
– Provides consistency in authentication
– Same decision no matter what access point a client connects to
– Attackers cannot search for a misconfigured access point
Central AuthenticationServer
Access Points
Client
Client
Credentials
Credentials
OK
Accept

5-71
Figure 5-23: 802.11 Security in 802.1X (Enterprise Mode)
• Extensible Authentication Protocols (EAPs)
– Messages are standardized by an extensible authentication protocol (EAP)
– There are several EAPs. The most popular is PEAP, which Microsoft favors
Central AuthenticationServer
AccessPoints
Client
Client
Credentials
Credentials
OK
Accept

5-72
Figure 5-23: 802.11 Security in 802.1X (Enterprise Mode)
• Keys
– Central authentication also provides keys to clients
– Changes the keys frequently
Central AuthenticationServer
Access Points
Client
Client
Key
Key

5-73
Perspective
• WEP operates in only one mode: shared key
• Both WPA and 802.11i operate in both 802.1X (enterprise) or pre-shared key (personal) mode
• 802.11i offers stronger security than WPA
• The Wi-Fi Alliance calls 802.11i “WPA2”

5-74
Test Your understanding
• Page 266
• 28 c)
• Page 268
• 29 a) d)
• 30

802.11 WLAN Management

5-76
Figure 5-24: Wireless LAN Management (Study Figure)
• Access Points Placement in a Building
– Must be done carefully for good coverage and to minimize interference between access points
– Lay out 30-meter to 50-meter radius circles on blueprints
– Adjust for obvious potential problems such as brick walls
– In multistory buildings, must consider interference in three dimensions

5-77
Figure 5-24: Wireless LAN Management (Study Figure)
• Access Points Placement in a Building
– Install access points and do site surveys to determine signal quality
– Adjust placement and signal strength accordingly
– This is quite expensive
5-78
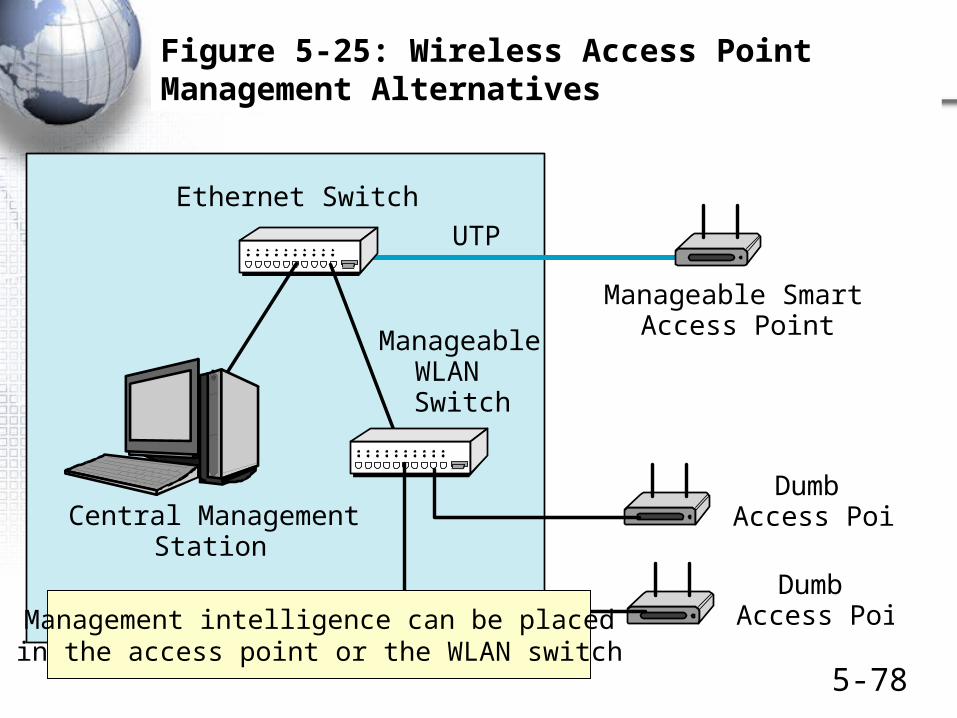
Figure 5-25: Wireless Access Point Management Alternatives
UTP
Manageable SmartAccess Point
Ethernet Switch
Central ManagementStation
DumbAccess Point
DumbAccess Point
ManageableWLANSwitch
Management intelligence can be placedin the access point or the WLAN switch

5-79
Figure 5-24: Wireless LAN Management (Study Figure)
• Remote Access Point Management
– Desired functionality
• Continuous transmission quality monitoring
• Immediate notification of failures
• Remote AP adjustment (power, channel, etc.)
• Ability to push software updates out to all APs or WLAN switches
• Take appropriate actions automatically whenever possible

5-81
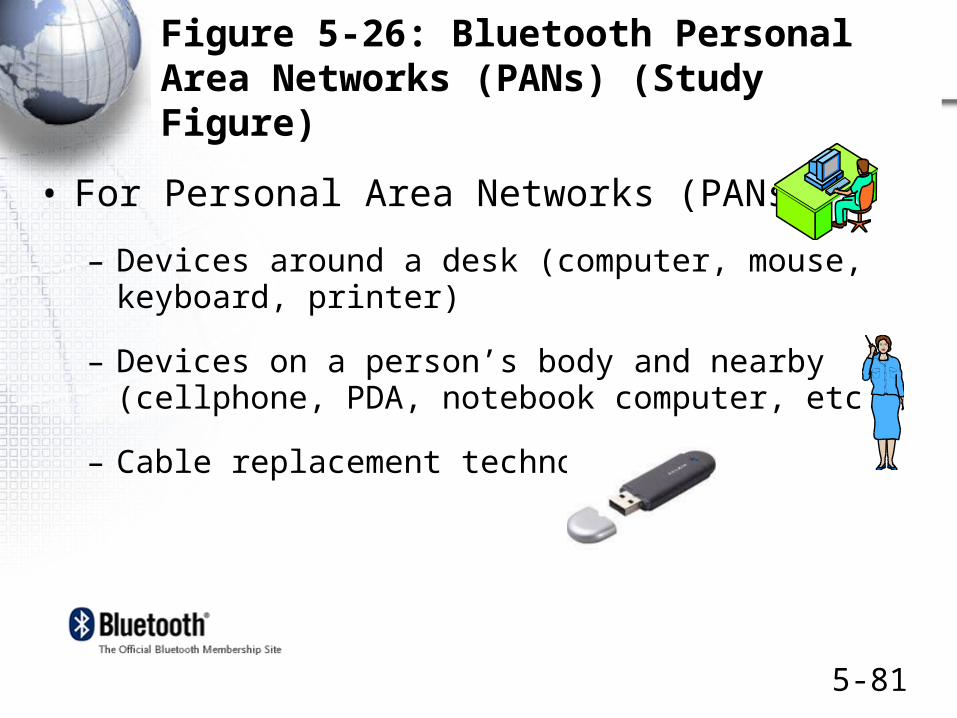
Figure 5-26: Bluetooth Personal Area Networks (PANs) (Study Figure)
• For Personal Area Networks (PANs)
– Devices around a desk (computer, mouse, keyboard, printer)
– Devices on a person’s body and nearby (cellphone, PDA, notebook computer, etc.)
– Cable replacement technology

5-82
Figure 5-26: Bluetooth Personal Area Networks (PANs), Continued
• Disadvantages Compared to 802.11
– Short distance (10 meters)
– Low speed (3 Mbps, with a slower reverse channel)
– Insufficient for WLAN in a building

5-83
Figure 5-26: Bluetooth Personal Area Networks (PANs), Continued
• Advantages Compared to 802.11
– Low battery power drain so long battery life between recharges
– Application profiles• Define how devices will work together with little or no
human intervention• Sending print jobs to printers• File synchronization• Etc.• Somewhat rudimentary• Devices typically only automate a few access profiles

5-84
Figure 5-26: Bluetooth Personal Area Networks (PANs), Continued
• Bluetooth Trends
– Bluetooth Alliance is enhancing Bluetooth
– The next version of Bluetooth is likely to grow to use ultrawideband transmission
• This should raise speed to 100 Mbps (or more)
• Transmission distance will remain limited to 10 meters
• Good for distributing television within a house

5-85
test
• 1. Telephone channels have a bandwidth of about 3.1 kHz, as we will see in the next chapter. a) If a telephone channel’s signal-to-noise ratio is 30 dB, how fast can a telephone channel carry data? Note: You need to convert decibels into the absolute signal-to-noise ratio to use the Shannon equation.
•(Check figure: Telephone modems operate at about 30 kbps,
•so your answer should be roughly this speed.)

Topics Covered
5-87
Radio Propagation
• 802.11 for Corporate WLANs
• Frequencies and Channels
• Antennas
• Propagation Problems– Inverse square law attenuation
– Dead spots / shadow zones
– Electromagnetic interference
– Multipath interference
– Attenuation and shadow zone problems increase with frequency

5-88
Radio Propagation
• Shannon’s Equation and the Importance of Channel Bandwidth
– C = B Log2(1+S/N)
• WLANs use unlicensed Radio Bands
• Spread Spectrum Transmission to Reduce Propagation Problems– FHSS (up to 4 Mbps)
– DSSS (up to 11 Mbps)
– OFDM (up to 54 Mbps)
– MIMO (100 Mbps to 600 Mbps)

5-89
802.11 Operation
• Wireless Access Point Bridge to the Main Wired Ethernet LAN
– To reach servers and Internet access routers
– Transfers packet between 802.11 and 802.3 frames
• Need for Media Access Control (Box)
– CSMA/CA and RTS/CTS
– Throughput is aggregate throughput

5-90
802.11 Operation
• Bands
– 2.4 GHz band: Only 3 channels, lower attenuation
– 5 GHz band: Around 24 channels, higher attenuation
– More channels means less interference between nearby access points
• Standards
– 802.11b: 11 Mbps, DSSS, 2.4 GHz band
– 802.11a: 54 Mbps, OFDM, 2.4 GHz band
– 802.11g: 54 Mbps, OFDM, 5 GHz band
– 802.11n: 100 Mbps – 600 Mbps, MIMO, Dual-Band

5-91
802.11 WLAN Security
• Wardrivers and Drive-By Hackers
• Core Security
– WEP (Unacceptably Weak)
– WPA (Lightened form of 802.11i)
– 802.11i (The gold standard today)
– 802.1X and PSK modes for WPA and 802.11i
• Rogue Access Points and Evil Twin Access Points

5-92
WLAN Management
• Surprisingly Expensive
• Access Point Placement
– Approximate layout
– Site survey for more precise layout and power
• Remote Access Point Management
– Smart access points or WLAN switches and dumb access points

5-93
Bluetooth
• PANs
• Cable Replacement Technology
• Limited Speeds and Distance
• Application Profiles