© 2009 pearson education, inc. publishing as prentice hall physical layer propagation: utp and...
TRANSCRIPT

© 2009 Pearson Education, Inc. Publishing as Prentice Hall
Physical Layer Propagation:UTP and Optical Fiber
Chapter 3
Panko’s Business Data Networks and Telecommunications, 7th edition © 2009 Pearson Education, Inc. Publishing as Prentice Hall
May only be used by adopters of the book
© 2009 Pearson Education, Inc. Publishing as Prentice Hall 3-22
Orientation
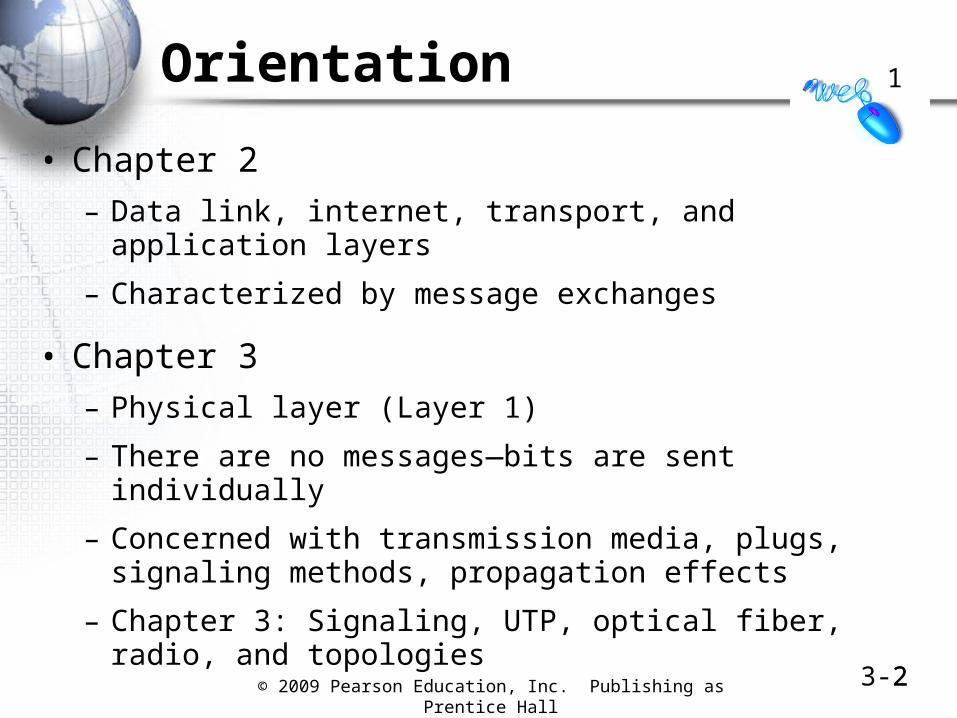
• Chapter 2
– Data link, internet, transport, and application layers
– Characterized by message exchanges
• Chapter 3
– Physical layer (Layer 1)
– There are no messages—bits are sent individually
– Concerned with transmission media, plugs, signaling methods, propagation effects
– Chapter 3: Signaling, UTP, optical fiber, radio, and topologies
1
© 2009 Pearson Education, Inc. Publishing as Prentice Hall 3-3
3-1: Signal and Propagation
3
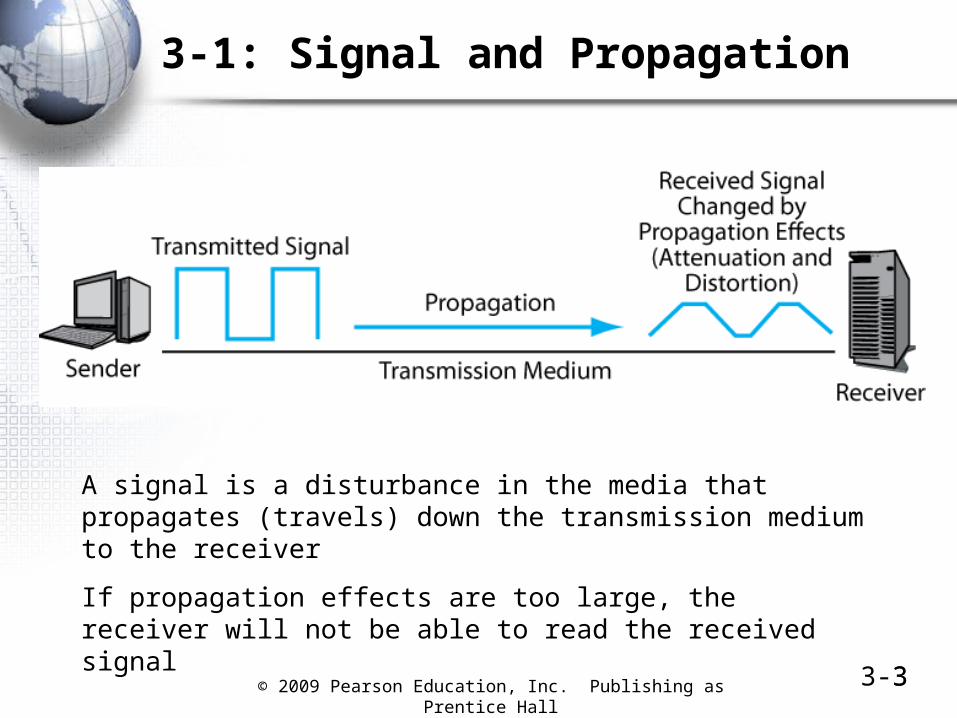
A signal is a disturbance in the media that propagates (travels) down the transmission medium to the receiver
If propagation effects are too large, the receiver will not be able to read the received signal
© 2009 Pearson Education, Inc. Publishing as Prentice Hall
BinaryData Representation

© 2009 Pearson Education, Inc. Publishing as Prentice Hall 3-55
Binary-Encoded Data
• Computers store and process data in binary representations
– Binary means “two”
– There are only ones and zeros
– Called bits
1101010110001110101100111

© 2009 Pearson Education, Inc. Publishing as Prentice Hall 3-66
Binary-Encoded Data
• Non-Binary Data Must be Encoded into Binary
– Text
– Integers (whole numbers)
– Decimal numbers
– Alternatives (North, South, East, or West, etc.)
– Graphics
– Human voice
– etc.
Hello 11011001…

© 2009 Pearson Education, Inc. Publishing as Prentice Hall 3-77
Binary-Encoded Data
• Some data are inherently binary
– 48-bit Ethernet addresses
– 32-bit IP addresses
– Need no further encoding

© 2009 Pearson Education, Inc. Publishing as Prentice Hall 3-88
3-2: Arithmetic with Binary Numbers
Binary Arithmetic for Whole Numbers (Integers)(Counting Begins with 0, not 1)
Integer012345678
Binary01
1011
100101110111
1000
“There are 10 kinds of people—those who understand binary and those who don’t”

© 2009 Pearson Education, Inc. Publishing as Prentice Hall 3-99
3-2: Arithmetic with Binary Numbers
Binary Arithmetic for Binary Numbers
1 0 0 1 1 +1+0 +1 +0 +1 +1=0 =1 =1 =10 =11
Basic Rules

© 2009 Pearson Education, Inc. Publishing as Prentice Hall 3-1010
3-2: Arithmetic with Binary Numbers
Binary Decimal 1000 8 +1 +1=1001 =9 +1 +1=1010 =10 +1 +1=1011 =11 +1 +1=1100 =12
Examples

© 2009 Pearson Education, Inc. Publishing as Prentice Hall 3-1111
Powers of 2
Bits Alternatives
1 2
2 4
3 8
4 16
5 32
6 64
7 128
8 256
10 1,024
16 65,536
An N-bit field can represent 2N alternatives.
Each additional bit doubles the number of possibilities
Start with one you know and double or halve until you have what you need
E.g., if you know 8 is 256, 10 must be 4 times as large or 1,024.

© 2009 Pearson Education, Inc. Publishing as Prentice Hall 3-12
3-3: Binary Encoding for a Number of Alternatives
12
Number of Bits in Field
Number of Alternatives that Can Be Encoded1
Specific Bit Sequences
Example
1 21 = 2 0, 1 Yes or No, Male or Female, etc.
2 22 = 4 00, 01, 10, 11 North, South, East, West
4 24 = 16 0000, 0001, 0010, …
Top 10 security threats (6 values go unused)
8 28 = 256 00000000, 00000001, …
ASCII text representation (128 values go unused)
1There are 2N alternatives with N bits.

© 2009 Pearson Education, Inc. Publishing as Prentice Hall 3-13
3-3: Binary Encoding for a Number of Alternatives
• Examples:
– 1. You have 4 bits. How many alternatives can your represent?
– 2. You need to represent 8 things. How many bits must you use?
– 3. You need to represent 6 things. How many bits must you use?
13

© 2009 Pearson Education, Inc. Publishing as Prentice Hall 3-14
3-4: ASCII and Extended ASCII (Study
• Purpose
– To represent text (A, a, 3, $, etc.) as binary data for transmission
• ASCII
– Traditional code to represent text data in binary
– Seven bits per character
– 27 (128) characters possible
– Sufficient for all keyboard characters (including shifted values)
14

© 2009 Pearson Education, Inc. Publishing as Prentice Hall 3-15
3-4: ASCII and Extended ASCII
• ASCII
– Sufficient for all keyboard characters
15
Category Meaning ASCII
Capital letters A 1000001
Lower-case letters a 1100001
Digits 3 0110011
Punctuation . 0101110
Special characters @ 1000000
Space 0100000
Printing control Carriage Return 0001101
Printing control Line feed 0001010
© 2009 Pearson Education, Inc. Publishing as Prentice Hall 3-16
3-4: ASCII and Extended ASCII
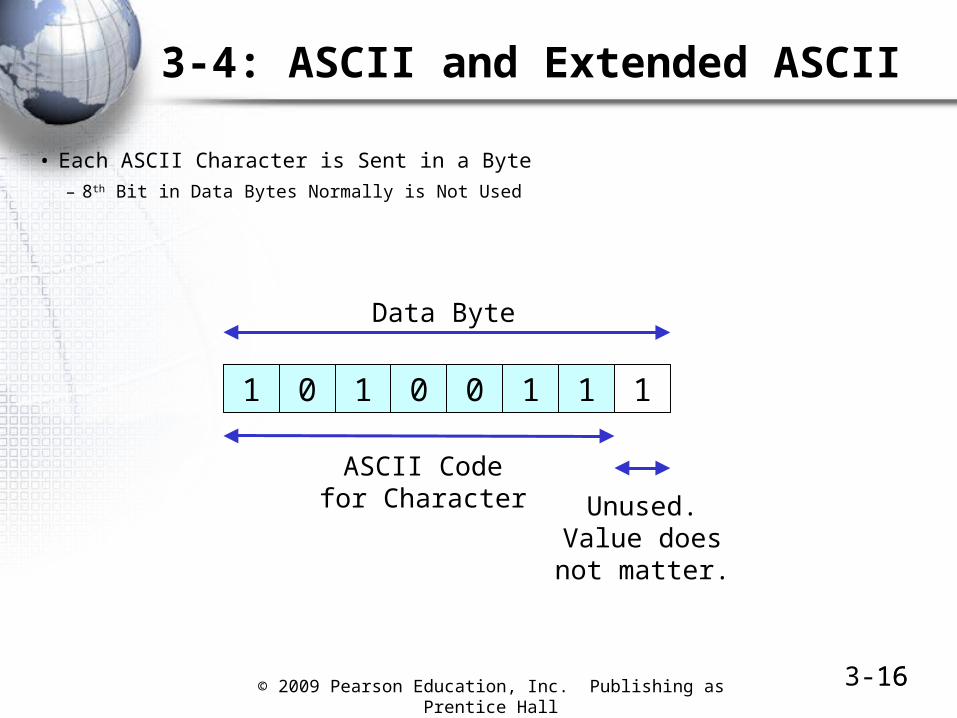
• Each ASCII Character is Sent in a Byte
– 8th Bit in Data Bytes Normally is Not Used
16
1 0 1 0 0 1 1 1
Data Byte
ASCII Codefor Character Unused.
Value doesnot matter.

© 2009 Pearson Education, Inc. Publishing as Prentice Hall 3-17
3-4: ASCII and Extended ASCII
• To send “Hello world!” (without the quotes), how many bytes will you have to transmit?
17

© 2009 Pearson Education, Inc. Publishing as Prentice Hall 3-18
3-4: ASCII and Extended ASCII
• Extended ASCII
– Used on PCs
– 8 bits per character
– 2 8 (256) characters possible
– Extra characters can represent formatting in word processing, etc.
• Text-to-ASCII and Text-to-Extended ASCII Calculators
– Readily available on the Internet
18
© 2009 Pearson Education, Inc. Publishing as Prentice Hall 3-19
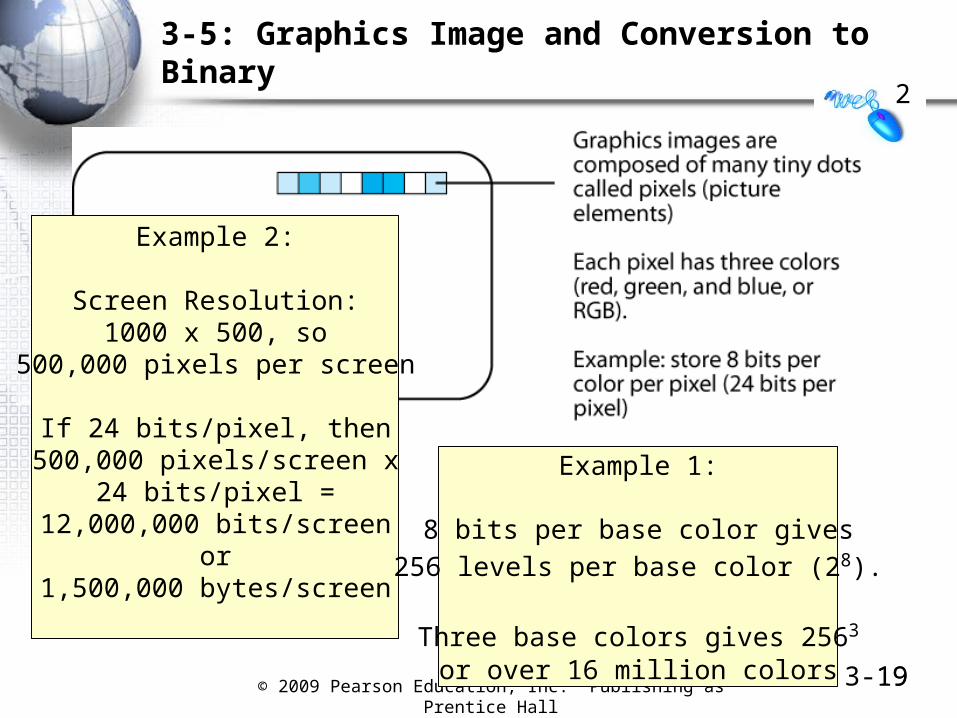
3-5: Graphics Image and Conversion to Binary
19
Example 2:
Screen Resolution:1000 x 500, so
500,000 pixels per screen
If 24 bits/pixel, then500,000 pixels/screen x
24 bits/pixel =12,000,000 bits/screen
or1,500,000 bytes/screen
2
Example 1:
8 bits per base color gives
256 levels per base color (28).
Three base colors gives 2563
or over 16 million colors
© 2009 Pearson Education, Inc. Publishing as Prentice Hall 3-20
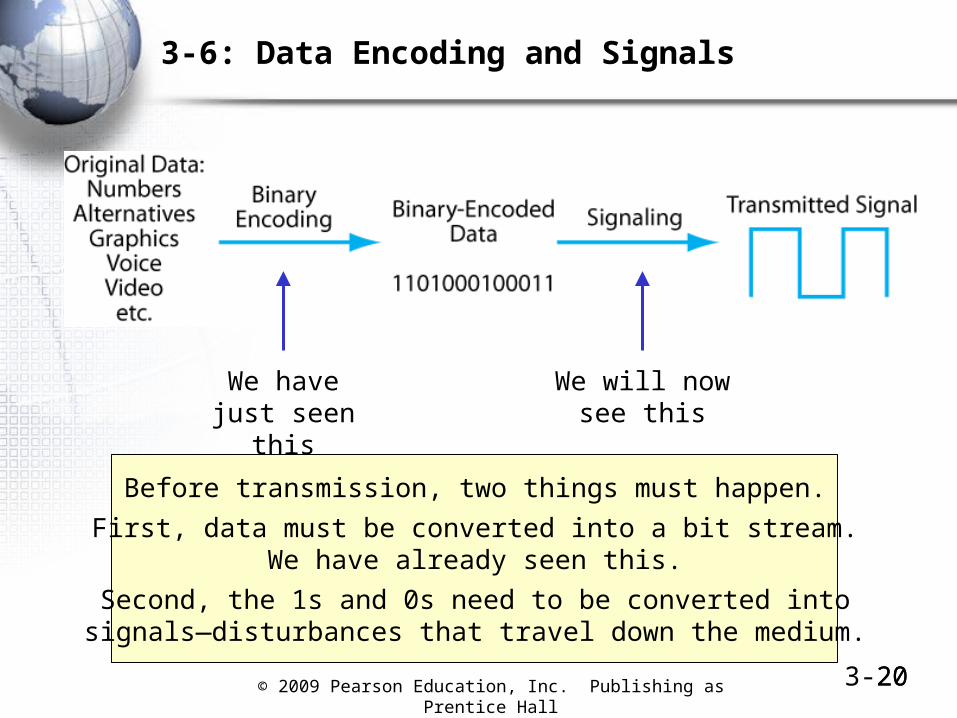
3-6: Data Encoding and Signals
20
We have just seen this
We will nowsee this
Before transmission, two things must happen.
First, data must be converted into a bit stream.We have already seen this.
Second, the 1s and 0s need to be converted intosignals—disturbances that travel down the medium.

© 2009 Pearson Education, Inc. Publishing as Prentice Hall
Signaling

© 2009 Pearson Education, Inc. Publishing as Prentice Hall 3-22
Figure 3-7: On/Off Signaling
22
On/off signaling is used in optical fiber.
The light is turned on during a clock cycle for a 1.
The light is turned off during a clock cycle for a 0.
There are two signaling states—on and off.
This is the simplest type of signaling.
© 2009 Pearson Education, Inc. Publishing as Prentice Hall 3-23
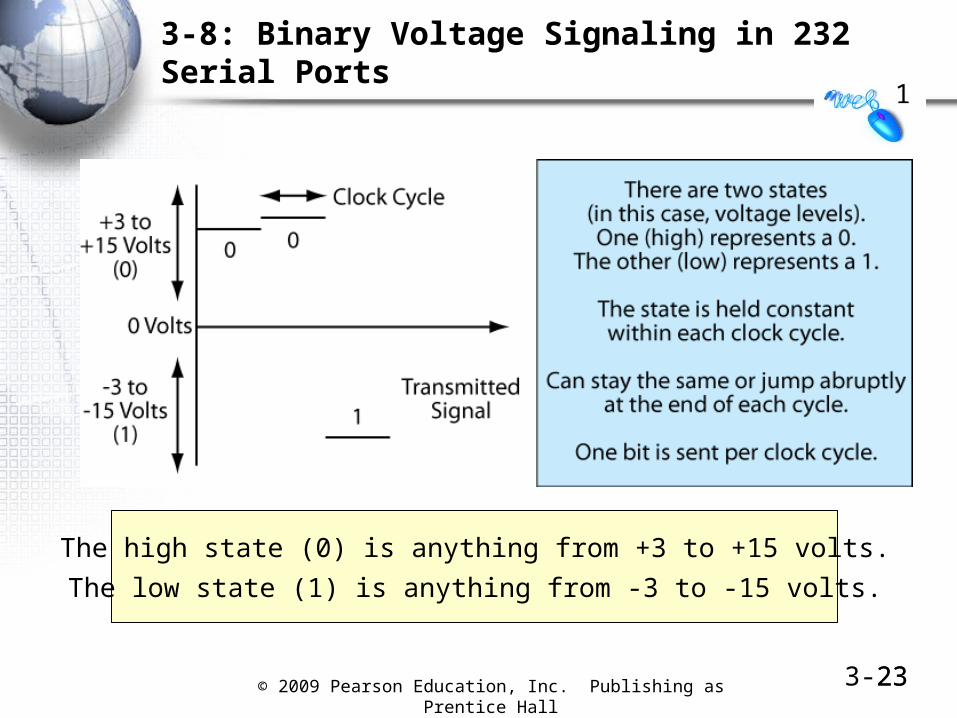
3-8: Binary Voltage Signaling in 232 Serial Ports
23
The high state (0) is anything from +3 to +15 volts.
The low state (1) is anything from -3 to -15 volts.
1

© 2009 Pearson Education, Inc. Publishing as Prentice Hall 3-24
3-9: Relative Immunity to Errors in Binary Signaling
24

© 2009 Pearson Education, Inc. Publishing as Prentice Hall 3-25
3-10: Four-State Digital Signaling
25
As you add more states/clock cycle, you can send more bits/clock cycle.2 states/clock cycle = 1 bit/clock cycle (binary)
4 states/clock cycle = 2 bits/clock cycle.
However, the states are closer together as you add more states.This reduces immunity to error.
2

© 2009 Pearson Education, Inc. Publishing as Prentice Hall 3-26
3-10: Four-State Digital Signaling
26
The baud rate is the number of clock cycles per second.The bit rate is the number of bits sent per second.
Example:With four states and a clock cycle of 1/1,000,000 second,
The baud rate will be 1 Mbaud (not bauds).The bit rate will be 2 bits/clock cycle * 1 million clock cycles/second=
2 Mbps.
In a box butshown here

© 2009 Pearson Education, Inc. Publishing as Prentice Hall 3-2727
Quiz
• Which Is Binary? Which Is Digital?
1.Calendar
5.Number
ofFingers
3.Gender:
Male or Female
4.On/Off Switch
2.Day of the Week

© 2009 Pearson Education, Inc. Publishing as Prentice Hall
Box: Multistate Digital Signaling

© 2009 Pearson Education, Inc. Publishing as Prentice Hall 3-29
3-11: Multistate Digital Signaling
• Digital Signaling
– Clock cycles
– Signal is held fixed during each clock cycle
– Binary signaling: two states
– Digital signaling: a few states (two or more)
– Up to about 256 states
29
Box

© 2009 Pearson Education, Inc. Publishing as Prentice Hall 3-30
3-11: Multistate Digital Signaling
• Why Use More than Two States?
– With more than two states, can send more than one bit per clock cycle
– Two states = 1 bit per clock cycle (1 or 0)
– Four states = 2 bits per clock cycle (00, 01, 10, 11)
– Eight states = 3 bits per clock cycle, etc.
– Each doubling of states gives one more bit per clock cycle
30
Box
© 2009 Pearson Education, Inc. Publishing as Prentice Hall 3-31
3-11: Multistate Digital Signaling
• Problem of Multiple States
– As the number of states increases, the difference between states decreases
– There is less tolerance for changes in the signal
– This is why there is a limit of a few states (256 maximum and usually much less)
31
Box

© 2009 Pearson Education, Inc. Publishing as Prentice Hall 3-32
3-11: Multistate Digital Signaling
• Concepts
– Bit rate: Number of bits sent per second
– Baud rate: Number of clock cycles per second
• If 1,000 clock cycles per second, 1 kbaud
• If each clock cycle is 1/1,000 second = 1,000 clock cycles/second = 1 kbaud
32
Box

© 2009 Pearson Education, Inc. Publishing as Prentice Hall
UTP PropagationUnshielded Twisted Pair wiring

© 2009 Pearson Education, Inc. Publishing as Prentice Hall 3-3434
3-12: Unshielded Twisted Pair (UTP) Wiring
• UTP Characteristics
– Inexpensive and to purchase and install
– Dominates media for access links between computers and the nearest switch

© 2009 Pearson Education, Inc. Publishing as Prentice Hall 3-35
3-12: Unshielded Twisted Pair (UTP) Wiring
• Standards
– The TIA/EIA-568 standard governs UTP wiring in the United States
– In Europe, the comparable standard is ISO/IEC 11801
35

© 2009 Pearson Education, Inc. Publishing as Prentice Hall 3-3636
3-13: 4-Pair UTP Cord with RJ45 Connector
3.8-pinRJ-45
Connector
2.8 Wires
organizedas 4
twistedpairs
Industry standard pen
1.UTP cord
UTP cord

© 2009 Pearson Education, Inc. Publishing as Prentice Hall 3-37
3-12: Unshielded Twisted Pair (UTP) Wiring
• Cord Organization
– A length of UTP wiring is a cord
– Each cord has eight copper wires
• Each wire is covered with dielectric (nonconducting) insulation.
– The wires are organized as four pairs
• Each pair’s two wires are twisted around each other several times per inch
– There is an outer plastic jacket that encloses the four pairs
37

© 2009 Pearson Education, Inc. Publishing as Prentice Hall 3-38
3-12: Unshielded Twisted Pair (UTP) Wiring
• Connector
– RJ-45 connector is the standard connector
– Plugs into an RJ-45 jack in a NIC, switch, or wall jack
38
RJ-45Jack
RJ-45Jack
8-pin RJ-45 connectors

© 2009 Pearson Education, Inc. Publishing as Prentice Hall 3-39
3-12: Unshielded Twisted Pair (UTP) Wiring
• Characteristics
– Inexpensive and easy to purchase and install
– Rugged: Can be run over with chairs, etc.
– Dominates media for access links
• Connections to the workgroup switch
39

© 2009 Pearson Education, Inc. Publishing as Prentice Hall 3-4040
3-14: Attenuation and Noise
Power
Distance
3.Noise Floor
(Average Noise level)
2.Noise
4.Noise Spike
1.Signal
2.Signal-
to-NoiseRatio (SNR)
5.Error
1. The signal attenuates (falls in power) as it propagates.
2. There is noise (random energy) in the wire that adds to the signal.
3. The average noise level is called the noise floor.
4. Noise is random. Occasionally, there will be large noise spikes.
5. Noise spikes as large as the signal cause errors.
6. You want to keep the signal-to-noise ratio high.

© 2009 Pearson Education, Inc. Publishing as Prentice Hall 3-4141
Limiting UTP Cord Length
• Limit UTP cord length to 100 meters
– This keeps the signal-to-noise ration (SNR) high.
– This makes attenuation and noise problems negligible
– Note that limiting cord lengths limits BOTH noise and attenuation problems
100 Meters MaximumCord Length

© 2009 Pearson Education, Inc. Publishing as Prentice Hall
Expressing Power Ratios in Decibels
42

© 2009 Pearson Education, Inc. Publishing as Prentice Hall 3-43
3-15: Expressing Power Ratios in Decibels
• Power Ratios (Such as S/N Ratios) Are Encountered Frequently in Networking.
• Power Ratios for Attenuation
– The signal power ratio is P2/P1
• P1 is the initial power and P2 is the received power.
– The final received power is P2/P1 of the original power
– Example. Power starts (P1) at 200 milliwatts (mW) and falls to (P2) 100 mW
• P2/P1 = 100 / 200 = 0.5 = 50%
43

© 2009 Pearson Education, Inc. Publishing as Prentice Hall 3-44
3-15: Power Ratios in Decibels
• Power Ratios Expressed in Decibels
– Power reduction ratios vary widely in attenuation
• When there is a wide range of values, engineers often express them in logarithms
– The equation for power ratios in decibels is dB = 10 log10
(P2/P1)
• Where P1 is the initial power and P2 is the final power after transmission
• If P2 is smaller than P1, then the answer will be negative
– In calculations, the Excel LOG10 function can be used
44

© 2009 Pearson Education, Inc. Publishing as Prentice Hall 3-45
3-15: Power Ratios in Decibels
• Example
– Over a transmission link, power drops by 63 percent.
– Therefore it drops to 37% of its original value.
– P2/P1 = 37% / 100% =.37
– From Excel: LOG10(0.37) = -0.4318
– 10*LOG10(0.37) = -4.3 dB
– The negative indicates power reduction through attenuation
45
© 2009 Pearson Education, Inc. Publishing as Prentice Hall 3-46
3-15: Power Ratios in Decibels
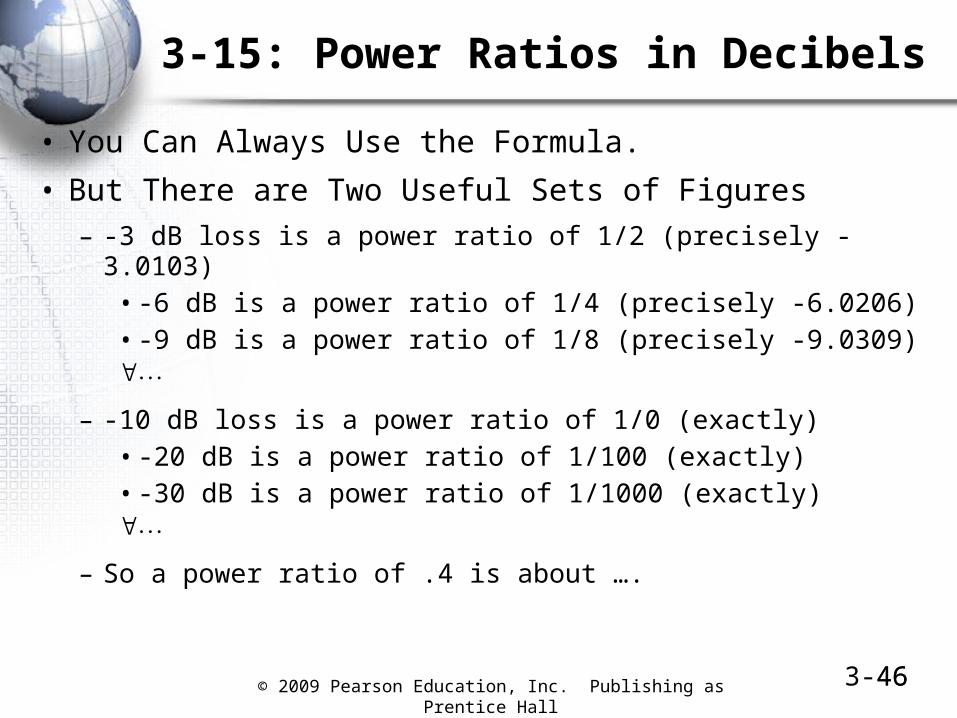
• You Can Always Use the Formula.
• But There are Two Useful Sets of Figures
– -3 dB loss is a power ratio of 1/2 (precisely -3.0103)• -6 dB is a power ratio of 1/4 (precisely -6.0206)• -9 dB is a power ratio of 1/8 (precisely -9.0309)
– -10 dB loss is a power ratio of 1/0 (exactly)• -20 dB is a power ratio of 1/100 (exactly)• -30 dB is a power ratio of 1/1000 (exactly)
– So a power ratio of .4 is about ….
46

© 2009 Pearson Education, Inc. Publishing as Prentice Hall 3-4747
UTP Wiring
• Electromagnetic Interference (EMI)
– Electromagnetic interference is electromagnetic energy from outside sources that adds to the signal
• From fluorescent lights, electrical motors, microwave ovens, etc.
– The problem is that UTP cords are like long radio antennas.
• They pick up EMI energy nicely
• When they carry signals, they also send EMI energy out from themselves

© 2009 Pearson Education, Inc. Publishing as Prentice Hall 3-4848
3-16: Electromagnetic Interference (EMI) and Twisting
Interference on the Two Halves of a Twist Cancels Out
TwistedWire
ElectromagneticInterference (EMI)

© 2009 Pearson Education, Inc. Publishing as Prentice Hall 3-4949
3-16: Crosstalk Interference and Terminal Crosstalk Interference
Untwistedat Ends Signal
Terminal CrosstalkInterference
Crosstalk Interference
Terminal crosstalk interferenceNormally is the biggest EMI problem for UTP

© 2009 Pearson Education, Inc. Publishing as Prentice Hall 3-5050
Interference Hierarchy
• EMI is any interference
– Signals in adjacent pairs interfere with one another (crosstalk interference). This is a specific type of EMI
• Crosstalk interference is worst at the ends, where the wires are untwisted. This is terminal crosstalk interference—a specific type of crosstalk EMI
EMI Crosstalk Interference Terminal Crosstalk Interference

© 2009 Pearson Education, Inc. Publishing as Prentice Hall 3-5151
Terminal Crosstalk Interference
• Terminal crosstalk interference dominates interference in UTP
– Terminal crosstalk interference is limited to an acceptable level by not untwisting wires more than a half inch (1.25 cm) at each end of the cord to fit into the RJ-45 connector
– This reduces terminal crosstalk interference to a negligible level.
1.25 cm or 0.5 inches

© 2009 Pearson Education, Inc. Publishing as Prentice Hall 3-5252
UTP Limitations
• Limit cords to 100 meters
– Limits BOTH noise AND attenuation problems to an acceptable level
• Do not untwist wires more than 1.25 cm (a half inch) when placing them in RJ-45 connectors
– Limits terminal crosstalk interference to an acceptable level
• Neither completely eliminates the problems but they usually reduce the problems to negligible levels
2

© 2009 Pearson Education, Inc. Publishing as Prentice Hall 3-53
3-18: Serial versus Parallel Transmission
53

© 2009 Pearson Education, Inc. Publishing as Prentice Hall 3-54
Figure 3-19: Wire Quality Standards
54
Category Technology Maximum Speed Maximum Ethernet Distance at this
Speed1 UTP Never defined Not Applicable
2 UTP Never defined Not Applicable
3 UTP 10 Mbps 100 meters
4 UTP 10 Mbps 100 meters
5 UTP 1 Gbps 100 meters
5e UTP 1 Gbps 100 meters
6 UTP 10 Gbps 55 meters
6A UTP 10 Gbps 100 meters
7 STP1 10 Gbps+ 100 meters
Category numbers indicate wire quality.
STP is shielded twisted pair. There is foil around each pair and a metal mesh around the fourpairs.

© 2009 Pearson Education, Inc. Publishing as Prentice Hall
Optical Fiber Transmission
Light through Glass
More Easily Spans Longer Distances than UTP

© 2009 Pearson Education, Inc. Publishing as Prentice Hall 3-56
3-20: Optical Fiber Transceiver and Strand
56
An optical fiber strand has a thin glass core.This core is 8.3, 50, or 62.5 microns in diameter.
This glass core is surrounded by a tubular glass cladding.The outer diameter of the cladding is 125 microns,
regardless of the core’s diameter.The transceiver injects laser light into the core.

© 2009 Pearson Education, Inc. Publishing as Prentice Hall 3-57
3-20: Optical Fiber Transceiver and Strand
57
When a light wave ray hits the core/cladding boundary,there is perfect internal reflection. There is no signal loss.

© 2009 Pearson Education, Inc. Publishing as Prentice Hall 3-5858
Two-Strand Full-Duplex Optical Fiber Cord with SC and ST Connectors
A fiber cord has two-fiber strands
for full-duplex (two-way) transmission
SC Connectors
ST Connectors
TwoStrands
Cord

© 2009 Pearson Education, Inc. Publishing as Prentice Hall 3-59
3-22: Full-Duplex Optical Fiber Cord with SC and ST Connectors
59
SC Connectors(push and click)
ST Connectors(bayonet connectors:
push and click)
In contrast to UTP, which always uses RJ-45 connectors,there are several optical fiber connector types.
SC and ST are the most popular.

© 2009 Pearson Education, Inc. Publishing as Prentice Hall 3-60
3-23: Frequency and Wavelength
60
Light travels in waves.The amplitude is the intensity of the wave.
In sound waves, amplitude is loudness.Amplitude is a measure of power.
Wave

© 2009 Pearson Education, Inc. Publishing as Prentice Hall 3-61
3-23: Frequency and Wavelength
61
Wavelength is the physical distancebetween comparable points on adjacent cycles
(peak-to-peak, trough-to-trough, start-to-start, etc.).Wavelengths are measured in meters.
Light is measured in wavelength.Light wavelengths are in the nanometer range.
Wave

© 2009 Pearson Education, Inc. Publishing as Prentice Hall 3-62
3-20 Optical Fiber Strand
62
In optical fiber transmission, light is expressed in nanometers.The transceiver transmits at 850 nm, 1,310 nm, or 1,550 nm.
Shorter-wavelength (850 nm) transceivers are less expensive.Longer-wavelength (1,310 or 1,550 nm) light travels farther.
For LAN fiber, 850 nm provides sufficient distance and dominates.

© 2009 Pearson Education, Inc. Publishing as Prentice Hall 3-63
3-23: Frequency and Wavelength
63
Waves can also be measured in frequency.The frequency is the number of complete cycles per second.
Hertz (Hz) is the term for cycles per second.Radio transmission is measured in frequency.
Radio transmission usually takes place in the MHz or GHz range.
Wave
© 2009 Pearson Education, Inc. Publishing as Prentice Hall 3-64
3-25: Multimode Fiber and Single-Mode Fiber
64
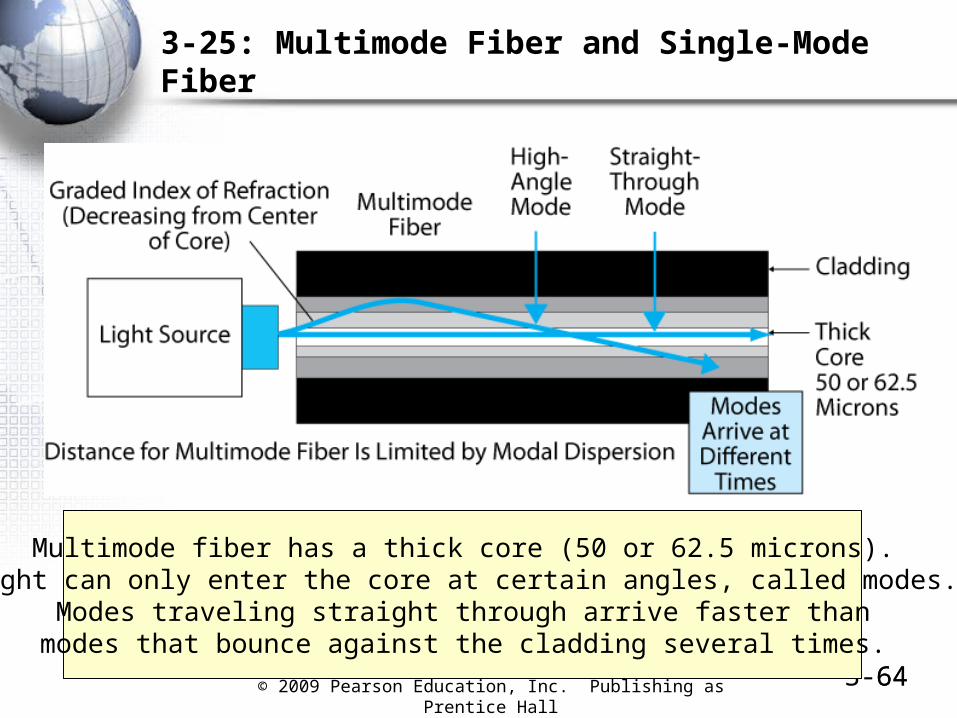
Multimode fiber has a thick core (50 or 62.5 microns).Light can only enter the core at certain angles, called modes.
Modes traveling straight through arrive faster thanmodes that bounce against the cladding several times.

© 2009 Pearson Education, Inc. Publishing as Prentice Hall 3-65
3-25: Multimode Fiber and Single-Mode Fiber
65
Modal dispersion is the difference in time it takes modes to propagate.If modal dispersion is too large, adjacent waves will overlap.
That will produce errors.Modal dispersion is the limiting factor for multimode fiber.

© 2009 Pearson Education, Inc. Publishing as Prentice Hall 3-66
3-25: Multimode Fiber and Single-Mode Fiber
66
Modal dispersion can be reduced by having a graded index ofrefraction in the core, decreasing from the center to the cladding.
All multimode fiber is graded index multimode fiber today.
Modal dispersion is also reduced by better-quality multimode fiber.Modal bandwidth (measured as MHz-km)is the measure of multimode fiber quality.

© 2009 Pearson Education, Inc. Publishing as Prentice Hall 3-67
3-26: Wavelength, Core Diameters, Modal Bandwidth, and Maximum Propagation Distance for Ethernet 1000BASE-SX
67
Wavelength Core Diameter Modal Bandwidth Maximum Propagation
Distance
850 nm 62.5 microns 160 MHz.km 220 m
850 nm 62.5 microns 200 MHz.km 275 m
850 nm 50 microns 500 MHz.km 550 m
With 850 nm light, distance can be increased byusing a smaller core diameter or
using better-quality fiber with higher modal bandwidth.

© 2009 Pearson Education, Inc. Publishing as Prentice Hall 3-68
3-25: Multimode Fiber and Single-Mode Fiber
68
Single mode fiber has a core diameter that is so small(8.3 microns) that only one mode can propagate.
Consequently, there is no modal dispersion.
Single mode fiber transmission distance is limitedonly by absorptive attenuation, which is extremely low.
Consequently, single mode fiber can carry signals for kilometers.However, single-mode fiber is more expensive than multimode.

© 2009 Pearson Education, Inc. Publishing as Prentice Hall
Radio Propagation

© 2009 Pearson Education, Inc. Publishing as Prentice Hall 3-70
Radio Propagation
70
Radio signals also propagate as waves.as noted earlier, radio waves are measured in Hz,
which is a measure of frequency.Radio usually operates in the MHz and GHz range.
© 2009 Pearson Education, Inc. Publishing as Prentice Hall 3-71
3-27: Omnidirectional and Dish Antennas
71
© 2009 Pearson Education, Inc. Publishing as Prentice Hall 3-72
3-28: Wireless Propagation Problems
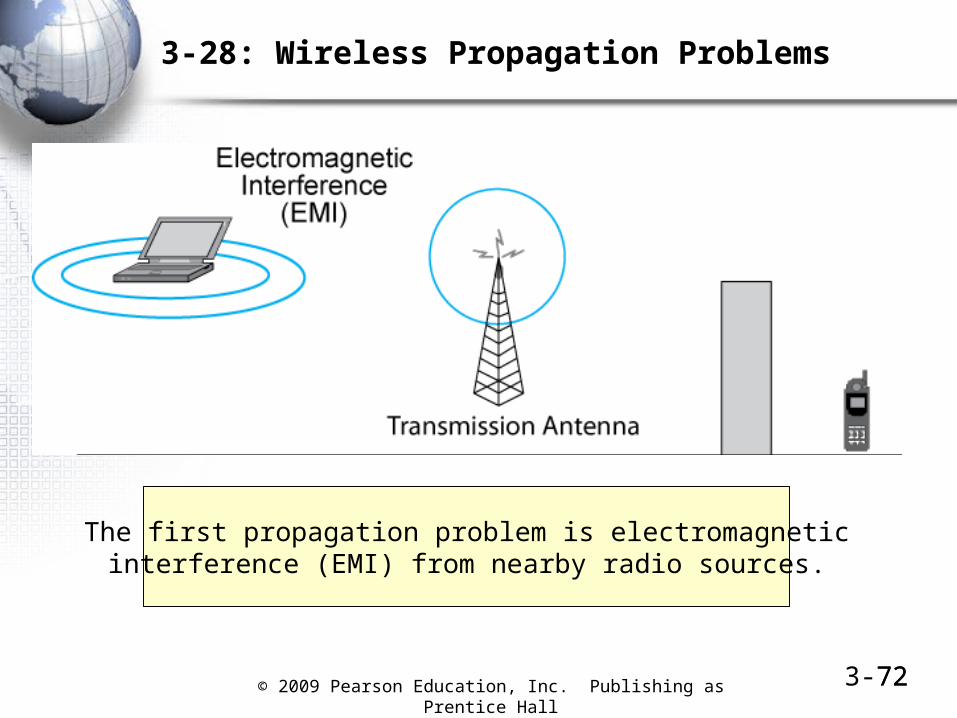
72
The first propagation problem is electromagneticinterference (EMI) from nearby radio sources.

© 2009 Pearson Education, Inc. Publishing as Prentice Hall 3-73
3-28: Wireless Propagation Problems
73
Another problem is inverse square law attenuation.As a signal propagates, its energy spreads out over the
Surface of an ever-expanding sphere.
© 2009 Pearson Education, Inc. Publishing as Prentice Hall 3-74
3-28: Wireless Propagation Problems
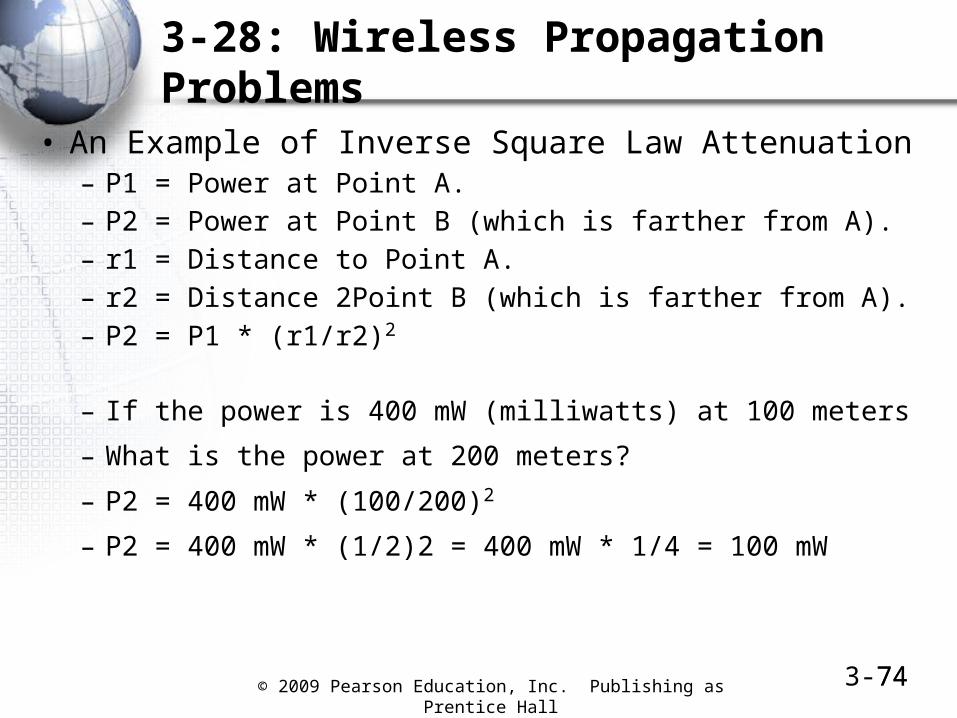
• An Example of Inverse Square Law Attenuation– P1 = Power at Point A.– P2 = Power at Point B (which is farther from A).– r1 = Distance to Point A.– r2 = Distance 2Point B (which is farther from A).– P2 = P1 * (r1/r2)2
– If the power is 400 mW (milliwatts) at 100 meters
– What is the power at 200 meters?
– P2 = 400 mW * (100/200)2
– P2 = 400 mW * (1/2)2 = 400 mW * 1/4 = 100 mW
74

© 2009 Pearson Education, Inc. Publishing as Prentice Hall 3-75
3-28: Wireless Propagation Problems
• An Example of Inverse Square Law Attenuation– P1 = Power at Point A.– P2 = Power at Point B (which is farther from A).– r1 = Distance to Point A.– r2 = Distance 2Point B (which is farther from A).– P2 = P1 * (r1/r2)2
– If the power is 900 mW (milliwatts) at 10 meters
– What is the power at 30 meters?
75

© 2009 Pearson Education, Inc. Publishing as Prentice Hall 3-76
3-28: Wireless Propagation Problems
76
Confusingly, wireless propagation suffers from two formsof attenuation. We have just seen inverse square law attenuation.
There is also absorptive attenuation, which is attenuationbecause power is absorbed by water molecules along the way.
Absorptive attenuation increases with frequency.

© 2009 Pearson Education, Inc. Publishing as Prentice Hall 3-77
3-28: Wireless Propagation Problems
77
When radio waves hit thick objects, they cannot penetrate.This creates shadow zones, which are also called dead spots.
Shadow zones get worse as frequency increases.

© 2009 Pearson Education, Inc. Publishing as Prentice Hall
Topology
Network topology is the physicalarrangement of a network’s
computers,switches, routers, and transmission
lines.
It is a physical layer concept.

© 2009 Pearson Education, Inc. Publishing as Prentice Hall 3-79
3-29: Major Topologies
79
The simplest topology is the point-to-point topology.

© 2009 Pearson Education, Inc. Publishing as Prentice Hall 3-80
3-29: Major Topologies
80
Ethernet uses a star topology.Note that the switch does not have to be in the middle of the star.

© 2009 Pearson Education, Inc. Publishing as Prentice Hall 3-81
3-29: Major Topologies
81
Larger Ethernet LANs use an extended star topology.This is better called a hierarchical topology.

© 2009 Pearson Education, Inc. Publishing as Prentice Hall 3-82
3-29: Major Topologies
82
In a mesh topology, there are many connectionsbetween switches or routers.
Consequently, there are many alternative routes between hosts.
© 2009 Pearson Education, Inc. Publishing as Prentice Hall 3-83
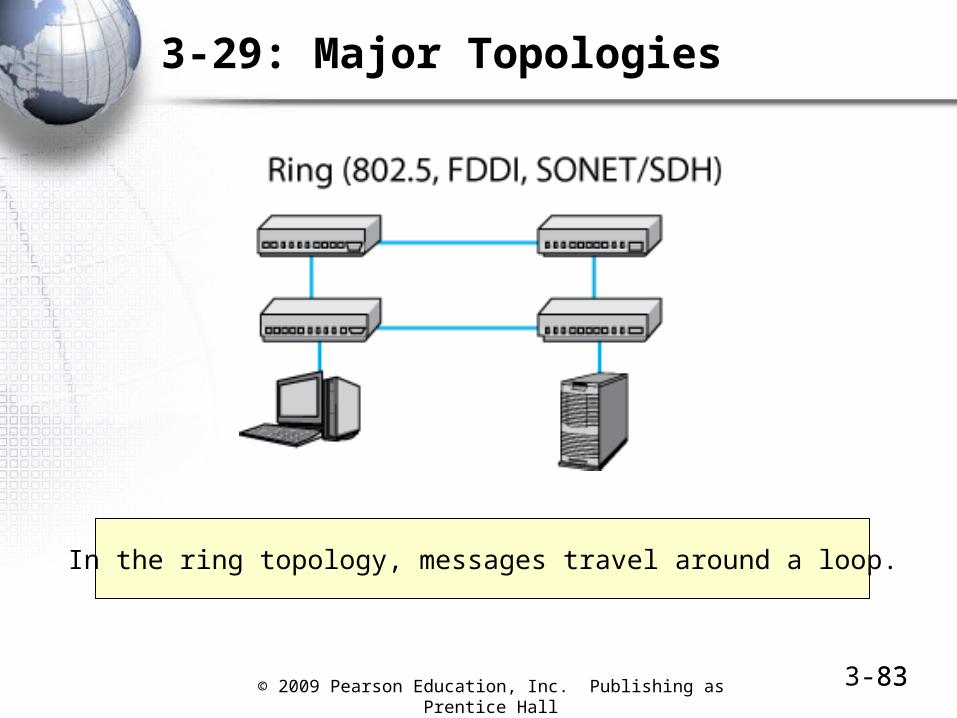
3-29: Major Topologies
83
In the ring topology, messages travel around a loop.

© 2009 Pearson Education, Inc. Publishing as Prentice Hall 3-84
3-29: Major Topologies
84
The bus topology uses broadcasting.The message receives each host at almost the same time.
All wireless transmission uses a bus topology.