chapter 5 the behavior of interest rates - … · • expected return: ... • risk: the degree of...
TRANSCRIPT
Chapter 5
The Behavior of Interest Rates
© 2013 Pearson Education, Inc. All rights reserved. 5-2
Determinants of Asset Demand
• Wealth: the total resources owned by the individual, including all assets
• Expected Return: the return expected over the next period on one asset relative to alternative assets
• Risk: the degree of uncertainty associated with the return on one asset relative to alternative assets
• Liquidity: the ease and speed with which an asset can be turned into cash relative to alternative assets
© 2013 Pearson Education, Inc. All rights reserved. 5-3
Theory of Portfolio Choice
Holding all other factors constant: 1. The quantity demanded of an asset is positively related
to wealth 2. The quantity demanded of an asset is positively related
to its expected return relative to alternative assets 3. The quantity demanded of an asset is negatively related
to the risk of its returns relative to alternative assets 4. The quantity demanded of an asset is positively related
to its liquidity relative to alternative assets
© 2013 Pearson Education, Inc. All rights reserved. 5-4
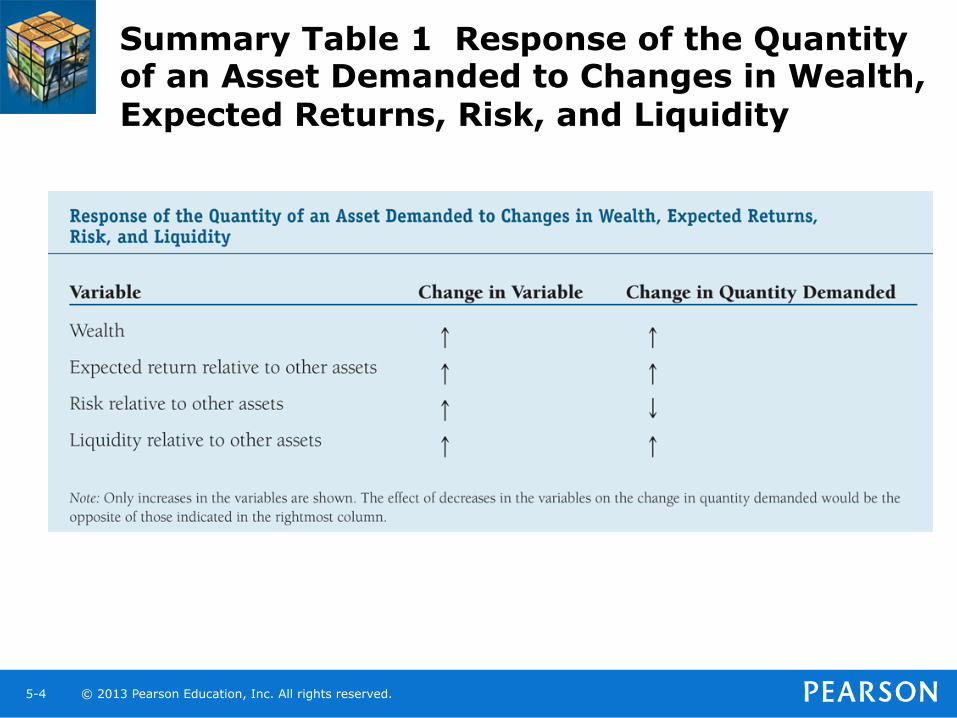
Summary Table 1 Response of the Quantity of an Asset Demanded to Changes in Wealth, Expected Returns, Risk, and Liquidity
© 2013 Pearson Education, Inc. All rights reserved. 5-5
Supply and Demand in the Bond Market
• At lower prices (higher interest rates), ceteris paribus, the quantity demanded of bonds is higher: an inverse relationship
• At lower prices (higher interest rates), ceteris paribus, the quantity supplied of bonds is lower: a positive relationship
© 2013 Pearson Education, Inc. All rights reserved. 5-6
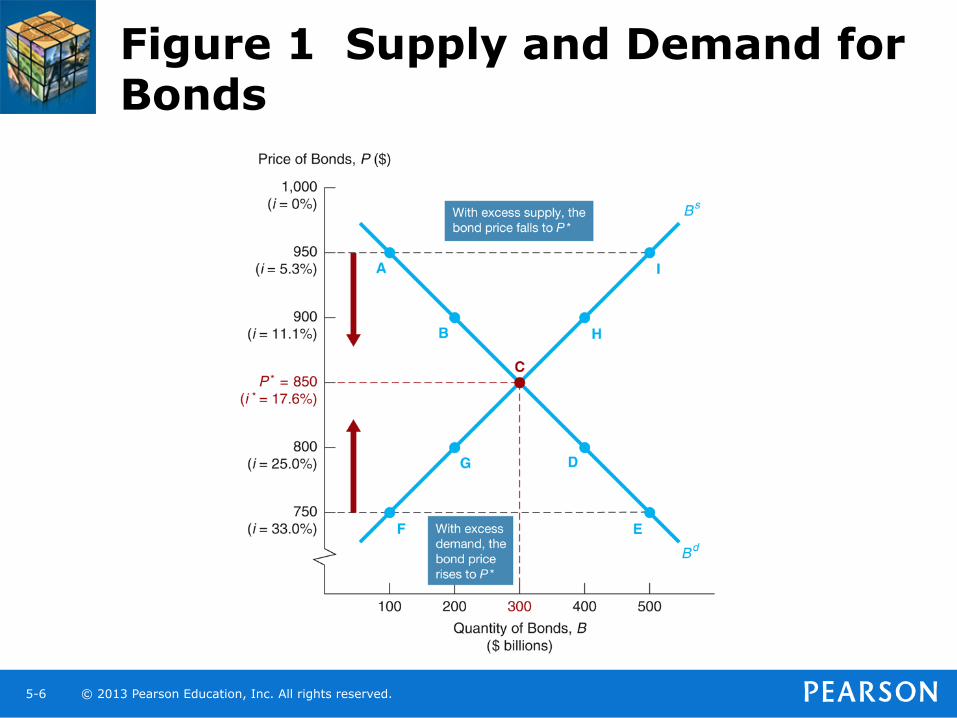
Figure 1 Supply and Demand for Bonds
© 2013 Pearson Education, Inc. All rights reserved. 5-7
Market Equilibrium
• Occurs when the amount that people are willing to buy (demand) equals the amount that people are willing to sell (supply) at a given price
• Bd = Bs defines the equilibrium (or market clearing) price and interest rate.
• When Bd > Bs , there is excess demand, price will rise and interest rate will fall
• When Bd < Bs , there is excess supply, price will fall and interest rate will rise
© 2013 Pearson Education, Inc. All rights reserved. 5-8
Changes in Equilibrium Interest Rates
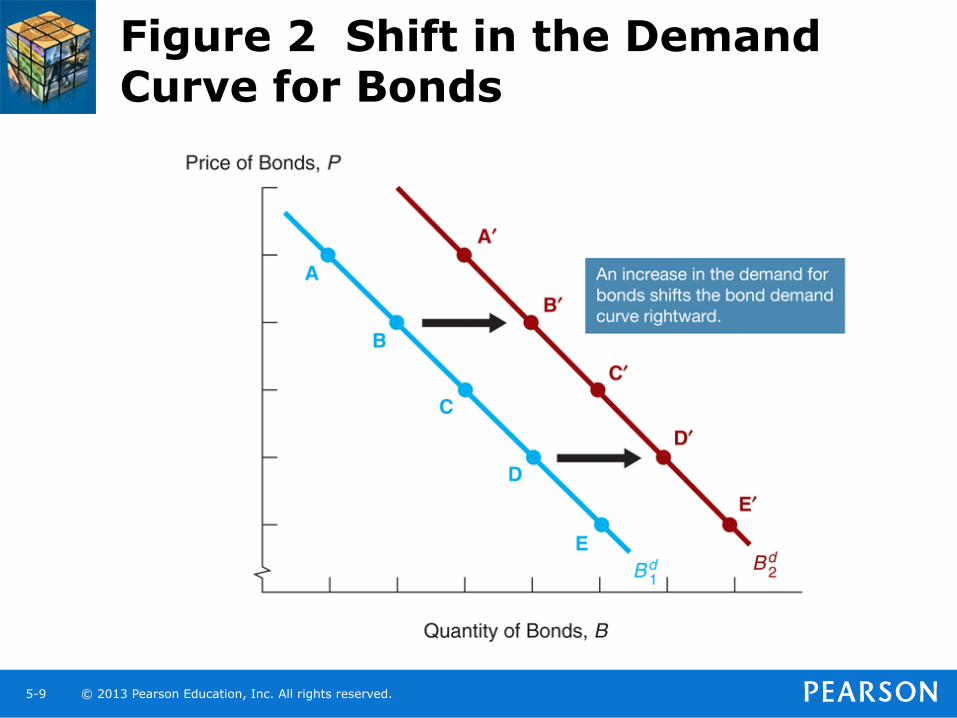
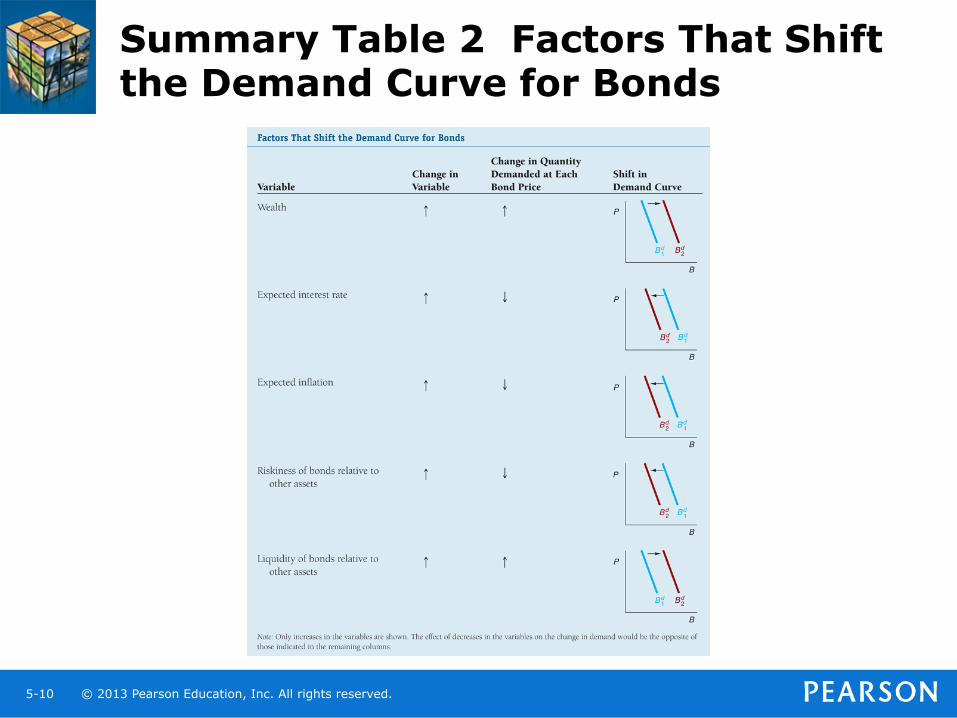
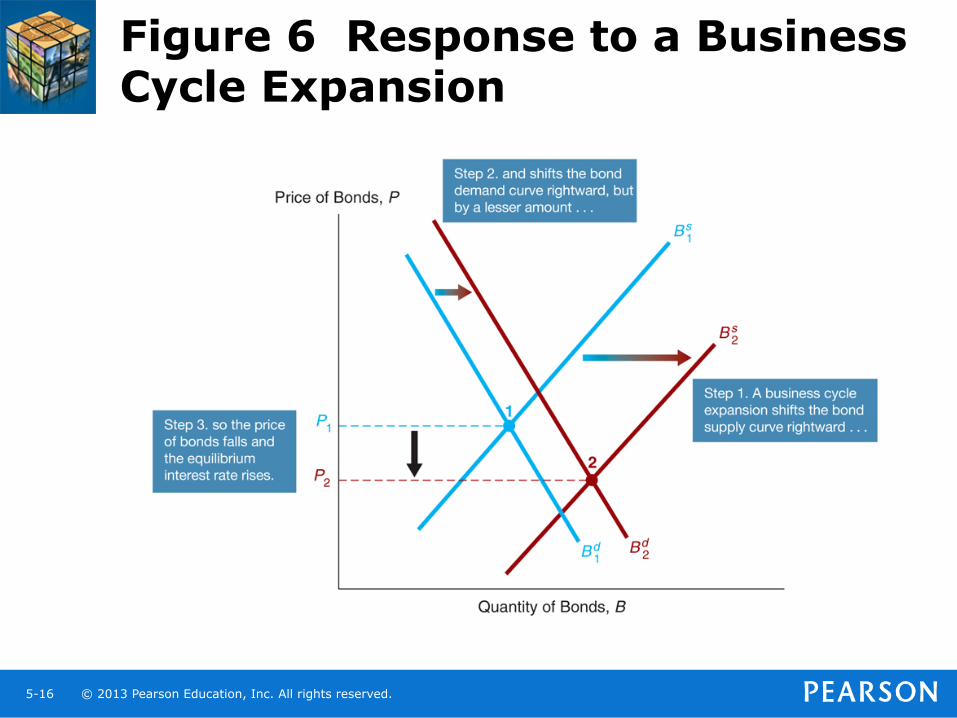
• Shifts in the demand for bonds: • Wealth: in an expansion with growing wealth, the
demand curve for bonds shifts to the right • Expected Returns: higher expected interest rates in
the future lower the expected return for long-term bonds, shifting the demand curve to the left
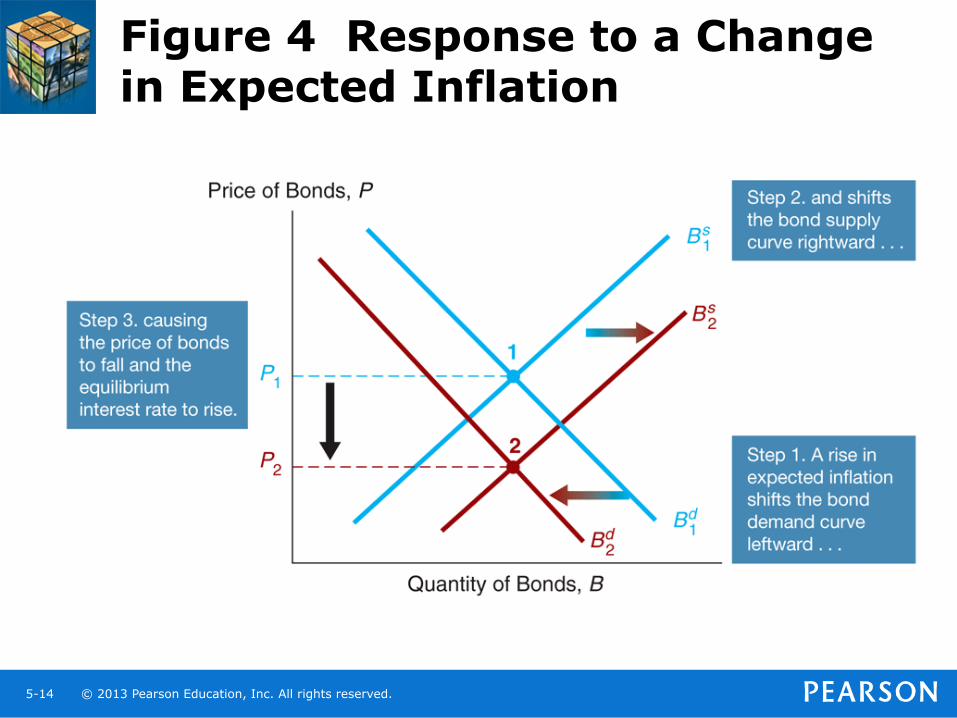
• Expected Inflation: an increase in the expected rate of inflations lowers the expected return for bonds, causing the demand curve to shift to the left
• Risk: an increase in the riskiness of bonds causes the demand curve to shift to the left
• Liquidity: increased liquidity of bonds results in the demand curve shifting right
© 2013 Pearson Education, Inc. All rights reserved. 5-9
Figure 2 Shift in the Demand Curve for Bonds
© 2013 Pearson Education, Inc. All rights reserved. 5-10
Summary Table 2 Factors That Shift the Demand Curve for Bonds
© 2013 Pearson Education, Inc. All rights reserved. 5-11
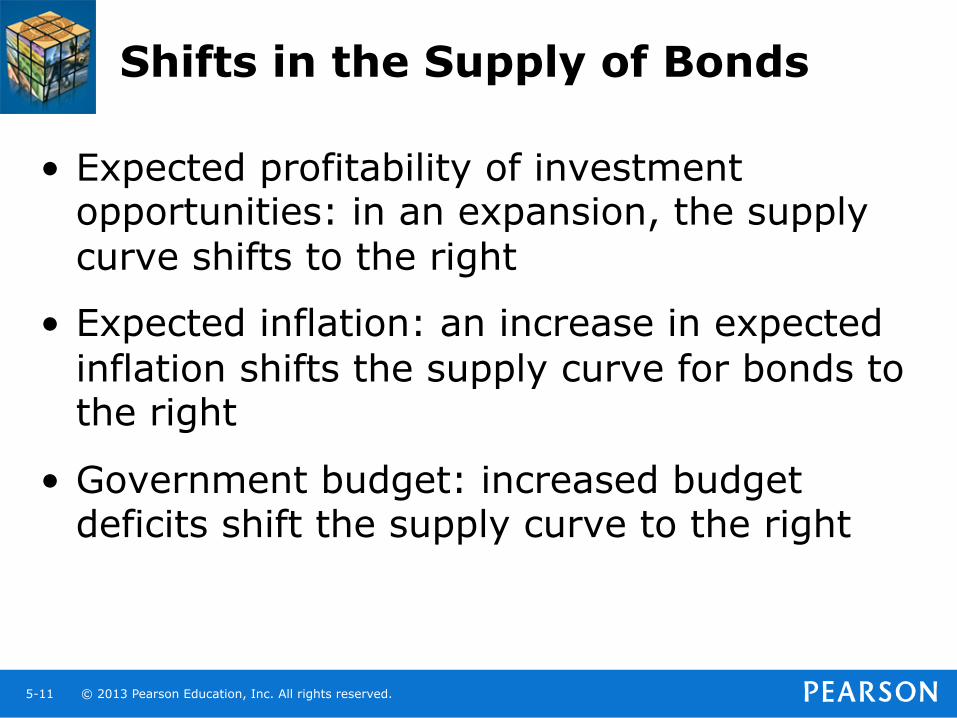
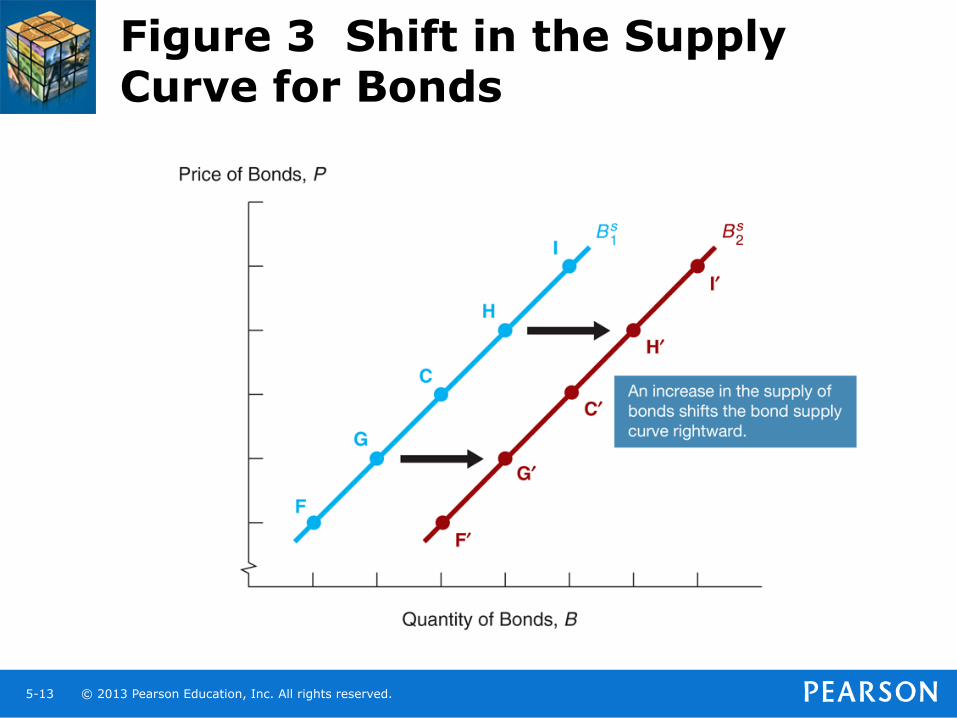
Shifts in the Supply of Bonds
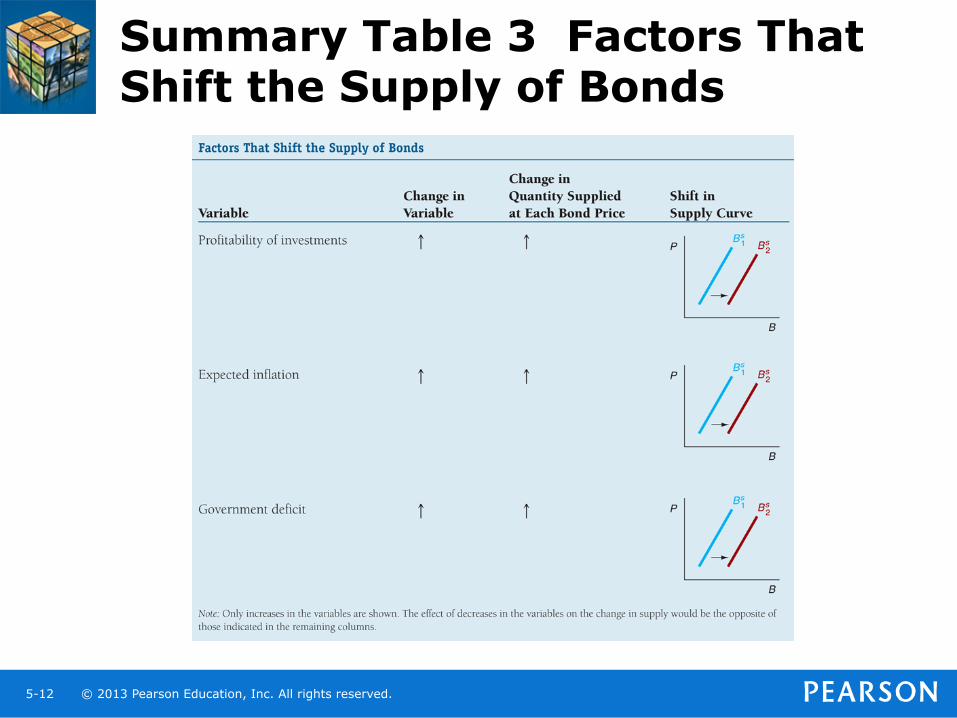
• Expected profitability of investment opportunities: in an expansion, the supply curve shifts to the right
• Expected inflation: an increase in expected inflation shifts the supply curve for bonds to the right
• Government budget: increased budget deficits shift the supply curve to the right
© 2013 Pearson Education, Inc. All rights reserved. 5-12
Summary Table 3 Factors That Shift the Supply of Bonds
© 2013 Pearson Education, Inc. All rights reserved. 5-13
Figure 3 Shift in the Supply Curve for Bonds
© 2013 Pearson Education, Inc. All rights reserved. 5-14
Figure 4 Response to a Change in Expected Inflation
© 2013 Pearson Education, Inc. All rights reserved. 5-15
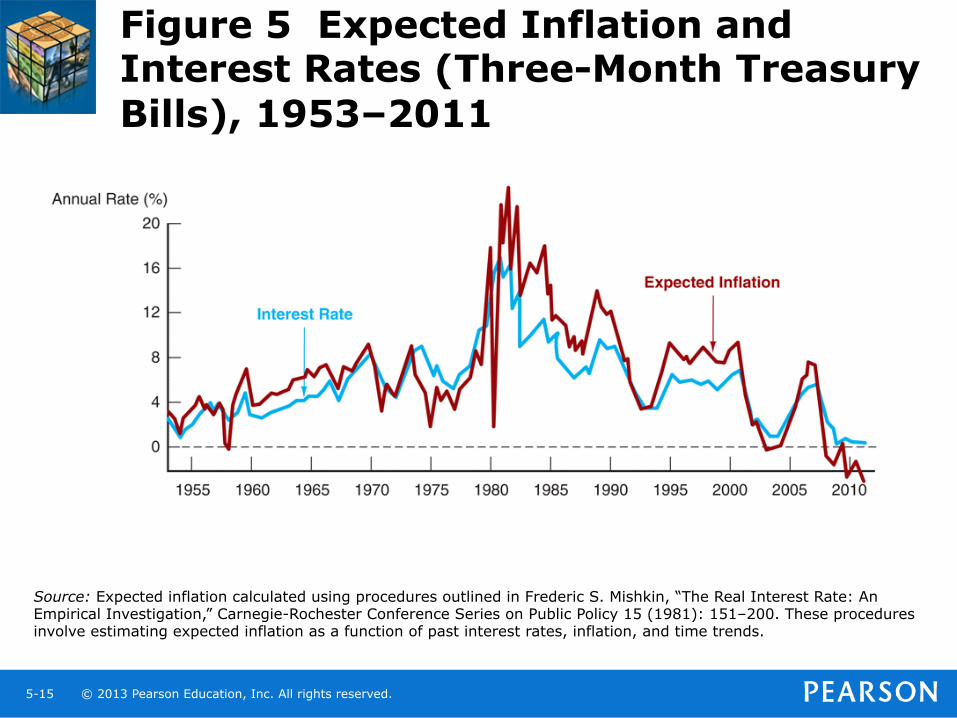
Figure 5 Expected Inflation and Interest Rates (Three-Month Treasury Bills), 1953–2011
Source: Expected inflation calculated using procedures outlined in Frederic S. Mishkin, “The Real Interest Rate: An Empirical Investigation,” Carnegie-Rochester Conference Series on Public Policy 15 (1981): 151–200. These procedures involve estimating expected inflation as a function of past interest rates, inflation, and time trends.
© 2013 Pearson Education, Inc. All rights reserved. 5-16
Figure 6 Response to a Business Cycle Expansion
© 2013 Pearson Education, Inc. All rights reserved. 5-17
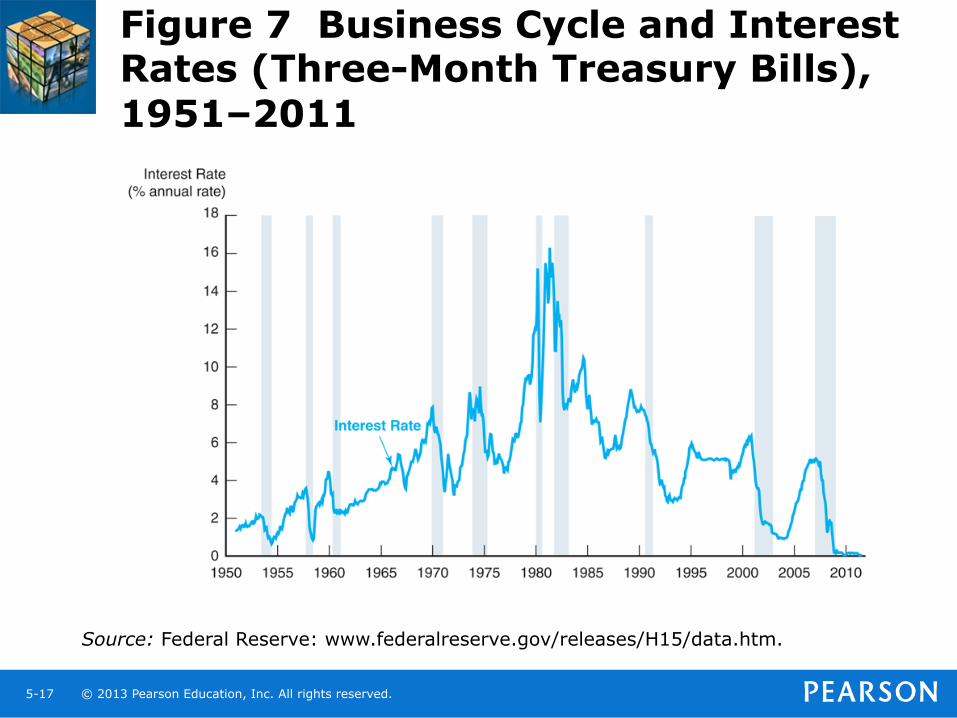
Figure 7 Business Cycle and Interest Rates (Three-Month Treasury Bills), 1951–2011
Source: Federal Reserve: www.federalreserve.gov/releases/H15/data.htm.
© 2013 Pearson Education, Inc. All rights reserved. 5-18
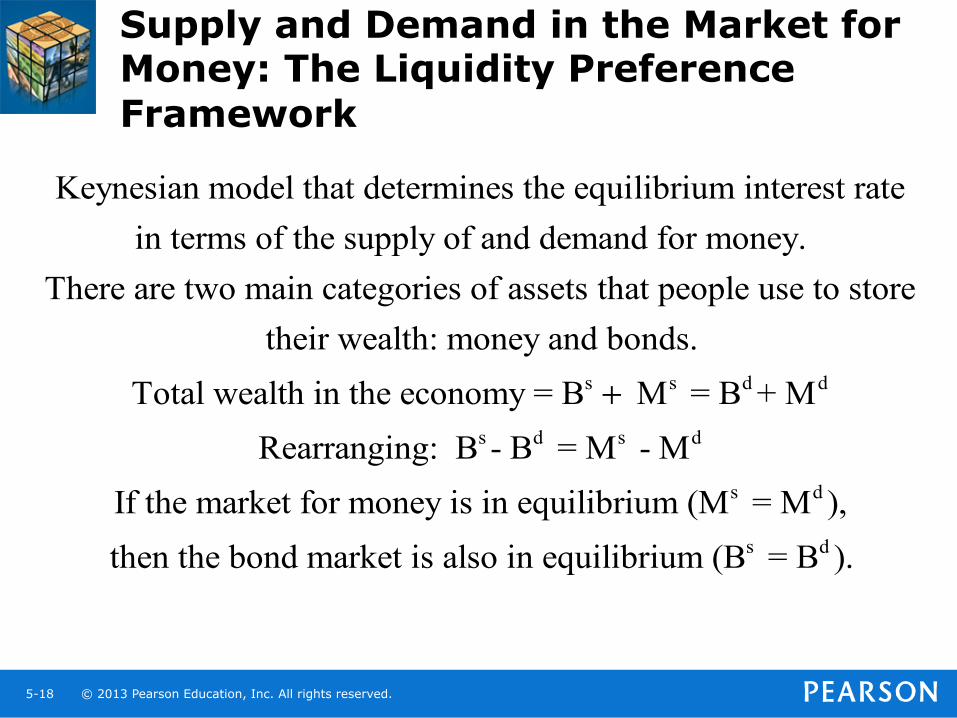
Supply and Demand in the Market for Money: The Liquidity Preference Framework
Keynesian model that determines the equilibrium interest ratein terms of the supply of and demand for money.
There are two main categories of assets that people use to storetheir wealth: money and bo
s s d d
s d s d
s d
s d
nds.Total wealth in the economy = B M = B + M
Rearranging: B - B = M - MIf the market for money is in equilibrium (M = M ),then the bond market is also in equilibrium (B = B ).
+
© 2013 Pearson Education, Inc. All rights reserved. 5-19
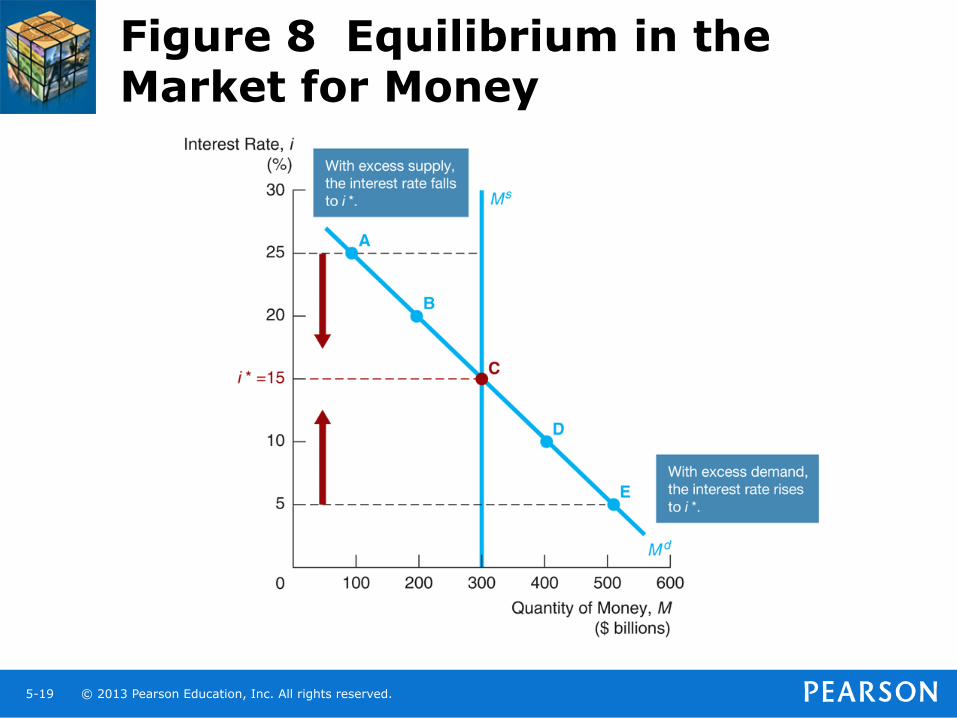
Figure 8 Equilibrium in the Market for Money
© 2013 Pearson Education, Inc. All rights reserved. 5-20
Demand for Money in the Liquidity Preference Framework
• As the interest rate increases: – The opportunity cost of holding money
increases… – The relative expected return of money
decreases… • …and therefore the quantity demanded of
money decreases.
© 2013 Pearson Education, Inc. All rights reserved. 5-21
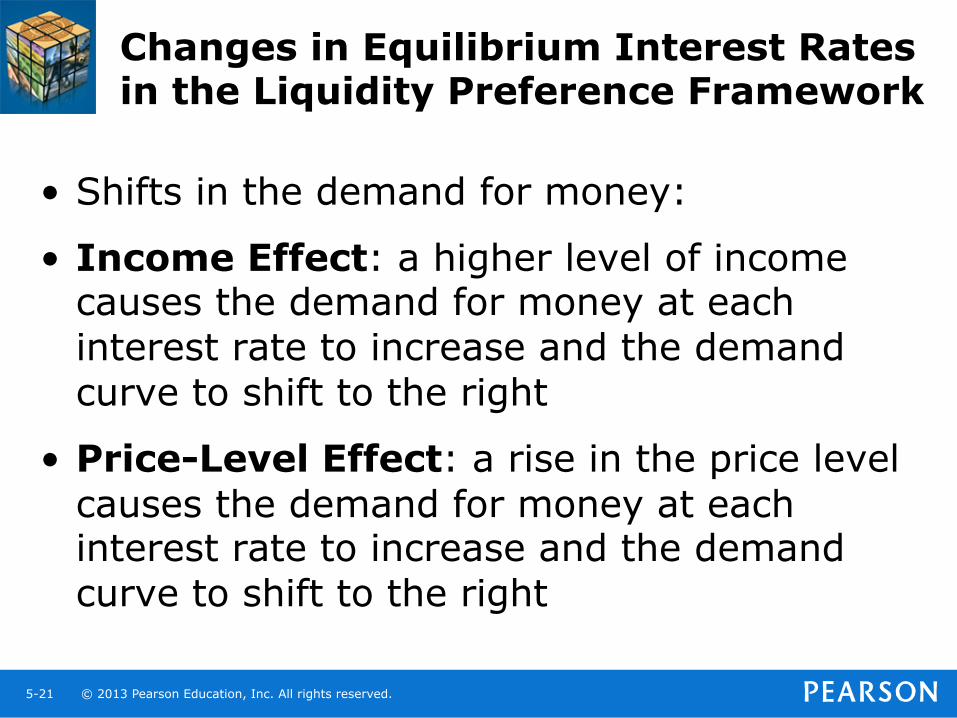
Changes in Equilibrium Interest Rates in the Liquidity Preference Framework
• Shifts in the demand for money:
• Income Effect: a higher level of income causes the demand for money at each interest rate to increase and the demand curve to shift to the right
• Price-Level Effect: a rise in the price level causes the demand for money at each interest rate to increase and the demand curve to shift to the right
© 2013 Pearson Education, Inc. All rights reserved. 5-22
Shifts in the Supply of Money
• Assume that the supply of money is controlled by the central bank
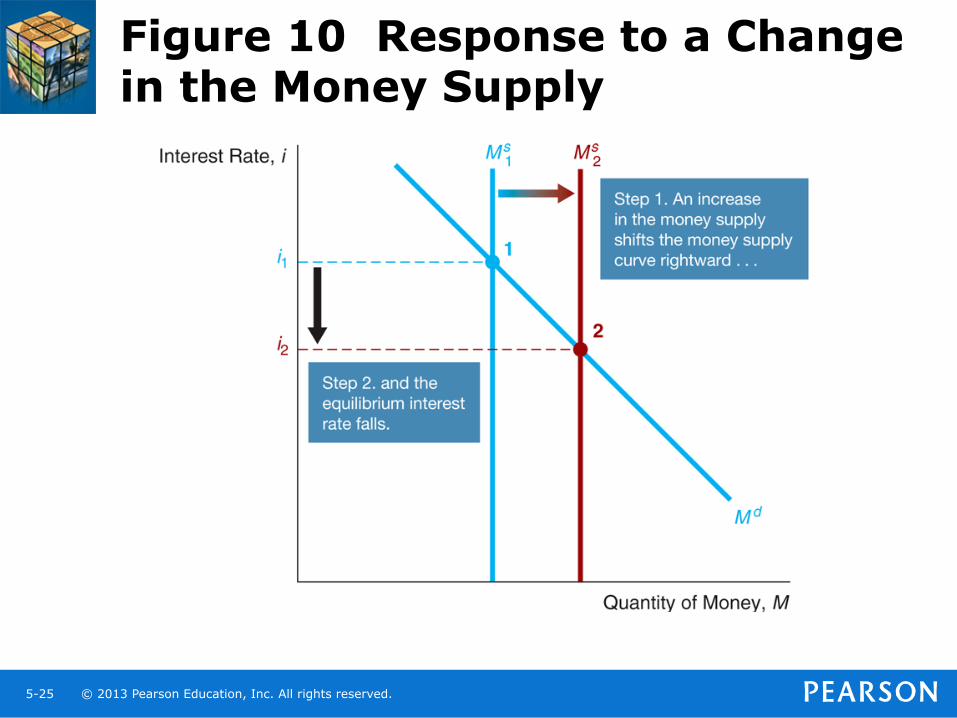
• An increase in the money supply engineered by the Federal Reserve will shift the supply curve for money to the right
© 2013 Pearson Education, Inc. All rights reserved. 5-23
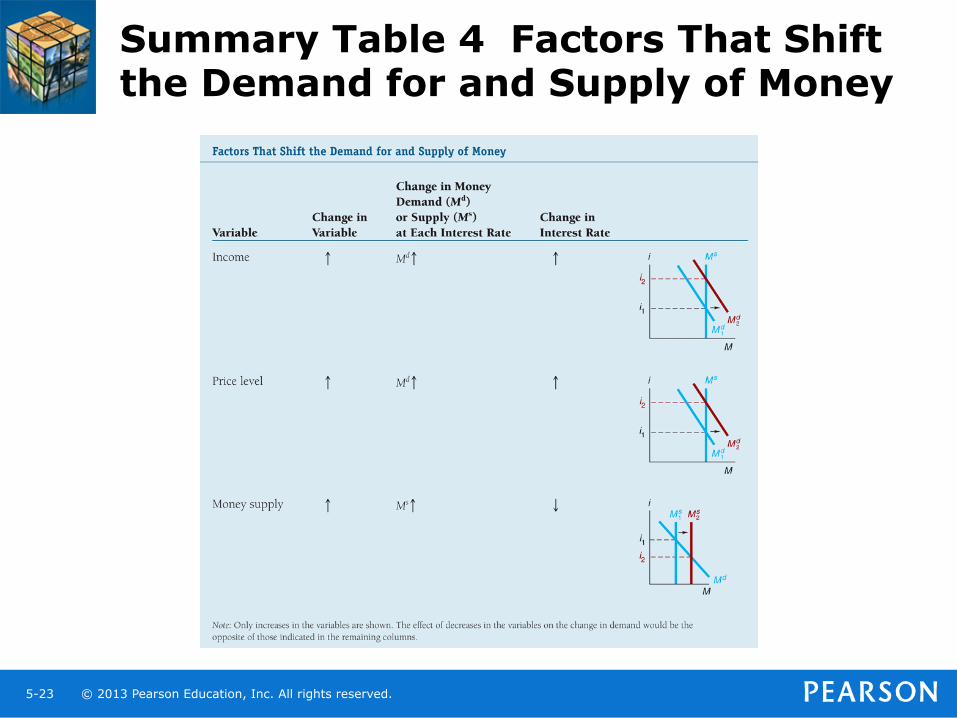
Summary Table 4 Factors That Shift the Demand for and Supply of Money
© 2013 Pearson Education, Inc. All rights reserved. 5-24
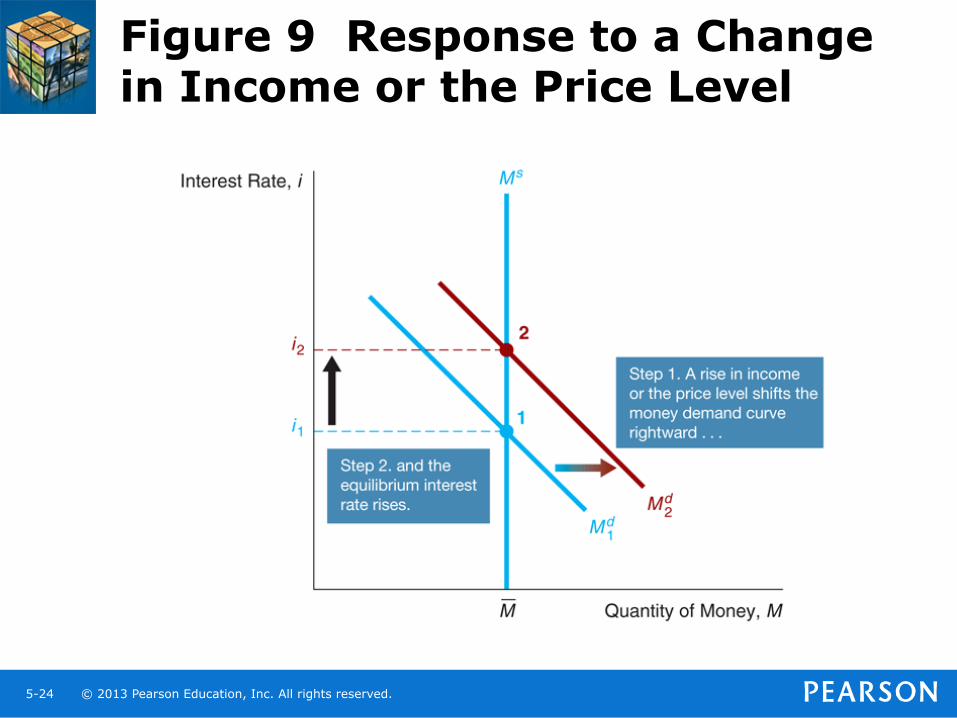
Figure 9 Response to a Change in Income or the Price Level
© 2013 Pearson Education, Inc. All rights reserved. 5-25
Figure 10 Response to a Change in the Money Supply
© 2013 Pearson Education, Inc. All rights reserved. 5-26
Price-Level Effect and Expected-Inflation Effect
• A one time increase in the money supply will cause prices to rise to a permanently higher level by the end of the year. The interest rate will rise via the increased prices.
• Price-level effect remains even after prices have stopped rising.
• A rising price level will raise interest rates because people will expect inflation to be higher over the course of the year. When the price level stops rising, expectations of inflation will return to zero.
• Expected-inflation effect persists only as long as the price level continues to rise.
© 2013 Pearson Education, Inc. All rights reserved. 5-27
Does a Higher Rate of Growth of the Money Supply Lower Interest Rates?
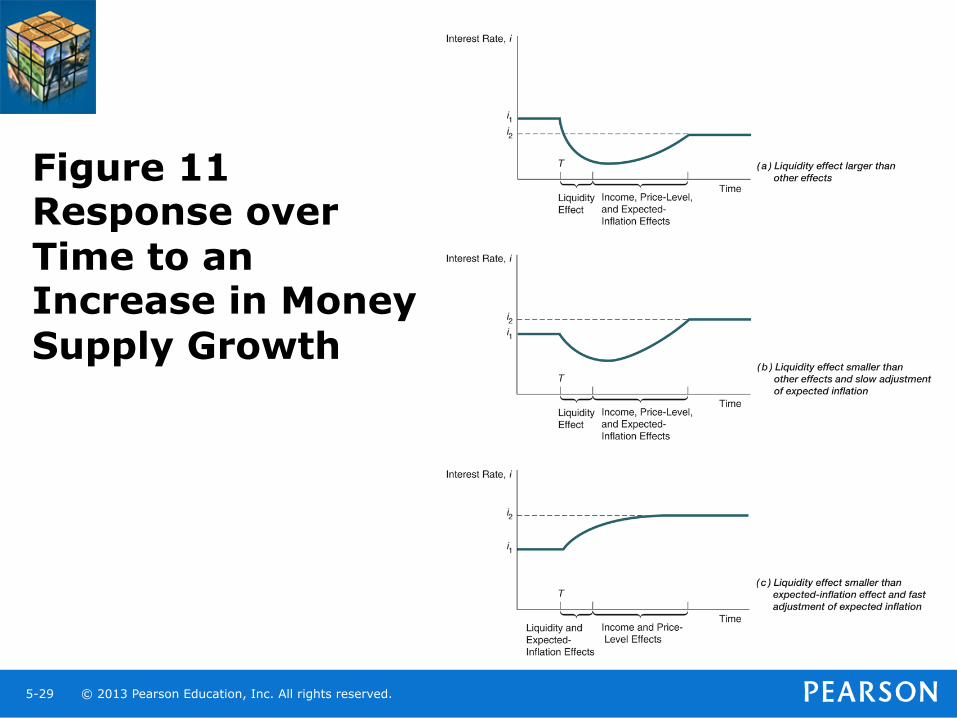
• Liquidity preference framework leads to the conclusion that an increase in the money supply will lower interest rates: the liquidity effect.
• Income effect finds interest rates rising because increasing the money supply is an expansionary influence on the economy (the demand curve shifts to the right).
© 2013 Pearson Education, Inc. All rights reserved. 5-28
Does a Higher Rate of Growth of the Money Supply Lower Interest Rates? (cont’d)
• Price-Level effect predicts an increase in the money supply leads to a rise in interest rates in response to the rise in the price level (the demand curve shifts to the right).
• Expected-Inflation effect shows an increase in interest rates because an increase in the money supply may lead people to expect a higher price level in the future (the demand curve shifts to the right).
© 2013 Pearson Education, Inc. All rights reserved. 5-29
Figure 11 Response over Time to an Increase in Money Supply Growth
© 2013 Pearson Education, Inc. All rights reserved. 5-30
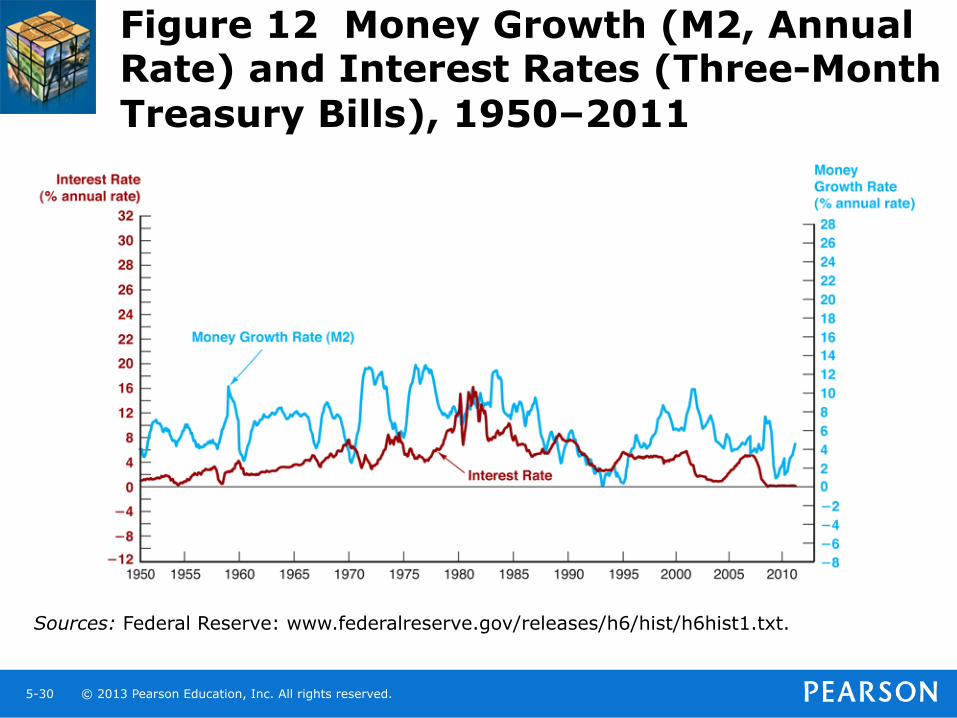
Figure 12 Money Growth (M2, Annual Rate) and Interest Rates (Three-Month Treasury Bills), 1950–2011
Sources: Federal Reserve: www.federalreserve.gov/releases/h6/hist/h6hist1.txt.