how will upswings in price inflation and interest rates ...atrf.info/papers/2011/2011_dibona.pdf ·...
TRANSCRIPT

Australasian Transport Research Forum 2011 Proceedings 28 - 30 September 2011, Adelaide, Australia
Publication website: http://www.patrec.org/atrf.aspx
1
How Will Upswings in Price Inflation and Interest Rates Change Toll Road Risk Profiles? A Study of Developing
East Asian Economies with Broader Implications
Richard F. Di Bona
Independent Consultant, Hong Kong
Email for correspondence: [email protected]
Abstract
The resurgence in private sector involvement in toll roads since the 1980’s coincided with secular decreases in price inflation and interest rates. Recently, these decreases have started reversing and in accordance the Kondratieff Wave (long-wave business cycle) are expected to increase.
With a primary focus on developing East Asian economies, the likely implications of such changes were tested using Monte Carlo risk simulation: combining economic scenarios with construction and operations costs, plus traffic and revenue for a simple, notional toll road case, linked with a financial model. This concluded that there would be a significant change in the nature and extent of project finance risks in response to increasing price inflation and interest rates. Whilst the increased demand associated with increasing price inflation (competition for commodities) and interest rates (competition for capital) would on average increase likely toll road returns, there was also an increased chance of project bankruptcy, i.e. both upside and downside risk increased.
These results were compared against data from practitioner questionnaires regarding inter alia expectations of the future, identifying gaps between expectations and likely outcomes. Moreover, these surveys also supported literature review evidence of the prevalence of bias and serial error in toll road forecasting, which in fact could exacerbate some of the down-side risks.
This Paper is based upon research undertaken in partial fulfilment of an MBA from Henley Business School (Di Bona, 2006).
1. Introduction
The resurgence in private sector involvement in toll roads since the 1980’s coincided with secular decreases in price inflation and interest rates. Recently, these decreases have started reversing and in accordance Kondratieff (1926) and Schumpeter (1939) are expected to increase. Given most transport privatisation and associated literature and experience are based on declining price inflation and interest rates, reviewing these based on increases conditions could be timely.
The specific hypothesis tested therefore was: “There is a significant change in the nature and extent of project finance risks for private stakeholders in East Asian toll roads during a period of increasing price inflation and interest rates”
The economies selected were developing East Asian economies in which the author had project experience and which were large enough for inter-urban tollway networks, namely: Cambodia, China, Indonesia, Laos, Malaysia, Myanmar, Philippines, Thailand and Vietnam.
Though tested with a primary focus on developing East Asian economies, lessons drawn could be of broader significance.

ATRF 2011 Proceedings
2
2. Environmental Analysis
2.1 PESTLE Analysis
PESTLE analysis was used to gauge potential risk and opportunity by country for toll roads, identifying external dynamics affecting the market. Table 1 summarises the findings, showing a growing desire overall for inter-urban transport. The key driving-force is economics; however, political/ legal constraints include corruption.
Table 1: Key Findings of PESTLE Analysis
Element Description
Political Stability concerns in many countries, though not always deterring
infrastructure investment
Economic Economies generally growing relatively rapidly, although wealth levels
varied.
Social
Generally much/ growing inter-urban travel, in parallel with rapid urbanisation. Demand suppressed in some cases by poor infrastructure.
Some countries have developed foreign private financing more than others. In general, the scope for this sector’s contribution is
acknowledged, but deep-seated nationalism can restrict foreign equity shares, sometimes creating management control issues.
Technological Tolling is largely manual, excepting a few major routes.
Legal A wide variety of legal systems, but with corruption often rife.
Environmental Economic development predominates over environmental considerations
2.2 Vehicle Ownership
Khan and Willumsen (1986) note correlation between car ownership and roadspace in developing countries: statistically one proxying the other. ADB et al (2005, p.3) suggest the following broad correlation between GDP and roadspace:
pitaofGDPperCaUSkminLandArea
PavedRoadsofkm$ln5.05.0
__
__ln
2
(1)
However, no goodness-of-fit is given (graphical presentation suggests low R2).
Regressions for the Study Area 9 countries, plus 5 others1 for benchmarking suggest S-curve relationships for paved roads, railway and airports in terms of kilometrages/ number of airports per km2 or per capita. Figures 1 and 2 show equations fitted for roads per capita and per km2 respectively, with respect to GDP per capita, suggesting substantial road build-out/ vehicle ownership growth are likely as economies grow. These also suggest clustering as follows:
Relatively developed networks, in countries with significant prior experience of transport infrastructure privatisation: China, Indonesia, Malaysia and Thailand;
Relatively undeveloped networks, also correlating to a relative lack of infrastructure privatisation: Cambodia, Laos and Myanmar; and,
Intermediate countries: with some problematic experience of privatisation (Philippines) or nascent interest in privatisation (Vietnam).
1 The other five countries were Mexico, Poland, South Korea, UK and USA

How Will Upswings in Price Inflation and Interest Rates Change Toll Road Risk Profiles? A Study of Developing East Asian Economies with Broader Implications
3
Figure 1: Relationship between Wealth and Roads per Capita
Figure 2: Relationship between Wealth and Road Density

ATRF 2011 Proceedings
4
3. Cost of Capital, Business Cycles, Interest Rates and Inflation
3.1 The Weighted Average Cost of Capital
Higson (1995) notes that according to the Fisher-Hirshleifer theorem firms should undertake projects if return is greater than investors’ required return. Highways require substantial up-front investment and traffic flows often take a few years to build-up to “break even” levels; attractiveness is greatly affected by timing of revenue receipts and the discount rate, as well as by initial investment size. Projects can be valued based inter alia on Net Present Value (NPV) or the Internal Rate of Return.
The Capital Asset Pricing Model (CAPM; ibid.) suggests the return on a risky project rj is:
)( imjij rrrr (2)
Where: ri is the return on riskless borrowing/ lending
rm is the return on the money market as a whole
The risk premium for j is a proportion βj of overall market risk-premium, as follows:
2
m
jm
j
(3)
Required return can also be calculated as the Weighted Average Cost of Capital (WACC):
MVMV
dMVeMV
DE
KDKEWACC
(4)
Where: EMV is total market value of equity employed
DMV is total market value of debt employed
Ke is cost of equity, given by (5)
Kd is cost of debt, given by (6)
thvidendGrowExpectedDiiceShare
DividendKe
Pr (5)
TaxRateeofFaceValuiceDebenture
teInterestRaKd
1
)(%Pr (6)
From Equations (2) and (4), the Fisher-Hirshleifer theorem is restated as pursue projects if:
MVMV
dMVeMVimji
DE
KDKErrr
)( (7)
3.2 Schumpeterian Cycle Theories and Definition of the Kondratieff Wave
Orthodox economics assumes given policies produce similar results at all times; Ormerod (1999, pp.96-102) notes experience contradicts this, due to periodic exogenous shocks. Others postulate cycles responding to exogenous shocks. But to some cycle adherents, such shocks are largely endogenous. Schumpeter (1939) consolidated others’ preceding work, specifying three inter-related cycles:

How Will Upswings in Price Inflation and Interest Rates Change Toll Road Risk Profiles? A Study of Developing East Asian Economies with Broader Implications
5
Kitchin (1923): based on fluctuations in business inventories (39+/– months)
Juglar (1863): based on business investment in plant and equipment (7-11 years)
Kondratieff (1926): based on development of new technologies/ sectors and impact of their adoption on socio-economic conditions (48-60 years; a.k.a. “K-Wave”)
The K-Wave postulates periodic “Creative Destruction” (Schumpeter, 1950, Chap.VII) intrinsic to industrial-capitalism. Kondratieff’s empirical work identified a number of patterns within each cycle. Further analysis by Schumpeter (1939), summarised by Faber (2002, pp.116-138) notes:
Before and during the beginning of Upswings there are profound changes in industrial techniques (based on new technologies) and/or involvement of new countries in the global economy and/or development of new transport technologies.
Social upheavals and international conflict are more likely during Upswings.
Agricultural prices decrease during downswings; industrial prices hold steady or fall slightly. During upswings, commodity price increases can create broader price inflation. Interest rates also follow this cycle, as appears to have been the case in recent years.
Upswings are characterised by brevity of depressions and intensity of booms; the opposite being true during downswings.
There are also separate transitional phases at peaks and troughs (often correlated to economic and financial crises). Appendix 1 shows K-Waves since 1787. Maddison (1995) estimated real global GDP per capita rose 2.90% p.a. from the 1950s-1970s (K-Wave upswing); but declined to 1.11% p.a. until the 1990’s (K-Wave downswing).
3.3 Interplay of Economic Growth, Price Inflation and Interest Rates
As noted in 3.2 above, K-Wave upswings include increased economic growth coupled with increases in price inflation and interest rates. This can be explained as follows: when economic growth accelerates, there is increased demand for goods and commodities (hence increased price inflation) and increased demand for capital to finance production and purchase of same (hence increased interest rates).
These in turn will affect the attractiveness of potential investments (Section 3.1), including toll roads, based on equation (7) as follows:
Expected returns from riskless borrowing/ lending (ri) will increase, placing barometric pressure on required returns from debt-financing any risky asset
This will increase the cost of debt (Kd)
Increased economic growth (and hence profits) together with price inflation will increase the cost of equity (Ke)
Ex ante project appraisal would normally be based upon contemporaneous values for Kd and Ke. These would likely subsequently increase. Consequently, should a project require re-financing after its initiation, the costs of such re-financing are likely to be higher than when the decision to proceed was taken. This is in contrast to K-Wave downswing conditions (e.g. 1980s and 1990s) when declining interest rates meant that re-financing would likely be cheaper than originally anticipated.

ATRF 2011 Proceedings
6
3.4 Postulated Position on the Kondratieff Wave
Based on a peak in interest rates in most leading economies in the early 1980’s, along with a peak in commodity prices (especially gold) and inflation rates, the last downwave begun around 1980/1981. Equally, the bottoming out of many commodity prices at the end of the 1990’s suggest an upswing began around the same time (more-or-less coinciding with the NASDAQ peaking in 2000). Recent increases in US interest rates and strong commodity markets support this assertion. Regarding inflation, Faber (2003, p.10) notes that in the classical definition of inflation (increased money supply), low interest rates and easy credit now available in many countries, but specifically the USA are evidence of inflation; price indices are likely to accelerate. Prolonged low real interest rates since the K-Wave bottom are likely to yield gold prices over-and-above what would normally be expected in the early stages of the upswing (Faber, 2005, 2006). Figure 3 plots US interest rates and nominal gold price, with a simplified K-Wave. The recent surge in gold prices is also shown.
A few transport planner-economists (e.g. Kilsby, 2006a, 2006b) have recently postulated and examined the implications of significant fuel price increases; though such work is not yet widespread.
Figure 3: Postulated Upturn in the Kondratieff Wave
0
2
4
6
8
10
12
14
16
18
1950
1955
1960
1965
1970
1975
1980
1985
1990
1995
2000
2005
Tre
asu
ry B
ill
Inte
rest
Rate
s (
%)
0
100
200
300
400
500
600
700
800
Go
ld P
rice (
US
D p
er
oz)
10 Year T-Bill 3 Month T-Bill Gold(USD/oz) K-Wave

How Will Upswings in Price Inflation and Interest Rates Change Toll Road Risk Profiles? A Study of Developing East Asian Economies with Broader Implications
7
4. Toll Roads from a Project Risk Perspective
4.1 Project Risk Analysis
Rigby and Penrose (2001) of Standard & Poor’s identify a pyramidal five-level framework for credit rating, which can be taken as a proxy for overall project investor risk, shown in Figure 4. Project-level risks comprise six broad elements, namely:
i. Contractual foundations
ii. Technology, construction and operations: both pre-construction (e.g. construction delay/ quality issues) and post-construction (e.g. Operations and Maintenance)
iii. Competitive position of project within its market: including industry fundamentals, project’s competitive advantage/ likely market share, threats of new entrants, etc
iv. Legal structure, including choice of legal jurisdiction
v. Counterparty risks: e.g. extent to which JV partners can contribute equity if/when debt funding exhausted, reliability of suppliers, political risk guarantees, etc
vi. Cashflow and financial risks: in addition to expected cashflow, ability to cope with interest rate, inflation, foreign exchange, liquidity and funding risks
Whilst the initial research investigated all items, the primary focus of that research – and of this Paper – is on items (iii) and (vi) above.
Figure 4: Standard & Poor’s Risk Pyramid
George et al (2004) note the uncertainty inherent in start-up tollways requires flexible financing approaches. Willumsen and Russell (1998) illustrate project-level risks over the duration of a project as shown in Figure 5, showing the predomination of traffic and revenue risks.

ATRF 2011 Proceedings
8
O&M
Traffic &
Revenue
Ramp Up
Construction
Costs
Construction
Delay
Change Orders
-2 -1 0 1 2 3 4 5 10
Han
dove
r
Year
Ris
k (
no
min
al)
Figure 5: Transport Concession Risks
4.2 Traffic Risks, Forecast Accuracy and Potential Bias
4.2.1 Introduction
This Section identifies key risks pertaining to traffic forecasting which could be affected by changes in price inflation and interest rates, as well as some key forecasting issues which are pervasive irrespective of price inflation and interest rates. Bain and Wilkins’ (2002) Traffic Risk Index (Appendix 2) summarises other forecasting issues and risks.
4.2.2 Accuracy Issues
Bain and Wilkins (2002) analyse toll-traffic uncertainty and traffic forecast error, showing strong inter-correlation. Average initial year traffic was 70% of forecast overall, 82% in lender-commissioned projections and 66% when commissioned by others, suggesting commissioning party influence on forecasts: debt-financiers relatively more concerned with down-side risk than equity-holders.
Whilst initial year errors might be due to ramp-up, which Streeter and McManus (1999) reckon can last 3-5 years, Bain and Polakovic (2005) note optimism bias is “constant through Years 2 to 5” as shown in Table 2, signalling other errors .They also note drastic differences in forecasts by different parties for the same projects, based in part on very different assumptions.
Brinkman (2003) and Kilsby (2004) identify forecasting issues, such as models’ opaqueness, lack of resources to properly forecast, plus psychological and ethical factors, overlapping to

How Will Upswings in Price Inflation and Interest Rates Change Toll Road Risk Profiles? A Study of Developing East Asian Economies with Broader Implications
9
an extent with some of the “technical” issues above. This includes modellers deluding themselves as to the infallibility and neutrality of their forecasts, which are more often flawed and biased.
Table 2: Bain and Polakovic Forecast Performance Statistics
Operating Year Mean Actual/ Forecast Standard Deviation
1 0.77 0.26
2 0.78 0.23
3 0.79 0.22
4 0.80 0.24
5 0.79 0.25
4.2.3 Value of Time
With the exception of “shadow toll” projects (where the operator is reimbursed based on patronage, but the user does not pay tolls), the willingness of user to pay tolls is critical (where users might be vehicle drivers or their employers/ hirers).
The behavioural value of time is the equivalencing of time and money, defined by Bain (2009, p.91) as “The monetary value attached to the possibility to save a determined amount of travel time.” Therefore the objective of revenue-maximising toll road operators could be defined as setting tolls at which toll revenue would be maximised.
Whilst higher tolls are usually preferred sometimes they are too high (Wong and Moy, 2004). As Ortúzar and Willumsen (1994, p.413) note, quantification of the value of time (VOT) can be fraught with difficulty and has elicited substantial discussion. Goods vehicles typically have higher tolls than passenger cars and as such identifying the VOT can be important. However, Bain and Wilkins (2002) note in developing countries long-distance tolls often exceed drivers’ wages, giving incentive to use untolled routes (pocketing bosses’ toll money). Some studies (e.g. ADB, 2003) have failed to establish any VOT for goods vehicles.
In modelling practice, VOT may be calibrated as part of assignment modelling calibration. However, for forecasting there is also a debate regarding the pace at which VOT should grow relative to income, i.e. the income elasticity of value of time. As income rises, expenditure usually also rises on items previously purchased (“income effect”) but there is also often new expenditure on items not previously purchased (“substitution effect”), so the income elasticity of VOT should usually be less than 1.0, especially in long-run forecasts.
4.2.4 Competing Routes and Link Roads
Contractual guarantees can theoretically limit competing routes’ development, presupposing the contracting branch of government is willing and able to enforce such guarantees across multiple government layers. Jiangsu Expressway circumvented this risk by acquiring rights to highways parallel to their flagship Shanghai-Nanjing Expressway. However, when GZI Transport listed in 1997, it was assumed that the ferry parallel to the (then) soon-to-open Humen Bridge would cease operation. But being operated by a different local government, operation continued with fares undercutting bridge tolls.
Even if concessionaires get first refusal at parallel routes, overinvestment may result in excess infrastructure relative to traffic, as Buchanan (1999) argues happened in Malaysia during a period of rapid economic growth and development in the 1990s.
Provision of adequate link roads is also important. Congested approaches/ exits can result in “hurry up and wait” (Bain and Wilkins, 2002), reducing tollways’ attractiveness.

ATRF 2011 Proceedings
10
4.2.5 Toll Increases and Revenue Guarantees
Contracts typically allow periodic price-indexed toll increases, or at a percentage of price inflation. However, Forsgren et al (1999) note toll increase approval processes are often opaque and beset with delay. Bain and Wilkins (2002) note tariff escalation is often politicised, especially where there is little previous “tolling culture.” Sometimes social unrest follows tolls’ imposition (Orosz, 1998) or toll increases, especially during economic downturns (Dizon, 2002).
Some contracts give revenue guarantees to operators, underwritten by government. However, China’s 2002 State Council directive scrapped such revenue guarantees overriding contract provisions, leading to New World Development divesting from 13 toll roads and bridges (Chan, 2003).
As price inflation accelerates the ability to increase tolls commensurately becomes more critical: whereas when price inflation decreases the impacts of delays or resistance to toll increases may be less than assessed during ex ante project appraisal, during price inflation increases the impacts of delayed or reduced toll increases will increase.
Whilst non-toll revenues may be generated (e.g. service stations, advertising), Streeter et al (2004) note their contribution is usually dwarfed by toll revenues.
4.2.6 Ramp-Up
Bain and Wilkins (2002) define ramp-up as information lag for users unfamiliar with a new highway and general reluctance to pay tolls (see Richardson (2004) for experimental evidence). Streeter and McManus (1999) reckon on 3-5 years’ ramp-up and note this is often underestimated in traffic forecasts.
Bain and Wilkins (2002) note ramp-up experience tends to cluster to extremes: either of limited duration (even exceeding forecast traffic levels) or lagging for a long duration, maybe never “catching up”, particularly for projects with a high Traffic Risk Index (see Appendix 2).
4.2.7 Operating Costs
Many models also apply distance-based monetary Vehicle Operating Costs (VOC) reflecting fuel, maintenance, depreciation, etc with a cost advantage for smoother expressways. Whilst economic values can be derived, accurate behavioural values can be elusive. Where there are larger VOC savings from an expressway ceteris paribus there is more scope for higher tolls. However, there is an issue as to who pays these costs (driver or employer).
4.2.8 Toll Leakage
Some vehicles use a facility without paying, either legitimately (e.g. certain government or military vehicles) or illegitimately. There may be theft by toll-collectors and fraud by administrators. Forsgren et al (1999) note toll leakage can be as high as 20% of revenues. Sometimes computerised toll collection and auditing can restrain losses, but on lower volume routes the cost of such measures might outweigh savings. If price inflation outstrips wages, there may be increased risk of malfeasance.
4.2.9 Induced Traffic
When a new highway significantly reduces transport costs or relieves congestion, it may result in additional (induced) traffic. And such traffic induction may correlate to increased economic growth. Indeed, Corbett et al (2006, p.A2-99) report substantial, rapid induction on Cambodia’s roads following rehabilitation. On green-field sites, it may also over time enable expanded development, generating further traffic demand. However, Willumsen and Russell

How Will Upswings in Price Inflation and Interest Rates Change Toll Road Risk Profiles? A Study of Developing East Asian Economies with Broader Implications
11
(1998) note the difficulty of reliably forecasting such effects; Bain and Polakovic (2005) report the prevalence of significant errors in induced traffic forecasts.
4.2.10 Economic Effects
Economic risks feed through many elements of traffic forecasts:
Overall travel demand (e.g. car ownership and usage, freight volumes, extent of traffic induction)
Willingness-to-pay tolls and try tollways (affordability; ramp-up extent and duration)
Toll leakage (incentive for malfeasance)
Over-investment increasing likelihood of competing routes being built/ upgraded
Economic cycles can affect decision-making, both in terms of evaluation assumptions adopted (often projections based on adaptive expectations) and the number of schemes being considered at any time. When expectations are high more projects are evaluated, so proportionally more projects are likely to founder on downturn (and be blamed on transport forecasts). This may create cynicism regarding tollway investments extending into the early economic recovery, resulting in under-investment in some areas, thence over-investment as returns on operating (and newly opened) highways exceed expectations, thus creating a new “error of optimism” (Pigou, 1920).
Luu (2006) and Gomez and Jomo (1999) cite governments in Vietnam and Malaysia potentially over-expanding transport infrastructure development.
4.3 Construction, Operations and Maintenance
Construction cost overruns and delay (deferred/ lost revenue) may imperil initial debt repayments. Rigby (1999) notes using engineering, procurement and construction (EPC) contractors’ reputations to proxy technical risk is both commonplace and erroneous: construction risks are often inadequately assessed. Based on UK experience, Flyvbjerg and COWI (2004) recommend highway construction cost estimates be uplifted 15% if a 50% chance of overrun/ delay is acceptable, or by 32% if 20% chance acceptable.
Ruster (1996) notes construction cost overruns, delays and defects can be largely mitigated by liquidated damages, performance bonds, warranties, contingency funds and insurance. As revenue losses are rarely disputed during delay/ overrun arbitrations, the focus of the research remains on demand-side risks. However, when the contractor is the concessionaire, such risks should be analysed. Similarly, operations and maintenance (O&M) risks should also be considered.
4.4 Summary of Key Issues
Key issues, whose importance may vary between countries and projects (with some risks correlated), which may be summarised under the following headings:
Macro-Economic Risks: including institutional, sovereign and broad economic risks.
Market Risks: primarily concerning scheme attractiveness and riskiness.
Forecasting Risks: pertaining to uncertainty and transport modelling practice.
Stakeholder attitudes to many of these risks (and the utility of evaluation criteria) were tested by questionnaire surveys, in terms of how often such risks are considered, whether they are deemed important and in the case of certain economic parameters, whether they are expected to increase or decrease in the near- to medium-term. Many risks were tested quantitatively by risk simulation modelling. The factors and proposed testing methods are

ATRF 2011 Proceedings
12
indicated in Table 3. Certain risks were beyond the remit of the research (e.g. bidding strategy) or not readily testable by either questionnaire or risk simulation.
Addressing the hypothesis, excepting the use of interest rates in financial analysis, little literature emphasised any importance of either price inflation or interest rates on tollways. They are therefore included in the key risks to be considered in both the questionnaire surveys and risk simulation.
Table 3: Summary of Key Risks and Issues
Risk Type
For Testing By
Questionnaire Risk Simulation
Macro-Economic Risks
Country’s political and legal systems
Exchange risks: exchange rate and cash repatriation
Interest rates
Price inflation
Economic growth and business cycles
Income (in)equality
Tolling culture
Corruption
Market Risks
Road’s social/ economic benefits
Construction time/ threat of over-run
Construction cost/ threat of over-run
Operation & maintenance costs
Contractual foundations
Threat of competing routes
Ramp-up: size and length
Toll affordability
Enforceability of toll increases
Minimum income guarantees
Toll leakage
Truckers using free routes, pocketing boss’s toll money
Guanxi (importance of business relationships)
Connecting roads: access/ egress
Forecasting Risks
Frequency of Over- and Under-Forecasting
Ramp up: length & size
Toll affordability
Sensitivity of traffic levels to GDP growth
Overall sensitivity of project traffic to tolls
Sensitivity of trucks/ large vehicles to tolls
Toll sensitivity to changes in income
Data availability/ quality for model calibration
Data availability/ quality for forecasting
Reliability of transport modelling process
Induced traffic
Forecasters pressured by clients to adjust numbers
Treatment of connecting and competing routes
Evaluation Criteria
Use of financial metrics, e.g. NPV, Financial IRR
Project’s social cost/ benefit and which metrics used
Do counterparties mitigate or add to project risk?
How Will Upswings in Price Inflation and Interest Rates Change Toll Road Risk Profiles? A Study of Developing East Asian Economies with Broader Implications
13
5. Questionnaire Survey
5.1 Purpose
In order to test both literature and environmental analyses, a questionnaire survey was undertaken to test practitioners’ experience and perceptions regarding:
Their scope of project experience;
Relative weightings of difference macro- and micro-level project risks;
Data availability and quality;
Accuracy of forecasts and which metrics are employed to test risk;
Market outlook in the nine Study Area countries; and,
Expectations for economic parameters.
The questionnaire was designed to afford a relatively broad sample of opinion; various advisory professions were sampled. Respondents were also asked to state the extent of their working experience, the proportion of this spent in relevant fields and their geographic experience. Questions covered economic, legal, engineering and connectivity risks, as well as (for those with modelling experience) an investigation into the reliability of transport demand forecasts, attempting to identify where practitioners feel their art is weakest.
Given the relative obscurity of business cycle theory even amongst economists, only one question relates directly to the use of business cycles, though others test expectations regarding price inflation and other economic variables. In order to prevent comparison with especially turbulent periods, expectation comparisons were between the previous 5 and next 10 years.
Sampling was done via the author’s personal contacts, extracting contact details from literature reviewed, using a number of internet-based newsgroups (“yahoogroups”), plus review of professional databases. As suggested by “sub-tribalism” (Morris, 1971), the best response rate was from those known to the author and those in the same primary field (transport planning), so the sample skewed towards transport planners/ economists. Such people also accounted for most of the optional (text) responses on broader issues. Given that some questions were designed specifically for transport planners this was not considered a problem (those without such experience being screened out of such questions, though not the rest of the survey).
5.2 Design and Execution
The internet-based www.surveymonkey.com was employed, allowing easy questionnaire dissemination and automatic result collation.
Piloting occurred in September 2006, followed shortly thereafter by the main survey (into October 2006).
Approximately 40 respondents started the survey but dropped-out after just a few questions. These responses were excluded from the analysis. In a number of cases, respondents did not give answers to each question, but nonetheless gave answers to many questions. Under such circumstances a “not sure” response was assumed for omitted answers. And when evaluating answers, such “not sure” responses were typically excluded, such that analysis would concentrate on stated opinions only. A total of 162 responses were considered as valid for analysis (though due to “not sure” and omitted answers, this number was often lower for specific questions), summarised by type of respondent in Figure 6 and years of experience in Figure 7.

ATRF 2011 Proceedings
14
Figure 6: Respondents by Experience Type
0
20
40
60
80
100
Financial,
Legal,
Operator
Transport
Planner,
Economist
Engineer,
Architect
Government,
Aid Agency
Academic Others
Figure 7: Working Experience of Respondents
30+
26%
20 to 29
30%
10 to 19
31%
5 to 9
6%
1 to 4
7%
5.3 Key Findings
Findings are shown in Appendix 3.
There is perceived primacy of legal and political factors on viability; though once modelling commences, economic factors predominate. Business cycles, toll familiarity and income inequality are deemed slightly unimportant.
Data quality and availability is deemed better in developed economies, as expected. There is no strong preference between four-stage, assignment and spreadsheet models. Rather each model should be tailored for specific conditions. Four-stage models are perceived as fairly reliable, but also as opaque.
Whilst under-forecasting appears relatively rare, over-forecasting happens much more often. There is some acknowledgement of transport planners adjusting forecasts to meet clients’ expectations. There appears a fundamental misunderstanding of the purposes of equity- and

How Will Upswings in Price Inflation and Interest Rates Change Toll Road Risk Profiles? A Study of Developing East Asian Economies with Broader Implications
15
debt-side forecasts; this based on only weak acceptance of differences between forecasts for either side (as the author suspected a priori).
NPV is the most often-used evaluation criterion, followed by FIRR, then economic metrics. Counterparty risks and risk correlation versus other projects are used more rarely.
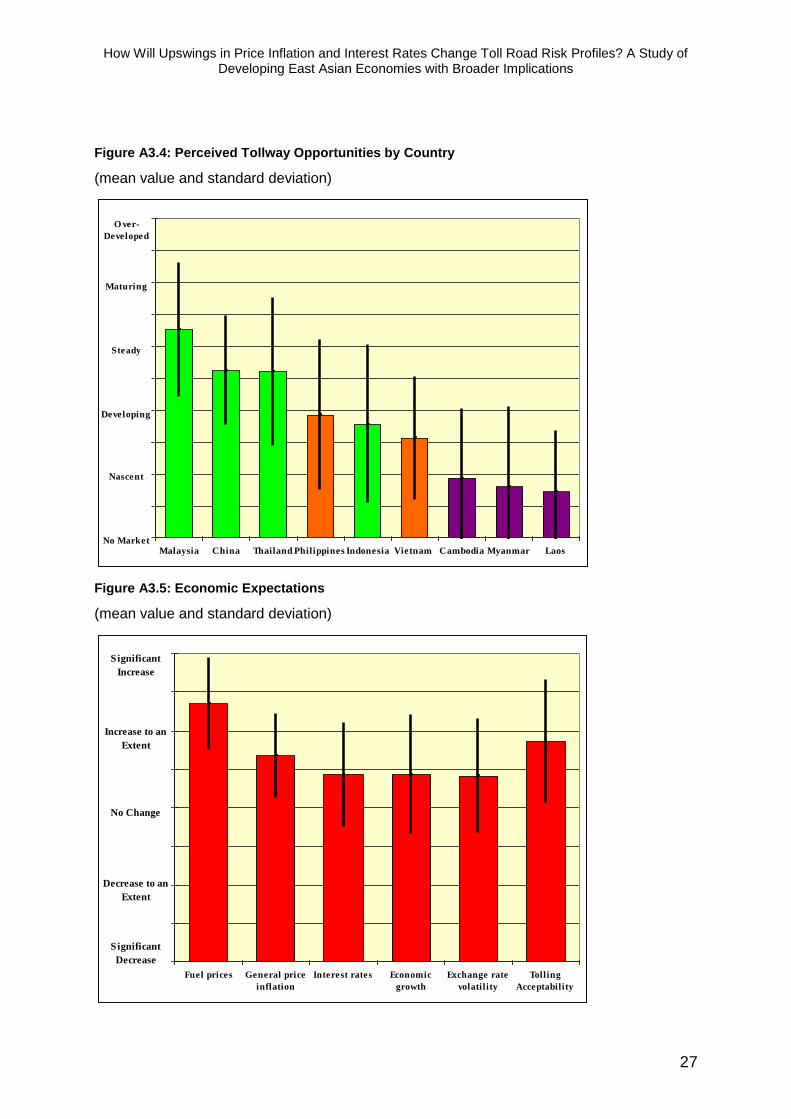
Country categorisation in Section 2.2 is broadly supported, but with Indonesia seen as less advanced than posited there. On average, Malaysia is seen as steady-to-maturing; Thailand and China as developing-to-steady; Philippines, Indonesia and Vietnam as nascent-to-developing; and Cambodia, Myanmar and Laos as sub-nascent. However, those with Indonesia experience rate the country as developing-to-steady; and those with local experience regard Cambodia and Myanmar as nascent.
There is a reasonable acceptance of symptoms of a K-Wave upswing, in terms of increasing price inflation (especially fuel prices), interest rates and to a lesser extent, economic growth. Tolling acceptability is predicted to increase. However, respondents did not deem the impacts of rising interest rates and price inflation to be significant.
6. Risk Simulation Model
6.1 Model Definition
A simple notional highway network model was developed. Using Excel/ Visual Basic, a simple incremental assignment model was developed for application to this, which was integrated with a financial model. Variables as set out in Appendix 4 were parameterised based on distributions of values, for testing through Monte Carlo risk simulation. This enabled quantitative estimation of the relative importance of different risks, both to test the specific hypothesis and to test whether questionnaire respondents might have underrated such risks.
In reality, each toll road project has specific locational and institutional risks. These were deliberately excluded by use of the simplified, notional case study; the aim being to concentrate on the relative importance of broad risks irrespective of particular locational context.
Three economic simulation scenarios are defined as follows:
“Conventional Case” of interest rates and price inflation similar to recent values;
“Respondents’ Case” based on questionnaire results with increased fuel prices and some increase in general price inflation and interest rates; and,
“Kondratieff Case” assuming an upswing with more substantial increases in price inflation, interest rates and also increased economic growth.
The case study network comprised six zones and eight links, including the fictional tolled highway. Both the total number of trips and road capacities were included amongst the simulation variables; all of which are shown in Appendix 4, together with network topology. 27 parameters were common for all three Cases (Conventional, Respondents’ and Kondratieff). A further 6 parameters had values specified for each Case differently, though for each Monte Carlo iteration, the values were inter-related.
10,000 iterations of Monte Carlo simulation were employed, using the following methodology:
Defining random parameters
Applying parameters to derive values for each quarter over a 30-year period, covering construction and operation (120 periods considered)
Traffic assignment for each quarter (but for initial quarters, prior to completion of the expressway, traffic is set to zero) and generation of resultant quarterly financials,

ATRF 2011 Proceedings
16
including servicing of debt (interest and/or principal as appropriate and any requirements for short-term financing to cover shortfalls)
Financial analysis across the project duration: summarised using FIRR, payback period and NPV (at a range of interest rates). Any run with FIRR≤0% or payback period >120 quarters was deemed to constitute financial failure
6.2 Results of Forecasting Model
Table 4 sets out results of an initial run for each scenario based upon modal values for each parameter (i.e. without Monte Carlo risk simulation). This suggests that despite delayed Payback (due to higher price inflation and interest rates) the Kondratieff case may give superior returns than the Conventional case, but that the Respondents’ case would yield the best returns; perhaps indicating more optimism amongst practitioners (transport planners being the largest respondent group).
Table 4: Comparison of Initial Runs (without Monte Carlo Risk Simulation)
Case
Conventional Respondents’ Kondratieff
FIRR 16.83% 17.88% 16.95%
Payback Period (years) 10.728 10.676 12.090
NPV (at 16%) $17,910,017 $45,944,246 $27,524,725
Table 5 sets out summary results of the 10,000 simulation runs for each case, with cumulative probability distributions of FIRR, payback and NPV (at 16%) shown in Figures 8, 9, and 10. Comparing Table 5 against Table 4, mean FIRR’s are greater, yet payback periods are longer except in the Kondratieff case (though this excludes 13 instances where there is no payback within 30 years).
Table 5: Summary Results from Simulation Runs
Metric Statistic
Case
Conventional Respondents’ Kondratieff
FIRR Mean 17.20% 17.99% 17.62%
Minimum* 0.01% 0.49% 0.11%
Maximum 28.75% 29.26% 30.14%
Standard Deviation 3.74% 3.77% 4.11%
Payback Period
(years)†
Mean 10.83 10.85 11.60
Minimum 6.44 6.31 6.53
Maximum 29.98 29.23 29.66
Standard Deviation 2.32 2.41 2.73
NPV at 16%
($ million)
Mean $28.1 $46.4 -$37.7
Minimum -$377.8 -$936.0 -$5,600.3
Maximum $296.6 $357.3 $465.0
Standard Deviation $80.3 $96.3 $308.9
Financial Failure
# of Cases 55 114 1250
% of Cases 0.6% 1.1% 12.5%
Note: * FIRR’s were not calculable once beneath 0%; hence 0% minimum value in all cases. † Excludes 13 instances under Kondratieff case where no payback obtained.

How Will Upswings in Price Inflation and Interest Rates Change Toll Road Risk Profiles? A Study of Developing East Asian Economies with Broader Implications
17
Figure 8: Cumulative Probability Distribution of FIRR (excluding FIRR<0%)
0%
20%
40%
60%
80%
100%
5% 10% 15% 20% 25%
Cu
mu
lati
ve %
Conventional Respondents' Kondratieff
Figure 9: Cumulative Probability Distribution of Payback Period (years)
0%
20%
40%
60%
80%
100%
8 10 12 14 16 18 20 22
Cu
mu
lati
ve %
Conventional Respondents' Kondratieff
Figure 10: Cumulative Probability Distribution of NPV at 16% ($m)
0%
20%
40%
60%
80%
100%
-500 -400 -300 -200 -100 0 100 200 300 400
Cu
mu
lati
ve %
Conventional Respondents' Kondratieff

ATRF 2011 Proceedings
18
For both FIRR and payback, the general pattern of Respondents’ Case being the most optimistic and the Conventional Case the most pessimistic holds. At a 16% discount rate, Respondents’ Case NPV is similar to the “base” run, but mean NPV is substantially higher in the Conventional Case, though still less than in the Respondents’ Case.
However, mean Kondratieff NPV is actually negative, despite mean FIRR of 17.62%; Figure 10 shows that average NPV is lowered due to a significant number of large negative NPV’s. In all cases, Kondratieff standard deviations are the greatest and Conventional standard deviations the smallest. Furthermore, 12.5% of Kondratieff runs resulted in “failure” (i.e. negative FIRR or no payback); substantially greater than 1.1% of Respondents’ runs and 0.6% of Conventional runs.
This suggests immediately that notwithstanding its superior mean values, the Respondents’ case is riskier than the Conventional case; however, the Kondratieff case is substantially riskier still.
6.3 Analysis of Individual Risks
Analysis of the impact of different simulation variables showed some variables have a large but poorly correlated effect on FIRR, whilst others have a smaller but better correlated effect. Importance was therefore assessed as follows:
The range (maximum less minimum) is calculated
The range is multiplied by the linear regression equation’s coefficient to determine the impact on FIRR; an absolute value is taken
The impact is multiplied by the linear regression equation’s R2 to weight impact by strength-of-relationship
The simulation variables were then grouped by category, so as to determine the relative importance of such risk categories, thus avoiding distortions due to the number of variables tested within each category. The categories were then ranked for each of the three cases, as shown in Table 6. The Case Study appears to give very low importance to the Value of Time, but this might be a consequence of the nature of network modelled.
Table 6: Rankings of Risk Categories’ Importance by Case
Risk Group
Conventional Respondents' Kondratieff
Impact*R2 Ranking Impact*R
2 Ranking Impact*R
2 Ranking
Road Capacities 0.30% 11 0.53% 10 1.35% 9
Construction Cost & Duration
5.68% 4 6.40% 4 8.75% 5
All O&M Costs 0.59% 9 1.02% 8 1.98% 8
Value of Time & Its Income Elasticity
0.00% 13 0.03% 13 0.05% 13
Vehicle Operating Costs 0.30% 10 0.19% 11 0.27% 12
Demand (Initial & Income Elasticity)
12.13% 1 12.69% 2 16.05% 2
Toll Revenue Leakage 0.95% 8 0.94% 9 1.20% 10
Ramp-Up: Amplitude & Duration
2.14% 6 2.30% 7 3.66% 7
Logit Model Parameters 0.09% 12 0.12% 12 0.32% 11
Toll Escalation Rate and Frequency
1.73% 7 2.56% 6 4.69% 6
GDP Growth 10.84% 2 12.62% 3 15.01% 3
Price Inflation 5.12% 5 5.91% 5 11.67% 4
Interest Rates 8.78% 3 15.73% 1 47.38% 1

How Will Upswings in Price Inflation and Interest Rates Change Toll Road Risk Profiles? A Study of Developing East Asian Economies with Broader Implications
19
What is more critical in the context of this research is the change in impacts and rankings between cases. Excepting Vehicle Operating Costs and Toll Leakage (the latter in the Respondents’ case), all parameters increase their impact on FIRR between Conventional and Respondents’ and Respondents’ and Kondratieff cases, indicating increased forecast risk volatility overall.
Interest rates increase markedly in importance in both Respondents’ and Kondratieff cases; this may be slightly overstated as initial interest rates feed into interest rates on any extra (subsequent) borrowings. However, in the Kondratieff case both sets of interest rates would individually outrank all other categories; illustrating the exponential increase in their impact as they rise, thus signifying that interest rates increase markedly in importance in times of high (or increasing) interest rates.
Demand ranks as most important in the Conventional case and remains second only to interest rates in the other cases, followed by GDP growth (which itself permeates many other parameters as explained in Section 4.2.10). Price inflation and construction costs/ duration are 4th and 5th most important (precise ranking case-dependent). The importance of toll escalation rates and frequency of increases also increases in the Respondents’ and especially the Kondratieff case, as might be expected: with price inflation increasing, the impact of delayed or incomplete adjustments increases. Indeed the impact of price inflation does not appear simple. General price inflation accounts for most price impact, but is positively correlated with outturn performance; likely because it decreases the real value of initial debt and is abated to an extent by toll increases, so downside risks associated with increased price inflation are statistically associated more strongly with toll escalation-associated variables.
Such inter-relationships between simulation system variables often occur; isolation of individual variables’ impacts is not always possible (Pindyck and Rubinfeld, 1981). With regards the Hypothesis, this suggests the impacts of increasing price inflation and interest rates on various project risk elements are not always wholly linear; rather, more complex system-wide interactions are possible.
7. Discussion of Key Findings and Conclusions
7.1 Interest Rates and Price Inflation
Whilst interest rates do not feature greatly in transport planning literature, they are very important in project finance: with investment risk increasing substantially as interest rates escalate; this corroborated by the risk simulation modelling. Price inflation can affect both construction and operating/ maintenance costs, as well as the impacts of delayed toll escalation or toll increases at under the rate of price inflation. Neither price inflation nor interest rates were seen as especially important in project risk analysis by most questionnaire respondents. Furthermore, there was little literature found in transport planning on the importance of these parameters (Kilsby (2006a, 2006b) being a rare exception.)
However, economic growth was recognised as very important to project performance (ranked by survey respondents behind only political and legal systems). Economic growth feeds through many aspects of market and forecasting risks (both discussed below). Survey respondents expected increasing price inflation and interest rates (and especially fuel prices), yet their importance was not rated that highly.
The simulation model adopted three economic scenarios. The first (“Conventional Case”) assumed similar trends to those experienced in recent years; the second (“Respondents’ Case”) incorporated respondents’ expectations of higher fuel prices and slightly higher interest rates and economic growth; the third case (“Kondratieff Case”) was based on an upswing in the K-Wave (Kondratieff, 1926), resulting in markedly higher general price inflation and interest rates, as well as higher economic growth. Based on FIRR, the

ATRF 2011 Proceedings
20
Respondents’ Case generally gave the most optimistic returns, with mean Kondratieff Case returns also higher than those from the Conventional Case. However, 12.5% of Kondratieff Case runs resulted in project failure (i.e. no payback and/or negative FIRR), versus 0.6% in the Conventional Case and 1.1% in the Respondents’ Case.
Given that economic growth correlates positively with FIRR, the impacts of increased price inflation and interest rates, where these outstrip economic growth would appear to have a significant negative impact on project performance. Furthermore, the apparent volatility of the Kondratieff Case would tend to support Faber’s (2002) assertion regarding the riskiness of the K-Wave Upswing (higher mean returns, but with an inherent danger of short-term reversals which can lead to bankruptcy).
7.2 Evaluation of Hypothesis and its Implications
In addition to general forecast uncertainty, the following risks should be highlighted (based on Conventional Case risk simulations):
Base demand (i.e. whether there is sufficient traffic congestion to drive demand);
Economic growth (which is likely to be volatile);
Interest rates (for financing);
Construction costs and duration; and,
Price inflation.
The specific hypothesis is “There is a significant change in the nature and extent of project finance risks for private stakeholders in East Asian toll roads during a period of increasing price inflation and interest rates.” Practitioners generally held that both price inflation and interest rates would increase to an extent, though were less certain as to the significance of such increases. The risk simulations showed both were strongly correlated with project FIRR. Assuming that projects are substantially debt-financed, then increasing interest rates would markedly affect outturn performance. Meanwhile, price inflation will affect construction and operating and maintenance costs, as well as increasing the impact of delayed toll increases (and increases beneath price inflation rates). Risk simulation showed that rising price inflation and especially interest rates are likely to substantially increase their importance relative to other project-level risks. However, should fixed-rate debt be available (e.g. bonds) then risk can be offset (rising price inflation decreasing the real debt burden) and subsequent increases in interest rates are less important (so long as re-financing is not necessary).
Furthermore, increasing price inflation and interest rates could be associated with accelerating economic growth; though the K-Wave posits this, acceptance of the K-Wave is not necessarily required to accept the linkage between economic growth, price inflation and interest rates. And economic growth is strongly positively correlated with project performance, permeating most aspects of demand forecasting and potentially mitigating some of the impacts of rising interest rates.
In conclusion, rising price inflation and interest rates do appear likely to change the nature and extent of project finance risks for private stakeholders in toll roads.
And furthermore, the potential implications of this appear to have been underestimated.

How Will Upswings in Price Inflation and Interest Rates Change Toll Road Risk Profiles? A Study of Developing East Asian Economies with Broader Implications
21
Acknowledgements
I am indebted to many for assistance and advice given during the preparation of the Dissertation on which this Paper is based. Firstly, to my supervisor, David Parker; also to all the staff of the Henley Hong Kong office, and to Ken Bull in Henley.
Within transport planning and associated professions, there are simply too many people to thank individually. I believe I have learnt something from almost everyone I have worked with. Whilst undertaking the research over a couple of years, I have picked the brains of many colleagues and clients, past and present; and due to frequent commercial sensitivity, many comments and discussions have been on an anonymous basis. Many also acted as disseminators of my questionnaire and as “sounding boards” to discuss ideas and informally corroborate “ball park” figures used in the Monte Carlo risk simulations.

ATRF 2011 Proceedings
22
Appendix 1 – Kondratieff Waves Since 1787
(from Faber, 2002)
P
anic
of
18
19
Pan
ic o
f 1
83
7P
anic
of
18
73
Cra
sh 1
92
9C
rash
19
73
Cra
sh 1
98
7
18
15
18
66
19
21
19
76
20
33
17
87
18
42
18
96
19
49
20
04
20
58
Dep
ress
ion
Har
d T
ime
Dep
ress
ion
Dep
ress
ion
Gre
at D
epre
ssio
n
17
87
- 1
84
21
84
2 -
18
96
18
96
- 1
94
91
94
9 -
20
04
20
04
- 2
05
8
Dis
pla
cem
ent
Can
als
Pro
gre
ss i
n:
Ele
ctro
nic
s
Ro
ads
Ele
ctri
city
Aer
osp
ace
Bri
dges
Co
nsu
mer
ism
Fif
th K
on
dra
tief
f
Go
ld D
isco
ver
ies
in C
alif
orn
ia a
nd
Au
stra
lia
Co
mm
un
icat
ion
, ch
emic
al a
nd
au
to
ind
ust
ry
Ser
vic
es i
ncl
ud
ing h
ealt
h c
are,
lei
sure
,
etc
Fir
st K
on
dra
tief
fS
eco
nd
Ko
nd
rati
eff
Th
ird
Ko
nd
rati
eff
Fo
urt
h K
on
dra
tief
f
Up
swin
g:
fro
m 1
99
5-2
00
4 t
o p
erio
d
20
25
-20
35
Do
wn
swin
g:
fro
m 2
02
5-2
03
5 t
o p
erio
d
20
55
-20
65
Op
enin
g o
f n
ew m
ark
ets,
Ch
ina,
Eas
tern
Eu
rop
e, R
uss
ia
Tel
eco
mm
un
icat
ion
s
Info
rmat
ion
tec
hn
olo
gy,
etc
Up
swin
g:
fro
m e
arly
18
90
s to
per
iod
19
14
-19
20
Do
wn
swin
g:
fro
m b
egin
nin
g o
f 1
91
4-
19
20
s
Up
swin
g:
fro
m 1
94
0s
to 1
97
0s
Do
wn
swin
g:
fro
m l
ate
19
70
s to
ear
ly
20
00
s
Up
swin
g:
fro
m l
ate
18
40
s to
ear
ly
18
70
s
Do
wn
swin
g:
fro
m e
arly
18
70
s to
ear
ly
18
90
s
Rai
lro
adis
atio
n o
f A
mer
ica
Up
swin
g:
fro
m l
ate
17
80
s to
per
iod
18
10
-18
17
Do
wn
swin
g:
fro
m p
erio
d 1
81
0-1
81
7 t
o
late
18
40
s
Ap
pli
cati
on
of
new
in
ven
tio
ns
to
man
ufa
ctu
rin
g (
Ind
ust
rial
Rev
olu
tio
n)
En
try o
f A
mer
ica
into
wo
rld
mar
ket
s

How Will Upswings in Price Inflation and Interest Rates Change Toll Road Risk Profiles? A Study of Developing East Asian Economies with Broader Implications
23
Appendix 2 – Traffic Risk Index (Bain and Wilkins, 2002)
Project Attributes Low High
Tolling Regime Shadow tolls User-paid tolls
Tolling Culture Toll roads well established; data on actual use available
No toll roads in country; uncertainty over acceptance
Tariff Escalation Flexible rate setting/ escalation formula; no government approval required
All tariff hikes require regulatory approval
Forecast Horizon Near-term forecasts required Long-term (30+ year) forecasts required
Toll-Facility Details Facility already open Facility at the very early stages of planning
Estuarial crossings Dense, urban networks
Radial corridors into urban areas Ring-roads/ beltways around urban areas
Extension of existing road Green-field site
Alignment: strong rationale (including tolling points and intersections)
Confused/ unclear road objectives (not where people want to go)
Alignment: strong economics Alignment: strong politics
Clear understanding of future highway network
Many options for network extensions exist
Stand-alone (single) facility Reliance on other, proposed highway improvements
Highly congested corridor Limited/ no congestion
Few competing roads Many alternative routes
Clear competitive advantage Weak competitive advantage
Only highway competition Multimodal competition
Good, high capacity connectors “Hurry-up-and-wait” (congested access/ egress routes)
“Active” competition protections (e.g. traffic calming, truck bans)
Autonomous authorities can do what they want
Surveys/ data collection
Easy to collect (laws exist) Difficult/ dangerous to collect
Experienced surveyors No culture of data collection
Up-to-date Historical information
Locally-calibrated parameters Parameters imported from elsewhere (another country?)
Existing zone framework (widely used) Develop zone framework from scratch
Users: private Clear market segment(s) Unclear market segments
Few, key origins and destinations Multiple origins and destinations
Dominated by single journey purpose (e.g. commute, airport)
Multiple journey purposes
High income, time-sensitive market Average/ low income market
Tolls in line with existing facilities Tolls higher than the norm – extended ramp-up?
Simple toll structure Complex toll structure (local discounts, frequent users, variable pricing, etc)
Flat demand profile (time-of-day, day-of-week, etc)
Highly seasonal and/ or “peaky” demand profile
Users: commercial Fleet operator pays toll Owner-driver pays toll
Clear time and operating cost savings Unclear competitive advantage
Simple route choice decision-making Complicated route choice decision-making
Strong compliance with weight restrictions
Overloading of trucks is commonplace
Micro-economics Strong, stable, diversified local economy
Weak/ transitional local/ national economy
Strict land-use planning regime Weak planning controls/ enforcement
Stable, predictable population growth Population forecast dependent on many, exogenous factors
Traffic growth Driven by/ correlated with existing, established and predictable factors
Reliance upon future factors, new developments, structural changes, etc
High car ownership Low/ growing car ownership

ATRF 2011 Proceedings
24
Appendix 3 – Results of Questionnaire Survey
Table A3.1: Aggregated Respondent Experience Categories
Group Components Number
Financial, Legal, Operator
Expressway Developer/ Operator/ Equity Investor Lawyer/ Attorney/ Solicitor Private Sector Lender Investment Banker Ratings Agency Accountant/ Valuer Insurer
29
Transport Planner/ Economist
Transport Planning Consultant Economist
98
Engineer/ Architect Civil/ Structural/ Pavement/ Highway Engineer/ Architect
37
Government/ Aid Agency Government Aid Agency
43
Academic Academic 22
Other Other 24
Table A3.2: Respondents’ Mean Years’ Experience in Various Fields
Project Type
Average Years per
Respondent
Sample’s Total Years’ Experience
Transport infrastructure projects 10.66 1,642
All infrastructure projects (transport & non-transport) 13.13 2,022
Projects in developing economies 7.26 1,119
Tolled highway projects (urban and/or rural, anywhere) 2.57 396
Rural or inter-urban tolled highway projects 1.70 262
Rural/ inter-urban tolled highways in developing economies 1.12 173
Figure A3.1: Respondents’ Global Experience
0 20 40 60 80 100 120
North America
Latin America/ Caribbean
Western Europe
Eastern Europe
Africa
Middle East
Central Asia
South Asia
East Asia
Oceania/ Australasia
Other
Respondents with Experience in this Region

How Will Upswings in Price Inflation and Interest Rates Change Toll Road Risk Profiles? A Study of Developing East Asian Economies with Broader Implications
25
Table A3.3: Rankings of Macro-Level Risks by Respondent Category
All
Financial, Legal,
Operators
Transport Planner,
Economist Engineer, Architect
Government, Aid Agency Academic Other
Political System 1 1 1 1 1 1 1
Legal System 2 2 2 2 2 2 3
Economic Growth 3 5 3 6 3 5 2
Corruption 4 3 5 3 4 4 4
Repatriating Profits 5 4 4 5 5 3 6
Currency Risks 6 6 7 4 8 7 5
Price Inflation 7 8 7 8 5 9 6
Interest Rates 8 6 6 7 7 6 9
Business Cycles 9 9 9 9 11 10 8
Toll Familiarity 10 10 10 10 9 8 10
Income (In)Equality 11 11 11 11 10 11 11
Table A3.4: Rankings of Project-Level Risks by Respondent Category
All
Financial, Legal,
Operators
Transport Planner,
Economist Engineer, Architect
Government, Aid Agency Academic Other
Legal/ contractual foundations 1 2 1 1 3 5 5
Construction cost 2 3 4 2 2 2 2
Competing routes 3 3 2 2 8 1 8
Toll increase enforceability 4 1 3 5 4 3 8
Social/ economic benefits 5 14 7 4 1 10 5
Construction time 6 7 5 7 6 4 1
Concession length 7 11 6 11 5 5 4
Operating & maintenance costs 8 12 11 9 7 13 3
Toll affordability (large vehicles) 9 7 9 12 12 12 11
Connecting routes 10 7 8 14 9 5 13
Toll affordability (other vehicles) 11 5 10 10 13 8 14
Guanxi 12 13 13 8 10 9 10
Minimum income guarantees 13 6 12 12 11 14 7
Toll leakage 14 10 14 6 14 11 12
Ramp up 15 15 15 15 15 15 15

ATRF 2011 Proceedings
26
Figure A3.2: Attitudes to Transport Model Types
1.0 1.5 2.0 2.5 3.0 3.5 4.0 4.5 5.0
Are reliable
Too data hungry
Too simplistic
Too complicated
Not suitable for
tollways
Not suitable for
developing economies
Too much of a black
box
Cannot provide
meaningful outputs
Four Stage Assignment Spreadsheet
Figure A3.3: Perceptions of Forecast Performance
1.0 1.5 2.0 2.5 3.0 3.5 4.0 4.5 5.0
How often do projects
significantly exceed
forecast traffic/
revenue levels?
How often do projects
fall well short of
forecast traffic/
revenue levels?
How often do clients
pressure transport
planners to adjust
forecasts?
Are forecasts higher if
for equity- rather than
debt-side clients?
Complete Sample Financial, Legal, Operator Transport Planner, Economist
Engineer, Architect Government, Aid Agency Academic
Other
How Will Upswings in Price Inflation and Interest Rates Change Toll Road Risk Profiles? A Study of Developing East Asian Economies with Broader Implications
27
Figure A3.4: Perceived Tollway Opportunities by Country
(mean value and standard deviation)
1.0
1.5
2.0
2.5
3.0
3.5
4.0
4.5
5.0
5.5
6.0
Malaysia China Thailand Philippines Indonesia Vietnam Cambodia Myanmar Laos
Developing
Nascent
No Market
Steady
Maturing
O ver-
Developed
Figure A3.5: Economic Expectations
(mean value and standard deviation)
1.0
1.5
2.0
2.5
3.0
3.5
4.0
4.5
5.0
Fuel prices General price
inflation
Interest rates Economic
growth
Exchange rate
volatility
Tolling
Acceptability
Significant
Increase
Increase to an
Extent
No Change
Decrease to an
Extent
Significant
Decrease

ATRF 2011 Proceedings
28
Appendix 4 - Definition of Simulation Model Parameters
Figure A4.1: Network Topology
Table A4.1: Link Characteristics
Road Section (“Link”) Length (km)
Road Standard
Lanes per Direction
Freeflow Speed (kph)
Small Vehicles
Large Vehicles
A 10 Local Road 3 70 60
B 3 Local Road 4 70 60
C 15 Local Road 3 70 60
D 25 Local Road 3 70 60
E 10 Local Road 2 70 60
F 2 Local Road 4 70 60
G 10 Local Road 3 70 60
H 40 Tollway 2 120 100
Table A4.2: Trip Distribution
To Zone
1 2 3 4 5 6 Total
Fro
m Z
on
e
1 3% 2% 4% 4% 5% 18%
2 3% 5% 3% 3% 3% 17%
3 2% 5% 5% 3% 3% 18%
4 4% 3% 5% 3% 2% 17%
5 4% 3% 3% 3% 2% 15%
6 5% 3% 3% 2% 2% 15%
Total 18% 17% 18% 17% 15% 15% 100%

How Will Upswings in Price Inflation and Interest Rates Change Toll Road Risk Profiles? A Study of Developing East Asian Economies with Broader Implications
29
Figure A4.1:Speed-Flow Curves by Link Type and Vehicle Type
0
20
40
60
80
100
120
0 0.5 1 1.5 2 2.5
Volume/Capacity Ratio
Sp
eed
(k
ph
)
Tollway (Small Vehicles) Tollway (Large Vehicles)
Local Road (Small Vehicles) Local Road (Large Vehicles)

ATRF 2011 Proceedings
30
Table A4.3: Parameter Value Distributions by Economic Scenario (1 of 4)
Ca
seV
ari
ab
le
Mo
da
l
Va
lue
Ch
an
ce o
f
Sm
all
er
Va
lue
Sta
nd
ard
Dev
iati
on
(Lo
w V
alu
es)
Min
imu
m
Va
lue
Sta
nd
ard
Dev
iati
on
(Hig
h V
alu
es)
Ma
xim
um
Va
lue
So
urc
e/ J
ust
ific
ati
on
Co
nven
tio
nal
Res
po
nd
ents
'
Ko
nd
rati
eff
Ex
pre
ssw
ay C
apac
ity/
Lan
e (p
cu’s
per
day
)2
0,0
00
50
%2
,00
02
0,0
00
2,0
00
28
,00
0F
rom
oth
er s
tud
ies
(co
rro
bo
rate
d
by o
ther
tra
nsp
ort
pla
nn
ers)
Co
nven
tio
nal
Res
po
nd
ents
'
Ko
nd
rati
eff
Lo
cal
Ro
ad C
apac
ity/
Lan
e (p
cu’s
per
day
)1
0,0
00
50
%1
,00
08
,00
01
,00
01
2,0
00
Fro
m o
ther
stu
die
s (c
orr
ob
ora
ted
by o
ther
tra
nsp
ort
pla
nn
ers)
Co
nven
tio
nal
Res
po
nd
ents
'
Ko
nd
rati
eff
Co
nst
ruct
ion
Co
st (
$)*
$1
85
.32
m2
5%
5%
90
%1
5%
30
%
$4
,63
3,0
00
per
km
* 4
0 k
m;
cost
over
run
mo
re l
ikel
y t
han
un
der
run
(se
e 2
.11
)
Co
nven
tio
nal
Res
po
nd
ents
'
Ko
nd
rati
eff
Co
nst
ruct
ion
Du
rati
on
(in
Qu
arte
rs)
10
20
%1
82
14
tim
e o
ver
run
mo
re l
ikel
y t
han
un
der
run
(se
e 2
.11
); s
pec
ifie
d i
n
wh
ole
qu
arte
rs (
i.e.
in
teger
s)
Co
nven
tio
nal
Res
po
nd
ents
'
Ko
nd
rati
eff
Op
erat
ion
s &
Mai
nte
nan
ce F
ixed
Co
sts
(% o
f C
on
stru
ctio
n C
ost
)
2%
50
%0
.50
%0
.10
%1
%4
%F
rom
oth
er s
tud
ies
(co
rro
bo
rate
d
by o
ther
tra
nsp
ort
pla
nn
ers)
Co
nven
tio
nal
Res
po
nd
ents
'
Ko
nd
rati
eff
Op
erat
ion
s &
Mai
nte
nan
ce V
aria
ble
Co
sts
(% o
f R
even
ues
)
3%
50
%1
%1
%1
%5
%F
rom
oth
er s
tud
ies
(co
rro
bo
rate
d
by o
ther
tra
nsp
ort
pla
nn
ers)
Co
nven
tio
nal
Res
po
nd
ents
'
Ko
nd
rati
eff
Bas
e V
alu
e o
f T
ime
for
Sm
all
Veh
icle
s ($
/ho
ur)
$4
5
0%
$1
$
2
$1
$
6
Fro
m o
ther
stu
die
s (c
orr
ob
ora
ted
by o
ther
tra
nsp
ort
pla
nn
ers)
Co
nven
tio
nal
Res
po
nd
ents
'
Ko
nd
rati
eff
Bas
e V
alu
e o
f T
ime
for
Lar
ge
Veh
icle
s ($
/ho
ur)
$3
5
0%
$1
$
1
$1
$
5
Fro
m o
ther
stu
die
s (c
orr
ob
ora
ted
by o
ther
tra
nsp
ort
pla
nn
ers)
Co
nven
tio
nal
Res
po
nd
ents
'
Ko
nd
rati
eff
Inco
me
Ela
stic
ity o
f V
alu
e
of
Tim
e (S
mal
l V
ehic
les)
0.5
50
%0
.15
0.2
0.1
50
.8se
e 2
.10
.1
Co
nven
tio
nal
Res
po
nd
ents
'
Ko
nd
rati
eff
Inco
me
Ela
stic
ity o
f V
alu
e
of
Tim
e (L
arge
Veh
icle
s)0
.55
0%
0.1
50
.20
.15
0.8
see
2.1
0.1

How Will Upswings in Price Inflation and Interest Rates Change Toll Road Risk Profiles? A Study of Developing East Asian Economies with Broader Implications
31
Table A4.3: Parameter Value Distributions by Economic Scenario (2 of 4)
Ca
seV
ari
ab
le
Mo
da
l
Va
lue
Ch
an
ce o
f
Sm
all
er
Va
lue
Sta
nd
ard
Dev
iati
on
(Lo
w V
alu
es)
Min
imu
m
Va
lue
Sta
nd
ard
Dev
iati
on
(Hig
h V
alu
es)
Ma
xim
um
Va
lue
So
urc
e/ J
ust
ific
ati
on
Co
nven
tio
nal
Res
po
nd
ents
'
Ko
nd
rati
eff
Bas
e S
mal
l V
ehic
le
Op
erat
ing C
ost
s o
n
Ex
pre
ssw
ays
($/k
m)
$0
.06
5
0%
$0
.01
5
$0
.03
$
0.0
15
$
0.0
9
Fro
m o
ther
stu
die
s (c
orr
ob
ora
ted
by o
ther
tra
nsp
ort
pla
nn
ers)
Co
nven
tio
nal
Res
po
nd
ents
'
Ko
nd
rati
eff
Bas
e L
arge
Veh
icle
Op
erat
ing C
ost
s o
n
Ex
pre
ssw
ays
($/k
m)
$0
.10
5
0%
$0
.02
5
$0
.05
$
0.0
25
$
0.1
5
Fro
m o
ther
stu
die
s (c
orr
ob
ora
ted
by o
ther
tra
nsp
ort
pla
nn
ers)
Co
nven
tio
nal
Res
po
nd
ents
'
Ko
nd
rati
eff
Sm
all
Veh
icle
Lo
cal
Ro
ad
Op
erat
ing C
ost
(re
lati
ve
to
exp
ress
way
)
1.5
50
%0
.25
1.0
0.1
52
.0F
rom
oth
er s
tud
ies
(co
rro
bo
rate
d
by o
ther
tra
nsp
ort
pla
nn
ers)
Co
nven
tio
nal
Res
po
nd
ents
'
Ko
nd
rati
eff
Lar
ge
Veh
icle
Lo
cal
Ro
ad
Op
erat
ing C
ost
(re
lati
ve
to
exp
ress
way
)
2.0
50
%0
.25
1.5
0.2
52
.5F
rom
oth
er s
tud
ies
(co
rro
bo
rate
d
by o
ther
tra
nsp
ort
pla
nn
ers)
Co
nven
tio
nal
Res
po
nd
ents
'
Ko
nd
rati
eff
Fac
tor
for
Bas
e S
mal
l
Veh
icle
Dem
and
Mat
rix
10
0%
50
%1
5%
70
%1
5%
13
0%
arb
itra
ry t
o r
efle
ct p
oss
ible
err
or
ran
ge
in i
nit
ial
surv
eys
on
a "
real
wo
rld
" p
roje
ct
Co
nven
tio
nal
Res
po
nd
ents
'
Ko
nd
rati
eff
Fac
tor
for
Bas
e L
arge
Veh
icle
Dem
and
Mat
rix
10
0%
50
%1
5%
70
%1
5%
13
0%
arb
itra
ry t
o r
efle
ct p
oss
ible
err
or
ran
ge
in i
nit
ial
surv
eys
on
a "
real
wo
rld
" p
roje
ct
Co
nven
tio
nal
Res
po
nd
ents
'
Ko
nd
rati
eff
Inco
me
Ela
stic
ity o
f S
mal
l
Veh
icle
Tra
ffic
1.2
55
0%
0.2
00
.85
0.2
01
.65
see
3.5
Co
nven
tio
nal
Res
po
nd
ents
'
Ko
nd
rati
eff
Inco
me
Ela
stic
ity o
f L
arge
Veh
icle
Tra
ffic
1.1
05
0%
0.2
00
.70
0.2
01
.50
see
3.5
(sm
alle
r val
ue
to a
llo
w f
or
larg
er t
ruck
s an
d c
oac
hes
an
d
incr
ease
d e
ffic
ien
cy)
Co
nven
tio
nal
Res
po
nd
ents
'
Ko
nd
rati
eff
To
ll R
even
ue
Lea
kag
e (%
)1
0%
50
%2
.50
%5
%5
%2
0%
Fro
m o
ther
stu
die
s (c
orr
ob
ora
ted
by o
ther
tra
nsp
ort
pla
nn
ers)
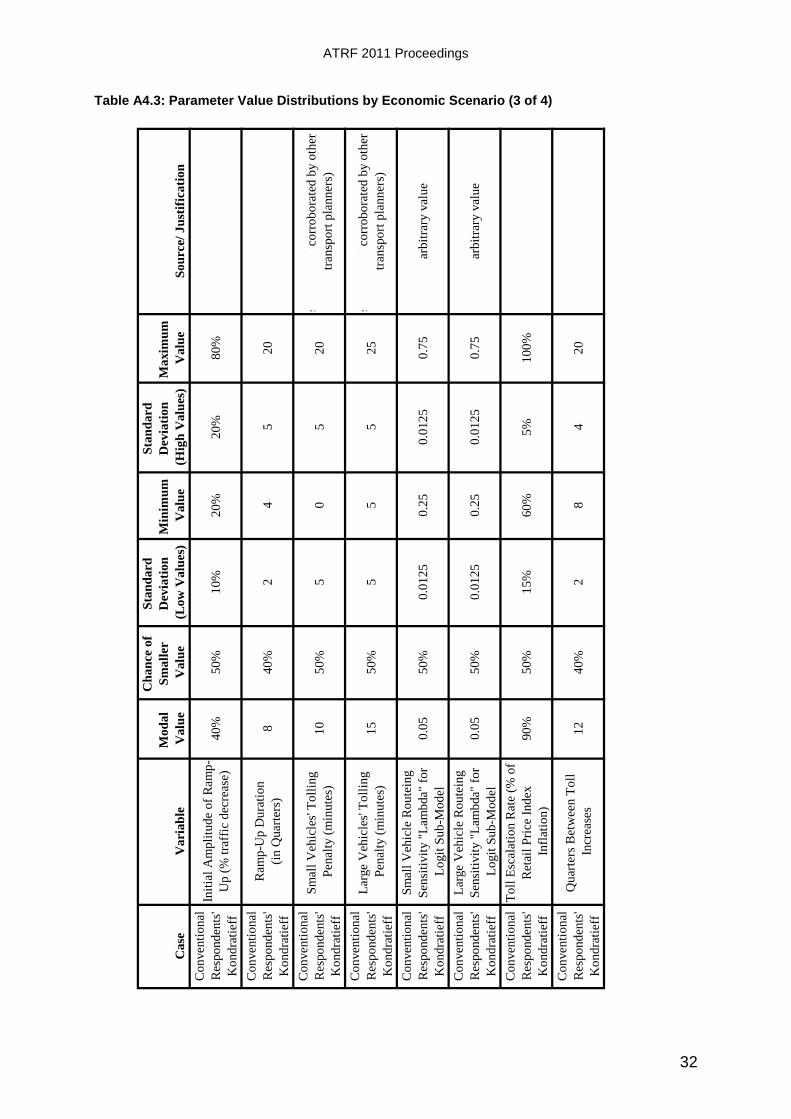
ATRF 2011 Proceedings
32
Table A4.3: Parameter Value Distributions by Economic Scenario (3 of 4)
Ca
seV
ari
ab
le
Mo
da
l
Va
lue
Ch
an
ce o
f
Sm
all
er
Va
lue
Sta
nd
ard
Dev
iati
on
(Lo
w V
alu
es)
Min
imu
m
Va
lue
Sta
nd
ard
Dev
iati
on
(Hig
h V
alu
es)
Ma
xim
um
Va
lue
So
urc
e/ J
ust
ific
ati
on
Co
nven
tio
nal
Res
po
nd
ents
'
Ko
nd
rati
eff
Init
ial
Am
pli
tud
e o
f R
amp
-
Up
(%
tra
ffic
dec
reas
e)4
0%
50
%1
0%
20
%2
0%
80
%se
e 2
.10
.4
Co
nven
tio
nal
Res
po
nd
ents
'
Ko
nd
rati
eff
Ram
p-U
p D
ura
tio
n
(in
Qu
arte
rs)
84
0%
24
52
0se
e 2
.10
.4
Co
nven
tio
nal
Res
po
nd
ents
'
Ko
nd
rati
eff
Sm
all
Veh
icle
s' T
oll
ing
Pen
alty
(m
inu
tes)
10
50
%5
05
20
see
2.9
(an
d c
orr
ob
ora
ted
by o
ther
tran
spo
rt p
lan
ner
s)
Co
nven
tio
nal
Res
po
nd
ents
'
Ko
nd
rati
eff
Lar
ge
Veh
icle
s' T
oll
ing
Pen
alty
(m
inu
tes)
15
50
%5
55
25
see
2.9
(an
d c
orr
ob
ora
ted
by o
ther
tran
spo
rt p
lan
ner
s)
Co
nven
tio
nal
Res
po
nd
ents
'
Ko
nd
rati
eff
Sm
all
Veh
icle
Ro
ute
ing
Sen
siti
vit
y "
Lam
bd
a" f
or
Lo
git
Su
b-M
od
el
0.0
55
0%
0.0
12
50
.25
0.0
12
50
.75
arb
itra
ry v
alu
e
Co
nven
tio
nal
Res
po
nd
ents
'
Ko
nd
rati
eff
Lar
ge
Veh
icle
Ro
ute
ing
Sen
siti
vit
y "
Lam
bd
a" f
or
Lo
git
Su
b-M
od
el
0.0
55
0%
0.0
12
50
.25
0.0
12
50
.75
arb
itra
ry v
alu
e
Co
nven
tio
nal
Res
po
nd
ents
'
Ko
nd
rati
eff
To
ll E
scal
atio
n R
ate
(% o
f
Ret
ail
Pri
ce I
nd
ex
Infl
atio
n)
90
%5
0%
15
%6
0%
5%
10
0%
see
2.1
0.3
Co
nven
tio
nal
Res
po
nd
ents
'
Ko
nd
rati
eff
Qu
arte
rs B
etw
een
To
ll
Incr
ease
s1
24
0%
28
42
0se
e 2
.10
.3

How Will Upswings in Price Inflation and Interest Rates Change Toll Road Risk Profiles? A Study of Developing East Asian Economies with Broader Implications
33
Table A4.3: Parameter Value Distributions by Economic Scenario (4 of 4)
Ca
seV
ari
ab
le
Mo
da
l
Va
lue
Ch
an
ce o
f
Sm
all
er
Va
lue
Sta
nd
ard
Dev
iati
on
(Lo
w V
alu
es)
Min
imu
m
Va
lue
Sta
nd
ard
Dev
iati
on
(Hig
h V
alu
es)
Ma
xim
um
Va
lue
So
urc
e/ J
ust
ific
ati
on
Co
nven
tio
nal
6%
50
%2
%2
%2
%1
0%
bas
e fo
r o
ther
cas
es a
lso
Res
po
nd
ents
'+
1%
50
%0
.5%
+0
%0
.5%
+2
%in
ad
dit
ion
to
Co
nven
tio
nal
val
ue
Ko
nd
rati
eff
+1
%5
0%
0.5
%+
0%
0.5
%+
2.5
%in
ad
dit
ion
to
Res
po
nd
ents
val
ue
Co
nven
tio
nal
2.5
%5
0%
1%
0.5
%1
%4
.5%
bas
e fo
r o
ther
cas
es a
lso
Res
po
nd
ents
'+
2.5
%5
0%
1.5
%+
0%
1.5
%+
5.5
%in
ad
dit
ion
to
Co
nven
tio
nal
val
ue
Ko
nd
rati
eff
+0
%n
/an
/an
/an
/an
/asa
me
as R
esp
on
den
ts v
alu
e
Co
nven
tio
nal
2.5
%5
0%
1%
0.5
%1
%4
.5%
bas
e fo
r o
ther
cas
es a
lso
Res
po
nd
ents
'+
0.7
5%
50
%0
.25
%+
0.2
5%
0.2
5%
+1
.25
%in
ad
dit
ion
to
Co
nven
tio
nal
val
ue
Ko
nd
rati
eff
+1
.0%
50
%0
.50
%+
0%
0.5
0%
+2
.5%
in a
dd
itio
n t
o R
esp
on
den
ts v
alu
e
Co
nven
tio
nal
2.5
%5
0%
1%
0.5
%1
%4
.5%
bas
e fo
r o
ther
cas
es a
lso
Res
po
nd
ents
'+
0.7
5%
50
%0
.25
%+
0.2
5%
0.2
5%
+1
.25
%in
ad
dit
ion
to
Co
nven
tio
nal
val
ue
Ko
nd
rati
eff
+1
.0%
50
%0
.50
%+
0%
0.5
0%
+2
.5%
in a
dd
itio
n t
o R
esp
on
den
ts v
alu
e
Co
nven
tio
nal
5%
50
%1
%3
%1
%7
%b
ase
for
oth
er c
ases
als
o
Res
po
nd
ents
'+
1%
50
%0
.50
%+
0%
0.5
0%
+2
%in
ad
dit
ion
to
Co
nven
tio
nal
val
ue
Ko
nd
rati
eff
+2
%5
0%
1%
+0
%1
%+
4%
in a
dd
itio
n t
o R
esp
on
den
ts v
alu
e
Co
nven
tio
nal
+2
%5
0%
1%
+0
%1
%+
4%
in a
dd
itio
n t
o i
nit
ial
deb
t ra
te
Res
po
nd
ents
'+
2%
50
%1
%+
0%
1%
+4
%in
ad
dit
ion
to
in
itia
l d
ebt
rate
Ko
nd
rati
eff
+2
%5
0%
1%
+0
%1
%+
4%
in a
dd
itio
n t
o i
nit
ial
deb
t ra
te
GD
P G
row
th (
% p
.a.)
Veh
icle
Op
erat
ing C
ost
Pri
ce I
nfl
atio
n (
% p
.a.)
Co
nst
ruct
ion
, O
per
atio
ns
& M
ain
ten
ance
Co
st
Infl
atio
n (
% p
.a.)
Gen
eral
Pri
ce I
nfl
atio
n (
%
p.a
.)
Inte
rest
Rat
es f
or
Init
ial
Deb
t (%
p.a
.)b
ased
on
co
nst
ruct
ion
co
sts
Inte
rest
Rat
es f
or
Ex
tra
Deb
t (%
p.a
.)fo
r su
bse
qu
ent
cash
sh
ort
fall
s

ATRF 2011 Proceedings
34
References
Asian Development Bank (ADB) (2003), Transit Fee and Tolling for Routes 3 and 9, Lao PDR, TA-3348 Final Report, Manila, April 2003
Bain, R. (2009) Toll Road Traffic & Revenue Forecasts: An Interpreter’s Guide, Robert Bain, UK
Bain, R. and Polakovic, L, (2005) “Traffic Forecasting Risk Study Update 2005: Through Ramp-Up and Beyond”, Commentary, Standard & Poor’s, London, 25 August 2005
Bain, R. and Wilkins, M. (2002) “Credit Implications of Traffic Risk in Start-Up Toll Facilities”, Infrastructure Finance, Standard & Poor’s, London, September 2002
Brinkman, P.A. (2003) The Ethical Challenges and Professional Responses of Travel Demand Forecasters, PhD Dissertation, University of California at Berkeley
Buchanan, C.P. (1999) “The Role of BOT in the Highway Sector – Experience from Malaysia and Elsewhere”, PIARC 21st World Roads Congress, Kuala Lumpur, October 1999
Central Intelligence Agency (CIA) (2005/2006) The World Factbook, www.odci.gov/cia/publications/factbook/index.html
Chan, C. (2003) “New World Divests in Mainland Toll Roads and Bridges”, South China Morning Post, Hong Kong, 17 November 2003
Corbett, V.F., Winston, B.P., Whittle, J.D., Mansell, P., Di Bona, R.F. and Husband, D., (2006) GMS Transport Sector Strategy Study, Final Report, T.A. No. 6195-REG, PADECO Co. Ltd., Tokyo and Asian Development Bank, Manila, May 2006
Di Bona, R.F. (2006) What are the key risks associated with private investment in start-up toll road projects in Developing East Asian Economies?, MBA Dissertation, Henley Management College (now Henley Business School), UK
Dizon, N. (2002) “Laguna Folk Sue Skyway Managers for Breach of Contract”, Sun Star, Manila, 19 January 2002, http://www.newsflash.org/2002/01/ht/ht002241.htm
Faber, M. (2002) Tomorrow’s Gold: Asia’s Age of Discovery, CLSA Books, Hong Kong
Faber, M. (2003) “The Financial Implications of Reflation”, The Gloom, Boom & Doom Report, Marc Faber Limited, Hong Kong, 23 June, 2003
Faber, M. (2005) “Why are Investment Markets Stalling?”, Market Commentary, Marc Faber Limited, Hong Kong, 2 September 2005
Faber, M. (2006) “Poor Mr. Bernanke”, Market Commentary, Marc Faber Limited, Hong Kong, 9 May 2006
Flyvbjerg, B. and COWI (2004) Procedures for Dealing with Optimism Bias in Transport Planning – Guidance Document, The British Department of Transport, London, and COWI, Copenhagen, 10 June 2004
Forsgren, K., Hecht J.E., Doud, T. and Wilkins, M. (1999) “The Toll Road Sector: Smooth Conditions Overall, but Watch for Caution Flags”, Standard & Poor’s Infrastructure Finance, October 1999, pp149-157
George, C., Trommer, S. and McDermott, M. (2004) “The Continuing Search for Bliss: Flexible Toll Road Structures”, Project Finance Special Report, Fitch Ratings, New York, 20 October 2004
Gomez, E.T. and Jomo K.S. (1999) Malaysia’s Political Economy: Politics, Patronage and Profits, 2nd Edition, Cambridge University Press.

How Will Upswings in Price Inflation and Interest Rates Change Toll Road Risk Profiles? A Study of Developing East Asian Economies with Broader Implications
35
Higson, C. (1995) Business Finance, 2nd Edition, Butterworths, London
Juglar, C. (1863) Des Crises Commerciales et leur Retour Périodique en France, en Angleterre, et aux Etats-Units, Imprimerie de Veuve Berger-Levrault, Strasbourg, 1863
Khan, A. and Willumsen, L.G. (1986) “Modelling Car Ownership and Use in Developing Countries”, Traffic Engineering and Control, 27(11), pp554-60.
Kilsby, D. (2004) “Ethical Challenges and Professional Responses of Travel Demand Forecasters – Review”, downloaded from www.kilsby.com.au (in October 2006)
Kilsby, D. (2006a) “Australia’s Future Oil Supply and Alternative Transport Fuels”, Submission to Senate Inquiry into Australia’s Future Oil Supply and Alternative Transport Fuels, National Committee on Transport, Engineers Australia, downloaded from www.kilsby.com.au (in October 2006)
Kilsby, D. (2006b) “Peak Oil – It’s Coming (Fast)”, Article in Cityscape, July and August 2006, downloaded from www.kilsby.com.au (in October 2006)
Kitchin, J. (1923) “Cycles and Trends in Economic Factors”, Review of Economic Statistics, Volume 5, pp. 10-16
Kondratieff, N.D. (1926) “Die Langen Wellen der Konjunktur”, Archiv für Sozialwissenschaft und Sozialpolitik, 1926, Volume 56, No. 3, pp. 573-609; translated by W. F. Stolper and reprinted as “Long Waves of Economic Life”, The Review of Economics and Statistics, Volume 17, Number 6, November 1935, pp. 20-42
Luu, H.S. (2006) “Financing Sources for Transport Development in Vietnam”, National Graduate Institute for Policy Studies, Tokyo, 26th August 2006, www.grips.ac.jp/vietnam/VDFTokyo/Doc/25LHSon26Aug06Slides.pdf
Maddison, A. (1995) Monitoring the World Economy, 1820-1992, Washington, D.C.: Organization for Economic Cooperation and Development
Morris, D. (1971) The Human Zoo, London: Corgi
Ormerod, P. (1999) Butterfly Economics, Far East Edition, London: Faber and Faber.
Orosz, C. (1998) “The Effects of Tolled Motorways in Hungary”, European Transport Conference, Loughborough, 14-18 September 1998
Ortúzar, J.d.D. and Willumsen, L.G. (1994) Modelling Transport, 2nd Edition, John Wiley & Sons
Pigou, A.C. (1920) The Economics of Welfare, London.
Pindyck, R.S. and Rubinfeld, D.L. (1981) Econometric Models and Economic Forecasts, Second Edition, McGraw-Hill International Editions, Singapore.
Richardson, A.J. (2004) “Estimating Individual Values of Time in Stated Preference Surveys”, presented at 26th Conference of Australian Institutes of Transport Research (CAITR), Melbourne, December 2004
Rigby, P.N. (1999) “Project Finance: Technical Risk Criteria”, Standard & Poor’s Infrastructure Finance, October 1999, pp 40-45
Rigby, P. and Penrose, J. (2001) “Project Finance Summary Debt Rating Criteria”, in Standard & Poor’s Project & Infrastructure Finance Review: Criteria and Commentary, October 2001, pp. 19-32
Ruster, J. (1996) “Mitigating Commercial Risks in Project Finance”, Public Policy for the Private Sector, Note No. 69, The World Bank, Washington, D.C., February 1996
ATRF 2011 Proceedings
36
Schumpeter, J.A. (1939) Business Cycles: A Theoretical, Historical and Statistical Analysis of the Capitalist Process, Philadelphia, 1939
Schumpeter, J.A. (1950) Capitalism, Socialism and Democracy, 3rd Edition, New York: Harper & Brothers, 1950
Streeter, W., Hermans, M., McCarthy, B., Stephenson, K., Monnier, L., Kolotas, P. and Osako, M. (2004) “Toll Road Securitizations: Wherein the Future Flows”, International Structured Finance/ Project Finance Special Report, Fitch Ratings, New York, 20 January 2004.
Streeter, W. and McManus, K. (1999) “Challenges of Start-Up Toll Roads”, Project Finance Special Report, Fitch ICBA, Duff & Phelps, New York.
Willumsen, L. and Russell, C. (1998) “Reducing Revenue Risk”, European Transport Conference, Loughborough, 14-18 September 1998