chapter 5 impact analysis and mitigation measures 5.1...
TRANSCRIPT

5-1
CHAPTER 5
IMPACT ANALYSIS AND MITIGATION MEASURES
5.1 GENERAL
The prime objective of this chapter is to understand the environmental impacts of heavy
mineral sand mining and its consequences on the coastal stretch covering the core and
buffer zone. The potential adverse impacts of mining on the land, water, air, average
noise and societal system of the area are sought to be brought out in detail. The water
system consists of surface and ground water domains. The land system consists of
human settlements, existing land use patterns, fragile shoreline and eco-protective land
cover. Air aspects include emissions due to transportation and mining Noise includes
sound generated by the Mineral Separation Plant (MSP) and other mining and separation
activities. All these are prone to multiple changes from time to time, in tune with the
prevalent socio-economic scenario, systemic anomalies in the seasons and coastal
dynamics and anthropogenic activities. The impact of mining on heavy mineral sand in
all these environment have been evaluated and possible measures to mitigate their
adverse impacts have been worked out.
The heavy mineral sand deposits of the coastal stretch of Kollam and Alappuzha districts
are one of the richest in the world. These sands contain Illmenite, sillimanite, rutile,
leucoxene, zircon and the highly radioactive monazite which were being mined and
separated by the IREL & KMML during the last decades and value added by KMML
during the last thirty odd years. This has been a source of sizeable revenue for the Govt.,
and due to pressure of land and CRZ restrictions for mining in the coastal stretch, the
KMML and other industrial users have to find suitable locales for sustained retrieval of
the strategic raw material without causing any environmental imbalance. It is therefore
important to collect temporal data on the original land and water systems in the area from
existing sources to assess the changes due to seasonal variations and anthropogenic
influence. This includes collection of representative water and soil samples to assess
from the designated block and its buffer impact peripheries. These data will be
synthesized and collated to prepare spatial outputs and workable models vis-a- vis
existing environment, to project EMPs. Impact assessment describes the beneficial and
adverse effects of the 88.119 Ha mining project. For extracting heavy minerals, beach
washing is collected using scrapers and inland mining conducted by using toyo pumps
mounted on pontoons. The dredge unit is transported using trucks and assembled at the

5-2
plot. The mined concentrate is transported to Mineral Separation plant (MSP) for
separating the various minerals.
Two methods of mining are used:
By collection of beach washing
By dredge mining or using TOYO pumps/ Excavation by using excavators where
dredge mining is not possible.
In beach washing collection, only sand that has been brought in by wave action is
collected. The quantum sand available for collection has been assessed by National
Center for Earth Science Studies, Trivandrum (NCESS) based on Sand Budgeting study.
From September 2014, onwards the beach wash collection is being limited as per
NCESS recommendation.
In case of inland mining, the pits are covered progressively by the tailings generated in
the treatment plant.
The environmental impact assessment process ensures identifying the key developmental
and operational activities/hazards resulting from the proposed mining & mineral
processing. The proposed activity is purely a wet process and there is no significant
impact on air except fugitive emissions due to material transport. Other significant
impacts include socio-economic impacts and road traffic congestion. However
considering various activity components, the impacts on the environment, either
beneficial or deleterious due to the proposed mining activity are identified. The aspects
on the environment that are likely to be disturbed or damaged due to the implementation
of this project is represented with mitigation measures. The area has a reserve of
12,811,700 tons of beach sand deposit and the average grade is seen to be 27.81% of
Heavy Mineral Content. Approximate quantity of sand mined so far is 1.14 million tons.
So the balance quantity of geological reserve is 11.6 million tons. The mineral separation
plant is located in the Mine lease area. No adverse impacts are anticipated due to MSP
since the separation of minerals is done using the physical properties of minerals such as
magnetic, conductivity, specific gravity. Equipment like magnetic separators,
electrostatic separators are used for separation of individual minerals.
The mining methods practiced here are such that there will be minimal environmental
impacts. Here there is no drilling or blasting. In Beach wash process, the accumulated
ore is scraped from the surface. In dredge mining, the sand is loosened by the cutter head

5-3
working inside the water in the dredge pond. There is no generation of dust or vibration
in both these operations.
Mathematical models are used to quantitatively predict the impacts on air and noise
quality. Air quality model was modelled using FDM pro™ (Fugitive Dust Emission
Modelling System) and noise by hemispherical model.
Battelle environmental system is used for evaluation of various impacts of environmental
pollution, ecology, human interest and Aesthetics.
The environmental impacts due to the mining can be summarised as follows:
Air quality
Noise
Topography and Land use
Water Environment
Ecology
Traffic
Socio-economic & Rehabilitation & Resettlement
5.2 Air environment
Beach sand extraction, upgradation and back filling do not cause appreciable rise in
gaseous or particulate pollution level in ambient and work zone environment. Sand
extraction process (dredging) is a wet primary process and back filled mass is moist in
form and do not release dry dusts in mining area. Therefore the pollution in the proposed
area will be insignificant. Ambient Air Quality monitored at Vellanathuruthu, KMML
Guest house, MS Plant and IRE Guesthouse for PM10,SO2 and NOX are well within
respective permissible limits. The meteorological data have been generated at 80 ha
mining site during the study period on an hourly basis.
5.2.1 Modelling of Dust Emissions
A) Modeling of air emissions
The air pollutants of interest in this project are PM10. The main sources are emissions
during mining and transportation. Dust emission is not significant in dredge mining as
the ore and rejects are in wet or slurry form. Road transportation of ore on the haul road
is the only source of dust emission.

5-4
B) Fugitive Emissions Estimation
Dust clouds due to the movement of trucks on roads can cause very significant transient
dust nuisance. In this project, the transportation of mined material is through rural
unpaved single lane road and concentrate is transported from MS plant to pigment plant
is through bituminous topped public roads with six meters width. The average mined
quantity of sand from Ponmana is 97,200 MT per year and Anchumanakkal beach
washings 36,900MT per year respectively. The combined mining is 1,34,100 MT per
year. The collection of mineral rich sand takes place during a span of 330 working days
with the plant working for 9 hours, from 8am to 5pm. Thus the collection and extraction
of mineral rich sand per day is 407 MT.
According to the project the requirement for the revision is done for the increase in
mining capacity to 4,50,000 MT/year, considering the limitation set by NCESS,
Trivandrum.
The material transported is heavy mineral rich beach sand, and its silt content is very
low. Therefore dust raised from entrainment of spilled materials will be relatively less
compared with the transportation of excavated soil or clay as commonly seen on roads in
Kerala.
Table 5.1 Provide the estimated vehicle movement in terms of total traffic within
mining site and the Road leading to the KMML plant for present and future
condition.
Sl.
No:
Project
time Site
Number
of trips
Total
trips
Increase
in traffic
no:
1 Present
condition
From Ponmana
and
Anchumanakk
al
With load 52
106 - Empty
load 52
From MS Plant
to pigment
plant
With load 10
20 - Empty
load 10

5-5
2 After
Expansion
From Ponmana
and
Anchumanakk
al
With load 137
258 162 Empty
load 137
From MS Plant
to pigment
plant
Towards
KMML 25
50 30 From
KMML 25
Dust can be assessed using emission factor equation for both paved and unpaved roads.
The emission factor equations are given below. The equation is according to AP 42 on
emission factors of unpaved roads.
5.165.0
32
WsLkE
Where:
E = Particulate emission factor (having units matching the units of k),
sL = Road surface silt loading (grams per square meter) (g/m2)
W = average weight (tons) of the vehicles traveling the road
k = is the particle size multiplier as given in the table below
Size range Particle Size Multiplier k
g/VKT
PM- 2.5 0.66
PM-10 4.6
PM-15 5.5
PM-30 24
5-6
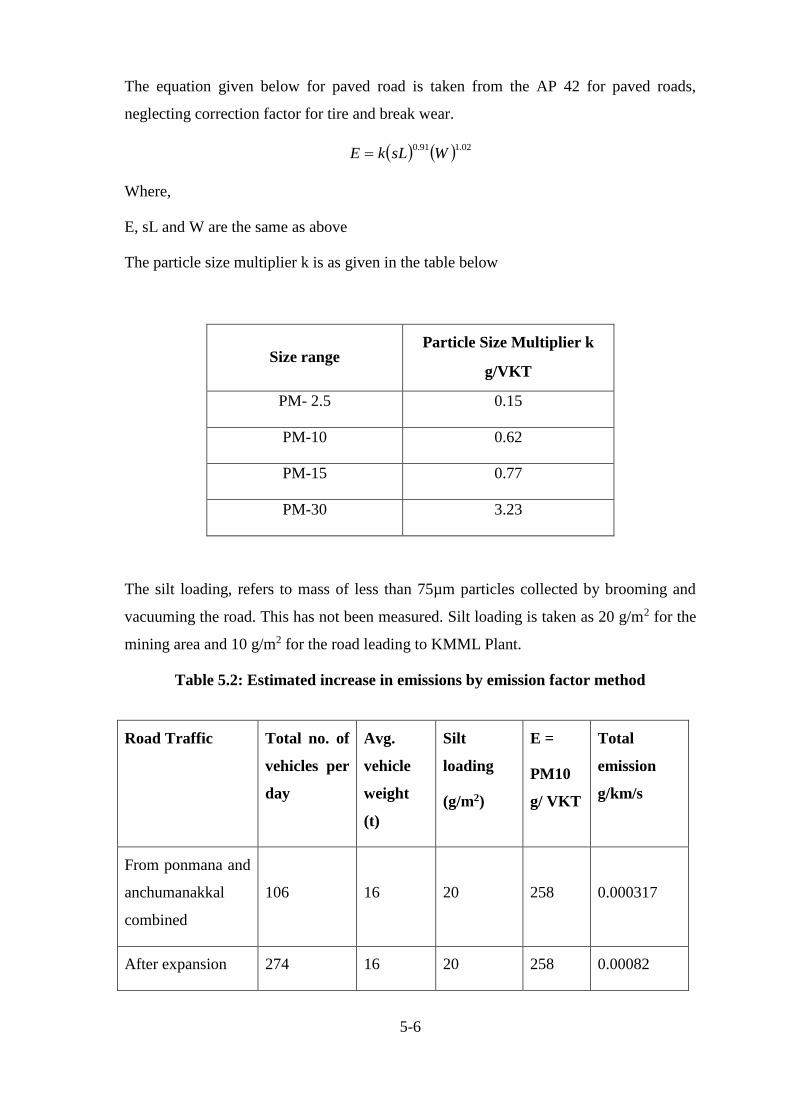
The equation given below for paved road is taken from the AP 42 for paved roads,
neglecting correction factor for tire and break wear.
02.191.0WsLkE
Where,
E, sL and W are the same as above
The particle size multiplier k is as given in the table below
Size range Particle Size Multiplier k
g/VKT
PM- 2.5 0.15
PM-10 0.62
PM-15 0.77
PM-30 3.23
The silt loading, refers to mass of less than 75µm particles collected by brooming and
vacuuming the road. This has not been measured. Silt loading is taken as 20 g/m2 for the
mining area and 10 g/m2 for the road leading to KMML Plant.
Table 5.2: Estimated increase in emissions by emission factor method
Road Traffic Total no. of
vehicles per
day
Avg.
vehicle
weight
(t)
Silt
loading
(g/m2)
E =
PM10
g/ VKT
Total
emission
g/km/s
From ponmana and
anchumanakkal
combined
106 16 20 258 0.000317
After expansion 274 16 20 258 0.00082

5-7
Modeling of SPM due to dust emissions from traffic has been done using Gaussian
Plume modeling method for which the general equation is given below. The Gaussian
model is the most commonly used model for the air dispersion modelling. The Gaussian
equation for point source emission is
C(x, y, z) = Q
2 πuσyσz{exp 〖(
−(𝑧 − ℎ)2
2𝜎𝑧2〗) + exp (
−(𝑧 + ℎ)2
2𝜎𝑧2) } { exp 〖(
−(𝑦)2
2𝜎𝑦2〗)}
The Gaussian equation applicable for the line source is
C(x, y, z) = 2q
√2πuσz{exp 〖(
−(𝐻)2
2𝜎𝑧2〗)}
Where,
C (𝑥,y,z)= Pollutant concentration as a function of downwind position (µg/m3)
Q = Emission rate (g/s)
q = Emission rate (g/s/m)
u = Average wind speed (m/s)
σy,σz = Standard distribution of the concentration distributions in the
Horizontal and vertical directions
z = Vertical distance from ground level, (m)
y = distance in horizontal direction (m)
H = Vertical distance from ground level, (m)
Dust emissions have been modeled using MOeF approved Envitrans FDMpro software.
From MS Plant to
pigment plant 20 16 10 87 0.0000202
After expansion 50 16 10 87 0.00005046

5-8
It would suffice to calculate the increase in PM10 from increase in total emission
calculated above, using the measured baseline values. The isopleth plots are obtained.
The isopleth plot for the current mining capacity is shown in figure 5.1.
Fig 5.1 Isopleth plot for current mining capacity
The model shows the highest value near the conjunction of the two roads. The CPCB
limit prescribed for PM10 is 100µg/m3 for 24 hour. According to the data obtained, the
PM10 is within prescribed limits for the current mining capacity. The figure 5.2 shows
the isopleth plot for the mining capacity after expansion without applying the mitigation
measures.

5-9
Figure 5.2 Isopleth plot for air quality after expansion without applying mitigation
measures.
5.2.2 Mitigation Strategies
Existing level of air pollution in the proposed core zone area is below the permissible
limits (National Ambient Air quality norms). The dredge is electric driven and therefore
has no gas or dust emissions. The only source of air pollution is emissions during road
transportation in haul roads of heavies from mine to MSP. No emissions are expected
from the loaded heavies as they are covered and transported in moist form.
Air pollution can be totally avoided by using water transport through the TS Canal. The
suggested method is the use of country boats which are the most environmentally
friendly and having a very positive socio-economic impact.
The following measures are recommended to reduce pollution for road transport
During the transportation from the segregated area, the material may be wetted
thoroughly to avoid dispersion.
The segregation area where the material is stored should be covered completely
to avoid wind dispersion

5-10
During transportation after the loading the vehicles should be secured with a
covering over the loaded material to avoid spillage, which on drying may cause
dispersion.
Provision of water trough at the exits of roads for tyre washing is recommended
at the exit of Chavara factory, for the return vehicles.
Good preventive maintenance schedule for equipment & vehicles.
It is suggested that the vehicles strictly follow the stipulations for their vehicular
exhausts, both diesel and petrol vehicles
The existing roads connecting MSP and TiO2 plant should be, resurfaced and
maintained in good condition. Trees should be planted on sides.
All the areas from loading point to the segregation point should be concreted or
tarred to avoid heavy dispersion of sand, which will lead to an increase in solid
particulate matter.
As per CPCB norms all the roads where vehicular transportation is being done
should be kept wet.
Ensure leak-proof transport equipment. Vehicles transporting the minerals shall
be provided with tarpaulin cover
Supply of face masks to workers and staff to prevent dust inhalation
Overloading of transport equipment must be prevented.
The 35% Calcium chloride solution can be sprayed on the roads to prevent the
rise of dust particles into the atmosphere. This shall be done in the summer
months when the soil is dry and subject to dispersion.
Gaseous pollutants in the exhaust fumes generated by the dozers and other machinery
shall be minimised by ensuring vigorous maintenance and stringent overhaul schedules.
The repair workshop and maintenance garage should be equipped with all necessary
facilities.
The air quality drastically improves after applying mitigation measures and this has been
modelled using Fugitive Dust Modelling Software, Envitrans mine FDMpro.

5-11
The isopleth plot showing the emission after the implementation of the mitigation
measures is shown in figure 5.3. This shows that the pollution was reduced considerably
after applying the mitigation measures.
Fig 5.3 Isopleth plot for the emission after the implementation of the mitigation
measures
5.3 Noise
Monitoring of sensitive areas has been done in and around the area. The noise was
measured in different locations in and around the area of mine lease.

5-12
Table 5.3 the value of noise measured from different locations near KMML
Sl no: Location of monitoring Time of monitoring
Value
recorded in
dB
1 Near Administrative Office. 08.05am - 08.15am 60.2
2 Near Dispensary 08.30am - 08.40am 54.9
3 Near Workshop (Electrical and
Mechanical) 08.55am - 09.05am 69.2
4 Location of monitoring: At Mining
Area North side 09.20am - 09.30am 76.1
5 Location of monitoring: At Mining
Area South side 09.45am - 09.55am 65.6
6 Near St. Andrew’s church and St.
Andrew’s L.P School 10.15am - 10.25am 56.1
7
Near IRE mining office and Kerala
Government Anganvadi (No. 116)
Chavara
10.40am - 10.50am 52.5
8 Near Zircon recovery plant (In front
of production department) 11.05am - 11.15am 64.9
9 Near Wet mill plant 11.40am - 11.45am 77.4
10 Near Govt. H.S.S
Shankaramangalam, Chavara 13.40pm - 13.50pm 75.7
11
Nerar Kalpakaseriyil Abdul Rahman
Kunju Memorial building,
Kattakada.
14.15pm - 14.25pm 54.2
12 Near KMML guest house 16.30pm - 16.45pm 64.6
13 Near Zircon sillmanite recovery
plant 11.55am -12.05pm 79.4
14 Near Rutile illmanite magnetic
separation plant 12.20pm -12.30pm 82.4

5-13
15 Near Panamana Minnam Thottathil
Sree Bhagavathi Temple 12.50pm - 13.00pm 52.4
16 Near Sreenarayana Guru
Temple,Thevalkara 14.45pm - 14.55pm 49.1
17 Near Kunnel Junction,Thevalkara 15.20pm - 15.30pm 75.7
18 Near KMML Titanium Junction 16.00pm - 16.10pm 77.8
Table 5.4 Standards for noise calculation according to CPCB Norms
Acceptable Outdoor Noise Levels: Norms of Central Pollution Control Board
Area Code Category of Area Limits in dB (A)
Day time Night time
A Industrial Area 75 70
B Commercial Area 65 55
C Residential Area 55 45
D Sensitive zone 55 45
5.3.1 Noise Modelling
The modelling of noise was carried out using the hemispherical model equation.
LW = Lp + [20 × log10 (r)] - 8
Where,
Lw= Sound power level (dB),
Lp = Sound pressure level at a receiver
r = distance from source
The modelling of noise has been carried out using the hemispherical model equation.
The Noise values have been calculated at a distance of 1m, 5m, 10m, 20m, and 40m

5-14
respectively. The Table 5.5 shows the variation of noise from source with distance. This
shows a logarithmic variation of noise. As the distance increases, the reduction in noise
also reduces.
Table 5.5 Change of noise from source with distance
Location
of
monitoring
Value
recorded
in dB
Calculated values at distances
1m 5m 10m 20m 30m 40m
Noise from
Machinery 92 84 70 64 57.9 54.4 51.9
Fig 5.4 Plot for the change of noise wrt the distance
From this, it is understood that the noise levels does not cross the limits as prescribed by
the standard limits by CPCB norms. The noise values are within limits. Figure 5.5 shows
the outburst of the noise from the Mineral Separation Plant and the buffer zone is limited
with 40 meters as the noise level does not cross beyond that limit. The nearest
inhabitants (settlements) from the MSP is more than 250 meters and the temple located
nearer to the plant is 340 meters away.
0.00
10.00
20.00
30.00
40.00
50.00
60.00
70.00
80.00
90.00
1 5 10 20 30 40 50
Nois
e V
alu
e p
red
icte
d
Distance from source
Predicted noise value v/s distance
noise in dB

5-15
5.3.2 Mitigation Strategies
Personnel involved in work on inplant noise producing equipment are likely to be
exposed to high level of noise. For such personnel, audiometric examination should be
arranged at least once a year. The noise level should be monitored at these key locations
once in a month and values to be recorded. The plant workers shall be provided with the
noise protection ear phones or plugs.
5.4 Ground water quality: Studies by CGWB
In a study conducted by Central Ground water board, a well located at Chavara recorded
an EC value of 1370 mS/cm at 250 C and chloride value of 298mg/l. However in the bore
wells, the quality of water is generally good, mostly the Electrical conductivity (EC) in
the range of 50 to 250 mS/cm at 250 C. The fluoride value is also within the permissible
limits. The shallow phreatic aquifers in alluvium are developed through dug wells. Filter
point wells are more economical where the saturated thickness of the shallow zone
exceeds 5m. These are feasible in the coastal areas along Chavara and Karunagappally
and the yield ranges from 20 to 60m3/day. In areas very near to the coast and tidal zones,
the water samples have reported EC above 1000 μS/cm at 25 0C. Chloride in phreatic
groundwater is below 60 mg/l in major part of the district. Higher values of chloride
were observed as localized patches in the coastal plain in the close vicinity of the
backwaters. The chloride content is observed as 298 mg/l in Chavara area.
Based on the sampling, hydrology survey and analysis the consultant has observed that
about 74 Hectares of land lying on the western side of TiO2 plant is being affected. The
area falls outside the core zone . The impact is observed on the water resources. Potable
water is supplied by KMML in the affected area
Tube well details constructed in 1992 at Chavara 80 58’; 760 32’ 05’’ D/9
Table: 5.6 Analytical data on samples from GWM wells in April 2006
Sl.no Depth
drilled
Depth
constructed
(m)
Static water
level
(m)
Aquifer Discharge
(lpm)
I 189.53 185 12.91 Warkallai 30
II 160.0 143 9.18 Ouilon 1.83

5-16
III` 101.45 48 2.89 Vaikkom 0.02
Table: 5.7 Data
Location
EC in
(us/cm
at250C)
Total
hardness
as
CaCO3
( mg/l)
Ca
( mg/l)``
Mg
( mg/l)
Cl
( mg/l)
F
( mg/l)
Karunagappally 325 110 35 49 60 0.02
Chavara 1370 465 162 14 298 0.26
5.4.1 Ground water level trend:
Ground water level trends analysed through water level data of observation wells in
Karunagapally block for 5 years (2006 to 2010) of 10 wells indicate that the fluctuation
ranges from 0.02 to 2.37 meters during SW monsoon and from 0.62 to 2.97 meters
during the North east monsoon. . The hydrological surveys and exploration for ground
water carried out in Kollam district by the Central Ground Water Board(CGWB) to
assess the capabilities of the aquifers, water quality and ground water potential. The
stage of ground water development in Chavara Panchayat and Karunagappally
Municipality were assessed as safe. However the prevalence of large scale pumping of
wells along the western area have resulted in the depletion of the water table aquifers, as
evidenced from the steep gradient of the water table contours.
5.4.2 Ground Water level and Flow Pattern
Ground water is influenced by the difference in hydraulic head produced by topographic
relief and unconsolidated formations. The difference in hydraulic head due to
topographic relief is the most significant driving force for ground water flow. The
contours were generated with reference to water level RL’s of wells which are measured
during the field survey. The water level RL of well is calculated from the above table i.e.,
(Water level RL= Reduced level - (depth to water level from top of parapet - Height of
parapet)).The details the wells taken into consideration for deciphering the ground water

5-17
contours are provided in Annexure 8. The ground water contours were drawn for
determining the ground water flow direction in the study area. Usually sandy layers
facilitate the flow of water whereas clayey layer retards it. The Ground water contour
map indicates that the ground water flow is predominantly towards western side. There
are no significant impacts on the water resources due to MSP or due to mining
5.4.3 Impact on water quality
Physicochemical parameters determined on the 99 well water samples collected from the
study area are tabulated in table 1 of annexure 8. Data generated was compared with the
Indian Standards and specifications for Drinking Water (IS: 10500:2012) and World
Health Organizations (WHO) drinking water limits. The analysis results were interpreted
based on IS: 10500 (2012).
Iron content in the water samples before and after filtration are presented in table 2 of
annexure 8. The table indicated that in most of the cases, the iron content is high in
samples subjected to analysis without filtration. Above pH 4, iron compounds precipitate
out from water. Majority of the water samples exhibited pH in the range above 4 and
hence showed lower iron content values in the case of water samples after filtration.
Thus tables 1 & 2 provides the data of all the physicochemical parameters analysed,
while table 3 , annexure 8 provides the data on trace metals analysed with ICP-MS at
University of Kerala, Kariavattom, Thiruvananthapuram.
5.4.4 Impact of inland mining on ground water conditions due to Saline Water Intrusion
Bicarbonate and carbonate ions are abundant in ground water but Chloride generally
occurs in small amounts but is abundant in sea water. Salt water intrusion may be
identified by the relative concentrations of some of the characteristic ions of sea water
such as Cl-, Na and Mg. The Cl- / (CO32- + HCO3
- ) ratio is recommended as a criterion to
evaluate salt water intrusion aspect. This ratio is considered to be indicative of ground
water contamination by sea water

5-18
Table 5.8: Range of Cl-/ (CO3 2- + HCO3- ) Vs Saltwater contamination level
Range of Cl-
/(CO32- +
HCO3- )
Remarks with reference to salt
water contamination
Sample no’s
< 0.5 Normal
ground water
(no salt water contamination )
0.5 - 1.30 Slightly contaminated ground
water
KMW1,KMW5,KMW13,KMW16
and KMW17
1.30 - 2.80 Moderately contaminated ground
water
KMW3,KMW6,
2.80 - 6.60 Injuriously contaminated ground
water
KMW11,KMW12
6.60 - 15.50 Highly contaminated ground
water(near sea water)
> 200.0 Sea water KM2( Mine pit water sample at
Koilthottam )
Above cited results show that the ground water in the study area is hard water with very
high alkalinity. Since 9 no’s of well water samples viz.KMW1, KMW3 ,KMW5,
KMW6, KMW11, KMW12, KMW13, KMW16 and KMW17 showed Cl-/(CO32- +
HCO3- ) ratio of ranging from 1.03 to 3.80, brackish / salt water intrusion is not ruled
out. The contamination level in the water samples varied from slightly contaminated,
moderately contaminated to injuriously contaminated ground water. Though the Cl-
concentrations of all the well water samples are within the permissible limit, overall
water quality in the core zone is unfit for drinking purpose but can be used for domestic
chores.

5-19
5.4.5 Sea erosion
The shoreline of Kerala has been subjected to severe coastal erosion in recent times. In
the monsoons, two third of the shore line is vulnerable to dynamic changes. Beach
erosion is a major environmental and public issue in the area and indeed throughout the
Kerala coast. The mining and removal of sand will have a negative impact on coastal
topography. Moreover, the dredging operation will not lead to any erosion at any point of
time. However the beach washing collection might be a causative factor for sea erosion if
carried out without any restraint in an unscientific manner. The NCESS had conducted a
detailed sand budgeting study at the instance of KMML
The coastal protection measures undertaken include; Seawall construction and Groyns,
by the state government and KMML in its mining areas. These measures are also being
taken up by KMML over the stretches of mining areas every year for controlling erosion.
But there is no evidence to state that beach sand mining is primarily the cause of sea
erosion. Besides the dredging of sand from land area will not lead to any erosion..
However the mining operations in the very loose unconsolidated sand near sea may upset
the stability of land area which is only about 1 to 2.5m m above msl.
Mitigation measures proposed are:
Rip rap walls on the banks of the TS canal
Construction of groyns for strengthening of existing seawalls and for a possible
land reclamation. The figure 5.6 shows an example of formation of beach due to
construction of groyns at Kayankulam Pozhi.

5-20
Fig 5.5 Beach formation due to construction of groyn.
Sand dunes may be constructed and stabilized using vegetation.
Geotechnical investigation study has already been conducted by IIT Madras on
the area for construction of groynes etc….
Mitigation measures are further explained in detail in Environmental Management Plan
chapter.
Fig 5.6 Study conducted by IIT Madras
5.5 Topography and Land use:
The Mining operations go in tandem with reclamation. About 75% of the raw sand will
be deposited back to the mining area and will be used for reclamation of the mined out
5-21
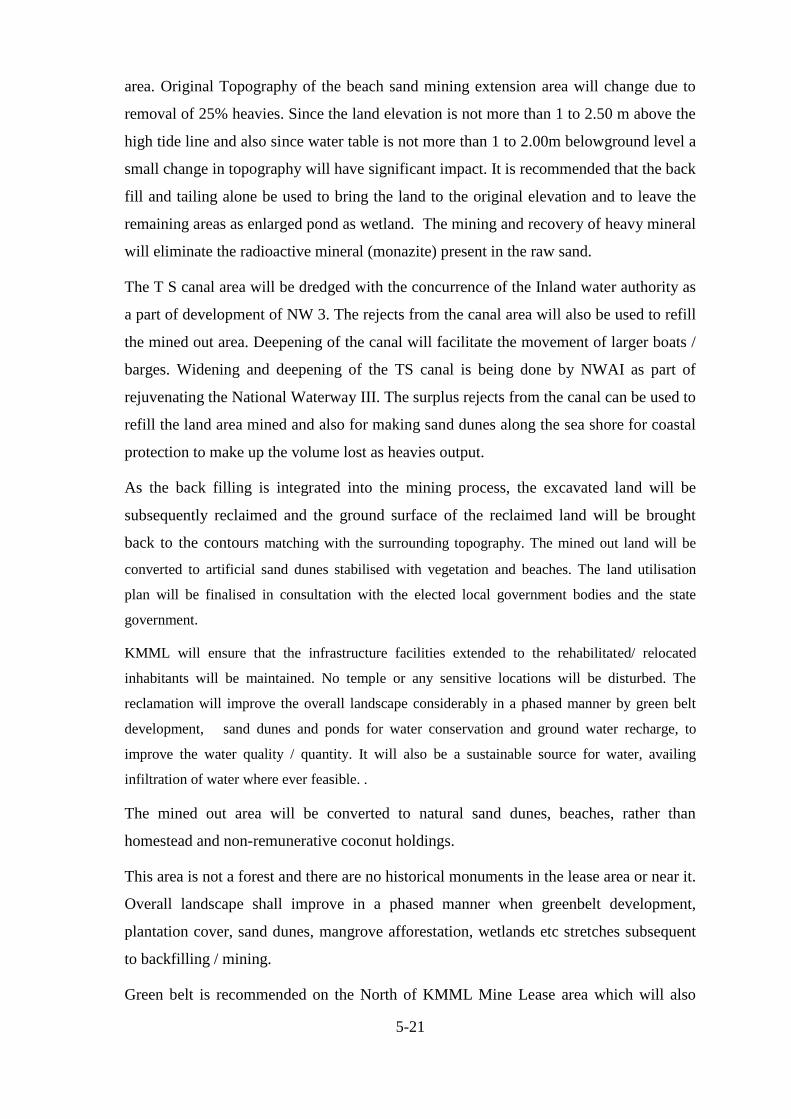
area. Original Topography of the beach sand mining extension area will change due to
removal of 25% heavies. Since the land elevation is not more than 1 to 2.50 m above the
high tide line and also since water table is not more than 1 to 2.00m belowground level a
small change in topography will have significant impact. It is recommended that the back
fill and tailing alone be used to bring the land to the original elevation and to leave the
remaining areas as enlarged pond as wetland. The mining and recovery of heavy mineral
will eliminate the radioactive mineral (monazite) present in the raw sand.
The T S canal area will be dredged with the concurrence of the Inland water authority as
a part of development of NW 3. The rejects from the canal area will also be used to refill
the mined out area. Deepening of the canal will facilitate the movement of larger boats /
barges. Widening and deepening of the TS canal is being done by NWAI as part of
rejuvenating the National Waterway III. The surplus rejects from the canal can be used to
refill the land area mined and also for making sand dunes along the sea shore for coastal
protection to make up the volume lost as heavies output.
As the back filling is integrated into the mining process, the excavated land will be
subsequently reclaimed and the ground surface of the reclaimed land will be brought
back to the contours matching with the surrounding topography. The mined out land will be
converted to artificial sand dunes stabilised with vegetation and beaches. The land utilisation
plan will be finalised in consultation with the elected local government bodies and the state
government.
KMML will ensure that the infrastructure facilities extended to the rehabilitated/ relocated
inhabitants will be maintained. No temple or any sensitive locations will be disturbed. The
reclamation will improve the overall landscape considerably in a phased manner by green belt
development, sand dunes and ponds for water conservation and ground water recharge, to
improve the water quality / quantity. It will also be a sustainable source for water, availing
infiltration of water where ever feasible. .
The mined out area will be converted to natural sand dunes, beaches, rather than
homestead and non-remunerative coconut holdings.
This area is not a forest and there are no historical monuments in the lease area or near it.
Overall landscape shall improve in a phased manner when greenbelt development,
plantation cover, sand dunes, mangrove afforestation, wetlands etc stretches subsequent
to backfilling / mining.
Green belt is recommended on the North of KMML Mine Lease area which will also

5-22
strengthen the border between Vattakayal and the Arabian Sea. About 2400 square
meters of coconut palms are recommended for plantation. Afforestation will be done to
about 300m per year. Thick bushes shall be placed in areas with lean land width.
5.5.1 DRAINAGE
The deposit is totally isolated from the main land side by T.S canal. Seasonal/perennial streams
join T.S canal at places instead of directly discharging into sea. The canal is connected with sea
at two ends of the deposits. Natural Drainage of water from the project site is not at all a problem
since the canal is just on the eastern side of the ML. Floating of the dredge on the canal water or
sand extraction at the canal bed for some period will not have any appreciable impact on
drainage. Thus beach sand mining will not have any impact on the network of backwater bodies
including T.S canal.
5.6 IMPACT ON ECOLOGY
5.6.1 Fauna
No animals, included in Schedule I of Wildlife Protection Act 1972 were observed in the study
area. No endangered or endemic animals were also observed during the ecological survey. Since
continuous mining activities are going on in this area, there is no stability for the soil habitat in
this area, which may be the reason for less soil organisms in this area. There are certain specific
areas in the buffer zone where the soil has become polluted due to the leaching of iron oxide
from KMML titanium plant.
5.6.1.1 Flora
At present, no endangered species or threatened species or plants included in the Schedule I of
wild life protection act of 1972 was observed. There are no forest nor wild life sanctuary in the
core or buffer zone. There are no significant impact on the ecology due to the mining or MSP
plant.
5.6.2 IMPACTS ON SOIL AND AGRICULTURE
The core zone soil is basically sandy soil. The mining will involve extraction of this sandy soil,
and dumping back the tailings in the mined out areas. Since the heavy mineral extraction is a
simple physical process, the sand which is dumped back will not differ chemically from the pre-
mining sand except that the heavy minerals are no longer present. The physical changes which
will occur will be minor and will have no lasting impacts. Mining will involve cutting down of
coconut trees leading to loss in coconut production. These trees if required can be replaced by
new saplings of improved variety to improve the agricultural yield. The emission from MSP is
too small to have any impact on the soil or agriculture production in the study area. Mitigation
measures suggested in EMP section has to be implemented by KMML.

5-23
5.6.3 SOCIO- ECONOMIC IMPACTS
5.6.3.1 Mining Area
Most of the households have left the Mine lease area by accepting reasonable compensation as
per the existing R&R policy of the government and the company. About 10 families resisted to
vacate on the assumption that the value offered by the company is less. These families feel that
that it is impossible to get suitable land with the money offered by the company.
During the pre-mining period, the majority of the people were engaged in fishing, daily wage
labors and driving. After mining process has started, fishing sector in this area has declined,
which caused a decrease in their daily income.
The income of the 10 families located in the ML area is less than Rs.20,000/- per annum.
Though majority of the inhabitants have primary, upper primary or high school education,
unemployment level is as high as 70%. Since there is no commercial or industrial activities in the
immediate vicinity of the mine area, people find it difficult to get suitable employment. They
cannot depend on their limited land holding for sustenance. The people in the ML area have
limited occupational skill but majority of them are well versed in fishing
The inhabitants generally depend on piped water supply or water supplied through mobile
tankers funded by KMML. The respondents have reported that the supply of water is insufficient
and erratic. The tanker supply is not reliable since the same is organised at the convenience of the
mine operator. Inadequate water supply is a major issue which has a direct bearing on the health
and hygiene of the 10 families living in the mining area.
The stagnant water in the mine pits has become a breeding ground for mosquitoes, increasing the
incidence of mosquito related diseases, skin ailments and allergic disorders. Sea erosion is
another serious issue faced by the people in the ML area.
A revised R & R package has to be devised to vacate the remaining 10 families in the ML area.
The amount of compensation should be reasonable so as to get land as per their occupational /
job profile pattern. However as a part of land acquisition package employment has been provided
for a member of the family from whom the land was purchased. In a way this has effected in
reducing the socio economic impacts of the project as well as an upliftment of the surrounding
community.

5-24
5.6.3.2 Buffer Zone
In Ponmana Panchayath three wards were taken for the study- Chittoor, Mekkad and
Ponmana wards which are free from mining but fall within the neighbourhood and indirectly
affected by mining.
Most of the wells have dried up or is contaminated mainly on the western and North Western
side of the existing KMML plant. Management measures for controlling the ground water
contamination are a must.
Frequent up and down movement of vehicles loaded with mineral concentrate ( between
KMML MSP and KMML Plant) are another area of concern which result in sand spills
and dust pollution, traffic congestion and accidents in the village roads. Unavailability of
potable water for drinking is another issue causing social unrest in this area. Water
available in the existing wells in the area is brackish or contaminated due to the seepage
from the titanium plant.
All these aspects adversely affect the people in the locality, specially their health and tranquil
family life. It is a fact that the company is taking steps for reducing the pollution. Infact the
respondents felt the company has undertaken some steps for reducing pollution which otherwise
will have a direct bearing on the health and well-being of people in the area.
Majority of the respondents reported that their income from the traditional job of fishing is
diminished. Though they are sparing more time compared to pre-mining period the income is
less. So, in the formulation of the R&R, this fact may be given much priority which will reduce
their anxiety as well as increase their standard of living.
A small portion of land in buffer zone are affected from the acidic leachate from the KMML
Titanium dioxide plant. In the affected area land utilization for agricultural purpose is
insignificant because of the loss in the fertility of the soil. They feel health issues are in the order
of increasing trend if management measures are not taken.
Take over the land with proper value is the main demand in addition to the following points:
1. The waste material is a source of iron. KMML may engage a reputed industry for taking
over the waste as a resource for producing steel.
2. Prevent Acid leak from storage pond by suitable technology/ or the leachate must be
treated in the ETP before discharge.
3. The operation of acid regeneration plant should be raised to maximum to reduce acid
purchase to subsequent treatment.
4. Look into option for alternate economic use of Iron oxide sludge by the company

5-25
5.6.3.3 ENVIRONMENTAL RADIOACTIVITY
The impact of mining project in terms of environmental radioactivity can only be
considered positive. The beach sand, rich in monazite deposits is the cause of anomalous
background radiation is mined and the beaches are refilled back through reclamation
with sands free of radiation. The mining activity will reduce the existing levels of
radiation and radioactivity. On the other hand it is expected to reduce the background
radiation level of the mined and refilled areas and thus the proposed action is expected to
have a net positive impact.
A) Risk hazard
KMML has adopted a mining method that has minimum of risks. The operations for
beach mining are conducted on the ground and it involves manual loading of heavy
mineral sands deposited by the wave action of the sea. Loading of sand on the trucks is
done semi mechanically . In dredge mining, the dredge works in an artificial pond and
the sand is dredged out from the pond. As the sand is collected by the cutter suction head,
more and more sand will slip into the pond and will be collected by the cutter suction
head. This will not pose any danger because the dredge is at a distance from any type of
structure. Any other method like manual mining, drilling and blasting would have caused
more dangers to man power and nearby structures. The mining methods deployed in
KMML are predominantly wet process.
5.6.4 Recommendations to mitigate environmental risks
5.6.4.1 Post mining land use and reclamation
In general, mining in India is conducted in land that belongs to the Government. In the
present instance almost all the land that is used for mining has been purchased by
KMML from persons who have absolute (JENMAM) rights over the land. Hence after
completion of the mining activity, KMML is free to utilise the mined out land as per the
desire of KMML / government. Being a Government owned company, the utilisation of
this land will be in line with Government directions. However, the decision will have to
be in consideration of the following factors:
The Mineral Separation Plant of the company is located in this block. The MS
plant will be required to continue its operations for treating sand mined in other blocks.

5-26
Beach washing Collection operations will continue because the reserves are being
replenished by the sea and will not exhaust when the inland deposit is mined out. The
MS plant will be required to process the Beach washing Collection product also.
In Beach washing Collection, there is no digging deep into the ground, only scraping the
accumulated ore. In dredge mining, the sand is loosened by the cutter head working
inside the water in the dredge pond. There is no generation of dust or vibration in both
these operations.
The operations are closely supervised by a team of competent personnel qualified to
perform these functions, by virtue of possessing the qualifications prescribed for the job
under Mines Act 1952. They include Mines mates possessing statutory Mines Mates
Certificate issued by Directorate General of Mines Safety (DGMS), Mines foreman with
Foreman certificate, Assistant Managers and Mines Managers with Mine Managers
Certificate issued by DGMS.
Total number of persons holding Certificates of competency from DGMS is shown in
table 5.9 . All the Registers required under Mines Act 1952, Mines Rules 1955 and
Metalliferous Mines Regulations 1961 are maintained here.
Additionally, the company has been working to improve the safety in mining by working
with DGMS and the workers unions. The company also has workmen inspectors and
they submit monthly reports on operational safety.
One possible environmental impact is the dust that could be raised during truck transport
of the ore and the rejects. To avoid dust generation, all haul roads are sprayed with water.
option of mitigation of dust in haul roads is to spray 35% CaCl2, which is effective for
mitigation of dust emissions. NIIST along with Pollution control board has proved this
method in a large clay mine in Trivandrum, as a feasible and cost effective solution. The
treatment applied is effective for 10 to 14 days in summer period for controlling of dust
emissions.

5-27
TABLE 5.9 NUMBER OF PERSONS HOLDING CERTIFICATES OF
COMPETENCY FROM DGMS
S. NO TYPE OF CERTIFICATE NUMBER OF HOLDERS
1 Mines mate 3
2 Mines Foreman 1
3 Second Class Mines Manager 4
4 First Class Mines Manager 3
5 Approved Electrical Supervisor 1
6 Approved Mechanical Engineer 1
5.7 EVALUATION BY BATTELLE ENVIRONMENTAL EVALUATION SYSTEM
(BEES)
The first step in this process is the identification of impacts which are likely to occur as a result
of this mining project. Environmental impact assessment process begins by identifying the
impacts due to mining and evaluation of impact with management plan conferred to the activities
of the mining site and a quantitative evaluation of different impacts. Based on the analysis no
major environmental impacts were observed except Socio-economic impact and minor impacts
on traffic, air quality and land use are anticipated. The probable impacts on the environment,
community, economy etc. are identified. Wherever possible, interrelationship and combined
effects are identified. The following proposed activity / parameters have been identified for
prediction of impacts due to the proposed plant.
For this project seven environmental parameters have been identified as the significant ones for
evaluation of impacts (Table 5.11). Battelle Environmental Evaluation system (BEES) is the
methodology used for evaluation of impacts. The parameters have been assigned with parameter
importance unit (PIU) based on the type of project. The objective measurement of the
environmental qualities prior to and after the implementation of the project, with and without
EMP and change in Environmental Impact Unit (EIU) are then presented into a subjective
interpretation of Environmental quality based on a scale of 1.0 for good quality and 0.0 for poor
quality (EQ).
Environnemental Impact unit (EIU) = (EQ) * (PIU)
Where, EIU= Environmental Impact Unit for the parameter

5-28
EQ = Environmental quality scale factor for the parameter
PIU= Parameter Importance units for the parameter
Table 5.10 : Values of environmental quality (EQ) factor
Sl no: Values on scale Environmental Quality
1 0.1 Unacceptable
2 0.2 Very Worst
3 0.3 Worst
4 0.4 Very Bad
5 0.5 Bad
6 0.6 Medium
7 0.7 Good
8 0.8 Very Good
9 0.9 Best
10 1 Excellent
This method evaluates the expected future condition of the environmental quality both “With”
and “Without” the project. A difference in Environmental Impact Units (EIU) between these two
conditions constitutes either an adverse impact, which corresponds to a loss in EIU or a
beneficial impact, which corresponds to a gain in EIU. The identified parameters have been
classified into four major categories i.e. Environmental Pollution, Ecological Environment,
Aesthetics & Human Interest.
In the present study, environmental pollution is the most affected among the other factors and
hence it is given a PIU value of 450 and the next affected parameter is human interest and so a
PIU value of 400 is adopted in this case. There are no significant impacts on ecological
environment. There are only minor impacts on the aesthetics of the area. A PIU value of 150 is
adopted for aesthetics.

5-29
Table 5.11 : Checklist of anticipated impacts due to the proposed Project
Sl.no.
Proposed activity/Parameter
IMPACTS
Negative No impact Positive
1 AIR QUALITY
i) KMML Mineral Separation
Plant plant emissions
**
ii) Fugitive emissions due to
loading / unloading / traffic
**
2 LAND Environment
Land cover **
Beach erosion **
Agriculture **
3 ECOLOGY
i) Terrestrial **
ii) Aquatic **
iii) Forestry – No forest land **
iv) Wild life- No wild life **
v) Fisheries **
4 WATER QUALITY
Lake / Sea area **
5 NOISE ENVIRONMENT **

5-30
5.7.1 Environmental Pollution
No major environmental pollution is anticipated during mining as this is carried out in wet
condition except traffic and fugitive emission due to transportation of concentrate. Suitable
control measures are suggested in the EMP to keep the dust emission levels within the prevalent
norms. No ground water is tapped.
Noise, air and water pollution shall be mitigated by curbing emissions at the source and other
management measures as suggested in EMP. Water sprinkling during construction and greenbelt
/ dunes proposed during post operational phase will take care of fugitive emissions. In summer
months chemical stabilisation shall be adopted for curbing emission on the roads inside the ML
area .The dunes proposed on the ML area will also give protection against sea erosion. In
addition groyns are proposed to curtail sea erosion. To eliminate traffic related issues, the
consultant recommends transportation of mineral to KMML from the mining area through barges
or country boats.
6 SOCIO-ECONOMIC
i) Change in social status **
ii) Change in economic
status
**
iii)Employment generation **
iv) Traffic **
v) Medical facilities **
vi) Infrastructural facilities **
7 Radiation **

5-31
5.7.2 Ecological Environment
No rare or endangered species exists and species found here are found in other parts of the core
area or buffer zone and likewise, there is no National park or wildlife sanctuary in the core area.
The project site consists of loose unconsolidated sandy soil with sparse vegetation. Mangroves
are found to exist as per CRZ mapping. There are a few patches of mangroves on the banks of
Vattakayal, the area of which is not large enough to map them in the scale used. The dredged
area will be filled by MRP rejects and well planned reclamation programme will ensure
improved land use pattern, improved crop yield, aesthetics and overall improvement.
5.7.3 Human interest
The following sections give the socio-economic impacts (on population growth, density,
aesthetics, standards of living, infrastructure etc.) likely as a result of the project.
During the mining phase:
short - term as well as long term employment opportunities
Table 5.12: Environmental Pollution (450)
Parameters PIU Existing EIU
(EQ*PIU)
After project
EIU with EMP
Change in
EIU with
EMP
EIU
without
EMP
Change in
EIU
without
EMP
Water 100 20 40 20 25 -5
Air 200 160 160 10 40 -110
Noise 50 25 20 -5 13 -12
Landuse
pattern 100 40 50 10 16 -24
Total
450
255
270
35
94 -151

5-32
improvement in socioeconomic status, communications and transportation sectors
local, long-term betterment of human welfare will take place;
Medical and drinking water supply facilities will improve the health of the people who are
directly or indirectly connected with the project.
Table 5.13: Human interest (400)
Parameters
PIU
Existing
EIU
(EQ*PIU)
After project
EIU
with
EMP
Change
in EIU
with
EMP
EIU
without
EMP
Change
in EIU
without
EMP
Economy output 60 18 30 12 12 -6
Employment 70 21 42 21 15 -6
Human welfare
schemes 60 24 36 12 16
-8
Overall
development 80 24 36 12 16
-8
Traffic 65 30 20 -10 13 -17
Radiation 65 13 45 32 26 13
TOTAL 400 130 209 79 98 -32
5-33
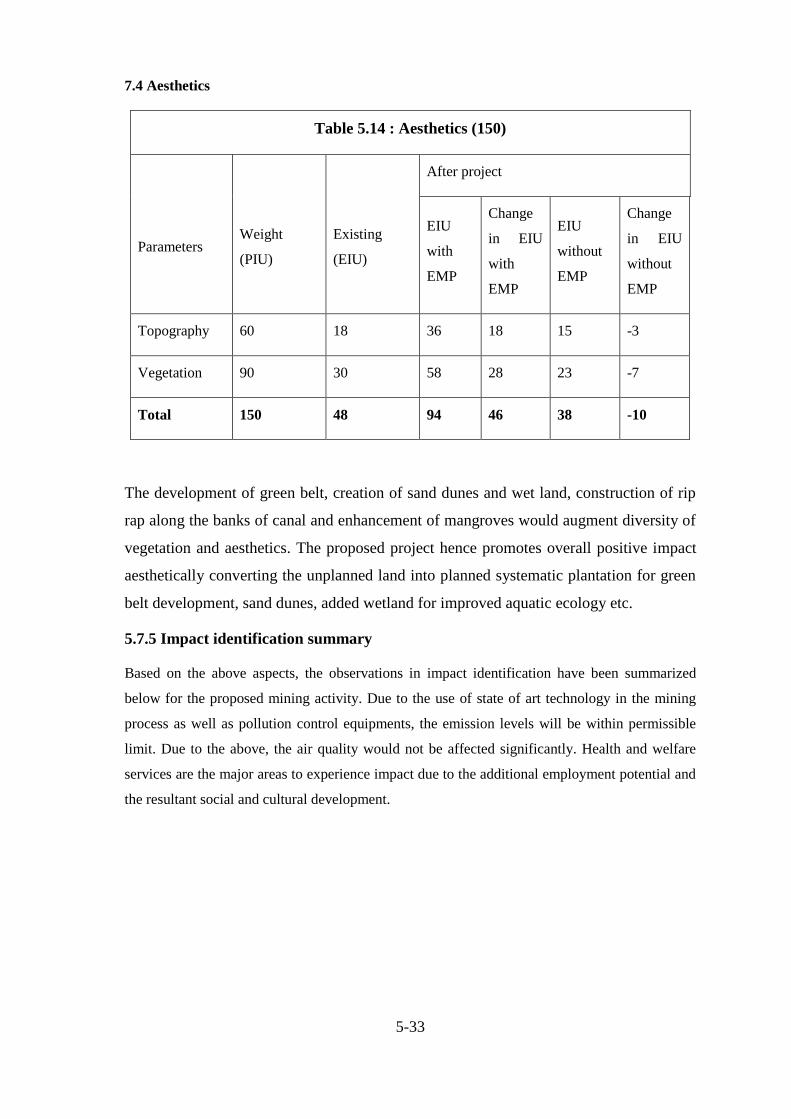
7.4 Aesthetics
Table 5.14 : Aesthetics (150)
Parameters
Weight
(PIU)
Existing
(EIU)
After project
EIU
with
EMP
Change
in EIU
with
EMP
EIU
without
EMP
Change
in EIU
without
EMP
Topography 60 18 36 18 15 -3
Vegetation 90 30 58 28 23 -7
Total 150 48 94 46 38 -10
The development of green belt, creation of sand dunes and wet land, construction of rip
rap along the banks of canal and enhancement of mangroves would augment diversity of
vegetation and aesthetics. The proposed project hence promotes overall positive impact
aesthetically converting the unplanned land into planned systematic plantation for green
belt development, sand dunes, added wetland for improved aquatic ecology etc.
5.7.5 Impact identification summary
Based on the above aspects, the observations in impact identification have been summarized
below for the proposed mining activity. Due to the use of state of art technology in the mining
process as well as pollution control equipments, the emission levels will be within permissible
limit. Due to the above, the air quality would not be affected significantly. Health and welfare
services are the major areas to experience impact due to the additional employment potential and
the resultant social and cultural development.

5-34
Table 5.15: Summary of Evaluation of Impacts
Sl.no. Category Weight (PIU)
Change in EIU
Without EMP With EMP
1 Environmental
Pollution 450 -151 35
2 Human interest 400 -32 79
3 Aesthetics 150 -10 46
Total 1000 -193 160

5-35
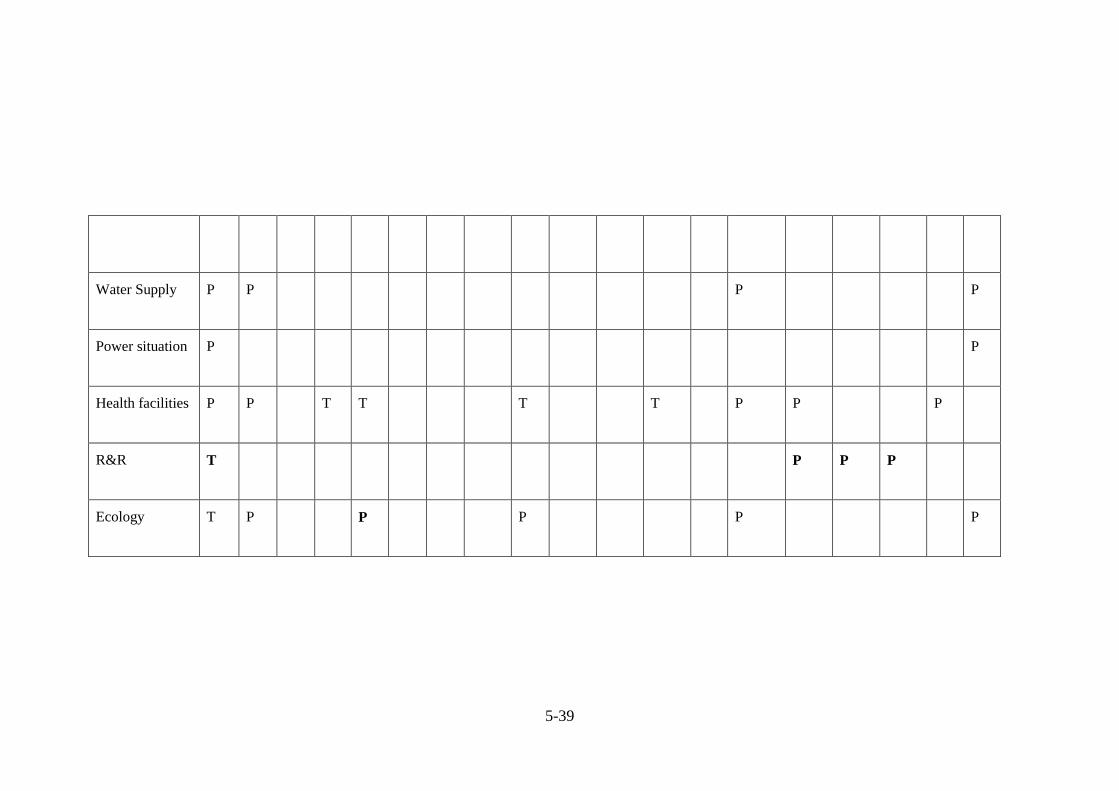
Table 5.16: Impact identification matrix during Mining operation
Identification
Matrix for
Operation Phase
P - permanent
impact
T - Temporary
impact
Environmental
parameters
Com
mis
sionin
g o
f m
inin
g e
quip
men
ts
Wat
er R
equir
emen
t
Eff
luen
t D
isch
arge
Gas
eous
Em
issi
ons
Fugit
ive
Em
issi
on
due
to t
raff
ic
Soli
d W
aste
D
isposa
l
Dre
dged
Mat
eria
l st
ora
ge
Raw
mat
eria
l H
andli
ng
Spil
ls a
nd L
eaks
Shut
dow
n/
Sta
rt o
ffs
Equip
men
t fa
ilure
Tra
ffic
Tra
nsp
ort
of
work
ers
Movem
ent
of
veh
icle
s
Med
ical
and o
ther
nee
ds
Educa
tional
nee
ds
Rec
reat
ional
n
eeds
Imm
igra
tion
Pow
er
nee
ds
Land use T P T T T P P
River water
Resources
P

5-36
Identification
Matrix for
Operation Phase
P - permanent
impact
T - Temporary
impact
Environmental
parameters
Com
mis
sionin
g o
f m
inin
g e
quip
men
ts
Wat
er R
equir
emen
t
Eff
luen
t D
isch
arg
e
Gas
eous
Em
issi
ons
Fugit
ive
Em
issi
on
due
to t
raff
ic
Soli
d W
aste
D
isposa
l
Raw
Mat
eria
l st
ora
ge
Raw
mat
eria
l H
andli
ng
Spil
ls a
nd L
eak
s
Shut
dow
n/
Sta
rt o
ffs
Equip
men
t fa
ilu
re
Tra
ffic
Tra
nsp
ort
of
work
ers
Movem
ent
of
veh
icle
s
Med
ical
and o
ther
nee
ds
Educa
tional
nee
ds
Rec
reat
ional
n
eed
s
Imm
igra
tio
n
Pow
er
nee
ds
Animal Life T
Groundwater
Resources
T T T
Odour Problem

5-37
Identification
Matrix for
Operation Phase
P - permanent
impact
T - Temporary
impact
Environmental
parameters
Com
mis
sionin
g o
f m
inin
g e
quip
men
t s
Wat
er R
equir
emen
t
Eff
luen
t D
isch
arg
e
Gas
eous
Em
issi
ons
Fugit
ive
Em
issi
on
due
to t
raff
ic
Soli
d W
aste
D
isposa
l
Raw
Mat
eria
l st
ora
ge
Raw
mat
eria
l H
andli
ng
Spil
ls a
nd L
eak
s
Shut
dow
n/
Sta
rt o
ffs
Equip
men
t fa
ilu
re
Tra
ffic
Tra
nsp
ort
of
work
ers
Movem
ent
of
veh
icle
s
Med
ical
and o
ther
nee
ds
Educa
tional
nee
ds
Rec
reat
ional
n
eed
s
Imm
igra
tio
n
Pow
er
nee
ds
Air Quality T P p T T P p
Solid Waste T T T T T
Noise T T T T P T P

5-38
Identification
Matrix for
Operation Phase
P - permanent
impact
T - Temporary
impact
Environmental
parameters
Com
mis
sionin
g o
f m
inin
g e
quip
men
ts
Wat
er R
equir
emen
t
Eff
luen
t D
isch
arg
e
Gas
eous
Em
issi
ons
Fugit
ive
Em
issi
on
Soli
d W
aste
D
isposa
l
Raw
Mat
eria
l st
ora
ge
Raw
mat
eria
l H
andli
ng
Spil
ls a
nd L
eak
s
Shut
dow
n/
Sta
rt o
ffs
Equip
men
t fa
ilu
re
Tra
ffic
Tra
nsp
ort
of
work
ers
Movem
ent
of
veh
icle
s
Med
ical
and o
ther
nee
ds
Educa
tional
nee
ds
Rec
reat
ional
n
eed
s
Imm
igra
tio
n
Pow
er
nee
ds
Human
Settlement
T T T P
Employment P P P P P
Infrastructure p P P
Culture P P P P
5-39
Water Supply P P P P
Power situation P P
Health facilities P P T T T T P P P
R&R T P P P
Ecology T P P P P P

5-40
Fig 5.7 Proposed road widening map between MSP
and TiO2 Fig 5.8 Distance of the buffer zone from the nearby
habitation

5-41
Fig 5.9 Proposed water transport route.