chapter 5. focus and · pdf file4 head, regional centre of the national institute for...
TRANSCRIPT

78 |
Chapter 5. Focus and perspectives
This focus section complements CropWatch analyses presented in chapters 1 through 4 by presenting
additional information about topics of interest to global agriculture. This issue includes an updated
production outlook for 2016 (5.1), a closer look at the situation in Morocco (5.2), a focus on agriculture in
Southwest Asian countries (5.3), and an update on El Niño (5.4).
5.1 Production outlook
Tables 5.1 and 5.2 present the current CropWatch estimate of 2016 crop production, based on a
combination of remote-sensing and trend-based projections. The information will be updated in the next
quarterly bulletin in November, including more actual information as it becomes available. Except for
wheat, of which the largest share is produced in the northern hemisphere as a winter crop,
approximately 80 percent of the total 2016 production has been harvested recently or is still growing.
Table 5.1. Summary of 2016 production estimates by major aggregates (thousand tons) and variation (%, compared with 2015) of maize, rice, wheat, and soybean
Maize Rice Wheat Soybean
2016 Δ% 2016 Δ% 2016 Δ% 2016 Δ%
Major producers 874897 0.8 639141 -4.3 622361 -0.6 287619 0.9
Minor producers 114783 5.1 74943 1.5 101099 3.2 21636 -8.7
All countries 989679 1.3 714084 -3.8 723460 -0.1 309255 0.1
Top 5 exporters 498413 0.8 254600 -8.0 248835 2.0 264606 1.0
Note: Major producers include China and the 30 countries listed in Chapters 3 (and table 5.2) for which CropWatch carries out a detailed qualitative and quantitative assessment of crop condition and production. Together, they represent more than 80% of the production and about 80% of exports of maize, rice, wheat and soybean. Refer to the note in table 5.2 for additional methodological detail. Minor producers include the 151 countries (from Afghanistan and Angola to Zambia and Zimbabwe). Country-wide productions for those minor producers are computed for each country based on trends derived from FAOSTAT data but aggregated in the table. “All countries" combines major and minor producers. The top-5 exporters are the countries listed by http://www.indexmundi.com/agriculture based on USDA data. The totals are based on table 5.2, except for soybean and Uruguay (the fifth largest producer), which is based on trends derived from FAOSTAT.
As illustrated in table 5.1, CropWatch currently estimates the production of 2016 to depart less than 1.5%
from the production of 2015 for maize (+1.3%), wheat (-0.1%), and soybean (+0.1%), while for rice a
marked drop of -3.8% is expected mainly as a result of adverse conditions in India. When considering only
the major producers, the situation is less favorable, as the bulk of the minor producers significantly
outperforms the major ones. The situation is slightly more favorable when the top five exporters are
considered: maize, wheat, and soybean supply is up by close to or more than 1% (0.8%, 2.0%, and 1.0%,
respectively). For rice the drop is 8%, which may result in some tension.
Large differences are sometimes observed between countries (for one crop) or between crops (within
one country). In general, between-country variability is largest for maize (-32 to +19%) and about
comparable for the three remaining crops (about -32% to +9%). For between-crop variability at the
national level, the size of the country, the number of seasons, and the diversity of eco-climatic conditions
play a major part. China is a perfect illustration with maize and soybean up 1% and rice and wheat down
1%. Other countries with low between-crop variability include Australia, Indonesia, Pakistan, Russia, and
the United States. High values occur in South Africa (-32% for maize and +9% for soybean, a relatively
minor crop in the country), Turkey (-16% for wheat, a winter crop, and +8% for soybean, a summer crop),
Canada (-5% for maize and +11% for wheat), and Myanmar where maize production increased 3% but

CHAPTER 5. FOCUS AND PERSPECTIVES | 79
rice dropped 17%, following a common behavior of rice production in Southern Asia. The pattern is the
result of the global agroclimatic patterns noted in Chapter 1 and section 3.1.
Table 5.2. 2016 national production estimates (thousand tons) and variation (%, compared with 2015) of maize, rice, wheat, and soybean of the maize producers
Maize Rice Wheat Soybean
2016 Δ% 2016 Δ% 2016 Δ% 2016 Δ%
Argentina 25710 1 1695 0 11630 -4 51080 -1
Australia 460 2 946 4 26631 5 93 6
Bangladesh 2377 6 48049 -5 1300 -1 71 2
Brazil 70433 -12 11055 -7 6713 -4 91774 2
Cambodia 852 2 8917 -6
Canada 11205 -5 34049 11 4995 -8
China 202016 1 200347 -1 118591 -1 13141 1
Egypt 5702 -4 6291 -4 10207 3 26 -5
Ethiopia 7784 19 136 8 4743 12 81 12
France 14619 -1 87 -5 37984 -3 149 2
Germany 4586 0 28106 3 15 18
India 16444 -13 144225 -7 86099 -6 10843 -11
Indonesia 18316 2 67906 0 891 1
Iran 2692 8 2763 9 16073 15 194 2
Kazakhstan 651 5 377 2 16852 5 247 10
Mexico 22335 -6 201 0 3550 -2 352 10
Myanmar 1776 3 23034 -17 197 3 159 -4
Nigeria 11597 11 4588 1 89 -2 680 5
Pakistan 4679 -4 9249 -2 24638 -1
Philippines 7565 0 19104 -2 1 3
Poland 3681 9 10418 0
Romania 11491 7 58 4 7675 7 164 3
Russia 12337 3 1017 3 53747 -1 2099 3
South Africa 9018 -32 3 0 1704 0 954 9
Thailand 5080 1 36644 -7 1 4 207 -3
Turkey 5920 0 943 3 19222 -16 168 8
Ukraine 30774 9 103 -7 23877 2 3799 2
United Kingdom 14076 -5
United States 359159 3 10340 4 57900 2 107362 1
Uzbekistan 405 7 377 7 6576 -2
Vietnam 5234 1 41448 -8 143 -10
Major producers 874897 0.8 639141 -4.3 622361 -0.6 287619 0.9
Minor producers 114783 5.1 74943 1.5 101099 3.2 21636 -8.7
All countries 989679 1.3 714084 -3.8 723460 -0.1 309255 0.1
Notes: See the note for table 5.1 for a definition of major (those listed in this table) and minor producers. Boldfaced numbers given for a country above are CropWatch estimates based on national statistics and remote sensing data. Other numbers are trends-based and computed from FAOSTAT data. The CropWatch estimates are based in part on current information and enjoy a larger degree of confidence than the trend-based projections. The last three lines are similar to those in table 5.1.
Maize
As mentioned, CropWatch foresees large differences among the performances of national maize
productions. The very large drop (-32%) in South Africa can clearly be assigned to the prevailing drought,
which was already mentioned in previous CropWatch bulletins. Similarly, the poor performance in India (-

80| CROPWATCH BULLETIN AUGUST 2016
13%) and Brazil (-12%) can be assigned to unfavorable agroclimatic conditions, specifically floods and
drought. Positive departures worth mentioning include those in Bangladesh (+6%), where the production
has been growing fast over several years now, Kazakhstan (+5%), and Uzbekistan (+7%), Ukraine and
neighboring Poland (9% and 7%, respectively), as well as Iran (+8%) and Ethiopia (+19%). If the increase
can be confirmed for the latter country by later estimates, it will provide welcome relief after a previous
season badly affected by drought.
Rice
Major producers from west to Southeast Asia suffered a drop in rice production largely associated with a
combination of drought and excess precipitation, either locally or through the discharge of rivers that
respond to rainfall in distant areas. In addition to India (-13%), which was already mentioned above, the
following countries show marked estimated production drops: Vietnam -8%, Thailand -7%, Cambodia -6%,
Bangladesh -5%, Pakistan and the Philippines, -2% and China, -1%. Myanmar and Indonesia stand out
with +3% and no change with 2015, respectively. Increases are noted for the United States (+4%) and Iran
(+9%).
Wheat
The largest decrease is estimated in Turkey (-16%), India (-6%), as well as in Argentina and Brazil (-4%
each). Large positive values among the major producers are those of Canada (+11%), Romania (+7%), and
Australia (+5%). Similar to the situation with rice and maize noted above, Iran and Ethiopia are also
expected to have good harvests of wheat (+15% and +12%, respectively).
Soybean
Due to changes in policy, China is forecast to increase soybean production by 1%, the first positive
departure in more than a decade. Russia and Ukraine are both consolidating their role as significant
soybean producers with 3% and 2% production growth. Among the leading producers, Argentina is put at
-1%, due to large excess precipitation, while Brazil and the United States are both increasing their output
over 2015, by 2% and 1%, respectively. Significant drops that may affect international markets include
Canada (-8%) and India (-11%). When considering population growth, the Indian soybean production
deficit is about 1.5 million tons. Added to the production drops of maize (2.4 million tons), rice (10.6
million tons), and wheat (5.3 million tons), the shortfall is significant.
5.2 Local stories: Drought in Morocco
R. Balaghi4and R. Gommes
Introduction
Chapters 1 and 3.1 (figures 1.1 and 3.1) have mentioned the overall pattern of excess precipitation that
has affected a huge mass of land, extending from the northern half of Africa across the Middle East to
central Asia and adjacent areas in southern and eastern Asia. Good indications exist of links between the
Moroccan climate, the North Atlantic Oscillation (NAO), and El Niño (Ward et al. 1999, Knippertz 2003,
Knippertz et al. 2003), but the connection between such a continent-wide anomaly and the latest El Niño
4 Head, Regional Centre of the National Institute for Agronomic Research (INRA) in Morocco; [email protected].
CHAPTER 5. FOCUS AND PERSPECTIVES | 81
is not ascertained. The pattern, however, is very compatible with global warming as Petit-Maire and
other researchers have observed an association between warmer conditions in the semi-arid areas from
Africa to Asia and warming at all time scales, from geological to daily scales (Petit-Maire 1992, 1999; Guo
et al. 2000).
Morocco normally enjoys a relatively uniform Mediterranean climate with mild and wet winters, well
suited for winter crops. Interestingly, during the current season, the western Mediterranean experienced
a marked precipitation shortfall centered on Spain and Morocco, where the deficit reached 68% between
July 2015 and July 2016. The pattern identified by Petit-Maire thus did not apply to Morocco this season.
In fact, Morocco’s climate has been known to be very variable and somewhat deviant compared with the
central and eastern Mediterranean.
This case study presents a closer look at the reported drought in Morocco as assessed by both CropWatch
and the Moroccan cereal crop Monitoring and forecasting system, CGMS-Morocco.
The current drought as assessed by CropWatch indices
CropWatch national indices (RAIN, TEMP, RADPAR, and BIOMSS) have clearly identified the current
Moroccan drought starting from the early stages of the latest growing season (table 5.3).
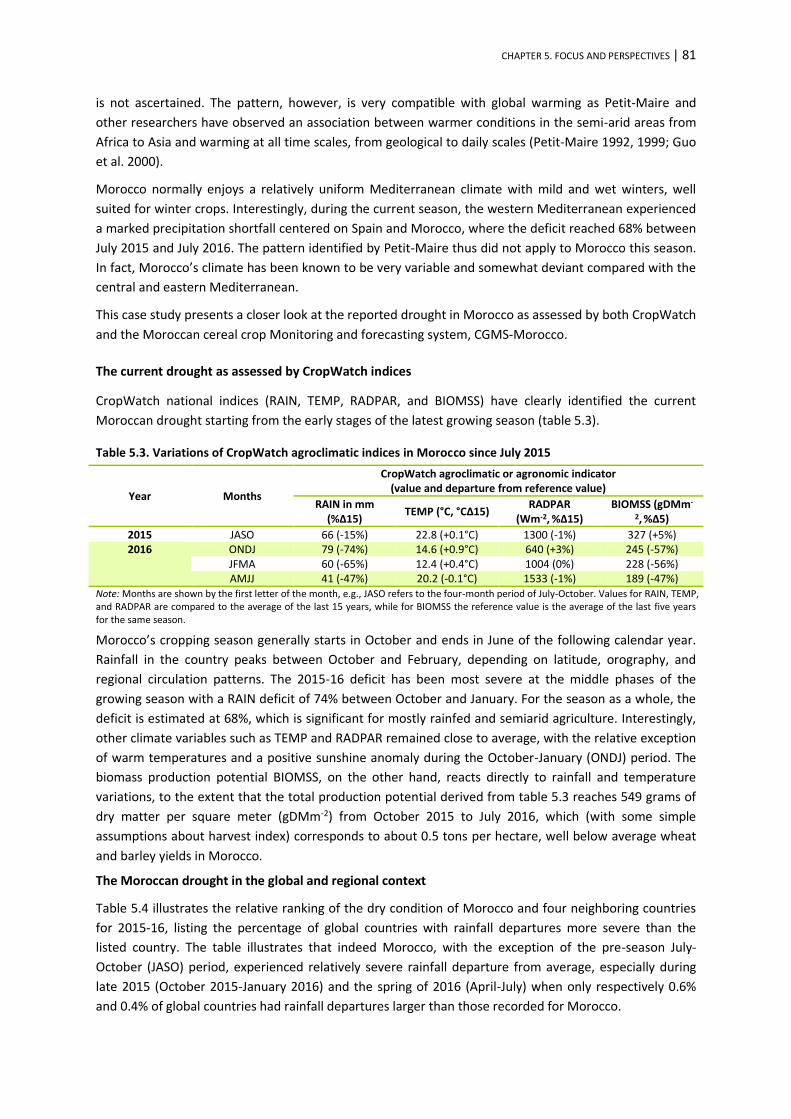
Table 5.3. Variations of CropWatch agroclimatic indices in Morocco since July 2015
Year Months
CropWatch agroclimatic or agronomic indicator (value and departure from reference value)
RAIN in mm (%Δ15)
TEMP (°C, °CΔ15) RADPAR
(Wm-2, %Δ15) BIOMSS (gDMm-
2, %Δ5)
2015 JASO 66 (-15%) 22.8 (+0.1°C) 1300 (-1%) 327 (+5%) 2016 ONDJ 79 (-74%) 14.6 (+0.9°C) 640 (+3%) 245 (-57%)
JFMA 60 (-65%) 12.4 (+0.4°C) 1004 (0%) 228 (-56%) AMJJ 41 (-47%) 20.2 (-0.1°C) 1533 (-1%) 189 (-47%)
Note: Months are shown by the first letter of the month, e.g., JASO refers to the four-month period of July-October. Values for RAIN, TEMP, and RADPAR are compared to the average of the last 15 years, while for BIOMSS the reference value is the average of the last five years for the same season.
Morocco’s cropping season generally starts in October and ends in June of the following calendar year.
Rainfall in the country peaks between October and February, depending on latitude, orography, and
regional circulation patterns. The 2015-16 deficit has been most severe at the middle phases of the
growing season with a RAIN deficit of 74% between October and January. For the season as a whole, the
deficit is estimated at 68%, which is significant for mostly rainfed and semiarid agriculture. Interestingly,
other climate variables such as TEMP and RADPAR remained close to average, with the relative exception
of warm temperatures and a positive sunshine anomaly during the October-January (ONDJ) period. The
biomass production potential BIOMSS, on the other hand, reacts directly to rainfall and temperature
variations, to the extent that the total production potential derived from table 5.3 reaches 549 grams of
dry matter per square meter (gDMm-2) from October 2015 to July 2016, which (with some simple
assumptions about harvest index) corresponds to about 0.5 tons per hectare, well below average wheat
and barley yields in Morocco.
The Moroccan drought in the global and regional context
Table 5.4 illustrates the relative ranking of the dry condition of Morocco and four neighboring countries
for 2015-16, listing the percentage of global countries with rainfall departures more severe than the
listed country. The table illustrates that indeed Morocco, with the exception of the pre-season July-
October (JASO) period, experienced relatively severe rainfall departure from average, especially during
late 2015 (October 2015-January 2016) and the spring of 2016 (April-July) when only respectively 0.6%
and 0.4% of global countries had rainfall departures larger than those recorded for Morocco.

82| CROPWATCH BULLETIN AUGUST 2016
Table 5.4. Percent rank precipitation in Morocco and neighboring countries
Mauritania Morocco Portugal Spain Algeria
2015 JASO 93.4 41.0 7.2 15.7 91.0 2016 ONDJ 90.8 0.6 4.9 6.7 22.7
JFMA 96.3 4.3 17.7 21.3 10.4 AMJJ 99.3 0.4 26.5 13.2 39.1
Note: Table lists the percentage of 173 countries worldwide with relatively drier conditions than the listed country (that is, Mauritania, Morocco, Portugal, Spain, or Algeria). For example, a percent rank of 5.0% for a given country means that 95.0% of countries worldwide had rainfall departures less severe than the listed country.
None of the neighboring countries reached any comparable situation for the same duration, even if
Portugal and Spain were also among the world’s driest (in relative terms) between October and January.
Strikingly, Mauritania, which belongs to the West African Sahelian group of countries, was one of the
wettest countries.
Although correlations between anomalies in Morocco and in neighboring countries are weak (figure 5.1),
even between Morocco and Algeria or Spain and Portugal, it appears that the variability is even larger
between the western Mediterranean and neighboring areas, in particular Europe.
Figure 5.1. CropWatch RAIN indicator departure from the fifteen-year average for Morocco and neighboring countries for overlapping four-month periods between July 2015 and July 2016 (percentage)
Note: Maps are extracted from the current and previous CropWatch bulletins. Different color coding is used for 2015 July-October (JASO) (left) and 2016 October-January (ONDJ), January-April (JFMA), and April-July (AMJJ) periods (right).
A closer look at rainfall variability over space and time in Morocco
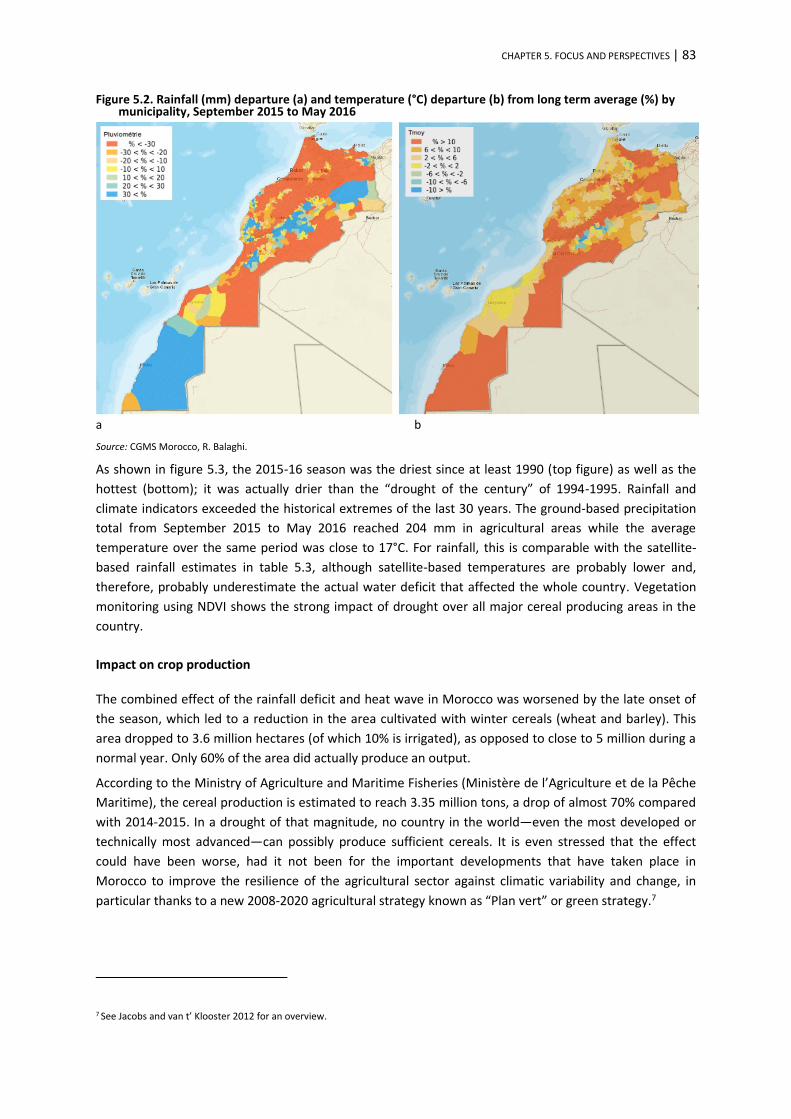
Figure 5.2 illustrates the spatial distribution of rainfall (figure a) and temperature (b) departures by
municipality from September 2015 to May 2016, as interpolated from a national network of ground
weather stations and by the Moroccan cereal crop Monitoring and Forecasting System, CGMS-Morocco.5
Most of the country was confronted with a severe rainfall deficit (over 30%), especially in northern zones
where agricultural areas are located. Rainfall was above normal only in mountainous zones and some
parts of the eastern high plateaus. However, in these latter areas rainfall is generally not well spatialized,
since very few stations exist. Temperature departure from the long term average was very high across
the country and especially in mountainous zones and southern agricultural areas, which had
consequences for crop tree cultivation, in particular of rosaceae (such as apples, pears, and medlars). The
combination of rainfall deficit and temperature increase has led to a significant water balance deficit all
over the country. Moroccan agriculture has been confronted with similarly severe conditions repeatedly
over its history,6 corresponding to 20 dry years over the last 70 years or 1 dry year every third.
5 The detailed data in this section and figures 5.2-5.4 are generated using the Moroccan cereal crop Monitoring and forecasting system, CGMS-Morocco. See www.cgms-maroc.ma and refer to Balaghi et al. 2013 for details. 6 For instance in 1944-45, 1948-49, 1949-50, 1960-61, 1965-67, 1972-73, 1974-75, 1980-81, 1982-83, 1983-84, 1986-87, 1991-92, 1992-93, 1994-95, 1996-97, 1998-99, 1999-2000, 2004-2005, 2006-2007 et 2007-2008.
CHAPTER 5. FOCUS AND PERSPECTIVES | 83
Figure 5.2. Rainfall (mm) departure (a) and temperature (°C) departure (b) from long term average (%) by municipality, September 2015 to May 2016
a b
Source: CGMS Morocco, R. Balaghi.
As shown in figure 5.3, the 2015-16 season was the driest since at least 1990 (top figure) as well as the
hottest (bottom); it was actually drier than the “drought of the century” of 1994-1995. Rainfall and
climate indicators exceeded the historical extremes of the last 30 years. The ground-based precipitation
total from September 2015 to May 2016 reached 204 mm in agricultural areas while the average
temperature over the same period was close to 17°C. For rainfall, this is comparable with the satellite-
based rainfall estimates in table 5.3, although satellite-based temperatures are probably lower and,
therefore, probably underestimate the actual water deficit that affected the whole country. Vegetation
monitoring using NDVI shows the strong impact of drought over all major cereal producing areas in the
country.
Impact on crop production
The combined effect of the rainfall deficit and heat wave in Morocco was worsened by the late onset of
the season, which led to a reduction in the area cultivated with winter cereals (wheat and barley). This
area dropped to 3.6 million hectares (of which 10% is irrigated), as opposed to close to 5 million during a
normal year. Only 60% of the area did actually produce an output.
According to the Ministry of Agriculture and Maritime Fisheries (Ministère de l’Agriculture et de la Pêche
Maritime), the cereal production is estimated to reach 3.35 million tons, a drop of almost 70% compared
with 2014-2015. In a drought of that magnitude, no country in the world—even the most developed or
technically most advanced—can possibly produce sufficient cereals. It is even stressed that the effect
could have been worse, had it not been for the important developments that have taken place in
Morocco to improve the resilience of the agricultural sector against climatic variability and change, in
particular thanks to a new 2008-2020 agricultural strategy known as “Plan vert” or green strategy.7
7 See Jacobs and van t’ Klooster 2012 for an overview.

84| CROPWATCH BULLETIN AUGUST 2016
Figure 5.3. Comparison of 2015-16 (September to May) rainfall (top) and temperature (bottom) in blue, compared to all other years (in green) since 1990-91
Note: The blue bar indicates the amount of rainfall (in mm, top figure) and temperature (in °C, bottom) between September 2015 and May 2016. Green bars represent all other years since 1990-91. Source: CGMS Morocco, R. Balaghi.
Finally, the rainfall accumulation similarity graph (figure 5.4) compares 2015-16 with the previous driest
years on record since 1990, which are 1995-96, 1992-93, 2006-2007, 1998-99, and 1991-92. It appears
that from the end of December, 2015-16 overtook the previously most severe drought year 1998-99.
From February to March the current season was similar to 1994-95, and from March 2015-16 remained
drier than any previous season on record since 1990-91.
Figure 5.4. Rainfall accumulation similarity graph comparing 2015-16 (black, lowest curve) with the 5 previous driest cropping seasons, since 1991 (year of the harvest)
Conclusions
Morocco is not one of the countries that monitored in detail by CropWatch. Nevertheless, the CropWatch
indicators correctly picked out Morocco as one of the most severe droughts cases of 2015-16, probably
more severe than South Africa where CropWatch has put the maize production drop at 32%. The RAIN

CHAPTER 5. FOCUS AND PERSPECTIVES | 85
indicator, in particular, performs particularly well, while TEMP is less efficient in capturing the heat wave
that accompanied the drought. This case study also stresses that the large anomalies which CropWatch
has been stressing as important global monitoring features also hide the fact that neighboring countries
sometimes behave rather differently, resulting in isolated food deficit spots which deserve close scrutiny.
Finally, the case study nicely illustrates the complementarity between global crop monitoring systems
such as CropWatch and the Moroccan Crop Growth Monitoring System.
5.3 Focus: Southwest Asia
Introduction
Southwest Asia (figure 5.5) is spatially organized around India (IND) and includes the countries from
Pakistan (PAK) to Bangladesh (BGD) as well as Nepal (NPL) and Bhutan (BHU) in the north and Sri Lanka
(LKA) in the south. Most of the north of India, Nepal, and Bhutan belongs to the Indo-Gangetic plain,
named after the Indus (Pakistan) and Ganges (India) rivers, where elevation rarely exceeds 250 meter.
The common delta of three of Asia's largest rivers (the Ganges, the Brahmaputra, and the Meghna)—and
one of the largest deltas in absolute terms8—is where Bangladesh is located, resulting in the country’s
rather peculiar lithology in which sediments predominate and “hard stone” is a rare occurrence (except in
some peripheral areas such as the Chittagong Hills in the southeast). Punjab (meaning, “land of five
rivers”9) constitutes the west of the low-lying areas of the Indo-Gangetic plain, which is delimited to the
west by the Baluchistan plateau along the Iranian (IRN) border. Beyond the Indo-Gangetic crescent,
elevation rises rapidly to the north in the Himalayan foothills and to the south of India, centered around
the Deccan Plateau at elevations around 500 meter. In Sri Lanka, elevations are highest in the south,
which markedly affects and conditions climate and agricultural patterns.
Just over one-fifth of the world population lives in southwest Asia, where India, Pakistan, and Bangladesh
are among the eight most populated countries in the world. Together with Europe and the eastern Gulf
of Guinea, southwestern Asia also includes some of the highest national population densities (table 5.5):
With more than 1100 people per square kilometer, Bangladesh has the record of the most densely
populated non-urban country in the world. The high density also accounts for the country’s large fraction
of arable land (60%, followed by India at 53% and, to a lesser extent, by Pakistan with 39%). In all three
countries, the values point at a relative shortage of land when compared with other countries in the
region.
With the exception of Pakistan, where 2015 population growth rates remain close to 2% (2.1%), all other
countries in the region now have rates close to 1% (1.2% in Bangladesh, India, and Nepal) or below (0.9%
in Sri Lanka.10 For the sake of comparison with some agricultural production statistics, table 5.5 shows the
increase of population over the last 12 years or so (percentage change between the averages of 1998-
2002 and 2010-2014). Among all countries, Pakistan shows the largest population growth (31%) and Sri
Lanka the smallest (9%). The contradiction between the World Bank growth rates and the FAO data
reflects a well-known debate about Bhutanese population statistics,11 involving population movements
from neighboring countries and cultural issues.
8 https://en.wikipedia.org/wiki/Bangladesh 9 https://en.wikipedia.org/wiki/Punjab_(region) 10 World Bank, http://data.worldbank.org/indicator 11 http://worldpopulationreview.com/countries/bhutan-population/ and http://countrystudies.us/bhutan/18.htm.

86| CROPWATCH BULLETIN AUGUST 2016
Figure 5.5. General setting (a) and topography (b) of Southwest Asia
(a) (b)
Note: The map demonstrates Southwest Asia's neighbors (Iran, IRN; Afghanistan, AFG; China, CHN; Myanmar, MMR) as well as some major subdivisions for India (IND) and Pakistan (PAK): SD, Sind; PJ, a province of Punjab in Pakistan and an Indian state; AP, Andhya Pradesh; AS, Assam; KT, Karnataka; MP, Madhya Pradesh; MH, Maharashtra; RJ, Rajasthan; UP, Uttar Pradesh; and TN, Tamil Nadu. The sovereignty of J&K, Jammu, and Kashmir, is unsettled.
Altogether, in spite of its very high population densities, Bangladesh is doing well in terms of food supply,
with cereal production growing faster than population (44% vs 20%) and the highest per capita cereal
production (343 kg per year). In India, values are comparable (25% vs 21%), while the situation is most
favorable in Sri Lanka (49% vs 9%). This last country, which has often been used to illustrate a successful
family planning policy12 (Abeykoon, 2011), also displays increases in agricultural production that well
exceed population growth, especially for soybean and maize (in terms of under-nutrition levels (25%),
however, the country is comparable with other countries in the region). Bangladesh too has massively
switched to maize, mostly at the expense of pulses and in particular spring wheat, which is a traditional
crop in the region but with a lower production potential than maize under the prevailing climate.
Agricultural environment
Most areas of Southwest Asia suffer from large rainfall deficits when compared with potential
evapotranspiration (PET), particularly for some water demanding crops such as maize or rice for which
water requirements exceed PET by 20% to 50% (figure 5.6(a)). As shown in the same figure, the region is
also characterized by some of the wettest climates in the world (e.g., in northeast India and the western
Ghats bordering the Deccan Plateau on the southwestern coast of India) where low temperature due to
elevation contributes to low PET. Capture of monsoon rainfall by the Himalayan relief constitutes the
main source of water for the Indo-Gangetic plain. Particularly for southern Pakistan, where near-desert
prevails in most of Sind province, the combination of high sunshine with a usually reliable water supply
and a pest and disease adverse low air moisture, constitute a very favorable environment for crops.
Together, India, Pakistan, and Bangladesh make up the largest contiguous area of irrigated agriculture in
the world. If central Asia and China (Yangtze) are also considered, the rivers that flow from the Himalayas
contribute to feeding about 20% of the global population (Allison, 2012). Because of this, however, and as
illustrated in recent CropWatch bulletins, floods are among the major hazards affecting the region. Some
traditional varieties of rice (e.g., the floating rice type known as B-aman in Bangladesh) are adapted to
12 http://archives.dailynews.lk/2003/12/02/new18.html

CHAPTER 5. FOCUS AND PERSPECTIVES | 87
floods with stem elongations that can sometimes reach 20 cm per day, but they cannot easily
accommodate modern farming techniques, including the development of high yielding varieties.
Table 5.5. Some basic statistics for Bangladesh (BDG), Bhutan (BHU), India (IND), Nepal (NPL), Pakistan (PAK) and Sri Lanka (LKA)
BGD BHU IND NPL PAK LKA Source
Population Million in 2015 155 0.743 1263 28 177 20 (1)
% change 20 33 21 17 31 9 (1)
Density (people/km2)
1117 20 394 180 241 309 (5)
GDP/capita 2011-2015 US$ 3123 7816 6020 2374 4811 11739 (2)
Males employed in agriculture (2014)
% of labor force 42 33 49 n.a. 38 29 (2)
Females employed in agriculture (2014)
% of labor force 68 63 71 n.a. 67 35 (2)
Agricultural production % GDP in 2014 16- 18- 17- 34- 25= 9- (2)
Agricultural land % total land area 70- 14+ 61= 29+ 47= 44+ (6)
Arable land % total land area 60 3 53 15 39 21 (6)
Land equipped for irrigation (LEI, 2007)
% agricultural land 55 3 32 28 70 24 (3)
Land actually irrigated, 2011 % of LEI 100 28 94 100 100 84 (4)
Water used for agriculture, 2011 % renewable water available
2 0.5 36 4 70 21 (4)
Cereal production (2009-2013) 1000 tons 53323 165 287384 8797 35864 4206 (7)
% change 44 25 25 28 28 49 (7)
Kg/person 343 222 227 320 202 206 (7)
Rice production % change 45 62 22 15 −5 44 (1)
Rice area % change 9 −16 −2 −4 11 30 (1)
Wheat Production % change −39 −50 26 54 29 n.a. (1)
Maize production % change 3029 15 91 46 162 528 (1)
Soybean production % change n.a. −63 106 59 −99 771 (1)
Oilcrops production % change 15 −46 56 32 30 9 (1)
Pulses production % change −34 62 34 29 −8 3 (1)
Potato production % change 216 41 90 119 104 39 (1) Notes: Population % change refers to the % change between the 1998-2002 average and the 2010-2014 average when available (otherwise, the second period was taken as 2009-2013); -, + and = signs after numbers indicate that the variable is decreasing, stable or increasing; n.a. stands for "not available" or "meaningless." Sources: (1) FAOSTAT or computed based on FAOSTAT (http://faostat3.fao.org/); (2) World Bank, http://data.worldbank.org/indicator; (3) http://data.un.org/Data.aspx; (4) FAO/Aquastat http://www.fao.org/nr/water/aquastat/maps/World-Map.ww.trwr_eng.htm and http://www.fao.org/nr/water/aquastat/water_use_agr/ IrrigationWaterUse.pdf; (5) https://en.wikipedia.org/wiki/List_of_countries_and_territories_by_population_density; (6) World Bank (same as 2). Agricultural land includes rangeland and forests, while arable land is normally cultivated with temporary crops (i.e., field crops as opposed to trees); (7) same source as (1); 2010-14 averages were used instead of 2009-2013 when available.
The annual water balance of the region undergoes marked seasonal changes from the temperate
mountains in the north to the equatorial highlands in Sri Lanka. In India, Nepal, and Pakistan, seasons are
often referred to as either Rabi or Kharif, with Rabi including mostly rainfed winter crops grown from
October to March (wheat, sesame, various Brassicas, and temperate legumes) and Kharif describing
rainfed summer crops in monsoon areas or irrigated crops, from May to November (rice, sugarcane,
cotton, maize, soybean, and tropical legumes). In Bangladesh, rice is grown throughout the year under
different scenarios of water control in three seasons: early monsoon Aus season (March-July), late
monsoon Aman (July-December), and mostly irrigated Boro season (January -June) (Dey and Norton
1992). In Sri Lanka, cropping seasons tend to be similar to those in maritime Southeast Asia; they are
commonly referred to as Maha (greater monsoon), sown between August and October and harvested

88| CROPWATCH BULLETIN AUGUST 2016
five or six months later, and Yala, sown between April and May and harvested about four or five months
later.13
Figure 5.6. Difference (mm) between annual rainfall and potential evapotranspiration (Rain-PET) (a) and percentage of crops in each pixel irrigated (b)
(a) (b)
Source: (a) Maps prepared based on Climond rainfall (Hijmans et al., 2005) and on PET computed from New_locClim (Grieser et al, 2006); (b) Based on GMIA data (FAO, 2016).
Cropping patterns in Southwest Asia are also very diverse, conditioned by factors such as the level of
water control (for example, flooded but rainfed lowland rice, river or ground-water irrigated rice, upland
rice, or aerobic rice), the period of limiting river and precipitation water or temperature conditions, and
the period of rainfall availability (from 0 months per year in Sind, Pakistan to 12 months in southern Sri
Lanka).
With the exception of Pakistan, countries use a moderate amount of their renewable water resources for
agriculture (less than 5% in Bangladesh, Bhutan, and Nepal; 21% in Sri Lanka; and 70% in Pakistan), under
land availability constraints in most countries. Cropping intensities can be high as in Indian and Pakistani
Punjab and Bangladesh, locally exceeding two crops per year. According to Wu et al (2015), room still
exists to increase production by reducing cropping intensity gaps, currently in the range of 0.1 to 0.5 in
Southwest Asia.
Production patterns and some trends
Production patterns in the region show large variations between countries, with wheat playing a major
role in India, Pakistan, and Nepal, and rice dominating the agricultural landscape in Bangladesh and Sri
Lanka (figure 5.7). Vegetables, fruits, and potatoes are ubiquitous. Due to the vegetarian tradition, pulses
occupy a larger, but still limited share of the food basket in India; a sizeable fraction is for export. In
general, crop distributions are more climate-conditioned than policy or market driven. India and Pakistan
are similar in many respects; the level of undernutrition is close to 20% in both, and the level of
mechanization is comparable too, with 15 to 20 tractors/1000 ha.14 For instance, both countries produce
large quantities of sugarcane (their main production in terms of fresh weight, even if the corresponding
amounts of sugar are well below the national cereal production levels) and import large amounts of oil,
13 http://countrystudies.us/sri-lanka/51.htm 14 FAOSTAT, http://faostat3.fao.org/faostat-gateway/go/to/home/E

CHAPTER 5. FOCUS AND PERSPECTIVES | 89
mostly from Southeast Asia. Milk, and milk products, are high in the diet. India and Pakistan differ mainly
in the relative importance of rice and wheat in their diet, and trade wheat (as well as potatoes) play a
larger role in Pakistan while India relies more on rice. For the remaining countries, rice plays a dominant
role, stressing the fact that Pakistan is the country of transition from western Asian and middle-eastern
culture, diets, and agriculture (starting with Iran), to southern Asian.
An interesting feature is the limited share of maize in Bangladesh and Sri Lanka when considering (see
table 5.5) that the crop is currently undergoing a remarkable increase in production. Soybean is growing
fast in India and Sri Lanka but decreasing in Pakistan where, according to M. Hanif (personal
communication), the crop is suffering from competition with new varieties of maize, as well as potatoes
(increasing everywhere), which produce a significantly higher income for farmers than soybeans. This is
not unlike the situation in China, Korea, and Japan where soybean appeals little to farmers in a context
where ample international supply of the crop is available.
Figure 5.7. Distribution of maize and wheat (a), rice (b), and potato and soybean (c), and national production patterns of main crop groups (d) in Southwest Asian countries
(a) (b) (c)
(d)
Note: Figure (a) illustrates main maize (yellow), wheat (pink), and maize + wheat (orange) production areas; Figure (b) includes main rice production areas; and (c) shows main potato (grey) and soybean (orange) producing areas. Figure (d) presents the relative share of various crop groups (excluding sugar) in Southwest Asia. See also the note for table 5.6. Source: Crop distribution maps are based on JRC crop masks, Vancutsem et al 2013; Figure (d) is based on FAOSTAT data.
Imports and exports
The southwestern Asian countries are no major exporters of primary agricultural commodities (rice,
wheat, maize, other cereals, potatoes, other roots-tubers, pulses, vegetables, fruits, soybean and other
oil crops, and textile fibers; table 5.6), with the exception of rice, animal feeds, and maize in India, and
wheat, potatoes and, to a lesser extent, rice in Pakistan. The most populated countries have also become
importers of pulses (India) and wheat (Bangladesh). One of the main exports of Bangladesh is fiber crops,
which is actually mostly jute and some cotton products. All countries, especially the larger ones, are
importers of oil. Due to its equatorial climate, Sri Lanka differs markedly from other countries by the role
of tea and rubber among its exports. Finally, due to the large Bhutan National Potato Program (Roder et
al, 2007), the crop has become a dominant export item in the country.

90| CROPWATCH BULLETIN AUGUST 2016
Table 5.6. Amounts (million tons) of agricultural imports and exports
Imports Exports
IND BGD PAK NPL LKA BHU IND BGD PAK NPL LKA BHU
List 1 5.24 6.22 3.25 0.94 1.77 0.09 19.67 0.44 6.6 0.1 0.83 0.07
List 2 0.8 1.22 0.98 0.15 1.26 0.03 9.24 0.01 0.71 0.09 0.2 0.01
Note: List 1 includes the crops (fiber crops to rice listed in figure 5.7; list 2 includes beverages, milk products, animal feeds, meat and sugar. In list 1, wheat includes wheat products as wheat equivalent; other cereal= total cereals less rice, wheat and maize; other roots-tubers = total roots and tubers minus potatoes; fruits include nuts; other oil crops computed from total primary oil crops (main oil crops) less soybeans. According to http://www.fao.org/es/faodef/fdef06e.htm#6.01, soybeans are part of primary oil crops but soybean values exceed oil crops some years.
5.4 El Niño
EI Niño has continued decaying during the second quarter of 2016. The eastern tropical Pacific sea
surface temperatures have cooled rapidly between January and July 2016 based on the Optimum
Interpolation Sea Surface Temperature (OISST), and temperatures are predicted to remain cool but
average until the first quarter of 2017 according to forecasting models15 at the Beijing Climate Center
(figure 5.8).
Figure 5.8. Tropical Pacific SSTA (Forecasted and Monitored datasets)
Source: http://cmdp.ncc-cma.net/download/ENSO/Variables_evolution/ENSO_SSTA_Patterns_O7P7_20160501.png
15 Climate System Model version 1.1 (BCC_CSM1.1).

CHAPTER 5. FOCUS AND PERSPECTIVES | 91
Figure 5.9. Monthly SOI-BOM time series for July 2015 to July 2016
Source: http://www.bom.gov.au/climate/current/soi2.shtml
Figure 5.9 illustrates the behavior of the standard Southern Oscillation Index (SOI) of the Australian
Bureau of Meteorology (BOM) from July 2015 to July 2016. During the current season, SOI has increased
rapidly from -22.0 in April to +2.8 in May and kept a positive value in June and July, indicating neutral
conditions of EI Niño and the possibility of a weak La Niña in 2017. NOAA confirms both this neutral
condition and that La Niña is slightly favored to develop with the cool tropical Pacific waters (figure 5.10).
Both BOM and NOAA issued a La Niña watch, stating conditions are weak for La Niña to emerge in late
2016 and early 2017. In the next few months, CropWatch will keep a close eye on the development of La
Niña and the regions that show sensitivity to this event.
Figure 5.10. Sea surface temperature difference from average temperature, July, 2016
Source: Climate.gov.