chapter 5: 5.0 data analysis and result 5
TRANSCRIPT

148
CHAPTER 5:
5.0 DATA ANALYSIS AND RESULT
5.1 Introduction
Chapter Five discusses the result of data analysis of the study. For the purpose of the data
analysis, Statistical Package for Social Science (SPSS) version 15.0 was employed. This
chapter deals with the analysis to investigate the relationship between supply chain
management practices, supply chain integration and supply chain performance using data
collected during the field survey. The earlier part of this chapter reinforces the framework
of analysis and hypotheses development. The following part is the descriptive statistical
analysis and inferential statistical analysis of the main variables which are supply chain
management practices, supply chain integration and supply chain performance. In its final
part, this chapter presents the empirical evidence about relationship between supply chain
management practices, supply chain integration and supply chain performance.
5.2 Response Rate
The total population size for this study will be 900 firms from electronics manufacturing
industry (MIDA, 2008). Based on the recommended sample size for the above population
size (Sekaran, 2003), about 269 questionnaires were distributed, 121 sets were returned, of
which 113 responses were useful for analysis. Eight questionnaires were discarded because
the respondents did not answer at least a minimum of 25 percent of the questions. In terms
of some of the unanswered questions, the average score was assigned to manage blank
responses (Sekaran, 2003). Due to constraints such as difficulty to contact respondents and
most of them were busy, the action above was proposed. This response received represents
42 percent of the proposed sample size.
149
In addition, to circumvent sample bias from the perspective of questionnaire distribution
method, Roscoe, (1975), suggested that the appropriate response rate should be more than
10 percent. For effective analysis at least a minimum of 30 percent responses must be
collected (Sekaran, 2003). In this study, the response rate is 42 percent. Hence, sample bias
is absent and the responses received can be assumed to represent the population. The higher
percentage of response is the result of having the supporting documents (i.e.
recommendation letter) from the Malaysian Logistics and Supply Chain Association
(MLSCA).
In terms of determining the relevant statistical analysis for the available sample size, there
were no specific guidelines. Nonetheless, it is suggested that multiple regression would be
the best method in examining the quality of the measurement and examining predictive
relationship simultaneously be conducted when the sample size is based on the ration of the
number of variables and observation 1:5 (Johnson & Wichern, 1998). Based on this
requirement, the minimum number of respondents was 60 samples. Since the sample size of
the current study is 113; multiple regressions can be used to test if there is support for the
proposed model.
5.3 Non-Response Bias
In the survey, it is important that the sample collected should represent the population under
study (Veera & Chandran, 2010). This is crucial as inferences are made to generalize the
findings of this study. The existence of a good response rate in this research provides some
confidence that the response bias is not a significant problem (Weiss & Heide, 1993).
150
Nevertheless non-response bias was tested by assessing the difference between the early
and late respondents.
The extrapolation technique was employed to test the likelihood of non-response, equating
late responses to non-respondents(Armstrong & Overton, 1977) cited by (Cousins &
Menguc, 2006). This was carried out by splitting the total sample into two groups; i] sample
respondent received before the second wave of mailing (n = 64), and ii] sample respondent
received after the second wave (n = 49). In order to compare these two groups in terms of
the mean responses on each variable, t-test was used. The results revealed no significant
differences between the two groups. As a result, the study respondents were not different
from non-respondents. For example, the study found that there was no statistically
significant difference (at α = 0.05) between respondents and non-respondents based on the
mean scores of the constructs used such as supplier strategic partnership (t = .85; p = .68);
customer relationship (t = .98; p = .43); information sharing (t = -1.15; p = .38); information
quality (t = 1.37; p = .24); internal lean practices (t = 0.35; p = 0.40); postponement (t = .50;
p = .41); agreed vision & goals (t = -.89; p = .37); risk & reward sharing (t = -.78; p = .36);
supply chain integration (t = -.89; p = .37); supply chain performance (t = -.89; p = .40) and
based on responses to such demographic characteristics as business description (t = -.35; p
= .64); operating experience (t = -.81; p = .54); numbers of employee (t = -.05; p = .85);
annual sales (t = -.49; p = .51).

151
5.4 Data Screening
Data screening is an important preliminary process before analyzing any data for the
purpose of research. This is to ensure the data is clean from several elements, namely,
missing data and outliers (Johnson & Wichern, 1998).
5.4.1 Detection of Missing Data
Missing data were reduced as much as possible by checking all the questionnaires at the
time of collection. When any questions were found unanswered it was either brought to
attention of respondent by telephone or discarded. Since all the data entered into SPSS,
before any tests were conducted using the data set, frequency distribution for each variable
in the study as well as missing value analysis were run to ensure the data were clean, The
result indicated that there was no missing data.
5.4.2 Detection of Outliers
Outliers as an observation with a unique combination of characteristics identifiable as
distinctly different from the other observations (Hair, Anderson, Tatham, & Black, 1998). It
is important to make a distinction between outliers that ought to be deleted and those that
ought not to be. Outliers that required deletion are recorded missing, incorrect data entry,
unusual data and data from respondents who are not members of the intended population
(Tabachnick & Fidell, 2001). For this study, maximum and minimum extreme values for all
the study variables were produced using SPSS. A visual inspection of the data revealed that
the data were free from outliers.
152
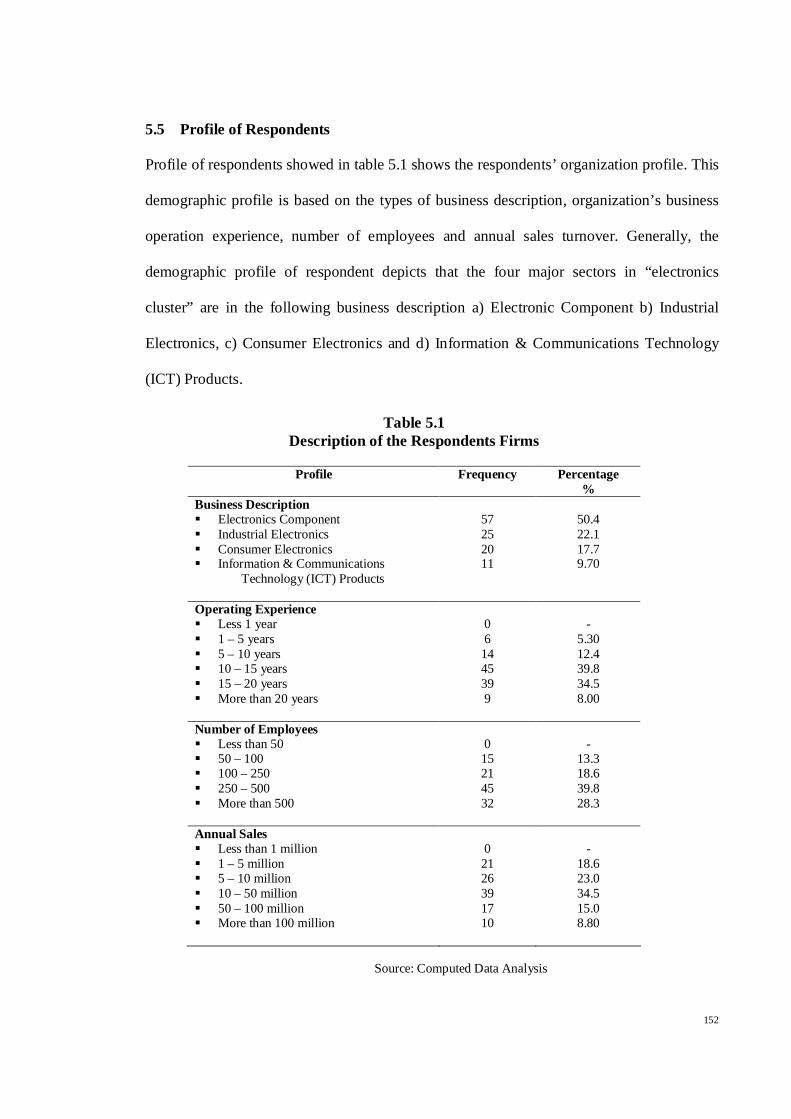
5.5 Profile of Respondents
Profile of respondents showed in table 5.1 shows the respondents’ organization profile. This
demographic profile is based on the types of business description, organization’s business
operation experience, number of employees and annual sales turnover. Generally, the
demographic profile of respondent depicts that the four major sectors in “electronics
cluster” are in the following business description a) Electronic Component b) Industrial
Electronics, c) Consumer Electronics and d) Information & Communications Technology
(ICT) Products.
Table 5.1 Description of the Respondents Firms
Profile
Frequency Percentage
% Business Description Electronics Component Industrial Electronics Consumer Electronics Information & Communications
Technology (ICT) Products
57 25 20 11
50.4 22.1 17.7 9.70
Operating Experience Less 1 year 1 – 5 years 5 – 10 years 10 – 15 years 15 – 20 years More than 20 years
0 6 14 45 39 9
-
5.30 12.4 39.8 34.5 8.00
Number of Employees Less than 50 50 – 100 100 – 250 250 – 500 More than 500
0 15 21 45 32
-
13.3 18.6 39.8 28.3
Annual Sales Less than 1 million 1 – 5 million 5 – 10 million 10 – 50 million 50 – 100 million More than 100 million
0 21 26 39 17 10
-
18.6 23.0 34.5 15.0 8.80
Source: Computed Data Analysis

153
The majority of the firms’ respondents are from electronic component product
manufacturing firms which constitute 50.4 percent of firm’s business types. The
semiconductor sub-sector accounts for the largest share of electronic components
manufacturing, followed by passive component and display devices. Then the majority of
the firms’ respondents are from northern and southern region of Malaysia. The command
numbers of employees are mostly above 250 employees. Almost all the selected firms for
this study are between 5 to 20 years of operational experience.
5.6 Normality Test
This study test for the symmetric nature and peakedness / flatness for the data set using the
shape descriptors, skewness and kurtosis, respectively. A variety of opinions can be found
concerning the acceptable level of skewness (the symmetry of a distribution) and kurtosis
(the clustering of scores toward the centre of a distribution) for a particular variable (George
& Mallery, 2003; Morgan, Griego, & Gloekner, 2001).

154
Table 5.2: Skewness and Kurtosis Analysis
N Skewness Kurtosis Construct / Dimension
Statistics Statistics Std. Error Statistics Std. Error Strategic Supplier Partnering
113 -0.867 0.227 0.704 0.451
Customer Relationship 113 -0.309 0.227 1.672 0.451
Information Sharing 113 -0.731 0.227 -0.273 0.451
Information Quality 113 -0.508 0.227 -0.394 0.451
Postponement 113 -0.558 0.227 -0.400 0.451
Internal Lean Practices 113 -0.081 0.227 -0.464 0.451
Agreed Vision & Goals 113 -0.045 0.227 0.049 0.451
Risk & Reward Sharing 113 -0.387 0.227 0.018 0.451
Supply Chain Integration
113 -0.733 0.227 0.723 0.451
Flexibility Performance 113 -0.876 0.227 0.748 0.451
Resource Performance 113 -0.777 0.227 0.509 0.451
Output Performance 113 -0.374 0.227 0.105 0.451
Source: Computed Data Analysis
Table 5.2 shows the skewness test and kurtosis test of all constructs (e.g. strategic supplier
partnering, customer relationship management, information sharing, information quality,
internal lean practices, postponement, agreed vision and goals, risk and reward sharing,
supply chain integration, flexibility performance, resources performance and output
performance.
The skewness value for measurement item ranges from -0.081 to -0.876, are well within the
recommended range of -1 to +1 (Hair, Black, Babin, Anderson, & Tatham, 2006). Kurtosis
value for measurement item ranges from -0.273 to +1.672, are well within the

155
recommended range of -2 to +2 (Carlos & Anil, 1980). As such, the test indicates that this
result has been revealed having data of normal distribution.
To uphold the validity and reliability of analysis, the normal probability plot is examined.
Hair, et al., (2006) also suggested using P-P plots to check the linear relationship of
variables. The normal plot of regression standardized residual for the dependent variable
indicates a relatively normal distribution.
5.7 Correlation Matrix
The interpretation of the strength of correlation was based on the description provided by
Davis, (1971). The description is as follows:
if r is 1.0, the magnitude is perfect;
if r is 0.85 – 0.99, the magnitude is very high;
if r is 0.70 – 0.84, the magnitude is high;
if r is 0.50 – 0.69, the magnitude is substantial;
if r is 0.30 – 0.49, the magnitude is moderate;
if r is 0.10 – 0.29, the magnitude is low; and
if r is 0.01 - 0.09, the magnitude is negligible.
5.7.1 Multicollinearity Test
To test multicollinearity, the correlation matrix of the variables was studied to identify the
occurrence of multicollinearity. The correlation coefficient is a measure of the closeness of

156
the relationships or association between independent and dependent variables (Hair, et al.,
1995). Multicollinearity problem exists when the independent variables are too highly
correlated, for instance Pearson’s r between each pair of independent variables does not
exceed 0.85 (Hair, et al., 1995). The results (see Table 5.3) indicate that none of the squared
correlations was close to 0.85 to suggest a problem with multicollinearity among the
research variables. Therefore, there is no evidence of significant multicollinearity among
the research variables.
5.7.2 Correlation Matrix between Variables
Table 5.3 shows the correlation matrix between variables. Strategic supplier partnering has
positive (significant) correlation with customer relationship (r = 0.333). This positive
correlation indicates that the supply chain members in the electronics manufacturing
industry do translate the customer’s requirement into the formulation of strategic supplier
partnering. As such, to successfully translate customers need into supplier partnering, there
is the need for significant information quality exchange (r= 0.512) and information sharing
(r=0.448) among manufacturer and suppliers. Through thorough information dissemination
and strategic supplier partnering, it is possible to have process streamlining, eliminate waste
and apply internal lean practices. This is proven with significant positive correlation of
strategic supplier partnering and internal lean practices (r=0.356). In addition, strategic
supplier partnering has positive correlation with commonly agreed vision and goals among
supply chain members (r=0.364) and weak positive correlation with risk and reward sharing
(r=0.135). Further, the close relationship with suppliers enables the manufacturer to
conduct product customization through production modularity in the content of
postponement (r=0.462). Moreover, strategic supplier partnering significantly correlate with

157
supply chain integration (r=0.406), flexibility performance (r=0.482), resources
performance (r=0.412) and output performance (r=0.273).
Customer relationship management has positive correlation with information sharing
(r=0.259) and information quality (r=0.137). This means information exchange and its
quality plays an important role in nurturing manufacturer-customer relationship.
Subsequently, internal lean practices (r=0.243) and postponement (r=0.248) has significant
positive correlation with customer relationship management which indicates customer
involvement in internal lean quality improvement program and distribution proximity to
customer. In addition, customer relationship management has positive correlation with
commonly agreed vision and goals among supply chain members (r=0.494) and weak
positive correlation with risk and reward sharing (r=0.092). Further, the close relationship
with customer enables the manufacturer to understand customer requirement better and to
give importance to postponement practices (r=0.248). Moreover, customer relationship
management significantly correlate with supply chain integration (r=0.239), flexibility
performance (r=0.329), resources performance (r=0.211) and output performance
(r=0.201).
Information sharing and information quality do compliment interchangeably due to its
common objective to furnish the supply chain members with reliable and timely
information to achieve successful business transaction. Therefore the information sharing
and information quality do have significantly strong correlation (r=0.605). The internal
supply chain management practices within a manufacturing focal firm such as internal lean
practices and postponement needs strong coordination across functional department. As

158
such information sharing and information quality became a prerequisite for internal lean
practices (r=0.551; r=0.475) and postponement (r=0.748; r=0.578). In addition, information
sharing and information quality have positive correlation with commonly agreed vision and
goals among supply chain members (r=0.335; r=0.207) and weak positive correlation with
risk and reward sharing (r=0.128; r=0.108). Moreover, information sharing and information
quality significantly correlates with supply chain integration (r=0.671; r=0.549), flexibility
performance (r=0.742; r=0.521), resources performance (r=0.634; r=0.527) and output
performance (r=0.658; r=0.483).
Since both internal lean practices and postponement are embedded within the context of
internal supply chain management practices, there is a significant correlation between these
two practices (r=0.624). However, internal lean practices have significant positive
correlation with commonly agreed vision and goals among supply chain members (r=366)
and weak positive correlation with risk and reward sharing (r=0.051). In addition, internal
lean practices have significant positive correlation with supply chain integration (r=0.363),
flexibility performance (r=0.462), resources performance (r=0.349) and output performance
(r=0.399). Similarly with internal lean practices, postponement has significant positive
correlation with commonly agreed vision and goals among supply chain members (r=0.389)
and weak positive correlation with risk and reward sharing (r=0.084). In addition,
postponement has significant positive correlation with supply chain integration (r=0.571),
flexibility performance (r=0.584), resources performance (r=0.521) and output performance
(r=0.587).

159
Unfortunately, the agreed vision and goals is not in tandem with risk and reward sharing
system in the electronic manufacturing firms. This gives both of the practices a weak and
insignificant correlation (r=0.143). However agreed vision and goals has significant
positive correlation with supply chain integration (r=0.358), flexibility performance
(r=0.434), resources performance (r=0.331) and output performance (r=0.313). Risk and
reward sharing generally do not show significant correlation with any dimensions of study
such as supply chain integration (r=0.117), flexibility performance (r=0.174), resources
performance (r=0.119) and output performance (r=0.086).

160
Table 5.3: Correlations among the Subscales of the Constructs
Source: Computed Data Analysis
SSP CRM IS IQ ILP PST VISN RISK SCI FP RP
CRM 0.333**
IS 0.448** 0.259**
IQ 0.512** 0.137 0.605**
ILP 0.356** 0.243** 0.551** 0.475**
PST 0.462** 0.248** 0.748** 0.578** 0.624**
VISN 0.364** 0.494** 0.335** 0.207* 0.366** 0.389**
RISK 0.135 0.092 0.128 0.108 0.051 0.084 0.143
SCI 0.406** 0.239* 0.671** 0.549** 0.363** 0.571** 0.358** 0.117
FP 0.482** 0.329* 0.742** 0.521** 0.462** 0.584** 0.434** 0.174 0.738**
RP 0.412** 0.211* 0.634** 0.527** 0.349** 0.521** 0.331** 0.119 0.844** 0.587**
OP 0.273** 0.201* 0.658** 0.483** 0.399** 0.587** 0.313** 0.086 0.752** 0.526** 0.701**
*** Correlation is significant at the 0.01 level ** Correlation is significant at the 0.05 level * Correlation is significant at the 0.05 level
161
5.8 Construct Validity
Construct validity is a method intended to select a relevant subset of items from a pool of
measurement items or questions. These items are based upon criteria of uniqueness. In
addition, they include the ability to convey different shades of meaning to respondents
through expert opinion and statistical method. The statistical method, evaluated by using (1)
principal component analysis as the extraction technique and (2) varimax as the method of
rotation in order to perform construct validity (Churchill, 1979).
5.8.1 Principal Component Analysis
In social science research study, construct validity is used to measure the validity of the
instruments in the survey questionnaires. Tu, (2002), reiterated that in order to validate the
instrument, apart from content validity, a research study should also give importance to
construct validation. Statistically, the construct validity can be measured and evaluated by
using principal component analysis as the extraction technique and varimax as the method
of rotation.
The ability of items to measure the same construct is demonstrated with higher factor
loadings (with a cut-off loading of 0.40) on a single component and eigenvalues greater
than 1.0. Further, Kaiser-Meyer- Olkin (KMO) measures of sampling adequacy is used as
the indicator to determine good dimension. KMO varies from 0 to 1.0 and KMO overall
should be 0.60 or higher to proceed with factor analysis (Norzaidi, Chong, Murali, & Intan
Salwani, 2007). Besides, the Kaiser-Meyer-Olkin (KMO) and Bartlett’s test for Sphericity
measure of sampling adequacy indicated a practical level of common variance.

162
Table 5.4 Kaiser-Meyer-Olkin (KMO)
and Bartlett’s test for Sphericity Measures
Construct KMO test Bartlett’s test (sig.) Strategic Supplier Partnering 0.779 0.00
Customer Relationship 0.669 0.00
Information Sharing 0.851 0.00
Information Quality 0.747 0.00
Postponement 0.720 0.00
Internal Lean Practices 0.634 0.00
Agreed Vision and Goals 0.655 0.00
Risk and Reward Sharing 0.629 0.00
Supply Chain Integration 0.753 0.00
Flexibility Performance 0.787 0.00
Resource Performance 0.887 0.00
Output Performance 0.885 0.00
Source: Computed Data Analysis
Table 5.4 shows all measures of those factors which are higher than recommended KMO
cut-off point of 0.60. This indicates the sampling adequacy for a satisfactory factor analysis
to proceed and Bartlett’s test shows all factors were significant which means that the
correlation matrix is an identity matrix. In short, this suggests that the inter-correlation
matrix contains enough common variance to make factor analysis worth pursuing.

163
5.8.2 Exploratory Factor Analysis
The main objective of factor analysis is to reduce the number of variables and to detect the
structure of the relationships among variables. There are a few methods in conducting factor
analysis, with principal components and maximum likelihood being the most popular
methods of parameter estimation (Kerlinger, 1973). Among these methods, the most
frequently used approach is the principal components analysis using varimax rotation
(Emory & Cooper, 1991). The idea of rotation is to reduce the number of factors on which
the variables under investigation have high loadings. Rotation does not actually change
anything but makes the interpretation of the analysis easier (Johnson & Wichern, 1998).
Since the items selected for this study were innumerable, factor analysis was conducted in
order to reduce the items into sizable factors, thus, enabling valid measures to be developed
for items associated with the impact of middle manager’s performance.
In order to conform to the requirements for a satisfactory factor analysis results, both
methods, such as principal components analysis using varimax rotation and maximum
likelihood, were used in the study. An item with low item-total correlation indicates that the
item is not drawn from the same domain and should be deleted to reduce error and
unreliability (Nunnally, 1978). Therefore, eigenvalues and variance explained (%) are
considered important values in factor analysis. Dimensions with similar loading on two
factors and dimensions with loading less than 0.40 were removed because loadings above
0.60 are usually considered high and those below 0.40 are low (S. C. Chong, 2006). The
following sections discuss the results of factor analysis for independent, intervening and
dependent variables.

164
5.8.3 Independent Variable Exploratory Factor Analysis – Supply Chain
Management Practices
The factor analysis was conducted on the items related to eight independent variables that
measure strategic supplier partnering, customer relationship management, information
sharing, information quality, internal lean practices, postponement, agreed vision and goals
and risk and reward sharing. Dimensions are ordered and grouped by size of loading to
facilitate interpretation. Principal component extraction used prior factors extraction to
estimate the number of factors, presence of outlier, absence of multicollinearity and
factorability of the correlation matrices (May, 2002). The following sections explain the
factor analysis for supply chain management practices.
5.8.3.1 EFA for Strategic Supplier Partnering
The ten items of supply chain management practices [SCMP] loaded onto one factor. The
factor contains ten items of which an eigenvalue of 5.81 and explained 58.52 percent of the
total variation. The factor loading are all more than 0.40, hence no item is removed. This
factor is labeled as ‘’Strategic Supplier Partnering” [SSP]. Table 5.5 provides an analysis of
construct validity testing on strategic supplier partnering.

165
Table 5.5: Exploratory Factor Analysis for Independent Variables:
Strategic Supplier Partnership
Items Factor SSP1 0.552 SSP2 0.670 SSP3 0.639 SSP4 0.539 SSP5 0.839 SSP6 0.698 SSP7 0.573 SSP8 0.440 SSP9 0.431
SSP10 0.555
Eigenvalue 5.81 Variance [%] 58.52
Source: Computed Data Analysis
5.8.3.2 EFA for Customer Relationship
The eight items of supply chain management practices [SCMP] loaded onto one factors.
The factor contains eight items of which an eigenvalue of 5.40 and explained 67.55 percent
of the total variation. The factor loading are all more than 0.40, except item CRM6 is
recommended to drop because of their values which are lower than the cut-off point
(>0.40). This factor is labeled as ‘’Customer Relationship” [CRM]. Table 5.6 provides an
analysis of construct validity testing on customer relationship.

166
Table 5.6: Exploratory Factor Analysis for Independent Variables:
Customer Relationship
Items Factor CRM1 0.688 CRM2 0.652 CRM3 0.687 CRM4 0.633 CRM5 0.684 CRM6 0.074 CRM7 0.595 CRM8 0.530
Eigenvalue 5.40
Variance [%] 67.55
Source: Computed Data Analysis
5.8.3.3 EFA for Information Sharing
The seven items of supply chain management practices [SCMP] are loaded onto one factor.
The factor contains seven items of which an eigenvalue of 4.30 and that explained 61.45
percent of the total variation. The factor loading are all more than 0.40, hence no item is
removed. This factor is labeled as ‘’Information Sharing” [IS]. Table 5.7 provides an
analysis of construct validity testing on information sharing.

167
Table 5.7: Exploratory Factor Analysis for Independent Variables:
Information Sharing
Items Factor IS1 0.777 IS2 0.776 IS3 0.846 IS4 0.708 IS5 0.831 IS6 0.795 IS7 0.746
Eigenvalue 4.30
Variance [%] 61.45
Source: Computed Data Analysis
5.8.3.4 EFA for Information Quality
The five items of supply chain management practices [SCMP] loaded on to one factor. The
factor contains five items of which an eigenvalue of 3.23 and that explained 64.51 percent
of the total variation. The factor loading are all more than 0.40, hence no item is removed.
This factor is labeled as ‘’Information Quality” [IQ]. Table 5.8 provides an analysis of
construct validity testing on strategic supplier partnering.
Table 5.8:
Exploratory Factor Analysis for Independent Variables: Information Quality
Items Factor IQ1 0.758 IQ2 0.810 IQ3 0.784 IQ4 0.860 IQ5 0.801
Eigenvalue 3.23
Variance [%] 64.51
Source: Computed Data Analysis
168
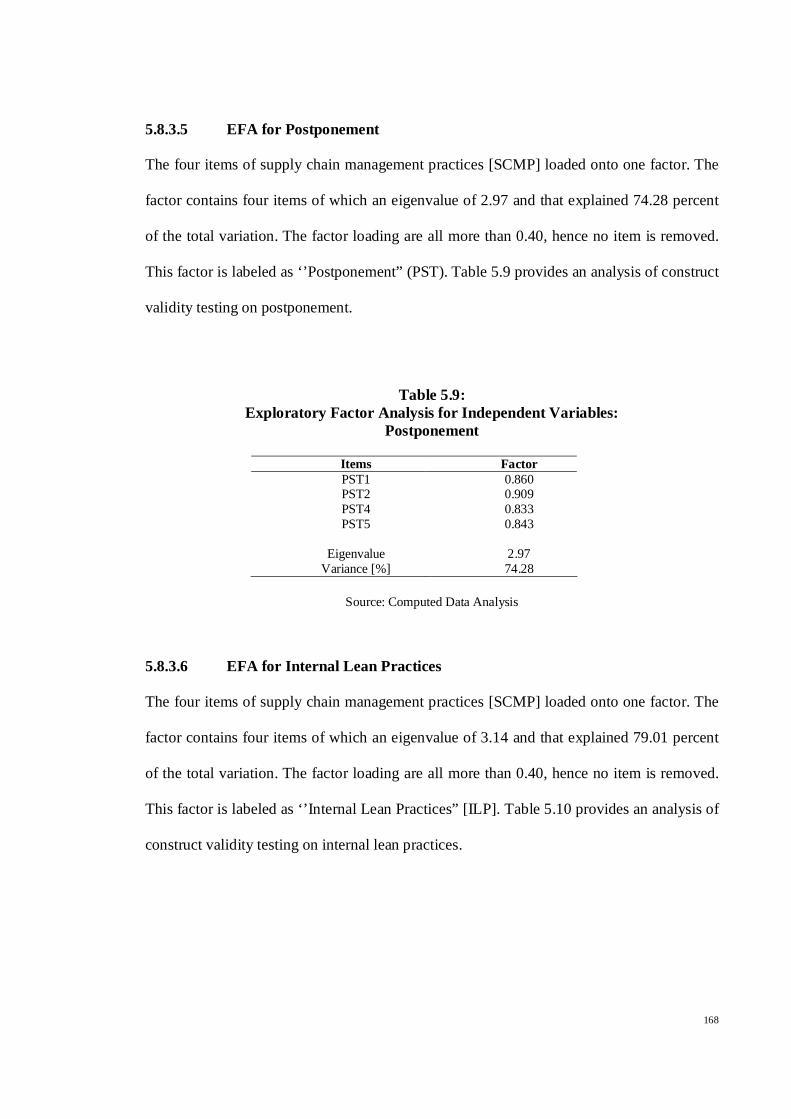
5.8.3.5 EFA for Postponement
The four items of supply chain management practices [SCMP] loaded onto one factor. The
factor contains four items of which an eigenvalue of 2.97 and that explained 74.28 percent
of the total variation. The factor loading are all more than 0.40, hence no item is removed.
This factor is labeled as ‘’Postponement” (PST). Table 5.9 provides an analysis of construct
validity testing on postponement.
Table 5.9: Exploratory Factor Analysis for Independent Variables:
Postponement
Items Factor PST1 0.860 PST2 0.909 PST4 0.833 PST5 0.843
Eigenvalue 2.97
Variance [%] 74.28
Source: Computed Data Analysis
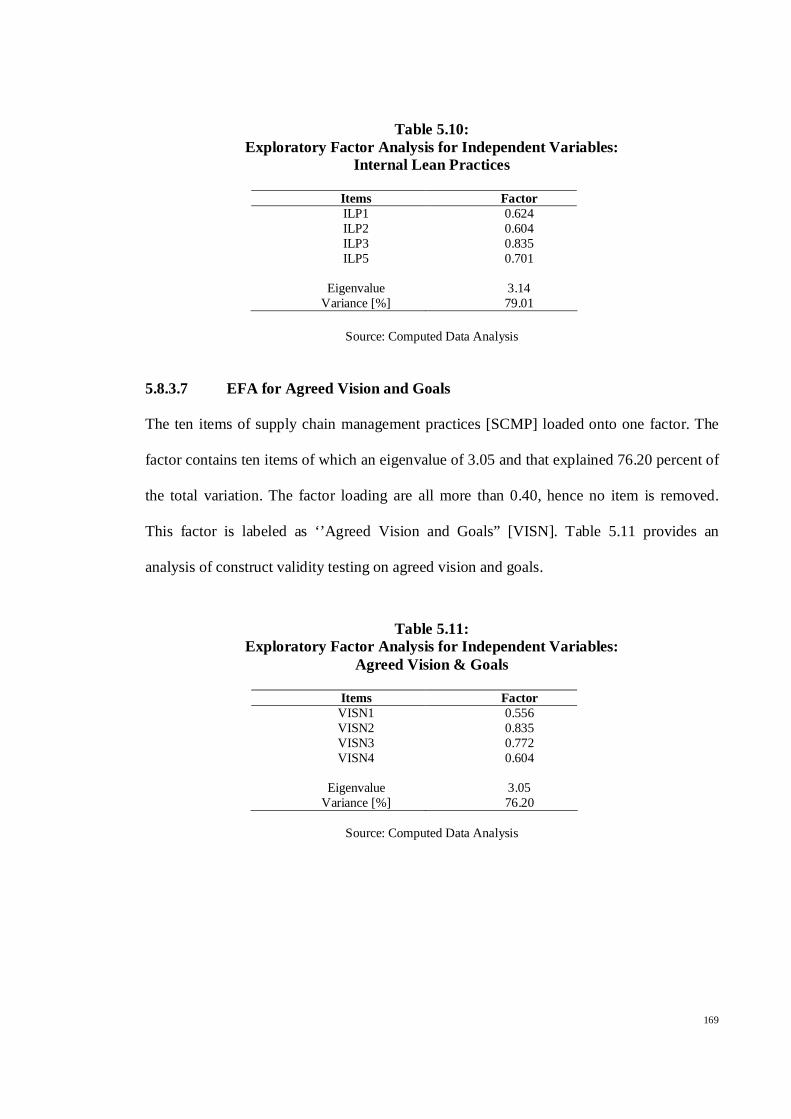
5.8.3.6 EFA for Internal Lean Practices
The four items of supply chain management practices [SCMP] loaded onto one factor. The
factor contains four items of which an eigenvalue of 3.14 and that explained 79.01 percent
of the total variation. The factor loading are all more than 0.40, hence no item is removed.
This factor is labeled as ‘’Internal Lean Practices” [ILP]. Table 5.10 provides an analysis of
construct validity testing on internal lean practices.
169
Table 5.10: Exploratory Factor Analysis for Independent Variables:
Internal Lean Practices
Items Factor ILP1 0.624 ILP2 0.604 ILP3 0.835 ILP5 0.701
Eigenvalue 3.14
Variance [%] 79.01
Source: Computed Data Analysis
5.8.3.7 EFA for Agreed Vision and Goals
The ten items of supply chain management practices [SCMP] loaded onto one factor. The
factor contains ten items of which an eigenvalue of 3.05 and that explained 76.20 percent of
the total variation. The factor loading are all more than 0.40, hence no item is removed.
This factor is labeled as ‘’Agreed Vision and Goals” [VISN]. Table 5.11 provides an
analysis of construct validity testing on agreed vision and goals.
Table 5.11:
Exploratory Factor Analysis for Independent Variables: Agreed Vision & Goals
Source: Computed Data Analysis
Items Factor VISN1 0.556 VISN2 0.835 VISN3 0.772 VISN4 0.604
Eigenvalue 3.05
Variance [%] 76.20

170
5.8.3.8 EFA for Risk and Reward Sharing
The three items of supply chain management practices [SCMP] loaded onto one factor. The
factor contains three items of which an eigenvalue of 2.05 and that explained 68.28 percent
of the total variation. The factor loading are all more than 0.40, hence no item is removed.
This factor is labeled as ‘’Risk and Reward Sharing” [RISK]. Table 5.12 provides an
analysis of construct validity testing on risk and reward sharing.
Table 5.12:
Exploratory Factor Analysis for Independent Variables: Risk & Reward Sharing
Items Factor RISK1 0.877 RISK2 0.889 RISK3 0.699
Eigenvalue 2.05
Variance [%] 68.28
Source: Computed Data Analysis
5.8.4 Intervening Variable Exploratory Factor Analysis
The second test of factor analysis was performed on the intervening variable, which is
supply chain integration.
5.8.4.1 EFA for Supply Chain Integration
The five items of supply chain integration [SCI] loaded onto one factor. The factor contains
five items of which an eigenvalue of 2.65 and that explained 53.01 percent of the total
variation. The factor loading are all more than 0.40, hence no item is removed. This factor
is labeled as ‘’Supply Chain Integration” [SCI]. Table 5.13 provides an analysis of
construct validity testing on supply chain integration.

171
Table 5.13: Exploratory Factor Analysis for Intervening Variables:
Supply Chain Integration
Items Factor SCI1 0.749 SCI2 0.431 SCI3 0.864 SCI4 0.801 SCI5 0.718
Eigenvalue 2.65
Variance [%] 53.01
Source: Computed Data Analysis
5.8.5 Dependent Variable Exploratory Factor Analysis
The third test of factor analysis was performed on the dependent variable, which is supply
chain performance.
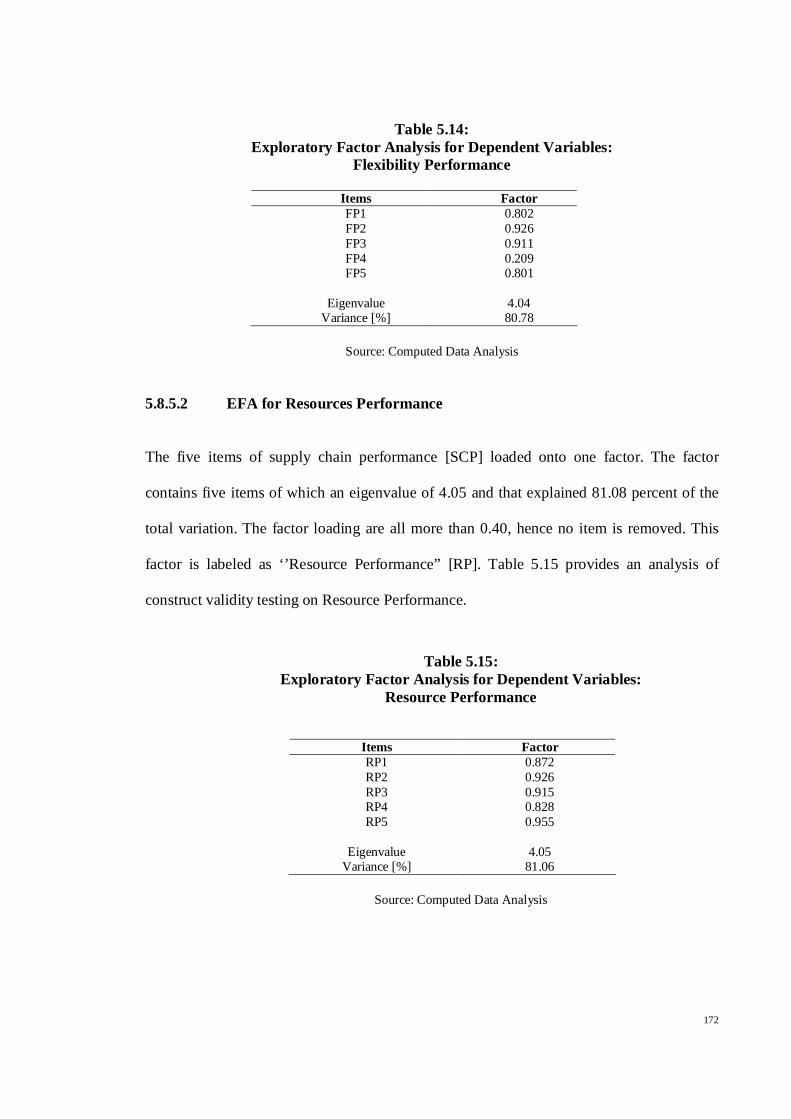
5.8.5.1 EFA for Flexibility Performance
The five items of supply chain performance [SCP] loaded onto one factor. The factor
contains five items of which an eigenvalue of 4.04 and that explained 80.78 percent of the
total variation. The factor loading are all more than 0.40, except item FP4 is recommended
to drop because of their values which are lower than the cut-off point (>0.40). This factor is
labeled as ‘’Flexibility Performance” [FP]. Table 5.14 provides an analysis of construct
validity testing on Flexibility Performance.
172
Table 5.14: Exploratory Factor Analysis for Dependent Variables:
Flexibility Performance
Items Factor FP1 0.802 FP2 0.926 FP3 0.911 FP4 0.209 FP5 0.801
Eigenvalue 4.04
Variance [%] 80.78
Source: Computed Data Analysis
5.8.5.2 EFA for Resources Performance
The five items of supply chain performance [SCP] loaded onto one factor. The factor
contains five items of which an eigenvalue of 4.05 and that explained 81.08 percent of the
total variation. The factor loading are all more than 0.40, hence no item is removed. This
factor is labeled as ‘’Resource Performance” [RP]. Table 5.15 provides an analysis of
construct validity testing on Resource Performance.
Table 5.15:
Exploratory Factor Analysis for Dependent Variables: Resource Performance
Items Factor RP1 0.872 RP2 0.926 RP3 0.915 RP4 0.828 RP5 0.955
Eigenvalue 4.05
Variance [%] 81.06
Source: Computed Data Analysis

173
5.8.5.3 EFA for Output Performance
The five items of supply chain performance [SCP] loaded onto one factor. The factor
contains five items of which an eigenvalue of 4.89 and that explained 69.86 percent of the
total variation. The factor loading are all more than 0.40, hence no item is removed. This
factor is labeled as ‘’Output Performance” [SCP]. Table 5.16 provides an analysis of
construct validity testing on Output Performance.
Table 5.16:
Exploratory Factor Analysis for Dependent Variables: Output Performance
Items Factor OP1 0.842 OP2 0.843 OP3 0.851 OP4 0.854 OP5 0.805 OP6 0.828 OP7 0.825
Eigenvalue 4.89
Variance [%] 69.86
Source: Computed Data Analysis
5.8.6 Summary of Exploratory Factor Analysis
At the end of EFA, 12 dimensions which were earlier proposed still remain. Only two items
were recommended to be removed which are CRM6 (the dimension of customer relation)
and FP4 (the dimension of flexibility performance). These two items were recommended to
be dropped from the model since it has lower loading value than the cut-off point (0.40)
(Chong, 2006), and removed until KMO achieves at 0.60 (cut-off) (Jones, LoPresti,
Naphtali, & Whitney, 1999). As a result the independent variable (supply chain
management practices) has eight dimensions, (i.e. strategic supplier partnering, customer
relationship management, information sharing, information quality, internal lean practices,

174
postponement, agreed vision and goals and risk and reward sharing), the intervening
variable, (i.e. supply chain integration) and the dependent variable, (supply chain
performance) has three dimensions, (i.e. flexibility performance, resources performance and
output performance). As such the final model and the proposed model are similar
theoretically and statistically. After all the dimensions have been identified, the next step is
to determine the fitness of the model which is discussed later in the section.
5.9 Measures of Reliability
Reliability analysis refers to the test of the consistency of respondents’ answers to all the
items in a measure, or the degree to which an instrument measures the same way each time
it is used under the same condition with the same subjects. In short, it reflects the degree
that items are independent measures of the same concept, they will be correlated with one
another. The appropriate test for reliability is inter-item consistency reliability which is
popularly known as the Cronbach’s coefficient alpha, which is used for multipoint-scaled
items. The higher the coefficient, the better is the reliability of what the instrument intends
to measure (Sekaran, 2003). In this study, the internal consistency reliability is measured by
applying the Cronbach’s alpha test to individual scales and the overall measures as reported
in Table 5.17.
Budd (1987) recommended that the acceptable estimation of reliability study of Cronbach’s
alpha between 0.50 to about 0.80. Nonetheless, Hair et al., (1995) considered 0.30 as
significant, loadings greater than 0.40 are considered more important; and loadings 0.50 or
greater are considered very significant. Whereas, Nunnally, (1978) argued that in early
stages of research, reliabilities of 0.50 – 0.60 would suffice, and that for basic research, it
175
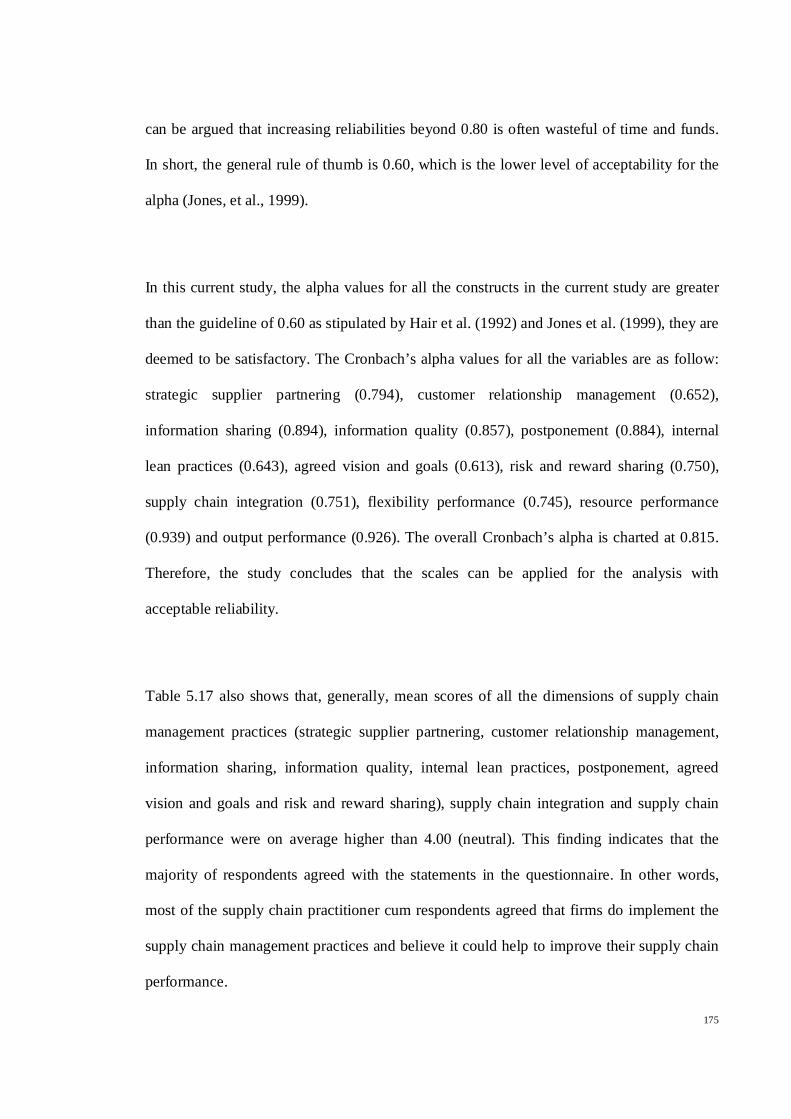
can be argued that increasing reliabilities beyond 0.80 is often wasteful of time and funds.
In short, the general rule of thumb is 0.60, which is the lower level of acceptability for the
alpha (Jones, et al., 1999).
In this current study, the alpha values for all the constructs in the current study are greater
than the guideline of 0.60 as stipulated by Hair et al. (1992) and Jones et al. (1999), they are
deemed to be satisfactory. The Cronbach’s alpha values for all the variables are as follow:
strategic supplier partnering (0.794), customer relationship management (0.652),
information sharing (0.894), information quality (0.857), postponement (0.884), internal
lean practices (0.643), agreed vision and goals (0.613), risk and reward sharing (0.750),
supply chain integration (0.751), flexibility performance (0.745), resource performance
(0.939) and output performance (0.926). The overall Cronbach’s alpha is charted at 0.815.
Therefore, the study concludes that the scales can be applied for the analysis with
acceptable reliability.
Table 5.17 also shows that, generally, mean scores of all the dimensions of supply chain
management practices (strategic supplier partnering, customer relationship management,
information sharing, information quality, internal lean practices, postponement, agreed
vision and goals and risk and reward sharing), supply chain integration and supply chain
performance were on average higher than 4.00 (neutral). This finding indicates that the
majority of respondents agreed with the statements in the questionnaire. In other words,
most of the supply chain practitioner cum respondents agreed that firms do implement the
supply chain management practices and believe it could help to improve their supply chain
performance.

176
Table 5.17 Internal Consistency of the Constructs
Construct/scale
Mean Standard Deviation
Cronbach’s Alpha
Supply Chain Management Practices
[Independent Variable] Strategic Supplier Partnering [5.84*] 0.794 SSP1 6.27 0.59 SSP2 5.80 0.84 SSP3 5.61 0.98 SSP4 5.20 1.20 SSP5 5.90 1.10 SSP6 6.33 0.88 SSP7 5.93 0.84 SSP8 5.76 0.86 SSP9 5.81 1.02 SSP10 5.82 1.01 Customer Relationship Management [3.93*]
0.652
CRM1 6.26 0.87 CRM2 5.74 0.86 CRM3 5.65 0.95 CRM4 5.10 1.11 CRM5 5.72 0.87 CRM6 3.70 1.75 CRM7 5.17 1.04 CRM8 5.65 0.96 Information Sharing [5.20*] 0.894 IS1 4.74 1.39 IS2 4.65 1.31 IS3 4.82 1.40 IS4 5.44 1.15 IS5 4.95 1.37 IS6 5.84 1.17 IS7 5.95 1.04 Information Quality [5.96*] 0.857 IQ1 5.75 1.22 IQ2 5.75 1.12 IQ3 6.17 0.94 IQ4 5.96 1.11 IQ5 6.17 0.84
* Average mean score
Source: Computed Data Analysis

177
Table 5.17 (…continue) Internal Consistency of the Constructs
Construct/scale Mean
Standard Deviation
Cronbach’s Alpha
Supply Chain Management Practices
[Independent Variable] Postponement [3.80*] 0.884 PST1 4.98 1.35 PST2 4.87 1.41 PST3 6.04 8.92 PST4 5.16 1.32 PST5 5.39 1.26 Internal Lean Practices [3.69*] 0.643 ILP1 5.37 1.28 ILP2 4.07 1.51 ILP3 3.37 1.63 ILP4 6.50 8.86 ILP5 5.06 1.51 Agreed Vision & Goals [5.43*] 0.613 VISN1 5.43 1.16 VISN2 6.20 0.78 VISN3 6.00 1.19 VISN4 4.47 1.35 Risk & Reward Sharing [5.18*] 0.750 RISK1 5.54 1.18 RISK2 5.30 1.06 RISK3 4.70 1.32
Supply Chain Integration
[Mediating Variable] Supply Chain Integration [5.44*] 0.751 SCI1 5.82 1.17 SCI2 5.00 1.24 SCI3 5.71 0.96 SCI4 5.48 1.05 SCI5 5.20 1.16
* Average mean score
Source: Computed Data Analysis

178
Table 5.17 (…continue) Internal Consistency of the Constructs
Construct/scale Mean
Standard Deviation
Cronbach’s Alpha
Supply Chain Performance [Dependent Variable]
-Flexibility Performance [5.48*] 0.745 FP1 5.84 1.17 FP2 5.95 1.04 FP3 5.90 1.06 FP4 4.28 1.67 FP5 5.46 1.11 Supply Chain Performance -Resource Performance [5.71*] 0.939 RP1 5.79 1.01 RP2 5.66 1.02 RP3 5.86 0.96 RP4 5.44 1.05 RP5 5.80 0.94 Supply Chain Performance -Output Performance [5.28*] 0.926 OP1 5.25 1.21 OP2 4.98 1.22 OP3 5.27 1.03 OP4 5.23 1.00 OP5 5.33 1.02 OP6 5.45 0.90 OP7 5.43 1.02
OVERALL N/A N/A
0.868
* Average mean score
Source: Computed Data Analysis

179
5.10 Multiple Regression Analysis
The regression analysis is a form of multivariate analysis which is subject to fulfill the
requirement of the normal assumptions of Ordinary Least Square [OLS]. These assumptions
include 1] linearity of the phenomenon measured, 2] constant variance of error terms
(homoscedasticity), 3] normality of the error term distribution, and 4] multicollinearity.
The minimum sample size is based on the ration of observation to independent variables is
5:1 (Hair, et al., 1995).
5.10.1 Basic Assumption for Multiple Regression Analysis
Linearity is the degree to which change in dependent variable is associated with the
independent variables. This assumption was assessed through an analysis of standardized
residual plots for each independent variable. As a result, the standardized residual plots did
not exhibit any nonlinear pattern to the residuals, thus ensuring that the overall equation
was linear. Hence the assumption of linearity was met.
A general common problem faced, in a cross-sectional data comes from heteroscedasticity
(Greene, 2000; Johnston & DiNardo, 1997). The second assumption, homoscedasticity, was
assessed by plotting the studentized residual and standardized predicted value, and then
compared them with the null plot. The result of the scatter plots showed no visible patterns,
thus indicating that the second assumption was also met.
The third assumption, normality was examined by level of skewness (the symmetry of a
distribution) and level of kurtosis (the clustering of scores toward the centre of a
180
distribution) for all variables of measure. Some statisticians have more liberal interpretation
of less than +1.00 for skewness, kurtosis and both (George & Mallery, 2003; Morgan, et al.,
2001). Table 5.2 shows that all constructs (e.g. strategic supplier partnering, customer
relationship management, information sharing, information quality, internal lean practices,
postponement, agreed vision and goals, risk and reward sharing, supply chain integration,
flexibility performance, resources performance and output performance) have less than
+1.00 (skewness and kurtosis) which indicates that this result revealed normal distribution.
The next is the fourth assumption that ascertains of the independent variables should not
have high correlations among them or this is indicated as multicollinearity.
Multicollinearity problem exists when the independent variables are too highly correlated,
for instance Pearson’s r between each pair of independent variables does not exceed 0.85
(Hair, et al., 1995). The results (see Table 5.3) indicate that none of the squared correlations
was close to 0.85 to suggest a problem with multicollinearity among the research variables.
Therefore, there is no evidence of significant multicollinearity among the research
variables.

181
5.10.2 Condition or Assumption for Hierarchical Regression Analysis
There are three main conditions or assumption which is required to be fulfilled in order to
examine the mediation effect using hierarchical regression analysis. The mediating effect
exists under the following conditions (Baron & Kenny, 1986):
Step 1
i] The independent variable (supply chain practices) is significantly associated with
the mediator (supply chain integration).
Step 2
i] The independent variable (supply chain practices) is significantly associated with
the dependent variable (resource performance] in the absence of the mediator (supply chain
integration).
ii] The independent variable (supply chain practices) is significantly associated with
the dependent variable (flexibility performance] in the absence of the mediator (supply
chain integration).
iii] The independent variable (supply chain practices) is significantly associated with
the dependent variable (output performance] in the absence of the mediator (supply chain
integration).
182
Step 3
i] The mediator variable (supply chain integration) is significantly associated with
the dependent variable (resource performance).
ii] The mediator variable (supply chain integration) is significantly associated with
the dependent variable (flexibility performance).
iii] The mediator variable (supply chain integration) is significantly associated with
the dependent variable (output performance).
Step 4
i] When the independent variable (supply chain practices) and the mediator variable
(supply chain integration) are controlled, a previously significant relationship between the
independent variable and dependent variable (resource performance) is no longer significant
or it is significantly decreased.
ii] When the independent variable (supply chain practices) and the mediator variable
(supply chain integration) are controlled, a previously significant relationship between the
independent variable and dependent variable (flexibility performance) is no longer
significant or it is significantly decreased.

183
iii] When the independent variable (supply chain practices) and the mediator variable
(supply chain integration) are controlled, a previously significant relationship between the
independent variable and dependent variable (output performance) is no longer significant
or it is significantly decreased.
Source: Generated by Researcher
Key i. DV = Dependent variable [supply chain performance] ii. IDV = Independent variable [supply chain practices] iii. MV = Mediating variable [supply chain integration]
Figure 5.1:
Schematic Diagram of Variables
The above figure illustrates the schematic diagram and the relationship between the main
variables of the study includes 1] dependent variable (supply chain performance), 2]
independent variable (supply chain practices) and 3] mediating variable (supply chain
integration).
MV
DV IDV

184
Table 5.18: Test Model for Hierarchical Regression Analysis
Source: Generated by Researcher Key i. DV = dependent variable [supply chain performance] ii. IDV = independent variable [supply chain practices] iii. MV = mediating variable [supply chain integration]
Table 5.18 depicts the various test models for hierarchical regression analysis which is
employed in this study. There are four test models in tandem to all the four steps required to
fulfill the conditions or assumption for hierarchical regression analysis.
Table 5.19: Conformance to Mediating Effect
Source: Generated by Researcher
Test Models
Model 1 MV = f[IDV] = a+ b [IDV]
Model 2 DV = f[IDV] = c + d [IDV]
Model 3 DV = f[MV] = e + f[MV]
Model 4 DV = f[IDV,MV] = g + h[IDV] +j[MV]
Full and Partial Effect Conformance
Full Effect Partial Effect
b= sig b= sig
d=sig d=sig
f= sig f= sig
j= sig j= sig
h= not sig h= sig but h < d

185
Table 5.19 depicts the criteria of conformance to mediating effect in terms of partial
mediation effect and full mediation effect. The criterion for full mediation effect is fulfilled
if the independent variable and the mediating variable are controlled; a previously
significant relationship between the independent variable and dependent variable is no
longer significant. In contrast, the criterion for partial mediation effect is fulfilled if the
independent variable and the mediating variable are controlled; a previously significant
relationship between the independent variable and dependent variable is significantly
decreased.
5.11 Result of Multiple Regression Analysis
The result of the multiple regressions analysis will be presented in three sets. These three
sets of regression analysis will represent three dependent variables, which are resources
performance, flexibility performance and output performance. These dependent variables
were regressed separately on eight independent variables (strategic supplier partnering,
customer relationship management, information sharing, information quality, internal lean
practices, postponement, agreed vision and goals and risk and reward sharing). The method
suggested by Baron and Kenny (1986) was used in assessing the mediating effect of supply
chain integration on the relationship between independent variables and dependent variables
(resources performance, flexibility performance and output performance).

186
Table 5.20: Regression Result of
Resources Performance-Dependent Variable
Variables Std Beta Std Beta Std Beta Std Beta Result
Step 1 Step 2 Step 3 Step 4
Model 1 Model 2 Model 3 Model 4
X M X Y M Y X, M Y
Criterion
Y = RP
Predictor
X1: SSP .038 .084 .055 No Mediation
X2: CRM -.525 -.233 .163 No Mediation
X3: IS .465*** .436*** .085 Full Mediation
X4: IQ .224*** .198*** .029 Full Mediation
X5: ILP -.052 -.056 -.017 No Mediation
X6: PST .498 .251 -.126 No Mediation
X7: VISN .171** .104 -.025 No Mediation
X8: RISK .024 .031 .012 No Mediation
Mediator
M = SCI .833*** .755***
R2 .484 .412 .713 .703
F 14.14*** 10.80*** 275.23*** 30.51*** Notes: * Significant at 0.1 level; ** Significant at 0.05 level; *** Significant at 0.01 level
Source: Computed Data Analysis
Table 5.20 depicts the results of the hierarchical regression of supply chain resource
performance (dependent variable). The result indicates that supply chain integration has full
mediation effect between the relationship of 1] information sharing and supply chain
resource performance, and 2] information quality and supply chain resource performance.

187
Table 5.21: Regression Result of
Output Performance-Dependent Variable
Variables Std Beta Std Beta Std Beta Std Beta Result
Step 1 Step 2 Step 3 Step 4
Model 1 Model 2 Model 3 Model 4
X M X Y M Y X, M Y
Criterion
Y = OP
Predictor
X1: SSP .038 -.080 -.102 No Mediation
X2: CRM -.525 -.582* -.279 No Mediation
X3: IS .465*** .570*** .302*** Partial Mediation
X4: IQ .224*** .167* .038 Full Mediation
X5: ILP -.052 .008 .038 No Mediation
X6: PST .498 .626* .339 No Mediation
X7: VISN .171** .079 -.020 No Mediation
X8: RISK .024 .024 .010 No Mediation
Mediator
M = SCI .752*** .576***
R2 .484 .431 .566 .598
F 14.14*** 11.60*** 144.70*** 19.52*** Notes: * Significant at 0.1 level; ** Significant at 0.05 level; *** Significant at 0.01 level
Source: Computed Data Analysis
Table 5.21 depicts the results of the hierarchical regression of supply chain output
performance (dependent variable). The result indicates that supply chain integration has full
mediation effect between the relationship of information quality and supply chain output
performance and partial mediation effect between information sharing and supply chain
output performance.

188
Table 5.22: Regression Result of
Flexibility Performance-Dependent Variable
Variables Std Beta Std Beta Std Beta Std Beta Result
Step 1 Step 2 Step 3 Step 4
Model 1 Model 2 Model 3 Model 4
X M X Y M Y X, M Y
Criterion
Y = FP
Predictor
X1: SSP .038 .102 .088 No Mediation
X2: CRM -.525 -.145 .054 No Mediation
X3: IS .465*** .561*** .385*** Partial Mediation
X4: IQ .224*** .086 .001 No Mediation
X5: ILP -.052 -.042 -.022 No Mediation
X6: PST .498 .146 -.043 No Mediation
X7: VISN .171** .230** .165** Partial Mediation
X8: RISK .024 .058 .048 No Mediation
Mediator
M = SCI .738*** .379***
R2 .484 .596 .545 .667
F 14.14*** 21.68*** 132.85*** 25.94*** Notes: * Significant at 0.1 level; ** Significant at 0.05 level; *** Significant at 0.01 level
Source: Computed Data Analysis
Table 5.22 depicts the results of the hierarchical regression of supply chain flexibility
performance (dependent variable). The result indicates that supply chain integration has
partial mediation effect between the relationship of 1] information sharing and supply chain
flexibility performance, and 2] agreed vision and supply chain flexibility performance.

189
5.11.1 Testing the relationship between independent and mediating variables
[STEP- 1]
H4: There is a positive significant relationship between supply chain management practices
and supply chain integration.
Specifically:
Hypothesis 4 Statement
H4a
There is a positive significant relationship between strategic
supplier partnering and supply chain integration.
H4b There is a positive significant relationship between customer
relationship and supply chain integration.
H4c There is positive significant relationship between information
sharing and supply chain integration.
H4d There is positive significant relationship between information
quality and supply chain integration.
H4e There is positive significant relationship between internal lean
practices and supply chain integration.
H4f There is positive significant relationship between
postponement and supply chain integration.
H4g There is positive significant relationship between agreed vision
and goals and supply chain integration.
H4h There is positive significant relationship between risk and
reward sharing and supply chain integration.

190
This study hypothesized that supply chain management practices were positively related to
supply chain integration. Hence, the supply chain integration was regressed on eight
dimensions of supply chain management practices. The findings showed that Hypothesis 4
was partially supported. The detail of the findings is discussed as follows:
The findings showed (see Tables 5.20, 5.21 and 5.22) that: (1) the extent of information
sharing was positively and significantly related to supply chain integration (p< 0.01), (2) the
extent of information quality was positively and significantly related to supply chain
integration (p< 0.05), and (3) the extent of agreed vision and goals was positively and
significantly related to supply chain integration (p< 0.05). The finding suggest that (1)
higher information sharing practices would result in higher supply chain integration level,
(2) higher information quality practices would result in higher supply chain integration
level, and (3) higher agreed vision and goal practices would result in higher supply chain
integration level. Therefore, hypotheses 4c, 4d and 4g were supported.
The other five dimensions of supply chain management practices (strategic supplier
partnering, customer relationship management, internal lean practices, postponement, and
risk and reward sharing) were not significantly related to supply chain integration.
Therefore, hypotheses 4a, 4b, 4e, 4f and 4h were not supported. Hence, the variation in
supply chain integration was explained by information sharing, information quality, and
agreed vision and goals. The percentage of explanation was as much as 48.40% (R2 =
0.484).

191
5.11.2 Testing for relationship between independent and dependent variables
[STEP- 2]
H1-3: There is a positive significant relationship between supply chain management
practices and supply chain performance.
In order to test the relationship between supply chain management and supply chain
performance, there are three main hypotheses involved (H1, H2 and H3). The supply chain
management practices include strategic supplier partnering, customer relationship
management, information sharing, information quality, internal lean practices,
postponement, agreed vision and goals and risk and reward sharing. On the other hand,
supply chain performance was measured in terms of resources performance, output
performance and flexibility performance. The detail of the findings for H1, H2 and H3 are
as follows:

192
5.11.2.1 Testing for relationship between supply chain management practices and
resource performance
H1: There is a positive significant relationship between supply chain management practices
and resources performance. .
Specifically:
Hypothesis 1 Statement
H1a
There is a positive significant relationship between strategic
supplier partnering and resources performance.
H1b There is a positive significant relationship between customer
relationship and resources performance.
H1c There is a positive significant relationship between
information sharing and resources performance.
H1d There is a positive significant relationship between
information quality and resources performance.
H1e There is a positive significant relationship between internal
lean practices and resources performance.
H1f There is a positive significant relationship between
postponement and resources performance.
H1g There is a positive significant relationship between agreed
vision and goals and resources performance.
H1h There is a positive significant relationship between risk and
reward and resources performance.
193
This study hypothesized that supply chain management practices were positively related to
resource performance. Hence, the resources performance was regressed on eight dimensions
of supply chain management practices. The findings showed (see table 5.20) that hypothesis
1 was partially supported. The detail of the findings is discussed as follows:
The findings showed that: (1) the extent of information sharing was positively and
significantly related to resource performance (p< 0.01), and (2) the extent of information
quality was positively and significantly related to resources performance (p< 0.01). The
finding suggest that (1) higher information sharing practices would result in higher
resources performance, and (2) similarly, higher information quality practices would result
in higher resources performance level. Therefore, hypotheses 1c and 1d were supported.
The other six dimensions of supply chain management practices (strategic supplier
partnering, customer relationship management, internal lean practices, postponement,
agreed vision & goals and risk and reward sharing) were not significantly related to
resource performance. Therefore, hypotheses 1a, 1b, 1e, 1f, 1g and 1h were not supported.
Hence, the variation in resource performance was explained by information sharing and
information quality. The percentage of explanation was as much as 41.20% (R2 = 0.412).

194
5.11.2.2 Testing for relationship between supply chain management practices and
output performance
H2: There is a positive significant relationship between supply chain management practices
and output performance.
Specifically:
Hypothesis 2 Statement
H2a
There is a positive significant relationship between strategic
supplier partnering and output performance.
H2b There is a positive significant relationship between customer
relationship management and output performance.
H2c There is a positive significant relationship between
information sharing and output performance.
H2d There is a positive significant relationship between
information quality and flexibility performance.
H2e There is a positive significant relationship between internal
lean practices and output performance.
H2f There is a positive significant relationship between
postponement and output performance.
H2g There is a positive significant relationship between agreed
vision and goals and output performance.
H2h There is a positive significant relationship between risk and
reward and output performance.
195
This study hypothesized that supply chain management practices were positively related to
output performance. Hence, the output performance was regressed on eight dimensions of
supply chain management practices. The findings showed (see table 5.21) that Hypothesis 2
was partially supported. The detail of the findings is discussed as follows:
The findings showed that: (1) the extent of information sharing was positively and
significantly related to output performance (p< 0.01), (2) the extent of information quality
was positively and significantly related to output performance (p< 0.1) and (3) the extent of
postponement was positively and significantly related to output performance (p< 0.1).
The findings suggest that (1) higher information sharing practices would result in higher
output performance, (2) similarly, higher information quality would result in higher output
performance level, and (3) higher postponement practices would result in higher output
performance level.
Therefore, hypotheses 2c, 2d and 2f were supported. The other five dimensions of supply
chain management practices (strategic supplier partnering, customer relationship
management, internal lean practices, agreed vision & goal and risk & reward sharing) were
not significantly related to output performance. Therefore, hypotheses 2a, 2b, 2e, 2g, and 2h
were not supported. Hence, the variation in output performance was explained by
information sharing and agreed vision & goals. The percentage of explanation was as much
as 43.10% (R2 = 0.431).
196
5.11.2.3 Testing for relationship between supply chain management practices and
flexibility performance
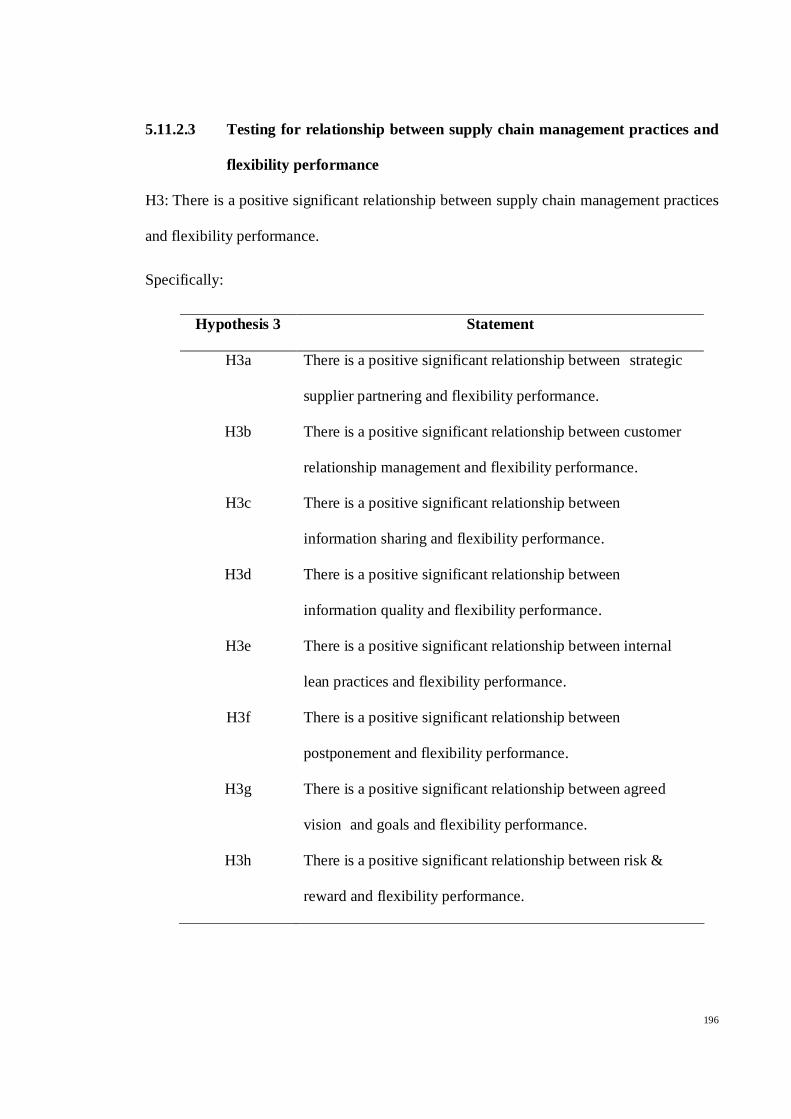
H3: There is a positive significant relationship between supply chain management practices
and flexibility performance.
Specifically:
Hypothesis 3 Statement
H3a
There is a positive significant relationship between strategic
supplier partnering and flexibility performance.
H3b There is a positive significant relationship between customer
relationship management and flexibility performance.
H3c There is a positive significant relationship between
information sharing and flexibility performance.
H3d There is a positive significant relationship between
information quality and flexibility performance.
H3e There is a positive significant relationship between internal
lean practices and flexibility performance.
H3f There is a positive significant relationship between
postponement and flexibility performance.
H3g There is a positive significant relationship between agreed
vision and goals and flexibility performance.
H3h There is a positive significant relationship between risk &
reward and flexibility performance.

197
This study hypothesized that supply chain management practices were positively related to
flexibility performance. Hence, the flexibility performance was regressed on eight
dimensions of supply chain management practices. The findings showed (see table 5.22)
that Hypothesis 3 was partially supported. The detail of the findings is discussed as follows:
The result showed that: (1) the extent of information sharing was positively and
significantly related to flexibility performance (p< 0.01), and (2) the extent of agreed vision
& goals was positively and significantly related to flexibility performance (p< 0.05). The
finding suggest that (1) higher information sharing practices would result in higher
flexibility performance, and (2) similarly, higher agreed vision & goals practices would
result in higher flexibility performance level.
Therefore, hypotheses 1c and 1h were supported. The other six dimensions of supply chain
management practices (strategic supplier partnering, customer relationship management,
information quality, internal lean practices, postponement, and risk and reward sharing)
were not significantly related to flexibility performance. Therefore, hypotheses 3a, 3b, 3d,
3e, 3f, and 3h were not supported. Hence, the variation in flexibility performance was
explained by information sharing and agreed vision & goals. The percentage of explanation
was as much as 59.60% (R2 = 0.596).

198
5.11.3 Testing for relationship between mediating variable and dependent variables
[STEP- 3]
H5: There is a positive significant relationship between supply chain integration and supply
chain performance.
Specifically:
Hypotheses 5 Statement
H5a
Supply chain integration is positively related to resources
performance
H5b Supply chain integration is positively related to flexibility
performance
H5c Supply chain integration is positively related to output
performance
This study hypothesized that supply chain integration was positively related to supply chain
performance. Supply chain performance was measured in terms of resources performance,
flexibility performance and output performance. Hence, the supply chain performance
integration was regressed on supply chain integration. The findings showed that hypothesis
5 was fully supported. The detail of the findings is discussed as follows:
The findings showed (see Tables 5.20, 5.21 and 5.22) that: (1) the extent of supply chain
integration was positively and significantly related to resources performance (p< 0.01), (2)
the extent of supply chain integration was positively and significantly related to output

199
performance (p< 0.01) and (3) the extent of supply chain integration was positively and
significantly related to flexibility performance (p< 0.01).
The finding suggest that (1) higher level of supply chain integration would result in higher
resource performance, (2) higher level of supply chain integration would result in higher
flexibility performance, and (3) higher level of supply chain integration would result in
higher output performance,. Therefore, hypotheses 5a, 5b and 5c were supported. Hence,
the variation in:
1] supply chain resource performance was explained by supply chain integration. The
percentage of explanation was as much as 71.30% (R2 = 0.713).
2] supply chain output performance was explained by supply chain integration. The
percentage of explanation was as much as 56.60% (R2 = 0.566).
3] supply chain flexibility performance was explained by supply chain integration. The
percentage of explanation was as much as 54.50% (R2 = 0.545).
5.11.4 Testing for mediation [STEP 4]
Three separate regressions were carried out to test the hypotheses that posited supply chain
integration to mediate the relationship between dimensions of supply chain management
practices and (1) resource performance, (2) flexibility performance, (3) output performance.
The output of these hierarchical regression analyses are illustrated in Tables 5.20, 5.21 and
5.22.

200
According to Baron and Kenny (1986), three relationships should be established. First, the
dimensions of supply chain management practices (independent variables) must be a
significant predictor of these respective dimensions of supply chain performance
(dependent variable) namely, (1) resource performance, (2) flexibility performance and (3)
output performance. Second, the dimensions of supply chain management practices
(independent variables) must be a significant predictor of supply chain integration
(mediating variable).
Third, in the final regression equation with the dimensions of supply chain management
practices (independent variables) entered together with supply chain integration (mediator),
and the supply chain integration (mediator) must be a significant predictor of the respective
dimension of supply chain performance (dependent variable), which are (1) resource
performance, (2) flexibility performance and (3) output performance.
Full mediation is established if the dimensions of supply chain management practices
(independent variable) in this third regression equation are non-significant. Meanwhile the
partial mediation is established if the dimensions of supply chain management practices
(independent variable) are significant but the beta (β) is reduced. The specific results of the
mediation analysis (third regression equation) were as follows:

201
5.11.4.1 Testing mediation between independent variables and dependent variable
(resource performance)
H6: Supply chain integration will mediate the relationship between supply chain
management practices and resource performance.
Specifically:
Hypotheses 6 Statement
H6a
Supply chain integration will mediate the relationship between
strategic supplier partnering and resources performance.
H6b Supply chain integration will mediate the relationship between
customer relationship and resources performance.
H6c Supply chain integration will mediate the relationship between
information sharing and resources performance.
H6d Supply chain integration will mediate the relationship between
information quality and resources performance.
H6e Supply chain integration will mediate the relationship between
internal lean practices and resources performance.
H6f Supply chain integration will mediate the relationship between
postponement and resources performance.
H6g Supply chain integration will mediate the relationship between
agreed vision and goals and resources performance.
H6h Supply chain integration will mediate the relationship between
risk & reward sharing and resources performance.

202
This study hypothesized that supply chain integration will mediate the relationship
dimensions of supply chain management practices and resource performance. Supply chain
management practices was measured in terms of strategic supplier partnering, customer
relationship management, information sharing, information quality, internal lean practices,
postponement, agreed vision and goals and risk and reward sharing. As shown in Table
5.20, information sharing, information quality and agreed vision and goals were the only
three variables that are found to be significantly related to supply chain integration in Step 1
(β= 0.465, p< 0.01); (β= 0.224, p< 0.01); (β= 0.171, p< 0.05) and also information sharing
and information quality were the only two variables that are found to be significantly
related to resource performance in Step 2 (β= 0.436, p< 0.01); (β= 0.198, p< 0.01).
In the Step 4, information sharing and information quality were found to be not
significantly related to resource performance (β= 0.085); (β= 0.029). Hence, the supply
chain integration acted as a full mediator in the relationship between (1) information
sharing and resource performance and (2) information quality and resource sharing.
Thus, hypotheses H6c and H6d were supported. In contrast, supply chain integration did not
mediate the relationship between the other six dimensions of supply chain management
practices. Thus, hypotheses H6a, H6b, H6e, H6f, H6g and H6h were not supported.

203
5.11.4.2 Testing mediation between independent variables and dependent variable
(output performance)
H7: Supply chain integration will mediate the relationship between supply chain
management practices and output performance.
Specifically:
Hypotheses 7 Statement
H7a
Supply chain integration will mediate the relationship between
strategic supplier partnering and output performance.
H7b Supply chain integration will mediate the relationship between
customer relationship and output performance.
H7c Supply chain integration will mediate the relationship between
information sharing and output performance.
H7d Supply chain integration will mediate the relationship between
information quality and output performance.
H7e Supply chain integration will mediate the relationship between
internal lean practices and output performance.
H7f Supply chain integration will mediate the relationship between
postponement and output performance.
H7g Supply chain integration will mediate the relationship between
agreed vision and goals and output performance.
H7h Supply chain integration will mediate the relationship between
risk & reward sharing and output performance.

204
This study hypothesized that supply chain integration will mediate the relationship
dimensions of supply chain management practices and output performance. Supply chain
management practices were measured in terms of strategic supplier partnering, customer
relationship management, information sharing, information quality, internal lean practices,
postponement, agreed vision and goals and risk and reward sharing. As shown in table
5.21, information sharing, information quality and agreed vision and goals were the only
three variables that are found to be significantly related to supply chain integration in Step 1
(β= 0.465, p< 0.01); (β= 0.224, p< 0.05); (β= 0.171, p< 0.05) and also information sharing
and information quality were the only two variables that are found to be significantly
related to output performance in Step 2 (β= 0.570, p< 0.01); (β= 0.167, p< 0.1).
In the forth step, information sharing were found to be also significantly related to resource
performance (β= 0.302 p<0.01). . Hence, the supply chain integration acted as a partial
mediator in the relationship between information sharing and output performance. Thus,
hypothesis H7c was supported. Meanwhile, information quality were found to be not
significantly related to resource performance (β= 0.308). Hence, the supply chain
integration acted as a full mediator in the relationship between information quality and
output performance. Thus, hypothesis H7d was supported. In contrast, supply chain
integration did not mediate the relationship between the other six dimensions of supply
chain management practices. Thus, hypotheses H7a, H7b, H7e, H7f, H7g and H7h were not
supported.

205
5.11.4.3 Testing mediation between independent variables and dependent variable
(flexibility performance)
H8: Supply chain integration will mediate the relationship between supply chain
management practices and flexibility performance.
Specifically:
Hypotheses 8 Statement
H8a
Supply chain integration will mediate the relationship between
strategic supplier partnering and flexibility performance.
H8b Supply chain integration will mediate the relationship between
customer relationship and flexibility performance.
H8c Supply chain integration will mediate the relationship between
information sharing and flexibility performance.
H8d Supply chain integration will mediate the relationship between
information quality and flexibility performance.
H8e Supply chain integration will mediate the relationship between
internal lean practices and flexibility performance.
H8f Supply chain integration will mediate the relationship between
postponement and flexibility performance.
H8g Supply chain integration will mediate the relationship between
agreed vision and goals and flexibility performance.
H8h Supply chain integration will mediate the relationship between
risk & reward sharing and flexibility performance.

206
This study hypothesized that supply chain integration will mediate the relationship
dimensions of supply chain management practices and flexibility performance. Supply
chain management practices was measured in terms of strategic supplier partnering,
customer relationship management, information sharing, information quality, internal lean
practices, postponement, agreed vision and goals and risk and reward sharing.
As shown in table 5.22, there were only two dimensions of supply chain management
practices that were significantly related to supply chain integration and flexibility
performance. The first variable was information sharing. In Step 1 the beta value for
information sharing was 0.465 (p< 0.01), while in Step 2, the beta value was 0.561 (p<
0.01). In Step 4 the information sharing was still a significant predictor of flexibility
performance, but the beta value was reduced (β= 0.385, p< 0.01). Hence, supply chain
integration acted as a partial mediator in the relationship between information sharing and
flexibility performance. Thus, hypothesis H8c was supported.
Next, the result showed agreed vision & goals to be significantly related to supply chain
integration and flexibility performance. In the Step 1 the beta value for agreed vision &
goals was (β= 0.171, p< 0.05), while in the step 2 the beta value was (β= 0.230, p< 0.05). In
the Step 4, agreed vision & goals was also significant predictor of flexibility performance
(β= 0.165, p< 0.05). Hence, supply chain integration acted as a partial mediator in the
relationship between agreed vision & goals and flexibility performance. Thus, hypothesis
H8g was supported. In contrast, supply chain integration did not mediate the relationship
between the other six dimensions of supply chain management practices. Thus, hypotheses
H8a, H8b, H8d, H8e, H8f and H8h were not supported.
207
5.12 Summary
This chapter presents the results of the data analysis using descriptive analysis and
inferential analysis (multivariate analysis). The first section describes the descriptive
statistics including the demographic profile of the firm respondents. The exploratory factor
analysis was also performed, and the correlation analysis was also conducted between the
factors extracted.
In the multivariate analysis, before the study proceeds with the analysis using hierarchical
regression technique, first the assumptions of multivariate analysis were assessed. This
consisted of testing for multicollinearity, normality and linearity of the data. The
assumptions were fulfilled. There were no signs that the multivariate requirements were
violated. Subsequently, multivariate analysis using hierarchical regression technique was
used.
The analysis basically examined the effects of the independent variables on the dependent
variables. Specifically, Hypothesis 1 to Hypothesis 3 focused on the direct relationship
between the variables and Hypothesis 6 to Hypothesis 8 focused on the mediating effect of
supply chain integration. In addition, Hypothesis 4 was focused on the effect of independent
variables on the mediating variable and Hypothesis 5 was focused on the effect of
mediating variables on the dependent variables.
In testing all the proposed hypotheses, four steps were involved in the regression analysis:
(1) Step 1 the mediator was regressed with independent variable, (2) Step 2 the dependent

208
variables was regressed with independent variables, (3) Step 3 the dependent variables was
regressed with mediating variable and (4) Step 4 dependent variable was regressed with
independent variables entered together with mediator. This chapter concluded with the
partial mediated model and full mediation model to examine the relationship of the
proposed hypotheses.